The Processing of Temporal Pitch and Melody Information in ...
The Processing of Temporal Pitch and Melody Information in ... The Processing of Temporal Pitch and Melody Information in ...
Neuron, Vol. 36, 767–776, November 14, 2002, Copyright ©2002 by Cell Press The Processing of Temporal Pitch and Melody Information in Auditory Cortex Roy D. Patterson, 1,5 Stefan Uppenkamp, 1 Ingrid S. Johnsrude, 2 and Timothy D. Griffiths 1,3,4 1 Centre for the Neural Basis of Hearing Physiology Department University of Cambridge Downing Street Cambridge CB2 3EG 2 MRC Cognition and Brain Sciences Unit 15 Chaucer Road Cambridge CB2 2EF 3 Wellcome Department of Imaging Neuroscience Institute of Neurology 12 Queen Square London WC1N 3BG 4 Auditory Group Newcastle University Medical School Newcastle upon Tyne NE2 4HH United Kingdom Summary An fMRI experiment was performed to identify the main stages of melody processing in the auditory path- way. Spectrally matched sounds that produce no pitch, fixed pitch, or melody were all found to activate Heschl’s gyrus (HG) and planum temporale (PT). Within this region, sounds with pitch produced more activa- tion than those without pitch only in the lateral half of HG. When the pitch was varied to produce a melody, there was activation in regions beyond HG and PT, specifically in the superior temporal gyrus (STG) and planum polare (PP). The results support the view that there is hierarchy of pitch processing in which the center of activity moves anterolaterally away from pri- mary auditory cortex as the processing of melodic sounds proceeds. Introduction This paper is concerned with three auditory processes involved in the perception of melody, and how these processes are organized in the ascending auditory path- way. A melody in this case is simply a sequence of notes like that produced when someone picks out a tune on the piano with one finger. From the auditory perspective, perception of a melody involves (1) detecting that segments of an extended sound contain temporal regularity, (2) determining the pitch of each of these regular segments, and (3) determining how the pitch changes from note to note over the course of the sound. Physiological studies (Palmer and Winter, 1992) and functional neuroimaging (Hall et al., 2002; Griffiths et al., 2001; Wessinger et al., 2001) suggest that the processing of temporal regularity begins in the brainstem and that pitch extraction is completed in HG, the site of primary auditory cortex (PAC) (Rademacher et al., 1993, 2001; Morosan 5 Correspondence: roy.patterson@mrc-cbu.cam.ac.uk et al., 2001; Rivier and Clarke, 1997; Hackett et al., 2001). This is consistent with the hierarchy of processing proposed for auditory cortex on the basis of recent anatomical studies in the macaque (Hackett et al., 1998, 2001; Kaas and Hackett, 2000; Rauschecker and Tian, 2000). Higher-level processes like pitch tracking and melody extraction are thought to be performed in more distributed regions beyond PAC, and the processing becomes asymmetric with more activity in the right hemisphere (see Zatorre et al., 2002, for a review). The current paper presents cortical data from a functional magnetic resonance imaging (fMRI) study designed to increase the sensitivity of auditory imaging and enable us to locate the neural centers involved in pitch and melody perception with much greater precision. Studies of pitch processing often employ sinusoids that activate focal regions on the basilar membrane; these studies show that the tonotopic organization observed in the cochlea is preserved in all of the nuclei of the auditory pathway up to PAC (for a review see Ehret and Romand, 1997). It is also possible to produce a tone with a strong pitch by regularizing the time intervals in a broadband noise so that one time interval occurs more often than any of the others (see Figure 1). As the degree of regularity increases, the hiss of the noise dies away, and the pitch of the tonal component increases to the point where it dominates the perception. These regularinterval (RI) sounds (Yost, 1998) are like noise insofar as they produce essentially uniform excitation along the basilar membrane and, thus, uniform activity across the tonotopic dimension of neural activity in the auditory pathway (compare Figures 1B and 1G). The fact that they produce a strong pitch without producing a set of harmonically related peaks in the internal spectrum shows that pitch can be coded temporally as well as tonotopically in the auditory system. Figure 1 illustrates how the auditory system could extract the pitch informa- tion from RI sounds. A brief comparison of spectral and temporal models of pitch is presented in Griffiths et al., 1998. RI sounds are useful in imaging because they enable us to generate sets of spectrally matched stimuli that enhance the sensitivity of perceptual contrasts in functional imaging. Their value was initially demonstrated by Griffiths et al. (1998), who used positron emission tomography (PET) to show that activation in HG in- creases with the temporal regularity of RI sounds and that, when the pitch changes over time, there is addi- tional activation in STG and PP. The power was limited, however, by constraints on radiation dose, and the spa- tial resolution was poor compared to that of fMRI. For these reasons, the results were restricted to group data, and they are ambiguous with regard to the degree of asymmetry at different stages. Subsequently, Griffiths et al. (2001) showed that the combination of RI sounds and fMRI was sufficiently sensitive to image all of the subcortical nuclei of the auditory pathway simultane- ously, provided the technique included cardiac gating (Guimares et al., 1998) and many replications of each stimulus condition. A contrast between the activation
- Page 2 and 3: Neuron 768 Figure 1. Simulated Neur
- Page 4 and 5: Neuron 770 Figure 3. Group Activati
- Page 6 and 7: Neuron 772 Figure 4. Activation for
- Page 8 and 9: Neuron 774 The Hemispheric Speciali
- Page 10: Neuron 776 Johnsrude, I.S., Penhune
Neuron, Vol. 36, 767–776, November 14, 2002, Copyright ©2002 by Cell Press<br />
<strong>The</strong> <strong>Process<strong>in</strong>g</strong> <strong>of</strong> <strong>Temporal</strong> <strong>Pitch</strong><br />
<strong>and</strong> <strong>Melody</strong> <strong>Information</strong> <strong>in</strong> Auditory Cortex<br />
Roy D. Patterson, 1,5 Stefan Uppenkamp, 1<br />
Ingrid S. Johnsrude, 2 <strong>and</strong> Timothy D. Griffiths 1,3,4<br />
1<br />
Centre for the Neural Basis <strong>of</strong> Hear<strong>in</strong>g<br />
Physiology Department<br />
University <strong>of</strong> Cambridge<br />
Down<strong>in</strong>g Street<br />
Cambridge CB2 3EG<br />
2<br />
MRC Cognition <strong>and</strong> Bra<strong>in</strong> Sciences Unit<br />
15 Chaucer Road<br />
Cambridge CB2 2EF<br />
3<br />
Wellcome Department <strong>of</strong> Imag<strong>in</strong>g Neuroscience<br />
Institute <strong>of</strong> Neurology<br />
12 Queen Square<br />
London WC1N 3BG<br />
4<br />
Auditory Group<br />
Newcastle University Medical School<br />
Newcastle upon Tyne NE2 4HH<br />
United K<strong>in</strong>gdom<br />
Summary<br />
An fMRI experiment was performed to identify the<br />
ma<strong>in</strong> stages <strong>of</strong> melody process<strong>in</strong>g <strong>in</strong> the auditory path-<br />
way. Spectrally matched sounds that produce no<br />
pitch, fixed pitch, or melody were all found to activate<br />
Heschl’s gyrus (HG) <strong>and</strong> planum temporale (PT). With<strong>in</strong><br />
this region, sounds with pitch produced more activa-<br />
tion than those without pitch only <strong>in</strong> the lateral half <strong>of</strong><br />
HG. When the pitch was varied to produce a melody,<br />
there was activation <strong>in</strong> regions beyond HG <strong>and</strong> PT,<br />
specifically <strong>in</strong> the superior temporal gyrus (STG) <strong>and</strong><br />
planum polare (PP). <strong>The</strong> results support the view that<br />
there is hierarchy <strong>of</strong> pitch process<strong>in</strong>g <strong>in</strong> which the<br />
center <strong>of</strong> activity moves anterolaterally away from pri-<br />
mary auditory cortex as the process<strong>in</strong>g <strong>of</strong> melodic<br />
sounds proceeds.<br />
Introduction<br />
This paper is concerned with three auditory processes<br />
<strong>in</strong>volved <strong>in</strong> the perception <strong>of</strong> melody, <strong>and</strong> how these<br />
processes are organized <strong>in</strong> the ascend<strong>in</strong>g auditory path-<br />
way. A melody <strong>in</strong> this case is simply a sequence <strong>of</strong> notes<br />
like that produced when someone picks out a tune on<br />
the piano with one f<strong>in</strong>ger. From the auditory perspective,<br />
perception <strong>of</strong> a melody <strong>in</strong>volves (1) detect<strong>in</strong>g that segments<br />
<strong>of</strong> an extended sound conta<strong>in</strong> temporal regularity,<br />
(2) determ<strong>in</strong><strong>in</strong>g the pitch <strong>of</strong> each <strong>of</strong> these regular segments,<br />
<strong>and</strong> (3) determ<strong>in</strong><strong>in</strong>g how the pitch changes from<br />
note to note over the course <strong>of</strong> the sound. Physiological<br />
studies (Palmer <strong>and</strong> W<strong>in</strong>ter, 1992) <strong>and</strong> functional neuroimag<strong>in</strong>g<br />
(Hall et al., 2002; Griffiths et al., 2001; Wess<strong>in</strong>ger<br />
et al., 2001) suggest that the process<strong>in</strong>g <strong>of</strong> temporal<br />
regularity beg<strong>in</strong>s <strong>in</strong> the bra<strong>in</strong>stem <strong>and</strong> that pitch extraction<br />
is completed <strong>in</strong> HG, the site <strong>of</strong> primary auditory<br />
cortex (PAC) (Rademacher et al., 1993, 2001; Morosan<br />
5<br />
Correspondence: roy.patterson@mrc-cbu.cam.ac.uk<br />
et al., 2001; Rivier <strong>and</strong> Clarke, 1997; Hackett et al., 2001).<br />
This is consistent with the hierarchy <strong>of</strong> process<strong>in</strong>g proposed<br />
for auditory cortex on the basis <strong>of</strong> recent anatomical<br />
studies <strong>in</strong> the macaque (Hackett et al., 1998, 2001;<br />
Kaas <strong>and</strong> Hackett, 2000; Rauschecker <strong>and</strong> Tian, 2000).<br />
Higher-level processes like pitch track<strong>in</strong>g <strong>and</strong> melody<br />
extraction are thought to be performed <strong>in</strong> more distributed<br />
regions beyond PAC, <strong>and</strong> the process<strong>in</strong>g becomes<br />
asymmetric with more activity <strong>in</strong> the right hemisphere<br />
(see Zatorre et al., 2002, for a review). <strong>The</strong> current paper<br />
presents cortical data from a functional magnetic resonance<br />
imag<strong>in</strong>g (fMRI) study designed to <strong>in</strong>crease the<br />
sensitivity <strong>of</strong> auditory imag<strong>in</strong>g <strong>and</strong> enable us to locate<br />
the neural centers <strong>in</strong>volved <strong>in</strong> pitch <strong>and</strong> melody perception<br />
with much greater precision.<br />
Studies <strong>of</strong> pitch process<strong>in</strong>g <strong>of</strong>ten employ s<strong>in</strong>usoids<br />
that activate focal regions on the basilar membrane;<br />
these studies show that the tonotopic organization observed<br />
<strong>in</strong> the cochlea is preserved <strong>in</strong> all <strong>of</strong> the nuclei <strong>of</strong><br />
the auditory pathway up to PAC (for a review see Ehret<br />
<strong>and</strong> Rom<strong>and</strong>, 1997). It is also possible to produce a tone<br />
with a strong pitch by regulariz<strong>in</strong>g the time <strong>in</strong>tervals <strong>in</strong><br />
a broadb<strong>and</strong> noise so that one time <strong>in</strong>terval occurs more<br />
<strong>of</strong>ten than any <strong>of</strong> the others (see Figure 1). As the degree<br />
<strong>of</strong> regularity <strong>in</strong>creases, the hiss <strong>of</strong> the noise dies away,<br />
<strong>and</strong> the pitch <strong>of</strong> the tonal component <strong>in</strong>creases to the<br />
po<strong>in</strong>t where it dom<strong>in</strong>ates the perception. <strong>The</strong>se regular<strong>in</strong>terval<br />
(RI) sounds (Yost, 1998) are like noise <strong>in</strong>s<strong>of</strong>ar<br />
as they produce essentially uniform excitation along the<br />
basilar membrane <strong>and</strong>, thus, uniform activity across the<br />
tonotopic dimension <strong>of</strong> neural activity <strong>in</strong> the auditory<br />
pathway (compare Figures 1B <strong>and</strong> 1G). <strong>The</strong> fact that<br />
they produce a strong pitch without produc<strong>in</strong>g a set<br />
<strong>of</strong> harmonically related peaks <strong>in</strong> the <strong>in</strong>ternal spectrum<br />
shows that pitch can be coded temporally as well as<br />
tonotopically <strong>in</strong> the auditory system. Figure 1 illustrates<br />
how the auditory system could extract the pitch <strong>in</strong>forma-<br />
tion from RI sounds. A brief comparison <strong>of</strong> spectral <strong>and</strong><br />
temporal models <strong>of</strong> pitch is presented <strong>in</strong> Griffiths et al.,<br />
1998.<br />
RI sounds are useful <strong>in</strong> imag<strong>in</strong>g because they enable<br />
us to generate sets <strong>of</strong> spectrally matched stimuli that<br />
enhance the sensitivity <strong>of</strong> perceptual contrasts <strong>in</strong> functional<br />
imag<strong>in</strong>g. <strong>The</strong>ir value was <strong>in</strong>itially demonstrated<br />
by Griffiths et al. (1998), who used positron emission<br />
tomography (PET) to show that activation <strong>in</strong> HG <strong>in</strong>-<br />
creases with the temporal regularity <strong>of</strong> RI sounds <strong>and</strong><br />
that, when the pitch changes over time, there is addi-<br />
tional activation <strong>in</strong> STG <strong>and</strong> PP. <strong>The</strong> power was limited,<br />
however, by constra<strong>in</strong>ts on radiation dose, <strong>and</strong> the spa-<br />
tial resolution was poor compared to that <strong>of</strong> fMRI. For<br />
these reasons, the results were restricted to group data,<br />
<strong>and</strong> they are ambiguous with regard to the degree <strong>of</strong><br />
asymmetry at different stages. Subsequently, Griffiths<br />
et al. (2001) showed that the comb<strong>in</strong>ation <strong>of</strong> RI sounds<br />
<strong>and</strong> fMRI was sufficiently sensitive to image all <strong>of</strong> the<br />
subcortical nuclei <strong>of</strong> the auditory pathway simultane-<br />
ously, provided the technique <strong>in</strong>cluded cardiac gat<strong>in</strong>g<br />
(Guimares et al., 1998) <strong>and</strong> many replications <strong>of</strong> each<br />
stimulus condition. A contrast between the activation
Neuron<br />
768<br />
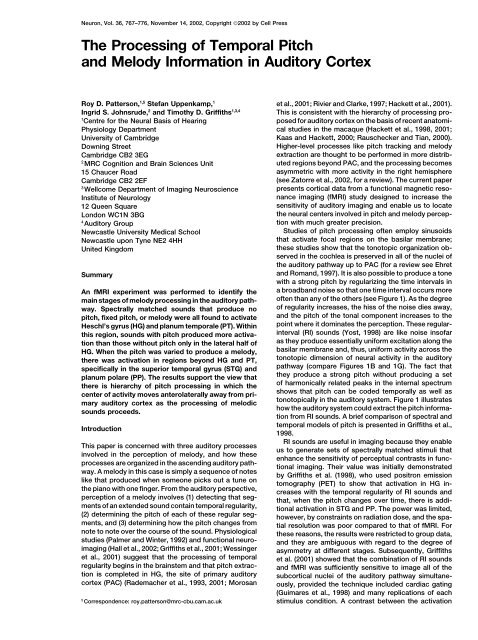
Figure 1. Simulated Neural Responses to a R<strong>and</strong>om Noise <strong>and</strong> a Regular-Interval (RI) Sound with a <strong>Pitch</strong> <strong>of</strong> 83.3 Hz<br />
<strong>The</strong> RI sound was constructed by: (1) delay<strong>in</strong>g a copy <strong>of</strong> a r<strong>and</strong>om noise by 12 ms (1/83.3 Hz), (2) add<strong>in</strong>g it back to the orig<strong>in</strong>al noise, <strong>and</strong><br />
(3) repeat<strong>in</strong>g the process 16 times (Yost, 1996; see Experimental Procedures for details). <strong>The</strong> ord<strong>in</strong>ate <strong>in</strong> (A)–(C) <strong>and</strong> (F)–(H) is the tonotopic<br />
dimension <strong>of</strong> hear<strong>in</strong>g, that is, place along the basilar membrane. (A) <strong>and</strong> (F) show the detailed temporal structure <strong>of</strong> the neural response at<br />
the output <strong>of</strong> the cochlea (Patterson et al., 1995) for the noise <strong>and</strong> RI sound, respectively; the activity is similar for the two sounds. (B) <strong>and</strong><br />
(G) show that the average neural activity over time (Patterson, 1994) is very similar for the two sounds; there are no harmonically related<br />
peaks <strong>in</strong> (G) to identify the pitch. (D) <strong>and</strong> (J) show that the average activity over channels is also very similar; there are no regularly repeat<strong>in</strong>g<br />
features to identify the pitch <strong>of</strong> the RI sound. <strong>The</strong> temporal regularity that dist<strong>in</strong>guishes the RI sound is <strong>in</strong> the time-<strong>in</strong>terval <strong>in</strong>formation <strong>of</strong> the<br />
neural patterns (A <strong>and</strong> F). When the time-<strong>in</strong>tervals between peaks are calculated <strong>in</strong> the <strong>in</strong>dividual channels <strong>of</strong> (F) <strong>and</strong> summarized <strong>in</strong> the<br />
correspond<strong>in</strong>g time-<strong>in</strong>terval histograms <strong>of</strong> (H), a concentration <strong>of</strong> activity appears at the RI delay (12 ms) (Patterson et al., 1996). In contrast,<br />
the time-<strong>in</strong>tervals <strong>in</strong> the neural pattern <strong>of</strong> noise (A) are r<strong>and</strong>omly distributed <strong>in</strong> the time-<strong>in</strong>terval histogram (C) (the concentration at 0 ms simply<br />
<strong>in</strong>dicates the presence <strong>of</strong> activity <strong>in</strong> the channel). <strong>The</strong> position <strong>and</strong> height <strong>of</strong> peaks <strong>in</strong> the average <strong>in</strong>terval histogram (K) are used to evaluate<br />
quantitative models <strong>of</strong> the pitch <strong>of</strong> RI sounds (e.g., Pressnitzer et al., 2001; Krumbholz et al., 2000).<br />
produced by RI sounds with fixed pitch <strong>and</strong> spectrally where the asymmetries reported by Zatorre et al. (2002)<br />
matched noise revealed that temporal pitch process<strong>in</strong>g first emerge.<br />
beg<strong>in</strong>s <strong>in</strong> subcortical structures. At the same time, a Studies <strong>of</strong> cytoarchitecture have shown that a reliable<br />
contrast between sounds with vary<strong>in</strong>g pitch <strong>and</strong> fixed l<strong>and</strong>mark for primary auditory cortex is the anteriormost,<br />
pitch did not reveal an <strong>in</strong>crease <strong>in</strong> activation <strong>in</strong> this transverse temporal gyrus (<strong>of</strong> Heschl) (Rademacher et<br />
region. <strong>The</strong> fact that pitch process<strong>in</strong>g beg<strong>in</strong>s <strong>in</strong> the al., 1993, 2001; Rivier <strong>and</strong> Clarke, 1997; Morosan et al.,<br />
bra<strong>in</strong>stem but is not completed there was <strong>in</strong>terpreted 2001), <strong>and</strong> functional imag<strong>in</strong>g studies have shown that<br />
as further evidence for the hypothesis that there is a most complex sounds produce activation <strong>in</strong> PAC <strong>and</strong><br />
neural hierarchy <strong>of</strong> melody process<strong>in</strong>g <strong>in</strong> the auditory surround<strong>in</strong>g areas <strong>in</strong> all normal listeners. <strong>The</strong> sensitivity<br />
pathway (Griffiths et al., 1998). In this paper, we present <strong>of</strong> the cortical data means that we can <strong>in</strong>vestigate<br />
the cortical data from the fMRI experiment. <strong>The</strong> excep- whether there are consistent differences between <strong>in</strong>dividual<br />
tional sensitivity <strong>of</strong> the study enables us to track the<br />
listeners <strong>in</strong> the location <strong>of</strong> functional activation<br />
hierarchy <strong>of</strong> melody process<strong>in</strong>g <strong>in</strong> auditory cortex with<strong>in</strong> auditory cortex, <strong>and</strong> whether the differences correspond<br />
across HG <strong>and</strong> out <strong>in</strong>to PP <strong>and</strong> STG, <strong>and</strong> determ<strong>in</strong>e<br />
to differences <strong>in</strong> the sulcal <strong>and</strong> gyral morphol-
<strong>Melody</strong> <strong>Process<strong>in</strong>g</strong> <strong>in</strong> the <strong>Temporal</strong> Lobe<br />
769<br />
Figure 2. Axial Projection <strong>of</strong> Group Activation<br />
<strong>in</strong> Glass Bra<strong>in</strong> View for Various Contrasts<br />
Top row: (A) noise versus silence, (B) fixed<br />
pitch versus silence, (C) diatonic melody versus<br />
silence, <strong>and</strong> (D) r<strong>and</strong>om melody versus<br />
silence.<br />
Middle row: (E) fixed pitch versus noise, (F)<br />
diatonic melody versus noise, <strong>and</strong> (G) r<strong>and</strong>om<br />
melody versus noise.<br />
Bottom row: (H) all sound conditions contrasted<br />
with silence. (J) diatonic melody versus<br />
fixed pitch <strong>and</strong> (K) r<strong>and</strong>om melody versus<br />
fixed pitch. <strong>The</strong> height threshold for activation<br />
was t 5.00 <strong>in</strong> every case (p 0.05 corrected<br />
for multiple comparisons across the whole<br />
volume). <strong>The</strong> arrows mark the approximate<br />
position <strong>of</strong> Heschl’s gyrus <strong>in</strong> the two hemispheres.<br />
<strong>The</strong> top row shows that these four<br />
types <strong>of</strong> sound produce activation <strong>in</strong> essentially<br />
the same cortical areas.<br />
ogy <strong>of</strong> the <strong>in</strong>dividuals (Penhune et al., 1996; Leonard et<br />
al., 1998).<br />
Results<br />
<strong>The</strong> anteriormost, transverse temporal gyrus <strong>of</strong> Heschl<br />
was identified <strong>in</strong> each <strong>of</strong> our listeners, <strong>and</strong> there was<br />
good agreement between this specification <strong>of</strong> the loca-<br />
tion <strong>of</strong> HG <strong>in</strong> our listeners <strong>and</strong> that obta<strong>in</strong>ed <strong>in</strong> other<br />
studies. <strong>The</strong> details <strong>of</strong> the analysis are presented <strong>in</strong><br />
Experimental Procedures. <strong>The</strong> group activation results<br />
are presented first with respect to the average position<br />
<strong>of</strong> HG for the group. <strong>The</strong>n the variability <strong>of</strong> the activation<br />
across listeners is compared to the variability <strong>of</strong> HG<br />
across listeners.<br />
Regions <strong>of</strong> Activation <strong>in</strong> the Group<br />
All Sounds versus Silence<br />
<strong>The</strong> activation produced by all four sound conditions<br />
was compared to activation produced <strong>in</strong> the silence<br />
condition to illustrate the doma<strong>in</strong> <strong>of</strong> cortical sensitivity<br />
to sound; the contrast <strong>in</strong>cludes 2592 volumes from all<br />
n<strong>in</strong>e listeners (fixed-effects analysis). In cortex, this con-<br />
trast yields bilateral activation <strong>in</strong> two large clusters<br />
shown <strong>in</strong> <strong>of</strong> Figure 2H (all sound-silence). <strong>The</strong> clusters<br />
are centered <strong>in</strong> the region <strong>of</strong> HG <strong>and</strong> PT, as would be<br />
expected. Outside this region, there is essentially no<br />
other cortical activation, perhaps because it was a passive<br />
listen<strong>in</strong>g experiment. <strong>The</strong> “V” <strong>of</strong> activity <strong>in</strong> the center<br />
<strong>of</strong> the panel is the subcortical activity reported <strong>in</strong> Grif-<br />
fiths et al. (2001). <strong>The</strong> position <strong>of</strong> HG for the group <strong>of</strong><br />
listeners falls along the l<strong>in</strong>e between the arrowheads <strong>in</strong><br />
each hemisphere. <strong>The</strong> group activation is centered on<br />
the mean position <strong>of</strong> HG <strong>in</strong> the right hemisphere <strong>and</strong><br />
along the posterolateral side <strong>of</strong> HG <strong>in</strong> the left hemisphere.<br />
Individual Sound Conditions versus Silence<br />
<strong>The</strong> <strong>in</strong>dividual sound conditions produced very similar<br />
patterns <strong>of</strong> activation when compared to silence, as<br />
shown <strong>in</strong> Figures 2A–2D. In the left hemisphere, there<br />
is little to dist<strong>in</strong>guish among the four contrasts <strong>in</strong> terms<br />
<strong>of</strong> the region <strong>of</strong> activation; <strong>in</strong> the right hemisphere, the<br />
three sounds with pitch produce slightly more activity<br />
<strong>in</strong> the region just anterior to the lateral end <strong>of</strong> HG. Many<br />
<strong>of</strong> the peaks <strong>in</strong> these contrasts have t values above ten,<br />
rang<strong>in</strong>g <strong>in</strong> some cases up to 40, <strong>and</strong> these peaks appear<br />
with remarkable consistency <strong>in</strong> all <strong>of</strong> the contrasts <strong>in</strong>-<br />
volv<strong>in</strong>g sound <strong>and</strong> silence. <strong>The</strong>re are significant differences<br />
between conditions, but they are largely associated<br />
with different levels <strong>of</strong> activation at fixed positions<br />
with<strong>in</strong> the ma<strong>in</strong> clusters rather than changes <strong>in</strong> the positions<br />
<strong>of</strong> peaks.<br />
Differential Sensitivity to <strong>Pitch</strong><br />
To reveal regions associated with the process<strong>in</strong>g <strong>of</strong><br />
tonal sounds as opposed to noise, we exam<strong>in</strong>ed the<br />
contrasts fixed versus noise, diatonic versus noise, <strong>and</strong><br />
r<strong>and</strong>om versus noise (Figures 2E–2G). In the fixed versus<br />
noise comparison, the most prom<strong>in</strong>ent area <strong>of</strong> differen-<br />
tial activity was <strong>in</strong> lateral HG <strong>in</strong> both hemispheres. <strong>The</strong><br />
diatonic versus noise <strong>and</strong> r<strong>and</strong>om versus noise contrasts<br />
both exhibited very similar activation to fixed ver-<br />
sus noise <strong>in</strong> HG. Anterior to HG, <strong>in</strong> the lateral part <strong>of</strong> PP,<br />
diatonic versus noise <strong>and</strong> r<strong>and</strong>om versus noise revealed<br />
bilateral activation that did not appear <strong>in</strong> the fixed versus
Neuron<br />
770<br />
Figure 3. Group Activation for Four Contrasts<br />
Us<strong>in</strong>g a Fixed-Effects Model, Rendered<br />
onto the Average Structural Image <strong>of</strong> the<br />
Group<br />
<strong>The</strong> height threshold for activation was t <br />
5.00 (p 0.05 corrected). Blue, noise versus<br />
silence; red, fixed pitch versus noise; green,<br />
diatonic melody versus fixed pitch; cyan, r<strong>and</strong>om<br />
melody versus fixed pitch. <strong>The</strong> white<br />
highlight shows the position <strong>of</strong> Heschl’s gyrus<br />
(HG) (the average <strong>of</strong> the HG maps for the n<strong>in</strong>e<br />
<strong>in</strong>dividuals). <strong>The</strong> arrows show the midl<strong>in</strong>e <strong>of</strong><br />
HG separately <strong>in</strong> each hemisphere. <strong>The</strong> position<br />
<strong>and</strong> orientation <strong>of</strong> the sections is illustrated<br />
<strong>in</strong> the bottom panels <strong>of</strong> the figure. <strong>The</strong><br />
sagittal sections show front to the left for the<br />
left hemisphere <strong>and</strong> front to the right for the<br />
right hemisphere.<br />
the head. <strong>The</strong> highlighted regions <strong>in</strong> the structural sections<br />
show the average position <strong>of</strong> HG <strong>in</strong> the two hemispheres;<br />
these regions are replotted under the functional activation<br />
<strong>in</strong> the axial sections above the structural sections.<br />
<strong>The</strong> functional activation shows that as a sequence <strong>of</strong><br />
noise bursts acquires the properties <strong>of</strong> melody (first<br />
pitch <strong>and</strong> then chang<strong>in</strong>g pitch), the region sensitive to<br />
the added complexity changes from a large area on HG<br />
<strong>and</strong> PT (blue) to a relatively focused area <strong>in</strong> the lateral<br />
half <strong>of</strong> HG (red) <strong>and</strong> then on out <strong>in</strong>to surround<strong>in</strong>g regions<br />
<strong>of</strong> PP <strong>and</strong> STG (green <strong>and</strong> cyan mixed). <strong>The</strong> orderly<br />
progression is consistent with the hypothesis that the<br />
hierarchy <strong>of</strong> melody process<strong>in</strong>g that beg<strong>in</strong>s <strong>in</strong> the bra<strong>in</strong>stem<br />
cont<strong>in</strong>ues <strong>in</strong> auditory cortex <strong>and</strong> subsequent re-<br />
gions <strong>of</strong> the temporal lobe. <strong>The</strong> activation is largely symmetric<br />
<strong>in</strong> auditory cortex <strong>and</strong> becomes asymmetric<br />
abruptly as it moves on to PP <strong>and</strong> STG with relatively<br />
more activity <strong>in</strong> the right hemisphere.<br />
noise contrast. With regard to melody process<strong>in</strong>g, these<br />
results suggest that there are a number <strong>of</strong> centers <strong>in</strong><br />
auditory cortex (HG <strong>and</strong> PT) that process all stimuli com<strong>in</strong>g<br />
up from subcortical structures <strong>in</strong> both hemispheres,<br />
<strong>and</strong> one <strong>of</strong> these regions <strong>in</strong> lateral HG is differentially<br />
active <strong>in</strong> the presence <strong>of</strong> pitch. We also <strong>in</strong>verted the<br />
three pitch versus noise contrasts to determ<strong>in</strong>e whether<br />
there might be a region particularly concerned with the<br />
process<strong>in</strong>g <strong>of</strong> noise. No c<strong>and</strong>idates were found; all <strong>of</strong><br />
the regions activated by noise were activated to at least<br />
the same degree by sounds with pitch.<br />
Differential Sensitivity to <strong>Melody</strong><br />
To reveal regions associated with melody process<strong>in</strong>g,<br />
we exam<strong>in</strong>ed the contrasts diatonic versus fixed <strong>and</strong><br />
r<strong>and</strong>om versus fixed (Figures 2J <strong>and</strong> 2K). Both contrasts<br />
reveal differential activation to melody <strong>in</strong> STG <strong>and</strong> PP,<br />
but <strong>in</strong> this case, the activation is asymmetric with more<br />
activity <strong>in</strong> the right hemisphere. In lateral HG <strong>and</strong> medial<br />
HG, there is virtually no differential activation when compared<br />
with the previous contrasts, <strong>in</strong>dicat<strong>in</strong>g that melody<br />
produced about the same level <strong>of</strong> activity as fixed<br />
pitch <strong>in</strong> HG. This suggests that HG is <strong>in</strong>volved <strong>in</strong> shortterm<br />
rather than longer-term pitch process<strong>in</strong>g, such as<br />
determ<strong>in</strong><strong>in</strong>g the pitch value or pitch strength rather than<br />
evaluat<strong>in</strong>g pitch changes across a sequence <strong>of</strong> notes.<br />
Diatonic versus R<strong>and</strong>om <strong>Melody</strong><br />
In an attempt to identify regions that might be specifically<br />
<strong>in</strong>volved <strong>in</strong> process<strong>in</strong>g diatonic melodies, we exam<strong>in</strong>ed<br />
the contrasts diatonic versus r<strong>and</strong>om <strong>and</strong> r<strong>and</strong>om<br />
versus diatonic. Neither contrast revealed significant<br />
peaks <strong>in</strong> any region <strong>of</strong> the bra<strong>in</strong>. As a result, the<br />
data from the two melody conditions will be considered<br />
together <strong>in</strong> most <strong>of</strong> the follow<strong>in</strong>g discussions.<br />
Hierarchy <strong>of</strong> <strong>Melody</strong> <strong>Process<strong>in</strong>g</strong><br />
A summary <strong>of</strong> the results to this po<strong>in</strong>t is presented <strong>in</strong><br />
Figure 3. <strong>The</strong> structural <strong>and</strong> axial sections show the<br />
activity <strong>in</strong> a plane parallel to the surface <strong>of</strong> the temporal<br />
lobe <strong>and</strong> just below it; the sagittal sections are orthogonal<br />
to the axial sections <strong>and</strong> they face outwards so that<br />
<strong>in</strong> both cases, the view <strong>of</strong> the temporal lobe is from outside<br />
Variability <strong>in</strong> Anatomy <strong>and</strong> Functional Activation<br />
across Listeners<br />
In this section, we exam<strong>in</strong>e how the anatomy <strong>of</strong> Heschl’s<br />
gyrus <strong>in</strong> <strong>in</strong>dividuals relates to the <strong>in</strong>dividual’s pattern <strong>of</strong><br />
functional activation, <strong>and</strong> how the functional data <strong>of</strong><br />
<strong>in</strong>dividuals relates to the pattern <strong>of</strong> activation observed<br />
<strong>in</strong> the group data.<br />
<strong>The</strong> analysis <strong>of</strong> the anatomy <strong>of</strong> HG was summarized<br />
for each listener <strong>in</strong> terms <strong>of</strong> three po<strong>in</strong>ts: (1) the centroid<br />
<strong>of</strong> the complete volume <strong>of</strong> HG, (2) the position <strong>of</strong> the<br />
medial end <strong>of</strong> HG, <strong>and</strong> (3) the position <strong>of</strong> the lateral<br />
end <strong>of</strong> HG (see Experimental Procedures). <strong>The</strong> group<br />
centroids for each <strong>of</strong> these po<strong>in</strong>ts are presented <strong>in</strong> Table<br />
1 with the st<strong>and</strong>ard deviations; the table shows that,<br />
follow<strong>in</strong>g normalization, the variability <strong>in</strong> the position <strong>of</strong><br />
HG is m<strong>in</strong>imal. Specifically, the st<strong>and</strong>ard deviations for<br />
the medial <strong>and</strong> central centroids are less than one voxel<br />
(2 mm) <strong>in</strong> all three dimensions, <strong>and</strong> the st<strong>and</strong>ard devia-<br />
tions for the lateral centroid are less than two voxels on<br />
average.<br />
With regard to the functional activation, the positions
<strong>Melody</strong> <strong>Process<strong>in</strong>g</strong> <strong>in</strong> the <strong>Temporal</strong> Lobe<br />
771<br />
Table 1. Coord<strong>in</strong>ates <strong>of</strong> Anatomical L<strong>and</strong>marks <strong>and</strong> Functional Activation Peaks <strong>in</strong> Heschl’s Gyrus<br />
Left<br />
Right<br />
x y z x y z<br />
Medial end <strong>of</strong> HG 35.8 26.9 10.5 36.0 26.3 10.3<br />
(1.1) (1.8) (1.0) (1.8) (1.8) (1.4)<br />
Central HG 49.1 18.9 6.2 48.8 16.8 5.4<br />
(1.7) (2.0) (1.0) (1.3) (1.8) (1.2)<br />
Lateral end <strong>of</strong> HG 62.1 9.7 4.8 61.2 7.8 3.3<br />
(2.6) (3.7) (1.4) (3.7) (3.6) (2.3)<br />
Fixed versus noise 55.3 12.9 1.5 57.2 8.8 1.9<br />
(Individual listeners) (3.8) (4.6) (2.9) (2.5) (5.0) (3.3)<br />
Penhune et al., 1996 45.0 19.8 7.8 47.8 15.5 6.8<br />
Morosan et al., 2001 (SPM normalized) 44.6 17.9 8.0 49.3 12.9 7.2<br />
Rademacher et al., 2001 42.0 21.0 7.0 46.0 13.0 8.0<br />
Coord<strong>in</strong>ates <strong>of</strong> Heschl’s gyrus. <strong>The</strong> top three rows show the mean position <strong>of</strong> the center <strong>of</strong> Heschl’s gyrus <strong>and</strong> the medial <strong>and</strong> lateral ends<br />
<strong>of</strong> Heschl’s gyrus, as determ<strong>in</strong>ed from structural scans for the <strong>in</strong>dividual listeners. <strong>The</strong> fourth row shows the mean position <strong>of</strong> the peaks <strong>of</strong><br />
activation for the contrast fixed versus noise from <strong>in</strong>dividual listeners. <strong>The</strong> bottom three rows show the location <strong>of</strong> Heschl’s gyrus obta<strong>in</strong>ed<br />
from previous studies.<br />
conditions with<strong>in</strong> listeners; for any one <strong>of</strong> the small blue<br />
regions <strong>in</strong> an <strong>in</strong>dividual’s data, it is typically the case<br />
that the region is activated by all <strong>of</strong> the different sounds<br />
used <strong>in</strong> the experiment, <strong>and</strong> the peak <strong>in</strong> the region is<br />
<strong>of</strong>ten <strong>in</strong> exactly the same place <strong>in</strong> each condition. Moreover,<br />
the degree <strong>of</strong> activation is the same, <strong>in</strong>asmuch as<br />
these regions rarely appear <strong>in</strong> contrasts <strong>in</strong>volv<strong>in</strong>g one<br />
<strong>of</strong> the pitch-produc<strong>in</strong>g sounds <strong>and</strong> noise, nor do they<br />
appear when these contrasts are <strong>in</strong>verted. <strong>The</strong> obvious<br />
hypothesis is that these regions <strong>of</strong> activation represent<br />
centers that analyze broadb<strong>and</strong> sounds for specific features<br />
or properties other than pitch <strong>and</strong> they are <strong>in</strong> some-<br />
what different places <strong>in</strong> different listeners.<br />
Fixed versus Noise<br />
With<strong>in</strong> the region on lateral HG where sounds with pitch<br />
produce more activation than noise (red <strong>in</strong> Figure 2),<br />
<strong>in</strong>dividual listeners have, on average, four significant<br />
peaks <strong>in</strong> the left hemisphere <strong>and</strong> five <strong>in</strong> the right hemi-<br />
sphere. <strong>The</strong> peaks are shown <strong>in</strong> red <strong>in</strong> Figure 4 (Aga<strong>in</strong>,<br />
listener 9 is an exception. <strong>The</strong> contrast yielded no signifi-<br />
cant activation on the left <strong>and</strong> only one peak <strong>in</strong> a very<br />
anterior region on the right; accord<strong>in</strong>gly, listener 9 was<br />
omitted from this analysis as well.). <strong>The</strong>re is some variation<br />
<strong>in</strong> the pattern <strong>of</strong> activation; on the right, the activity<br />
for listeners 1, 6, <strong>and</strong> 7 appears to be slightly anterior<br />
to HG, <strong>and</strong> on the left, the activity for listeners 4, 5, 6,<br />
<strong>and</strong> 8 appears to be slightly posterior to HG. However,<br />
the region is small relative to the relatively large regions<br />
<strong>of</strong> activation produced by the noise versus silence contrast.<br />
Centroids were calculated for the fixed versus noise<br />
peaks <strong>in</strong> each hemisphere for each listener <strong>and</strong> aver-<br />
aged across listeners; their coord<strong>in</strong>ates are presented<br />
<strong>in</strong> the fourth row <strong>of</strong> Table 1. <strong>The</strong> functional centroid for<br />
the group is between the central <strong>and</strong> lateral anatomical<br />
centroids <strong>and</strong> a little below the l<strong>in</strong>e <strong>of</strong> anatomical<br />
centroids for the group. <strong>The</strong> st<strong>and</strong>ard deviations for the<br />
functional centroids are a little greater than those for<br />
the anatomical centroids at the lateral end <strong>of</strong> HG but,<br />
<strong>in</strong> general, the variability <strong>of</strong> the functional centroids is<br />
comparable to that <strong>of</strong> the anatomical centroids for the<br />
fixed versus noise contrast. This relatively small, bilateral<br />
region <strong>in</strong> lateral HG would appear to be a prime<br />
<strong>of</strong> the major peaks are very consistent across conditions<br />
with<strong>in</strong> <strong>in</strong>dividuals. Nevertheless, the major peaks <strong>in</strong> the<br />
group data do not co<strong>in</strong>cide with those <strong>in</strong> the data <strong>of</strong><br />
<strong>in</strong>dividuals. Indeed, there are essentially no peaks <strong>in</strong> the<br />
group data that appear consistently for <strong>in</strong>dividuals. So,<br />
the position <strong>of</strong> a peak <strong>in</strong> the group data represents a<br />
location where activation from <strong>in</strong>dividuals overlaps <strong>in</strong><br />
some way; it is not the location where a majority <strong>of</strong><br />
the <strong>in</strong>dividuals all exhibit the same peak. In order to<br />
underst<strong>and</strong> the form <strong>of</strong> the variability across listeners,<br />
axial <strong>and</strong> sagittal sections like those <strong>in</strong> Figure 3 were<br />
prepared for all n<strong>in</strong>e listeners. <strong>The</strong> sections are presented<br />
with one listener per row <strong>in</strong> Figure 4. <strong>The</strong> first<br />
th<strong>in</strong>g that the figure reveals is that the regions <strong>of</strong> activation<br />
<strong>in</strong> <strong>in</strong>dividuals are more focal than <strong>in</strong> the group average,<br />
<strong>in</strong>dicat<strong>in</strong>g that the larger regions <strong>of</strong> activation <strong>in</strong><br />
the group data represent overlapp<strong>in</strong>g focal regions from<br />
<strong>in</strong>dividuals–regions which <strong>in</strong> an <strong>in</strong>dividual are highly consistent<br />
across conditions. Moreover, variability <strong>in</strong> the<br />
location <strong>of</strong> activation differs <strong>in</strong> the three contrasts: noise<br />
versus silence (blue), fixed versus noise (red), <strong>and</strong> melody<br />
versus fixed (green). Accord<strong>in</strong>gly, the variability is<br />
analyzed separately for each contrast.<br />
Noise versus Silence<br />
Noise produces foci <strong>of</strong> activation <strong>in</strong> the region <strong>of</strong> HG<br />
<strong>and</strong>/or PT <strong>in</strong> all listeners. <strong>The</strong> activation appears along<br />
the posterolateral edge <strong>of</strong> HG for some listeners (2, 3,<br />
4, <strong>and</strong> 7), but not others (1, 5, 6, <strong>and</strong> 8). <strong>The</strong>re is a region<br />
<strong>of</strong> activation at the posteromedial end <strong>of</strong> HG for some<br />
listeners (1, 2, 4, <strong>and</strong> 5), but not others (3, 6, <strong>and</strong> 8), <strong>and</strong><br />
there is a concentration <strong>of</strong> activation anterior to HG <strong>in</strong><br />
some listeners (3, 5, <strong>and</strong> 7), but not others. In short,<br />
the noise activation <strong>in</strong> <strong>in</strong>dividuals is restricted to focal<br />
regions <strong>of</strong> HG <strong>and</strong> PT, <strong>and</strong> together these regions produce<br />
the larger noise versus silence region <strong>in</strong> the group<br />
data. With<strong>in</strong> this larger region, however, the distribution<br />
<strong>of</strong> functional activation is quite variable across listeners.<br />
(<strong>The</strong> data <strong>of</strong> listener 9 are <strong>in</strong>cluded <strong>in</strong> Figure 4 for completeness,<br />
but they are omitted from this analysis because<br />
the pattern <strong>of</strong> activation is so different from that<br />
<strong>of</strong> the other eight listeners.)<br />
This pattern <strong>of</strong> variation <strong>in</strong> the noise activation st<strong>and</strong>s<br />
<strong>in</strong> marked contrast to the consistency <strong>of</strong> peaks across
Neuron<br />
772<br />
Figure 4. Activation for Three Contrasts <strong>in</strong> Individual Listeners (1–9) Rendered on Sections <strong>of</strong> <strong>The</strong>ir Individual Structural Images<br />
<strong>The</strong> orientation <strong>of</strong> the axial sections is the same as <strong>in</strong> Figure 3. <strong>The</strong> height threshold for activation was t 5.00 (p 0.001 uncorrected).<br />
Clusters with fewer than eight voxels were excluded from the figure to focus attention on the more significant clusters. <strong>The</strong> plane <strong>of</strong> each<br />
sagittal section is given <strong>in</strong> mm <strong>in</strong> Talairach-like space <strong>in</strong> each <strong>of</strong> the respective panels. <strong>The</strong> position <strong>of</strong> the <strong>in</strong>dividual’s HG is highlighted <strong>in</strong><br />
each case. <strong>The</strong> pairs <strong>of</strong> black arrows show the position <strong>of</strong> HG <strong>in</strong> the group. Blue, noise versus silence; red, fixed pitch versus noise; green,<br />
diatonic <strong>and</strong> r<strong>and</strong>om melodies versus fixed pitch.<br />
c<strong>and</strong>idate for a pitch center or tone process<strong>in</strong>g center<br />
<strong>in</strong> auditory cortex.<br />
<strong>Melody</strong> versus Fixed<br />
<strong>The</strong>re are three regions where melody produces more<br />
activation than fixed pitch: one at the lateral end <strong>of</strong> HG,<br />
one <strong>in</strong> STS, <strong>and</strong> one <strong>in</strong> PP. Figure 4 shows that there is<br />
somewhat more <strong>of</strong> this activity (green) <strong>in</strong> the <strong>in</strong>dividual<br />
data than <strong>in</strong> the group data (green <strong>and</strong> cyan <strong>in</strong> Figure 3),<br />
<strong>and</strong> the asymmetry is less pronounced <strong>in</strong> the <strong>in</strong>dividual<br />
data. <strong>The</strong>re are two reasons for this: (1) the height thresh-<br />
old was reduced for the <strong>in</strong>dividual data (p 0.001 uncorrected),<br />
<strong>and</strong> (2) the location <strong>of</strong> the activity is highly vari-<br />
able across listeners, so much <strong>of</strong> it does not appear <strong>in</strong><br />
the average. With regard to asymmetry, for five <strong>of</strong> the<br />
n<strong>in</strong>e listeners (1, 2, 3, 4, <strong>and</strong> 6), there is more activation<br />
<strong>in</strong> the right hemisphere than the left; the activation is<br />
roughly balanced for listener 7, <strong>and</strong> listeners 5, 8, <strong>and</strong><br />
9 exhibit little or no melody versus fixed activity. In the<br />
right hemisphere, six <strong>of</strong> the n<strong>in</strong>e listeners have two regions<br />
<strong>of</strong> melody activation, but none has activity <strong>in</strong> all<br />
three <strong>of</strong> the regions identified <strong>in</strong> the average data, <strong>and</strong><br />
no one comb<strong>in</strong>ation <strong>of</strong> areas is overly common. In the<br />
left hemisphere, there is generally less activity <strong>and</strong> there<br />
is no discernible pattern. So, the distribution <strong>of</strong> activation<br />
associated with the process<strong>in</strong>g <strong>of</strong> melody <strong>in</strong>formation<br />
outside auditory cortex is considerably more vari-<br />
able across listeners than the process<strong>in</strong>g <strong>of</strong> pitch<br />
<strong>in</strong>formation <strong>in</strong> lateral HG.<br />
<strong>Melody</strong> produces essentially the same amount <strong>of</strong> activation<br />
as noise <strong>in</strong> PT <strong>and</strong> medial HG; <strong>in</strong> lateral HG,<br />
melody produces only slightly more activation than fixed<br />
pitch, <strong>and</strong> so the regions <strong>of</strong> differential activation to<br />
melody (green) are largely separate from those associ-<br />
ated with noise <strong>and</strong> fixed pitch. <strong>The</strong> exception is <strong>in</strong><br />
lateral HG, where listeners 2, 3, 6, <strong>and</strong> 7 exhibit some<br />
differential activation to melody with<strong>in</strong> the region <strong>of</strong> activation<br />
associated with fixed pitch. It may be that lateral<br />
HG is <strong>in</strong>volved <strong>in</strong> detect<strong>in</strong>g when a pitch changes <strong>and</strong><br />
the regions <strong>in</strong> PP <strong>and</strong> STS are <strong>in</strong>volved <strong>in</strong> evaluat<strong>in</strong>g the<br />
pitch contour on a longer time scale.<br />
Summary <strong>of</strong> Listener Variability<br />
Eight <strong>of</strong> the n<strong>in</strong>e listeners exhibit the hierarchy <strong>of</strong> melody<br />
process<strong>in</strong>g observed <strong>in</strong> the group analysis. With<strong>in</strong> <strong>in</strong>di-<br />
viduals, the locations <strong>of</strong> the peaks associated with the<br />
process<strong>in</strong>g <strong>of</strong> noise <strong>and</strong> fixed pitch are highly consistent<br />
across stimulus conditions. Across listeners, however,<br />
the locations <strong>of</strong> the peaks associated with noise vary<br />
considerably. Similarly, the locations <strong>of</strong> peaks associ-<br />
ated with the process<strong>in</strong>g <strong>of</strong> melody <strong>in</strong> PP <strong>and</strong> STG vary<br />
considerably across <strong>in</strong>dividuals. <strong>The</strong> variability <strong>in</strong> the<br />
location <strong>of</strong> HG is small relative to the functional variabil-<br />
ity, <strong>and</strong> so the variability <strong>in</strong> the functional activation<br />
cannot be expla<strong>in</strong>ed <strong>in</strong> terms <strong>of</strong> the gross anatomy.
<strong>Melody</strong> <strong>Process<strong>in</strong>g</strong> <strong>in</strong> the <strong>Temporal</strong> Lobe<br />
773<br />
Discussion<br />
<strong>and</strong> right hemispheres, respectively, <strong>and</strong> the difference<br />
was not significant (t 1.47, df 7, <strong>and</strong> p 0.19).<br />
With regard to the hierarchy <strong>of</strong> melody process<strong>in</strong>g: the For all eight listeners, prom<strong>in</strong>ent peaks occurred <strong>in</strong> the<br />
fact that the contrast between fixed pitch <strong>and</strong> noise melody versus noise contrast <strong>and</strong> the r<strong>and</strong>om versus<br />
activates a region lateral to PAC on HG <strong>and</strong> the fact that noise contrast at precisely the same positions as <strong>in</strong> the<br />
the contrast between melody <strong>and</strong> fixed pitch produces fixed versus noise contrast, <strong>and</strong> so the analysis was<br />
activation outside <strong>of</strong> HG <strong>and</strong> PT supports the hypothesis extended to these peaks as well, s<strong>in</strong>ce they were asthat<br />
there is a hierarchy <strong>of</strong> pitch process<strong>in</strong>g <strong>in</strong> human sumed to represent the operation <strong>of</strong> the pitch extraction<br />
cerebral cortex with the activation mov<strong>in</strong>g anterolater- mechanism <strong>in</strong> the melody conditions. <strong>The</strong> average valally<br />
as process<strong>in</strong>g proceeds. <strong>The</strong>re are limited anatomi- ues for the melody versus noise contrast were 8.3 (left)<br />
cal data concern<strong>in</strong>g connectivity <strong>in</strong> human cerebral cor- <strong>and</strong> 9.3 (right), <strong>and</strong> the difference was not significant<br />
tex, but the relevant studies (Howard et al., 2000; Tardif (p 0.39). <strong>The</strong> average values for the r<strong>and</strong>om versus<br />
<strong>and</strong> Clarke, 2001; Hackett et al., 2001) are consistent noise contrast were 8.2 (left) <strong>and</strong> 9.2 (right); the differwith<br />
the hierarchy <strong>of</strong> process<strong>in</strong>g suggested by the func- ence was not significant (p 0.09). This suggests that<br />
tional data. Anatomical studies <strong>of</strong> the macaque show pitch process<strong>in</strong>g is largely symmetric <strong>in</strong> the hierarchy<br />
that auditory cortex is composed <strong>of</strong> a central core, a up to <strong>and</strong> <strong>in</strong>clud<strong>in</strong>g lateral HG.<br />
surround<strong>in</strong>g belt, <strong>and</strong> a lateral parabelt (Hackett et al., Pronounced asymmetries are largely limited to the<br />
1998) <strong>and</strong> that this cortical system is connected hierar- melody versus fixed contrast <strong>in</strong> the current study, <strong>and</strong><br />
chically (Kaas <strong>and</strong> Hackett, 2000). <strong>The</strong> core conta<strong>in</strong>s they emerge as the activation moves from HG out onto<br />
three regions: A1; a more rostral region, R; <strong>and</strong> an even PP <strong>and</strong> STG. This <strong>in</strong>terpretation is consistent with a host<br />
more rostrotemporal region, RT (e.g., Kaas <strong>and</strong> Hackett, <strong>of</strong> neuropsychological studies. One <strong>of</strong> the earlier ones<br />
2000). A recent comparative study <strong>of</strong> auditory cortex <strong>in</strong> (Samson <strong>and</strong> Zatorre, 1988) shows that patients with<br />
macaques, chimpanzees, <strong>and</strong> humans (Hackett et al., anterior temporal-lobe resections (spar<strong>in</strong>g HG) are more<br />
2001) suggests that core <strong>in</strong> macaques corresponds to impaired when detect<strong>in</strong>g a s<strong>in</strong>gle note change <strong>in</strong> a patthe<br />
central three quarters <strong>of</strong> HG <strong>in</strong> humans. In our func- tern <strong>of</strong> three notes if the resections are on the right.<br />
tional data, the centroid <strong>of</strong> the activity associated with A recent study (Johnsrude et al., 2000) <strong>in</strong>dicates that<br />
pitch on HG (shown <strong>in</strong> red <strong>in</strong> Figure 3) is somewhat patients with anterior temporal-lobe excisions that enlateral<br />
<strong>and</strong> anterior to the region <strong>of</strong> HG traditionally asso- croach upon the anterolateral extremity <strong>of</strong> HG <strong>in</strong> the<br />
ciated with PAC. This suggests that the pitch region right hemisphere, but not <strong>in</strong> the left, are more impaired<br />
corresponds to the R or RT region <strong>of</strong> core. It should be when discrim<strong>in</strong>at<strong>in</strong>g the direction <strong>of</strong> a melodic contour.<br />
noted, however, that the centroid <strong>of</strong> the pitch center <strong>in</strong> Similarly, functional neuroimag<strong>in</strong>g studies, which show<br />
our study is below the central axis <strong>of</strong> HG, which may relatively more activity <strong>in</strong> the right hemisphere <strong>in</strong> remean<br />
that it is not R or RT. <strong>The</strong> extra activation produced sponse to melodic sounds, support the hypothesis that<br />
by melodies <strong>in</strong> STG <strong>and</strong> lateral PP is outside the core the asymmetry is greater <strong>in</strong> regions anterior to auditory<br />
area; the region <strong>of</strong> activation <strong>in</strong> STG may correspond to cortex (e.g., Zatorre et al., 1994; see Zatorre et al., 2002,<br />
a parabelt region <strong>in</strong> macaque, but the region <strong>in</strong> lateral<br />
for a review).<br />
PP seems rather anterior to be a parabelt region. In any<br />
In their PET study, Griffiths et al. (1998) performed an<br />
event, the functional hierarchy <strong>of</strong> melody process<strong>in</strong>g<br />
<strong>in</strong>teraction analysis to f<strong>in</strong>d areas where activity <strong>in</strong>revealed<br />
<strong>in</strong> humans would appear to be consistent with<br />
creased as a function <strong>of</strong> pitch strength, more for melothe<br />
hierarchy <strong>of</strong> anatomical connections reported for<br />
dies than for fixed pitch, <strong>and</strong> found two pairs <strong>of</strong> relatively<br />
macaques.<br />
lateral regions–a posterior pair near the <strong>in</strong>tersection <strong>of</strong><br />
With regard to the emergence <strong>of</strong> asymmetry <strong>in</strong> the<br />
PT <strong>and</strong> STG (58, 42, 2 <strong>and</strong> 72, 40, 6) <strong>and</strong> an<br />
hierarchy: <strong>in</strong> the study <strong>of</strong> subcortical activation (Griffiths<br />
anterior pair on PP (54, 10, 18 <strong>and</strong> 58, 12, 26). <strong>The</strong><br />
et al., 2001), the fixed versus noise contrast revealed<br />
contrast between melody <strong>and</strong> fixed pitch <strong>in</strong> the current<br />
symmetric activation <strong>in</strong> the bra<strong>in</strong>stem <strong>and</strong> slightly asymfMRI<br />
experiment is reasonably comparable, <strong>and</strong> Figures<br />
metric activation <strong>in</strong> the auditory thalamus with greater<br />
2J <strong>and</strong> 2K show activation <strong>in</strong> similar regions to those <strong>in</strong><br />
activation on the right; together these f<strong>in</strong>d<strong>in</strong>gs led to<br />
the PET study; the peaks <strong>in</strong> the posterior regions are at<br />
the conclusion that subcortical process<strong>in</strong>g <strong>of</strong> temporal<br />
62, 28, 2 <strong>and</strong> 66, 30, 2 <strong>and</strong> those <strong>in</strong> the anterior<br />
regularity was largely symmetric. With regard to auditory<br />
regions are at 56, 6, 10 <strong>and</strong> 54, 14, 16. <strong>The</strong> activacortex,<br />
the PET study <strong>of</strong> Griffiths et al. (1998) revealed<br />
bilateral activation that <strong>in</strong>creased with the strength <strong>of</strong><br />
tion <strong>in</strong> the fMRI study is more asymmetric than <strong>in</strong> the PET<br />
the pitch produced by the RI sounds, although the actistudy,<br />
perhaps because it had greater spatial resolution.<br />
vation was somewhat asymmetric with<strong>in</strong> respect to HG.<br />
<strong>The</strong>re is also a recent study that relates musical ability,<br />
It was centered on HG <strong>in</strong> the right hemisphere <strong>and</strong> tolated<br />
s<strong>in</strong>usoids, <strong>and</strong> gray matter volume <strong>in</strong> HG (Schnei-<br />
magnetoencephalographic (MEG) responses to moduward<br />
the lateral end <strong>of</strong> HG <strong>in</strong> the left hemisphere. <strong>The</strong><br />
data from the current study <strong>in</strong>dicate that all the broadmatter<br />
<strong>in</strong> HG was significantly greater <strong>in</strong> a group <strong>of</strong><br />
der et al. (2002). <strong>The</strong>y found that the volume <strong>of</strong> gray<br />
b<strong>and</strong> stimuli produce bilateral <strong>and</strong> relatively symmetric<br />
activity <strong>in</strong> auditory cortex (HG <strong>and</strong> PT) (the blue <strong>and</strong> pr<strong>of</strong>essional musicians than amateur <strong>and</strong> nonmusicians,<br />
red regions <strong>in</strong> Figure 3). A specific test for hemispheric <strong>and</strong> the pr<strong>of</strong>essionals had stronger MEG responses <strong>in</strong><br />
asymmetry was performed for the fixed versus noise medial HG. <strong>The</strong> data were symmetric for amateur musi-<br />
contrast associated with pitch process<strong>in</strong>g <strong>in</strong> lateral HG cians <strong>and</strong> nonmusicians (consistent with our data), but<br />
(as before, listener 9 was omitted from the analysis). there was a small, significant asymmetry for pr<strong>of</strong>essional<br />
<strong>The</strong> t value for the most prom<strong>in</strong>ent peak <strong>in</strong> this contrast musicians. So for pr<strong>of</strong>essional musicians, the asymmewas<br />
identified for each <strong>of</strong> the listeners <strong>in</strong> each hemisphere.<br />
try associated with melody may emerge one stage ear-<br />
<strong>The</strong> average values were 6.3 <strong>and</strong> 6.8 <strong>in</strong> the left lier <strong>in</strong> the hierarchy <strong>of</strong> melody<br />
process<strong>in</strong>g.
Neuron<br />
774<br />
<strong>The</strong> Hemispheric Specialization Hypothesis<br />
In their review <strong>of</strong> asymmetry <strong>in</strong> response to speech <strong>and</strong><br />
musical sounds, Zatorre et al. (2002) conclude that the<br />
process<strong>in</strong>g <strong>of</strong> sounds with musical pitch results <strong>in</strong> relatively<br />
more activity <strong>in</strong> the right hemisphere, whereas the<br />
process<strong>in</strong>g <strong>of</strong> sounds with critical tim<strong>in</strong>g <strong>in</strong>formation,<br />
like syllables with plosive consonants, results <strong>in</strong> relatively<br />
more activity <strong>in</strong> the left hemisphere. <strong>The</strong>y then go<br />
on to propose that the auditory system has developed<br />
“… parallel <strong>and</strong> complementary systems–one <strong>in</strong> each<br />
hemisphere–specialized for rapid temporal process<strong>in</strong>g<br />
(left) or for f<strong>in</strong>e spectral process<strong>in</strong>g (right) respectively”<br />
(page 40), <strong>and</strong> they draw an analogy with the uncerta<strong>in</strong>ty<br />
pr<strong>in</strong>ciple as it applies to time <strong>and</strong> frequency constra<strong>in</strong>ts<br />
<strong>in</strong> the spectrogram (their Box 2). Note that the discussion<br />
<strong>of</strong> the data is <strong>in</strong> terms <strong>of</strong> pitch, while the HS hypothesis<br />
<strong>and</strong> the analogy are described <strong>in</strong> terms <strong>of</strong> spectral process<strong>in</strong>g.<br />
<strong>The</strong> activation associated with the pitch <strong>and</strong><br />
melody <strong>of</strong> RI sounds appears to be largely compatible<br />
with the pitch <strong>and</strong> melody activation discussed by Zatorre<br />
et al. (2002), as noted above. It seems somewhat<br />
difficult, however, to reconcile the process<strong>in</strong>g <strong>of</strong> RI<br />
sounds with the part <strong>of</strong> the HS hypothesis that says<br />
that the right hemisphere is specialized for f<strong>in</strong>e spectral<br />
process<strong>in</strong>g.<br />
<strong>The</strong> HS hypothesis suggests that pitch is the result<br />
<strong>of</strong> f<strong>in</strong>e spectral process<strong>in</strong>g <strong>in</strong> auditory cortex or, to be<br />
more specific, that pitch arises from the detection <strong>of</strong><br />
harmonically related peaks <strong>in</strong> the tonotopic representation<br />
<strong>of</strong> the Fourier magnitude spectrum <strong>of</strong> the sound<br />
as it occurs <strong>in</strong> or near auditory cortex (the concept is<br />
illustrated <strong>in</strong> Figures 1A <strong>and</strong> 1B <strong>of</strong> Griffiths et al., 1998).<br />
This cannot be the case for the RI sounds <strong>in</strong> this study,<br />
s<strong>in</strong>ce there are no harmonically related peaks across<br />
the tonotopic dimension <strong>of</strong> the representation at any<br />
level <strong>in</strong> the auditory system (Figure 1G <strong>of</strong> the current<br />
paper). Moreover, the f<strong>in</strong>e-gra<strong>in</strong> tim<strong>in</strong>g <strong>in</strong>formation observed<br />
<strong>in</strong> physiological responses at the level <strong>of</strong> the<br />
bra<strong>in</strong>stem is not observed <strong>in</strong> auditory cortex. This is<br />
what led us to suggest that the differential activation <strong>in</strong><br />
lateral HG is associated with the calculation <strong>of</strong> precise<br />
values for pitch <strong>and</strong> pitch strength from the heights <strong>and</strong><br />
widths <strong>of</strong> the peaks <strong>in</strong> a representation someth<strong>in</strong>g like<br />
that shown <strong>in</strong> Figure 1K. It may be that the same area<br />
calculates precise spectral pitch values when the tonotopic<br />
representation <strong>in</strong> auditory cortex exhibits peaks<br />
<strong>and</strong> that the specialization is not so much one <strong>of</strong> f<strong>in</strong>e<br />
spectral process<strong>in</strong>g <strong>in</strong> auditory cortex to extract an ac-<br />
curate pitch estimate, but more one <strong>of</strong> accurate monitor<strong>in</strong>g<br />
<strong>of</strong> the pitch <strong>in</strong>formation flow<strong>in</strong>g from auditory cortex<br />
<strong>in</strong> subsequent centers concerned with whether the<br />
sound has the k<strong>in</strong>d <strong>of</strong> stable pitch exhibited by musical<br />
notes, <strong>and</strong> what the <strong>in</strong>tervals are when the pitch jumps<br />
from one note to another. A modified version <strong>of</strong> the HS<br />
hypothesis <strong>in</strong> which the specialization <strong>in</strong>volves f<strong>in</strong>e pitch<br />
track<strong>in</strong>g rather than f<strong>in</strong>e spectral process<strong>in</strong>g would appear<br />
to be <strong>in</strong> good agreement with the data, but <strong>in</strong> this<br />
case, the analogy with the uncerta<strong>in</strong>ty pr<strong>in</strong>ciple would<br />
seem somewhat tenuous.<br />
Conclusions<br />
All <strong>of</strong> the broadb<strong>and</strong> sounds <strong>in</strong> this study produced<br />
activation bilaterally <strong>in</strong> a number <strong>of</strong> centers <strong>in</strong> HG <strong>and</strong><br />
PT <strong>in</strong>dependent <strong>of</strong> whether they produced a pitch or<br />
whether the pitch was chang<strong>in</strong>g over time. <strong>The</strong> fixedpitch<br />
stimuli produced more activation than noise <strong>in</strong><br />
lateral HG, bilaterally. <strong>The</strong> noise <strong>and</strong> fixed-pitch stimuli<br />
did not produce any substantial regions <strong>of</strong> activation<br />
outside HG <strong>and</strong> PT. When the pitch was varied to pro-<br />
duce a melody, the sound produced additional, asymmetric<br />
activation <strong>in</strong> STG <strong>and</strong> lateral PP with relatively<br />
more activity <strong>in</strong> the right hemisphere.<br />
While it is not possible at this time to be precise about<br />
the mechanics <strong>of</strong> auditory <strong>in</strong>formation process<strong>in</strong>g at<br />
each stage, if we assume that there are three stages<br />
<strong>of</strong> melody <strong>in</strong>formation process<strong>in</strong>g as proposed <strong>in</strong> the<br />
<strong>in</strong>troduction, <strong>and</strong> they occur <strong>in</strong> the order specified, then<br />
the broad mapp<strong>in</strong>g from stage <strong>of</strong> process<strong>in</strong>g to bra<strong>in</strong><br />
region would appear to be as follows. (1) <strong>The</strong> extraction<br />
<strong>of</strong> time-<strong>in</strong>terval <strong>in</strong>formation from the neural fir<strong>in</strong>g pattern<br />
<strong>in</strong> the auditory nerve <strong>and</strong> the construction <strong>of</strong> time-<strong>in</strong>ter-<br />
val histograms (e.g., the rows <strong>of</strong> Figures 1C <strong>and</strong> 1H),<br />
probably occurs <strong>in</strong> the bra<strong>in</strong>stem <strong>and</strong> thalamus. (2) De-<br />
term<strong>in</strong><strong>in</strong>g the specific value <strong>of</strong> a pitch <strong>and</strong> its salience<br />
from the <strong>in</strong>terval histograms probably occurs <strong>in</strong> lateral<br />
HG (e.g., by produc<strong>in</strong>g a summary histogram as <strong>in</strong> Figures<br />
1E <strong>and</strong> 1K <strong>and</strong> locat<strong>in</strong>g the first peak). (3) Determ<strong>in</strong>-<br />
<strong>in</strong>g that the pitch changes <strong>in</strong> discrete steps <strong>and</strong> track<strong>in</strong>g<br />
the changes <strong>in</strong> a melody probably occurs beyond auditory<br />
cortex <strong>in</strong> STG <strong>and</strong>/or lateral PP. It would appear<br />
to be these latter processes associated with melody<br />
process<strong>in</strong>g rather than pitch extraction per se that give<br />
rise to the asymmetries observed <strong>in</strong> neuropsychological<br />
<strong>and</strong> functional neuroimag<strong>in</strong>g studies.<br />
Experimental Procedures<br />
Subjects<br />
N<strong>in</strong>e normal-hear<strong>in</strong>g listeners volunteered as subjects after giv<strong>in</strong>g<br />
<strong>in</strong>formed consent (six male, three female, mean age 34.3 8.9<br />
years). None <strong>of</strong> the listeners had any history <strong>of</strong> hear<strong>in</strong>g disorders<br />
or neurological disorders.<br />
Stimulus Generation<br />
<strong>The</strong> stimuli were sequences <strong>of</strong> noise bursts <strong>and</strong> regular-<strong>in</strong>terval (RI)<br />
sounds. A RI sound is created by delay<strong>in</strong>g a copy <strong>of</strong> a r<strong>and</strong>om noise<br />
<strong>and</strong> add<strong>in</strong>g it back to the orig<strong>in</strong>al. <strong>The</strong> perception has some <strong>of</strong> the<br />
hiss <strong>of</strong> the orig<strong>in</strong>al r<strong>and</strong>om noise <strong>and</strong> also a weak pitch with a<br />
frequency at the <strong>in</strong>verse <strong>of</strong> the delay time. <strong>The</strong> strength <strong>of</strong> this pitch<br />
<strong>in</strong>creases when the delay-<strong>and</strong>-add process is repeated (Yost et al.,<br />
1996). When the pitch is less than about 125 Hz <strong>and</strong> the stimuli are<br />
high-pass filtered at about 500 Hz, the RI sounds effectively excite<br />
all frequency channels <strong>in</strong> the same way as r<strong>and</strong>om noise (Patterson<br />
et al., 1996); compare the frequency pr<strong>of</strong>iles <strong>in</strong> Figures 1G <strong>and</strong> 1B.<br />
<strong>The</strong> perception <strong>of</strong> pitch <strong>in</strong> this case is based on extract<strong>in</strong>g time<br />
<strong>in</strong>tervals rather than spectral peaks from the neural pattern pro-<br />
duced by the RI sound <strong>in</strong> the auditory nerve; compare the frequency<br />
pr<strong>of</strong>ile <strong>in</strong> Figure 1G with the time-<strong>in</strong>terval pr<strong>of</strong>ile <strong>in</strong> Figure 1K. Quanti-<br />
tative models <strong>of</strong> the pitch <strong>of</strong> RI sounds based on peaks <strong>in</strong> the time-<br />
<strong>in</strong>terval pr<strong>of</strong>ile have proven highly successful (e.g., Pressnitzer et<br />
al., 2001).<br />
<strong>The</strong>re were five conditions <strong>in</strong> the experiment: four sound condi-<br />
tions <strong>and</strong> a silent basel<strong>in</strong>e. <strong>The</strong> sounds were sequences <strong>of</strong> 32 notes<br />
played at the rate <strong>of</strong> four notes/s (8 s total duration). Each note<br />
was 200 ms <strong>in</strong> duration <strong>and</strong> there were 50 ms <strong>of</strong> silence between<br />
successive notes. <strong>The</strong> sounds were (1) r<strong>and</strong>om noise with no pitch<br />
(noise) <strong>and</strong> three RI sounds <strong>in</strong> which the pitch was (2) fixed for a<br />
given 32-note sequence (fixed), (3) varied to produce novel diatonic<br />
melodies (diatonic), or (4) varied to produced r<strong>and</strong>om note melodies<br />
(r<strong>and</strong>om). <strong>The</strong> pitch range for the diatonic <strong>and</strong> r<strong>and</strong>om melodies<br />
was 50 to 110 Hz. <strong>The</strong> pitch <strong>in</strong> the fixed-pitch sequences was varied
<strong>Melody</strong> <strong>Process<strong>in</strong>g</strong> <strong>in</strong> the <strong>Temporal</strong> Lobe<br />
775<br />
r<strong>and</strong>omly between sequences to cover the same range as the melo- centroids for a normalized version <strong>of</strong> their PAC data (p. 677). To<br />
dies over the course <strong>of</strong> the experiment. All <strong>of</strong> the sounds were ensure comparability, we obta<strong>in</strong>ed the raw data for n<strong>in</strong>e cases from<br />
b<strong>and</strong>-pass filtered between 500 <strong>and</strong> 4000 Hz us<strong>in</strong>g fourth-order Rademacher <strong>and</strong> colleagues, <strong>and</strong> we applied the default, smoothly<br />
Butterworth filters <strong>and</strong> presented to both ears at 75 dB SPL through nonl<strong>in</strong>ear, normalization <strong>of</strong> SPM99 to the data. Centroids were then<br />
magnet-compatible, high-fidelity electrostatic headphones (Palmer calculated for these maps us<strong>in</strong>g the same probability-weighted<br />
et al., 1998).<br />
function applied to the Penhune maps. All three sets <strong>of</strong> centroids<br />
are listed <strong>in</strong> Table 1. Note that the estimates based on HG <strong>and</strong> PAC<br />
fMRI Protocol<br />
data are almost identical.<br />
Sparse temporal sampl<strong>in</strong>g was used to separate the scanner noise Overall, the positions for HG estimated from the current study are<br />
<strong>and</strong> the experimental sounds <strong>in</strong> time (Edmister et al., 1999; Hall <strong>in</strong> good agreement with the positions derived <strong>in</strong> previous studies.<br />
et al., 1999). Blood oxygenation level-dependent (BOLD) contrastthan<br />
<strong>The</strong> group centroid <strong>in</strong> the current study is more anterior on the right<br />
image volumes were acquired every 12 s, us<strong>in</strong>g a 2.0-T MRI scanner<br />
on the left (t (8df) 3.69, p 0.01), consistent with previous<br />
(Siemens, VISION, Erlangen) with gradient-echo-planar imag<strong>in</strong>g (TR/ reports. A comparison with other studies shows a displacement <strong>of</strong><br />
TE 12,000 ms/35 ms). A total <strong>of</strong> 48 axial slices were acquired 5–7.7 mm <strong>in</strong> the left <strong>and</strong> 3.2–5.9 mm <strong>in</strong> the right hemisphere. <strong>The</strong>re<br />
cover<strong>in</strong>g the whole bra<strong>in</strong>. Each condition was repeated 48 times <strong>in</strong> was a significant difference (t 2.71, p 0.05) <strong>in</strong> left/right displacer<strong>and</strong>om<br />
order. A T1-weighted MPRAGE high-resolution (1 1 ment when compared with the centroids <strong>of</strong> HG, while this displace-<br />
1.5 mm) structural image was also collected from each subject on ment was not significantly different from the estimates <strong>of</strong> the center<br />
the same MR system. Further details are presented <strong>in</strong> Griffiths et <strong>of</strong> PAC (see Table 1). One-group t tests, test<strong>in</strong>g for significant dis-<br />
al. (2001).<br />
placement (2-tailed) between left <strong>and</strong> right hemispheres separately<br />
for x, y, <strong>and</strong> z revealed that only the x coord<strong>in</strong>ate <strong>in</strong> the left <strong>and</strong> the<br />
Data <strong>Process<strong>in</strong>g</strong> <strong>and</strong> Analysis<br />
z coord<strong>in</strong>ate <strong>in</strong> the right were significantly different <strong>in</strong> location from<br />
Structural <strong>and</strong> functional data were processed <strong>and</strong> analyzed us<strong>in</strong>g<br />
all three other estimates. Our x coord<strong>in</strong>ate <strong>in</strong> the left is, on average,<br />
SPM99 (http://www.fil.ion.ucl.ac.uk/spm). <strong>The</strong> BOLD time series<br />
5.2 mm (<strong>in</strong>dividual averages range 4.1–7.1 mm) more lateral than <strong>in</strong><br />
was realigned to the first image <strong>of</strong> the series <strong>and</strong> then the structural<br />
the other estimates. Our z coord<strong>in</strong>ate <strong>in</strong> the right is 2.0 mm <strong>in</strong>ferior<br />
image was coregistered to these images <strong>and</strong> resampled to 2 2 <br />
to the other estimates (<strong>in</strong>dividual average range 1.4–2.6 mm).<br />
2 mm resolution. <strong>The</strong> realigned BOLD images were normalized to<br />
the st<strong>and</strong>ard SPM EPI template (ICBM 152, Brett et al., 2002) us<strong>in</strong>g Acknowledgments<br />
aff<strong>in</strong>e <strong>and</strong> smoothly nonl<strong>in</strong>ear spatial transformations: the same<br />
normalization parameters were applied to the structural images. <strong>The</strong> research was supported by the UK Medical Research Council<br />
<strong>The</strong> result<strong>in</strong>g images are <strong>in</strong> st<strong>and</strong>ardized, Talairach-like space. <strong>The</strong> (G9900369, G9901257).<br />
ICBM-152 template creates images that are a few millimeters displaced<br />
from the Talairach bra<strong>in</strong> (Talairach <strong>and</strong> Tournoux, 1988), Received: May 23, 2002<br />
particularly <strong>in</strong> the superior-<strong>in</strong>ferior (z) dimension (Brett et al., 2002). Revised: September 24, 2002<br />
This is the reason for the phrase Talairach-like. F<strong>in</strong>ally, the functional<br />
data were smoothed with a Gaussian filter <strong>of</strong> 5 mm (full-width at References<br />
half maximum). Fixed-effects analyses were conducted on each<br />
listener’s data (288 scans) <strong>and</strong> across the whole group <strong>of</strong> subjects Brett, M., Johnsrude, I.S., <strong>and</strong> Owen, A.M. (2002). <strong>The</strong> problem <strong>of</strong><br />
(with a total <strong>of</strong> 2592 scans) us<strong>in</strong>g the general l<strong>in</strong>ear model. <strong>The</strong> functional localization <strong>in</strong> the human bra<strong>in</strong>. Nat. Rev. Neurosci. 3,<br />
height threshold for group activation was t 5.00 (p 0.05 corrected 243–249.<br />
for multiple comparisons across the whole volume). It was reduced Edmister, W.B., Talavage, T.M., Ledden, P.J., <strong>and</strong> Weissk<strong>of</strong>f, R.M.<br />
somewhat for the <strong>in</strong>dividual data to t 5.00 (p 0.001 uncorrected). (1999). Improved auditory cortex imag<strong>in</strong>g us<strong>in</strong>g clustered volume<br />
acquisitions. Hum. Bra<strong>in</strong> Mapp. 7, 89–97.<br />
Evaluation <strong>of</strong> Individual Anatomy<br />
Ehret, G., <strong>and</strong> Rom<strong>and</strong>, R. (1997). <strong>The</strong> Central Auditory System (New<br />
In order to observe the relationship between functional activation York: Oxford University Press).<br />
<strong>and</strong> macroscopic anatomy, the putative location <strong>of</strong> primary auditory<br />
Griffiths, T.D., Büchel, C., Frackowiak, R.S.J., <strong>and</strong> Patterson, R.D.<br />
cortex was identified <strong>in</strong> each listener. All four <strong>of</strong> the authors labeled<br />
(1998). Analysis <strong>of</strong> temporal structure <strong>in</strong> sound by the bra<strong>in</strong>. Nat.<br />
the first transverse temporal gyrus (HG) <strong>in</strong> both hemispheres <strong>of</strong><br />
Neurosci. 1, 422–427.<br />
each listener, us<strong>in</strong>g a s<strong>of</strong>tware label<strong>in</strong>g package (MRIcro: http://<br />
www.psychology.nott<strong>in</strong>gham.ac.uk/staff/crl/mricro.html) <strong>and</strong> the Griffiths, T.D., Uppenkamp, S., Johnsrude, I., Josephs, O., <strong>and</strong> Pat-<br />
anatomical criteria suggested by Penhune et al. (1996). Both white terson, R.D. (2001). Encod<strong>in</strong>g <strong>of</strong> the temporal regularity <strong>of</strong> sound <strong>in</strong><br />
<strong>and</strong> gray matter were <strong>in</strong>cluded <strong>in</strong> the labeled volumes. In some the human bra<strong>in</strong>stem. Nat. Neurosci. 4, 633–637.<br />
listeners HG is duplicated or partially duplicated (Penhune et al., Guimares, A.R., Melcher, J.R., Talavage, T.M., Baker, J.R., Ledden,<br />
1996; Leonard et al., 1998). In this study, the duplication was ignored, P., Rosen, B.R., Kiang, N.Y.S., Fullerton, B.C., <strong>and</strong> Weissk<strong>of</strong>f, R.M.<br />
<strong>and</strong> the label<strong>in</strong>g was restricted to the part <strong>of</strong> HG anterior to any (1998). Imag<strong>in</strong>g subcortical activity <strong>in</strong> humans. Hum. Bra<strong>in</strong>. Mapp.<br />
divid<strong>in</strong>g sulcus (Rademacher et al., 1993; 2001). So our estimates 6, 33–41.<br />
<strong>of</strong> the extent <strong>of</strong> primary auditory cortex are a little more conservative Hackett, T.A., Stepniewska, I., <strong>and</strong> Kaas, J.H. (1998). Subdivisions<br />
than is traditional (Rademacher et al., 2001).<br />
<strong>of</strong> auditory cortex <strong>and</strong> ipsilateral cortical connections <strong>of</strong> the parabelt<br />
<strong>The</strong> label<strong>in</strong>g <strong>of</strong> the four judges was comb<strong>in</strong>ed to produce a labeled auditory cortex <strong>in</strong> macaque monkeys. J. Comp. Neurol. 394,<br />
volume <strong>of</strong> HG for each listener by <strong>in</strong>clud<strong>in</strong>g all voxels that two 475–495.<br />
or more judges had labeled as part <strong>of</strong> HG. <strong>The</strong> result is a three-<br />
Hackett, T.A., Preuss, T.M., <strong>and</strong> Kaas, J.H. (2001). Architectonic<br />
dimensional HG map that is coregistered with the <strong>in</strong>dividual’s funcidentification<br />
<strong>of</strong> the core region <strong>in</strong> auditory cortex <strong>of</strong> macaques,<br />
tional data. F<strong>in</strong>ally, a mean HG volume was created for the group<br />
chimpanzees, <strong>and</strong> humans. J. Comp. Neurol. 441, 197–222.<br />
by averag<strong>in</strong>g across the n<strong>in</strong>e <strong>in</strong>dividually labeled volumes.<br />
Hall, D.A., Haggard, M.P., Akeroyd, M.A., Palmer, A.R., Summerfield,<br />
A.Q., Elliott, M.R., Gurney, E.M., <strong>and</strong> Bowtell, R.W. (1999). “Sparse”<br />
Comparison <strong>of</strong> Anatomy with Previous Studies<br />
temporal sampl<strong>in</strong>g <strong>in</strong> auditory fMRI. Hum. Bra<strong>in</strong> Mapp. 7, 213–223.<br />
<strong>The</strong> location <strong>of</strong> HG obta<strong>in</strong>ed <strong>in</strong> the current study was compared<br />
with that obta<strong>in</strong>ed <strong>in</strong> one morphological study (Penhune et al., 1996) Hall, D.A., Johnsrude, I.J., Haggard, M.P., Palmer, A.R., Akeroyd,<br />
<strong>and</strong> one cytoarchitectonic study (Morosan et al., 2001, Rademacher M.A., <strong>and</strong> Summerfield, A.Q. (2002). Spectral <strong>and</strong> temporal pro-<br />
et al., 2001): <strong>in</strong> the former, HG was identified on the MR scans <strong>of</strong> cess<strong>in</strong>g <strong>in</strong> human auditory cortex. Cereb. Cortex 12, 140–149.<br />
20 <strong>in</strong>dividuals; <strong>in</strong> the latter, PAC was identified <strong>in</strong> bra<strong>in</strong>s <strong>of</strong> ten Howard, M.A., Volkov, I.O., Mirsky, R., Garell, P.C., Noh, M.D., Granner,<br />
<strong>in</strong>dividuals. Probability volumes <strong>of</strong> HG were obta<strong>in</strong>ed from Penhune,<br />
M., Damasio, H., Ste<strong>in</strong>schneider, M., Reale, R.A., H<strong>in</strong>d, J.E.,<br />
<strong>and</strong> centroids were calculated for the volumes <strong>in</strong> a probability- <strong>and</strong> Brugge, J.F. (2000). Auditory cortex on the human posterior<br />
weighted fashion (Hall, et al., 2002). Rademacher et al. (2001) report superior temporal gyrus. J. Comp. Neurol. 416, 79–92.
Neuron<br />
776<br />
Johnsrude, I.S., Penhune, V.B., <strong>and</strong> Zatorre, R.J. (2000). Functional<br />
specificity <strong>in</strong> the right human auditory cortex for perceiv<strong>in</strong>g pitch<br />
direction. Bra<strong>in</strong> 123, 155–163.<br />
Kaas, J.H., <strong>and</strong> Hackett, T.A. (2000). Subdivisions <strong>of</strong> auditory cortex<br />
<strong>and</strong> process<strong>in</strong>g streams <strong>in</strong> primates. Proc. Natl. Acad. Sci. USA 97,<br />
11793–11799.<br />
Krumbholz, K., Patterson, R.D., <strong>and</strong> Pressnitzer, D. (2000). <strong>The</strong> lower<br />
limit <strong>of</strong> pitch as determ<strong>in</strong>ed by rate discrim<strong>in</strong>ation. J. Acoust. Soc.<br />
Am. 108, 1170–1180.<br />
Leonard, C.M., Puranik, C., Kuldau, J.M., <strong>and</strong> Lombard<strong>in</strong>o, L.J.<br />
(1998). Normal variation <strong>in</strong> the frequency <strong>and</strong> location <strong>of</strong> human<br />
auditory cortex l<strong>and</strong>marks. Heschl’s gyrus: where is it? Cereb. Cortex<br />
8, 397–406.<br />
Morosan, P., Rademacher, J., Schleicher, A., Amunts, K., Schormann,<br />
T., <strong>and</strong> Zilles, K. (2001). Human primary auditory cortex: subdivisions<br />
<strong>and</strong> mapp<strong>in</strong>g <strong>in</strong>to a spatial reference system. Neuroimage<br />
13, 684–701.<br />
Palmer, A.R., <strong>and</strong> W<strong>in</strong>ter, I.M. (1992). Cochlear nerve <strong>and</strong> cochlear<br />
nucleus responses to the fundamental frequency <strong>of</strong> voiced speech<br />
sounds <strong>and</strong> harmonic complex tones. In Auditory Physiology <strong>and</strong><br />
Perception. Y Cazals, L. Demany, <strong>and</strong> K. Horner, eds. (Oxford: Pergamon),<br />
pp. 231–239.<br />
Palmer, A.R., Bullock, D.C., <strong>and</strong> Chambers, J.D. (1998). A highoutput,<br />
high-quality sound system for use <strong>in</strong> auditory fMRI. Neuroimage<br />
7, S359.<br />
Patterson, R.D. (1994). <strong>The</strong> sound <strong>of</strong> a s<strong>in</strong>usoid: time-<strong>in</strong>terval models.<br />
J. Acoust. Soc. Am. 96, 1419–1428.<br />
Patterson, R.D., Allerh<strong>and</strong>, M., <strong>and</strong> Giguere, C. (1995). Time-doma<strong>in</strong><br />
modell<strong>in</strong>g <strong>of</strong> peripheral auditory process<strong>in</strong>g: a modular architecture<br />
<strong>and</strong> a s<strong>of</strong>tware platform. J. Acoust. Soc. Am. 98, 1890–1894.<br />
Patterson, R.D., H<strong>and</strong>el, S., Yost, W.A., <strong>and</strong> Datta, A.J. (1996). <strong>The</strong><br />
relative strength <strong>of</strong> the tone <strong>and</strong> noise components <strong>in</strong> iterated rippled<br />
noise. J. Acoust. Soc. Am. 100, 3286–3294.<br />
Penhune, V.B., Zatorre, R.J., MacDonald, J.D., <strong>and</strong> Evans, A.C.<br />
(1996). Interhemispheric anatomical differences <strong>in</strong> human primary<br />
auditory cortex: probabilistic mapp<strong>in</strong>g <strong>and</strong> volume measurement<br />
from magnetic resonance scans. Cereb. Cortex 6, 661–672.<br />
Pressnitzer, D., Patterson, R.D., <strong>and</strong> Krumbholz, K. (2001). <strong>The</strong> lower<br />
limit <strong>of</strong> melodic pitch. J. Acoust. Soc. Am. 109, 2074–2084.<br />
Rademacher, J., Cav<strong>in</strong>ess, V.S., Ste<strong>in</strong>metz, H., <strong>and</strong> Galaburda, A.M.<br />
(1993). Topographical variation <strong>of</strong> the human primary cortices <strong>and</strong><br />
its relevance to bra<strong>in</strong> mapp<strong>in</strong>g <strong>and</strong> neuroimag<strong>in</strong>g studies. Cereb.<br />
Cortex 3, 313–329.<br />
Rademacher, J., Morosan, P., Schormann, T., Schleicher, A., Werner,<br />
C., Freund, H.J., <strong>and</strong> Zilles, K. (2001). Probabilistic mapp<strong>in</strong>g<br />
<strong>and</strong> volume measurement <strong>of</strong> human primary auditory cortex. Neuroimage<br />
13, 669–683.<br />
Rauschecker, J.P., <strong>and</strong> Tian, B. (2000). Mechanisms <strong>and</strong> streams<br />
for process<strong>in</strong>g ‘what’ <strong>and</strong> ‘where’ <strong>in</strong> auditory cortex. Proc. Natl.<br />
Acad. Sci. USA 97, 11800–11806.<br />
Rivier, F., <strong>and</strong> Clarke, S. (1997). Cytochrome oxidase, acetylchol<strong>in</strong>esterase,<br />
<strong>and</strong> NADPH-diaphorase sta<strong>in</strong><strong>in</strong>g <strong>in</strong> human supratemporal<br />
<strong>and</strong> <strong>in</strong>sular cortex: evidence for multiple auditory areas. Neuroimage<br />
6, 288–304.<br />
Samson, S., <strong>and</strong> Zatorre, R.J. (1988). Melodic <strong>and</strong> harmonic discrim<strong>in</strong>ation<br />
follow<strong>in</strong>g unilateral cerebral excision. Bra<strong>in</strong> Cogn. 7, 348–360.<br />
Schneider, P., Scherg, M., Günter Dosch, H., Specht, H.J., Gultshalk,<br />
A., <strong>and</strong> Rupp, A. (2002). Morphology <strong>of</strong> Heschl’s gyrus reflects enhanced<br />
activation <strong>in</strong> the auditory cortex <strong>of</strong> musicians. Nat. Neurosci.<br />
5, 688–694.<br />
Talairach, P., <strong>and</strong> Tournoux, J. (1988). Co-Planar Stereotaxic Atlas<br />
<strong>of</strong> the Human Bra<strong>in</strong>. (Stuttgart: Thieme).<br />
Tardif, E., <strong>and</strong> Clarke, S. (2001). Intr<strong>in</strong>sic connectivity <strong>in</strong> human auditory<br />
areas: trac<strong>in</strong>g study with DiI. Eur. J. Neurosci. 13, 1045–1050.<br />
Wess<strong>in</strong>ger, M., Van Meter, J., Tian, B., Pekar, J., <strong>and</strong> Rauschecker,<br />
J.P. (2001). Hierarchical organisation <strong>of</strong> the human auditory cortex<br />
revealed by functional magnetic resonance imag<strong>in</strong>g. J. Cogn. Neurosci.<br />
13, 1–7.<br />
Yost, W.A. (1996). <strong>Pitch</strong> <strong>of</strong> iterated rippled noise. J. Acoust. Soc.<br />
Am. 100, 511–518.<br />
Yost, W.A. (1998). Auditory process<strong>in</strong>g <strong>of</strong> sounds with temporal<br />
regularity: Auditory process<strong>in</strong>g <strong>of</strong> regular-<strong>in</strong>terval stimuli. In Psychophysical<br />
<strong>and</strong> Physiological Advances <strong>in</strong> Hear<strong>in</strong>g, A. Palmer, A. Rees,<br />
Q. Summerfield, <strong>and</strong> R. Meddis, eds. (London: Whurr), pp. 546–553.<br />
Yost, W.A., Patterson, R.D., <strong>and</strong> Sheft, S. (1996). A time-doma<strong>in</strong><br />
description for the pitch strength <strong>of</strong> iterated rippled noise. J. Acoust.<br />
Soc. Am. 99, 1066–1078.<br />
Zatorre, R.J., Evans, A.C., <strong>and</strong> Meyer, E. (1994). Neural mechanisms<br />
underly<strong>in</strong>g melodic perception <strong>and</strong> memory for pitch. J. Neurosci.<br />
14, 1908–1919.<br />
Zatorre, R.J., Bel<strong>in</strong>, P., <strong>and</strong> Penhune, V.B. (2002). Structure <strong>and</strong><br />
functions <strong>of</strong> auditory cortex: music <strong>and</strong> speech. Trends Cogn. Sci.<br />
6, 37–46.


