Self-report outcome in new hearing-aid users - Department of ...
Self-report outcome in new hearing-aid users - Department of ...
Self-report outcome in new hearing-aid users - Department of ...

Create successful ePaper yourself
Turn your PDF publications into a flip-book with our unique Google optimized e-Paper software.
Table 5. Subscales with contribut<strong>in</strong>g items. The scores are<br />
calculated as the average <strong>of</strong> the response values for the<br />
contribut<strong>in</strong>g items (3rd column), and the subscale is designated<br />
<strong>in</strong> the text by its short notation (2nd column)<br />
Subscale Short notation Items<br />
GHABP<br />
Benefit GHABP-B Benefit 1<br />
Residual Disability GHABP-R Residual Disability 1<br />
Satisfaction GHABP-D Satisfaction 1<br />
IOI-HA<br />
Introspection IOI-IS 1, 2, 4, 7<br />
Interaction IOI-IA 3, 6<br />
HAPQ<br />
average HAPQ 118<br />
SADL<br />
Personal Image SADL-PI 4, 8, 13<br />
Positive Effect SADL-PE 1, 3, 5, 6, 9, 10<br />
GHABP item 3<br />
Hear<strong>in</strong>g <strong>aid</strong> use HA-use IOI-HA item 1<br />
SADL additional item 3<br />
ALD<br />
Auditory lifestyle ALD 125 (weighted average)<br />
1 For GHABP, only answers to listen<strong>in</strong>g situations nom<strong>in</strong>ated and<br />
answered at all three sessions were <strong>in</strong>cluded <strong>in</strong> calculat<strong>in</strong>g the subscale<br />
scores.<br />
that suggested that the dist<strong>in</strong>ctness <strong>of</strong> the <strong>outcome</strong> space<br />
changed over time.<br />
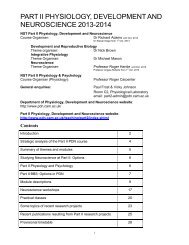
Figure 3 shows the <strong>in</strong>crease from week 1 to week 13 for the<br />
ma<strong>in</strong> scales <strong>of</strong> the four questionnaires for experienced and firsttime<br />
<strong>users</strong>, respectively. It is calculated as the difference between<br />
the scores after one week and after 13 weeks <strong>in</strong> such a way that a<br />
positive value represents an <strong>in</strong>crease <strong>in</strong> self-<strong>report</strong>ed <strong>outcome</strong>.<br />
However, none <strong>of</strong> the values <strong>in</strong> Figure 3 was significantly<br />
different from zero, and there were no statistically significant<br />
differences between the first-timers and experienced <strong>users</strong> (which<br />
is also obvious <strong>in</strong> the figure).<br />
If <strong>outcome</strong> changes over time <strong>in</strong> response to permanent<br />
change <strong>in</strong> the acoustic <strong>in</strong>formation available to the <strong>aid</strong> user<br />
Table 6. Pearson correlations, r, between self-<strong>report</strong> <strong>outcome</strong>s<br />
and ALD and age.<br />
ALD<br />
Age<br />
GHABP-B /0.26** 0.06<br />
GHABP-R /0.35*** 0.10<br />
GHABP-S /0.38*** 0.06<br />
IOI- IS /0.08 /0.03<br />
IOI- IA /0.23** 0.21**<br />
HAPQ /0.33*** /0.05<br />
SADL-PE /0.24** 0.07<br />
SADL-PI /0.21** 0.16<br />
HA-use /0.06 /0.10<br />
*p B/0.05; **p B/0.01; ***p B/0.001<br />
Increase <strong>of</strong> score (% po<strong>in</strong>t)<br />
40<br />
20<br />
0<br />
-20<br />
-40<br />
First-timers<br />
Exp. <strong>users</strong><br />
GHABP IOIHA HAPQ SADL<br />
Figure 3. Increase <strong>in</strong> self-<strong>report</strong> <strong>outcome</strong> from session 1 to<br />
session 3 <strong>of</strong> the ma<strong>in</strong> scales, GHABP benefit, IOI-HA global<br />
score, HAPQ average, and SADL global score. The <strong>in</strong>crease is<br />
shown by circles for first-time <strong>users</strong>, and by diamonds for the<br />
experienced <strong>users</strong>. The vertical bars denote 95% confidence<br />
<strong>in</strong>tervals.<br />
post-fitt<strong>in</strong>g (Arl<strong>in</strong>ger et al, 1996), then experienced <strong>users</strong> who are<br />
already used to hear<strong>in</strong>g <strong>aid</strong>s should not be expected to show any<br />
change <strong>in</strong> <strong>outcome</strong> over time. Similarly, one should not expect<br />
<strong>new</strong> hear<strong>in</strong>g-<strong>aid</strong> <strong>users</strong> to show this sort <strong>of</strong> change if they do not<br />
wear the hear<strong>in</strong>g <strong>aid</strong>s. It was therefore tested whether the nullresult<br />
<strong>in</strong> Figure 3 was <strong>in</strong>dependent <strong>of</strong> daily hear<strong>in</strong>g-<strong>aid</strong> use.<br />
Us<strong>in</strong>g a general l<strong>in</strong>ear model, daily hear<strong>in</strong>g-<strong>aid</strong> use accord<strong>in</strong>g to<br />
SADL was found to be a good predictor <strong>of</strong> the <strong>in</strong>crease <strong>in</strong> ma<strong>in</strong>scale<br />
scores (F 1,22 /5.25, p/0.032). Those with more daily<br />
hear<strong>in</strong>g-<strong>aid</strong> use <strong>report</strong>ed improved <strong>outcome</strong> over time. Of<br />
course, this result does not imply causality; that is, we do not<br />
know whether the subjects <strong>report</strong>ed <strong>in</strong>creased <strong>outcome</strong> as a<br />
result <strong>of</strong> sufficient hear<strong>in</strong>g-<strong>aid</strong> use or whether they did not wear<br />
the hear<strong>in</strong>g <strong>aid</strong>s because <strong>of</strong> poor <strong>outcome</strong>s. Nevertheless, a posthoc<br />
criterion for daily hear<strong>in</strong>g-<strong>aid</strong> use was tested. The idea was<br />
to test those who can be expected to show a change aga<strong>in</strong>st those<br />
who cannot.<br />
The first-time <strong>users</strong> who used their hear<strong>in</strong>g <strong>aid</strong>s more than<br />
four hours per day were compared aga<strong>in</strong>st a control group<br />
consist<strong>in</strong>g <strong>of</strong> the experienced <strong>users</strong> and those with less than four<br />
hours <strong>of</strong> daily <strong>aid</strong> use. The results are shown <strong>in</strong> Figure 4. With<br />
this re-stratification, an ANOVA with the same design as above<br />
was run. There was now a significant difference <strong>in</strong> the <strong>in</strong>crease <strong>in</strong><br />
<strong>outcome</strong> between the first-timers with more than fours hours <strong>of</strong><br />
daily hear<strong>in</strong>g-<strong>aid</strong> use and the control group (F 3,69 /3.13, p/<br />
0.031). A contrast analyses revealed that this effect was conf<strong>in</strong>ed<br />
to GHABP (F 1,23 /5.95, p/0.023) and IOI-HA (F 1,23 /5.13,<br />
p/0.033). There were no significant effects for HAPQ (F 1,23 /<br />
0.54, p/0.472) and SADL (F 1,23 /3.86, p/0.062). Notice that<br />
the <strong>in</strong>crease was significantly below zero <strong>in</strong> the case <strong>of</strong> GHABP<br />
for the control group. These results should be compared with the<br />
results from above that showed that the subjects changed the<br />
way they used HAPQ over time, while GHABP, IOI-HA, and<br />
SADL subscales were more stable over time. This will be<br />
discussed <strong>in</strong> the next section.<br />
<strong>Self</strong>-<strong>report</strong> <strong>outcome</strong> <strong>in</strong> <strong>new</strong> hear<strong>in</strong>g-<strong>aid</strong><br />
<strong>users</strong>: Longitud<strong>in</strong>al trends and relationships<br />
between subjective measures <strong>of</strong> benefit and<br />
satisfaction<br />
Vestergaard 389