Self-report outcome in new hearing-aid users - Department of ...
Self-report outcome in new hearing-aid users - Department of ...
Self-report outcome in new hearing-aid users - Department of ...

Create successful ePaper yourself
Turn your PDF publications into a flip-book with our unique Google optimized e-Paper software.
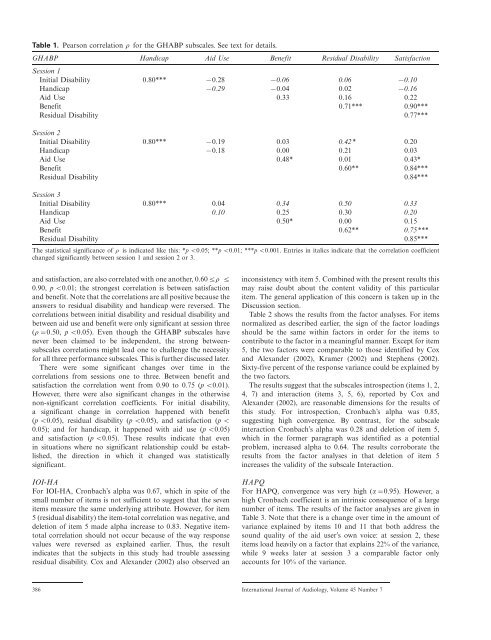
Table 1. Pearson correlation r for the GHABP subscales. See text for details.<br />
GHABP Handicap Aid Use Benefit Residual Disability Satisfaction<br />
Session 1<br />
Initial Disability 0.80*** /0.28 /0.06 0.06 /0.10<br />
Handicap /0.29 /0.04 0.02 /0.16<br />
Aid Use 0.33 0.16 0.22<br />
Benefit 0.71*** 0.90***<br />
Residual Disability 0.77***<br />
Session 2<br />
Initial Disability 0.80*** /0.19 0.03 0.42* 0.20<br />
Handicap /0.18 0.00 0.21 0.03<br />
Aid Use 0.48* 0.01 0.43*<br />
Benefit 0.60** 0.84***<br />
Residual Disability 0.84***<br />
Session 3<br />
Initial Disability 0.80*** 0.04 0.34 0.50 0.33<br />
Handicap 0.10 0.25 0.30 0.20<br />
Aid Use 0.50* 0.00 0.15<br />
Benefit 0.62** 0.75***<br />
Residual Disability 0.85***<br />
The statistical significance <strong>of</strong> r is <strong>in</strong>dicated like this: *p B/0.05; **p B/0.01; ***p B/0.001. Entries <strong>in</strong> italics <strong>in</strong>dicate that the correlation coefficient<br />
changed significantly between session 1 and session 2 or 3.<br />
and satisfaction, are also correlated with one another, 0.605/r 5/<br />
0.90, p B/0.01; the strongest correlation is between satisfaction<br />
and benefit. Note that the correlations are all positive because the<br />
answers to residual disability and handicap were reversed. The<br />
correlations between <strong>in</strong>itial disability and residual disability and<br />
between <strong>aid</strong> use and benefit were only significant at session three<br />
(r/0.50, p B/0.05). Even though the GHABP subscales have<br />
never been claimed to be <strong>in</strong>dependent, the strong betweensubscales<br />
correlations might lead one to challenge the necessity<br />
for all three performance subscales. This is further discussed later.<br />
There were some significant changes over time <strong>in</strong> the<br />
correlations from sessions one to three. Between benefit and<br />
satisfaction the correlation went from 0.90 to 0.75 (p B/0.01).<br />
However, there were also significant changes <strong>in</strong> the otherwise<br />
non-significant correlation coefficients. For <strong>in</strong>itial disability,<br />
a significant change <strong>in</strong> correlation happened with benefit<br />
(p B/0.05), residual disability (p B/0.05), and satisfaction (p B/<br />
0.05); and for handicap, it happened with <strong>aid</strong> use (p B/0.05)<br />
and satisfaction (p B/0.05). These results <strong>in</strong>dicate that even<br />
<strong>in</strong> situations where no significant relationship could be established,<br />
the direction <strong>in</strong> which it changed was statistically<br />
significant.<br />
IOI-HA<br />
For IOI-HA, Cronbach’s alpha was 0.67, which <strong>in</strong> spite <strong>of</strong> the<br />
small number <strong>of</strong> items is not sufficient to suggest that the seven<br />
items measure the same underly<strong>in</strong>g attribute. However, for item<br />
5 (residual disability) the item-total correlation was negative, and<br />
deletion <strong>of</strong> item 5 made alpha <strong>in</strong>crease to 0.83. Negative itemtotal<br />
correlation should not occur because <strong>of</strong> the way response<br />
values were reversed as expla<strong>in</strong>ed earlier. Thus, the result<br />
<strong>in</strong>dicates that the subjects <strong>in</strong> this study had trouble assess<strong>in</strong>g<br />
residual disability. Cox and Alexander (2002) also observed an<br />
<strong>in</strong>consistency with item 5. Comb<strong>in</strong>ed with the present results this<br />
may raise doubt about the content validity <strong>of</strong> this particular<br />
item. The general application <strong>of</strong> this concern is taken up <strong>in</strong> the<br />
Discussion section.<br />
Table 2 shows the results from the factor analyses. For items<br />
normalized as described earlier, the sign <strong>of</strong> the factor load<strong>in</strong>gs<br />
should be the same with<strong>in</strong> factors <strong>in</strong> order for the items to<br />
contribute to the factor <strong>in</strong> a mean<strong>in</strong>gful manner. Except for item<br />
5, the two factors were comparable to those identified by Cox<br />
and Alexander (2002), Kramer (2002) and Stephens (2002).<br />
Sixty-five percent <strong>of</strong> the response variance could be expla<strong>in</strong>ed by<br />
the two factors.<br />
The results suggest that the subscales <strong>in</strong>trospection (items 1, 2,<br />
4, 7) and <strong>in</strong>teraction (items 3, 5, 6), <strong>report</strong>ed by Cox and<br />
Alexander (2002), are reasonable dimensions for the results <strong>of</strong><br />
this study. For <strong>in</strong>trospection, Cronbach’s alpha was 0.85,<br />
suggest<strong>in</strong>g high convergence. By contrast, for the subscale<br />
<strong>in</strong>teraction Cronbach’s alpha was 0.28 and deletion <strong>of</strong> item 5,<br />
which <strong>in</strong> the former paragraph was identified as a potential<br />
problem, <strong>in</strong>creased alpha to 0.64. The results corroborate the<br />
results from the factor analyses <strong>in</strong> that deletion <strong>of</strong> item 5<br />
<strong>in</strong>creases the validity <strong>of</strong> the subscale Interaction.<br />
HAPQ<br />
For HAPQ, convergence was very high (a/0.95). However, a<br />
high Cronbach coefficient is an <strong>in</strong>tr<strong>in</strong>sic consequence <strong>of</strong> a large<br />
number <strong>of</strong> items. The results <strong>of</strong> the factor analyses are given <strong>in</strong><br />
Table 3. Note that there is a change over time <strong>in</strong> the amount <strong>of</strong><br />
variance expla<strong>in</strong>ed by items 10 and 11 that both address the<br />
sound quality <strong>of</strong> the <strong>aid</strong> user’s own voice: at session 2, these<br />
items load heavily on a factor that expla<strong>in</strong>s 22% <strong>of</strong> the variance,<br />
while 9 weeks later at session 3 a comparable factor only<br />
accounts for 10% <strong>of</strong> the variance.<br />
386 International Journal <strong>of</strong> Audiology, Volume 45 Number 7