Download PDF - pcaarrd - Department of Science and Technology
Download PDF - pcaarrd - Department of Science and Technology
Download PDF - pcaarrd - Department of Science and Technology

You also want an ePaper? Increase the reach of your titles
YUMPU automatically turns print PDFs into web optimized ePapers that Google loves.
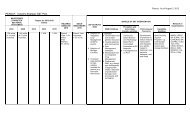
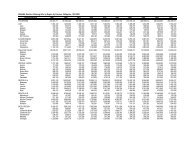
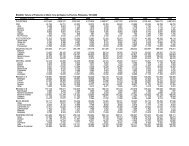
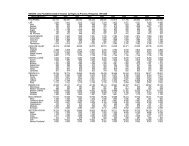
Table 2. Quantity <strong>and</strong> value <strong>of</strong> Philippine fruit exports, 1994–1998. a<br />
Growth<br />
% Share Rate %/yr<br />
1994 1995 1996 1997 1998 1994–98 1994–98<br />
A. Quantity t<br />
Banana, fresh/chips 1,170,658 1,231,182 1,270,573 1,162,429 1,164,072 69.98 0<br />
Pineapple, all forms 459,711 448,465 439,235 410,834 371,116 24.84 -5.16<br />
Mango, all forms 35,985 51,396 46,313 54,574 56,966 2.86 13.79<br />
Papaya, fresh/dried 3,832 2,719 1,688 694 230 0.11 -48.18<br />
Others, all forms 31,744 36,451 32,999 43,954 38,016 2.21 5.24<br />
Total 1,701,930 1,770,213 1,790,808 1,672,485 1,630,400 100.00 -0.98<br />
B. Value 1,000 US$ FOB<br />
Banana, fresh/chips 231,321 244,247 258,533 240,434 235,791 51.82 0.33<br />
Pineapple, all forms 145,592 140,320 156,570 149,798 178,657 31.73 0.33<br />
Mango, all forms 40,895 556,345 51,068 53,128 51,347 10.79 4.49<br />
Papaya, fresh/dried 1,392 1,283 835 587 339 0.19 -4,439.00<br />
Others, all forms 20,146 23,098 26,422 30,527 27,432 5.47 8.61<br />
Total 439,346 965,293 493,428 474,474 493,566 100.00 1.45<br />
Annual Average<br />
573M<br />
a BAS 1999.<br />
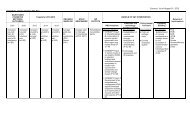
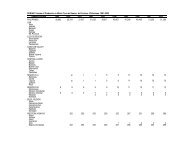
Table 3.<br />
Harvest area, value, <strong>and</strong> volume <strong>of</strong> production <strong>of</strong> selected fruits in the Philippines,<br />
1993 <strong>and</strong> 1997.<br />
1993 <strong>and</strong> 1997<br />
1993 % 1997 % Average %<br />
Harvest Area ( ‘000 ha)<br />
All Crops 12,549 13,025 12,790<br />
Fruits 815 6.49 877 6.73 846 6.59<br />
Banana 326 2.60 338 2.60 328 2.57<br />
Mango 61 0.49 92 0.71 77 0.61<br />
Pineapple 43 0.34 40 0.31 43 0.34<br />
Papaya 6 0.05 6 0.05 5 0.04<br />
Citrus 29 0.23 31 0.24 31 0.24<br />
Durian 4 0.03 4 0.03 4 0.03<br />
Other fruits 346 2.76 366 2.81 281 2.78<br />
Production Value (million P)<br />
All Crops 177,472 276,826 230,807<br />
Fruits 36,465 20.55 58,925 21.29 19.9<br />
Banana 10,564 5.95 14,921 5.39 12,693 5.55<br />
Mango 6,716 3.78 10,554 3.81 9,556 4.15<br />
Pineapple 5,394 3.04 11,090 4.01 6,957 2.98<br />
Papaya 289 0.16 255 0.09 280 0.12<br />
Citrus 1,561 0.88 1,745 0.63 1,697 0.75<br />
Durian 739 0.42 885 0.32 840 0.38<br />
Other fruits 11,202 6.31 19,475 7.04 13,873 5.96<br />
6 ............................................................................................................. R&D Status <strong>and</strong> Directions