

PBL rapport 550026002 Calibration and validation of the land use ...
PBL rapport 550026002 Calibration and validation of the land use ...
PBL rapport 550026002 Calibration and validation of the land use ...

You also want an ePaper? Increase the reach of your titles
YUMPU automatically turns print PDFs into web optimized ePapers that Google loves.
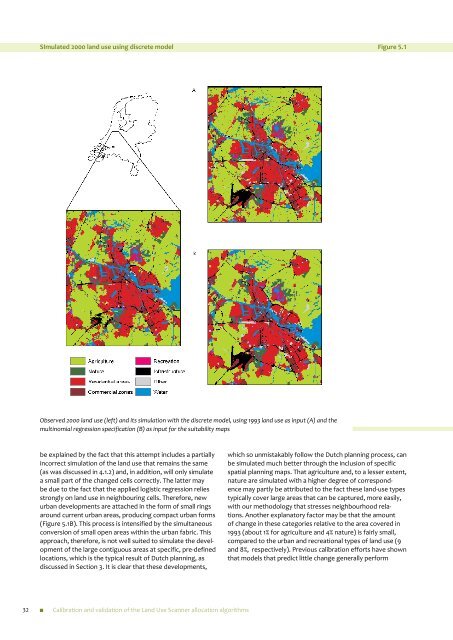
SImulated 2000 l<strong>and</strong> <strong>use</strong> using discrete model<br />
Figure 5.1<br />
Observed 2000 l<strong>and</strong> <strong>use</strong> (left) <strong>and</strong> its simulation with <strong>the</strong> discrete model, using 1993 l<strong>and</strong> <strong>use</strong> as input (A) <strong>and</strong> <strong>the</strong><br />
multinomial regression specification (B) as input for <strong>the</strong> suitability maps<br />
be explained by <strong>the</strong> fact that this attempt includes a partially<br />
incorrect simulation <strong>of</strong> <strong>the</strong> l<strong>and</strong> <strong>use</strong> that remains <strong>the</strong> same<br />
(as was discussed in 4.1.2) <strong>and</strong>, in addition, will only simulate<br />
a small part <strong>of</strong> <strong>the</strong> changed cells correctly. The latter may<br />
be due to <strong>the</strong> fact that <strong>the</strong> applied logistic regression relies<br />
strongly on l<strong>and</strong> <strong>use</strong> in neighbouring cells. Therefore, new<br />
urban developments are attached in <strong>the</strong> form <strong>of</strong> small rings<br />
around current urban areas, producing compact urban forms<br />
(Figure 5.1B). This process is intensified by <strong>the</strong> simultaneous<br />
conversion <strong>of</strong> small open areas within <strong>the</strong> urban fabric. This<br />
approach, <strong>the</strong>refore, is not well suited to simulate <strong>the</strong> development<br />
<strong>of</strong> <strong>the</strong> large contiguous areas at specific, pre-defined<br />
locations, which is <strong>the</strong> typical result <strong>of</strong> Dutch planning, as<br />
discussed in Section 3. It is clear that <strong>the</strong>se developments,<br />
which so unmistakably follow <strong>the</strong> Dutch planning process, can<br />
be simulated much better through <strong>the</strong> inclusion <strong>of</strong> specific<br />
spatial planning maps. That agriculture <strong>and</strong>, to a lesser extent,<br />
nature are simulated with a higher degree <strong>of</strong> correspondence<br />
may partly be attributed to <strong>the</strong> fact <strong>the</strong>se l<strong>and</strong>-<strong>use</strong> types<br />
typically cover large areas that can be captured, more easily,<br />
with our methodology that stresses neighbourhood relations.<br />
Ano<strong>the</strong>r explanatory factor may be that <strong>the</strong> amount<br />
<strong>of</strong> change in <strong>the</strong>se categories relative to <strong>the</strong> area covered in<br />
1993 (about 1% for agriculture <strong>and</strong> 4% nature) is fairly small,<br />
compared to <strong>the</strong> urban <strong>and</strong> recreational types <strong>of</strong> l<strong>and</strong> <strong>use</strong> (9<br />
<strong>and</strong> 8%, respectively). Previous calibration efforts have shown<br />
that models that predict little change generally perform<br />
32<br />
<strong>Calibration</strong> <strong>and</strong> <strong>validation</strong> <strong>of</strong> <strong>the</strong> L<strong>and</strong> Use Scanner allocation algorithms


