

PBL rapport 550026002 Calibration and validation of the land use ...
PBL rapport 550026002 Calibration and validation of the land use ...
PBL rapport 550026002 Calibration and validation of the land use ...

Create successful ePaper yourself
Turn your PDF publications into a flip-book with our unique Google optimized e-Paper software.
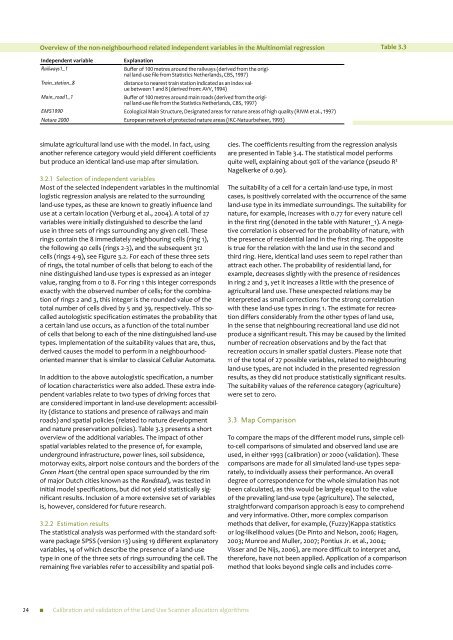
Overview <strong>of</strong> <strong>the</strong> non-neighbourhood related independent variables in <strong>the</strong> Multinomial regression<br />
Table 3.3<br />
Independent variable<br />
Railways1_1<br />
Explanation<br />
Buffer <strong>of</strong> 100 metres around <strong>the</strong> railways (derived from <strong>the</strong> original<br />
l<strong>and</strong>-<strong>use</strong> file from Statistics Ne<strong>the</strong>rl<strong>and</strong>s, CBS, 1997)<br />
Train_station_8<br />
distance to nearest train station indicated as an index value<br />
between 1 <strong>and</strong> 8 (derived from: AVV, 1994)<br />
Main_road1_1<br />
Buffer <strong>of</strong> 100 metres around main roads (derived from <strong>the</strong> original<br />
l<strong>and</strong>-<strong>use</strong> file from <strong>the</strong> Statistics Ne<strong>the</strong>rl<strong>and</strong>s, CBS, 1997)<br />
EMS1990 Ecological Main Structure, Designated areas for nature areas <strong>of</strong> high quality (RIVM et al., 1997)<br />
Natura 2000 European network <strong>of</strong> protected nature areas (IKC-Natuurbeheer, 1993)<br />
simulate agricultural l<strong>and</strong> <strong>use</strong> with <strong>the</strong> model. In fact, using<br />
ano<strong>the</strong>r reference category would yield different coefficients<br />
but produce an identical l<strong>and</strong>-<strong>use</strong> map after simulation.<br />
3.2.1 Selection <strong>of</strong> independent variables<br />
Most <strong>of</strong> <strong>the</strong> selected independent variables in <strong>the</strong> multinomial<br />
logistic regression analysis are related to <strong>the</strong> surrounding<br />
l<strong>and</strong>-<strong>use</strong> types, as <strong>the</strong>se are known to greatly influence l<strong>and</strong><br />
<strong>use</strong> at a certain location (Verburg et al., 2004). A total <strong>of</strong> 27<br />
variables were initially distinguished to describe <strong>the</strong> l<strong>and</strong><br />
<strong>use</strong> in three sets <strong>of</strong> rings surrounding any given cell. These<br />
rings contain <strong>the</strong> 8 immediately neighbouring cells (ring 1),<br />
<strong>the</strong> following 40 cells (rings 2-3), <strong>and</strong> <strong>the</strong> subsequent 312<br />
cells (rings 4-9), see Figure 3.2. For each <strong>of</strong> <strong>the</strong>se three sets<br />
<strong>of</strong> rings, <strong>the</strong> total number <strong>of</strong> cells that belong to each <strong>of</strong> <strong>the</strong><br />
nine distinguished l<strong>and</strong>-<strong>use</strong> types is expressed as an integer<br />
value, ranging from 0 to 8. For ring 1 this integer corresponds<br />
exactly with <strong>the</strong> observed number <strong>of</strong> cells; for <strong>the</strong> combination<br />
<strong>of</strong> rings 2 <strong>and</strong> 3, this integer is <strong>the</strong> rounded value <strong>of</strong> <strong>the</strong><br />
total number <strong>of</strong> cells dived by 5 <strong>and</strong> 39, respectively. This socalled<br />
autologistic specification estimates <strong>the</strong> probability that<br />
a certain l<strong>and</strong> <strong>use</strong> occurs, as a function <strong>of</strong> <strong>the</strong> total number<br />
<strong>of</strong> cells that belong to each <strong>of</strong> <strong>the</strong> nine distinguished l<strong>and</strong>-<strong>use</strong><br />
types. Implementation <strong>of</strong> <strong>the</strong> suitability values that are, thus,<br />
derived ca<strong>use</strong>s <strong>the</strong> model to perform in a neighbourhoodoriented<br />
manner that is similar to classical Cellular Automata.<br />
In addition to <strong>the</strong> above autologistic specification, a number<br />
<strong>of</strong> location characteristics were also added. These extra independent<br />
variables relate to two types <strong>of</strong> driving forces that<br />
are considered important in l<strong>and</strong>-<strong>use</strong> development: accessibility<br />
(distance to stations <strong>and</strong> presence <strong>of</strong> railways <strong>and</strong> main<br />
roads) <strong>and</strong> spatial policies (related to nature development<br />
<strong>and</strong> nature preservation policies). Table 3.3 presents a short<br />
overview <strong>of</strong> <strong>the</strong> additional variables. The impact <strong>of</strong> o<strong>the</strong>r<br />
spatial variables related to <strong>the</strong> presence <strong>of</strong>, for example,<br />
underground infrastructure, power lines, soil subsidence,<br />
motorway exits, airport noise contours <strong>and</strong> <strong>the</strong> borders <strong>of</strong> <strong>the</strong><br />
Green Heart (<strong>the</strong> central open space surrounded by <strong>the</strong> rim<br />
<strong>of</strong> major Dutch cities known as <strong>the</strong> R<strong>and</strong>stad), was tested in<br />
initial model specifications, but did not yield statistically significant<br />
results. Inclusion <strong>of</strong> a more extensive set <strong>of</strong> variables<br />
is, however, considered for future research.<br />
3.2.2 Estimation results<br />
The statistical analysis was performed with <strong>the</strong> st<strong>and</strong>ard s<strong>of</strong>tware<br />
package SPSS (version 13) using 19 different explanatory<br />
variables, 14 <strong>of</strong> which describe <strong>the</strong> presence <strong>of</strong> a l<strong>and</strong>-<strong>use</strong><br />
type in one <strong>of</strong> <strong>the</strong> three sets <strong>of</strong> rings surrounding <strong>the</strong> cell. The<br />
remaining five variables refer to accessibility <strong>and</strong> spatial policies.<br />
The coefficients resulting from <strong>the</strong> regression analysis<br />
are presented in Table 3.4. The statistical model performs<br />
quite well, explaining about 90% <strong>of</strong> <strong>the</strong> variance (pseudo R 2<br />
Nagelkerke <strong>of</strong> 0.90).<br />
The suitability <strong>of</strong> a cell for a certain l<strong>and</strong>-<strong>use</strong> type, in most<br />
cases, is positively correlated with <strong>the</strong> occurrence <strong>of</strong> <strong>the</strong> same<br />
l<strong>and</strong>-<strong>use</strong> type in its immediate surroundings. The suitability for<br />
nature, for example, increases with 0.77 for every nature cell<br />
in <strong>the</strong> first ring (denoted in <strong>the</strong> table with Nature1_1). A negative<br />
correlation is observed for <strong>the</strong> probability <strong>of</strong> nature, with<br />
<strong>the</strong> presence <strong>of</strong> residential l<strong>and</strong> in <strong>the</strong> first ring. The opposite<br />
is true for <strong>the</strong> relation with <strong>the</strong> l<strong>and</strong> <strong>use</strong> in <strong>the</strong> second <strong>and</strong><br />
third ring. Here, identical l<strong>and</strong> <strong>use</strong>s seem to repel ra<strong>the</strong>r than<br />
attract each o<strong>the</strong>r. The probability <strong>of</strong> residential l<strong>and</strong>, for<br />
example, decreases slightly with <strong>the</strong> presence <strong>of</strong> residences<br />
in ring 2 <strong>and</strong> 3, yet it increases a little with <strong>the</strong> presence <strong>of</strong><br />
agricultural l<strong>and</strong> <strong>use</strong>. These unexpected relations may be<br />
interpreted as small corrections for <strong>the</strong> strong correlation<br />
with <strong>the</strong>se l<strong>and</strong>-<strong>use</strong> types in ring 1. The estimate for recreation<br />
differs considerably from <strong>the</strong> o<strong>the</strong>r types <strong>of</strong> l<strong>and</strong> <strong>use</strong>,<br />
in <strong>the</strong> sense that neighbouring recreational l<strong>and</strong> <strong>use</strong> did not<br />
produce a significant result. This may be ca<strong>use</strong>d by <strong>the</strong> limited<br />
number <strong>of</strong> recreation observations <strong>and</strong> by <strong>the</strong> fact that<br />
recreation occurs in smaller spatial clusters. Please note that<br />
11 <strong>of</strong> <strong>the</strong> total <strong>of</strong> 27 possible variables, related to neighbouring<br />
l<strong>and</strong>-<strong>use</strong> types, are not included in <strong>the</strong> presented regression<br />
results, as <strong>the</strong>y did not produce statistically significant results.<br />
The suitability values <strong>of</strong> <strong>the</strong> reference category (agriculture)<br />
were set to zero.<br />
3.3<br />
Map Comparison<br />
To compare <strong>the</strong> maps <strong>of</strong> <strong>the</strong> different model runs, simple cellto-cell<br />
comparisons <strong>of</strong> simulated <strong>and</strong> observed l<strong>and</strong> <strong>use</strong> are<br />
<strong>use</strong>d, in ei<strong>the</strong>r 1993 (calibration) or 2000 (<strong>validation</strong>). These<br />
comparisons are made for all simulated l<strong>and</strong>-<strong>use</strong> types separately,<br />
to individually assess <strong>the</strong>ir performance. An overall<br />
degree <strong>of</strong> correspondence for <strong>the</strong> whole simulation has not<br />
been calculated, as this would be largely equal to <strong>the</strong> value<br />
<strong>of</strong> <strong>the</strong> prevailing l<strong>and</strong>-<strong>use</strong> type (agriculture). The selected,<br />
straightforward comparison approach is easy to comprehend<br />
<strong>and</strong> very informative. O<strong>the</strong>r, more complex comparison<br />
methods that deliver, for example, (Fuzzy)Kappa statistics<br />
or log-likelihood values (De Pinto <strong>and</strong> Nelson, 2006; Hagen,<br />
2003; Munroe <strong>and</strong> Muller, 2007; Pontius Jr. et al., 2004;<br />
Visser <strong>and</strong> De Nijs, 2006), are more difficult to interpret <strong>and</strong>,<br />
<strong>the</strong>refore, have not been applied. Application <strong>of</strong> a comparison<br />
method that looks beyond single cells <strong>and</strong> includes corre-<br />
24<br />
<strong>Calibration</strong> <strong>and</strong> <strong>validation</strong> <strong>of</strong> <strong>the</strong> L<strong>and</strong> Use Scanner allocation algorithms


