

RIVM report xxxxxx xxx
RIVM report xxxxxx xxx
RIVM report xxxxxx xxx

You also want an ePaper? Increase the reach of your titles
YUMPU automatically turns print PDFs into web optimized ePapers that Google loves.
<strong>RIVM</strong> <strong>report</strong> 773301 001 / NRP <strong>report</strong> 410200 051 page 111 of 142<br />
$SSHQGL[&RQVWUXFWLRQRIWKHWRWDOXUEDQDQGUXUDO<br />
KXPDQSRSXODWLRQPDSVLQ('*$5<br />
$6HOHFWLRQRIWRWDOSRSXODWLRQPDS<br />
At present, several gridded population map are publicly available, such as the 1 o x1 o maps from<br />
Harvard/Logan (Logan, 1993, pers. comm.), NASA-GISS (www.giss.nasa.gov/data/landuse/people<br />
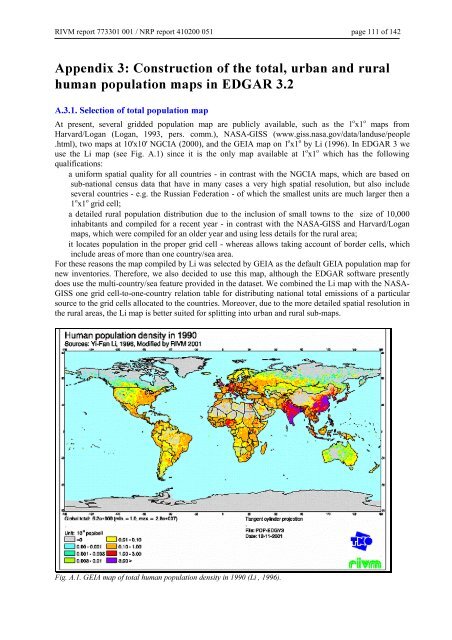
.html), two maps at 10'x10' NGCIA (2000), and the GEIA map on 1 o x1 o by Li (1996). In EDGAR 3 we<br />
use the Li map (see Fig. A.1) since it is the only map available at 1 o x1 o which has the following<br />
qualifications:<br />
ú a uniform spatial quality for all countries - in contrast with the NGCIA maps, which are based on<br />
sub-national census data that have in many cases a very high spatial resolution, but also include<br />
several countries - e.g. the Russian Federation - of which the smallest units are much larger then a<br />
1 o x1 o grid cell;<br />
ú a detailed rural population distribution due to the inclusion of small towns to the size of 10,000<br />
inhabitants and compiled for a recent year - in contrast with the NASA-GISS and Harvard/Logan<br />
ú<br />
maps, which were compiled for an older year and using less details for the rural area;<br />
it locates population in the proper grid cell - whereas allows taking account of border cells, which<br />
include areas of more than one country/sea area.<br />
For these reasons the map compiled by Li was selected by GEIA as the default GEIA population map for<br />
new inventories. Therefore, we also decided to use this map, although the EDGAR software presently<br />
does use the multi-country/sea feature provided in the dataset. We combined the Li map with the NASA-<br />
GISS one grid cell-to-one-country relation table for distributing national total emissions of a particular<br />
source to the grid cells allocated to the countries. Moreover, due to the more detailed spatial resolution in<br />
the rural areas, the Li map is better suited for splitting into urban and rural sub-maps.<br />
)LJ$*(,$PDSRIWRWDOKXPDQSRSXODWLRQGHQVLW\LQ/L


