Zoological Parks Authority - Parliament of Western Australia - The ...
Zoological Parks Authority - Parliament of Western Australia - The ...
Zoological Parks Authority - Parliament of Western Australia - The ...

Create successful ePaper yourself
Turn your PDF publications into a flip-book with our unique Google optimized e-Paper software.
<strong>Zoological</strong> <strong>Parks</strong> <strong>Authority</strong> ANNUAL REPORT 2012<br />
Disclosures and Legal Compliance<br />
Financial Statements<br />
<strong>Zoological</strong> <strong>Parks</strong> <strong>Authority</strong><br />
Notes to the Financial Statements for the Year Ended 30 June 2012 continued<br />
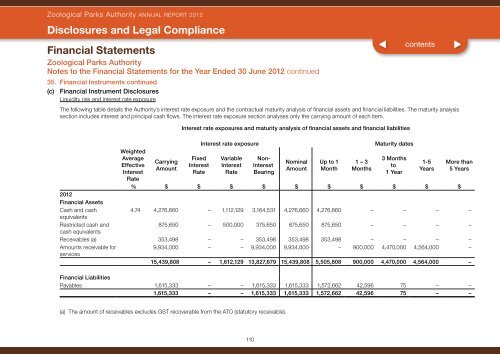
35. Financial Instruments continued<br />
(c) Financial Instrument Disclosures<br />
Liquidity risk and interest rate exposure<br />
<strong>The</strong> following table details the <strong>Authority</strong>’s interest rate exposure and the contractual maturity analysis <strong>of</strong> financial assets and financial liabilities. <strong>The</strong> maturity analysis<br />
section includes interest and principal cash flows. <strong>The</strong> interest rate exposure section analyses only the carrying amount <strong>of</strong> each item.<br />
Interest rate exposures and maturity analysis <strong>of</strong> financial assets and financial liabilities<br />
Weighted<br />
Average<br />
Effective<br />
Interest<br />
Rate<br />
Carrying<br />
Amount<br />
Fixed<br />
Interest<br />
Rate<br />
Interest rate exposure Maturity dates<br />
Variable<br />
Interest<br />
Rate<br />
Non-<br />
Interest<br />
Bearing<br />
Nominal<br />
Amount<br />
Up to 1<br />
Month<br />
1 – 3<br />
Months<br />
3 Months<br />
to<br />
1 Year<br />
1-5<br />
Years<br />
More than<br />
5 Years<br />
% $ $ $ $ $ $ $ $ $ $<br />
2012<br />
Financial Assets<br />
Cash and cash<br />
4.74 4,276,660 – 1,112,129 3,164,531 4,276,660 4,276,660 – – – –<br />
equivalents<br />
Restricted cash and<br />
875,650 – 500,000 375,650 875,650 875,650 – – – –<br />
cash equivalents<br />
Receivables (a) 353,498 – – 353,498 353,498 353,498 – – – –<br />
Amounts receivable for<br />
9,934,000 – – 9,934,000 9,934,000 – 900,000 4,470,000 4,564,000 –<br />
services<br />
15,439,808 – 1,612,129 13,827,679 15,439,808 5,505,808 900,000 4,470,000 4,564,000 –<br />
Financial Liabilities<br />
Payables 1,615,333 – – 1,615,333 1,615,333 1,572,662 42,596 75 – –<br />
1,615,333 – – 1,615,333 1,615,333 1,572,662 42,596 75 – –<br />
(a) <strong>The</strong> amount <strong>of</strong> receivables excludes GST recoverable from the ATO (statutory receivable).<br />
110