Broome Port Authority - Parliament of Western Australia
Broome Port Authority - Parliament of Western Australia
Broome Port Authority - Parliament of Western Australia

You also want an ePaper? Increase the reach of your titles
YUMPU automatically turns print PDFs into web optimized ePapers that Google loves.
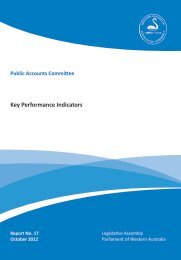
40<br />
35<br />
30<br />
25<br />
20<br />
15<br />
10<br />
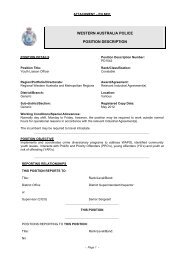
Expeditionary Cruise<br />
Vessels<br />
Cruise Liners<br />
5<br />
0<br />
2006/07 2007/08 2008/09 2009/10 2010/11<br />
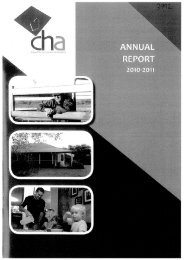
Figure 7 – Cruise vessel visits to <strong>Broome</strong> <strong>Port</strong> for the past 5 years<br />
Berth Occupancy (Berths 4-10)<br />
Figure 8 shows the monthly average berth occupancy (Berths 4-10) for the period July 2010 – June<br />
2011. The monthly average during this period was 30% down from 37% during 2009/10. The<br />
highest monthly average was 37% during November 2010.<br />
70<br />
60<br />
50<br />
%<br />
40<br />
30<br />
20<br />
31<br />
24<br />
27<br />
25<br />
37<br />
32 32 31<br />
27<br />
33 33<br />
22<br />
10<br />
0<br />
Jul‐10 Aug‐10 Sep‐10 Oct‐10 Nov‐10 Dec‐10 Jan‐11 Feb‐11 Mar‐11 Apr‐11 May‐11 Jun‐11<br />
Average Berth Occupancy (Left Axis)<br />
Linear (Average Berth Occupancy (Left Axis))<br />
Figure 8 – Berth Occupancy<br />
Vessel Turnaround Times<br />
Figure 9 shows monthly average vessel turnaround times for oil & gas supply vessels was 18 hours<br />
(19 hours in 2009/10). Maintenance <strong>of</strong> this port efficiency KPI leads to an increase in berth<br />
availability, which is required to counter the onset <strong>of</strong> port congestion due to recurrent peaking in<br />
wharf usage above 60%. There were no oil & gas supply vessels visiting from December 2010 –<br />
February 2011.<br />
Page 18 <strong>of</strong> 79