Broome Port Authority - Parliament of Western Australia
Broome Port Authority - Parliament of Western Australia
Broome Port Authority - Parliament of Western Australia

Create successful ePaper yourself
Turn your PDF publications into a flip-book with our unique Google optimized e-Paper software.
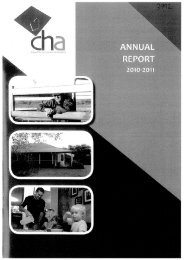
BROOME PORT AUTHORITY<br />
2011 ANNUAL<br />
REPORT
CONTENTS<br />
1. EXECUTIVE SUMMARY .............................................................................................................................................. 4<br />
2. CHAIRMAN’S REPORT ............................................................................................................................................... 5<br />
3. CEO’S REPORT ........................................................................................................................................................... 7<br />
4. AGENCY OVERVIEW .................................................................................................................................................. 9<br />
4.1. Agency Performance ........................................................................................................................................... 9<br />
4.2. Ministerial Directions .......................................................................................................................................... 10<br />
4.3. Governance ....................................................................................................................................................... 10<br />
4.4. Environmental Management .............................................................................................................................. 14<br />
4.5. Organisational Structure .................................................................................................................................... 15<br />
5. OPERATIONAL OVERVIEW ..................................................................................................................................... 17<br />
5.1. Operational Review and KPI’s ........................................................................................................................... 17<br />
5.2. Trade Statistics .................................................................................................................................................. 20<br />
5.3. Safety Review .................................................................................................................................................... 23<br />
6. DIRECTORS REPORT ............................................................................................................................................... 26<br />
6.1. Role <strong>of</strong> the Board ............................................................................................................................................... 26<br />
6.2. Directors’ Rights ................................................................................................................................................ 26<br />
6.3. Directors’ Details ................................................................................................................................................ 26<br />
6.4. Directors Meetings ............................................................................................................................................. 28<br />
6.5. Planned Achievements ...................................................................................................................................... 29<br />
6.6. Dividends ........................................................................................................................................................... 31<br />
6.7. Operating Results .............................................................................................................................................. 31<br />
6.8. Significant Changes in the State <strong>of</strong> Affairs ......................................................................................................... 32<br />
6.9. Strategy and Future Performance ...................................................................................................................... 33<br />
6.10. Events Subsequent to Reporting Date ............................................................................................................... 33<br />
6.11. Likely Developments .......................................................................................................................................... 33<br />
6.12. Directors Emoluments ........................................................................................................................................ 33<br />
6.13. Rounding Off ...................................................................................................................................................... 35<br />
7. STATEMENT OF COMPREHENSIVE INCOME FOR THE YEAR ENDED 30 JUNE 2011 ....................................... 36<br />
8. STATEMENT OF FINANCIAL POSITION AS AT 30 JUNE 2011 ............................................................................. 37<br />
9. STATEMENT OF CHANGES IN EQUITY FOR THE YEAR ENDED 30 JUNE 2011 ................................................. 38<br />
10. STATEMENT OF CASH FLOW FOR THE YEAR ENDED 30 JUNE 2011 ................................................................ 39<br />
11. FINANCE .................................................................................................................................................................... 40
CONTENTS<br />
TABLES<br />
Table 1 – Agency Performance 2010/2011 ....................................................................... 9<br />
Table 2 – Advertising Expenses 2010/2011 ...................................................................... 11<br />
Table 3 – Public Sector Management Act 1994 activities .................................................. 12<br />
Table 4 – Occupational Safety and Health Performance Indicators .................................. 24<br />
Table 5 – Meetings attended by Directors . ....................................................................... 28<br />
Table 6 – Director’s Emoluments 2011 ...... ....................................................................... 33<br />
Table 7 – Director’s Emoluments 2010 ...... ....................................................................... 34<br />
Table 8 – Executive Emoluments 2011 ..... ....................................................................... 34<br />
Table 9 – Executive Emoluments 2010 ..... .............................................................................. 35
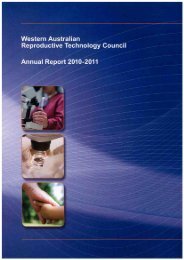
1. EXECUTIVE SUMMARY<br />
<strong>Broome</strong> <strong>Port</strong> is located on a sheltered peninsula halfway between the Pilbara <strong>Port</strong>s and <strong>Port</strong> <strong>of</strong><br />
Darwin (figure 1) and the depth alongside the wharf is naturally maintained by tidal flow at<br />
approximately 10 metres. The <strong>Port</strong> is linked to the main coastal highway by a modern logistics<br />
corridor (quad road train capable) that bypasses the town. Community infrastructure includes a<br />
modern hospital, a thriving tourism and hospitality industry, and a busy and well managed regional<br />
airport.<br />
Figure 1 – Strategic Location<br />
The <strong>Port</strong> is the logistical gateway for the Kimberley region and essential fuel supplies and<br />
construction materials are imported for regional distribution. The port is also an intermodal hub for<br />
onshore and <strong>of</strong>fshore projects and activities. In 2010 the <strong>Broome</strong> <strong>Port</strong> <strong>Authority</strong> was assigned a role<br />
in the compilation <strong>of</strong> the WA State Government’s Browse LNG Strategic Assessment, and this role<br />
has carried over into the planning work associated with Browse Project definitions.<br />
During the past year <strong>Broome</strong> <strong>Port</strong> <strong>Authority</strong> has complied with its mandate under the <strong>Port</strong><br />
Authorities Act 1999 (WA), namely to:<br />
a) Facilitate trade within and through the port and plan for future growth and development <strong>of</strong><br />
the port;<br />
b) Undertake or arrange for activities that will encourage and facilitate the development <strong>of</strong> trade<br />
and commerce generally for the economic benefit <strong>of</strong> the State through the use <strong>of</strong> the port<br />
and related facilities;<br />
c) Control business and other activities in the port or in connection with the operation <strong>of</strong> the<br />
port;<br />
d) Be responsible for the safe and efficient operation <strong>of</strong> the port;<br />
e) Be responsible for the maintenance and preservation <strong>of</strong> vested property and other property<br />
held by it; and<br />
f) Protect the environment <strong>of</strong> the port and minimise the impact <strong>of</strong> port activities on that<br />
environment.<br />
Page 4 <strong>of</strong> 79
2. CHAIRMAN’S REPORT<br />
Figure 2 – Chair<br />
Laurie Shervington<br />
I am pleased to advise that I was appointed to chair the <strong>Broome</strong> <strong>Port</strong><br />
<strong>Authority</strong> Board <strong>of</strong> Directors on 24th March 2011 and I look forward to<br />
continuing the fine work <strong>of</strong> my predecessor Dr. Ian Burston who well<br />
served this port for eight years, and the Board <strong>of</strong> Esperance <strong>Port</strong><br />
<strong>Authority</strong> for the prior decade. I also look forward to working with our<br />
Board members who capably represent the community interests.<br />
Recently, several <strong>of</strong> our Directors had their terms <strong>of</strong> <strong>of</strong>fice renewed<br />
which represents State Government satisfaction in the Board’s<br />
commitment to, and conduct <strong>of</strong> its corporate governance obligations.<br />
I join the Board at a time <strong>of</strong> prime opportunity for the region, when new business and employment<br />
opportunities might be provided to the community with the further exploration and development <strong>of</strong><br />
the <strong>of</strong>fshore Browse Basin, and from increased levels <strong>of</strong> general shipping. Further opportunities<br />
might arise from the inception <strong>of</strong> a multi-billion dollar greenfield port site at James Price Point for<br />
which <strong>Broome</strong> <strong>Port</strong> <strong>Authority</strong> expects to provide regulatory and oversight functions on behalf <strong>of</strong> the<br />
State Government.<br />
The new Minister for Transport the Hon. Troy Buswell has provided clarity and guidance in the State<br />
Government’s expectations <strong>of</strong> the Board. Accordingly, the Minister’s expectations were translated<br />
into clear strategic directions for management to grow and evolve our port’s capabilities and to<br />
develop the requisite financial and operational resources.<br />
In line with the Board’s commitment to the State Government’s transport, logistics and supply chain<br />
strategies, submissions were made to the high level planning documents WA <strong>Port</strong>s Review and the<br />
State Freight Strategy. Outcomes from these two reviews are likely to shape the <strong>Port</strong> <strong>Authority</strong>’s<br />
strategic deliberations for the coming decade. Accordingly, the Board aims to increase management<br />
capabilities and expertise by empowering managers to meet the operational and technical<br />
challenges flowing from an expanded <strong>Port</strong> <strong>Authority</strong> role and a potentially broader regional footprint.<br />
I was privileged to become a signatory to the historic agreement between the Goolarbooloo Jabir<br />
Jabir Traditional Owners, Woodside Energy Ltd. and the State Government on 30th June 2011. This<br />
State agreement will benefit Kimberley Traditional Owners through the provision <strong>of</strong> training,<br />
employment, and business opportunities plus increased societal and financial prospects. The <strong>Port</strong><br />
<strong>Authority</strong> Board has resultantly committed to engage and train a number <strong>of</strong> Indigenous personnel<br />
across its management and staff structure.<br />
During the year our Board and Management ensured compliance with the roles and functions<br />
required under the <strong>Port</strong> Authorities Act 1999 - inclusive <strong>of</strong> facilitating and supporting trade;<br />
maintaining high levels <strong>of</strong> governance and standards <strong>of</strong> commerce; safe, efficient and effective<br />
operations and conservancy; the maintenance and preservation <strong>of</strong> property; sound environmental<br />
management over land and water; plus a continued emphasis on maritime security. Significant effort<br />
was assigned to infrastructure maintenance and capital works, including the planning for further<br />
essential projects such as stormwater management, placing power services underground, safety<br />
audits and improvements, and hydrographic surveys.<br />
Page 5 <strong>of</strong> 79
Other works involved wharf repairs and maintenance, roadworks, the provision <strong>of</strong> improved workers’<br />
facilities, and the half-life refit <strong>of</strong> a 100-tonne crane.<br />
The preservation <strong>of</strong> a safe working system was aided by our highly motivated employee <strong>Port</strong> Safety<br />
Committee.<br />
A severe and unexpected decline in business operations occurred during the first half <strong>of</strong> FY2010-11<br />
as an outcome <strong>of</strong> reduced <strong>of</strong>fshore Browse Basin drilling operations following the Montara oil spill,<br />
and this decline was exacerbated by the Federal Government’s suspension <strong>of</strong> live cattle exports in<br />
2H 2010-11. The revenue derived from <strong>of</strong>fshore resources operations and cattle exports normally<br />
constitutes 65% <strong>of</strong> the <strong>Port</strong> <strong>of</strong> <strong>Broome</strong>’s annual income. Despite this unforeseen business downturn,<br />
a revised financial management plan resulted in only a minimal loss for the year. Our Chief<br />
Executive Officer and Managers are to be congratulated for their ability to quickly and successfully<br />
adapt to such changed and straitened financial and operational circumstances. I would also like to<br />
thank the members <strong>of</strong> the Board for their support and the hard work they have contributed to the<br />
business <strong>of</strong> the Board during the year.<br />
The next five years are expected to set the Board and all personnel <strong>of</strong> <strong>Broome</strong> <strong>Port</strong> <strong>Authority</strong> with<br />
many challenges and uncertainties, as well as opportunities for both personal and corporate growth.<br />
The <strong>Port</strong> <strong>Authority</strong> will endeavour to further grow its regional capabilities plus act as a catalyst for<br />
community employment and business opportunities. We thank all stakeholders and the community<br />
for their support and look forward to our ongoing relationships in the coming year.<br />
Page 6 <strong>of</strong> 79
3. CEO’S REPORT<br />
Figure 3 – CEO<br />
Capt Vic Justice<br />
During the past financial year <strong>Broome</strong> <strong>Port</strong> <strong>Authority</strong> overcame several<br />
major challenges, and the most formidable <strong>of</strong> these challenges was the<br />
business and financial impact <strong>of</strong> the federal government’s Montara Oil<br />
Spill Report and the resultant suspended authorisation processes for<br />
<strong>of</strong>fshore drilling approvals. The Browse Basin drilling downturn led to a<br />
17% unexpected reduction in the port’s shipping and logistics activities<br />
with a 15% decline in forecast shipping revenue. This business activities<br />
downturn was further exacerbated by <strong>Australia</strong>’s suspension <strong>of</strong> live<br />
cattle exp orts to Indonesia which began to affect cattle shipments from<br />
<strong>Broome</strong> at the close <strong>of</strong> the reporting period.<br />
Throughout the year a fundamental challenge successfully met by our management team was the<br />
expanded workload associated with assisting the State Government in the strategic planning<br />
aspects <strong>of</strong> Kimberley regional logistics development. Logistics planning and its societal and industry<br />
implications for the wider <strong>Western</strong> Kimberley region had little precedent and the resultant increased<br />
workload for senior port personnel was substantial. BrPA’s contributions to these planning<br />
processes are expected, in due course, to assist the State Government in providing regional<br />
benefits, including community training, employment, and business opportunities.<br />
From a management perspective the declining value <strong>of</strong> port revenues during the second half <strong>of</strong><br />
2010-11 required a comprehensive review <strong>of</strong> programmed essential works and an adjustment <strong>of</strong> the<br />
timelines for when planned objectives might be executed. Key objectives from within our strategic<br />
plans retained high priority. In particular, the important areas <strong>of</strong> safety, environmental protection and<br />
maintenance were afforded precedence within an amended operational budget, and essential works<br />
such as road repairs and crane maintenance were progressed. Another priority was to bring port<br />
and near-port land holdings to project ready status so that land rentals might eventually provide a<br />
steady source <strong>of</strong> predictable income.<br />
Funding was sourced from Treasury and Finance for much needed capital works at the wharf<br />
including items <strong>of</strong> safety and facility enhancement. Under deck maintenance continued with an<br />
emphasis on corrosion control works and refurbishment <strong>of</strong> structural sections. Other crucial work<br />
programs included refurbishment <strong>of</strong> pipeline systems and valves, and the provision <strong>of</strong> a new fire<br />
main to the slipway area and operations building.<br />
Despite a reduced availability <strong>of</strong> funds, the broad strategic directions and objectives for the year<br />
were achieved and in terms <strong>of</strong> productivity, the key performance indicators and overall<br />
organisational effectiveness measures set by our Board were met. <strong>Port</strong> effectiveness was further<br />
enhanced by the acquisition <strong>of</strong> a more powerful tug by the service provider company, and the<br />
primary 100-tonne crane was given a major half-life refit. Risk management and audit processes<br />
ensured that management tasks, overview and compliances met the relevant State Government<br />
standards.<br />
In response to the Board’s requirement for an emphasis on environmental matters, our<br />
management undertook a substantial revision <strong>of</strong> the Environmental Management Plan, and<br />
implemented further flora and fauna surveys, seawater sampling and testing, stormwater planning<br />
and management, and renewed our support <strong>of</strong> seagrass monitoring and blue-green algae studies<br />
Page 7 <strong>of</strong> 79
within the Roebuck Bay benthic zone. BrPA also provided training support to the newly appointed<br />
Indigenous rangers who will assist in the terrestrial and waterside management <strong>of</strong> the proposed<br />
Roebuck Bay Marine Park.<br />
Stakeholder surveys, communications, and presentations were delivered towards the <strong>Port</strong><br />
<strong>Authority</strong>’s objective <strong>of</strong> enhancing stakeholder support. The WA State Government is a key<br />
stakeholder (owner <strong>of</strong> the port) and early briefings on <strong>Port</strong> <strong>of</strong> <strong>Broome</strong> matters were provided to the<br />
Hon Troy Buswell MLA upon his appointment as Minister for Transport in December 2010. Other<br />
stakeholder relationships that were furthered throughout the year include those with port users,<br />
service entities and emergency response organisations, the community and community interest<br />
groups, the media, the wider port and shipping industry, and importantly, our own employees.<br />
BrPA contributed submissions to the WA <strong>Port</strong>s Review and the WA State Freight Strategy and<br />
subsequently worked with the Department for State Development in formulating plans towards<br />
implementing port management for the proposed James Price Point LNG production and export<br />
facility. These high level activities are the forerunner <strong>of</strong> a wider Kimberley ports management role<br />
that the State Government is considering within the WA <strong>Port</strong>s Review.<br />
We acknowledge the input <strong>of</strong> our stakeholders and workforce during the past year, and in particular<br />
for the support and assistance provided by Department <strong>of</strong> Transport managers in assisting us to<br />
formulate business cases towards the port’s growth and development.<br />
Significant activities planned for the coming year are aligned with increasing the value <strong>of</strong> the port<br />
authority to all <strong>of</strong> our stakeholders, enhancing our quality management processes, and in ensuring<br />
that stakeholder’s future needs are met. These activities include a substantially increased effort<br />
towards master plans in support <strong>of</strong> port growth and development, the programming and conduct <strong>of</strong><br />
capital works and maintenance (particularly for much-needed works upon the wharf infrastructure),<br />
placing overhead power lines underground, initiating project management for site works programs,<br />
developing a business case for eventual wharf replacement, sourcing funding towards a wider<br />
Kimberly port authority role, and expanding the training and accreditation program for our workforce.<br />
We continue to work with our peer groups <strong>Port</strong>s WA and <strong>Port</strong>s <strong>Australia</strong> to develop high level<br />
policies and planning instruments in support <strong>of</strong> state and national port objectives, operations and<br />
administration.<br />
In summary, the financial outcome for FY2010-11 was not at all what was planned, but the port<br />
authority adapted to major unexpected challenges plus an expanded workload, and managed to<br />
sustain all normal port processes without diminishing any operational capabilities. Our Minister and<br />
Board <strong>of</strong> Directors have provided clear strategic direction for the coming year during which <strong>Broome</strong><br />
<strong>Port</strong> <strong>Authority</strong> aims to provide higher levels <strong>of</strong> port management capability and services delivery.<br />
Page 8 <strong>of</strong> 79
4. AGENCY OVERVIEW<br />
4.1. Agency Performance<br />
Table 1 – Agency Performance 2010/2011<br />
FINANCIAL PERFORMANCE: Result ($000) % Change<br />
from FY09-10<br />
Total Revenue 13,173 (10)%<br />
Pr<strong>of</strong>it/Loss after Tax (106) (109)%<br />
Dividend to State Government 0 (100)%<br />
Capex 1,210 24%<br />
Total Assets 33,013 5%<br />
Key objectives achieved during the year as measured by an extensive stakeholder satisfaction<br />
survey included:<br />
a) Projects were implemented to increase the <strong>Port</strong> land holdings sufficient to meet customer<br />
requirements;<br />
b) Business cases were raised and financial planning was conducted towards future growth;<br />
c) A high level <strong>of</strong> services provision and informational flow were aimed towards maintaining<br />
stakeholders’ continued support; and<br />
d) A safe working environment was maintained for <strong>Port</strong> staff and stakeholders, including<br />
contractors and visiting ships and their crews.<br />
Business performance was constrained by the business and economic decline that affected the <strong>Port</strong><br />
during 2H 2010-11. Notwithstanding, the following activities were successfully accomplished:<br />
a) <strong>Port</strong>’s maritime industries were promoted and growth occurred in the areas <strong>of</strong> fuel tanker<br />
operations and general cargo shipping;<br />
b) Efficiently manage and improve all <strong>Port</strong> property;<br />
c) Improved customer service was provided to <strong>Port</strong> tenants, customers and the public;<br />
d) Sustainable Land Use Planning and land development practices were undertaken;<br />
e) Community and stakeholder relationships were addressed in order to enhance the public<br />
understanding and confidence in the <strong>Port</strong>;<br />
f) Sound and sustainable environmental management practices were applied to all<br />
transactions involving <strong>Port</strong> lands and waters; and<br />
g) Revenue flow and cash reserves were managed prudently so that the <strong>Port</strong> <strong>Authority</strong><br />
finances remained viable, and the organisation was able to adequately fund improvements,<br />
asset holdings, maintenance and maintain prudent cash reserves.<br />
Page 9 <strong>of</strong> 79
4.2. Ministerial Directions<br />
Nil.<br />
4.3. Governance<br />
The Disability Services Act 1993—Section 29<br />
<strong>Broome</strong> <strong>Port</strong> <strong>Authority</strong> is exempt from formulating a Disability Access and Inclusion Plan. However,<br />
periodic reviews take place to ensure that the <strong>Port</strong> complies as far as possible with both Federal<br />
and State Government disability legislation.<br />
Substantive Equality<br />
The <strong>Authority</strong> is exempt from reporting on Substantive Equality measures. However, the <strong>Authority</strong><br />
endorses substantive equality, is establishing closer ties with local Indigenous organisations, and<br />
provides for equal access to public services and diversity within the workforce.<br />
Equal Opportunity<br />
BrPA submitted an updated Equal Opportunity Employment Plan to the Equal Opportunity<br />
Commission in December 2009, which was subsequently approved, and is gradually implementing<br />
initiatives arising from the Plan. In response to the plan induction and departing employee feedback<br />
mechanisms have been introduced during this reporting period.<br />
All female staff benefit from BrPA’s Education Assistance Policy and have been undertaking training<br />
at either a tertiary or TAFE level. Throughout the year BrPA employed an Indigenous trainee<br />
studying a Certificate II in Business, within the Administration section, and placed a school-based<br />
Indigenous trainee within the engineering services section.<br />
Human Resources<br />
Stevedoring employment decreased through 2010 – 11 in line with a decline in the expected<br />
<strong>of</strong>fshore exploration activity and reduction in live cattle export shipping activity.<br />
The Employee Consultative Committee has been suspended pending negotiations, with the<br />
Maritime Union <strong>of</strong> <strong>Australia</strong>, for a new Enterprise Agreement as the current EBA is due to expire in<br />
November 2011.<br />
Training delivered during the year includes accounting and maintenance s<strong>of</strong>tware package<br />
upgrades, oil spill response, first aid, radio and the implementation <strong>of</strong> a Certificate III and IV in<br />
Transport and Logistics (Stevedoring), with 37 participants formalising their training efforts.<br />
Figure 4 – Oil spill training<br />
Page 10 <strong>of</strong> 79
The State Records Act 2000<br />
BrPA has a registered Recordkeeping Plan - RKP 2008020. The compliance <strong>of</strong> Operations and<br />
Finance sections with recordkeeping standards has been reviewed throughout the year. One<br />
Administration staff participated in extensive records management training including Keyword<br />
Classification, Records Disposal and Records Management Basics provided by Integrated Records<br />
and Information Solutions (IRIS).<br />
Disposal <strong>of</strong> records is an ongoing process in accordance with the State Records Office approved<br />
‘General Disposal Authorities’.<br />
Freedom <strong>of</strong> Information<br />
The Freedom <strong>of</strong> Information Act 1992 applies. <strong>Broome</strong> <strong>Port</strong> has an Information Statement which<br />
details relevant legislation, methods for community/customer interaction, the structure <strong>of</strong><br />
management and decision making functions and the public library records that are maintained by<br />
BrPA. The Information Statement explains how to lodge a Freedom <strong>of</strong> Information request and lists<br />
associated charges, and a copy <strong>of</strong> the document is available at the BrPA’s <strong>of</strong>fices and the website -<br />
www.broomeport.wa.gov.au.<br />
There was been one application made under this Act during the financial year 2010 – 2011 which<br />
will be processed outside <strong>of</strong> the FoI process due to agreement between the applicant and BrPA.<br />
The Electoral Act 1907 – section 175ZE<br />
Table 2 - Advertising Expenses 2010/11 (includes staff recruitment).<br />
Advertising Agencies Detail Amount<br />
<strong>Broome</strong> Advertiser Sale/Tender $30.45<br />
Recruitment $931.82<br />
WA Newspapers Recruitment $2,244.32<br />
CareerOne Recruitment $260.00<br />
Lloyds List Recruitment $688.80<br />
The Employment Office Pty Ltd Recruitment $3,129.50<br />
Media Advertising organisations<br />
Showcase Publications Pty Ltd Marketing <strong>Port</strong> Services $8,125.00<br />
North West Expo Marketing <strong>Port</strong> Services $500.00<br />
APEA Conference Marketing <strong>Port</strong> Services $636.36<br />
Risk Management<br />
Total $16,546.25<br />
Senior management assists the Board in identifying specific sources <strong>of</strong> risk and in establishing<br />
controls to mitigate these risks. Risk management is a standing agenda item at Manager’s<br />
meetings.<br />
Risk management is ingrained within <strong>Port</strong> decision making functions, from a wharf operations<br />
perspective through to contractual arrangements and Board decisions, and the Board members<br />
have a dedicated Audit and Risk Committee.<br />
Page 11 <strong>of</strong> 79
Compliance with Legislation<br />
BrPA and its operations are affected by many State, Federal and International laws, regulations,<br />
conventions, codes and standards. The <strong>Authority</strong> analyses new and amended legislation and any<br />
changes to codes, standards and conventions to ensure identification <strong>of</strong> any change that may<br />
impact upon <strong>Port</strong> operations, and managers implement relevant measures to ensure compliance.<br />
Insurance <strong>of</strong> Directors and Officers<br />
BrPA paid a premium <strong>of</strong> $33,816.48 to insure the Directors and <strong>of</strong>ficers <strong>of</strong> BrPA against liabilities for<br />
costs and expenses incurred by them in defending any civil or criminal proceedings arising out <strong>of</strong><br />
their conduct while acting in the capacity <strong>of</strong> director or <strong>of</strong>ficer <strong>of</strong> the <strong>Authority</strong>. Coverage excludes<br />
conduct involving a willful breach <strong>of</strong> duty in relation to their employment or appointment to the BrPA<br />
Board.<br />
BrPA indemnifies its director’s against liabilities and claims incurred by them as a result <strong>of</strong> their<br />
<strong>of</strong>fice to the extent permitted by law and provided that various conditions have been satisfied.<br />
The Public Sector Management Act 1994—Section 31 (1) framework<br />
Table 3 – Public Sector Management Act 1994 activities<br />
Compliance issues:<br />
Public Sector Standards<br />
(PSS) Breach claims:<br />
Significant action is taken to monitor and ensure compliance. In<br />
order to achieve best practice, BrPA is internally and externally<br />
audited. The development and administration <strong>of</strong> policies to satisfy<br />
auditors’ requirements imposes significant demands on the<br />
BrPA’s administrative resources.<br />
Nil<br />
WA Code <strong>of</strong> Ethics Reports<br />
<strong>of</strong> non compliance with WA<br />
Code <strong>of</strong> Ethics:<br />
Agency Code <strong>of</strong> Conduct:<br />
Nil<br />
Nil<br />
Corruption Prevention<br />
BrPA has a comprehensive system <strong>of</strong> policies that form the basis <strong>of</strong> its corruption prevention<br />
system.<br />
The following codes and policies reduce the risk <strong>of</strong> corruption and misconduct:<br />
• Education Assistance Policy<br />
• Business Travel Policy<br />
• Risk Management Policy<br />
• Debt Management Policy<br />
• Asset Policy<br />
• Investment Policy<br />
Page 12 <strong>of</strong> 79
• Salary Packaging Policy<br />
• IT Change Management Policy<br />
The codes and policies have been approved by the Board <strong>of</strong> Directors and each staff member is<br />
required to sign a form in which they acknowledge receipt <strong>of</strong> the relevant policy and agree to abide<br />
by its terms.<br />
The Code <strong>of</strong> Conduct also addresses:<br />
• Customer Service<br />
• Conflicts <strong>of</strong> interest<br />
• Offer and Acceptance <strong>of</strong> Gifts and other Incentives<br />
• Personal Behaviour with customers and work colleagues<br />
• Pr<strong>of</strong>essional Integrity<br />
• Corruption<br />
• Release and use <strong>of</strong> <strong>Port</strong> <strong>Authority</strong> Information<br />
• Use <strong>of</strong> <strong>Port</strong> <strong>Authority</strong> Resources<br />
The Purchasing Policy sets clear guidelines regarding the procedure to be followed when services<br />
and products are procured by the <strong>Port</strong>. The procedure separates the approvals required to issue a<br />
purchase order so that multiple parties are aware <strong>of</strong> any significant purchase. Staff members<br />
authorised to purchase goods and services on behalf <strong>of</strong> the <strong>Port</strong> are assigned limits on the value <strong>of</strong><br />
goods and services they can purchase.<br />
BrPA also has policies addressing approved expenditure for entertainment, Entertainment Policy,<br />
and usage and expenditure limits for credit cards, Credit Card Policy, to ensure correct expenditure<br />
protocol is followed.<br />
A Public Interest Disclosure Officer has been appointed who is obligated to investigate, assess and<br />
where appropriate, refer misconduct allegations made in accordance with the Public Interest<br />
Disclosure Act 2003 to the relevant authorities. BrPA’s updated website sets out the process to be<br />
followed if an individual wishes to make a Public Interest Disclosure.<br />
Opportunities and Risks<br />
BrPA has identified the following opportunities and risks for attention in the year ahead:<br />
Potential Threats<br />
• Regulatory Change<br />
• Live cattle trade uncertainty<br />
• Environmental compliance<br />
• Refugee processing<br />
• Lack <strong>of</strong> competition for logistics suppliers<br />
• Darwin as an alternative port<br />
• Funding challenges<br />
• Industry and Government<br />
• Union Activism<br />
• Intertidal Zone responsibilities<br />
• Increasing environmental activism<br />
• Exposure to risks inherent at other regional ports<br />
Page 13 <strong>of</strong> 79
Potential Opportunities<br />
• James Price Point<br />
• Resources export port<br />
• Expansion <strong>of</strong> Browse <strong>of</strong>fshore exploration and development<br />
• Growth <strong>of</strong> International cruise ship market<br />
• <strong>Port</strong>s WA - collective knowledge<br />
• Remedial dredging <strong>of</strong> <strong>Broome</strong> Harbour<br />
• Carbon Tax – sea mile lower carbon<br />
• Quarantine approved premises in <strong>Broome</strong><br />
• Imports directly into <strong>Broome</strong><br />
4.4. Environmental Management<br />
In keeping with an Indigenous Land Use Agreement reached between the State <strong>of</strong> <strong>Western</strong><br />
<strong>Australia</strong> and the Yawuru RNTBC, BrPA has been liaising with the Department <strong>of</strong> Regional<br />
Development and Lands, the Department <strong>of</strong> Environment and Conservation (DEC), the Yawuru<br />
RNTBC and the Shire <strong>of</strong> <strong>Broome</strong> to surrender approximately 50 hectares <strong>of</strong> land previously<br />
gazetted as port lands. The surrendered land will be managed as a reserve by the DEC, <strong>Broome</strong><br />
Shire and the Yawuru RNTBC.<br />
As part <strong>of</strong> its development <strong>of</strong> the remaining land at <strong>Broome</strong> <strong>Port</strong> and <strong>of</strong> additional lands to the north<br />
<strong>of</strong> the <strong>Port</strong> boundary, BrPA has also had a water management plan developed by engineers GHD.<br />
The plan is currently with the Shire <strong>of</strong> <strong>Broome</strong> and Nyamba Buru Yawuru PBC for comment.<br />
Management and consultants C<strong>of</strong>fey Environments reviewed the BrPA’s Environmental<br />
Management Plan to ensure compliance with relevant legislation and encompass <strong>Port</strong> leaseholder<br />
activities.<br />
BrPA continues to contribute to ongoing monitoring studies <strong>of</strong> sea grass and blue green algae<br />
(Lyngbya) within Roebuck Bay. The studies will provide baselines for future comparison studies.<br />
Figure 5 – Team measures canopy height at Town Beach<br />
Page 14 <strong>of</strong> 79
4.5. Organisational Structure<br />
MINISTER<br />
Hon Troy Buswell, MLA<br />
Minister for Transport; Housing<br />
BOARD MEMBERS<br />
Laurie Shervington (Chairman)<br />
Kim Male (Deputy Chair)<br />
George Morris<br />
Marie Gamble<br />
Derek Albert<br />
CHIEF EXECUTIVE OFFICER<br />
HARBOUR MASTER<br />
FINANCE MANAGER<br />
OPERATIONS MANAGER<br />
COMMERCIAL MANAGER<br />
AND GENERAL COUNSEL<br />
ADMINISTRATION MANAGER<br />
AND EXECUTIVE OFFICER<br />
Captain Vic Justice MBA Dip.MS Master Mariner MNI<br />
Captain Graham Hill (formerly Ken Burleigh MMDS)<br />
Charles Kleiman Bachelor <strong>of</strong> Business (Accounting) CPA<br />
Robert Wilkinson BSc, Post Grad Dip Com<br />
Sean Mulhall BA LLB<br />
Rosemary Braybrook<br />
POSTAL ADDRESS PO Box 46<br />
BROOME <strong>Western</strong> <strong>Australia</strong> 6725<br />
OFFICE ADDRESS<br />
401 <strong>Port</strong> Drive<br />
TELEPHONE 08 9194 3100<br />
BROOME <strong>Western</strong> <strong>Australia</strong> 6725<br />
FACSIMILE Administration 08 9192 1778 Operations 08 9194 3188<br />
EMAIL<br />
WEBSITE<br />
info@broomeport.wa.gov.au<br />
www.broomeport.wa.gov.au<br />
Page 15 <strong>of</strong> 79
Organisational Chart<br />
Chief Executive<br />
Officer (Capt. Vic<br />
Justice)<br />
Operations<br />
Manager<br />
(Rob<br />
Wilkinson)<br />
Administration<br />
Manager<br />
(Rosemary<br />
Braybrook)<br />
Finance Manager<br />
(Charles Kleiman)<br />
Commercial<br />
Manager (Sean<br />
Mulhall)<br />
H&S Officer<br />
(vacant)<br />
Harbourmaster<br />
(Graham Hill)<br />
Operations<br />
Superintendant<br />
(Mal Gower)<br />
Services<br />
Superintendant<br />
(Christian Lee)<br />
Admin. Officer<br />
Operations<br />
(Christina Grey)<br />
Administration<br />
Assistant<br />
Accountant<br />
(Simone Cooper)<br />
Supervisor<br />
Pay & Accounts<br />
(Angela Jackson)<br />
Deputy HM<br />
(vacant)<br />
Shift Supervisors<br />
(6)<br />
Shipping Officer<br />
Maintenance<br />
Supervisor<br />
Receptionist<br />
Operations<br />
Receptionist<br />
Administration<br />
Payroll Officer<br />
Accounts Officer<br />
Stevedores<br />
(40)<br />
Maintenance<br />
Team (4)<br />
Page 16 <strong>of</strong> 79
5. OPERATIONAL OVERVIEW<br />
5.1. Operational Review and KPI’s<br />
Vessel Visits<br />
Figure 6 shows a 16% reduction in vessel visits during 2010-11 due to a decrease in livestock<br />
vessel visits. Offshore oil & gas use <strong>of</strong> the wharf decreased in line with continued reduced Browse<br />
Basin exploration activities compared to the previous years’. Large commercial vessel visits<br />
remained strong influenced by the resurrection <strong>of</strong> the coastal shipping service making regular calls<br />
into <strong>Broome</strong>.<br />
Number <strong>of</strong> vessels<br />
1800<br />
1600<br />
1400<br />
1200<br />
1000<br />
800<br />
600<br />
400<br />
200<br />
0<br />
2006‐07 2007‐08 2008‐09 2009‐10 2010‐11<br />
Other vessels<br />
(Navy, Customs, Fisheries, private)<br />
Livestock<br />
Large Commercial<br />
(cruise, fuel, general)<br />
Oil & Gas Offshore Exploration<br />
Small Commercial<br />
(Pearling, Fishing, Tourism<br />
Charter, Offshore Support Charter)<br />
Figure 6 – Vessel Visits<br />
Industries where vessel visits decreased include:<br />
• Fishing vessels by 4%.<br />
• Pearling vessels by 14%.<br />
• Offshore oil & gas vessels by 41% (202 visits compared with 345 in 2009/10).<br />
• Livestock vessels by 28%<br />
• Navy vessels by 50%.<br />
• Department <strong>of</strong> Fisheries vessels by 29%.<br />
• Cruise vessels by 18% due to a reduction in cruise liner visits (figure 7).<br />
Industries where vessel visits increased include:<br />
• Customs vessels by 17%.<br />
• Private vessel visits increased by 20% with continued marketing <strong>of</strong> <strong>Broome</strong> by Superyachts<br />
<strong>Australia</strong>.<br />
• General cargo by 45% due to the resurrection <strong>of</strong> the coastal shipping service operated by<br />
Jebsens.<br />
Page 17 <strong>of</strong> 79
40<br />
35<br />
30<br />
25<br />
20<br />
15<br />
10<br />
Expeditionary Cruise<br />
Vessels<br />
Cruise Liners<br />
5<br />
0<br />
2006/07 2007/08 2008/09 2009/10 2010/11<br />
Figure 7 – Cruise vessel visits to <strong>Broome</strong> <strong>Port</strong> for the past 5 years<br />
Berth Occupancy (Berths 4-10)<br />
Figure 8 shows the monthly average berth occupancy (Berths 4-10) for the period July 2010 – June<br />
2011. The monthly average during this period was 30% down from 37% during 2009/10. The<br />
highest monthly average was 37% during November 2010.<br />
70<br />
60<br />
50<br />
%<br />
40<br />
30<br />
20<br />
31<br />
24<br />
27<br />
25<br />
37<br />
32 32 31<br />
27<br />
33 33<br />
22<br />
10<br />
0<br />
Jul‐10 Aug‐10 Sep‐10 Oct‐10 Nov‐10 Dec‐10 Jan‐11 Feb‐11 Mar‐11 Apr‐11 May‐11 Jun‐11<br />
Average Berth Occupancy (Left Axis)<br />
Linear (Average Berth Occupancy (Left Axis))<br />
Figure 8 – Berth Occupancy<br />
Vessel Turnaround Times<br />
Figure 9 shows monthly average vessel turnaround times for oil & gas supply vessels was 18 hours<br />
(19 hours in 2009/10). Maintenance <strong>of</strong> this port efficiency KPI leads to an increase in berth<br />
availability, which is required to counter the onset <strong>of</strong> port congestion due to recurrent peaking in<br />
wharf usage above 60%. There were no oil & gas supply vessels visiting from December 2010 –<br />
February 2011.<br />
Page 18 <strong>of</strong> 79
25.0<br />
20.0<br />
Hours<br />
15.0<br />
10.0<br />
5.0<br />
0.0<br />
Vessel Turnaround Time (Oil & Gas Rig Tenders)<br />
Linear (Vessel Turnaround Time (Oil & Gas Rig Tenders))<br />
Jul‐10 Aug‐10 Sep‐10 Oct‐10 Nov‐10 Dec‐10 Jan‐11 Feb‐11 Mar‐11 Apr‐11 May‐11 Jun‐11<br />
Figure 9 – Vessel Turnaround Time<br />
Crane Rates<br />
Figure 10 shows that the monthly average crane rates for oil & gas supply vessels was 12.8 lifts per<br />
hour (an increase up from 12.0 lifts per hour during 2009-10). This improvement is a result <strong>of</strong><br />
improved coordination between all parties in the landside logistics chain. The increase in crane<br />
rates assists with meeting vessel turnaround time expectations from the <strong>of</strong>fshore oil & gas industry.<br />
There were no oil & gas supply vessels visiting from December 2010 – February 2011.<br />
Lifts per hour<br />
15.0<br />
14.0<br />
13.0<br />
12.0<br />
11.0<br />
10.0<br />
9.0<br />
8.0<br />
7.0<br />
6.0<br />
5.0<br />
Lifts per Hour (Oil & Gas Rig Tenders)<br />
Poly. (Lifts per Hour (Oil & Gas Rig Tenders))<br />
Jul‐10 Aug‐10 Sep‐10 Oct‐10 Nov‐10 Dec‐10 Jan‐11 Feb‐11 Mar‐11 Apr‐11 May‐11 Jun‐11<br />
Figure 10 – Average Crane Rate (Oil & Gas Rig Tenders)<br />
Truck Turnaround Times<br />
Figure 11 shows that the monthly average gate to gate truck turnaround times for trucks servicing<br />
<strong>of</strong>fshore oil & gas exploration over the 12 months to 30 June 2011 was 29 minutes. There were no<br />
oil & gas supply vessels visiting from December 2010 – February 2011.<br />
Page 19 <strong>of</strong> 79
60<br />
50<br />
Minutes<br />
40<br />
30<br />
20<br />
10<br />
0<br />
Jul‐10<br />
Gate to Gate Truck Turnaround Time (Oil & Gas Rig Tenders)<br />
Poly. (Gate to Gate Truck Turnaround Time (Oil & Gas Rig Tenders))<br />
Aug‐10 Sep‐10 Oct‐10 Nov‐10 Dec‐10 Jan‐11 Feb‐11 Mar‐11 Apr‐11 May‐11 Jun‐11<br />
Figure 11 – Gate to Gate Truck Turnaround Time<br />
5.2. Trade Statistics<br />
Total Trade<br />
Figure 12 shows that total trade slightly decreased during the past year by 3%.<br />
Tonnes<br />
450,000<br />
400,000<br />
350,000<br />
300,000<br />
250,000<br />
200,000<br />
150,000<br />
100,000<br />
50,000<br />
0<br />
Imports<br />
Exports<br />
2001/02 2002/03 2003/04 2004/05 2005/06 2006/07 2007/08 2008/09 2009/10 2010/11<br />
Financial Year Ending 30 June<br />
Figure 12 – Total Trade for the past 10 years<br />
Import Trade<br />
Figure 13 shows that total import trade increased 12% from the previous year. Fuel imports<br />
increased by 22% due to increased demand for fuel in the Kimberley region.<br />
Drilling equipment and drill mud imports decreased from the previous year due to reduced Browse<br />
Basin oil & gas exploration activities.<br />
Building material imports have fallen during the past three years in line with subdued commercial<br />
building activities within the region.<br />
Page 20 <strong>of</strong> 79
250,000<br />
Tonnes<br />
200,000<br />
150,000<br />
100,000<br />
50,000<br />
Other<br />
Drilling Equipment & Mud<br />
Building materials<br />
Fuel and oils<br />
0<br />
2006/07 2007/08 2008/09 2009/10 2010/11<br />
Export Trade<br />
Figure 13 – Import Trade for the past 5 years<br />
Figure 14 shows that total export trade decreased by 16% from the previous year with fuel bunkers,<br />
drilling equipment and mud used by the <strong>of</strong>fshore oil & gas exploration industry down due to<br />
decreased Browse Basin demand. Fresh water supply increased due to added demand from<br />
construction activity on Barrow Island.<br />
Livestock export tonnage and the number <strong>of</strong> cattle exported decreased from the previous year.<br />
250,000<br />
Tonnes<br />
200,000<br />
150,000<br />
100,000<br />
Other<br />
Fuel Bunkers<br />
Fresh Water<br />
50,000<br />
Drilling Equipment & Mud<br />
0<br />
2006/07 2007/08 2008/09 2009/10 2010/11<br />
Livestock (cattle, sheep & goats)<br />
Figure 14 – Export Trade for the past 5 years<br />
Container Trade<br />
Figure 15 shows that container trade decreased slightly. This trade aspect correlates both with the<br />
diminished coastal shipping business under the previous proponents and reduced <strong>of</strong>fshore drilling<br />
activity.<br />
Page 21 <strong>of</strong> 79
TEUs<br />
400<br />
350<br />
300<br />
250<br />
200<br />
150<br />
100<br />
50<br />
0<br />
2006/07 2007/08 2008/09 2009/10 2010/11<br />
Total Import TEUs<br />
Total Export TEUs<br />
Figure 15 – Container Trade for the past 5 years<br />
Offshore Oil & Gas Exploration<br />
During 2010/11 <strong>of</strong>fshore oil and gas exploration drilling activities in the Browse Basin were<br />
undertaken by Shell Development <strong>Australia</strong> and Woodside Energy Limited. From December 2010<br />
through to the beginning <strong>of</strong> March 2011 there were no rigs operating <strong>of</strong>fshore.<br />
Ancillary <strong>of</strong>fshore exploration shipping included seismic vessels and jack-up rigs undertaking<br />
oceanographic studies in the Browse Basin and <strong>of</strong>fshore at James Price Point. General cargo<br />
vessel visits supplying bulk drill product and drilling equipment grow or decrease in line with <strong>of</strong>fshore<br />
support activities, plus import fuel shipments reflect both the levels <strong>of</strong> <strong>of</strong>fshore exploration and the<br />
stages <strong>of</strong> the Kimberley tourist season. The <strong>Port</strong> supplied the bulk <strong>of</strong> its potable water and fuel<br />
bunker exports to Browse Basin exploration drilling activities and construction <strong>of</strong> an oil & gas<br />
processing facility on Barrow Island.<br />
Infrastructure Improvement and Maintenance<br />
Blast and paint maintenance to the wharf underdeck structure during the year was undertaken at the<br />
abutment <strong>of</strong> the wharf and the North Eastern end <strong>of</strong> the wharf link bridge, and this work was<br />
overseen by a competent third party inspector. Outstanding underdeck warranty rectification work is<br />
also progressing. BrPA installed a new fender system to the dinghy davit berth to provide a safe<br />
fendering for small tender vessels. A wharf pylon protection and strengthening trial was initiated on<br />
four pylons as an alternative method <strong>of</strong> repairing and protecting wharf steel piles.<br />
Other essential major works included the resurfacing <strong>of</strong> the road area approaching the wharf<br />
entrance and renewing the drainage and supporting pad at the security gate. This work ensured that<br />
trucks could safely transit from <strong>Port</strong> lands onto the wharf link bridge. Road resurfacing also occurred<br />
adjacent to the Administration building carpark. A new portable gatehouse building which provides a<br />
safety improvement for BrPA employees was installed to replace the existing fixed facility.<br />
The wharf underdeck access trolleys refurbishment and replacement continued. The major 10 year<br />
inspection and service was completed on BrPA’s 100T Demag Crane. In response to the important<br />
nature <strong>of</strong> maintaining crucial infrastructure and assets, BrPA implemented a computerized<br />
maintenance management system and are developing an employee in a Maintenance Planning and<br />
Store role. An additional supplementary welder was also employed.<br />
Page 22 <strong>of</strong> 79
5.3. Safety Review<br />
Commitment to Occupational Safety and Health<br />
<strong>Broome</strong> <strong>Port</strong> <strong>Authority</strong> recognises its obligations to provide a safe and healthy work environment for<br />
all employees, contractors, port users and visitors. We operate under a strong leadership based<br />
safety culture which begins with management commitment from the Board <strong>of</strong> Directors through to<br />
the shop floor. We believe that a successful safety management system must foster continuous<br />
improvement principles to provide a safe and productive work environment that is fit for purpose,<br />
therefore maintaining the welfare <strong>of</strong> our operators as the business grows.<br />
BrPA has demonstrated its commitment to injury management as well as occupational safety and<br />
health (OSH) by implementing a Workplace Injury Management Policy which has been distributed to<br />
all employees. Injury management is raised as a topic during the induction process for new<br />
employees, where the significance <strong>of</strong> accurate reporting and timely return to work programs are<br />
discussed to assist employees with limited knowledge on the impact that injury management can<br />
have within an organisation.<br />
BrPA’s Health Safety and Environmental Activity Plan – 2011 outlines the organisation’s targets for<br />
OSH and injury management performance:<br />
• Total Recordable Frequency Rate: targeted at 0 per million man hours worked,<br />
• Serious Injury Frequency Rate: targeted at 0 per million man hours worked, and<br />
• Lost Time Injury Frequency Rate: targeted at 0 per million man-hours worked.<br />
Formal Mechanism for Consultation with Employees on OS&H Matters<br />
Consultation and communication are integral in achieving an accident and injury free environment<br />
and this is manifested by OSH and injury management discussion during the induction process for<br />
new employees.<br />
BrPA has an effective Occupational Safety and Health Committee that plays an integral part in the<br />
communication and consultation process within the organisation. To ensure timely communication<br />
and consultation on safety issues BrPA has increased the number <strong>of</strong> safety and health<br />
representatives from four to seven.<br />
OSH information is made available to all staff via notice boards, electronic bulletins, flyers and via<br />
safety meetings. For more complex information that requires investigation, our employees,<br />
contractors and visitors are actively encouraged to seek the assistance <strong>of</strong> the Health Safety and<br />
Environment Officer who will assist in researching the required information in a timely manner.<br />
Injury Management and Workers Compensation<br />
BrPA is committed to assisting injured workers return to their pre-existing duties as soon as<br />
medically possible and in accordance with the Workers’ Compensation and Injury Management Act<br />
1981. Management supports the injury management process and recognises that its success relies<br />
on the active participation and cooperation <strong>of</strong> the injured worker and BrPA.<br />
Where possible the agency actively seeks suitable or alternative duties internally whilst having<br />
regard for injured workers’ medical restrictions. Injury management is outlined during the induction<br />
process for new employees in conjunction with the Workplace Injury Management Policy.<br />
Page 23 <strong>of</strong> 79
Occupational Safety and Health Management Systems<br />
BrPA has an effective Occupational Safety and Health Management System (OSHMS) that is<br />
internally reviewed on an annual basis. External agencies are encouraged to audit the OSHMS to<br />
ensure continuity and effectiveness for both stakeholders and the organisation, and to promote their<br />
own commitment to safety. The last external audit was conducted July 2010.<br />
Significant findings <strong>of</strong> this audit were as follows:<br />
• Incident Investigation - Ensure all investigators receive training – 1 day Investigation<br />
program.<br />
• Determine a Quantitative measurement for the success and value <strong>of</strong> the procedures.<br />
• Apply a Quantitative, rather than Qualitative, measurement that has a criteria to determine<br />
the SUCCESS and VALUE <strong>of</strong> the procedure/process/policy to the organisation.<br />
Occupational Safety and Health Performance Indicators<br />
Table 4 – Occupational Safety and Health Performance Indicators<br />
Actual Results<br />
Results against Target<br />
Measure<br />
2009-10 2010-11 Target Comment on Result<br />
Number <strong>of</strong> fatalities 0 0 0<br />
Lost time injury and/or<br />
disease incident rate<br />
Lost time injury and/or<br />
disease severity rate<br />
Percentage <strong>of</strong> injured<br />
workers return to work<br />
within 28 days<br />
Percentage <strong>of</strong> managers<br />
trained in occupational<br />
safety, health and injury<br />
management<br />
responsibilities<br />
0 12.13% 0<br />
0 12.13% 0<br />
100% 100% 100%<br />
12.5% 12.5% 50%<br />
1 LTI recorded in<br />
November 2010.<br />
Number <strong>of</strong> managers to<br />
undertake training<br />
identified, however course<br />
rescheduled to a later<br />
date by external provider.<br />
Significant Awards Received by the Agency<br />
During the period BrPA received Occupational Safety and Health Awards as follow:<br />
• August 2010, APPEA Safety Innovation Awards – Finalist.<br />
• October 2010, IFAP Safety Achievement Award for an Effective Safety Management System<br />
(Gold).<br />
• October 2010, IFAP Safety Achievement Award for 6 months without a lost time injury.<br />
Additional Information<br />
BrPA recognises that the marine industry and in particular port operations such as stevedoring can<br />
entail high-risk work. There are many hazardous conditions to consider and mitigate towards an<br />
Page 24 <strong>of</strong> 79
acceptable level <strong>of</strong> risk. BrPA has addressed movement <strong>of</strong> heavy loads, working at heights, working<br />
on vessels that are in motion due to weather conditions alongside the wharf, and personnel fatigue<br />
due to irregular hours and ambient work conditions.<br />
The agency has developed a number <strong>of</strong> key initiatives and training schedules to educate and<br />
prepare operators for various tasks as mentioned above. These include:<br />
• Certificate III in Transport and Logistics (Stevedoring);<br />
• Certificate IV in Transport and Logistics (Stevedoring); and<br />
• Site specific Dogging.<br />
The port is a member <strong>of</strong> <strong>Port</strong>s WA Peer Group for Occupational Safety and Health. This forum<br />
works towards port specific OS&H programs and investigates commercial products that may provide<br />
industry best practice solutions.<br />
Figure 16 – Man overboard exercise<br />
Page 25 <strong>of</strong> 79
6. DIRECTORS REPORT<br />
The Board <strong>of</strong> Directors <strong>of</strong> the <strong>Broome</strong> <strong>Port</strong> <strong>Authority</strong>, in accordance with Schedule 5 <strong>of</strong> the <strong>Port</strong><br />
Authorities Act 1999, has pleasure in submitting its report for the financial year ended 30 June 2011.<br />
6.1. Role <strong>of</strong> the Board<br />
The Board <strong>of</strong> Directors (Board) <strong>of</strong> BrPA is its governing body and in the name <strong>of</strong> the port authority<br />
performs the functions, determines policies and controls the affairs <strong>of</strong> BrPA. The role <strong>of</strong> the Board<br />
as the governing body is to provide leadership, direction and oversight to BrPA through setting<br />
corporate policies and strategic direction.<br />
The Audit and Risk Review sub-committee <strong>of</strong> the Board scrutinises finance and risk related matters,<br />
governance issues, human resource requirements, and formulates the internal audit requirements<br />
for the year. The Strategic Management sub-committee oversees the environmental and<br />
sustainability functions, project management, and the implementation <strong>of</strong> strategic initiatives.<br />
During 2010-11 the Board commissioned consultants to conduct an internal audit <strong>of</strong> BrPA<br />
procedures and practices, and initiated a significant engineering review resulting in a<br />
comprehensive report on wharf infrastructure maintenance requirements and costs. The Board<br />
commissioned design work for a new heavy lift wharf and accompanying business plan to support<br />
future increased trade requirements. A Land Use Plan was drafted which is awaiting final approval<br />
and implementation.<br />
The Board appoints the Chief Executive Officer and reviews CEO performance and remuneration.<br />
The Board also ensures that holistic regulatory and ethical standards are met and that risks are<br />
appropriately managed.<br />
<strong>Broome</strong> <strong>Port</strong> <strong>Authority</strong> has five Directors who are appointed by the Minister for Transport and these<br />
Directors may hold <strong>of</strong>fice for up to three years. Members <strong>of</strong> staff are not eligible for appointment as<br />
a Director.<br />
6.2. Directors’ Rights<br />
Directors have access to independent legal or financial advice paid for as an approved BrPA<br />
expense and are entitled to access the <strong>Authority</strong>’s records for a period <strong>of</strong> seven years following<br />
retirement from the Board.<br />
6.3. Directors’ Details<br />
The names and details <strong>of</strong> the Directors <strong>of</strong> the <strong>Broome</strong> <strong>Port</strong> <strong>Authority</strong> during the financial year and<br />
until the date <strong>of</strong> this report are:<br />
Mr Laurie Shervington LLB – Chairman<br />
Mr Shervington was appointed on 24 March 2011, he has been a practicing lawyer for 43 years and<br />
has listed public company and private company experience as a director. His current term expires<br />
31 December 2012.<br />
Page 26 <strong>of</strong> 79
Dr Ian Burston AM – (retired) Chairman<br />
Dr Burston retired after guiding and serving the <strong>Port</strong> for some eight years after having his term<br />
extended until 31 December 2010 through this reporting period.<br />
Mr Kim Male – Deputy Chair<br />
Mr Male’s family has been closely involved with the development <strong>of</strong> <strong>Broome</strong> and the pearling<br />
industry for over a hundred years. Mr Male is a local businessman who has been active in diverse<br />
community organisations, he was a member <strong>of</strong> the <strong>Broome</strong> Shire Council for 30 years and is an<br />
honorary Freeman <strong>of</strong> the municipality. Mr Male is a Justice <strong>of</strong> the Peace and his present term as a<br />
director <strong>of</strong> the <strong>Port</strong> <strong>Authority</strong> expires on 31 December 2012.<br />
Mr George Morris<br />
Mr Morris is a consultant with a wide range <strong>of</strong> experience in the oil exploration industry. He is<br />
currently working with Buru Energy co-coordinating exploration in the Canning Basin. He has<br />
worked with many <strong>of</strong> the larger <strong>Australia</strong>n oil and gas explorers, Mr Morris has developed<br />
experience in project planning, community consultation and liaison, project management and<br />
communication and reporting. As a long term <strong>Broome</strong> resident, Mr Morris has a wide ranging<br />
involvement with the community. He has had lengthy involvement with the <strong>Broome</strong> Turf Club and<br />
was a founder member <strong>of</strong> the Surf Lifesaving Club, and his current term as director expires on 31<br />
December 2011.<br />
Ms Marie Gamble<br />
Ms Gamble is a long term resident <strong>of</strong> <strong>Broome</strong> and for the past 20 years has been a director in the<br />
pearling industry and a retail proprietor. Ms Gamble has been involved throughout this period in<br />
community projects, tourism and the pastoral industry within the <strong>Broome</strong> and wider Kimberley<br />
region. Her current term as director expires on 31 December 2011.<br />
Mr Derek Albert<br />
Mr Albert has a long history with <strong>Broome</strong> as a lifelong resident. Mr Albert is heavily involved in the<br />
local community assisting an array <strong>of</strong> community organisations and has senior management<br />
experience in the marine, tourism and construction industries, with additional business consulting<br />
experience. Mr Albert has Post-Graduate qualifications in management and management<br />
accounting and his current term expires on 30 June 2013.<br />
Retirements, Appointments and Continuation in Office <strong>of</strong> Directors<br />
The Chairman Ian Burston AM retired on 31 December 2010 and Laurie Shervington was appointed<br />
as Chairman in March 2011. Deputy Chairman Kim Male’s term was extended to 31 December<br />
2012 and Director Derek Albert’s term was renewed until 30 June 2013, throughout the reporting<br />
period.<br />
Page 27 <strong>of</strong> 79
6.4. Directors Meetings<br />
During the financial year Directors held six Directors’ meetings, four Accounting Risk and Audit<br />
meetings and five Strategic Management sub-Committee meetings. Directors’ attendance at these<br />
meetings is shown in the table below:<br />
Table 5 – Meetings attended by Directors<br />
Members Name<br />
Ian Burston<br />
(Chairman)<br />
Laurie<br />
Shervington<br />
(Chairman)<br />
Kim Male<br />
(Deputy<br />
Chairman)<br />
George<br />
Morris<br />
Marie<br />
Gamble<br />
Derek<br />
Albert<br />
Board Meetings<br />
held in 2010/11<br />
6 6 6 6 6 6<br />
Number <strong>of</strong><br />
Board meetings<br />
attended in<br />
2010/11<br />
3<br />
(due to<br />
retirement)<br />
2<br />
(due to<br />
commencement<br />
date)<br />
5 5 6 6<br />
Audit & Risk<br />
sub-Committee<br />
meetings held<br />
4 4 4 4 4 4<br />
Audit & Risk<br />
sub-Committee<br />
meetings<br />
attended<br />
3<br />
(due to<br />
retirement)<br />
0<br />
(due to<br />
commencement<br />
date)<br />
4 3 4 4<br />
Strategic<br />
Planning sub-<br />
Committee<br />
meetings held<br />
Strategic<br />
Planning sub-<br />
Committee<br />
meetings<br />
attended<br />
5 5 5 5 5 5<br />
4<br />
(due to<br />
retirement)<br />
0<br />
(due to<br />
commencement<br />
date)<br />
5 3 4 5<br />
Page 28 <strong>of</strong> 79
6.5. Planned Achievements<br />
Planned<br />
Achievements<br />
Status<br />
FINANCE:<br />
a) Source funding for slipway capital<br />
works,<br />
emergency services infrastrucutre and land<br />
remediation;<br />
b) Examin potential customer revenue streams, and<br />
maximise revenue‐generation capability; and<br />
c) Produce a business model to operatee<br />
efficiently, cheaply, pr<strong>of</strong>itably and remain<br />
competitive against other ports.<br />
FINANCE:<br />
a) Future borrowings approved for emergency<br />
services infrastructure and land remediation;<br />
b) Fees and charges benchmarked and two new<br />
charges for navigation and infrastructure<br />
introduced to <strong>of</strong>fset expenditure in these areas;<br />
and<br />
c) Business model reviewed and updated, and<br />
KPI's<br />
measured.<br />
PRICING<br />
AND CHARGES:<br />
a) Maximise revenue and pr<strong>of</strong>it from existing<br />
customer base.<br />
PRICING AND CHARGES:<br />
a) Fees and charges reviewed<br />
and increased<br />
generally by 3.5% to 5%, with<br />
pilotage charges<br />
increasing after a period without rise.<br />
FACILITATE TRADE:<br />
a) Conduct market surveys, reviews and<br />
analyse<br />
customer requirements<br />
and trade opportunities;<br />
b) Support establishment <strong>of</strong> an AQIS approved<br />
inspection facility;<br />
c) Market the <strong>Port</strong> to expand cargo volumes and<br />
broaden customer base;<br />
d) Collaborate with business, regulatory<br />
authorities<br />
and the local community;<br />
e) Explore opporuntites<br />
arising as an intermodel hub;<br />
and<br />
f) Investigate the feasibility <strong>of</strong> an artesian water bore<br />
as an alternative source <strong>of</strong> drill water.<br />
FACILITATE TRADE:<br />
a) Cusomter survey undertaken and new trade<br />
opportunities explored on an ongoing basis;<br />
b ) Land leased for the establishment <strong>of</strong> an AQIS<br />
approved insepction facility;<br />
c) Marketing activities conducted including<br />
advertising, and presentations at conferences/ /trade<br />
shows. Responded to stakeholder requirements in<br />
areas <strong>of</strong> training, services, plant and assets;<br />
d) Conductedd <strong>Port</strong> User Group, Logistics Working<br />
Group and other stakeholder meetings;<br />
e) Identified and progressed opportunities for<br />
expanding supply chain support activities; and<br />
f) Demand for water has declined hence sinking an<br />
artesian water bore is not required at this time.<br />
PERFORMANCE TARGETS:<br />
a) Implement a cost reduction strategy to<br />
minimise<br />
waste, increase productivty and effectiveness.<br />
PERFORMANCEE TARGETS:<br />
a) Strategy was successful particularly in relation to<br />
meeting cost<br />
constraints from<br />
an unexpected<br />
declining business base.<br />
PERSONNEL:<br />
a) Training plan concepts to be addressedd in regard<br />
to enhancing relationships with Yawuru people.<br />
PERSONNEL:<br />
a) BrPA was a signatory to the WA<br />
Government/ /Woodside agreement and consequently<br />
has an obligation towards training and employing a<br />
percentage <strong>of</strong><br />
traditional owner employees for<br />
the<br />
proposed James Price Point Browse LNG <strong>Port</strong><br />
<strong>Authority</strong>.<br />
Page 29 <strong>of</strong> 79
Planned<br />
Achievements<br />
Status<br />
LAND:<br />
a) Continue works aimed at developing land within<br />
the <strong>Port</strong> area inclusive <strong>of</strong> headworks for<br />
drainage, provision<br />
<strong>of</strong> utilities and roads;<br />
b) Progress works and sub‐lease arrangements for<br />
land at <strong>Port</strong>'s Northern boundary;<br />
c) Incorporate headworks levy in new rental rates;<br />
and<br />
d) Encourage tennants to maximise<br />
use <strong>of</strong> land.<br />
INFRASTRUCTURE:<br />
a) Funding to be sourced/identifie<br />
ed to progress<br />
whole <strong>of</strong> site needs including maintenance and<br />
refurbishment <strong>of</strong> infrastrucutre and equipment; and<br />
b) Produce a concept design and business case in<br />
support <strong>of</strong> a heavy<br />
lift wharf.<br />
LAND:<br />
a) Obtained funding for headworks plans and<br />
entered into contracts to<br />
relocate utilities;<br />
b) Legal documents/agreements finalised;<br />
c) Pending release <strong>of</strong> new<br />
land; and<br />
d) Tenants utilising land to capacity and sub‐<br />
leasing.<br />
INFRASTRUCTURE:<br />
a) Borrowings approved, over three years, for<br />
infrastructure and equipment refurbishment and<br />
replacement and funding<br />
being sought for wharf<br />
extension <strong>of</strong> life; and<br />
b) Concept plans finalised and business case<br />
prepared, ongoing.<br />
SAFETY AND ENVIRONMENT:<br />
a) Maintain and exceed present levels <strong>of</strong> safety and<br />
environmental compliance;<br />
b)<br />
Prepare audits and train workforce in<br />
risk, hazardous goods handling, safety and marine<br />
oeprations; and<br />
c) Enhance maritime security through infrastructure<br />
planning and increased training drills and exercices.<br />
SAFETY AND ENVIRONEMENT:<br />
a) Environmental Management Plan updated, IFAP<br />
safety awards received and one LTI recorded;<br />
b) Oil spill response training undertaken and<br />
revised Safety Operating<br />
Procedures promulgated<br />
and training provided; and<br />
c) New Gatehouse installed and manned 24/7 by<br />
safety watchkeepers and<br />
training drills an<br />
ongoingg activity.<br />
PLANNING:<br />
a) Collarborate with the State Government in<br />
planning for the proposed James Price Point LNG<br />
precint.<br />
PLANNING:<br />
a) Input provided to Department <strong>of</strong> State<br />
Development committees, and seed funding<br />
acquired to employ a project manager for BrPA LNg<br />
precint<br />
responsibilities; and<br />
b) Project <strong>of</strong>fice established.<br />
Page 30 <strong>of</strong> 79
6.6. Dividends<br />
A dividend <strong>of</strong> $775,450 is due and payable for the previous financial year.<br />
6.7. Operating Results<br />
The 2010/11 budget estimated that the pr<strong>of</strong>it before tax and dividend would be $0.58m. The actual<br />
outcome for 2010/11 was an after tax loss <strong>of</strong> $0.1m. This outcome was mainly due to the significant<br />
reduction <strong>of</strong> Oil & Gas support vessels visiting the <strong>Port</strong>. Oil and Gas campaigns that were expected<br />
to be supported from <strong>Broome</strong> were delayed due to a Federal government freeze on drilling<br />
approvals as a result <strong>of</strong> the West Atlas/Montara oil rig spill. The loss amount was minimised through<br />
judicious overview <strong>of</strong> expenditure.<br />
Shipping revenue<br />
Shipping activity and revenue was below budget due to a $1.0m drop in Oil & Gas revenue for the<br />
period, plus fewer livestock exports and a decline in regional construction activity, as shown by the<br />
following graph.<br />
$200<br />
$000's<br />
$‐<br />
‐$200<br />
‐$400<br />
Coastal Trading<br />
Livestock<br />
Petroleum<br />
Oil & Gas<br />
Pearling<br />
Fishing<br />
Charter<br />
Bitumen<br />
Cement<br />
Cruise Shipping<br />
Other Shipping<br />
Gas Oil<br />
‐$600<br />
‐$800<br />
‐$1,000<br />
‐$1,200<br />
Figure 17 – Variance from Budget<br />
Page 31 <strong>of</strong> 79
The graph below shows that the oil and gas sector was<br />
still the <strong>Port</strong>’s major revenue generator. The<br />
percentag<br />
e <strong>of</strong> revenuee realised from each shipping activity is shown at figure 18.<br />
0%<br />
1%<br />
1%<br />
2%<br />
Shipping Activity By Industry<br />
1%<br />
1%<br />
6%<br />
6% 3%<br />
13%<br />
47%<br />
19%<br />
Coastal Trading<br />
Livestock<br />
Petroleum<br />
Oil & Gas<br />
Pearling<br />
Fishing<br />
Charter<br />
Bitumen<br />
Cement<br />
Cruise Shipping<br />
Figure 18 – Shipping Activity as a Percentage <strong>of</strong><br />
Total Revenue<br />
Non-shipping revenue<br />
The total non-shipping<br />
revenue was in line with budget forecastss for the period. BrPA<br />
received a<br />
grant <strong>of</strong> $300k prior to year end<br />
from the Department <strong>of</strong> State Development in whichh $30k was<br />
taken up as revenuee this year<br />
and the remainder will be recognized as revenue during the<br />
forthcoming<br />
2011/12 year.<br />
Expenditure<br />
Total expenditure was<br />
$0.96 million lower than estimated in the 2009/10 budget. The reduction in<br />
Oil & Gas vessel visits reducedd the direct labour cost by $0. 4m. Also, management reducedd<br />
expendituree where operationally<br />
feasible, thus some repairs & maintenance<br />
were delayed thereby<br />
reducing costs by $0.7m compared to budget for the period.<br />
Other financial matters<br />
The level <strong>of</strong> internal audit work during the year produced a positive end <strong>of</strong> year audit result. The<br />
minor item recommendations were accepted by management and will be acted upon<br />
during the<br />
coming financial year.<br />
6.8. Significant Changes in the State <strong>of</strong> Affairs<br />
BrPA was delivered a planning role towards the evolvement <strong>of</strong> the Browse<br />
LNG development at<br />
James Price Point, which necessitated expenditure towards this<br />
project. The project<br />
involves a<br />
requirement to formulate a business case for an estimated $40M expenditure over six years in order<br />
to provide a port authority presence and capabilities at James Price<br />
Point.<br />
Page 32 <strong>of</strong> 79
6.9. Strategy and Future Performance<br />
BrPA invests in holistic employee training and facilitates both individual and corporate selfs<br />
performance<br />
improvement through a process <strong>of</strong> internal appraisals and benchmarking the port’<br />
levels against those <strong>of</strong> other ports and logistics organisations. During the year individual employees<br />
achieved qualifications at certificate levels three and four in frontline management while others<br />
attained certificates or diplomas in administration or management.<br />
Two surveys, conducted to establish whether port performance and capabilities conform with<br />
customer and stakeholder requirements, recorded that all but 4% <strong>of</strong> respondents were satisfied. A<br />
series <strong>of</strong> internal audits reviewed internal business processes in order to inform managers <strong>of</strong> how<br />
well their area <strong>of</strong> business performed and results <strong>of</strong> these processes were satisfactory, albeit with<br />
several areas for improvement.<br />
An ongoing process <strong>of</strong> risk management inclusive <strong>of</strong> financial, operational, safety and environment,<br />
administrative, and project areas and activities ensured that BrPA addressed vulnerabilities and<br />
became a more resilient organisation.<br />
6.10. Events Subsequent to Reporting Date<br />
No events were recorded after the reporting date.<br />
6.11. Likely Developments<br />
At the time <strong>of</strong> writing this report there are no likely developments that might impact upon the<br />
operations <strong>of</strong> the port authority.<br />
6.12. Directors Emoluments<br />
The following tabulations are provided in accordance with Section 13(c)(i) <strong>of</strong> Schedule 5 <strong>of</strong> the <strong>Port</strong><br />
Authorities Act 1999 - the nature and amount <strong>of</strong> each major element <strong>of</strong> remuneration for each<br />
Director and the three named key management personnel <strong>of</strong> the <strong>Authority</strong> who received the highest<br />
remuneration:<br />
Table 6 – Director’s Emoluments 2011<br />
Short term<br />
Postemployee<br />
employment Total<br />
benefits<br />
benefits remuneration<br />
Cash salary & Superannuation<br />
Director’s name<br />
fees<br />
benefits<br />
L. Shervington 12,236 1,101 13,337<br />
I Burston 22,500 - 22,500<br />
K Male 25,000 2,250 27,250<br />
G Morris 16,500 1,485 17,985<br />
M Gamble 16,500 1,485 17,985<br />
D Albert 16,500 1,485 17,985<br />
Total 109,236 7,806 117,042<br />
Page 33 <strong>of</strong> 79
Table 7 – Director’s Emoluments 2010<br />
Director’s name<br />
Short term<br />
employee<br />
benefits<br />
Cash salary &<br />
fees<br />
Total<br />
remuneration<br />
I Burston 45,000 - 45,000<br />
K Male 25,000 2,250 27,250<br />
G Morris 16,500 1,485 17,985<br />
M Gamble 16,500 1,485 17,985<br />
D Albert 16,500 1,485 17,985<br />
Total 119,500 6,705 126,205<br />
Director Kim Male is a proprietor <strong>of</strong> the retail store Streeter and Male (Mitre 10). The transactions for<br />
the year with Streeter and Male amounted to $1,525 (2010: $1,482). This is one <strong>of</strong> the several retail<br />
stores used by the <strong>Broome</strong> <strong>Port</strong> <strong>Authority</strong> on normal commercial terms and conditions.<br />
Mr. Burston resigned from Board in 2011 and was replaced by Mr. Shervington.<br />
Table 8 – Executive Emoluments 2011<br />
Postemployment<br />
benefits<br />
Superannuation<br />
benefits<br />
Postemployment<br />
Short term employee<br />
Total<br />
benefits benefits remuneration<br />
Cash<br />
salary & Other Superannuation<br />
Executive’s name fees benefits benefits<br />
V Justice 263,714 37,770 27,329 328,813<br />
S Mulhall 223,648 - 20,128 243,776<br />
K Burleigh 264,542 21,162 19,649 305,353<br />
Total 751,904 58,932<br />
67,106 877,942<br />
Page 34 <strong>of</strong> 79
Table 9 – Executive Emoluments 2010<br />
Executive’s name<br />
Postloyment<br />
Short term employee benefits<br />
emp<br />
benefits<br />
Cash<br />
salary & Other Superannuation<br />
fees benefits benefits<br />
Total<br />
remuneration<br />
V Justice 265,443 25,816 28,093 319,352<br />
S Mulhall 229,850 - 20,546 250,396<br />
K Burleigh 230,816 - 16,699 247,515<br />
Total 726,109 25,816 65,338 817,263<br />
6.13. Rounding Off<br />
Amounts have been rounded <strong>of</strong>f to the nearest thousand dollars in the Directors’ Report and<br />
Financial Statements.<br />
Page 35 <strong>of</strong> 79
7. STATEMENT OF COMPREHENSIVE INCOME FOR THE YEAR ENDED 30 JUNE 2011<br />
Notes 2011 2010<br />
$'000<br />
$'000<br />
Revenue 4 13,173 14,482<br />
Depreciation a nd amortisation expense 6 (1,161) (1,161)<br />
Po rt operations expenses 5 (5,043) (5,010)<br />
General administration 7 (4,204) (3,551)<br />
Asset maintenance (1,016) (1,034)<br />
Environmental expenses<br />
(25) (131)<br />
<strong>Port</strong> utilities (612) (525)<br />
Safety and security<br />
Finance costs 8<br />
(577) (529)<br />
(632) (655)<br />
Other expenses 9 (113) (181)<br />
Pr<strong>of</strong>it before income tax (210) 1,705<br />
Income tax (expense) / benefit 10 104 (512)<br />
(Loss)/Pr<strong>of</strong>it for the year (106) 1,193<br />
OTHER COMPREHENSIVE INCOME<br />
Changes in asset revaluation surplus<br />
- -<br />
Gains/losses recognised directly in equity<br />
- -<br />
Income tax on items <strong>of</strong> other comprehensive income - -<br />
Total other comprehensive income - -<br />
TOTAL COMPREHENSIVE INCOME FOR THE<br />
YEAR<br />
(106) 1,193<br />
The notes on pages 41 to 76 are an integral part <strong>of</strong> these financial statements.<br />
Page 36 <strong>of</strong> 79
8. STATEMENT OF FINANCIAL POSITION AS AT 30 JUNE 2011<br />
Notes 2011 2010<br />
$'000<br />
$'000<br />
ASSETS<br />
Current Assets<br />
Cash and cash equivalents 12 4,660 3,744<br />
Trade and other receivables<br />
13 1,781 1,289<br />
Total current assets<br />
Non-current Assets<br />
Deferred tax assets 10<br />
6,441<br />
563<br />
5,033<br />
380<br />
Property, plant and equipment 14 25,968 25,947<br />
Intangible assets 15 41 53<br />
Total non-current assets 26,572 26,380<br />
TOTAL ASSETS 33,013 31,413<br />
LIABILITIES<br />
Current Liabilities<br />
Trade and other payables 16 746 836<br />
Provisions<br />
18 1,275 336<br />
Interest bearing borrowings 17 548 519<br />
Other Liabilities<br />
19 259 194<br />
Total current liabilities<br />
Non-current Liabilities<br />
Provisions 18<br />
2,828<br />
135<br />
1,885<br />
122<br />
Interest bearing borrowings 17 11,684 10,159<br />
Total non-current liabilities<br />
11,819 10,281<br />
TOTAL LIABILITIES 14,647 12,166<br />
NET ASSETS 18,366 19,247<br />
EQUITY<br />
Contributed Equity 20 17,136 17,136<br />
Retained pr<strong>of</strong>its 20 1,230 2,111<br />
TOTAL EQUITY 18,366 19,247<br />
The notes on pages 41 to 76 are an integral part <strong>of</strong> these financial statements.<br />
Page 37 <strong>of</strong> 79
9. STATEMENT OF CHANGES IN EQUITY FOR THE YEAR ENDED 30 JUNE 2011<br />
Notes<br />
Contributed<br />
Retained<br />
Total<br />
Reserves<br />
Equity<br />
earnings<br />
equity<br />
$0’000 $0’000 $0’000 $0’000<br />
Balance at 1 July 2009 20 17,136 - 1,978 19,114<br />
Prior period error adjustment - - (235)<br />
(235)<br />
Total comprehensive income for<br />
the year<br />
- - 1, 193 1,193<br />
Transactions with owners in their<br />
capacity as owners:<br />
Capital contributors<br />
- - -<br />
Dividends paid 11 - - (825)<br />
(825)<br />
Contributions to owners - - -<br />
-<br />
Balance at 30 June 2010 17,136 - 2,111 19,247<br />
Balance at 1 July 2010 20 17,136 - 2,111 19,247<br />
Total comprehensive income for<br />
the year<br />
- - (106) (106)<br />
Tr ansactions with owners in their<br />
capacity as owners:<br />
Cap ital contributors<br />
- - - -<br />
Dividends payable 11 - - (775) (775)<br />
Contributions to owners - - -<br />
-<br />
Balance at 30 June 2011<br />
17,136 - 1,230 18,366<br />
The notes on pages 41 to 76 are an integral part <strong>of</strong> these financial statements.<br />
Page 38 <strong>of</strong> 79
10. STATEMENT OF CASH FLOW FOR THE YEAR ENDED 30 JUNE 2011<br />
Cash flows from operating activitie s<br />
2010<br />
$’000<br />
Cash receipts from customers 12,917<br />
14,458<br />
Cash receipts from State and Commonwealth<br />
Government funding<br />
Notes 2011<br />
$’000<br />
391 372<br />
Cash paid to suppliers and employees ( 12,027) (11, 763)<br />
Interest paid (632)<br />
(655)<br />
Income taxes paid (100)<br />
(442)<br />
Net cash from operating activitie s 21 549<br />
1,970<br />
Cash flows from investing activities<br />
Proceeds from sale <strong>of</strong> property, plant and equip ment 23 345<br />
Acquisitions <strong>of</strong> property, plant and equipment (1,210)<br />
(976)<br />
Net cash from investing activities (1,187)<br />
(631)<br />
Cash flows from financing activities<br />
Proceeds from borrowings 2,073<br />
-<br />
Repayment <strong>of</strong> borrowings<br />
(470) (504)<br />
Final Dividend -<br />
(825)<br />
Finance lease payments (49) (78)<br />
Receipts from State Government equity contributions -<br />
-<br />
Net cash from financing activities 1,554 (1,407)<br />
Net increase (decrease) in cash and cash equivalent s 916 (68)<br />
Cash and cash equivalents at 1 July 3,744 3,812<br />
Cash and cash equivalents at 30 June 12 4,660 3,744<br />
The notes on pages 41 to 76 are an integral part <strong>of</strong> these financial statements.<br />
Page 39 <strong>of</strong> 79
11. FINANCE<br />
Contents<br />
Note 1 Basis <strong>of</strong> preparation Note 15 Intangible ass ets<br />
Summary <strong>of</strong> significant accounting<br />
Note 2 policies<br />
Note 16<br />
Trade and other payables<br />
Note 3 Expenses by nature Note 17 Interest bearing borrowings<br />
Note 4 Revenue Note 18 Provisions<br />
Note 5<br />
<strong>Port</strong> operations expense<br />
Note 19<br />
Other liabilities<br />
Note 6 Depreciation and amortisation Note 20 Equity<br />
Note 7 General administration expense Note 21<br />
Reco nciliation o f cash flows<br />
from operating activities<br />
Note 8 Finance costs Note 22 Financial instruments<br />
Note 9 Other expenses<br />
Note 23 Commitments<br />
Note 10 Income tax<br />
Note 24 Remuneration <strong>of</strong> Auditors<br />
Note 11 Dividends Note 25<br />
Related Parties<br />
Note 12 Cash and cash equivalents Note 26 Contingent liabilities<br />
Note 13 Trade and other receivables Note 27<br />
Events occurr ing after balance<br />
sheet date<br />
Note 14<br />
Property, plant and equipment<br />
Page 40 <strong>of</strong> 79
1. Basis <strong>of</strong> preparation<br />
a) Statement <strong>of</strong> compliance<br />
The financial report is a general-purpose financial report which has been prepared in accordance<br />
with <strong>Australia</strong>n equivalents to International Financial Reporting Standards (AIFRSs), other<br />
authoritative pronouncements <strong>of</strong> the <strong>Australia</strong>n Accounting Standards Board and Urgent Issues<br />
Group Consensus Views and the <strong>Port</strong> Authorities Act 1999. The accounting policies adopted in the<br />
preparation <strong>of</strong> the financial statements have been consistently applied throughout all periods<br />
presented, unless otherwise stated.<br />
The financial statements were authorised for issue on 15 August, 2011 by the Board <strong>of</strong> Directors <strong>of</strong><br />
<strong>Broome</strong> <strong>Port</strong> <strong>Authority</strong> (“the <strong>Authority</strong>”).<br />
b) Presentation <strong>of</strong> the statement <strong>of</strong> comprehensiv e income<br />
During the ye ar ended 30 June 2011 the <strong>Authority</strong> modified the statement <strong>of</strong> comprehensive income<br />
presentation <strong>of</strong> expenses using a classification based on the nature <strong>of</strong> expenses. Comparative<br />
amounts<br />
were reclassified for consistency.<br />
Classification <strong>of</strong> expenses by nature is considered to provide more relevant and reliable information<br />
than classifica tion by function due to the nature <strong>of</strong> the <strong>Authority</strong>’s operations.<br />
A ccording to AASB 101 Presentation <strong>of</strong> Financial Statements, expen ses classified by nature are not<br />
reallocated among various functions within the entity. However, t he <strong>Authority</strong> has allocated<br />
employee benefits expenses to various line items on the statement <strong>of</strong> comprehensive income<br />
including marine exp enses, port operations expenses, general administration, and asset<br />
maintenance. This allocation reflects the internal reporting structure <strong>of</strong> the <strong>Authority</strong> which allocates<br />
labour expenses to significant expense items in the income statement based on the nature <strong>of</strong> the<br />
expenses incurred. The <strong>Authority</strong> believes that the allocation is more<br />
relevant to the understanding<br />
<strong>of</strong> the financial performance <strong>of</strong> the <strong>Authority</strong> and does not result in a function <strong>of</strong> expense<br />
presentation.<br />
The directors have concluded that the financial statements present fairly the <strong>Authority</strong>’s financial<br />
position, financial performance and cash flows and that it has complied with applicable standards<br />
and interpretations, except that it has departed from AASB 101, p ara 99, to achieve a fair<br />
presentation.<br />
c) Basis <strong>of</strong> measurement<br />
The financial statements have been prepared on the accrual basis <strong>of</strong> accounting using the historical<br />
cost convention.<br />
d) Functional and presentation currency<br />
These financial statements are presented in <strong>Australia</strong>n dollars and all values are rounded to the<br />
nearest thousand dollars ($’000) unless otherwise stated.<br />
e) Use <strong>of</strong> estimates and judgements<br />
The preparation <strong>of</strong> financial statements requires management to make judgments, estimates and<br />
assumptions that affect the application <strong>of</strong> accounting policies and the reported amounts <strong>of</strong> assets,<br />
liabilities, income and expenses. Actual results may differ from these estimates.<br />
Page 41 <strong>of</strong> 79
Estimates and underlying assumptions are reviewed on an ongoing basis. Revisions to accounting<br />
estimates are recognised in the period in which the estimate is revised and in any future periods<br />
affected.<br />
In particular, information about significant areas <strong>of</strong> estimation, uncertainty and critical judgments in<br />
applying accounting policies that have the most significant effect on the amounts recognised in the<br />
financial statements are:<br />
(i) discount rates used in estimating provisions;<br />
(ii) estimating useful life and residual values <strong>of</strong> key assets; and<br />
(iii) long service leave – retention rates<br />
and discount rates.<br />
Page 42 <strong>of</strong> 79
2. Summary <strong>of</strong> significant accounting policies<br />
The accounting policies set out below have been applied consistently to all periods presented in<br />
these financial statements unless otherwise stated.<br />
Certain comparative amounts have been reclassified to conform with the current year’s presentation<br />
[see note 1(b)].<br />
a)<br />
Revenue recognition<br />
Revenue is measured at the fair value <strong>of</strong> consideration received or receivable. Revenue is<br />
recognised for the major business activities as follows:<br />
(i) Rendering <strong>of</strong> services<br />
Revenue from services rendered is recognised in pr<strong>of</strong>it or loss in proportion to the stage <strong>of</strong><br />
completion <strong>of</strong> the transaction at the reporting date. Where the contract outcome cannot be<br />
measured reliably, revenue is recognised only to the extent <strong>of</strong> the expenses recognised that are<br />
recoverable.<br />
(ii) Interest<br />
Interest revenue is recognised as it accrues using the effective interest method [see note 2(b)].<br />
(iii) Rental income<br />
Rental income is recognised in the income statement on a straight-line basis over the term <strong>of</strong> the<br />
lease. Lease incentives granted are recognised as an integral part <strong>of</strong> the total rental income.<br />
b) Finance income and expenses<br />
Finance income comprises interest income on funds invested and interest receivable from debtors.<br />
Interest income is recognised as it accrues in pr<strong>of</strong>it or loss using the effective interest method.<br />
Finance expenses comprise interest expense on borrowing and finance charges payable under<br />
finance leases. All borrowing costs are recognised in pr<strong>of</strong>it or loss using the effective interest<br />
method. The interest expense component <strong>of</strong> finance lease payments is also recognised in the<br />
income statement using the effective interest rate method.<br />
In determining the amount <strong>of</strong> borrowing costs to be capitalised during the financial year, investment<br />
revenue earned directly relating to borrowings, is deducted from the borrowing costs incurred.<br />
Income tax expense comprises current and deferred tax. Income tax expense is recognised in pr<strong>of</strong>it<br />
or loss except to the extent that it relates to items recognised directly in equity, in which case it is<br />
recognised in equity.<br />
Current tax is the expected tax payable on the taxable income for the year, using tax rates enacted<br />
or substantially enacted at the reporting date and any adjustment to tax payable in respect <strong>of</strong><br />
previous years.<br />
Deferred tax is recognised using the balance sheet method, providing for temporary differences<br />
between the carrying amounts <strong>of</strong> assets and liabilities for financial reporting purposes and the<br />
amounts used for taxation purposes. Deferred tax is not recognised on the initial recognition <strong>of</strong><br />
assets or liabilities in a transaction that is not a business combination and that affects neither<br />
accounting nor taxable pr<strong>of</strong>it/loss.<br />
Page 43 <strong>of</strong> 79
Deferred tax is measured at the tax rates that are expected to be applied to the temporary<br />
differences when they reverse, based on the laws that have been enacted or substantively enacted<br />
by the reporting date.<br />
A deferred tax asset is recognised to the extent that it is probable that future taxable pr<strong>of</strong>its will be<br />
available which the temporary difference can be utilised. Deferred tax assets are reviewed at each<br />
reporting date and are reduced to the extent that it is no longer probable that the related tax benefits<br />
will be realised.<br />
c) Receivables<br />
(i) Trade receivables<br />
Trad e debtors are recognised and carried at the original invoice amounts less an allowance for any<br />
uncollectable amounts. Debtors are generally settled within 14 days except for property rentals,<br />
which are governed by individual lease agreements.<br />
The collectability <strong>of</strong> receivables is reviewed on an ongoing basis and any receivables identified as<br />
uncollectable are written-<strong>of</strong>f against the allowance account. The allowance for uncollectable<br />
amounts (doubtful debts) is raised when there is objective evidence that the <strong>Authority</strong> will not be<br />
able to collect a debt.<br />
(ii) Lease receivables<br />
A lease receivable is recognised for leases <strong>of</strong> property, plant and equipment which effectively<br />
transfers to the lessee substantially all <strong>of</strong> the risks and benefits incidental to legal ownership <strong>of</strong> the<br />
leased asset. The lease receivable is initially recognised as the amount <strong>of</strong> the present value <strong>of</strong> the<br />
minimum lease payments receivable at the reporting date plus the present value <strong>of</strong> any<br />
unguaranteed residual value expected to accrue at the end <strong>of</strong> the lease term.<br />
Finance lease payments are allocated between interest revenue and reduction <strong>of</strong> the lease<br />
receivable over the term <strong>of</strong> the lease in order to reflect a constant periodic rate <strong>of</strong> return on the net<br />
investment outstanding in respect <strong>of</strong> the lease with interest revenue calculated using the interest<br />
rate implicit in the lease recognised directly in the income statement.<br />
d) Inventories<br />
Inventories consist <strong>of</strong> stores which are measured at the lower <strong>of</strong> cost and net realisable value.<br />
e) Income tax<br />
The <strong>Authority</strong> operates within the national tax equivalent regime (“NTER”) whereby an equivalent<br />
amount in respect <strong>of</strong> income tax is payable to the State Government. The calculation <strong>of</strong> the liability<br />
in respect <strong>of</strong> income tax is governed by NTER guidelines and directions approved by Government.<br />
As a consequence <strong>of</strong> participation in the NTER, the <strong>Authority</strong> is required to comply with AASB 112<br />
Income Taxes.<br />
Page 44 <strong>of</strong> 79
f) Property, plant and equipment<br />
(i) Recognition and measurement<br />
Items <strong>of</strong> property, plant and equipment are measured at cost less accumulated depreciation and<br />
accumulated impairment losses.<br />
Cost includes expenditure that is directly attributable to the acquisition <strong>of</strong> the asset. The cost <strong>of</strong> selfconstructed<br />
assets includes the cost <strong>of</strong> materials and direct labour, any other costs directly<br />
attributable to bringing the asset to a working condition for its intended use and the costs <strong>of</strong><br />
dismantling and removing the items and restoring the site on which they are located. Purchased<br />
s<strong>of</strong>tware that is integral to the functionality <strong>of</strong> the related equipment is capitalised as part <strong>of</strong> that<br />
equipment.<br />
When parts <strong>of</strong> an item <strong>of</strong> property, plant and equipment have different useful lives, they are<br />
accounted for as separate items (major components) <strong>of</strong> property, plant and equipment.<br />
Gains and losses on disposal <strong>of</strong> an item <strong>of</strong> property, plant and equipment are determined by<br />
comparing the proceeds from disposal with the carrying amount <strong>of</strong> property, plant and equipment<br />
and are recognised net within “other income” in pr<strong>of</strong>it or loss.<br />
(ii) Subsequent costs<br />
The cost <strong>of</strong> replacing part <strong>of</strong> an item <strong>of</strong> property, plant and equipment is recognised in the carrying<br />
amount <strong>of</strong> the item if it is probable that future economic benefits embodied within the part will flow to<br />
the <strong>Authority</strong> and its cost can be measured reliably. The carrying amount <strong>of</strong> the replaced part is<br />
derecognised. The costs <strong>of</strong> the day-to-day servicing <strong>of</strong> property, plant and equipment are<br />
recognised in pr<strong>of</strong>it or loss as incurred.<br />
(iii) Depreciation<br />
Depreciation is recognised in pr<strong>of</strong>it or loss on a straight-line basis over the estimated useful lives <strong>of</strong><br />
each part <strong>of</strong> an item <strong>of</strong> property, plant and equipment. Land is not depreciated.<br />
The estimated useful lives for each class <strong>of</strong> depreciable assets are as follows:<br />
Asset improvements 10 years<br />
Buildings 7 to 50 years<br />
Infrastructure 5 to 66 years<br />
Harbour facilities 10 to 40 years<br />
Navigation Aids 7 to 20 years<br />
Electronic 2 to 10 years<br />
Plant & equipment 1 to 23 years<br />
Furniture & equipment 2 to 17 years<br />
Motor vehicles 3 to 8 years<br />
Low Value Pool 3 years<br />
Depreciation methods, useful lives and residual values are reviewed<br />
at each reporting date.<br />
Page 45 <strong>of</strong> 79
g) Intangible assets<br />
(i)<br />
Research and development<br />
Research costs are expensed as incurred.<br />
Development activities involve a plan or design for the production <strong>of</strong> new or substantially improved<br />
products and processes. Development expenditure is capitalised only if development costs can be<br />
measured reliably, the product or process is technically and commercially feasible, future economic<br />
benefits are probable and the <strong>Authority</strong> intends to and has sufficient resources to complete<br />
development and to use or sell the asset. The expenditure capitalised includes the cost <strong>of</strong> materials,<br />
direct labour and overhead costs that are directly attributable to preparing the asset for its intended<br />
use. Other development expenditure is recognised in pr<strong>of</strong>it or loss as incurred.<br />
Capitalised development expenditure is measured at cost less accumulated amortisation and<br />
accumulated impairment losses.<br />
(ii) Subsequent expenditure<br />
Subsequent expenditure is capitalised only when it increases the future economic benefits<br />
embodied in the specific asset to which it relates.<br />
(iii) Computer s<strong>of</strong>tware<br />
S<strong>of</strong>tware that is an integral part <strong>of</strong> the related hardware is treated as property, plant and equipment.<br />
S<strong>of</strong>tware that is not an integral part <strong>of</strong> the related hardware is treated as an intangible asset.<br />
(iv)<br />
Amortisation<br />
Amortisation is recognised in pr<strong>of</strong>it or loss on a straight line basis over the estimated useful lives <strong>of</strong><br />
intangible assets from the date they are available for use. Computer s<strong>of</strong>tware amortisation is 2 to 20<br />
years. The estimated useful life <strong>of</strong> amortised assets is as follows:<br />
Computer s<strong>of</strong>tware 2 to 20 years<br />
h) Impairment<br />
Property, plant and equipment and intangible assets are tested for any indication <strong>of</strong> impairment at<br />
each balance sheet date. Where there is any indication <strong>of</strong> impairment, the recoverable amount is<br />
estimated. Where the recoverable amount is less than the carrying amount, the asset is considered<br />
impaired and is written down to the recoverable amount and an impairment loss is recognised. As<br />
the <strong>Authority</strong> is a not for pr<strong>of</strong>it entity, the recoverable amount is the higher <strong>of</strong> an asset’s fair value<br />
less costs to sell and depreciated replacem<br />
ent cost.<br />
The risk <strong>of</strong> impairment is generally limited to circumstances where an asset’s depreciation is<br />
materially understated, where the replacement cos t is falling or where there is a significant change<br />
in useful life. Each relevant class <strong>of</strong> assets is reviewed annually to verify that the accumulated<br />
depreciation/amortisation reflects the level <strong>of</strong> consumption or expiration <strong>of</strong> the asset’s future<br />
economic benefits and to any impairment risk from falling replacement costs.<br />
Intangible assets not yet available for use are tested for impairment at each balance sheet date<br />
irrespective <strong>of</strong> whether there is any indication <strong>of</strong> impairment.<br />
Page 46 <strong>of</strong> 79
All impairment losses are recognised in pr<strong>of</strong>it or loss.<br />
An impairment loss is reversed if the reversal can be related objectively to an event occurring after<br />
the impairment loss was recognised. An impairment loss is reversed only to the extent that the<br />
asset’s carrying amount does not exceed the carrying amount that would have been determined, net<br />
<strong>of</strong> depreciation or amortisation, if no impairment loss had been recognised.<br />
i) Leases<br />
Leases in which the <strong>Authority</strong> assumes substantially all the risks and rewards <strong>of</strong> ownership are<br />
classified as finance leases. Upon initial recognition the leased asset is measured at an amount<br />
equal to the lower <strong>of</strong> its fair value and the present value <strong>of</strong> the minimum lease payments.<br />
Subsequent to initial recognition, the asset is accounted for in accordance with the accounting policy<br />
applicable to that asset.<br />
Other leases are operating leases and the leased assets are not recognised on the <strong>Authority</strong>’s<br />
balance sheet.<br />
Payments made under operating leases are recognised in pr<strong>of</strong>it or loss on a straight-line basis over<br />
the term <strong>of</strong> the lease. Lease incentives received are recognised as an integral part <strong>of</strong> the total lease<br />
expense, over the term <strong>of</strong> the lease.<br />
Mini mum lease payments made under finance leases are apportioned between the finance expense<br />
and the reduction <strong>of</strong> the outstanding liability. The finance expense is allocated to each period during<br />
the lease term so as to produce a constant periodic rate <strong>of</strong> interest on the remaining balance <strong>of</strong> the<br />
liability. Contingent lease payments are accounted for by revising the minimum lease payments over<br />
the remaining term <strong>of</strong> the lease when the lease adjustment is confirmed.<br />
j) Financial instruments<br />
In addition to cash, the <strong>Authority</strong> has two categories <strong>of</strong> financial instruments:<br />
1. Loans a nd receivables;<br />
2. Financial liabilities measured at amortised cost.<br />
Refer to Note 22( ii) for further information on the classification <strong>of</strong> financial instruments.<br />
Initial recognition and measurement is at fair value. The transaction cost or face value is equivalent<br />
to the fair value. Subsequent measurement is at amortised cost using the effective interest method.<br />
The fair value <strong>of</strong> short-term receivables and payables is the transaction cost or the face value<br />
because there is no interest rate applicable and subsequent measurement is not required as the<br />
effect <strong>of</strong> discounting is not material.<br />
k) Payables<br />
Payables, including trade creditors, amounts payable and accrued expenses, are recognised for<br />
amounts to be paid in the future for goods and services received prior to the reporting date. The<br />
carrying amount is equivalent to fair value, as they are generally settled within 30 days.<br />
Page 47 <strong>of</strong> 79
l) Borrowings<br />
All borrowings are initially recognised at cost, being the fair value <strong>of</strong> the consideration received less<br />
directly attributable transaction costs. Subsequent measurement is at amortised cost using the<br />
effective interest rate method.<br />
Gains and losses are recognised in the income statement when the liabilities are derecognised, as<br />
well as through the amortisation process.<br />
Borrowing costs are expensed as incurred unless they relate to qualifying assets.<br />
m) Employee benefits<br />
The liability for annual and long service leave expected to be settled within 12 months after the<br />
balance sheet date is recognised and measured at the undiscounted amounts expected to be paid<br />
when the liabilities are settled. Annual and long service leave expected to be settled more than 12<br />
months after the balance sheet date is measured at the present value <strong>of</strong> amounts expected to be<br />
paid when the liabilities are settled. Leave liabilities are in respect <strong>of</strong> services provided by<br />
employees up to the balance sheet date.<br />
When assessing expected future payments consideration is given to expected future wage and<br />
salary levels including non-salary components such as employer superannuation contributions. In<br />
addition, the long service leave liability also considers the experience <strong>of</strong> employee departures and<br />
periods <strong>of</strong> service.<br />
The expected future payments are discounted to present value using market yields at the balance<br />
sheet date on national government bonds with terms to maturity that match, as closely as possible,<br />
the estimated future cash outflows.<br />
All annual leave and unconditional long service leave provisions are classified as current liabilities<br />
as the <strong>Authority</strong> does not have an unconditional right to defer settlement <strong>of</strong> the liability for at least 12<br />
months after the balance sheet date.<br />
Associated payroll on-costs are included in the determination <strong>of</strong> other provisions.<br />
n) Employee superannuation<br />
The Gold State Superannuation Scheme (GSS), a defined benefit lump sum scheme, and the<br />
Superannuation and Family Benefits Act Scheme, a defined benefit pension scheme, are now<br />
closed to new members. The <strong>Authority</strong> is liable for superannuation benefits for past years’ service <strong>of</strong><br />
members <strong>of</strong> the Superannuation and Family Benefits Act Scheme who elected to transfer to the<br />
GSS Scheme. The <strong>Authority</strong> also accrues for superannuation benefits to the pension scheme for<br />
those members who elected not to transfer from that scheme.<br />
The superannuation liability for existing employees with the pre-transfer service incurred under the<br />
Superannuation and Family Benefits Act Scheme who transferred to the GSS Scheme are provided<br />
for at reporting date.<br />
Employees who are not members <strong>of</strong> either the Pension or the GSS Schemes became<br />
non-contributory members <strong>of</strong> the West State Superannuation<br />
Scheme (WSS), an accumulation fund<br />
until 15 April 2007. From 16 April 2007, employees who are not members <strong>of</strong> the Pension, GSS or<br />
WSS Schemes become non-contributory members <strong>of</strong> the GESB Superannuation Scheme (GESB<br />
Super), a taxed accumulation fund.<br />
Page 48 <strong>of</strong> 79
The <strong>Authority</strong> makes concurrent contributions to the Government Employee Superannuation Board<br />
(GESB) on behalf <strong>of</strong> employees in compliance with the Commonwealth Government’s<br />
Superannuation Guarantee (Administration) Act 1992. These contributions extinguish the liability for<br />
superannuation charges in respect <strong>of</strong> the WSS and GESB Super Schemes.<br />
Defined benefit plan<br />
The <strong>Authority</strong>’s net obligation in respect <strong>of</strong> defined benefit pension plan is calculated separately by<br />
estimating the amount <strong>of</strong> future benefit that employees have earned in return for their service in the<br />
current and prior periods; that benefit is discounted to determine its present value, and the fair value<br />
<strong>of</strong> any plan assets is deducted. These benefits are unfunded.<br />
The discount rate used is the market yield rate at the balance sheet date on national government<br />
bonds that have maturity dates approximating to the terms <strong>of</strong> the entity’s obligations. The calculation<br />
is performed by a qualified actuary using the actuarial cost method.<br />
The superannuation expense <strong>of</strong> the defined benefit plan is made up <strong>of</strong> the following elements:<br />
• Current service cost;<br />
• Interest cost (unwinding <strong>of</strong> the discount);<br />
• Actuarial gains and losses; and<br />
• Past service cost.<br />
Actuarial gains and losses <strong>of</strong> the defined benefit plan are recognised immediately as income and<br />
expense in the income statement.<br />
The superannuation expense <strong>of</strong> the defined contribution plan is recognised as and when the<br />
contributions fall due.<br />
o) Dividends<br />
Dividends are recognised as a liability in the period they are declared.<br />
p) Provisions<br />
A provision is recognised if, as a result <strong>of</strong> a past event, the <strong>Authority</strong> has a present legal or<br />
constructive obligation that can be estimated reliably and it is probable that an outflow <strong>of</strong> economic<br />
benefits will be required to settle the obligation. If the effect <strong>of</strong> the time value <strong>of</strong> money is material,<br />
provisions are determined by discounting the expected future cash flows at a pre-tax rate that<br />
reflects current market assessments <strong>of</strong> the time value <strong>of</strong> money and the risks specific to the liability.<br />
Where discounting is used, the increase in the provision due to the passage <strong>of</strong> time is recognised as<br />
finance costs.<br />
q) Cash and cash equivalents<br />
Cash and cash equivalents in the balance sheet comprise cash on hand, cash at bank, at call<br />
deposits and term deposits due within 30 days.<br />
For the purpose <strong>of</strong> the cash flow statement, cash equivalents consist <strong>of</strong> cash and cash equivalents<br />
as defined above.<br />
Page 49 <strong>of</strong> 79
) Goods and services tax<br />
Revenue, expenses and assets are recognised net <strong>of</strong> the amount <strong>of</strong> goods and services tax (GST),<br />
except where the amount <strong>of</strong> GST incurred is not recoverable from the taxation authority. In these<br />
circumstances, the GST is recognised as part <strong>of</strong> the cost <strong>of</strong> acquisition <strong>of</strong> the asset or as part <strong>of</strong> the<br />
expense.<br />
Receivables and payables are stated with the amount <strong>of</strong> GST included. The net amount <strong>of</strong> GST<br />
recoverable from, or payable to, the ATO is included as a current asset or liability in the balance<br />
sheet.<br />
Cash flows are included in the statement <strong>of</strong> cash flows on a gross basis. The GST components <strong>of</strong><br />
cash flows arising from investing and financing activities which are recoverable from, or payable to,<br />
the ATO are classified as operating cash flows.<br />
s) Contributed equity<br />
The <strong>Authority</strong> receives support from the WA Government (see note 21). The amount received is<br />
recognised directly as a credit to contributed equity.<br />
t) New standards and interpretations not yet adopted<br />
The following standards, amendments to standards and interpretations have been identified as<br />
those which may impact the entity in the period <strong>of</strong> initial application. They are available for early<br />
adoption at 30 June 2010, but have not been applied in preparing this financial report:<br />
• AASB 124 : Related Party Disclosures, this revision amends the disclosure requirements for<br />
government related<br />
entities and the definition <strong>of</strong> a related party and is effective for annual<br />
reporting periods ending on or after 31 December 2011.<br />
Page 50 <strong>of</strong> 79
3. Expenses by nature<br />
Operating expenses are presented on the face <strong>of</strong> the income statement using a classification based<br />
on the nature <strong>of</strong> expenses [see note 1(b)]. Marine expenses include those expenses derived from<br />
water based activities, port operations expenses include those expenses related to land based<br />
support activities, whilst general administration expenses includes expenditure <strong>of</strong> an administrative<br />
nature.<br />
4. Revenue<br />
Revenue consists <strong>of</strong> the following items:<br />
Rendering <strong>of</strong> services<br />
2011 2010<br />
$’000 $’000<br />
Charges on cargo 3,830 4,349<br />
Charges on ships 5,642 6,531<br />
Shipping services 1,513 1,273<br />
Interest revenue<br />
Rentals and leases<br />
133<br />
1,424<br />
160<br />
1,528<br />
Government grants and subsidies 391 372<br />
Other 240<br />
269<br />
Total revenue 13,173 14,482<br />
5. <strong>Port</strong> operations expense<br />
2011 2010<br />
$’000 $’000<br />
Shipping activity 2,416 2,607<br />
Indirect wages & salaries – operations 1,726 1,618<br />
Plant & equipment 821 698<br />
Other 80 87<br />
5,043 5,010<br />
Page 51 <strong>of</strong> 79
6. Depreciation and amortization<br />
Depreciation<br />
2011 2010<br />
$’000 $’000<br />
Buildings 63 57<br />
Improvements 18 18<br />
Electronic equipment 41 34<br />
Plant and equipment<br />
206 193<br />
Harbour facilities<br />
Furniture & fittings<br />
Motor vehicles<br />
Navigation Aids<br />
659<br />
10<br />
43<br />
26<br />
649<br />
11<br />
37<br />
29<br />
Associated infrastructure<br />
Low Value Pool<br />
65<br />
17<br />
115<br />
7<br />
Total Depreciation 1,148 1,150<br />
Amortisation<br />
Intangible assets 13 11<br />
Total Amortisation 13 11<br />
Total depreciation and amortisation 1,161 1,161<br />
7. General administration expense<br />
2011 2010<br />
$'000 $'000<br />
G eneral administration expenses<br />
Administration employee expenses 2,965 2,704<br />
Other administration expenses<br />
1,239 847<br />
4,204 3,551<br />
8. Finance costs<br />
2011 2010<br />
$'000 $'000<br />
Finance leases, finance charges<br />
13 14<br />
Interest Paid<br />
619 641<br />
Finance costs expensed 632 655<br />
Page 52 <strong>of</strong> 79
9. Other expenses<br />
2011 2010<br />
$'000<br />
$'000<br />
Doubtfu l debts - -<br />
Other 113 181<br />
10. Income tax<br />
Recognised in the Statement <strong>of</strong> Comprehensive Income<br />
Curren t tax expense<br />
Current income tax charge<br />
2011 2010<br />
$’000 $’000<br />
(63) 443<br />
Adjustment for prio r periods - -<br />
Deferre d tax expense<br />
Origination and reversal <strong>of</strong> temporary<br />
differences<br />
Current Tax expense/benefit<br />
Recognition <strong>of</strong> previously unrecognised<br />
tax losses<br />
(63) 443<br />
(183) 69<br />
142 -<br />
- -<br />
(41) 69<br />
Total income tax expense/(benefit) (104) 512<br />
113 181<br />
Numerical reconciliation between tax<br />
expense and pre-tax pr<strong>of</strong>it<br />
Pr<strong>of</strong>it/(loss) for the period (147) 1,193<br />
Total income tax expense (63) 512<br />
Pr<strong>of</strong>it excluding income t ax (210) 1,705<br />
Income tax using the statutory rate <strong>of</strong><br />
30% (2010:30%)<br />
(63) 512<br />
Non-deductible expenses 3 2<br />
Adjustments in respect <strong>of</strong> previous<br />
deferred income tax (44) -<br />
Temporary investment allowance -<br />
(2)<br />
Income tax expense (104) 512<br />
Page 53 <strong>of</strong> 79
Deferred income tax<br />
2010 2010 2011 2010<br />
Balance<br />
Sheet<br />
Balance<br />
Sheet<br />
Income<br />
Statement<br />
Income<br />
Statement<br />
$,000 $,000 $,000 $,000<br />
Deferred ta x liabilities<br />
Receivables 19 74 ( 54) 67<br />
Accelerated depreciation for tax<br />
purposes -<br />
- -<br />
FBT Installment<br />
5 6 (2) -<br />
24<br />
80<br />
Deferred tax assets<br />
Receivables - -<br />
- -<br />
Accelerated depreciation for tax<br />
purposes 264 274<br />
9 12<br />
Payables 16<br />
17<br />
2 (11)<br />
Employee benefits<br />
197 158<br />
(39) (10)<br />
Borrowing costs -<br />
-<br />
- -<br />
Business related costs<br />
110 11 (99) 11<br />
Tax losses - -<br />
- -<br />
587 460<br />
Set-<strong>of</strong>f <strong>of</strong> deferred tax liabilities pursuant<br />
to the set-<strong>of</strong>f provisions (24) (80)<br />
Net deferred tax assets (liabilities) 563 380<br />
Deferred tax charge (183) 69<br />
11. Dividends<br />
2011 2010<br />
$’000 $’000<br />
Dividends payable/paid in the financial year 775 825<br />
In accordance with the Government Financial Policy, WA <strong>Port</strong>s are required to pay dividends <strong>of</strong><br />
65% <strong>of</strong> after tax pr<strong>of</strong>its for 2011 and 2010. However, in accordance with <strong>Australia</strong>n Accounting<br />
Standards, dividends relating to the financial results for the year ended 30 June 2011 have not been<br />
provided as they are expected to be declared by Government after balance date.<br />
A dividend <strong>of</strong> $775,450 in respect <strong>of</strong> the financial year results for the year ended 30 June 2010 is<br />
due<br />
and payable by 30 June 2012.<br />
Page 54 <strong>of</strong> 79
12. Cash & cash equivalents<br />
2011 2010<br />
$’000 $’000<br />
Bank balances<br />
3,660 1,244<br />
Call deposits - -<br />
Term deposits 1,000 2,500<br />
4,660 3,744<br />
The <strong>Authority</strong>’s exposure to interest rate risk and sensitivity analysis for financial assets<br />
liabilities are disclosed in note 23(i).<br />
and<br />
13. Trade and other receivables<br />
2011 2010<br />
$’000 $ ’000<br />
Current<br />
Receivables 1,153 1,013<br />
Less: allowance for impairment <strong>of</strong> receivables<br />
-<br />
1,153<br />
-<br />
1,013<br />
Accrued revenue<br />
50 238<br />
Prepayments<br />
578<br />
38<br />
1,781 1,289<br />
Non-Current<br />
Reconciliation <strong>of</strong> changes in the allowance for impairment <strong>of</strong> receivables:<br />
Balance at the beginning <strong>of</strong> the year<br />
- -<br />
Doubtful debts expense recognised in the Statement <strong>of</strong> Comprehensive<br />
Income<br />
- -<br />
Amounts written <strong>of</strong>f during the year<br />
- -<br />
B alance at the end <strong>of</strong> the year - -<br />
The <strong>Authority</strong> does not hold any collateral as security or other credit enhanceme nts to receivables.<br />
The <strong>Authority</strong> does not hold any financial assets that had to have their terms renegotiated that<br />
would have otherwise resulted in them being past due or impaired.<br />
As at 30 June, the ageing analysis <strong>of</strong> trade debtors past due but not impaired is as follows:<br />
Not more than 3 months 82 17<br />
More than 3 months but less than 6 months - -<br />
More than 6 months but less than 1 year - -<br />
Balance at the end <strong>of</strong> the year<br />
82 17<br />
Page 55 <strong>of</strong> 79
14. Property, plant and equipment<br />
2011 2010<br />
$’000 $’000<br />
L and<br />
At cost 1,291 1,291<br />
Buildings<br />
At cost 2,789 2,610<br />
Less: Accumulated Depreciation (664)<br />
2,125<br />
(610)<br />
2,000<br />
Improvements<br />
At cost 223 223<br />
Less: Accumulated Depreciation<br />
(107) (89)<br />
116 134<br />
Electronic equipment<br />
At cost<br />
234 232<br />
Less: Accumulated Depreciation (130) (94)<br />
104 138<br />
Plant & equipment<br />
At cost<br />
2,373 1,769<br />
Less: Accumulated Depreciation (1,277) (1,076)<br />
1,096 693<br />
Harbour facilities<br />
At cost 24,301 24,077<br />
Less: Accumulated Depreciation (4,505) (3,843)<br />
19,796 20,234<br />
Furniture & Fittings<br />
At cost 73 109<br />
Less: Accumulated Depreciatio n (27) (57)<br />
46 52<br />
Motor vehicles<br />
At cost 276 214<br />
Less: Accumulated Depreciation (120) (105)<br />
156<br />
109<br />
Navigation Aids<br />
At cost 417 417<br />
Less: Accumulated Depreciation (353) (328)<br />
64 89<br />
Page 56 <strong>of</strong> 79
Associated infrastructure<br />
At cost 2,274 2,104<br />
L ess: Accumulated Depreciation (1,171) (1,104)<br />
1,103 1,000<br />
Low Value Pool<br />
At cost 67 35<br />
Less: A ccumulated Depreciation<br />
(23) (7)<br />
44 28<br />
Total property, plant and equipment<br />
At cost 34,318 33,081<br />
Less: Accumulated Depreciation (8,377) (7,313)<br />
25,941 25,768<br />
Works In Progress 27 179<br />
Total property, plant and equipment 25,968 25,947<br />
Reconciliations <strong>of</strong> the carry amounts <strong>of</strong> property, plant and equipment at the beginning and end <strong>of</strong><br />
the reporting period are set out below:<br />
2011 2010<br />
$’000 $ ’000<br />
Land<br />
Carrying amount at 1 July<br />
Additions<br />
1,291<br />
-<br />
1,291<br />
-<br />
Disposals<br />
Impairment losses<br />
-<br />
-<br />
-<br />
-<br />
Carrying amount at 30 June 1,291 1,291<br />
Improvements<br />
Carrying amount at 1 July 134 144<br />
Transfer from work in progress<br />
0 8<br />
Depreciation for the year (18) (18)<br />
Disposals<br />
- -<br />
Impairment losses<br />
- -<br />
Carrying amount at 30 June<br />
116 134<br />
Page 57 <strong>of</strong> 79
14. Property, plant and equipment (continued)<br />
2011 2010<br />
$’000 $’000<br />
Buildings<br />
Carrying amount a t 1 July 2,000<br />
1,792<br />
Additions<br />
7<br />
264<br />
Transfer from work in progress<br />
188<br />
-<br />
Depreciation for the year (63) (56)<br />
Disposals<br />
(7) -<br />
Impairment losses<br />
- -<br />
Carrying amount at 30 June 2,125 2,000<br />
Plant and equipment<br />
Carrying amount at 1 July 693<br />
846<br />
Additions<br />
29<br />
69<br />
Transfer from work in progress<br />
586<br />
0<br />
Depreciation for the year<br />
(206) (192)<br />
Disposals (6) (30)<br />
Impairment losses<br />
- -<br />
Carrying amount at 30 June 1,096<br />
693<br />
Electronic Equipment<br />
Carryin g amount at 1 July 138 73<br />
Additions 10 103<br />
Transfer from work in progress<br />
- -<br />
Depreciatio n for the year (41) (37)<br />
Disposals (3) (1)<br />
Impairment losses - -<br />
Carrying amount at 30 June 104 138<br />
Harbour Facilities<br />
Carrying amount at 1 July 20,234 20,149<br />
Additions 3 734<br />
Transfer from work in progress 218 -<br />
Depreciation for the year (659) (649)<br />
Disposals - -<br />
Impairment losses - -<br />
Carrying amount at 30 June<br />
19,796 20,234<br />
Page 58 <strong>of</strong> 79
Furniture & Fittings<br />
Carrying amount at 1 July 52<br />
60<br />
Additions<br />
5<br />
13<br />
Transfer from work in progress<br />
- -<br />
Depreciation for the year (10)<br />
(8)<br />
Disposals<br />
(1)<br />
(13)<br />
Impairment losses 0 0<br />
Carrying amount at 30 June 46 52<br />
Motor Vehicles<br />
Carrying amount at 1 July 109 157<br />
Additions 114<br />
19<br />
Transfer from work in progress - -<br />
Depreciation for the year (43)<br />
(36)<br />
Disposals (24)<br />
(31)<br />
Impairment losses - -<br />
Carrying amount at 30 June 156 109<br />
Navigation Aids<br />
Carrying amount at 1 July<br />
Additions<br />
89<br />
1<br />
49<br />
75<br />
Depreciation for the year (26) (35)<br />
Disposals - -<br />
Impairment losses<br />
- -<br />
Carrying amount at 30 June 64 89<br />
Associated Infrastructure<br />
Carrying amount at 1 July 1,000 1,710<br />
Additions 102 81<br />
T ransfer from work in progress 66 -<br />
Depreciation for the year (65) (65)<br />
Disposals - (491)<br />
Prior period error adjustment - (235)<br />
Impairment losses - -<br />
Carrying amount at 30 June<br />
1,103 1,000<br />
Page 59 <strong>of</strong> 79
Low Value Pool<br />
Carrying amount at 1 July 28 -<br />
Additions 33 35<br />
Transfer from work in progress<br />
- -<br />
Depreciation for the year ( 17) (7)<br />
Disposals - -<br />
Impairment losses - -<br />
Carrying amount at 30 June 44 28<br />
Work in progress:<br />
Carrying amount at 1 July 179 536<br />
Additions 906 842<br />
Transfers to property, plant and equipment (1,058) (1, 199)<br />
Carrying amount at 30 June<br />
27 179<br />
Total property, plant and equipment 25,968 25,947<br />
Operating leases<br />
Carrying Amount at<br />
1 July 2010<br />
Repayments<br />
Carrying Amount at<br />
30 June 2011<br />
Plant & Motor<br />
equipment Vehicle<br />
$’000 $’000<br />
414 23<br />
(160) (13)<br />
254 10<br />
Finance leases<br />
Plant &<br />
equipment<br />
Buildings<br />
$’000 $’000<br />
Carrying Amount at<br />
1 July 2010<br />
36 82<br />
Repayments (17) (32)<br />
Carrying Amount at<br />
30 June 2011<br />
19 50<br />
Page 60 <strong>of</strong> 79
15. Intangible Assets<br />
2011 2010<br />
$’000 $’000<br />
Computer s<strong>of</strong>tware<br />
At cost 138 137<br />
Less: accu mulated depreciation (97) (84)<br />
41 53<br />
Reconciliation <strong>of</strong> carry ing amounts<br />
Computer s<strong>of</strong>tware<br />
Carrying amount at 1 July 53 35<br />
Additions 1 29<br />
Disposals<br />
Amortisation expense<br />
-<br />
(13)<br />
-<br />
(11)<br />
Carrying amount at 30 June 41 53<br />
16. Trade and other payables<br />
2011 2010<br />
$’000 $’000<br />
Current<br />
Trade payables 362 511<br />
Accrued expenses<br />
384 325<br />
746 836<br />
The <strong>Authority</strong>’s exposure to liquidity risk related<br />
22(i)<br />
to trade and other payables is disclosed in note<br />
Page 61 <strong>of</strong> 79
17. Interest bearing borrowings<br />
This note provides information about the contractual terms <strong>of</strong> the <strong>Authority</strong>’s interest bearing<br />
borrowings, which are measured at amortised cost. For more information about the authority’s<br />
exposure to interest rate liquidity risk, see note 23(i).<br />
2011 2010<br />
$’000 $ ’000<br />
C urrent liabilities<br />
Direct borrowings 498 470<br />
Current portion <strong>of</strong> finance lease liabilities (secured) (a)<br />
50<br />
548<br />
49<br />
519<br />
Non-current liabilities<br />
Direct borrowings 11,665 10,090<br />
Non-current portion <strong>of</strong> finance lease liabilities (secured) (a) 19 69<br />
11,684 10,159<br />
Lease liabilities are effectively secured as the rights to leased assets reverse to the lessor in the<br />
event <strong>of</strong> default.<br />
Significant terms and conditions<br />
Direct borrowings comprise <strong>of</strong> two loans at fixed interest rates from WA Treasury Corpo ration and<br />
a re repayable in accordance with a fixed repayment schedule. A loan for $11.32m with fixed<br />
monthly principal and interest repayments that will result in the loan being fully settled in February<br />
2025. The effec tive interest rate on the loan is 5.98% A loan for $2.073m with fixed monthly<br />
principal and interest repayments that will result in the loan being fully settled in July 2026. The<br />
effective interest rate on the loan is 5.78%.<br />
Interest rate risk exposure<br />
The <strong>Authority</strong>’s exposure to interest rate risk on the interest bearing borrowings and the effective<br />
weighted average interest rate at year end by maturity periods is set out in the following table.<br />
2011 Fixed interest rate<br />
Interest bearing<br />
borrowings<br />
1 year<br />
or<br />
less<br />
Over<br />
1 to 2<br />
years<br />
Over<br />
2 to 3<br />
years<br />
Over<br />
3 to 4<br />
years<br />
Over<br />
4 to 5<br />
years<br />
More<br />
than 5<br />
years<br />
Total<br />
($'000) ($'000) ($'000) ($'000) ($'000) ($'000) ($'000)<br />
Direct borrowings 498 528 559 695 758 9,125 12,163<br />
Finance lease<br />
liabilities<br />
50 19 - - - - 69<br />
548 547 559 695 758 9,125 12,232<br />
Weighted average interest rate:<br />
Direct borrowings 5.8%<br />
Finance leases and liabilities 9.2%<br />
Page 62 <strong>of</strong> 79
2010 Fixed interest rate<br />
1 year<br />
or<br />
Over 1<br />
to 2<br />
Over2<br />
to 3<br />
Over 3<br />
to 4<br />
Over 4<br />
to 5<br />
More<br />
than 5<br />
Interest bearing<br />
borrowings<br />
less years years years years years<br />
Total<br />
($'000) ($'000) ($'000) ($'000) ($'000) ($'000) ($'000)<br />
D irect borrowings 470 498 528 559 593 7,912 10,560<br />
Finance lease<br />
liabilities<br />
53 51 14 - - - 118<br />
523 549 542 559 593 7,912 10,678<br />
Weighted average interest rate:<br />
Direct borrowings 5.6%<br />
Finance leases and liabilities 9.2%<br />
18. Provisions<br />
2011<br />
$’000<br />
2010<br />
$’000<br />
Current<br />
Annual leave<br />
345 288<br />
Sick leave 86 63<br />
Time in lieu 6 14<br />
Accrued days <strong>of</strong>f 16 16<br />
Long service leave 53 27<br />
Fringe benefits tax 15 (4)<br />
Dividend<br />
775 -<br />
Income tax<br />
(21) (68)<br />
1,275 336<br />
Non-Current<br />
Long service leave 135 122<br />
135 122<br />
Annual leave liabilities have be en classified as current a s there is no unconditional right to defer<br />
settlement for at least 12 month s after balance sheet date. Assessments indicate that actual<br />
settlement <strong>of</strong> the liabilities will occur as follows:<br />
2011 2010<br />
$ ’000 $’000<br />
Within 12 months <strong>of</strong> balance date<br />
253 215<br />
More than 12 months after balance sheet date 92 73<br />
345 288<br />
Page 63 <strong>of</strong> 79
Sick leave liabilities have been classified current as there is no unconditional right to defer<br />
settlement for at least 12 months after balance sheet date. Assessments indicate that actual<br />
settlement <strong>of</strong> the liabilities will occur as fol lows:<br />
2011 2010<br />
$ ’000 $’000<br />
Within 12 months <strong>of</strong> balance dat e 70<br />
40<br />
More than 12 months after balance sheet date 16 86<br />
23<br />
63<br />
Time in lieu liabilities have been classified as current as there is no unconditional right to defer<br />
settlement for at least 12 months after balance sheet date. Assessments indicate that actual<br />
settlement <strong>of</strong> the liabilities will occur as follows:<br />
2011 2010<br />
$’000 $’000<br />
Within 12 months <strong>of</strong> balance date<br />
More than 12 months after balance sheet date<br />
6<br />
-<br />
14<br />
-<br />
6 14<br />
Accrued days <strong>of</strong>f liabilities have been classified as current as there is no unconditional right to defer<br />
settlement for at least 12 months after balance sheet date. Assessments indicate that actual<br />
settlement <strong>of</strong> the liabilities will occur as follows:<br />
2011 2010<br />
$’000 $’000<br />
Within 12 months <strong>of</strong> balance date<br />
More than 12 months after balance sheet date<br />
16<br />
-<br />
16<br />
-<br />
16 16<br />
The settlement <strong>of</strong> long service leave liabilities gives rise to the payment <strong>of</strong> employment on-costs<br />
including workers compensation premiums and payroll tax. The provision is measured at the<br />
present value <strong>of</strong> expected future payments.<br />
2011 2010<br />
$’000 $’000<br />
Within 12 months <strong>of</strong> balance date<br />
53 27<br />
M ore than 12 months after balance sheet date 135 122<br />
188 149<br />
Page 64 <strong>of</strong> 79
2011<br />
$’000<br />
Annual leave provision<br />
Carrying amount at 1 July<br />
288<br />
Provisions made during the year<br />
332<br />
A mounts utilised in the year (275)<br />
Carrying amount at 30 June<br />
345<br />
19. Other liabilities<br />
2011 2010<br />
$’000 $’000<br />
Current<br />
Prepaid lease and license income<br />
187<br />
100<br />
Unallocated wages<br />
72<br />
259<br />
94<br />
194<br />
Page 65 <strong>of</strong> 79
20. Equity<br />
Contributed equity<br />
Balance at the start <strong>of</strong> the year<br />
Capital contributions<br />
Balance at the end <strong>of</strong> the year<br />
2011 2010<br />
$’000 $’000<br />
17,136<br />
-<br />
17,136<br />
-<br />
17,136 17,136<br />
Retained earnings<br />
Balance at start <strong>of</strong> year 2,111 1,978<br />
Pr<strong>of</strong>it for the period (106) 1,193<br />
Prior peri od error adjustment - (235)<br />
Dividends declared (775) (825)<br />
Balance at end <strong>of</strong> year 1,230 2,111<br />
Correction <strong>of</strong> Prior Period Errors<br />
During the year, the <strong>Authority</strong> identified an error in capitalized assets for associated infrastructure.<br />
Costs to move and update a water main located on <strong>Port</strong> property were capitalized during the<br />
2009/10 financial year. The <strong>Authority</strong> reevaluated the asset and decided that the costs were not<br />
eligible for capitalization as the underlying asset was not the <strong>Authority</strong>’s property. The prior period<br />
comparative numbers have been adjusted accordingly where<br />
material to the presentation <strong>of</strong> the<br />
financial statements.<br />
As the error was made in a financial year prior to the comparative year, the Statement <strong>of</strong> Financial<br />
Position opening balance as at 1 July 2009 were restated as follows:<br />
Property plant and equipment decreased by $235,524 to de-recognise the previously recognised<br />
water main from infrastructure assets. This decrease to property, plant and equipment was made up<br />
<strong>of</strong> the following:<br />
• Infrastructure assets by $243,890<br />
• Accumulated depreciation on the buildings by $8,366<br />
• Retained earnings were increased by $235,524<br />
In addition, this error resulted in restatement <strong>of</strong> the following line items for the year ending 30 June<br />
2011:<br />
• Property, plant and equipment decreased by $243,890<br />
• Retained earnings decreased by $243,890<br />
• Accumulated Depreciation on infrastructure assets increased by $8,366 and<br />
• Retained earnings decreased by $8,366<br />
Page 66 <strong>of</strong> 79
Correction <strong>of</strong> Prior Period Errors (Continue)<br />
Finance Report Line<br />
Item/Balance Affected<br />
Note<br />
Actual<br />
2011<br />
$’000<br />
Correction<br />
$’000<br />
Corre<br />
cted<br />
Actual<br />
2011<br />
$ ’000<br />
Balance Sheet Extract<br />
Non-Current Assets<br />
Property, Plant and 14 26,203 (235) 25,968<br />
Equipment<br />
Total Non-current assets 26,807 (235) 26,572<br />
Total Assets 33,248 (235) 33,013<br />
Net Assets 18,601 (235) 18,366<br />
Statement <strong>of</strong> Changes in<br />
Equity Extract<br />
Retained Earnings<br />
Opening Balance 19,114 - 19,114<br />
Net effect <strong>of</strong> Correction <strong>of</strong> an<br />
Error<br />
Total Income and Expense<br />
recognised directly in<br />
Equity for the period<br />
- (235) (235)<br />
368 - 368<br />
Closing Balance 19,482 (235) 19,247<br />
Page 67 <strong>of</strong> 79
21. Reconciliation <strong>of</strong> cash flows from operating activities<br />
2011 2010<br />
$’000 $ ’000<br />
Cash flows from operating activities<br />
Pr<strong>of</strong>it/(Loss) for the period (106) 1,193<br />
Depreciation<br />
1,148 1,149<br />
Deferred tax provision (41) 69<br />
Amortisation <strong>of</strong> intangi ble assets 13 12<br />
Write-<strong>of</strong>fs<br />
- 1<br />
(Gain)/loss on sale <strong>of</strong> property, plant and equipment 17 76<br />
Operating pr<strong>of</strong>it before changes in working capital and p rovisions 1,031 2,500<br />
Changes in assets and liabilities<br />
Change in trade and other receivables (141) 575<br />
Chan ge in prepayments (540) 41<br />
Change in accrued income<br />
189 (226)<br />
Change in trade and other payables (112) (200)<br />
Change in prepaid income 87 (325)<br />
Change in e mployee benefits 130 32<br />
Change in provisions<br />
68 (427)<br />
Change in income tax benefit (163) -<br />
Net cash from operating activities<br />
549 1,970<br />
Page 68 <strong>of</strong> 79
22. Financial instruments<br />
(i) Financial risk management objectives and policies<br />
The <strong>Authority</strong>’s principal financial instruments comprise cash and cash equivalents,<br />
receivables, payables, interest bearing borrowings and finance leases. The <strong>Authority</strong> has<br />
limited exposure to financial risks. The <strong>Authority</strong>’s overall risk management program focuses<br />
on managing the risks identified below.<br />
The fair values and carrying amounts <strong>of</strong> various financial instruments recognised at reporting<br />
date are as follows:<br />
Notes 2011 2011 2010 2010<br />
$’000 $’000 $’000 $’000<br />
Carrying<br />
Amounts<br />
Fair<br />
Values<br />
Carrying<br />
Amounts<br />
Fair<br />
Values<br />
Cash and cash equivalents<br />
Trade and other receivables<br />
Trade and other payables<br />
Loans and borrowings<br />
12 4,660 4,660 3,744 3,744<br />
13 1,781 1,781 1,013 1,013<br />
17 (746) (746) (836) (836)<br />
18 (12,232) (11,224) (10,678) (11,225)<br />
(6,537) (5,529) (6,757) (7,304)<br />
Note:<br />
The carrying amounts <strong>of</strong> cash and equivalents, receivables and trade and other payables are a<br />
reasonable approximation <strong>of</strong> their fair values on account <strong>of</strong> their short maturity cycle.<br />
The fair value <strong>of</strong> loans and borrowings are estimated by discounting<br />
the future expected cash flows<br />
applying the current Government yield curve at reporting date plus an adjustment for the BrPA's<br />
credit spread (i.e. 0.31% to 2.20%). BrPA does not expect prepayments <strong>of</strong> those loans and<br />
borrowings.<br />
Market risk<br />
Market risk is the changes in market prices such as foreign exchange rates and interest rates that<br />
will affect the <strong>Authority</strong>’s income or the value <strong>of</strong> its holdings <strong>of</strong> financial instruments. The <strong>Authority</strong><br />
does not trade in foreign currency and is not materially exposed to other price risks.<br />
The <strong>Authority</strong>’s exposure to market risk as a result <strong>of</strong> changes in interest rates, relates primarily to<br />
its long term debt obligations. The <strong>Authority</strong>’s borrowings are all obtained through the <strong>Western</strong><br />
<strong>Australia</strong>n Treasury Corporation (WATC) and are at fixed rates with varying maturities. The risk is<br />
managed by WATC through portfolio diversification and variation in maturity dates. Other than as<br />
detailed in the interest rate sensitivity analysis in the table below, the <strong>Authority</strong> has limited exposure<br />
to interest rate risk because it has no borrowings other than WATC borrowings and finance leases<br />
(fixed interest rate).<br />
Page 69 <strong>of</strong> 79
At balance sheet date, if interest rates had moved as illustrated in the table below, with all the other<br />
variables held constant, the effect would be as follows:<br />
Interest Rate Risk<br />
Interest Rate Risk<br />
+25 basis points +50 basis points -25 Basis points -50 Basis points<br />
2011<br />
Financ ial Assets<br />
Cash & cash<br />
equivalents<br />
Total Increase/<br />
(Decrease)<br />
Carrying<br />
Amount<br />
Pr<strong>of</strong>it Equity Pr<strong>of</strong>it Equity Pr<strong>of</strong>it Equity Pr<strong>of</strong>it Equity<br />
($'000) ($'000) ($'000) ($'000) ($'000) ($’000) ($’000) ($’000) ($’000)<br />
4,660 12 12 23 23 (12) (12) ( 23) (23)<br />
12 12 23 23 (12) (12) ( 23) (23)<br />
2010<br />
Financial Assets<br />
Cash & cash<br />
equivalents<br />
Total<br />
Increase/(Decrease)<br />
3,744 9 9 19 19 (9) (9) (19) (19)<br />
9 9 19 19 (9) (9) ( 19) (19)<br />
The weighted average inertest rate for each category <strong>of</strong> financial instrument<br />
is as follows:<br />
2011<br />
Financial Assets<br />
& Liabilities<br />
Cash & cash<br />
equivalents<br />
Trade and other<br />
receivables<br />
Interest bearing<br />
borrowings<br />
Finance leases<br />
Trade and other<br />
payables<br />
Net Financial<br />
Assets/(Liabilities)<br />
Within one year<br />
Weighted<br />
Average Interest<br />
Rate<br />
Fixed<br />
Interest Rate<br />
Floating<br />
Interest<br />
rate<br />
Non Interest<br />
Bearing<br />
Total<br />
$’000 $’000 $’000<br />
5.22% 4,660 4,660<br />
1,781 1,781<br />
5.82% (12,163) (12,163)<br />
9.23% (69) (69)<br />
(746) (746)<br />
(12,232) 4,660 1,035 (6,537)<br />
Page 70 <strong>of</strong> 79
2010<br />
Financial Assets<br />
& Liabilities<br />
Cash & cash<br />
equivalents<br />
Trade and other<br />
receivables<br />
Interst bearing<br />
borrowings<br />
Finance leases<br />
Trade and other<br />
payables<br />
Net Financial<br />
Assets/(Liabilities)<br />
Within one year<br />
Weighted<br />
Average Interest<br />
Rate<br />
Fixed<br />
Interest Rate<br />
Floating<br />
Interest<br />
rate<br />
Non Interest<br />
Bearing<br />
Total<br />
$ ’000 $’ 000 $’000<br />
3. 95% 3, 744 3,744<br />
1,288 1,288<br />
5.57% (10,560) (10,560)<br />
9.17% (118) (118)<br />
(836) (836)<br />
(10,678) 3,744 452 (6,482)<br />
Credit risk<br />
Credit risk arises when there is t he possib ility <strong>of</strong> the Author ity’s receivables defaulting on their<br />
obligations resulting in financial loss to the <strong>Authority</strong>. The <strong>Authority</strong> measures credit risk on a fair<br />
value basis and monitors risk on a regular basis. With respect to credit risk arising from cash and<br />
cash equivalents, the <strong>Authority</strong>’s exposure to credit risk arises with the default <strong>of</strong> the counter party,<br />
with a maximum exposure equal to the carrying amount <strong>of</strong> the cash and cash equivalents.<br />
The <strong>Authority</strong> operates predominantly within the shippin g industry and accordingly is e xposed to<br />
risks affecting that industry.<br />
The maximum exposure to cre dit risk at balance date in relation to each<br />
class <strong>of</strong> recognised fin<br />
ancial assets is the gross carrying amount <strong>of</strong> those assets inclusive <strong>of</strong> any<br />
provisions for impairment, as shown in the table at Note 23(ii).<br />
The <strong>Authority</strong> follows stringent credit control and management procedures in revi ewing and<br />
monitoring debtor accounts and outstanding balances as evidenced by the historical aged debtor<br />
balances. In addition, management <strong>of</strong> receivables includes frequent monitoring, t hereby minimising<br />
the <strong>Authority</strong>’s exposure to bad debts. For financial assets that are past due or impaired, refer t o<br />
note 13 ‘Trade and other receivables’.<br />
The <strong>Authority</strong>’s credit risk manage ment is further supported by rental agreements and se ctions 116<br />
and 117 <strong>of</strong> the <strong>Port</strong> <strong>Authority</strong>’s Act 1999. Section 116 refers to the liability to pa y port charges in<br />
respect <strong>of</strong> vessels and Section117 refers to the liability to pay port charges in respect <strong>of</strong> goods.<br />
<strong>Port</strong><br />
charges are defined in Section 115.<br />
Liquidity risk<br />
The <strong>Authority</strong>’s objective is to maintain a balance between<br />
continuity <strong>of</strong> funding and flexibility<br />
through the use <strong>of</strong> cash and cash reserves and its borrowing facilities. The <strong>Authority</strong> manages its<br />
exposure to liquidity risk by ensuring that appropriate procedures are in place to manage cash<br />
flows, including forecast cash flows, to ensure sufficient funds are available to meet its<br />
commitments.<br />
Page 71 <strong>of</strong> 79
The table below reflects the contractual maturity <strong>of</strong> financial liabilities. The contractual maturity<br />
amounts are representative <strong>of</strong> the undis counted amounts at the balance sheet date. The table<br />
includes both interest and principle cash flows. An adjustment has been made where adjudged to<br />
be material.<br />
Carrying Up to 1<br />
1-3 3-12<br />
1-5<br />
Financial liabilities<br />
>5 years<br />
amount month months months<br />
years<br />
2011 ( $'000) ($'000) ($'000) ( $'000) ($'000) ($'000)<br />
Trade payables & accruals (746) (587) (159) - - -<br />
Finance lease li ability (73) (4) (9) (41) (19) -<br />
Borrowings (17,960) (100) (201) (904) (5,162) (11,593)<br />
(18,779) (691) (369) (945) (5,181) (11,593)<br />
Financial liabilities<br />
2010<br />
Carrying Up to 1<br />
1-3 3-12<br />
1-5<br />
>5 years<br />
amount month months months years<br />
($'000) ($'000) ($'000) ($'000) ($'000) ($'000)<br />
Trade payables & accruals (836) (629) (207) -<br />
- -<br />
Finance lease liability (131) (8) (9) (41) (73) -<br />
Borrowings (15,918) (90) (181) (814) (4,341) (10,492)<br />
(16,885) (727) (397) (855) (4,414) (10,492)<br />
The risk implied from the values shown in the table below reflects a balanced view <strong>of</strong> cash inflows<br />
and outflows. Leasing obligations, trade payables and other financial liabilities mainly originate from<br />
the financing <strong>of</strong> assets used in the ongoing operations such as property, plant and equipment and<br />
investments in working capital e.g. inventories and trade receivables. These assets are considered<br />
in the <strong>Authority</strong>’s overall liquidity risk.<br />
Risks associated with the liability on borrowings are reduced by the <strong>Authority</strong> paying a guarantee<br />
charge. This charge guarantees payment to the WATC by the Government for outstanding<br />
borrowings in case <strong>of</strong> default.<br />
Financial assets<br />
Carrying<br />
amount<br />
Up to 1<br />
month<br />
1-3<br />
months<br />
3-12<br />
months<br />
1-5<br />
years<br />
>5 years<br />
2011 ($'000) ($'000) ($'000) ($'000) ($'000) ($'000)<br />
Cash and cash equivalents 4,660<br />
4,660 - - - -<br />
Trade and other receivables 1,153 1,153 - - - -<br />
5,813 5,813 - - - -<br />
Financial liabilities<br />
Carrying Up to 1 1-3 3-12 1-5 >5 years<br />
amount month months months years<br />
2011 ($'000) ($'000) ($'000) ($'000) ($'000) ($'000)<br />
Trade payables & accruals (746) (587) (159) - - -<br />
Finance lease liability (73) (4) (9) (41) (19) -<br />
Borrowings– interest only (17,960) (100) (201) (904) (5,162) (11,593)<br />
(18,779) (691) (369) (945) (5,181) (11,593)<br />
Page 72 <strong>of</strong> 79
Net Maturity (12,966) 5,122 (369) (945) (5,181) (11,593)<br />
Financial assets<br />
Carrying Up to 1 1-3 3-12 1-5<br />
amount month months months years<br />
>5 years<br />
2010 ($'000) ($'000) ($'000) ($'000) ($'000) ($'000)<br />
Cash and cash equivalents<br />
3,744 3,744 - - - -<br />
Trade and other receivables<br />
1,013 1,013 - - - -<br />
4 ,757 4,757 - - - -<br />
Financial liabilities<br />
Carrying<br />
amount<br />
Up to 1<br />
1-3 3-12<br />
month<br />
months<br />
months<br />
1-5<br />
years<br />
>5 years<br />
2010 ($'000) ($' 000) ($'000) ($'000) ($'000) ($'000)<br />
Trade payables & accruals (836) (629) (207) - - -<br />
Finance lease liability (131) (8) (9) (41) (73) -<br />
Borrowings-interest only (15,918) (90) (181) (814) (4,341) ( 10,492)<br />
(16,885) ( 727) (397) (855) (4,414) (10,492)<br />
Net maturity (12,128) 4,030 (397) (855) (4,414) (10,492)<br />
(ii) Categories <strong>of</strong> financial instruments<br />
Set out below are the carrying amounts <strong>of</strong> the <strong>Authority</strong>’s financial instruments. The<br />
Directors consider the carrying amounts <strong>of</strong> the financial instruments represent their net<br />
fair values.<br />
Financial assets<br />
2011 2010<br />
$’000 $’000<br />
Cash and cash equivalents<br />
4,660 3,744<br />
T rade and other receivable<br />
s 1,781 1,013<br />
6,441 4,757<br />
Financial liabilitie s<br />
Trade and other pa yables 746 836<br />
Interest bearing borrowings -<br />
-<br />
Obligations under finance leases 69 118<br />
Fixed rate borrowings 12,163 10,560<br />
12,978 11,514<br />
The carrying amount, by ma turity, <strong>of</strong> the interest bearing borrowin gs that are exposed<br />
to interest risk are disclose d in note 18.<br />
(iii)<br />
Fair values<br />
All financial assets and liabilities recognised in the Statement <strong>of</strong> Financial Position,<br />
whether they are carried at cost or fair value, are recognised at amounts that represent<br />
a reasonable approximation <strong>of</strong> fair value otherwise<br />
stated in the applicable notes.<br />
Page 73 <strong>of</strong> 79
23. Commitments<br />
(i) Capital expenditure commitments<br />
Capital expenditure commitments, bein g contracte d capital expenditure additional to<br />
the amounts reported in th e financial state ments, ar e p ayable as follows:<br />
2011 2010<br />
$’000 $’000<br />
Within one year<br />
- 54<br />
(ii) Lease commitments<br />
Commitments in relation to leases contracted for a t the balan ce sheet da<br />
te but not<br />
recognised in the financial statements as liabilities, are payable as follows:<br />
2011 2010<br />
$’000 $’000<br />
Within one year<br />
169 160<br />
Later than one year but not later than five years 95 254<br />
Later than 5 years - -<br />
264 414<br />
R epresenting:<br />
Non-cancellable operating leases<br />
264 414<br />
(iii) Finance lease commitments<br />
2011 2010<br />
$ ’000 $ ’000<br />
Minimum lease payment commitments in relation to<br />
finance leases are payable as follows:<br />
Within one year 54 58<br />
Later than one year but not later than five years<br />
19<br />
73<br />
Later than 5 years<br />
-<br />
-<br />
Minimum lease payments 73 131<br />
Less: future finance charges (4) (13)<br />
69 118<br />
Page 74 <strong>of</strong> 79
The present value <strong>of</strong> finance leases payable is as follows:<br />
Within one year: 53 56<br />
Later than one year but not later than five years 19 69<br />
Later than 5 years - -<br />
Present value <strong>of</strong> lease liabilities 72<br />
125<br />
In cluded in the financial statements as:<br />
Current (note 18)<br />
50 49<br />
N on-current (note 18) 18 69<br />
68<br />
118<br />
Finance leases payable are in respect <strong>of</strong> <strong>of</strong>fice accommodation, motor vehicles and<br />
other plant<br />
(iv) Non-cancellable operating lease commitments<br />
Commitments for minimum lease payments are payable<br />
as follows:<br />
Within one year:<br />
169 160<br />
Later than one year but not later than five years<br />
Later than 5 years<br />
95<br />
-<br />
254<br />
-<br />
264<br />
414<br />
(v) Operating leases receivable<br />
Future minimum rentals receivable for operating leases at<br />
reporting date:<br />
Within one year:<br />
1,365 1,143<br />
Later than one year but not later than five years 5,460 4,572<br />
6,825 5,715<br />
Many leases that extend beyond 5 years include an option to rene w and consequently,<br />
rentals receivable beyond 5 years have not been provided.<br />
Operating leases receivable are in respect<br />
<strong>of</strong> property rentals.<br />
Page 75 <strong>of</strong> 79
24. Remuneration <strong>of</strong> Auditors<br />
Remuneration payable to the Auditor General in respect to the audit for the current financial year is<br />
as follows:<br />
2011 2010<br />
$’000 $’000<br />
Auditing the accounts and financial statements<br />
27 27<br />
25. Related Parties<br />
Directors<br />
The names <strong>of</strong> persons who were Directors <strong>of</strong> <strong>Broome</strong> <strong>Port</strong> <strong>Authority</strong> at any time during the financial<br />
year are as follows:<br />
L. Shervington , I. Burston, G. Morris, M. Gamble, K. Male and D. Albert.<br />
There have been no material related parties’ transactions.<br />
26. Contingent liabilities<br />
There are no contingent liabilities.<br />
27. Events occurring after the balance sheet date<br />
There are no events, either favourable or unfavourable that have occurred between the reporting<br />
date and the d ate when the financial report was authorised for issue.<br />
Page 76 <strong>of</strong> 79
Directors’ declaration<br />
In the opinion <strong>of</strong> the directors <strong>of</strong> <strong>Broome</strong> <strong>Port</strong> <strong>Authority</strong>:<br />
( a) the financial statements and notes, set out on pages 36 to 76 are in accordance with the<br />
financial reporting provisions <strong>of</strong> the <strong>Port</strong> Authorities Act 1999, including:<br />
(i) giving a true and fair view <strong>of</strong> the <strong>Authority</strong>’s financial position as at 30 June 2010 and<br />
its performance, for the financial year ended on that date; and<br />
(ii) complying with <strong>Australia</strong>n Accounting Standards (including the <strong>Australia</strong>n Accounting<br />
Interpretations) and the <strong>Port</strong> Authorities Act 1999;<br />
(b)<br />
there<br />
when<br />
are reasonable grounds to believe that the <strong>Authority</strong> will be able to pay its debts as and<br />
they become due and payable.<br />
Signed in accordance with a resolution <strong>of</strong> the directors:<br />
Mr Kim Male<br />
Deputy Chairman<br />
Date: 15 September 2011<br />
Page 77 <strong>of</strong> 79
Page 78 <strong>of</strong> 79
Page 79 <strong>of</strong> 79