Annual Report 2010 - Parliament of Western Australia
Annual Report 2010 - Parliament of Western Australia
Annual Report 2010 - Parliament of Western Australia

Create successful ePaper yourself
Turn your PDF publications into a flip-book with our unique Google optimized e-Paper software.
::_.V16-5.2-a/yefiX52.-2-e6-.e.e,(7:670/Si_Frag<br />
NCN<br />
e:+/726Zern:::,-<br />
"<br />
_<br />
c';:$<br />
Luning DJ lib<br />
-4n41 ,1P<br />
L=<br />
/nu<br />
IsW.<br />
p -I<br />
Pr' ifeRr 410<br />
L,<br />
/<br />
, It;<br />
1171112.6.<br />
I- -I-<br />
-_ 7<br />
-.atlas<br />
a<br />
sffiTs<br />
-<br />
c<br />
imr-=3--<br />
- - - -<br />
-<br />
<strong>Annual</strong> <strong>Report</strong> <strong>2010</strong>
2009–<strong>2010</strong> Highlights<br />
Operational Highlights<br />
Total Port trade<br />
More than 11.266 million tonnes – a record<br />
Total Port exports<br />
More than 10.895 million tonnes – a record<br />
Total iron ore exports<br />
More than 9.211 million tonnes – a record<br />
Total Port imports<br />
371,721 tonnes<br />
Number <strong>of</strong> ships to berth<br />
205<br />
Gross tonnages <strong>of</strong> vessels<br />
7,886,877 tonnes – a record<br />
Financial Highlights<br />
Revenue<br />
More than $41.84 million<br />
Expenditure<br />
More than $42.6 million<br />
Operating loss<br />
$0.761 million before tax<br />
Capital expenditure<br />
More than $16.99 million<br />
Purchases in the Goldfields Esperance Region<br />
More than $12.63 million<br />
Employee benefits<br />
More than $11.69 million<br />
Front cover images:<br />
Bottom: MCP Linz prepares to sail from<br />
Esperance with a cargo <strong>of</strong> containerised<br />
nickel concentrates for Canada.<br />
Top: Maintenance work being carried out<br />
on the Berth Two shiploader.<br />
I<br />
d 3<br />
_<br />
61.4-411010§<br />
-44tc:--s-tAtr7;--<br />
sr -<br />
IA, -<br />
4<br />
atre:Bet<br />
_1; ,`" -44:"tie4fierl. - -<br />
_<br />
_<br />
-
-<br />
Contents<br />
Chairman’s <strong>Report</strong>......................................2<br />
CEO’s <strong>Report</strong>.............................................4<br />
Corporate Governance................................6<br />
Directors & Port Executives.........................7<br />
Directors’ <strong>Report</strong>........................................8<br />
Regulatory Requirements..........................11<br />
Finance....................................................12<br />
Business Development..............................14<br />
Engineering <strong>Report</strong>...................................16<br />
Trade.......................................................18<br />
Performance Indicators.............................20<br />
Shipping..................................................22<br />
Environmental Management......................24<br />
Corporate Relations..................................26<br />
Human Resources....................................28<br />
Financial Statements.................................31<br />
Directors’ Declaration...............................64<br />
Auditor’s Declaration.................................65<br />
Contacts<br />
Postal Address<br />
PO Box 35<br />
Esperance WA 6450<br />
-<br />
11W*75" VV*7-02<br />
it<br />
r gral<br />
ORVIMI<br />
it2<br />
_<br />
--<br />
A<br />
Street Address<br />
The Esplanade<br />
Esperance WA 6450<br />
Telephone<br />
(08) 9072 3333<br />
Facsimile<br />
(08) 9071 1312<br />
Email<br />
admin@epsl.com.au<br />
Web Page<br />
www.epsl.com.au<br />
tgef.P.'-c-rareir*St-re r*.git.1141SiSeit<br />
WOrtirri"<br />
- .<br />
47-.24Prac .2.4prac-- tr---"Ir-a-AcTdd3Z<br />
4-11eFtt`-÷ar---E-41:a_C-c<br />
= j<br />
s<br />
7._<br />
-as<br />
1
fnfliKincria ra. 41- 6.7 /71 tiff-7:17.; lizrasffirws.,(4<br />
ifeW/PWrirftri.r. tew1194tWWfigerffiVegloV,474(4',#4.
II<br />
11 4<br />
10.4,<br />
eirafftlafraftrff. arics/W e, fla<br />
"0110W4triatraneenr lit9eV n7/476<br />
The Federal Government has committed $60 million to the upgrade<br />
<strong>of</strong> the transport corridor and a similar fi gure has been placed in<br />
the forward estimates by the State Government. Design work has<br />
started on the project, and the local community has been kept<br />
informed <strong>of</strong> the project’s progress.<br />
The Board is <strong>of</strong> the view that the corridor upgrade is essential for<br />
the community, the future growth <strong>of</strong> the Port and the Esperance<br />
Region.<br />
Following the appointment <strong>of</strong> the new Chief Executive, the Board<br />
<strong>of</strong> Directors approved the restructure <strong>of</strong> the organisation during<br />
the year, with the appointment <strong>of</strong> General Managers for the areas<br />
<strong>of</strong> Commerce and Operations. These positions provide essential<br />
management support to the Chief Executive Offi cer and leadership<br />
to Port employees.<br />
Employee numbers increased during the year from 101 to 109<br />
following a recruitment drive to replace those who had left the Port<br />
during the previous 12 months. This enables the Port to prepare for<br />
increased trade next fi nancial year.<br />
The Board is very conscious <strong>of</strong> its responsibility and commitment to<br />
providing a safe workplace for its employees and is working closely<br />
with the Executive <strong>of</strong> the Port to achieve signifi cant improvements<br />
in the safely performance and culture at the Port.<br />
An emergency response team has been established at the Port.<br />
This was carried out under the direction <strong>of</strong> the Department <strong>of</strong> Mines<br />
and Petroleum and addresses any emergencies for employees<br />
working at heights and in enclosed spaces.<br />
The Port continues to be a major employer in the Shire <strong>of</strong><br />
Esperance and the Board recognises the key role that the Port<br />
plays in the economic and social well being <strong>of</strong> the region.<br />
The Port continued to support the local community during the<br />
year with more than $74,000 being provided in sponsorships<br />
and donations. This included major sponsorship <strong>of</strong> the Clontarf<br />
Foundation’s South East Football Academy. Other benefi ciaries<br />
included the Bi-annual Kids Fun Day in the Port Park, Apex,<br />
Esperance Volunteer Fire and Rescue Service and Rotary’s annual<br />
Handicamp.<br />
Esperance Senior High School year nine students participated in a<br />
joint education program run by the Port, with about 250 students<br />
visiting the Port to look at environmental issues, management<br />
.,4Assa tsz1/4Nav,1/4\sk1/4\n\bc\<br />
*ANSI YZNlatel%ti.:\<br />
structures, health and safety procedures and industrial relation<br />
matters. This program has been running now for four years.<br />
Finally, I would like to take the opportunity to thank my fellow Board<br />
members for their support during the past 12 months, and to<br />
acknowledge the Esperance Ports’ dedicated and conscientious<br />
employees for their efforts in what was a diffi cult year.<br />
I would also like to formally acknowledge the contribution <strong>of</strong> the<br />
previous Chairman Jim Matijasevich who led the Port ably through<br />
a diffi cult period.<br />
I am sure that in <strong>2010</strong>–11 Esperance Ports Sea and Land will<br />
continue to work with and regain the confi dence <strong>of</strong> the local<br />
community, and will continue to provide the highest standard <strong>of</strong><br />
service to current and future customers.<br />
,___,..(----.J-__<br />
,__,..(----.J-__<br />
Tim Shanahan<br />
Acting Chairman<br />
Aerial view <strong>of</strong> the Esperance Port.<br />
tseastwAvse;i01/4kk,<br />
%ChAs1/44-WaVAM1016Z1/4/kW-aira<br />
3
CEO’s <strong>Report</strong><br />
The 2009–10 fi nancial year was a challenging one for Esperance<br />
Ports Sea and Land with a signifi cant increase in trade,<br />
infrastructure upgrades, an increase in maintenance requirements,<br />
and the fi nalising <strong>of</strong> the matters relating to the handling <strong>of</strong> lead<br />
carbonate at the Port. Negotiations with potential new clients also<br />
either continued during the year or, in some cases, commenced.<br />
Pleasingly, trade increased by 13.2 percent from more than 9.94<br />
million tonnes the previous year to more than 11.266 million tonnes.<br />
This was the fi rst time more than 10 million tonnes <strong>of</strong> cargo had<br />
been handled by the Port.<br />
The overall improved trading performance resulted in an improved<br />
fi nancial position at the end <strong>of</strong> the 2009–10 year, although a trading<br />
loss <strong>of</strong> $0.761 million was recorded. This is an improvement on the<br />
previous year’s $3.069 million loss, with the overall trade outlook<br />
improving.<br />
Although trade increased from the previous year, revenue for<br />
the year fell from $42.29 million to $41.84 million, which could<br />
be attributed to the recovery <strong>of</strong> abnormal electricity charges in<br />
2008–09 following the Varanus Island gas explosion.<br />
The increase in trade came mainly from iron ore exports which<br />
increased 24.6 percent. The Port along with Cliff Natural<br />
Resources’ personnel held a public information session to provide<br />
local residents with the opportunity to discuss the company’s<br />
proposed future increase in iron ore exports.<br />
The Port also has been talking to other junior iron ore miners from<br />
the Yilgarn region about their export needs.<br />
Nickel concentrate exports rose to 323,684 tonnes in 2009–10, an<br />
increase <strong>of</strong> 18.3 percent over the previous year’s fi gure <strong>of</strong> 273,635<br />
tonnes. Nickel producers are increasingly exporting their product<br />
in containers and the Port handled 5480 TEUs during the year, the<br />
most since the arrival <strong>of</strong> the container crane at the Port in October<br />
2007.<br />
Container traffi c will continue to rise with nickel producer <strong>Western</strong><br />
Areas indicating that it will move its product in containers from<br />
August <strong>2010</strong>, and First Quantum Minerals is expected to export<br />
nickel hydroxide in containers.<br />
First Quantum Minerals is re-commissioning the Ravensthorpe<br />
venture following its acquisition from BHP Billiton and has indicated<br />
that it will be moving product out <strong>of</strong> Esperance by mid 2011, as<br />
well as importing bulk sulphur for its acid plant and to generate the<br />
mine site’s power supplies.<br />
Grain exports were lower at 1.338 million tonnes in 2009–10, down<br />
from 1.569 million tonnes the previous year. The Port, however,<br />
handled a record 247,565 tonnes <strong>of</strong> canola during the year, the<br />
fi gure refl ecting the higher prices being paid for that grain. The Port<br />
is expecting to handle higher grain tonnages in <strong>2010</strong>–11 following<br />
a promising start to the new season with normal to above average<br />
rainfall across the local agricultural area.<br />
Imports fell by 25 percent between 2008–09 and 2009–10, and<br />
by 47 percent between the record year <strong>of</strong> 2007–08 and 2009–10.<br />
Petroleum products fell from 340,673 tonnes last year to 304,590<br />
tonnes this year, which is signifi cantly below the record <strong>of</strong> 404,472<br />
tonnes recorded in 2007–08. Manufactured fertiliser imports also fell.<br />
The increase in trade to more than 11 million tonnes during the<br />
year resulted in increased maintenance tasks to maintain the<br />
Port’s operational requirements. A review <strong>of</strong> the methods used to<br />
plan, schedule and implement work packages was undertaken<br />
and resulted in a new Reliability Centred Maintenance system<br />
being introduced. If all aspects <strong>of</strong> the new maintenance model are<br />
introduced, dependability <strong>of</strong> infrastructure is expected to increase<br />
to 92 percent, which will be a pleasing outcome for both the Port<br />
and our customers.<br />
Negotiations continued during the year with Galaxy Resources<br />
for the export <strong>of</strong> spodumene from the Port. Galaxy has started<br />
developing its Mt Cattlin project north <strong>of</strong> Ravensthorpe and plans<br />
to export 137,000 tonnes <strong>of</strong> product through Esperance starting<br />
in November <strong>2010</strong>. The Port has been working with the company<br />
and the State Government regulators to have its Operating Licence<br />
amended to allow the storing and handling <strong>of</strong> the product.<br />
Negotiations have also continued with potential woodchip exporter<br />
Elders Forestry, who acquired Integrated Tree Cropping’s assets<br />
in the Esperance Region during the year. The company has about<br />
50,000 hectares <strong>of</strong> bluegum plantations on the Esperance Coastal<br />
Plain within about 100 kilometres <strong>of</strong> the Port, and has indicated<br />
4
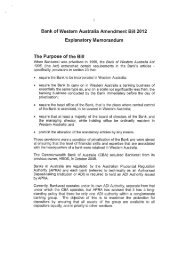
Loading Cliff Natural Resources’ iron ore on Berth Three.<br />
that it wants to export 400,000 tonnes <strong>of</strong> woodchips annually from<br />
Esperance to Japan. Land has been earmarked for a woodchip<br />
stockpile and the construction <strong>of</strong> a woodchip receival facility. Work<br />
on the woodchip infrastructure is likely to start early in 2011.<br />
The Port Consultative Committee (PCC) held discussions with<br />
Elders Forestry about the company’s plans to ship woodchips from<br />
Esperance during the year, and Cliffs outlined to PCC members<br />
its proposal to increase iron ore exports out <strong>of</strong> the Port from next<br />
fi nancial year.<br />
The Port’s bi-annual hydrographic survey, carried out in early <strong>2010</strong>,<br />
indicated a need for maintenance dredging. The Port has called for<br />
expressions <strong>of</strong> interest from dredging companies to carry out the<br />
work in 2011.<br />
Esperance Ports continues to work with the Shire <strong>of</strong> Esperance and<br />
the Department <strong>of</strong> Transport (DoT) to fi nd a solution to the ongoing<br />
foreshore erosion <strong>of</strong> the town beach. The Port has assumed joint<br />
responsibility with DoT for maintaining a section <strong>of</strong> the beach and<br />
agreed to support the Shire and DoT to construct a rockwall along<br />
the vulnerable areas <strong>of</strong> the beach, from Brazier Street to the Jetty,<br />
to protect public and private infrastructure. Plans to build a rockwall<br />
to protect infrastructure and a groyne to capture sand to maintain a<br />
beach are advancing and the parties hope to present design plans<br />
to the community for comment over the next few months, with the<br />
view <strong>of</strong> having the rockwall constructed before the winter <strong>of</strong> 2011.<br />
At the end <strong>of</strong> the fi nancial year the Port and members <strong>of</strong> its<br />
operational workforce had reached an agreement on a new<br />
Esperance Ports Sea and Land Enterprise Bargaining Agreement<br />
(EBA) to cover <strong>2010</strong>. A new agreement to cover the next three<br />
years will be negotiated in the coming months.<br />
Although I have been in the role as CEO for only a short time, I<br />
have gained an appreciation <strong>of</strong> the dedication and commitment <strong>of</strong><br />
the team at Esperance Ports Sea and Land, and thank those who<br />
have assisted me in developing an understanding <strong>of</strong> the current<br />
operations and the future challenges ahead for the Port.<br />
I would like to thank the Board <strong>of</strong> Directors for their assistance in<br />
my settling into the CEO position at the Port, and acknowledge<br />
the contribution to the ongoing well being <strong>of</strong> the organisation by<br />
our customers, the Port Consultative Committee and the local<br />
community. Most importantly, I would like to thank our dedicated<br />
and hardworking employees for their invaluable contribution to the<br />
Esperance Ports.<br />
Michal Frydrych<br />
Chief Executive Offi cer<br />
The Port continues to work with the Shire, Main Roads <strong>Western</strong><br />
<strong>Australia</strong> and DoT to implement the proposed upgrade <strong>of</strong> the<br />
transport corridor into the Port. The Federal Government has<br />
committed $60 million to the project, and the State Government<br />
has matched this amount in its forward estimates <strong>of</strong> its <strong>2010</strong><br />
budget. The Port is hopeful that the work will start next fi nancial<br />
year. The corridor was built in the 1960s when the volume <strong>of</strong><br />
cargo handled by the Port was less than half a million tonnes<br />
annually. Today the fi gure is over 11 million tonnes and is expected<br />
to grow signifi cantly in the next fi ve years. Both rail and road<br />
transport continues to increase annually and unless the upgrade is<br />
completed it will restrict the total volume <strong>of</strong> cargo that the Port can<br />
handle.<br />
5
Corporate Governance<br />
Role <strong>of</strong> Board<br />
The role <strong>of</strong> the Esperance Ports Sea and Land Board is to perform<br />
the functions, determine the policies and control the affairs <strong>of</strong><br />
the Esperance Port Authority, trading as Esperance Ports Sea<br />
and Land. These include developing strategic business plans,<br />
monitoring management’s performance in implementing plans,<br />
and reviewing the Port’s investment philosophies and strategies.<br />
The Board appoints the Chief Executive Offi cer and reviews<br />
performance and remuneration. It also ensures regulatory and<br />
ethical standard are met and risks are appropriately managed.<br />
Board Composition<br />
Esperance Ports Sea and Land consists <strong>of</strong> a Board <strong>of</strong> Directors<br />
comprising fi ve people appointed by the Minister for Transport.<br />
In appointing a person as Director, the Minister must have due<br />
regard to all relevant guidelines published, approved, endorsed<br />
or administered by the Minister for Public Sector Management.<br />
A member <strong>of</strong> staff is not eligible to be appointed as a Director. A<br />
Director may hold <strong>of</strong>fi ce for up to three years, and is eligible for<br />
re-appointment.<br />
Directors’ Rights<br />
Directors have access to independent legal or fi nancial advice as<br />
an approved Port expense, and access to Esperance Ports Sea<br />
and Land records for a period <strong>of</strong> up to seven years upon retirement<br />
from the Board. In addition, they have Directors’ and Offi cers’<br />
Liability insurance cover.<br />
Codes <strong>of</strong> Conduct<br />
Esperance Ports Sea and Land’s Codes <strong>of</strong> Conduct defi ne<br />
standards <strong>of</strong> ethical and pr<strong>of</strong>essional conduct that applies to<br />
Directors and Employees. The Codes are designed to assist the<br />
Port’s Directors and Employees to fully understand their rights,<br />
responsibilities and obligations in their respective roles. The Codes<br />
<strong>of</strong> Conduct relating to Employees also constitutes part <strong>of</strong> the<br />
Esperance Ports’ Human Resources Manual, which is accessible<br />
to all staff.<br />
Legislation<br />
The activities <strong>of</strong> the Esperance Ports Sea and Land are governed<br />
by the Port Authorities Act 1999. The Act has modernised Port<br />
Authority legislation and provides a clear trade facilitation role for<br />
<strong>Western</strong> <strong>Australia</strong>n Port Authorities, with a commercial focus on<br />
operations. Under the Act, Port Authorities are established as<br />
commercialised entities and are governed by Boards <strong>of</strong> Directors<br />
appointed by the Minister.<br />
Esperance Ports Sea and Land operates under established<br />
principles to ensure that business is carried out in the best interests<br />
<strong>of</strong> all stakeholders.<br />
Risk Management<br />
A Risk Management Policy has been established for Esperance<br />
Ports, which is designed to identify specifi c sources <strong>of</strong> risk and<br />
alternative controls to mitigate those risks.<br />
The Port’s insurer, RiskCover, has provided a Riskbase Database<br />
System to assist identify and rank risks according to likelihood and<br />
effect <strong>of</strong> occurrence. The Risk Management Committee compiles<br />
the information for the Riskbase System and undertakes the<br />
ranking and review process.<br />
External Audit<br />
The Offi ce <strong>of</strong> the Auditor General (OAG) has contracted out the<br />
annual external audit <strong>of</strong> the Port’s functions to Grant Thornton<br />
<strong>Australia</strong> Limited. In accordance with the Port Authorities Act 1999,<br />
Esperance Ports Sea and Land is required to submit an audited<br />
<strong>Annual</strong> <strong>Report</strong> on its most recently completed fi nancial year to the<br />
Minister within ten days <strong>of</strong> the receipt <strong>of</strong> the fi rst audit opinion from<br />
the OAG on the fi nancial accounts <strong>of</strong> the Port.<br />
Internal Audit<br />
The Internal Audit <strong>of</strong> the Esperance Ports is conducted on an<br />
annual basis by Stantons International. The Internal Audit Plan<br />
has a specifi c focus on the review <strong>of</strong> accounting procedures and<br />
related internal controls.<br />
6
-.<br />
Esperance Ports’ Directors (from left): Tim Shanahan (Acting Chairman), Phil Thick, Kathy Finlayson and Phil Chalmers.<br />
Directors & Port Executives<br />
Directors<br />
Tim Shanahan (Acting Chairman)<br />
Kathy Finlayson<br />
Phil Thick<br />
Phil Chalmers<br />
Jim Matijasevich resigned as Chairman <strong>of</strong><br />
the Esperance Port in March <strong>2010</strong>.<br />
Chief Executive Officer<br />
General Manager Commerce<br />
General Manager Operations<br />
Harbour Master<br />
Deputy Harbour Master<br />
Chief Financial Officer<br />
Corporate Relations Manager<br />
Environmental Manager<br />
Human Resources Manager<br />
Port Terminal Manager<br />
Maintenance Manager<br />
Michal Frydrych<br />
Devinder Grewal<br />
Neil Pearson<br />
Captain Rob Lovell<br />
Captain Joseph Pereira<br />
Kevin Fernance<br />
Richard Grant<br />
Alex Leonard<br />
Narelle Matthews<br />
Pieter Kross<br />
Brant Grundy<br />
7
Directors’ <strong>Report</strong><br />
The Board <strong>of</strong> Directors <strong>of</strong> the Esperance Port Authority trading<br />
as Esperance Ports Sea and Land (the Authority) has pleasure in<br />
submitting its report for the fi nancial year ended 30 June <strong>2010</strong>.<br />
1. Directors<br />
The Directors <strong>of</strong> the Authority during the 2009–10 fi nancial year and<br />
up to the date <strong>of</strong> this report were:<br />
J. Matijasevich<br />
BE Civil<br />
Appointed August 2006. Resigned March <strong>2010</strong>.<br />
P. Thick<br />
BE Civil (Hons.) FAICD<br />
Appointed August 2007<br />
P. Chalmer<br />
B.Sc (Hons.), Ph.D<br />
Appointed November 2007<br />
K. Finlayson<br />
JP CitWA<br />
Appointed March 2009<br />
T. Shanahan<br />
LLB PSM<br />
Appointed March 2009<br />
2. Directors’ Meetings<br />
The number <strong>of</strong> Directors’ meetings and number <strong>of</strong> meetings attended<br />
by each <strong>of</strong> the Directors <strong>of</strong> the Authority during the fi nancial year are:<br />
Maximum Number Number<br />
Director <strong>of</strong> Meetings Attended<br />
J. Matijasevich 6 5<br />
T. Shanahan 8 8<br />
P. Thick 8 7<br />
P. Chalmer 8 8<br />
K. Finlayson 8 6<br />
3. Principal Activities<br />
During the year the principal activities <strong>of</strong> the Port consisted <strong>of</strong>:<br />
• Port planning for future development,<br />
• Trade promotion and facilitation,<br />
• Asset maintenance and construction, and<br />
• Provision <strong>of</strong> services, power supply and labour as required for<br />
stevedoring, pilotage, mooring and maintenance activities.<br />
There were no signifi cant changes in the nature <strong>of</strong> the activities<br />
carried out by the Authority during the year.<br />
4. Dividends<br />
The Authority has not declared a dividend for 2009–10 and has<br />
not paid dividends for the years 2005–06, 2006–07, 2007–08, and<br />
2008–09. Unpaid dividends total $1.74 million.<br />
The Authority is seeking exemption from paying these dividends as<br />
part <strong>of</strong> an equity restoration plan to restore the Authority’s fi nancial<br />
position following the abnormal expenditure resulting from lead<br />
related issues during the past two years.<br />
5. Operating and Financial Review<br />
Review <strong>of</strong> operations<br />
The Port has had a record trade year. BHP Billiton announced the<br />
sale <strong>of</strong> their Ravensthorpe Nickel mine to First Quantum Minerals<br />
who intend to reopen the mine during the coming year. Container<br />
numbers picked up on the previous year with Xstrata exporting<br />
nickel in containers. During the coming year <strong>Western</strong> Areas will<br />
commence exporting nickel in containers. Total trade was 1.3<br />
million tonnes greater than the previous year with iron ore exports<br />
increasing by 1.82 million tonnes. Off-setting this gain were losses<br />
in grain exports, being down 0.359 million tonnes, and fuel and<br />
fertiliser imports. Cargo handled for the year was 11,266,987<br />
tonnes.<br />
The Authority is seeking an equity injection to compensate for the<br />
abnormal expenditure incurred over the two past trading years in<br />
relation to the lead issue. Part <strong>of</strong> this package to restore the Port’s<br />
8
I AV<br />
. I<br />
I ....<br />
I I I II<br />
. .<br />
III II I I<br />
. . . ti<br />
)2t,<br />
mob:ripe Ihri;<br />
bg<br />
-<br />
_ .<br />
11,<br />
73! red 04<br />
1:1,71HarL<br />
=44 -rrS - iigmisgAlt<br />
_ - -<br />
Pr-A<br />
-<br />
An early morning swimmer watches the arrival <strong>of</strong> MV Amphion to load a cargo <strong>of</strong> grain.<br />
^<br />
fi nancial position includes waivering dividend payments for the<br />
years 2005–06 through to 2007–08.<br />
The Authority received approval in 2009 to spend $38 million<br />
for new and upgraded facilities to handle mineral concentrates.<br />
Substantial elements <strong>of</strong> this project have been completed, and to<br />
30 June <strong>2010</strong>, $18.63 million had been spent.<br />
Court Case<br />
Esperance Ports Sea and Land was fi ned $525,000 in the<br />
Esperance Magistrates Court in October 2009 after pleading guilty<br />
to six charges relating to the pollution caused by the handling <strong>of</strong><br />
lead carbonate and nickel concentrate at the Port from 2006 to<br />
early 2007.<br />
The Port expressed its deep regret for the incidents and told the<br />
court there was never any deliberate wrongdoing; however, errors<br />
were made and the Port accepted its share <strong>of</strong> responsibility for the<br />
incident.<br />
Since the incident, a large-scale clean-up <strong>of</strong> the Port and town<br />
was initiated by Esperance Ports Sea and Land and is continuing<br />
through the works being carried out by the Esperance Cleanup and<br />
Recovery Project.<br />
The Port’s bulk concentrate infrastructure has been upgraded<br />
to ensure that such an incident cannot happen again. The Port<br />
stopped storing and handling lead carbonate in March 2006, and<br />
removed a 9000 tonne stockpile from the Port by May 2009.<br />
Increasingly, nickel concentrates are being shipped out <strong>of</strong> the Port<br />
in containers rather than being handled as a bulk product.<br />
Commentary on operating results<br />
The Authority recorded a loss for the year before income tax<br />
expense <strong>of</strong> $0.761 million. Income tax credit <strong>of</strong> $0.16 million has<br />
been calculated giving an after tax loss <strong>of</strong> $0.601 million.<br />
Port trade was 11,266,987 tonnes, up 1,318,141 tonnes on the<br />
previous year and 0.367 million tonnes above budget. Total revenue<br />
was $41.835 million, 3.5 percent above budget and $0.458 million<br />
down on the previous year’s $42.293 million. Revenue earned<br />
is dependent on the mix <strong>of</strong> cargoes, while additional revenue<br />
was recovered the previous year from major Port users to cover<br />
increased electricity costs.<br />
Total expenditure was $42.596 million being 0.4 percent below<br />
budget and a $2.765 million decrease on the previous year. There<br />
was a signifi cant reduction in administration expenditure being<br />
down 71.7 percent to $2.9 million, included in this amount is the<br />
$0.525 million fi ne for the lead and nickel related incidents.<br />
Other reductions in expenditure on the previous year occurred<br />
in travel, Board, power, interest and government charges.<br />
Offsetting these gains were increases in contract services, staff<br />
training, insurance, salaries, maintenance, wages, and rates<br />
and taxes. Expenditure on lead related issues added $1.756<br />
million to the Port’s operating costs for the year. Provisions for<br />
staff entitlements totalling $1.051 million were made during<br />
the year. Other expenditure continuing to impact the Port are<br />
increased environmental monitoring and compliance costs to meet<br />
Department <strong>of</strong> Environment (DEC) requirements. A nil dividend<br />
has been recommended to the Minister for Transport in light <strong>of</strong> the<br />
$0.761 million loss.<br />
Strategy and future performance<br />
During the coming fi nancial year the Authority will be closely<br />
monitoring operating costs and reviewing existing Port charges and<br />
their structure.<br />
6. Significant Changes in the State <strong>of</strong><br />
Affairs<br />
In the opinion <strong>of</strong> the Directors there were no signifi cant changes in<br />
the state <strong>of</strong> affairs <strong>of</strong> the Authority that occurred during the fi nancial<br />
year under review other than those already mentioned above.<br />
7. Events Subsequent to <strong>Report</strong>ing Date<br />
There has not arisen in the interval between the end <strong>of</strong> the fi nancial<br />
year and the date <strong>of</strong> this report any item, transaction or event <strong>of</strong> a<br />
material and unusual nature likely, in the opinion <strong>of</strong> the Directors <strong>of</strong><br />
the Authority, to affect signifi cantly the operations <strong>of</strong> the Authority,<br />
the results <strong>of</strong> those operations, or the state <strong>of</strong> affairs <strong>of</strong> the<br />
Authority, in future fi nancial years.<br />
9
ff/griW7Pri*wrsirwelv-4rteftifift14/0.t.W.ffiff-tai<br />
iftairty.eywiiinfiTeig7/0401),Ifilirirdritie41ffrillaSifirOrIffi!<br />
wM7/409.7497Wgz<br />
8. Likely Developments<br />
During the coming year the Authority will complete works on<br />
the Mineral Concentrate Circuit Upgrade (MCCU). The Authority<br />
will have spent $23.5 million. The Authority has not been able to<br />
negotiate with the Port users for the recovery <strong>of</strong> this expenditure.<br />
Negotiations with First Quantum Minerals continued during the year<br />
following the company’s acquisition <strong>of</strong> BHP Billiton’s Ravensthorpe<br />
nickel operations. First Quantum plans to export nickel hydroxide<br />
out <strong>of</strong> Esperance in containers and import bulk sulphur for its<br />
operations.<br />
Galaxy Resources has started developing its Mt Cattlin Spodumene<br />
project north <strong>of</strong> Ravensthorpe and plans to export 137,000 tonnes<br />
<strong>of</strong> product through Esperance starting in November <strong>2010</strong>.<br />
Elders Forestry acquired Integrated Tree Cropping’s assets in<br />
the Esperance Region during the year and plans to export up to<br />
400,000 tonnes <strong>of</strong> woodchips annually out <strong>of</strong> Esperance Port when<br />
in full production.<br />
9. Directors’ Emoluments<br />
In accordance with Section 13(c)(i) <strong>of</strong> Schedule 5 <strong>of</strong> the Port<br />
Authorities Act 1999, the nature and amount <strong>of</strong> each major element<br />
<strong>of</strong> remuneration <strong>of</strong> each Director <strong>of</strong> the Authority, each <strong>of</strong> the three<br />
named executives who received the highest remuneration and<br />
other key management personnel <strong>of</strong> the Authority are below.<br />
10. Environmental Regulation<br />
The Authority’s operations are subject to regulation under both<br />
Commonwealth and State environmental legislation applicable to<br />
any <strong>Australia</strong>n commercial entity. Under the Port Authorities Act<br />
1999, the Authority is also required to “protect the environment<br />
<strong>of</strong> the Port and minimise the impact <strong>of</strong> Port activities on that<br />
environment”.<br />
11. Environmental Management<br />
The Authority is complying with one Environmental Protection<br />
Notices (EPN). EPN DEC 02 <strong>of</strong> 2007 relates to lead cleanup <strong>of</strong><br />
the Port site. The Authority still has to dispose <strong>of</strong> a small quantity<br />
<strong>of</strong> lead contaminated residues to complete this EPN. In order to<br />
comply with environmental responsibilities and objectives, the<br />
Authority has improved the documentation <strong>of</strong> its systems and<br />
revised its risk register. In the longer term the Authority aims to have<br />
an environmental management system certified to the international<br />
standard ISO14001.<br />
The Authority received six infringement notices from the DEC<br />
relating to lead and nickel incidents at the Port. These infringements<br />
carried a potential fine to the Port <strong>of</strong> $1.325 million. The Authority<br />
pleaded guilty to the infringements during the year and was fined<br />
$525,000.<br />
12. Rounding Off<br />
Amounts have been rounded <strong>of</strong>f to the nearest thousand dollars in<br />
the Directors’ <strong>Report</strong> and Financial Statements.<br />
This report is made with a resolution <strong>of</strong> the Directors:<br />
T. Shanahan<br />
Acting Chairman<br />
Esperance,<br />
22 September <strong>2010</strong><br />
Non-Executive Directors <strong>of</strong> Esperance Port Authority<br />
Name Directors’ Fee Superannuation Total<br />
$ $ $<br />
T. Shanahan 33,558 3,020 36,578<br />
Acting Chairman<br />
J. Matijasevich 31,463 2,832 34,295<br />
Chairman resigned March <strong>2010</strong><br />
P. Thick 16,500 1,485 17,985<br />
P. Chalmer 16,500 1,485 17,985<br />
K. Finlayson 16,500 1,485 17,985<br />
Senior Executives <strong>of</strong> Esperance Port Authority<br />
Name Base Salary Motor Vehicle Superannuation Total<br />
$ $ $ $<br />
D. A. Parsons 231,178 7,999 20,806 259,983<br />
Chief Executive Officer<br />
P. Webster 210,261 – 18,923 229,184<br />
Assistant Harbour Master<br />
N. Pearson 196,056 14,273 17,645 227,974<br />
General Manager Operations<br />
10<br />
o4wIxtosiiklVabitilkS4A\<br />
ttits,1,1\XcsSUSWARaNSI-kl,<br />
.\\VkiktisitS\_ ,,,\ANNzeik%aa\\\\,1/4*&%t\\\
Regulatory Requirements<br />
Electoral Act 1907<br />
Section 175Ze <strong>of</strong> the Electoral Act 1907 requires Esperance Ports<br />
Sea and Land to include a statement in its annual report detailing<br />
expenditure incurred by or on behalf <strong>of</strong> the Agency during the<br />
current reporting period over the classes <strong>of</strong> expenditure set out in<br />
the table below.<br />
3.<br />
4.<br />
Review the effi ciency and effectiveness <strong>of</strong> Esperance Ports’<br />
record keeping training program to ensure it meets the<br />
requirement <strong>of</strong> the Act.<br />
Induct new employees with regard to compliance with<br />
Esperance Ports’ record keeping system and the Port’s<br />
responsibility in regard to the Act.<br />
Record Keeping<br />
Esperance Ports recognises the importance <strong>of</strong> proper and<br />
adequate record keeping practices. The State Records Act 2000<br />
requires Esperance Ports Sea and Land to report on the following:<br />
1. Evaluate the effi ciency and effectiveness <strong>of</strong> Esperance Ports’<br />
record keeping system to ensure it meets the requirements <strong>of</strong><br />
the Act.<br />
2. Conduct record keeping training as required.<br />
Disability Services Plan<br />
Esperance Ports has a Disability Services Plan in place and all<br />
aspects <strong>of</strong> the plan are operational. Periodic reviews take place<br />
to ensure it complies with both State and Federal Government<br />
disability legislation.<br />
Freedom <strong>of</strong> Information<br />
Esperance Ports received no Freedom <strong>of</strong> Information requests<br />
during the 2009–10 fi nancial year.<br />
Class Of Expenditure Organisation/Company Total Expenditure 2009–10<br />
Advertising agencies<br />
Market research agencies<br />
Polling organisations<br />
Direct mailing agencies<br />
Nil<br />
Nil<br />
Nil<br />
Nil<br />
Media, for advertising Esperance Holdings Pty Ltd $3,341<br />
Hocking and Company Pty Ltd $594<br />
Showcase Publications $11,875<br />
Adcorp <strong>Australia</strong> Ltd $6,048<br />
Seek Limited $720<br />
Market Creations $610<br />
Lloyds List $624<br />
Email Media $375<br />
11
Finance<br />
imlimW-7/#4167a6P/WaTfi4M0A<br />
erforAWaraimiti/tatfW,-7///41104r40,977///414SWiff,e,,,7"///607ArffewW1V,<br />
Esperance Ports Sea and Land recorded an operating loss for the<br />
year before income tax expense <strong>of</strong> $0.761 million, a signifi cant<br />
improvement on the previous year’s loss <strong>of</strong> $3.069 million. Income<br />
tax credit <strong>of</strong> $0.160 million has been calculated giving an after tax<br />
loss <strong>of</strong> $0.601 million. Income tax is paid to the <strong>Western</strong> <strong>Australia</strong>n<br />
State Government under a National Tax Equivalent Regime (NTER)<br />
as agreed between the State and Federal Governments. No<br />
provision for a dividend has been made.<br />
Revenue<br />
Total revenue decreased from $42.29 million for 2008–09 to<br />
$41.84 million in 2009–10. Total trade increased 13.2 percent<br />
on the previous year and total revenue decreased 0.97 percent.<br />
The decrease in revenue for 2009–10 compared to 2008–09<br />
was due to the abnormal recovery in 2008–09 <strong>of</strong> $2.0 million for<br />
the increased cost <strong>of</strong> power as a result <strong>of</strong> the loss <strong>of</strong> gas to the<br />
Esperance power station following the Veranus Island incident.<br />
During 2009–10, revenue from wharfage decreased 6.2 percent as<br />
a result <strong>of</strong> the change in the mix <strong>of</strong> cargoes, while vessel charges<br />
increased 9.5 percent as a result <strong>of</strong> increased trade <strong>of</strong>fset by more<br />
effi cient berth utilisation.<br />
Revenue from Pipeline Service Charge decreased in line with<br />
the decrease in petroleum imports, down from 340,673 tonnes<br />
last year to 304,590 tonnes this year. Handling charge revenue<br />
increased 10.6 percent on the previous year, which refl ected<br />
the increase in iron ore exports and changes in other handling<br />
operations.<br />
Revenue from labour recoup decreased 18.8 percent on the<br />
previous year as a result <strong>of</strong> a decrease in supplying labour for third<br />
party shipping services.<br />
Revenue from pilotage, plant hire and sundry income increased<br />
during the year, while income from interest received, rentals and<br />
quarantine waste disposal decreased.<br />
i._<br />
Mir<br />
12<br />
jr-A4=<br />
<strong>Western</strong> Areas and Port personnel gather on Berth Two to watch the loading <strong>of</strong> the company’s first shipment <strong>of</strong> containerised nickel concentrates.<br />
rw4aNA .nN1%.\\NtoMalic\m4)L*.. ict* \1043iNN..*tzil,4;-sAk\-<br />
\:,4kkit1/4-A\v*kwalb\\\1/4kkit\\\*,%)6611Vabit;&\kktkNi.,,,t\\N
i<br />
_<br />
del<br />
A busy working Port with vessels alongside all three berths.<br />
WMWsU077 Wif/leiffAriihinifocrefff#W71/74104941Arle//79tint,e977//frilf,Weiff#9,r47//7941,17,ef7i:<br />
ratfeileitiliffirrnewnwentinrent4tigrtaherin<br />
Expenditure<br />
Total expenditure for the year was $42.6 million, which was $2.77<br />
million less than the preceding year and $0.34 million less than<br />
budget. Decreases on budget were recorded in expenditure for<br />
general administration, travel expenses, interest charges, Board<br />
fees and expenses, insurance, depreciation, government charges,<br />
provisions for annual leave and accrued days <strong>of</strong>f. Increases to<br />
budget were incurred for contract services, staff training, payroll<br />
tax, salaries, electricity and water purchases, maintenance and<br />
wages.<br />
Expenditure decreased on the previous year by $2.77 million.<br />
Administration expenditure was reduced by 71.7 percent to $2.9<br />
million, which included a $0.525 million fi ne for the lead and nickel<br />
related incidents. Other reductions on the previous year occurred<br />
in travel expenses, Board costs, power and interest costs and<br />
government charges. Offsetting these gains were increases in<br />
contract services, staff training, insurance, salaries, maintenance,<br />
wages, and rates and taxes.<br />
Expenditure on lead related issues added $1.756 million to the<br />
Port’s operating costs for the year. Provisions for staff entitlements<br />
totalling $1.051 million were made during the year. A nil dividend<br />
has been recommended to the Minister for Transport in light <strong>of</strong> the<br />
$0.761 million loss.<br />
Capital<br />
Esperance Ports borrowed $14.5 million from the <strong>Western</strong><br />
<strong>Australia</strong>n Treasury Corporation during the year. Capital repayments<br />
<strong>of</strong> $5.057 million were made to reduce the debt owed to the<br />
<strong>Western</strong> <strong>Australia</strong>n Treasury Corporation.<br />
Capital expenditure during the year was $16.99 million. The<br />
Port spent $0.957 million on minor works, $2.122 million on<br />
improvements to the iron ore circuit and a further $13.911 million<br />
on the mineral concentrate circuit, bringing the total expenditure<br />
on the circuit to $18.629 million. The mineral concentrate circuit<br />
upgrade has a budget <strong>of</strong> $38 million.<br />
_<br />
....., I-cOn..<br />
. "<br />
g<br />
n<br />
n* 2L1 c<br />
meg'<br />
Will . ° A<br />
..S c'zi PS tle. InOtt o'm u' .<br />
TOFWENion 44.<br />
"Thirvittc_2:117K-trjra<br />
erq7- 1.-S- -<br />
Aft-gp .2_.<br />
U LA<br />
a<br />
- =^:"S"StIS CIPAL iiSeL<br />
%<br />
° 9 !I °A-<br />
7<br />
a-<br />
F<br />
PIP TAW EF ....%utru.9 .taiworin<br />
g A hg<br />
Lightning storm lights up the Port.<br />
?I'Okt-kk NNAS& '.kLia.t%n\*.-%:%\').t\'Ai*q41.,`<br />
Z.1/4kVakk,t4.-.\\-4.k.1/211a\\\%&Albeit.\-\"-4%'\-\\\1/4"4\*4'1/4AkNve''\\\\411(%lik<br />
13
Business Development<br />
There have been several lines <strong>of</strong> focus this year as the Port worked<br />
on further developing its commercial activity and consolidating<br />
internal capability to deliver its customers’ expectations and comply<br />
with its given responsibilities.<br />
in<br />
=<br />
rirr'<br />
`rsidlia ras -<br />
.441. WBSTIIIN ARRAS<br />
"P7.75r.; 'try<br />
Pioneering the Expiirt <strong>of</strong> Nickel<br />
Enclosed Contaikwr, to China.<br />
rh. L....x.ptin: tI NiLkel<br />
IIIEruzlosed C:1 11 IT t Chi rus<br />
Internally, the focus has been on developing a robust and<br />
integrated management system, supported by a contemporary<br />
IT infrastructure. All the key operational processes are now risk<br />
assessed and controlled to ensure safety <strong>of</strong> personnel, the assets<br />
involved and the environment. A recording database has been<br />
developed for tracking action items arising from incident/accident/<br />
hazard reports. This will ensure the correct information is captured<br />
and actioned for investigation and the lessons learnt are brought<br />
into management practices.<br />
Commercially, too, the focus has been to integrate risk<br />
management into business agreements and practices. The Port’s<br />
fi nancial systems s<strong>of</strong>tware and document management system<br />
have both been successfully upgraded as part <strong>of</strong> the server<br />
upgrade. The addition <strong>of</strong> a centralised backup system now means<br />
that the Port has a reliable means <strong>of</strong> data retrieval and archival.<br />
IT has played a key role in all developments this year, with the<br />
introduction <strong>of</strong> new hardware and s<strong>of</strong>tware platforms. The majority<br />
<strong>of</strong> the Port’s IT systems have been redesigned or rebuilt. The fi bre<br />
optic network has been reconfi gured into a more robust network,<br />
and the main server centre has been moved out <strong>of</strong> the Port<br />
operations area and into a new purpose-built server room in the<br />
Port’s administration building.<br />
So far, about 85 percent <strong>of</strong> the systems have been migrated to a<br />
new virtualised server platform, bringing about performance gains<br />
and power savings, while providing a system that is both scalable<br />
and easily managed.<br />
2009 saw the introduction <strong>of</strong> a Helpdesk system, where Port staff<br />
can log support calls from their computer, a feature which has<br />
enabled IT staff to manage calls in a more effi cient and organised<br />
manner. This system is on track to record about 1000 calls in its<br />
fi rst year.<br />
The Port’s environment remains a key area <strong>of</strong> interest to<br />
the community, the regulator and the Port’s management.<br />
Environmental monitoring has been upgraded with the completion<br />
<strong>of</strong> the radio network allowing all monitoring stations to return<br />
data automatically to a new environmental monitoring database,<br />
where it can be analysed and reported on. This automation and<br />
14
-<br />
,<br />
pgT1<br />
-244r<br />
__,, yen p<br />
:161N-4E2<br />
Itliiiiiird'aa<br />
NO NOKIK<br />
I<br />
-<br />
-, I '4'<br />
,<br />
-Nwt<br />
I<br />
II 14<br />
0 r 4 - 4,1t,<br />
i,i1 -<br />
1,,, ,<br />
"'WM.<br />
- -Ns+ "<br />
. -<br />
MCP Goteborg prepares to load containers.<br />
centralised management <strong>of</strong> information should mean some real<br />
gains in effi ciency for Port environmental staff. The Port is still,<br />
however, required to have certain reports analysed and written by<br />
consultants.<br />
The Harbour Master’s <strong>of</strong>fi ce and all its associated communication<br />
equipment has been moved to a new location. A Geographic<br />
Information System (GIS) has been introduced. The GIS system<br />
allows Port staff to model developments in a highly accurate spatial<br />
environment, creating maps and plans that are overlaid on top <strong>of</strong><br />
the latest satellite imagery <strong>of</strong> the Port.<br />
The IT components <strong>of</strong> the Port’s Control System have all been<br />
upgraded, providing more effi cient real time monitoring <strong>of</strong> the<br />
Port’s transport and operations network. Port Electrical and IT<br />
staff worked with the s<strong>of</strong>tware vendors to ensure the minimum<br />
<strong>of</strong> downtime and the result was a smooth upgrade process,<br />
completing the project in March <strong>2010</strong>.<br />
The Global Financial Crisis did have an impact on some producers<br />
<strong>of</strong> cargo but it also created opportunities for others to move into<br />
trading. The Port continues to discuss the potential export <strong>of</strong> niche<br />
commodities such as woodchips with producers. However, First<br />
Quantum Minerals, the new owners <strong>of</strong> the Ravensthorpe nickel<br />
project, has been engaged in discussions with the Port to fi nalise<br />
commercial agreements. Their trade will be in containers, except<br />
for sulphur imports, which will remain in bulk.<br />
Similarly, Galaxy Resources has worked closely with the Port to<br />
defi ne their export plans for spodumene to China where it will be<br />
processed into lithium for batteries.<br />
The container trade has seen some growth with Xstrata moving to<br />
half height containers for all their exports. During the next fi nancial<br />
year, <strong>Western</strong> Areas is expected to follow suit. Interest from some<br />
grain producers to explore the container trade has remained strong<br />
although it is not expected to substantially impact on bulk grain<br />
movements through the Port.<br />
There has been growing interest from more iron ore producers in<br />
the region to export through Esperance at least until the Oakajee<br />
project is ready for operations.<br />
This dialogue to develop new business will continue with the<br />
expectation that any new trade will continue to maintain the<br />
high operational hygiene standards expected <strong>of</strong> the Port by its<br />
community.<br />
Stage One <strong>of</strong> the Metal Concentrate Circuit Upgrade has<br />
been completed successfully well within budget and on time.<br />
Environmental expectations associated with this upgrade have all<br />
been met. Peripheral works on that circuit continue to be executed.<br />
Stage Two <strong>of</strong> this work has been postponed sine die to allow<br />
assessment <strong>of</strong> the effi cacy <strong>of</strong> the works completed thus far and the<br />
need for specifi c works that may need to be done in the future.<br />
MCP Linz departs the Port with a cargo <strong>of</strong> containers.<br />
15
Engineering <strong>Report</strong><br />
/ Ar<br />
Ii<br />
c$4-,:.,<br />
,,,fro.<br />
407 /47<br />
- 4IV "<br />
"01 "<br />
il; 4<br />
-.IP' -.X1P.<br />
th , Jae-gor<br />
t-it;CI 1)<br />
,r 1.4:11,--,<br />
4<br />
, a ..r it<br />
. ,<br />
i co/ ea:' / / -<br />
1 °Pr<br />
.<br />
tr Si(, Al , /<br />
Illtb,<br />
A<br />
' itr k.,_,<br />
,44,TtiSr<br />
_ _ -<br />
Mineral Concentrate Circuit Upgrade<br />
In early December 2008, the Premier <strong>of</strong> <strong>Western</strong> <strong>Australia</strong><br />
announced the construction <strong>of</strong> a $100 million world-class,<br />
purpose-built mineral concentrate handling facility that would<br />
enable the environmentally compliant export <strong>of</strong> bulk minerals from<br />
Esperance Port.<br />
The fi rst stage <strong>of</strong> the project (Stage One) comprised undertaking<br />
Dust Emissions Reduction Works on the existing concentrate<br />
handling facility as broadly prescribed in the Port’s Operating<br />
Licence. Commissioning <strong>of</strong> these works were to be achieved by<br />
31 August 2009.<br />
These works were completed by the deadline by the Alliance<br />
established in early 2009 between the Esperance Port Authority<br />
and Bilfi nger Berger Services <strong>Australia</strong>. The main elements <strong>of</strong> the<br />
works comprised:<br />
• Enclosure <strong>of</strong> conveyor galleries and transfer points;<br />
• Installation <strong>of</strong> a superior ventilation system on the storage<br />
shed;<br />
• Improvements to the shiploader; and<br />
• Installation <strong>of</strong> a container tipper.<br />
Work on the existing concentrate handling facility continued<br />
during the 2009–10 fi nancial year. The Alliance carried out various<br />
engineering works such as changing out conveyor belting, idlers<br />
and mechanical components to improve the operation <strong>of</strong> the<br />
conveying systems which has reduced the generation <strong>of</strong> dust.<br />
Other works carried during the year included further refi nement <strong>of</strong><br />
the storage shed ventilation system and structural modifi cations<br />
to the supporting structures to accommodate the additional loads<br />
from enclosure <strong>of</strong> the conveyors and installation <strong>of</strong> additional dust<br />
control plant.<br />
It is forecast that all Stage One works for the upgrading <strong>of</strong> the<br />
mineral handling facility will be completed in the <strong>2010</strong>–11 fi nancial<br />
year. Stage One will be delivered under budget at $28.5 million<br />
against the original budget <strong>of</strong> $38 million.<br />
Tradesmen working on the Berth Two loader chute.<br />
The environmental performance <strong>of</strong> the upgraded existing minerals<br />
handling system has been signifi cantly enhanced. Extensive<br />
monitoring within the Port and at various monitoring sites outside <strong>of</strong><br />
16
1..._1711 )2.17<br />
\<br />
-<br />
Port workers carrying out maintenance work on a Port channel maker.<br />
the Port indicate substantial improvements in dust emission levels<br />
with an increasing number <strong>of</strong> monitoring sites being unable to<br />
register any dust from the Port’s nickel handling operations.<br />
The performance <strong>of</strong> the system continues to be monitored as<br />
further improvements to the system are being made. Further, the<br />
Port is expecting existing customers to change from delivery <strong>of</strong><br />
nickel concentrate product in kibbles to half height containers<br />
which will utilise the new tipper system. Trial delivery <strong>of</strong> nickel<br />
product in half height containers is planned for August <strong>2010</strong>.<br />
The Port’s Operating Licence specifi ed that “a new purpose built<br />
bulk metal concentrate receival, storage, transfer and shiploading<br />
facility shall be installed to meet international best practice for the<br />
control <strong>of</strong> odour and dust emissions by 6 January 2011.”<br />
Following consideration <strong>of</strong> a business case on the proposed<br />
Stage Two development <strong>of</strong> a world-class facility, the Minister for<br />
Transport in June <strong>2010</strong> announced that Government had deferred<br />
its decision on proceeding with the $100 million Stage Two facility<br />
until June 2011.<br />
Accordingly, the Port has applied to the Department <strong>of</strong><br />
Environment and Conservation to amend the Licence to refl ect the<br />
Government’s decision to defer the Stage Two works.<br />
Lead Shed<br />
In June 2009 industrial demolition specialists McMahon Services<br />
were engaged to dismantle and remove the shed that had<br />
previously stored the lead carbonate. The 9000 tonne lead<br />
carbonate stockpile had been removed by May 2009.<br />
The demolition and disposal <strong>of</strong> the shed was undertaken using the<br />
same stringent procedures that were developed and documented<br />
in the Port’s “Lead Removal Plan”.<br />
All demolition material was treated before being taken <strong>of</strong>f site and<br />
was disposed at various licenced receival facilities.<br />
McMahon Services diligently managed the demolition project with<br />
no environmental or safety incidents occurring.<br />
Maintenance Review<br />
The Port’s maintenance task has become increasingly demanding<br />
during the 2009–10 fi nancial year with the increase in trade to more<br />
than 11 million tonnes and the introduction <strong>of</strong> two additional iron<br />
ore train movement a week.<br />
With further growth in Port trade predicted, the current<br />
maintenance requirement will increase and will invariably be<br />
accompanied with diminishing windows <strong>of</strong> time available to carry<br />
out the maintenance tasks.<br />
To meet the future operating demands the Maintenance<br />
Department embarked on a project to enhance its maintenance<br />
and asset management function.<br />
An internal review <strong>of</strong> the methods used to plan, schedule and<br />
implement work packages was undertaken to identify any shortfall<br />
in the ability to meet future maintenance needs.<br />
The results <strong>of</strong> this review led to a new system <strong>of</strong> Preventative<br />
Maintenance Management being introduced at the Port.<br />
The Preventative Maintenance system is based on an <strong>Australia</strong>n<br />
and International Standard: “AS IEC 60300-2004 Dependability<br />
Management”. This standard covers all aspects <strong>of</strong> maintenance<br />
management to provide availability, reliability and cost control.<br />
These aspects are considered to be fundamental to achieving<br />
operational and fi nancial targets.<br />
The introduction <strong>of</strong> regular shutdowns for planned maintenance<br />
<strong>of</strong> the Port’s infrastructure has been pursued and has seen an<br />
improvement in both reliability and availability.<br />
Implementation <strong>of</strong> all aspects <strong>of</strong> the AS IEC 60300 standards are<br />
expected to deliver levels <strong>of</strong> dependability <strong>of</strong> the infrastructure,<br />
and will increase plant reliability to accepted industry standards <strong>of</strong><br />
above 92 percent.<br />
Implementation <strong>of</strong> the new preventative maintenance approach<br />
commenced during the latter part <strong>of</strong> the fi nancial year, and a<br />
substantially functional system is expected to be operating by the<br />
end <strong>of</strong> <strong>2010</strong>–11.<br />
Rail maintenance has been an area <strong>of</strong> focus for the Maintenance<br />
Department with several sections <strong>of</strong> the Port’s rail infrastructure<br />
being replaced during the fi nancial year.<br />
With the completion <strong>of</strong> these high priority areas, other areas<br />
requiring work will be undertaken during <strong>2010</strong>–11. These works will<br />
return to the Port’s rail system to a “fi t for purpose” standard.<br />
17
Trade<br />
Total trade for 2009-10 was a record 11.266 million tonnes, an<br />
increase <strong>of</strong> more than 1.318 million tonnes or 13.2 percent more<br />
than the previous year’s total <strong>of</strong> 9.94 million tonnes, and more than<br />
13 percent above the record <strong>of</strong> 9.949 million tonnes recorded in the<br />
2006–07 fi nancial year.<br />
While the overall exports increased from 9.452 million tonnes last<br />
year to 10.895 million tonnes in 2009–10, imports fell from 496,627<br />
tonnes the previous year to 371,721 tonnes. Imports were well<br />
down on the record 705,918 tonnes recorded in 2007–08 fi nancial<br />
year.<br />
The increase in trade can be attributed to the rise in iron ore<br />
exports by Cliffs Natural Resources from its Koolyanobbing<br />
operations. During the year the Port handled more than 9.211<br />
million tonnes <strong>of</strong> iron ore, 1.819 million tonnes or about 24.6<br />
percent more than previous year.<br />
Overall grain exports fell from 1.697 million tonnes in 2008–09 to<br />
1.338 million tonnes in 2009–10, although there was a signifi cant<br />
increase in canola exports, up from 139,581 tonnes last year to a<br />
record 247,565 tonnes. Wheat and barley exports fell in 2009–10,<br />
while there were increases in lupin and pea exports.<br />
Nickel concentrate exports rose by 50,049 tonnes, up from<br />
273,635 tonnes in 2008–09 to 323,684 tonnes this year, an<br />
increase <strong>of</strong> about 18.3 percent. No nickel hydroxide was exported<br />
from the Port this year following the closure <strong>of</strong> BHP Billiton’s<br />
Ravensthorpe nickel operations, which also impacted on the total<br />
import trade with no sulphur being imported during the year.<br />
Container trade increased during the near from 3010 TUE’s in<br />
2008–09 to 5480 TUE’s this year following the decision by Xstrata<br />
Nickel to export nickel concentrates in containers.<br />
Fuel imports fell slightly to 304,590 tonnes, down from the 340,673<br />
tonnes the previous year and the record <strong>of</strong> 404,472 tonnes in<br />
2007–08. The fall in fuel imports can be contributed to the global<br />
economic crisis that forced the closure or reduced production by<br />
nickel producers in the Goldfi elds Esperance Region.<br />
There was also a signifi cant decrease in fertiliser imports.<br />
While the total exports increased signifi cantly during the year, the<br />
number <strong>of</strong> ships berthing at the Port fell from 207 in 2008–09 to<br />
205 this year; however, the gross tonnage rose from more than<br />
7.628 million tonnes to more than 7.886 million tonnes with more<br />
cape sized vessels visiting Esperance.<br />
Trade Forecast<br />
Esperance Ports is forecasting an increase in total trade for the<br />
<strong>2010</strong>–11 fi nancial year.<br />
This is can be attributed to an increase in iron ore exports by<br />
Cliffs Natural Resources to 11.5 million tonnes, the resumption<br />
<strong>of</strong> nickel hydroxide exports by First Quantum Minerals who will<br />
resume mining and processing operations at the Ravensthorpe<br />
nickel operations (RNO), an increase in the handling <strong>of</strong> nickel<br />
concentrates with <strong>Western</strong> Areas exporting its products through<br />
the Port, Galaxy Resources’ spodumene being shipped from<br />
October <strong>2010</strong> and the start <strong>of</strong> woodchip exports.<br />
Sulphur imports for First Quantum will also resume in <strong>2010</strong>–2011.<br />
With more nickel concentrates being exported in containers<br />
and the resumption <strong>of</strong> RNO operations, a signifi cant increase in<br />
container trade is expected.<br />
Trade volumes for grain, fuel and fertiliser are expected to remain at<br />
current seasonal levels.<br />
The number <strong>of</strong> vessels visiting the Port is expected to increase<br />
because <strong>of</strong> the increase in total trade.<br />
Comparative Results <strong>of</strong> Principal Cargoes<br />
PRODUCT <strong>2010</strong> (TONNES) 2009 (TONNES) PERCENT (CHANGE)<br />
Petroleum 304,590 340,673 -10.6<br />
Fertiliser 57,775 75,077 -23.0<br />
Grain 1,338,119 1,697,346 -21.2<br />
Nickel 323,684 273,635 +18.3<br />
Iron Ore 9,211,331 7,392,929 +24.6<br />
18
:<br />
;<br />
7D4 44.404V"VagO:PP<br />
1124 'It<br />
T SOCIKG MLZATONNE<br />
Et L;<br />
1<br />
Preparing bags <strong>of</strong> nickel concentrate for loading into a ship’s hold.<br />
Imports-Exports Year Ended June 30, <strong>2010</strong><br />
CARGO (Tonnes) <strong>2010</strong> 2009 2008 2007 2006<br />
Container Tonnes Empty 9,356 - - - -<br />
IMPORTS<br />
Petroleum 304,590 340,673 404,472 385,880 284,474<br />
Phosphate - - - - -<br />
Manufactured Fertilisers 57,775 75,077 84,663 78,001 78,290<br />
Sulphur - 74,149 201,162 29,496 -<br />
Magnesia Oxide - 6,728 14,331 - -<br />
Sundry - - 1,290 5,338 2,564<br />
TOTAL IMPORTS 371,721 496,627 705,918 498,715 365,328<br />
TEU’s IN 3,395 1,565 1,607 - -<br />
EXPORTS<br />
Iron Ore 9,211,331 7,392,929 7,435,699 7,572,075 5,998,309<br />
Nickel 323,684 273,635 193,491 173,801 213,110<br />
Lead - 8,925 - 79,588 86,262<br />
Barley 611,210 732,379 620,905 337,003 715,930<br />
Wheat 428,683 801,701 677,153 1,032,801 712,128<br />
Oats - - - 271 4,524<br />
Sulphur 22,042 25,000 - - -<br />
Lupins 19,205 - 10,011 33,598 -<br />
Peas 31,456 23,685 33,000 24,962 47,169<br />
Canola 247,565 139,581 218,467 196,915 166,403<br />
Nickel Hydroxide - 54,384 35,639 - -<br />
TOTAL EXPORTS 10,895,266 9,452,219 9,224,365 9,451,014 7,943,835<br />
TEU’s OUT 2,085 1,445 2,071 - -<br />
TOTAL TRADE 11,266,987 9,948,846 9,930,283 9,949,729 8,309,163<br />
GROSS TONNAGE 7,886,877 7,628,856 7,345,228 7,404,800 6,488,064<br />
NO. OF VESSELS 205 207 192 181 177<br />
NO. OF TRADE VESSELS 202 202 185 181 173<br />
TOTAL TEU’S 5,480 3,010 3,678 - -<br />
19
Performance Indicators<br />
Outcome<br />
To provide effi cient and reliable services that meet the<br />
needs <strong>of</strong> Port users.<br />
Effectiveness<br />
Time at berth<br />
TARGET <strong>2010</strong> 2009 2008 2007<br />
40.0 Hours 53.3 52.5 59.0 48.2<br />
This is the average period <strong>of</strong> time from the fi rst line ashore to the<br />
last line <strong>of</strong>f when departing from the Port. The lower this fi gure the<br />
faster vessels are loaded and the more effective is the use <strong>of</strong> wharf<br />
space. This increase in time at the berth is due to an increase is<br />
slower loading / discharge <strong>of</strong> vessels.<br />
Total Time<br />
TARGET <strong>2010</strong> 2009 2008 2007<br />
60.0 Hours 72.99 105.3 86.9 66.7<br />
This is the average time elapsed from the arrival <strong>of</strong> a ship at the<br />
Port boundary to departure from the Port. This indicator has<br />
decreased and refl ects a reduction in waiting times for berth access<br />
and is partially <strong>of</strong>fset by increased alongside time.<br />
Efficiency<br />
Cargo handled per time in Port<br />
TARGET <strong>2010</strong> 2009 2008 2007<br />
700.0 Tonnes 764.3 467.8 617.4 823.9<br />
This is the average cargo handled for total time from Port arrival to<br />
departure. The increase refl ects an increase in bulk cargoes such<br />
as iron ore.<br />
Cargo handled per hour at berth<br />
TARGET <strong>2010</strong> 2009 2008 2007<br />
1100.0 Tonnes 1046.7 938.3 909.8 1139.6<br />
This is the average cargo handled per ship hour at berth.<br />
The higher this fi gure the more productive are cargo handling<br />
operations. This fi gure has increased because <strong>of</strong> larger tonnages <strong>of</strong><br />
bulk cargoes being handled.<br />
Cargo handled per shift hour<br />
TARGET <strong>2010</strong> 2009 2008 2007<br />
1600.0 Tonnes 1960.9 1489.9 1564.7 1839.2<br />
This is the average tonnes <strong>of</strong> cargo, excluding fuel, handled<br />
per shift hour worked. Continuous loading and improved cargo<br />
handling capabilities <strong>of</strong> minerals and faster loading rates for grain<br />
has been <strong>of</strong>fset by slower general cargoes during the year.<br />
Outcome<br />
To provide and maintain Port facilities such as wharves<br />
and associated infrastructure that will meet user needs.<br />
Effectiveness<br />
Berth occupancy<br />
TARGET <strong>2010</strong> 2009 2008 2007<br />
42.0 Percent 40.9 40.3 41.5 33.2<br />
Average berth occupancy measures the time ships are actually<br />
along side the berth as a percentage <strong>of</strong> the total time available.<br />
Time alongside increased on the previous year because <strong>of</strong> an<br />
increase in tonnes handled.<br />
Time awaiting berth<br />
TARGET <strong>2010</strong> 2009 2008 2007<br />
25.0 Hours 19.7 52.8 27.9 18.5<br />
Is that time from arrival at the Port boundary to the fi rst line ashore.<br />
This indicator can refl ect berth congestion; however, during the<br />
year the Port did not experience signifi cant congestion <strong>of</strong> the<br />
previous year when a large number <strong>of</strong> grain vessels arrived at once.<br />
Other factors causing ships to wait at anchor include waiting for<br />
letters <strong>of</strong> credit for cargo and ships not choosing to work.<br />
20
'<br />
Grain vessel departing Berth One.<br />
Average ship alongside time<br />
TARGET <strong>2010</strong> 2009 2008 2007<br />
Petroleum 30.0 Hours 24.9 23.7 22.5 18.1<br />
Fertiliser 45.0 Hours 44.3 47.9 47.6 46.9<br />
Grain 40.0 Hours 52.9 52.2 56.9 47.4<br />
Nickel 30.0 Hours 58.4 53.6 81.3 47.5<br />
Iron Ore 59.0 Hours 60.4 60.1 60.4 57.1<br />
Sulphur 180.0 Hours 99.3 88.2 213.5 0.0<br />
Containers 50.0 Hours 43.0 70.8 61.9 0.0<br />
Other 00.0 Hours 26.2 35.2 40.5 40.5<br />
The period <strong>of</strong> time alongside for each <strong>of</strong> the cargoes is dependent<br />
on the nature <strong>of</strong> the cargo, cargo size, vessel size and equipment<br />
to load or discharge the cargo and in some instances whether<br />
the vessel needs to be fumigated or cleaned out to load grain.<br />
The lower these fi gures the more effective are cargo handling<br />
operations.<br />
Efficiency<br />
Total expenditure per tonne <strong>of</strong> cargo<br />
This is all expenditure items divided by the total trade.<br />
TARGET <strong>2010</strong> 2009 2008 2007<br />
$4.00 $3.78 $4.55 $3.87 $3.22<br />
A reduction in this number equates to less expenditure per tonne<br />
<strong>of</strong> cargo.<br />
Total costs per ship visit<br />
This is the total expenditure divided by the number <strong>of</strong> ship calls.<br />
TARGET <strong>2010</strong> 2009 2008 2007<br />
$215,814 $210,872 $224,396 $207,796 $176,998<br />
A reduction in this fi gure indicates either reduced expenditure or<br />
increased vessel visits.<br />
Outcome<br />
To promote the development <strong>of</strong> trade through the Port.<br />
Effectiveness<br />
Total trade comparison<br />
Year precent change on previous year Volume-Tonnes<br />
<strong>2010</strong> +13.2% 11,266,319<br />
2009 +0.2% 9,948,846<br />
2008 -0.2% 9,930,283<br />
2007 +19.7% 9,949,729<br />
2006 +6.9% 8,309,163<br />
2005 +6.5% 7,774,123<br />
2004 +21.4% 7,297,131<br />
2003 -2.8% 6,009,535<br />
2002 +44.1% 6,184,212<br />
2001 +24.4% 4,291,021<br />
The Port has had another successful trading year with trade<br />
increasing by 13.2% on the previous year.<br />
TEU’s In TEU’s Out Total<br />
<strong>2010</strong> 3,395 2,085 5,480<br />
2009 1,565 1,445 3,010<br />
2008 1,607 2,071 3,678<br />
The Port handled containers for the fi rst time in large numbers<br />
using the Port’s container crane.<br />
Safety Indicator<br />
<strong>2010</strong> 2009 2008 2007 2006<br />
Number <strong>of</strong> significant incidents nil nil nil nil nil<br />
Again there were no signifi cant incidents recorded. Signifi cant<br />
Incidents are defi ned as those causing damage in excess<br />
<strong>of</strong> $20,000 to the Port’s assets or personal injury requiring<br />
hospitalisation or fatal accidents.<br />
21
Shipping<br />
1!flifgar1 ,0:11<br />
41171c, - - IF<br />
Pr" ST ajm'<br />
_ -41<br />
, _<strong>of</strong><br />
"--_-<br />
"... F<br />
RA<br />
*4 E<br />
C<br />
lora, .r,<br />
.7<br />
...-1<br />
ell.' 441<br />
LP7 .....<br />
et!,<br />
yr :17<br />
):a --<br />
awl<br />
lir 0-<br />
---4 7042c. ___ ..gr<br />
r<br />
.4kler T.; 'F--- 't<br />
a<br />
.--,' .<br />
._ ...., . ,<br />
.<br />
-<br />
__ .<br />
1..<br />
,..... .-E-.<br />
-<br />
FT a ay SI PC r - a'<br />
- Itat, m -'<br />
P-7] -7....e, :-.3.-<br />
...0.-<br />
[-.1<br />
- egrai- z<br />
- Iv _,/--<br />
_.. '<br />
ar-<br />
---- -.1%, -- f-mirt---'; i ,-,ars ...-<br />
int ..., L,<br />
r<br />
tt<br />
APO<br />
-- ,t _ji, r--- :7"....<br />
th mom. ANSEL". "In":II<br />
=96 Say. "MI Sam cararal... --r<br />
r;<br />
a am vc<br />
' -c<br />
Cruise ship MV Vollendan steams into Esperance Port.<br />
Shipping Milestones<br />
Movements<br />
Esperance Ports Sea and Land recorded 205 ship visits during<br />
the 2009–10 year, which was two less than the record 207 visits<br />
the previous fi nancial year. However, with increased total trade, the<br />
vessels were larger and the gross registered tonnes rose from more<br />
than 7.628 tonnes the previous year to more than 7.886 million<br />
tonnes this year, a record for Esperance.<br />
MV South Fortune<br />
Daylight restrictions for Panamax vessels to and from Berth One<br />
were removed and on 31 January <strong>2010</strong>, the fi rst night sailing <strong>of</strong> a<br />
Panamax grain ship, MV SOUTH FORTUNE carrying barley and<br />
canola occurred.<br />
Maximum Drafts<br />
The maximum allowable load drafts for ships berthing at the<br />
Esperance Port was brought into line with International best<br />
practice by removing the absolute draft restriction <strong>of</strong> 18 metres,<br />
and allowing vessels to load to deeper drafts, providing the<br />
minimum Underwater Keel Clearance <strong>of</strong> 1.3 metres is observed.<br />
MV Luigi D’Amato<br />
The MV LUIGI D’AMATO sailed on the rising tide with a record<br />
draft <strong>of</strong> 18.06 metres on 27 January <strong>2010</strong> with a cargo <strong>of</strong> 175,643<br />
tonnes <strong>of</strong> iron ore.<br />
MV Nord Steel<br />
On 15 February <strong>2010</strong>, MV NORD STEEL sailed with a draft <strong>of</strong><br />
18.17 metres carrying 177,623 tonnes <strong>of</strong> iron ore.<br />
Cruise Ships<br />
MV ATHENA and MV VOLLENDAM made one-day stopover calls<br />
to Esperance during the year.<br />
Hydrographic Surveys<br />
The Port was surveyed in February <strong>2010</strong>. General accretion was<br />
noted and appropriate notices were promulgated so that minimum<br />
Underwater Keel Clearances could be maintained. The Port will<br />
again be surveyed after maintenance dredging to remove high<br />
spots has been completed.<br />
22
,<br />
II I II. I 'I III<br />
Ell 'I'11 /1<br />
i I<br />
Ji<br />
11R<br />
Isri<br />
L I 1'1<br />
Ii<br />
ti<br />
I?<br />
IL ;<br />
I i El' 1 ;<br />
1t I; 7,11<br />
I 1I<br />
.., ...,....,<br />
,<br />
P . '<br />
0<br />
Tourists watch the berthing <strong>of</strong> an iron ore vessel.<br />
Port Beacons<br />
Over a period <strong>of</strong> about 12 months two <strong>of</strong> the Port’s fi ve piled<br />
beacon structures have failed. The welded steel pipe sections<br />
<strong>of</strong> both beacons failed at the sea bed level, and metallurgical<br />
investigations attributed the failures to poor welding techniques.<br />
The piled structures had been in service for about nine years.<br />
Temporary buoys are now being used in the locations previously<br />
marked by the beacons.<br />
An appraisal <strong>of</strong> alternative aids to navigation has been undertaken<br />
by the Port and has included the potential use <strong>of</strong> PEL sector lights<br />
and ocean class polyethylene buoys.<br />
It is intended for the beacons to be replaced in late summer or<br />
autumn when the sea and meteorologically conditions are more<br />
favourable for pile driving operations.<br />
Port Dredging<br />
The <strong>2010</strong> annual hydrographic survey <strong>of</strong> the Port has shown a loss<br />
<strong>of</strong> depth adjacent to the Port’s iron ore berth (Berth Three) and its<br />
second bulk berth (Berth Two). The reduction in depth has only had<br />
a minor impact on shipping operations at Berth Three and has not<br />
affected Berth Two.<br />
While the berths have experienced a loss <strong>of</strong> depth <strong>of</strong> about 0.5<br />
metre at a small number <strong>of</strong> locations, the Port approaches and<br />
swinging basin have also been subject to progressive accretion<br />
<strong>of</strong> sand since the previous Port expansion dredging works in<br />
2001–02.<br />
Losses <strong>of</strong> depth up to 1.5 metres have occurred but to date these<br />
have not had an impact on the navigation <strong>of</strong> ships.<br />
Expressions <strong>of</strong> Interest were invited in May <strong>2010</strong> from companies<br />
to provide dredging services to remove the small volume <strong>of</strong> high<br />
spots, and for a more extensive maintenance dredging which<br />
would return the Port to its post-construction depths.<br />
The Expressions <strong>of</strong> Interest are currently being evaluated and it is<br />
intended to carry out maintenance dredging during <strong>2010</strong>–11.<br />
Pilotage<br />
Following the resignation <strong>of</strong> Esperance Ports’ pilot, Captain Paul<br />
Webster, Captain Joseph Pereira, the former Assistant Harbour<br />
Master with the Port Hedland Port Authority, was recruited. He<br />
commenced training as a Marine Pilot and was licenced in May<br />
<strong>2010</strong> to pilot ships into and out <strong>of</strong> Esperance.<br />
Following the resignation <strong>of</strong> Captain Julian Thomas shortly after<br />
Captain Webster, recruitment to replace him was commenced and<br />
the successful candidate, Captain Stephen Dickason, is expected<br />
to commence employment with Esperance Ports Sea and Land in<br />
August <strong>2010</strong>.<br />
et A<br />
7<br />
23
Environmental Management<br />
Environmental Management<br />
Esperance Ports Sea and Land aims to conduct its activities<br />
in a manner which protects the environment and promotes<br />
sustainability by:<br />
• Complying with relevant environmental legislation and<br />
regulations including the Operating Licence, Ministerial<br />
Statement 681 and internal procedures;<br />
• Identifying and managing issues not included in the Operating<br />
Licence;<br />
• Including environmental planning in the Port’s expansion and<br />
future business; and<br />
• Communicating environmental risks to our stakeholders.<br />
Air Quality<br />
The start <strong>of</strong> the 2008–09 fi nancial year saw the Air Quality<br />
Monitoring Network consisting <strong>of</strong> four sites on the Port’s boundary<br />
that are used for reporting compliance with the Port’s Operating<br />
Licence. These sites are complemented by a further <strong>Australia</strong>n<br />
Standard compliant site located in the community close to the<br />
Shire <strong>of</strong> Esperance’s Offi ce, as well as four other sites within the<br />
Port used as an early warning system.<br />
The four sites located within the Port use Esamplers that measure<br />
Total Suspended Particulates (TSP) in real time and indicate the<br />
source and direction <strong>of</strong> the dust within the Port.<br />
The four sites on the Port’s boundary each have a High Volume<br />
Air Sampler (HVAS) measuring TSP over a 24-hour period, and a<br />
Tapered Element Oscillating Microbalance (TEOM) measuring the<br />
respirable particulate (
A fully loaded iron ore carrier prepares to depart Esperance Port.<br />
• Using a dust binding agent and eliminating the use <strong>of</strong> about 20<br />
million litres <strong>of</strong> scheme water a year for dust suppression on<br />
the unsealed roads;<br />
• Harvesting about three million litres <strong>of</strong> rainwater from iron ore<br />
sheds annually; and<br />
• Re-using about two million litres <strong>of</strong> treated wastewater from<br />
the wastewater treatment plant a year.<br />
The Port is also investigating further re-use options including using<br />
treated water for conditioning moisture levels <strong>of</strong> mineral products to<br />
reduce the potential for dust.<br />
Stormwater and Landscaping<br />
The Port is looking to combine its plans for stormwater<br />
management with landscaping by creating rain gardens in areas<br />
designed to soak away clean stormwater from ro<strong>of</strong>s and road<br />
run-<strong>of</strong>f. All existing stormwater infrastructure is to be cleaned<br />
and surveyed. Surrounding land surfaces will also be surveyed<br />
to develop a surface drainage map and plans to manage surface<br />
water run-<strong>of</strong>f more effectively and to cater for any foreseeable<br />
developments.<br />
Waste Management<br />
Risk-based procedures have been improved and are being<br />
implemented to remove, recycle, reuse or dispose <strong>of</strong> solid<br />
waste. These wastes include scrap metal, plastics, wood and<br />
excavated fi ll. These procedures involve assessing the likelihood<br />
<strong>of</strong> contamination and conducting laboratory testing if there are any<br />
doubts on contamination.<br />
Risk Assessment<br />
Before any new project is undertaken at the Port, a risk assessment<br />
is conducted to identify potential environmental impacts and ensure<br />
appropriate management has been implemented.<br />
Current risk assessments include:<br />
• Handling spodumene through the Port. Lithium produced<br />
from processing spodumene is used to produce batteries.<br />
The community will be consulted as part <strong>of</strong> the DEC-approval<br />
process; and<br />
• Maintenance dredging <strong>of</strong> the Port to remove sediments<br />
accreted since the previous Port expansion works in 2001–02<br />
were completed.<br />
Black Swan Incident<br />
In August 2009 the Port responded to heat and smoke being<br />
generated in its Black Swan nickel concentrate storage shed. The<br />
smoke was being generated from stockpiled nickel concentrate.<br />
The incident was widely, but at times inaccurately reported, in the<br />
media.<br />
As a precautionary measure the Port evacuated those employees<br />
not responsible for dealing with the incident and moved two ships<br />
<strong>of</strong>f the adjacent berths. The Port together with FESA vented the<br />
smoke and doused the small area <strong>of</strong> heated nickel concentrate<br />
to eliminate further smoke generation. Port operations returned to<br />
normal later in the day.<br />
Internal and external investigations were undertaken to identify<br />
the factors contributing to the incident and to develop appropriate<br />
process and management changes to reduce or eliminate the<br />
possibility <strong>of</strong> future occurrences.<br />
The investigations identifi ed that the particular concentrate had<br />
become vulnerable to self-heating as a result <strong>of</strong> its storage history<br />
at the mine and its mineralogical content. In collaboration with the<br />
product exporter, a management plan was developed to ensure<br />
the risks associated with heating <strong>of</strong> this type <strong>of</strong> nickel concentrate<br />
product were managed.<br />
The primary management measures include:<br />
• Product arrives at the Port under a layer <strong>of</strong> lime to reduce<br />
the availability <strong>of</strong> oxygen and restrict self heating to below 60<br />
degrees C;<br />
• Once stockpiled in the shed the surface is covered with a less<br />
reactive nickel concentrate;<br />
• The temperatures <strong>of</strong> the stockpile are monitored three times<br />
daily;<br />
• If temperatures exceeds 60 degrees C, the problem area <strong>of</strong><br />
the stockpile is watered and turned over to allow evaporative<br />
cooling and again covered with inert product;<br />
• Storage times in the shed are minimised; and<br />
• Entry into the storage shed requires a personal monitoring<br />
devices and breathing protection together with the requirement<br />
for the shed’s ventilation system to be operating all the time.<br />
The Port continues to export nickel concentrate in bulk but none <strong>of</strong><br />
the product is similar to the reactive concentrate that is susceptible<br />
to self heating.<br />
25
Corporate Relations<br />
Education Program<br />
Nine classes <strong>of</strong> year nine students from the Esperance Senior High<br />
School participated in this year’s joint education program run by the<br />
school and Esperance Ports.<br />
The curriculum developed by the school’s teachers and<br />
implemented by Port staff provided the students with an insight into<br />
the daily workings <strong>of</strong> a busy regional port.<br />
The society and environment students looked at environmental<br />
issues, management structure, health and safety issues, industrial<br />
relations matters, business activities, shipping, loading operations,<br />
products handled by the Port and career opportunities in the<br />
maritime industry.<br />
Of particular interest this year was the transport issues associated<br />
with the transport corridor, new products the Port will be handling<br />
in the new future including spodumene and woodchips, and the<br />
resumption <strong>of</strong> exports <strong>of</strong> nickel hydroxide from the Ravensthorpe<br />
Nickel Operations.<br />
The economic value <strong>of</strong> the Port to the town, region and State was<br />
discussed at length.<br />
The program included class-based activities including talks on the<br />
various topics by Port personnel, and a Port tour to look fi rst hand<br />
at the activities <strong>of</strong> a working port.<br />
Foreshore Remediation<br />
Esperance Ports has agreed to work with the Shire <strong>of</strong> Esperance<br />
and Department <strong>of</strong> Transport to plan and construct a seawall along<br />
the town beach foreshore to overcome the annual problems <strong>of</strong><br />
beach erosion which damages infrastructure and has the potential<br />
to impact on homes.<br />
The Port is particularly concerned about the fuel pipeline that that<br />
has been installed around the foreshore between the Port and the<br />
tanker farm that is located near the Tanker Jetty.<br />
Department <strong>of</strong> Transport coastal engineers have prepared a<br />
concept design for a seawall, and the Port, the Shire and the<br />
Department will progress the project to fi nal detailed design for a<br />
seawall.<br />
The Port has agreed to meet part <strong>of</strong> the cost <strong>of</strong> the design<br />
work. Once the design has been prepared and a business case<br />
prepared, the Port will look at sharing the cost <strong>of</strong> the construction<br />
<strong>of</strong> the seawall with the Shire <strong>of</strong> Esperance and the Department <strong>of</strong><br />
Transport.<br />
Foreshore erosion has been a problem from the time the sand<br />
dunes around the bay that acted as a natural barrier to the<br />
ocean were cleared. Since 1978 the Port has been involved in<br />
foreshore remediation and has spent more than $5 million on sand<br />
renourishment and other works.<br />
4<br />
vas.,<br />
st<br />
Sail training vessel on -a visit to Esperance Port.<br />
-<br />
-<br />
17! -=4:71!_-4<br />
26
n`a<br />
Year nine students from the Esperance Senior High School visit the Port.<br />
Sponsorship and Donations<br />
Esperance Ports Sea and Land provided $74,169 in sponsorship<br />
and donations to the local community during the 2009–10 fi nancial<br />
year, which was slightly up on the previous year.<br />
The major recipient was the Clontarf Foundation’s South East<br />
Football Academy which the Port has supported with an annual<br />
donation <strong>of</strong> $25,000 since its inception. The Academy is now<br />
established and providing many benefi ts to the Esperance High<br />
School and the Community.<br />
The Port also assists the Academy by providing traineeships for<br />
Indigenous students participating in the Academy.<br />
Other benefi ciaries <strong>of</strong> the Port’s sponsorship scheme included<br />
ESCARE Inc ($5000) for the bi-annual Kids Fund Day in the Port<br />
Park; Esperance Volunteer Fire and Rescue Service ($5000);<br />
Esperance Apex Club ($5200); and the Esperance Senior High<br />
School ($5000) to support the Tournament <strong>of</strong> the Minds teams<br />
participating interstate and to assist students touring with the Quiet<br />
Lions Tour <strong>of</strong> Thailand.<br />
The Port continues to support the Rotary Handicamp, Nulsen<br />
Primary School, Esperance Chamber <strong>of</strong> Commerce and Industry<br />
Business Awards, and the Cancer Council <strong>of</strong> WA.<br />
Esperance Ports’ Sponsorship Policy aims to assist organisations<br />
whose activities benefi t the wider community.<br />
Port Consultative Committee<br />
The Port Consultative Committee (PCC) held discussions about<br />
Elders Forestry (formerly ITC) plans to ship woodchips out <strong>of</strong><br />
Esperance and Cliffs Natural Resources proposal to increase iron<br />
ore exports. Both Elders and Cliffs personnel gave presentations to<br />
the Committee about their respective projects.<br />
Elders told the September 2009 meeting <strong>of</strong> the Committee that<br />
it had a 10-year contract to ship 400,000 tonnes <strong>of</strong> woodchips<br />
annually to Japan. The company owns about 45,000 hectares <strong>of</strong><br />
bluegum plantations within 100 kilometres <strong>of</strong> Esperance.<br />
The company spoke about the transport <strong>of</strong> the product,<br />
environmental matters including dust and noise associated with the<br />
project and the visual impact the stockpile would have.<br />
Cliffs outlined their proposal to increase iron ore exports from<br />
8.8 million tonnes annually to 11.5 million tonnes annually at the<br />
December 2009 meeting. The PCC was told that the Cliff’s proposal<br />
would be achieved by the use <strong>of</strong> existing infrastructure and service<br />
providers, that the number <strong>of</strong> trains or frequency <strong>of</strong> train movements<br />
would not change except that the rakes <strong>of</strong> wagons would be longer<br />
from the minesite, and that there would be an increase in the number<br />
<strong>of</strong> vessels berthing at the Port to load iron ore.<br />
Other matters discussed included the Mineral Concentrate Circuit<br />
Upgrade, the Port Expansion Pre-feasibility Study carried out by<br />
URS <strong>Australia</strong>, the Port’s ongoing dust monitoring program, results<br />
from marine sediment sampling and the proposed upgrade <strong>of</strong> the<br />
transport corridor into the Port.<br />
The Committee was also given an explanation about an incident<br />
in the Black Swan nickel storage shed on 18 August 2009, when<br />
product started to smolder which led to the Port being closed<br />
down. The progress <strong>of</strong> discussions with farmers about the potential<br />
to export agriculture produce in containers was also discussed.<br />
Community Consultation<br />
Esperance Ports and Cliffs Natural Resources conducted an<br />
Information Session for the community in relation to the company’s<br />
proposed increase in iron ore exports from 8.8 million tonnes<br />
annually to 11.5 million tonnes.<br />
Following an advertising campaign to inform local residents <strong>of</strong> the<br />
session, Cliffs outlined the proposal to interested people, which<br />
included changes required to the Port’s Environmental Licence to<br />
increase the amount <strong>of</strong> iron ore received and exported through<br />
Esperance.<br />
Issues discussed with local residents included the construction<br />
<strong>of</strong> a traffi c bridge to minimise risks between local traffi c and rail,<br />
reduction in noise by the use <strong>of</strong> modern locomotives, upgrades<br />
to the rail network and a guarantee the at the dust levels will not<br />
exceed the Port’s Licence limits.<br />
The consultation followed meetings with other key stakeholders<br />
including the Shire <strong>of</strong> Esperance, Department <strong>of</strong> Transport,<br />
Environmental Protection Authority, Department <strong>of</strong> Environment and<br />
Conservation and the Port Consultative Committee.<br />
Esperance Ports committed to monitor dust along a section <strong>of</strong> the<br />
rail network adjacent to the transport corridor that was a concern<br />
for some residents. Monitoring results will be made available to<br />
people living near the rail link.<br />
27
Human Resources<br />
Recruitment<br />
A major recruitment drive was initiated in March this year to replace<br />
employees who had left the Port the preceding 12 months because<br />
<strong>of</strong> natural attrition.<br />
A decision had been made following the closure <strong>of</strong> BHP Billiton’s<br />
Ravensthorpe Nickel Operations in October 2008 that any<br />
employee who left the Port would not be replaced. No employee<br />
was retrenched because <strong>of</strong> the closure. The closure <strong>of</strong> the mine<br />
affected the Port’s trade with the loss <strong>of</strong> bulk sulphur imports and<br />
container trade.<br />
With trade fi gures at the Port reaching record levels this fi nancial<br />
year and with Ravensthorpe Nickel being brought back into<br />
production by First Quantum Minerals, increases in iron ore exports,<br />
and new products being handled by the Port, a recruitment drive<br />
was initiated to increase the Port’s fi ve work teams to 11 members<br />
each and establish a pool <strong>of</strong> permanent casuals.<br />
By 30 June the required team numbers had been established and<br />
interviews held for the casual positions.<br />
Overall employment numbers increased from 101 at July 1 2009 to<br />
109 at the end <strong>of</strong> the fi nancial year.<br />
Industrial Relations<br />
At the end <strong>of</strong> the fi nancial year, negotiations were well advanced<br />
for the development <strong>of</strong> a new Esperance Ports Sea and Land<br />
Enterprise Bargaining Agreement.<br />
Owing to the time it had taken to reach consensus on a number <strong>of</strong><br />
issues, the Port and its operations employees agreed to negotiate a<br />
one-year agreement terminating on 31 December <strong>2010</strong> rather than<br />
a three-year agreement.<br />
All outstanding issues had been resolved by June 30 and the <strong>2010</strong><br />
EBA was lodged with Fair Work <strong>Australia</strong> in July.<br />
Negotiations for a new three-year agreement will be held early in the<br />
new fi nancial year with an agreement to be in place in early 2011.<br />
No lost time stoppages were experienced during the year.<br />
Training<br />
The major training focus at Esperance Ports during the fi nancial<br />
year was the establishment <strong>of</strong> an emergency response team. This<br />
was under the direction <strong>of</strong> the Mines Department who placed<br />
an improvement notice on the Port because <strong>of</strong> the nature <strong>of</strong> its<br />
operations, particularly employees working at heights and in<br />
enclosed spaces.<br />
Sixteen employees completed an extensive training program<br />
conducted by Ricklan Emergency Management Services Pty Ltd<br />
over a 10-month period. Each operation and maintenance team<br />
at the Port now has a minimum <strong>of</strong> four trained personnel who can<br />
carry out emergency procedures if required.<br />
More than $40,000 was spent on equipping the team with essential<br />
breathing apparatus and rope rescue equipment.<br />
During the year more than 4000 hours <strong>of</strong> formal training were<br />
conducted over a wide area <strong>of</strong> the activities carried out at the<br />
Port, including heavy metal induction and circuit orientation,<br />
tagging and isolation, ship’s mooring assessment, tanker<br />
watchman assessment, chemical alert training and plant supervisor<br />
assessment.<br />
Other areas <strong>of</strong> training included acquiring national accreditation<br />
for all crew members for elevated work platforms and forklifts,<br />
and bringing all train and hatchmen supervisors up to the level <strong>of</strong><br />
competency required for the position.<br />
New employees undertook extensive induction training before<br />
joining the Port’s operations and maintenance teams.<br />
Training for <strong>2010</strong>–11 will focus on the training <strong>of</strong> middle managers,<br />
supervisors and leading hands in the areas <strong>of</strong> effective supervisory<br />
and leadership skills, effective communication, and knowledge <strong>of</strong><br />
legal considerations.<br />
Occupational Health and Safety<br />
Esperance Ports Sea and Land aims to be recognised as an<br />
organisation with signifi cant commitment and outstanding<br />
performance in Occupational Health and Safety and Injury<br />
Management.<br />
The Port’s Board <strong>of</strong> Directors has supported the development <strong>of</strong><br />
the Port’s OHS Strategic Plan <strong>2010</strong>–15 that commits the Port to<br />
provide a work environment that is well maintained and safe for all<br />
individuals including employees, service providers, contractors and<br />
other visitors.<br />
28
ii<br />
II<br />
io-<br />
Llit<br />
Do<br />
to- 10v<br />
.r<br />
A<br />
r.'<br />
I 11<br />
kt<br />
0<br />
r 14<br />
0<br />
IL<br />
Esperance Ports’ pilot boat “Spitfire”<br />
The following OHS Strategic Objectives are based around identifi ed<br />
critical priorities:<br />
1. Reduce the frequency and impact <strong>of</strong> workplace injuries and<br />
illnesses;<br />
2. Establish effective Occupational Health and Safety<br />
Governance;<br />
3. Reduce incidents by eliminating hazards;<br />
4. Empower, motivate and train employees to identify and<br />
manage hazards effectively; and<br />
5. Enhance the pr<strong>of</strong>i le and practice <strong>of</strong> occupational health and<br />
safety at all levels <strong>of</strong> the Port’s management and workforce.<br />
To facilitate the commitment to employee consultation, the Esperance<br />
Ports has completed an Occupational Health and Safety employee<br />
perception survey within ten defi ned categories. A 100 percent<br />
involvement was attained and feedback on the results and the<br />
development <strong>of</strong> action plans to improve on OHS performance had<br />
commenced in consultation with various roles within the company.<br />
The Port has increased the number <strong>of</strong> safety representatives on site<br />
from fi ve to six. They are employees elected under the Mines Safety<br />
Inspection Act.<br />
Current initiatives <strong>of</strong> this group that operate under the direction <strong>of</strong><br />
the OHS Offi cer include the development <strong>of</strong> descriptive functions to<br />
assist OHS representatives execute their duties and improve overall<br />
OHS performance.<br />
The OHS committee has met quarterly through the 2009–<strong>2010</strong><br />
fi nancial year.<br />
The Port has identifi ed and addressed 688 items through the use<br />
<strong>of</strong> internal and external resources through monthly workplace<br />
inspections and audits.<br />
OHS Management Systems<br />
Esperance Ports engaged the services <strong>of</strong> a certifi ed lead auditor<br />
<strong>of</strong> OHS management systems to determine the conformance<br />
achieved and improvements required against the <strong>Australia</strong>n<br />
Standard 4801: Occupational Health and Safety Management<br />
systems.<br />
The following priorities were identifi ed:<br />
1. Develop procedures meeting the requirements <strong>of</strong> the AS 4801<br />
standard;<br />
2. Develop standards considered cardinal to Esperance Ports’<br />
safety rules, accompanied by a comprehensive training<br />
program to introduce and implement these rules;<br />
3. Establish a structured training program for managers,<br />
supervisors, service providers and contractors that address<br />
the requirements under the relevant Acts in which the Port<br />
operates; and<br />
4. Review and correct fi ndings within the Chemical Management<br />
System.<br />
A priority identifi ed in the 2008–09 fi nancial year that has been<br />
resolved was the development <strong>of</strong> an Asbestos Register and<br />
Asbestos Management Program.<br />
Injury Management<br />
Esperance Ports is committed to providing injury management<br />
support to employees who sustain an injury, illness or disability. In<br />
the event <strong>of</strong> a work related injury, illness or disability, the focus is<br />
on an employee returning to safe and meaningful work as early as<br />
possible in accordance with the Workers’ Compensation and Injury<br />
Management Act 1981.<br />
Esperance Ports’ Injury Management System has been assessed<br />
by RiskCover as complying with legislative requirements.<br />
OHS Statistics 2009–10<br />
(All rates represent rolling fi gures)<br />
Lost Time Injury Frequency Rate 30.40<br />
Lost Time Injury Duration Rate 5.4<br />
Number <strong>of</strong> Fatalities<br />
Nil<br />
Lost Time Injury/Disease Incidence Rate 4.7<br />
Lost Time Injury Severity Rate<br />
Nil<br />
Percent Injured Workers Returned to Work within 28 Weeks 100<br />
Occurrences reported to Department <strong>of</strong> Minerals & Petroleum 9<br />
Improvement Notices received 1<br />
Prohibition Notices received<br />
Nil<br />
29
I<br />
ili171401 I 11"pf 11.1p,<br />
Vs;<br />
'e 't<br />
ri<br />
4<br />
'),<br />
itt _A<br />
-<br />
4t1At<br />
,<br />
, '73<br />
- P9=V-It<br />
6<br />
a " A it<br />
-<br />
,<br />
I La-A t<br />
1 (10,-<br />
/1<br />
n' -NI n ILAIL ""f<br />
S<br />
fg<br />
-Sjalrit<br />
VITS<br />
isial\;_<br />
--<br />
1;1 1<br />
- - 4,--°<br />
_orrai/<br />
r<br />
1 -erre-nr-r-<br />
In I1[<br />
441.-<br />
PI,'I<br />
..:&11111;<br />
wa'<br />
I rl<br />
3 rat- ekl<br />
-Lt<br />
ly<br />
---Cet LA<br />
".1 "A-ClAireAV<br />
,..<br />
I% 21-r.,_21<br />
CL<br />
-<br />
2 A ,<br />
Inl'Ayirriiir,l,',.<br />
e<br />
LI- m' 2P Pell II II<br />
I<br />
ey a = c .eSti ja '111<br />
II , II 1<br />
II<br />
p I, 1 J<br />
4q. II<br />
'<br />
cP Thtal 'I 1 I II 11 ll<br />
1<br />
I' #kThlWa--:f INTTI:71-it ill II<br />
Iii<br />
11110<br />
' IC in<br />
ril I 1<br />
i fill<br />
I Ir II 1<br />
1 1,1,<br />
ilillloii, 1<br />
Lii<br />
I<br />
IIIIII4CeL'i II.<br />
1<br />
III it,I1 , I, r I' i<br />
ir h i I II 4<br />
0 '<br />
1 ' 1oi i '<br />
i" Is 111,<br />
, piLt 1<br />
I.' r iiiiII, i 1,<br />
jiii<br />
11 tfl 1,1,g :,,1<br />
, II<br />
Port personnel take part in an oil spill training exercise.
Financial Statements<br />
Contents<br />
Statement <strong>of</strong> Comprehensive Income 32<br />
Statement <strong>of</strong> Financial Position 33<br />
Statement <strong>of</strong> Changes in Equity 34<br />
Statement <strong>of</strong> Cash Flows 34<br />
Notes to the Financial Statements 35<br />
Directors’ Declaration 64<br />
Auditor’s Declaration 65<br />
31
Statement <strong>of</strong> Comprehensive Income<br />
For the year ended 30 June <strong>2010</strong><br />
Note <strong>2010</strong> 2009<br />
$’000 $’000<br />
Revenue 4 40,485 38,702<br />
Other income 5 1,350 3,591<br />
Depreciation and amortisation expense 6 (3,434) (3,458)<br />
Employee benefits 7 (11,689) (11,061)<br />
General administration 3 (3,086) (5,365)<br />
Asset maintenance 3 (7,097) (6,412)<br />
Contract services (6,211) (4,807)<br />
Power and water (5,488) (7,639)<br />
Insurance (594) (416)<br />
Government charges (1,010) (1,027)<br />
Finance costs 8 (3,868) (5,080)<br />
Other expenses 9 (119) (97)<br />
Pr<strong>of</strong>it / (Loss) before income tax (761) (3,069)<br />
Income tax (expense) / benefit 10 160 1,331<br />
Pr<strong>of</strong>it for the year (601) (1,738)<br />
The notes on pages 36 to 63 are an integral part <strong>of</strong> these financial statements.<br />
32
Wrap<br />
rntermwa7ferwireor-wfifexvaeow,<br />
"IMMTairrarforiff<br />
Statement <strong>of</strong> Financial Position<br />
As at 30 June <strong>2010</strong><br />
fir<br />
axe-7n<br />
*"7.7 . /V<br />
Note <strong>2010</strong> 2009<br />
$’000 $’000<br />
ASSETS<br />
Current Assets<br />
Cash and cash equivalents 12 6,822 8,249<br />
Trade and other receivables 13 10,089 10,418<br />
Inventories 14 1,849 1,768<br />
Current tax assets - -<br />
Total current assets 18,760 20,435<br />
Non Current Assets<br />
Trade and other receivables 13 45,106 49,332<br />
Deferred tax assets 10 4,783 3,673<br />
Property, plant and equipment 15 67,982 54,602<br />
Intangible assets 16 142 70<br />
Total non-current assets 118,013 107,677<br />
TOTAL ASSETS 136,773 128,112<br />
LIABILITIES<br />
Current Liabilities<br />
Trade and other payables 17 5,665 6,672<br />
Interest bearing borrowings 18 14,403 9,686<br />
Provisions 19 3,862 4,043<br />
Other 20 47 61<br />
Total current liabilities 23,977 20,462<br />
Non Current Liabilities<br />
Interest bearing borrowings 18 74,309 69,583<br />
Deferred tax liabilities 10 8,928 7,978<br />
Provisions 19 478 407<br />
Total non-current liabilities 83,715 77,968<br />
TOTAL LIABILITIES 107,692 98,430<br />
NET ASSETS 29,081 29,682<br />
EQUITY<br />
Contributed equity 21 2,209 2,209<br />
Retained earnings 21 26,872 27,473<br />
TOTAL EQUITY 29,081 29,682<br />
The notes on pages 36 to 63 are an integral part <strong>of</strong> these financial statements.<br />
AtttNANItitk.\\*ktA,N.fteallijSolteNtei<br />
kkatys1/2tN<br />
33<br />
ttakWtaNX,Wckei halkWvatMettlyactit
Statement <strong>of</strong> Changes in Equity<br />
For the year ended 30 June <strong>2010</strong><br />
Note Contributed equity Reserves Retained earnings Total equity<br />
$’000 $’000 $’000 $’000<br />
Balance as at 1 July 2008 2,209 29,211 31,420<br />
Total comprehensive income for the year (1,738) (1,738)<br />
Balance at 30 June 2009 2,209 26,784 29,682<br />
Balance at 1 July 2009 21 2,209 27,473 29,682<br />
Total comprehensive income for the year (601) (601)<br />
Balance at 30 June <strong>2010</strong> 2,209 26,872 29,081<br />
Statement <strong>of</strong> Cash Flows<br />
For the year ended 30 June <strong>2010</strong><br />
Note <strong>2010</strong> 2009<br />
$’000 $’000<br />
Cash flows from operating activities<br />
Cash receipts from customers 42,881 41,047<br />
Cash paid to suppliers and employees (36,330) (32,926)<br />
Cash generated from operations 6,551 8,121<br />
Interest paid (4,396) (5,080)<br />
Income taxes paid 458<br />
Net cash from operating activities 22 2,155 3,499<br />
Cash flows from investing activities<br />
Proceeds from sale <strong>of</strong> property, plant and equipment 3,852 3,841<br />
Acquisition <strong>of</strong> property, plant and equipment 15 (16,877) (5,703)<br />
Net cash from investing activities (13,025) (1,862)<br />
Cash flows from financing activities<br />
Repayment <strong>of</strong> borrowings (5,057) (4,102)<br />
Proceeds from borrowings 14,500 5,000<br />
Net cash from financing activities 9,443 898<br />
Net increase (decrease) in cash and cash equivalents (1,427) 2,535<br />
Cash and cash equivalents at 1 July 8,249 5,714<br />
Cash and cash equivalents at 30 June 12 6,822 8,249<br />
The notes on pages 36 to 63 are an integral part <strong>of</strong> these financial statements.<br />
34
Notes to the Financial Statements<br />
For the Year Ended 30 June <strong>2010</strong><br />
Note 1 Basis <strong>of</strong> preparation 36<br />
Note 2 Summary <strong>of</strong> signifi cant accounting policies 36<br />
Note 3 Expenses by nature 40<br />
Note 4 Revenue 41<br />
Note 5 Other Income 41<br />
Note 6 Depreciation and amortisation expense 41<br />
Note 7 Employee benefi ts expense 42<br />
Note 8 Finance costs 42<br />
Note 9 Other expenses 42<br />
Note 10 Income tax expense 43<br />
Note 11 Dividends 44<br />
Note 12 Cash and cash equivalents 45<br />
Note 13 Trade and other receivables 45<br />
Note 14 Inventories 46<br />
Note 15 Property, plant and equipment 46<br />
Note 16 Intangible assests 50<br />
Note 17 Trade and other payables 51<br />
Note 18 Interest bearing borrowings 51<br />
Note 19 Provisions 53<br />
Note 20 Other liabilities 55<br />
Note 21 Equity 55<br />
Note 22 Reconciliation <strong>of</strong> cash fl ows from 56<br />
operating activities<br />
Note 23 Financial instruments 56<br />
Note 24 Commitments 61<br />
Note 25 Remuneration <strong>of</strong> auditor 62<br />
Note 26 Related parties 62<br />
Note 27 Contingent liabilities 63<br />
35
1. Basis <strong>of</strong> preparation<br />
(a) Statement <strong>of</strong> compliance<br />
The financial report is a general purpose financial report which has<br />
been prepared in accordance with <strong>Australia</strong>n Accounting Standards<br />
(AASBs) (including <strong>Australia</strong>n Interpretations) adopted by the<br />
<strong>Australia</strong>n Accounting Standards Board (AASB) and the financial<br />
reporting provisions <strong>of</strong> the Port Authorities Act 1999, except as<br />
disclosed in note 1(b).<br />
The financial statements were authorised for issue on<br />
22 September <strong>2010</strong> by the Board <strong>of</strong> Directors <strong>of</strong> Esperance Port<br />
Authority (“the Authority”).<br />
(b) Presentation <strong>of</strong> the income statement<br />
During the year ended 30 June <strong>2010</strong> the Authority modified<br />
the Statement <strong>of</strong> Comprehensive Income presentation <strong>of</strong><br />
expenses using a classification based on the nature <strong>of</strong> expenses.<br />
Comparative amounts were reclassified for consistency.<br />
Classification <strong>of</strong> expenses by nature is considered to provide more<br />
relevant and reliable information than classification by function due<br />
to the nature <strong>of</strong> the Authority’s operations.<br />
The Directors have concluded that the financial statements present<br />
fairly the Authority’s financial position, financial performance and<br />
cash flows and that it has complied with applicable standards and<br />
interpretations, except that it has departed from AASB 101, para<br />
99, to achieve a fair presentation.<br />
(c) Basis <strong>of</strong> measurement<br />
The financial statements have been prepared on the accrual basis<br />
<strong>of</strong> accounting using the historical cost convention.<br />
(d) Functional and presentation currency<br />
These financial statements are presented in <strong>Australia</strong>n dollars and<br />
all values are rounded to the nearest thousand dollars ($’000)<br />
unless otherwise stated.<br />
(e) Use <strong>of</strong> estimates and judgements<br />
The preparation <strong>of</strong> financial statements requires management<br />
to make judgements, estimates and assumptions that affect the<br />
application <strong>of</strong> accounting policies and the reported amounts <strong>of</strong><br />
assets, liabilities, income and expenses. Actual results may differ<br />
from these estimates.<br />
Estimates and underlying assumptions are reviewed on an ongoing<br />
basis. Revisions to accounting estimates are recognised in the<br />
period in which the estimate is revised and in any future periods<br />
affected.<br />
In particular, information about significant areas <strong>of</strong> estimation<br />
uncertainty and critical judgements in applying accounting policies<br />
that have the most significant effect on the amounts recognised in<br />
the financial statements are:<br />
Operating lease commitments – as lessor<br />
The Authority has entered into commercial property leases on<br />
some <strong>of</strong> its land and buildings and has determined that it retains<br />
all the significant risks and rewards <strong>of</strong> ownership <strong>of</strong> these land and<br />
buildings and has thus classified the leases as operating leases.<br />
Defined benefit plans<br />
Various actuarial assumptions are required when determining the<br />
Authority’s superannuation obligations. These assumptions and the<br />
related carrying amounts are discussed in note 19(d).<br />
2. Summary <strong>of</strong> significant accounting<br />
policies<br />
The accounting policies set out below have been applied<br />
consistently to all periods presented in these financial statements<br />
unless otherwise stated.<br />
Certain comparative amounts have been reclassified to conform<br />
with the current year’s presentation [see note 1(b)].<br />
(a) Revenue recognition<br />
Revenue is measured at the fair value <strong>of</strong> consideration received or<br />
receivable. Revenue is recognised for the major business activities<br />
as follows:<br />
(i) Rendering <strong>of</strong> services<br />
Revenue from services rendered is recognised in pr<strong>of</strong>it or loss in<br />
proportion to the stage <strong>of</strong> completion <strong>of</strong> the transaction at the<br />
reporting date. Where the contract outcome cannot be measured<br />
reliably, revenue is recognised only to the extent <strong>of</strong> the expenses<br />
recognised that are recoverable.<br />
(ii) Interest<br />
Interest revenue is recognised as it accrues using the effective<br />
interest method [see note 2(b)].<br />
(iii) Rental income<br />
Rental income is recognised in the income statement on a straightline<br />
basis over the term <strong>of</strong> the lease. Lease incentives granted are<br />
recognised as an integral part <strong>of</strong> the total rental income.<br />
(b) Finance income and expenses<br />
Finance income comprises interest income on funds invested<br />
and interest receivable under finance leases. Interest income is<br />
recognised as it accrues in pr<strong>of</strong>it or loss, using the effective interest<br />
method. The interest receivable component <strong>of</strong> finance lease<br />
receivables is also recognised in the income statement using the<br />
effective interest rate method.<br />
Finance expenses comprise interest expense on borrowings. All<br />
borrowing costs are recognised in pr<strong>of</strong>it or loss using the effective<br />
interest method. The interest expense component <strong>of</strong> finance lease<br />
payments is also recognised in the income statement using the<br />
effective interest rate method.<br />
Borrowing costs are recognised as expenses in the period in which<br />
they are incurred except where they are directly attributable to<br />
the acquisition, construction or production <strong>of</strong> a qualifying asset in<br />
which case they are capitalised as part <strong>of</strong> the cost <strong>of</strong> the asset.<br />
36
In determining the amount <strong>of</strong> borrowing costs to be capitalised<br />
during the financial year, investment revenue earned directly relating<br />
to the borrowings, is deducted from the borrowing costs incurred.<br />
(c) Income tax<br />
The Authority operates within the national tax equivalent regime<br />
(“NTER”) whereby an equivalent amount in respect <strong>of</strong> income tax<br />
is payable to the State Government. The calculation <strong>of</strong> the liability<br />
in respect <strong>of</strong> income tax is governed by NTER guidelines and<br />
directions approved by Government.<br />
As a consequence <strong>of</strong> participation in the NTER, the Authority is<br />
required to comply with AASB 112 Income Taxes.<br />
Income tax expense comprises current and deferred tax. Income<br />
tax expense is recognised in pr<strong>of</strong>it or loss except to the extent that<br />
it relates to items recognised directly in equity, in which case it is<br />
recognised in equity.<br />
Current tax is the expected tax payable on the taxable income for<br />
the year, using tax rates enacted or substantively enacted at the<br />
reporting date, and any adjustment to tax payable in respect <strong>of</strong><br />
previous years.<br />
Deferred tax is recognised using the balance sheet method,<br />
providing for temporary differences between the carrying amounts<br />
<strong>of</strong> assets and liabilities for financial reporting purposes and the<br />
amounts used for taxation purposes. Deferred tax is not recognised<br />
on the initial recognition <strong>of</strong> assets or liabilities in a transaction that is<br />
not a business combination and that affects neither accounting nor<br />
taxable pr<strong>of</strong>it or loss. Deferred tax is measured at the tax rates that<br />
are expected to be applied to the temporary differences when they<br />
reverse, based on the laws that have been enacted or substantively<br />
enacted by the reporting date.<br />
A deferred tax asset is recognised to the extent that it is probable<br />
that future taxable pr<strong>of</strong>its will be available against which the<br />
temporary difference can be utilised. Deferred tax assets are<br />
reviewed at each reporting date and are reduced to the extent that<br />
it is no longer probable that the related tax benefit will be realised.<br />
(d) Receivables<br />
(i) Trade receivables<br />
Trade debtors are recognised and carried at the original invoice<br />
amounts less an allowance for any uncollectible amounts. Debtors<br />
are generally settled within 30 days except for property rentals,<br />
which are governed by individual lease agreements.<br />
The collectability <strong>of</strong> receivables is reviewed on an ongoing basis<br />
and any receivables identified as uncollectible are written-<strong>of</strong>f against<br />
the allowance account. The allowance for uncollectible amounts<br />
(doubtful debts) is raised when there is objective evidence that the<br />
Authority will not be able to collect its debts.<br />
(ii) Lease receivables<br />
A lease receivable is recognised for leases <strong>of</strong> property, plant and<br />
equipment which effectively transfers to the lessee substantially all<br />
<strong>of</strong> the risks and benefits incidental to legal ownership <strong>of</strong> the leased<br />
asset. The lease receivable is initially recognised as the amount <strong>of</strong><br />
the present value <strong>of</strong> the minimum lease payments receivable at the<br />
reporting date plus the present value <strong>of</strong> any unguaranteed residual<br />
value expected to accrue at the end <strong>of</strong> the lease term.<br />
Finance lease payments are allocated between interest revenue<br />
and reduction <strong>of</strong> the lease receivable over the term <strong>of</strong> the lease<br />
in order to reflect a constant periodic rate <strong>of</strong> return on the net<br />
investment outstanding in respect <strong>of</strong> the lease with interest<br />
revenue calculated using the interest rate implicit in the lease and<br />
recognised directly in the Statement <strong>of</strong> Comprehensive Income.<br />
(e) Inventories<br />
Inventories consist <strong>of</strong> stores which are measured at the lower <strong>of</strong><br />
cost and net realisable value.<br />
(f) Property, plant and equipment<br />
(i) Recognition and measurement<br />
Items <strong>of</strong> property, plant and equipment are measured at cost less<br />
accumulated depreciation and accumulated impairment losses.<br />
Cost includes expenditure that is directly attributable to the<br />
acquisition <strong>of</strong> the asset. The cost <strong>of</strong> self constructed assets<br />
includes the cost <strong>of</strong> materials and direct labour, any other costs<br />
directly attributable to bringing the asset to a working condition for<br />
its intended use, and the costs <strong>of</strong> dismantling and removing the<br />
items and restoring the site on which they are located. Purchased<br />
s<strong>of</strong>tware that is integral to the functionality <strong>of</strong> the related equipment<br />
is capitalised as part <strong>of</strong> that equipment.<br />
When parts <strong>of</strong> an item <strong>of</strong> property, plant and equipment have<br />
different useful lives, they are accounted for as separate items<br />
(major components) <strong>of</strong> property, plant and equipment.<br />
Gains and losses on disposal <strong>of</strong> an item <strong>of</strong> property, plant and<br />
equipment are determined by comparing the proceeds from<br />
disposal with the carrying amount <strong>of</strong> property, plant and equipment<br />
and are recognised net within “other income” in pr<strong>of</strong>it or loss.<br />
(ii) Subsequent costs<br />
The cost <strong>of</strong> replacing part <strong>of</strong> an item <strong>of</strong> property, plant and<br />
equipment is recognised in the carrying amount <strong>of</strong> the item if it is<br />
probable that the future economic benefits embodied within the<br />
part will flow to the Authority and its cost can be measured reliably.<br />
The carrying amount <strong>of</strong> the replaced part is derecognised. The<br />
costs <strong>of</strong> the day-to-day servicing <strong>of</strong> property, plant and equipment<br />
are recognised in pr<strong>of</strong>it or loss as incurred.<br />
(iii) Depreciation<br />
Depreciation is recognised in pr<strong>of</strong>it or loss on a straight line basis<br />
over the estimated useful lives <strong>of</strong> each part <strong>of</strong> an item <strong>of</strong> property,<br />
plant and equipment with the exception <strong>of</strong> motor vehicles being<br />
recognised on the diminishing value basis. Land is not depreciated.<br />
37
2. Summary <strong>of</strong> significant accounting<br />
policies (continued)<br />
(iii) Depreciation (continued)<br />
The estimated useful lives for each class <strong>of</strong> depreciable assets are<br />
as follows:<br />
• Channels 20–80 years<br />
• Breakwater 50 years<br />
• Buildings and ancillaries 5–50 years<br />
• Berths 20–25 years<br />
• Oil pipeline 20 years<br />
• Electrical services 5–40 years<br />
• Office equipment 2–15 years<br />
• Motor vehicles 4–7 years<br />
• Plant and equipment 2–20 years<br />
• Bulk loading facilities 3–40 years<br />
• Berth stabilisation and fenders 10–25 years<br />
Depreciation methods, useful lives and residual values are reviewed<br />
at each reporting date.<br />
(g) Intangible assets<br />
(i) Research and development<br />
Research costs are expensed as incurred.<br />
Development activities involve a plan or design for the production<br />
<strong>of</strong> new or substantially improved products and processes.<br />
Development expenditure is capitalised only if development costs<br />
can be measured reliably, the product or process is technically and<br />
commercially feasible, future economic benefits are probable, and<br />
the Authority intends to and has sufficient resources to complete<br />
development and to use or sell the asset. The expenditure<br />
capitalised includes the cost <strong>of</strong> materials, direct labour and<br />
overhead costs that are directly attributable to preparing the asset<br />
for its intended use. Other development expenditure is recognised<br />
in pr<strong>of</strong>it or loss as incurred.<br />
Capitalised development expenditure is measured at cost less<br />
accumulated amortisation and accumulated impairment losses.<br />
(ii) Subsequent expenditure<br />
Subsequent expenditure is capitalised only when it increases the<br />
future economic benefits embodied in the specific asset to which it<br />
relates.<br />
(iii) Computer s<strong>of</strong>tware<br />
S<strong>of</strong>tware that is an integral part <strong>of</strong> the related hardware is treated<br />
as property, plant and equipment. S<strong>of</strong>tware that is not an integral<br />
part <strong>of</strong> the related hardware is treated as an intangible asset.<br />
(iv) Amortisation<br />
Amortisation is recognised in pr<strong>of</strong>it or loss on a straight line basis<br />
over the estimated useful lives <strong>of</strong> intangible assets from the date<br />
that they are available for use. The estimated useful lives for each<br />
class <strong>of</strong> depreciable assets are as follows:<br />
• Computer s<strong>of</strong>tware 2–5 years<br />
• Licences 3 years<br />
(h) Impairment<br />
Property, plant and equipment and intangible assets are tested for<br />
any indication <strong>of</strong> impairment at each balance sheet date. Where<br />
there is any indication <strong>of</strong> impairment, the recoverable amount is<br />
estimated. Where the recoverable amount is less than the carrying<br />
amount, the asset is considered impaired and is written down to<br />
the recoverable amount and an impairment loss is recognised. As<br />
the Authority is a not-for-pr<strong>of</strong>it entity, the recoverable amount is<br />
the higher <strong>of</strong> an asset’s fair value less costs to sell and depreciated<br />
replacement cost.<br />
The risk <strong>of</strong> impairment is generally limited to circumstances<br />
where an asset’s depreciation is materially understated, where<br />
the replacement cost is falling or where there is a significant<br />
change in useful life. Each relevant class <strong>of</strong> assets is reviewed<br />
annually to verify that the accumulated depreciation/amortisation<br />
reflects the level <strong>of</strong> consumption or expiration <strong>of</strong> an asset’s future<br />
economic benefits and to evaluate any impairment risk from falling<br />
replacement costs.<br />
Intangible assets not yet available for use are tested for impairment<br />
at each balance sheet date irrespective <strong>of</strong> whether there is any<br />
indication <strong>of</strong> impairment.<br />
All impairment losses are recognised in pr<strong>of</strong>it or loss.<br />
An impairment loss is reversed if the reversal can be related<br />
objectively to an event occurring after the impairment loss was<br />
recognised. An impairment loss is reversed only to the extent<br />
that the asset’s carrying amount does not exceed the carrying<br />
amount that would have been determined, net <strong>of</strong> depreciation or<br />
amortisation, if no impairment loss had been recognised.<br />
(i) Leases<br />
Leases in terms <strong>of</strong> which the Authority assumes substantially all<br />
the risks and rewards <strong>of</strong> ownership are classified as finance leases.<br />
Upon initial recognition the leased asset is measured at an amount<br />
equal to the lower <strong>of</strong> its fair value and the present value <strong>of</strong> the<br />
minimum lease payments. Subsequent to initial recognition, the<br />
asset is accounted for in accordance with the accounting policy<br />
applicable to that asset.<br />
Other leases are operating leases and the leased assets are not<br />
recognised on the Authority’s balance sheet.<br />
Payments made under operating leases are recognised in pr<strong>of</strong>it<br />
or loss on a straight line basis over the term <strong>of</strong> the lease. Lease<br />
incentives received are recognised as an integral part <strong>of</strong> the total<br />
lease expense, over the term <strong>of</strong> the lease.<br />
Minimum lease payments made under finance leases are<br />
apportioned between the finance expense and the reduction <strong>of</strong><br />
the outstanding liability. The finance expense is allocated to each<br />
period during the lease term so as to produce a constant periodic<br />
rate <strong>of</strong> interest on the remaining balance <strong>of</strong> the liability. Contingent<br />
lease payments are accounted for by revising the minimum lease<br />
38
payments over the remaining term <strong>of</strong> the lease when the lease<br />
adjustment is confirmed.<br />
(j) Financial instruments<br />
In addition to cash, the Authority has three categories <strong>of</strong> financial<br />
instruments:<br />
• Loans and receivables;<br />
• Held to maturity investments; and<br />
• Financial liabilities measured at amortised cost.<br />
Refer to Note 23(ii) for further information on the classification <strong>of</strong><br />
financial instruments.<br />
Initial recognition and measurement is at fair value. The transaction<br />
cost or face value is equivalent to the fair value. Subsequent<br />
measurement is at amortised cost using the effective interest<br />
method.<br />
The fair value <strong>of</strong> short-term receivables and payables is the<br />
transaction cost or the face value because there is no interest rate<br />
applicable and subsequent measurement is not required as the<br />
effect <strong>of</strong> discounting is not material.<br />
(k) Payables<br />
Payables, including trade creditors, amounts payable and accrued<br />
expenses, are recognised for amounts to be paid in the future<br />
for goods and services received prior to the reporting date. The<br />
carrying amount is equivalent to fair value, as they are generally<br />
settled within 30 days.<br />
(l) Borrowings<br />
All borrowings are initially recognised at cost, being the fair value<br />
<strong>of</strong> the consideration received less directly attributable transaction<br />
costs. Subsequent measurement is at amortised cost using the<br />
effective interest rate method.<br />
Gains and losses are recognised in the Statement <strong>of</strong><br />
Comprehensive Income when the liabilities are derecognised, as<br />
well as through the amortisation process.<br />
Borrowing costs are expensed as incurred unless they relate to<br />
qualifying assets.<br />
(m) Employee benefits<br />
The liability for annual and long service leave expected to be settled<br />
within 12 months after the balance sheet date is recognised and<br />
measured at the undiscounted amounts expected to be paid when<br />
the liabilities are settled. <strong>Annual</strong> and long service leave expected<br />
to be settled more than 12 months after the balance sheet date<br />
is measured at the present value <strong>of</strong> amounts expected to be paid<br />
when the liabilities are settled. Leave liabilities are in respect <strong>of</strong><br />
services provided by employees up to the balance sheet date.<br />
When assessing expected future payments consideration is given<br />
to expected future wage and salary levels including non-salary<br />
components such as employer superannuation contributions.<br />
In addition, the long service leave liability also considers the<br />
experience <strong>of</strong> employee departures and periods <strong>of</strong> service.<br />
The expected future payments are discounted to present<br />
value using market yields at the balance sheet date on national<br />
government bonds with terms to maturity that match, as closely as<br />
possible, the estimated future cash outflows.<br />
All annual leave and unconditional long service leave provisions are<br />
classified as current liabilities as the Authority does not have an<br />
unconditional right to defer settlement <strong>of</strong> the liability for at least 12<br />
months after the balance sheet date.<br />
Associated payroll on-costs are included in the determination <strong>of</strong><br />
other provisions.<br />
(n) Employee superannuation<br />
The Gold State Superannuation Scheme (GSS), a defined benefit<br />
lump sum scheme, and the Superannuation and Family Benefits<br />
Act Scheme, a defined benefit pension scheme, are now closed to<br />
new members. The Authority is liable for superannuation benefits<br />
for past year’s service <strong>of</strong> members <strong>of</strong> the Superannuation and<br />
Family Benefits Act Scheme who elected to transfer to the GSS<br />
Scheme. The Authority accrues superannuation benefits to the<br />
pension scheme for those members who elected not to transfer<br />
from that scheme. Monthly contributions are also made to SERF<br />
to satisfy existing workforce requirements for waterside employees<br />
who transferred to the Authority during 1992 and for casual staff.<br />
The superannuation liability for existing employees with the pretransfer<br />
service incurred under the Superannuation and Family<br />
Benefits Act Scheme who transferred to the GSS Scheme are<br />
provided for at reporting date.<br />
The Authority’s total superannuation liability has been actuarially<br />
assessed as at 30 June 2009.<br />
Employees who are not members <strong>of</strong> either the Pension or the GSS<br />
Schemes became non contributory members <strong>of</strong> the West State<br />
Superannuation Scheme (WSS), an accumulation fund until 15<br />
April 2007. From 16 April 2007, employees who are not members<br />
<strong>of</strong> the Pension, GSS or WSS Schemes become non-contributory<br />
members <strong>of</strong> the GESB Superannuation Scheme (GESB Super),<br />
a taxed accumulation fund. The Authority makes concurrent<br />
contributions to the Government Employee Superannuation<br />
Board (GESB) on behalf <strong>of</strong> employees in compliance with the<br />
Commonwealth Government’s Superannuation Guarantee<br />
(Administration) Act 1992. These contributions extinguish the<br />
liability for superannuation charges in respect <strong>of</strong> the WSS and<br />
GESB Super Schemes.<br />
Defined benefit plan<br />
The Authority’s net obligation in respect <strong>of</strong> defined benefit pension<br />
plan is calculated separately by estimating the amount <strong>of</strong> future<br />
benefit that employees have earned in return for their service in the<br />
current and prior periods; that benefit is discounted to determine<br />
its present value, and the fair value <strong>of</strong> any plan assets is deducted.<br />
These benefits are unfunded.<br />
39
2. Summary <strong>of</strong> significant accounting<br />
policies (continued)<br />
(n) Employee superannuation (continued)<br />
The discount rate used is the market yield rate at the balance<br />
sheet date on national government bonds that have maturity<br />
dates approximating to the terms <strong>of</strong> the entity’s obligations. The<br />
calculation is performed by a qualified actuary using the actuarial<br />
cost method.<br />
The superannuation expense <strong>of</strong> the defined benefit plan is made up<br />
<strong>of</strong> the following elements:<br />
• Current service cost;<br />
• Interest cost (unwinding <strong>of</strong> the discount);<br />
• Actuarial gains and losses; and<br />
• Past service cost.<br />
Actuarial gains and losses <strong>of</strong> the defined benefit plan are<br />
recognised immediately as income and expense in the Statement<br />
<strong>of</strong> Comprehensive Income.<br />
The superannuation expense <strong>of</strong> the defined contribution plan is<br />
recognised as and when the contributions fall due.<br />
(o) Dividends<br />
Dividends are recognised as a liability in the period in which they<br />
are declared.<br />
(p) Provisions<br />
A provision is recognised if, as a result <strong>of</strong> a past event, the Authority<br />
has a present legal or constructive obligation that can be estimated<br />
reliably, and it is probable that an outflow <strong>of</strong> economic benefits will<br />
be required to settle the obligation. If the effect <strong>of</strong> the time value <strong>of</strong><br />
money is material, provisions are determined by discounting the<br />
expected future cash flows at a pre tax rate that reflects current<br />
market assessments <strong>of</strong> the time value <strong>of</strong> money and the risks<br />
specific to the liability.<br />
Where discounting is used, the increase in the provision due to the<br />
passage <strong>of</strong> time is recognised as finance costs.<br />
(q) Cash and cash equivalents<br />
Cash and cash equivalents in the Statement <strong>of</strong> Financial Position<br />
comprise cash on hand, cash at bank, at call deposits and term<br />
deposits due within 30 days.<br />
For the purpose <strong>of</strong> the Statement <strong>of</strong> Cash Flow, cash equivalents<br />
consist <strong>of</strong> cash and cash equivalents as defined above.<br />
(r) Goods and services tax<br />
Revenue, expenses and assets are recognised net <strong>of</strong> the amount<br />
<strong>of</strong> goods and services tax (GST), except where the amount <strong>of</strong><br />
GST incurred is not recoverable from the taxation authority. In<br />
these circumstances, the GST is recognised as part <strong>of</strong> the cost <strong>of</strong><br />
acquisition <strong>of</strong> the asset or as part <strong>of</strong> the expense.<br />
Receivables and payables are stated with the amount <strong>of</strong> GST<br />
included. The net amount <strong>of</strong> GST recoverable from, or payable to,<br />
the ATO is included as a current asset or liability in the Statement <strong>of</strong><br />
Financial Position.<br />
Cash flows are included in the statement <strong>of</strong> cash flows on a gross<br />
basis. The GST components <strong>of</strong> cash flows arising from investing<br />
and financing activities which are recoverable from, or payable to,<br />
the ATO are classified as operating cash flows.<br />
(s) Contributed equity<br />
The Authority receives support from the WA Government (see<br />
note 21). The amount received is recognised directly as a credit to<br />
contributed equity.<br />
(t) New standards and interpretations not yet adopted<br />
The following standards, amendments to standards and<br />
interpretations have been identified as those which may impact the<br />
entity in the period <strong>of</strong> initial application. They are available for early<br />
adoption at 30 June 2009, but have not been applied in preparing<br />
this financial report:<br />
• Revised AASB 101 Presentation <strong>of</strong> Financial Statements<br />
(2007) introduces the term total comprehensive income, which<br />
represents changes in equity during a period other than those<br />
changes resulting from transactions with owners in their capacity<br />
as owners. Total comprehensive income may be presented in<br />
either a single statement <strong>of</strong> comprehensive income (effectively<br />
combining both the income statement and all non-owner changes<br />
in equity in a single statement) or, in an income statement and<br />
a separate statement <strong>of</strong> comprehensive income. Revised AASB<br />
101, which becomes mandatory for the Authority’s 30 June <strong>2010</strong><br />
financial statements, is expected to have a significant impact on<br />
the presentation <strong>of</strong> the financial statements. The Authority plans<br />
to provide total comprehensive income in a single statement <strong>of</strong><br />
comprehensive income for its <strong>2010</strong> financial statements.<br />
• Revised AASB 123 Borrowing Costs removes the option to<br />
expense borrowing costs and requires that an entity capitalise<br />
borrowing costs directly attributable to the acquisition, construction<br />
or production <strong>of</strong> a qualifying asset as part <strong>of</strong> the cost <strong>of</strong> that asset.<br />
The revised AASB 123 will become mandatory for the Authority’s<br />
30 June <strong>2010</strong> financial statements. The Authority already<br />
capitalises borrowing costs directly attributable to qualifying assets,<br />
therefore there will be no impact in the Authority’s 30 June <strong>2010</strong><br />
financial statements.<br />
3. Expenses by nature<br />
Operating expenses are presented on the face <strong>of</strong> the Statement<br />
<strong>of</strong> Comprehensive Income using a classification based on the<br />
nature <strong>of</strong> expenses (see note 1(b)). Marine expenses include those<br />
expenses derived from water-based activities, Port operations<br />
expenses include those expenses related to land-based support<br />
activities, whilst general administration expenses includes<br />
expenditure <strong>of</strong> an administrative nature.<br />
40
4. Revenue<br />
Revenue Consists <strong>of</strong> the following items:<br />
<strong>2010</strong> 2009<br />
$’000 $’000<br />
Rendering <strong>of</strong> services<br />
Charges on cargo 6,957 7,416<br />
Charges on ships 10,753 9,831<br />
Port services 17,422 15,916<br />
Infrastructure charge 3,905 3,993<br />
Interest revenue on bank accounts 294 376<br />
Rentals and leases 810 889<br />
Other operating revenue 344 281<br />
Total revenue 40,485 38,702<br />
5. Other income<br />
Other Income Consists <strong>of</strong> the following items:<br />
<strong>2010</strong> 2009<br />
$’000 $’000<br />
Net gain on sale <strong>of</strong> property, plant and equipment 4 -<br />
Sale <strong>of</strong> electricity and water 1,346 3,591<br />
1,350 3,591<br />
6. Depreciation and amortisation expense<br />
<strong>2010</strong> 2009<br />
$’000 $’000<br />
Depreciation<br />
Buildings and ancillaries 601 665<br />
Berths one and two 273 274<br />
Berth three and ship loader 35 35<br />
Berth stabilisation and fenders 210 219<br />
Breakwater 210 210<br />
Bulk loading facilities 721 715<br />
Channels 240 218<br />
Electrical services 86 87<br />
Office equipment 96 81<br />
Oil pipeline 18 18<br />
Plant and equipment 905 911<br />
Total depreciation 3,395 3,433<br />
Amortisation<br />
Intangible assets 39 25<br />
Total amortisation 39 25<br />
Total depreciation and amortisation 3,434 3,458<br />
41
7. Employee Benefits Expense<br />
<strong>2010</strong> 2009<br />
$’000 $’000<br />
Wages and salaries 10,649 10,045<br />
Superannuation – defined benefit plans (see note 19(d)) 902 816<br />
Long service leave 92 43<br />
<strong>Annual</strong> leave 2 136<br />
Sick leave 50 24<br />
Accumulated days <strong>of</strong>f (6) (3)<br />
11,689 11,061<br />
Employment on-costs such as workers’ compensation insurance and payroll tax are included at note 9 ‘Other expenses’.<br />
The employment on-costs liability is included at note 19 ‘Provisions’.<br />
8. Finance Costs<br />
<strong>2010</strong> 2009<br />
$’000 $’000<br />
Interest paid 5,194 4,878<br />
Hedging Loss / (Gain) (528) 202<br />
4,666 5,080<br />
Borrowing costs capitalised (798) -<br />
Finance costs expensed 3,868 5,080<br />
9. Other Expenses<br />
<strong>2010</strong> 2009<br />
$’000 $’000<br />
Employee on-costs (a) 11 11<br />
Fringe benefits tax 98 70<br />
Sundry 10 8<br />
Impairment loss - -<br />
Loss on sale <strong>of</strong> assets - 8<br />
119 97<br />
(a) Includes workers’ compensation insurance, payroll tax and other employment on-costs. The on-costs liability associated<br />
with the recognition <strong>of</strong> annual and long service leave liability is included at note 19 ‘Provisions’. Superannuation contributions<br />
accrued as part <strong>of</strong> the provision for leave are employee benefits and are not included in employee on-costs.<br />
42
10. Income Tax Expense<br />
<strong>2010</strong> 2009<br />
$’000 $’000<br />
Recognised in the Statement <strong>of</strong> Comprehensive Income<br />
Deferred tax expense<br />
Origination and reversal <strong>of</strong> temporary differences (160) (1,003)<br />
Change in the unrecognised temporary differences - (328)<br />
(160) (1,331)<br />
Total income tax expense / (benefit) (160) (1,331)<br />
Numerical Reconciliation Between Tax Expense and Pre Tax Net Pr<strong>of</strong>it<br />
<strong>2010</strong> 2009<br />
$’000 $’000<br />
(Loss) / Pr<strong>of</strong>it for the period (601) (1,738)<br />
Total income tax (benefit) expense (160) (1,331)<br />
(Loss) / Pr<strong>of</strong>it excluding income tax (761) (3,069)<br />
Income tax using the statutory tax rate <strong>of</strong> 30% (2009: 30%) (198) (921)<br />
Non-deductible expenses 38 (82)<br />
(160) (1,003)<br />
Under / (over) provision in prior years - (328)<br />
Prior year tax losses not recognised now recouped - -<br />
Income tax expense / (benefit) (160) (1,331)<br />
Income tax recognised directly in equity<br />
Income tax on income and expense recognised directly in equity - -<br />
Total income tax recognised directly in equity - -<br />
43
10. Income Tax Expense (continued)<br />
Deferred Income Tax<br />
Statement <strong>of</strong><br />
Statement <strong>of</strong><br />
Financial Position Comprehensive Income<br />
<strong>2010</strong> 2009 <strong>2010</strong> 2009<br />
$’000 $’000 $’000 $’000<br />
Deferred tax liabilities<br />
Other adjustments (62) -<br />
Accelerated depreciation for tax purposes (7,620) (6,843)<br />
Finance lease receivable (current) (1,246) (1,135)<br />
Gross deferred tax liabilities (8,928) (7,978)<br />
Deferred tax assets<br />
Employee benefits 717 676<br />
Prepaid rental 14 18<br />
Tax Losses 3,897 2,648<br />
Others 155 331<br />
Gross deferred tax assets 4,783 3,673<br />
Set-<strong>of</strong>f <strong>of</strong> deferred tax liabilities pursuant to set-<strong>of</strong>f provisions (8,929) (7,978)<br />
Net deferred tax assets / (liability) (4,146) (4,305)<br />
Deferred tax charge (160) (1,331)<br />
Current tax liabilities<br />
The current tax liability <strong>of</strong> Nil (2009: Nil) represents the amount <strong>of</strong> income taxes payable in respect <strong>of</strong> current and prior<br />
financial periods.<br />
11. Dividends<br />
<strong>2010</strong> 2009<br />
$’000 $’000<br />
Dividends paid in the financial year - -<br />
In accordance with Government Financial Policy, WA Ports are required to pay dividends <strong>of</strong> 65% <strong>of</strong> after tax pr<strong>of</strong>its. However,<br />
in accordance with <strong>Australia</strong>n Accounting Standards, dividends relating to the financial results for the year ended 30 June<br />
<strong>2010</strong> have not been provided as they are expected to be declared by Government after balance date.<br />
A dividend <strong>of</strong> ‘NIL’ (2009: NIL) in respect <strong>of</strong> the financial results for the year ended 30 June 2009 was paid by 30 June <strong>2010</strong>.<br />
44
12. Cash and Cash Equivalents<br />
<strong>2010</strong> 2009<br />
$’000 $’000<br />
Bank balances 5,322 6,749<br />
Term deposits 1,500 1,500<br />
Cash and cash equivalents in the statements <strong>of</strong> cash flows 6,822 8,249<br />
The Authority’s exposure to interest rate risk and sensitivity analysis for financial assets and liabilities are disclosed in note 23(i).<br />
13. Trade and Other Receivables<br />
<strong>2010</strong> 2009<br />
$’000 $’000<br />
Current<br />
Receivables 5,901 6,433<br />
Less: allowance for impairment <strong>of</strong> receivables - -<br />
5,901 6,433<br />
Accrued revenue 16 2<br />
GST receivable - 135<br />
Finance lease receivable 4,153 3,784<br />
Prepayments 19 64<br />
10,089 10,418<br />
Non-current<br />
Finance lease receivable 45,106 49,332<br />
45,106 49,332<br />
Reconciliation <strong>of</strong> changes in the allowance for impairment <strong>of</strong> receivables:<br />
Balance at start <strong>of</strong> year 59,783 59,783<br />
Doubtful debts expense recognised in the Statement <strong>of</strong> Comprehensive Income - -<br />
Amounts written <strong>of</strong>f during the year - -<br />
Amount recovered during the year 4,588 -<br />
Balance at end <strong>of</strong> year 55,195 59,783<br />
The Authority does not hold any collateral as security or other credit enhancements relating to receivables.<br />
The Authority does not hold any financial assets that had to have their terms renegotiated that would have otherwise resulted<br />
in them being past due or impaired.<br />
At 30 June, the ageing analysis <strong>of</strong> trade debtors past due but not impaired was nil.<br />
45
14. Inventories<br />
<strong>2010</strong> 2009<br />
$’000 $’000<br />
Current<br />
Stores– at cost 1,849 1,768<br />
1,849 1,768<br />
15. Property, Plant and Equipment<br />
<strong>2010</strong> 2009<br />
$’000 $’000<br />
Channels<br />
At cost 16,119 16,119<br />
Accumulated depreciation (3,010) (2,770)<br />
Accumulated impairment losses - -<br />
13,109 13,349<br />
Land<br />
At cost 1,282 1,282<br />
Accumulated impairment losses - -<br />
1,282 1,282<br />
Buildings and ancillaries<br />
At cost 13,169 12,839<br />
Accumulated depreciation (3,343) (2,743)<br />
Accumulated impairment losses - -<br />
9,826 10,096<br />
Berths One and Two<br />
At cost 6,140 6,140<br />
Accumulated depreciation (3,794) (3,520)<br />
Accumulated impairment losses - -<br />
2,346 2,620<br />
Berth Three and ship loader<br />
At cost 590 590<br />
Accumulated depreciation (253) (218)<br />
Accumulated impairment losses - -<br />
337 372<br />
Berth stabilisation and fenders<br />
At cost 3,911 3,911<br />
Accumulated depreciation (2,194) (1,985)<br />
Accumulated impairment losses - -<br />
1,717 1,926<br />
Breakwater<br />
At cost 10,482 10,482<br />
Accumulated depreciation (2,463) (2,253)<br />
Accumulated impairment losses - -<br />
8,019 8,229<br />
Bulk loading facilities<br />
At cost 16,697 16,697<br />
Accumulated depreciation (12,407) (11,686)<br />
Accumulated impairment losses - -<br />
4,290 5,011<br />
46
15. Property, Plant and Equipment (continued)<br />
<strong>2010</strong> 2009<br />
$’000 $’000<br />
Electrical services<br />
At cost 1,672 1,672<br />
Accumulated depreciation (472) (386)<br />
Accumulated impairment losses - -<br />
1,200 1,286<br />
Office equipment<br />
At cost 658 601<br />
Accumulated depreciation (462) (461)<br />
Accumulated impairment losses - -<br />
196 140<br />
Oil pipeline<br />
At cost 360 360<br />
Accumulated depreciation (252) (234)<br />
Accumulated impairment losses - -<br />
108 126<br />
Plant and equipment<br />
At cost 8,296 8,111<br />
Accumulated depreciation (4,607) (3,777)<br />
Accumulated impairment losses - -<br />
3,689 4,334<br />
Total property, plant and equipment at net book value 46,119 48,771<br />
Add: Work in progress (at cost) 21,863 5,831<br />
Total property, plant and equipment 67,982 54,602<br />
47
15. Property, Plant and Equipment (continued)<br />
Reconciliations <strong>of</strong> the carrying amounts <strong>of</strong> property, plant and equipment at the beginning and end <strong>of</strong> the reporting period<br />
are set out below.<br />
<strong>2010</strong> 2009<br />
$’000 $’000<br />
Breakwater<br />
Carrying amount at 1 July 8,229 8,438<br />
Depreciation for the year (210) (209)<br />
Impairment losses - -<br />
Carrying amount at 30 June 8,019 8,229<br />
Land<br />
Carrying amount at 1 July 1,282 1,282<br />
Additions - -<br />
Disposals - -<br />
Impairment losses - -<br />
Carrying amount at 30 June 1,282 1,282<br />
Buildings and ancillaries<br />
Carrying amount at 1 July 10,096 10,639<br />
Additions 331 122<br />
Depreciation for the year (601) (665)<br />
Disposals - -<br />
Impairment losses - -<br />
Carrying amount at 30 June 9,826 10,096<br />
Berths One and Two<br />
Carrying amount at 1 July 2,620 2,893<br />
Depreciation for the year (274) (273)<br />
Disposals - -<br />
Impairment losses - -<br />
Carrying amount at 30 June 2,346 2,620<br />
Berth Three and ship loader<br />
Carrying amount at 1 July 372 407<br />
Additions - -<br />
Depreciation for the year (35) (35)<br />
Disposals - -<br />
Impairment losses - -<br />
Carrying amount at 30 June 337 372<br />
48
15. Property, Plant and Equipment (continued)<br />
Reconciliations <strong>of</strong> the carrying amounts <strong>of</strong> property, plant and equipment at the beginning and end <strong>of</strong> the reporting period<br />
are set out below.<br />
<strong>2010</strong> 2009<br />
$’000 $’000<br />
Berth stabilisation and fenders<br />
Carrying amount at 1 July 1,926 2,145<br />
Depreciation for the year (209) (219)<br />
Impairment losses - -<br />
Carrying amount at 30 June 1,717 1,926<br />
Bulk loading facilities<br />
Carrying amount at 1 July 5,011 5,630<br />
Additions - 96<br />
Disposals - -<br />
Depreciation for the year (721) (715)<br />
Impairment losses - -<br />
Carrying amount at 30 June 4,290 5,011<br />
Channels<br />
Carrying amount at 1 July 13,349 13,568<br />
Additions - -<br />
Depreciation for the year (240) (219)<br />
Disposals - -<br />
Impairment losses - -<br />
Carrying amount at 30 June 13,109 13,349<br />
Electrical services<br />
Carrying amount at 1 July 1,286 1,373<br />
Depreciation for the year (86) (87)<br />
Additions - -<br />
Disposals - -<br />
Impairment losses - -<br />
Carrying amount at 30 June 1,200 1,286<br />
Office equipment<br />
Carrying amount at 1 July 140 180<br />
Additions 151 40<br />
Disposals (94) -<br />
Depreciation for the year (1) (80)<br />
Disposals - -<br />
Impairment losses - -<br />
Carrying amount at 30 June 196 140<br />
49
15. Property, Plant and Equipment (continued)<br />
Reconciliations <strong>of</strong> the carrying amounts <strong>of</strong> property, plant and equipment at the beginning and end <strong>of</strong> the reporting period are<br />
set out below.<br />
<strong>2010</strong> 2009<br />
$’000 $’000<br />
Oil pipeline<br />
Carrying amount at 1 July 126 144<br />
Depreciation for the year (18) (18)<br />
Disposals - -<br />
Impairment losses - -<br />
Carrying amount at 30 June 108 126<br />
Plant and equipment<br />
Carrying amount at 1 July 4,334 4,503<br />
Additions 362 840<br />
Depreciation for the year (837) (911)<br />
Disposals (170) (98)<br />
Impairment losses - -<br />
Carrying amount at 30 June 3,689 4,334<br />
Work in progress<br />
Carrying amount at 1 July 5,831 13,313<br />
Additions 16,032 4,613<br />
Transfers to finance lease - (12,095)<br />
Carrying amount at 30 June 21,863 5,831<br />
Total property, plant and equipment 67,982 54,602<br />
16. Intangible Assets<br />
<strong>2010</strong> 2009<br />
$’000 $’000<br />
Computer s<strong>of</strong>tware<br />
At cost 329 297<br />
Accumulated amortisation (187) (227)<br />
Accumulated impairment losses - -<br />
142 70<br />
Reconciliation <strong>of</strong> carrying amounts<br />
Computer s<strong>of</strong>tware<br />
Carrying amount at 1 July 70 63<br />
Additions 112 32<br />
Impairment losses recognised in income statement - -<br />
Amortisation expense (40) (25)<br />
Carrying amount at 30 June 142 70<br />
50
17. Trade and Other Payables<br />
<strong>2010</strong> 2009<br />
$’000 $’000<br />
Current<br />
Trade payables 1,990 3,374<br />
Income in advance 845 299<br />
GST payable 184 -<br />
Accrued expenses 2,344 2,169<br />
Fair value derivatives 302 830<br />
5,665 6,672<br />
The Authority’s exposure to liquidity risk related to trade and other payables is disclosed in note 23(i).<br />
18. Interest Bearing Borrowings<br />
This note provides information about the contractual terms <strong>of</strong> the Authority’s interest bearing borrowings, which are measured<br />
at amortised cost. For more information about the Authority’s exposure to interest rate and liquidity risk, see note 23(i).<br />
<strong>2010</strong> 2009<br />
$’000 $’000<br />
Current liabilities<br />
Direct borrowings 14,403 9,686<br />
14,403 9,686<br />
Non-current liabilities<br />
Direct borrowings 74,309 69,583<br />
74,309 69,583<br />
Financing arrangements<br />
The Authority has access to the following lines <strong>of</strong> credit:<br />
Total facilities available:<br />
Direct and special borrowings 103,400 79,417<br />
103,400 79,417<br />
Facilities utilised at reporting date:<br />
Direct borrowings 88,712 79,269<br />
88,712 79,269<br />
Facilities not utilised at reporting date:<br />
Direct borrowings 14,688 148<br />
14,688 148<br />
Significant Terms and Conditions<br />
The Port Authority’s loans and borrowings are financed at fixed rate <strong>of</strong> interest; therefore changes in the interest rates will<br />
have no impact on the pr<strong>of</strong>itability <strong>of</strong> the Port Authority.<br />
51
18. Interest Bearing Borrowings (continued)<br />
Interest Rate Risk Exposure<br />
The Authority’s exposure to interest rate risk on the interest bearing borrowings and the effective weighted average interest<br />
rate at year end by maturity periods is set out in the following table.<br />
<strong>2010</strong><br />
Fixed interest rate<br />
Variable 1 year or Over 1 Over 2 Over 3 Over 4 More Total<br />
interest less to 2 to 3 to 4 to 5 than 5<br />
rate years years years years years<br />
$’000 $’000 $’000 $’000 $’000 $’000 $’000 $’000<br />
Interest bearing borrowings:<br />
Direct borrowings 6,891 - - - - - - 6,891<br />
Special borrowings - 15,074 5,483 5,838 6,216 6,619 42,591 81,821<br />
6,891 15,074 5,483 5,838 6,216 6,619 42,591 88,712<br />
Weighted average interest rate:<br />
Direct borrowings 5.75 - - - - - - 5.75<br />
Special borrowings - 6.25 6.25 6.25 6.25 6.25 6.25 -<br />
2009<br />
Fixed interest rate<br />
Variable 1 year or Over 1 Over 2 Over 3 Over 4 More Total<br />
interest less to 2 to 3 to 4 to 5 than 5<br />
rate years years years years years<br />
$’000 $’000 $’000 $’000 $’000 $’000 $’000 $’000<br />
Interest bearing borrowings:<br />
Direct borrowings 7,523 - - - - - - 7,523<br />
Special borrowings - 9,692 8,037 4,301 4,582 4,882 40,252 71,746<br />
7,523 9,692 8,037 4,301 4,582 4,882 40,252 79,269<br />
Weighted average interest rate:<br />
Direct borrowings 5.34 - - - - - - 5.34<br />
Special borrowings - 6.3 6.3 6.3 6.3 6.3 6.3 6.3<br />
52
19. Provisions<br />
<strong>2010</strong> 2009<br />
$’000 $’000<br />
Current<br />
Employee benefits provision<br />
Salaries and wages accrued 38 296<br />
<strong>Annual</strong> leave (a) 830 828<br />
Long service leave (b) 502 447<br />
Superannuation 4 4<br />
Sick leave 455 435<br />
Liability for accumulated days <strong>of</strong>f 155 160<br />
Other provisions<br />
Employment on-costs 136 131<br />
Dividend provision 1,742 1,742<br />
3,862 4,043<br />
Non-current<br />
Employee benefits provision<br />
Long service leave (b) 316 279<br />
Superannuation 25 26<br />
Sick leave 104 75<br />
Other provisions<br />
Employment on-costs (c) 33 27<br />
478 407<br />
(a) <strong>Annual</strong> leave liabilities have been classified as current as there is no unconditional right to defer settlement for at least 12<br />
months after balance sheet date. Assessments indicate that actual settlement <strong>of</strong> the liabilities will occur as follows:<br />
<strong>2010</strong> 2009<br />
$’000 $’000<br />
Within 12 months <strong>of</strong> balance date 561 629<br />
More than 12 months after balance sheet date 269 199<br />
830 828<br />
(b) Long service leave liabilities have been classified as current where there is no unconditional right to defer settlement for at<br />
least 12 months after balance sheet date. Assessments indicate that actual settlement <strong>of</strong> the liabilities will occur as follows:<br />
<strong>2010</strong> 2009<br />
$’000 $’000<br />
Within 12 months <strong>of</strong> balance date 270 279<br />
More than 12 months after balance sheet date 548 447<br />
818 726<br />
(c) The settlement <strong>of</strong> annual and long service leave liabilities gives rise to the payment <strong>of</strong> employment on-costs including<br />
workers’ compensation premiums and payroll tax. The provision is measured at the present value <strong>of</strong> expected future payments.<br />
The associated expense, apart from the unwinding <strong>of</strong> the discount (finance cost), is included at note 9 ‘Other expenses’.<br />
53
19. Provisions (continued)<br />
(d) Defined benefit superannuation plans<br />
The following is a summary <strong>of</strong> the most recent financial position <strong>of</strong> the Pension Scheme related to the Authority calculated in<br />
accordance with AASB 119 Employee Benefits.<br />
<strong>2010</strong> 2009<br />
$’000 $’000<br />
Amounts recognised in the Statement <strong>of</strong> Financial Position:<br />
Present value <strong>of</strong> unfunded obligations 29 30<br />
Fair value <strong>of</strong> plan assets<br />
29 30<br />
Reconciliation <strong>of</strong> movement in the present value <strong>of</strong> the unfunded obligations<br />
recognised in the Statement <strong>of</strong> Financial Position:<br />
Opening balance 30 29<br />
Current service cost 3 5<br />
Interest cost - -<br />
Actuarial gain on liabilities - -<br />
Benefits paid (including expenses and taxes) (4) (4)<br />
29 30<br />
Amounts recognised in the Statement <strong>of</strong> Comprehensive Income:<br />
Current service cost<br />
Interest cost 1 2<br />
Actual gain recognised 2 3<br />
3 5<br />
Historic summary:<br />
Defined benefit plan obligation 29 30<br />
Plan assets<br />
29 30<br />
Experience adjustments arising on plan liabilities - -<br />
Experience adjustments arising on plan assets - -<br />
Principal actuarial assumptions:<br />
Discount rate 5.48 5.34<br />
Expected future salary increases 4.5 4.5<br />
Expected future pension increases 2.5 2.5<br />
Anticipated return on plan assets - -<br />
Expected contributions: 4 4<br />
Employer contributions are made to meet the cost <strong>of</strong> retirement benefit obligations as they fall due. For further details<br />
regarding the policy in respect <strong>of</strong> provision for retirement benefit obligations, refer to note 2(n).<br />
54
19. Provisions (continued)<br />
Movements in provisions<br />
Reconciliations for the carrying amounts <strong>of</strong> each class <strong>of</strong> provision, except for employee benefits are set out below:<br />
<strong>2010</strong><br />
$’000<br />
Retirement benefit obligations<br />
Carrying amount at 1 July 30<br />
Provisions made during the year -<br />
Amounts utilised in the year (1)<br />
Carrying amount at 30 June 29<br />
Employment on-costs provision<br />
Carrying amount at 1 July 161<br />
Provisions made during the year 9<br />
Amounts utilised in the year -<br />
Carrying amount at 30 June 170<br />
20. Other Liabilities<br />
<strong>2010</strong> 2009<br />
$’000 $’000<br />
Current<br />
Prepaid rental income 47 61<br />
47 61<br />
21. Equity<br />
<strong>2010</strong> 2009<br />
$’000 $’000<br />
Contributed equity<br />
Balance at the start <strong>of</strong> the year 2,209 2,209<br />
Capital contributions - -<br />
Balance at end <strong>of</strong> year 2,209 2,209<br />
Retained earnings<br />
Balance at start <strong>of</strong> year 27,473 29,211<br />
Pr<strong>of</strong>it / (Loss) for the period (601) (1,738)<br />
Balance at end <strong>of</strong> year 26,872 27,473<br />
55
22. Reconciliation <strong>of</strong> Cash Flows from Operating Activities<br />
Note <strong>2010</strong> 2009<br />
$’000 $’000<br />
Cash flows from operating activities<br />
Pr<strong>of</strong>it / (Loss) for the period (601) (1,738)<br />
Adjustments for:<br />
Depreciation 6 3,395 3,433<br />
Amortisation <strong>of</strong> intangible assets 6 39 25<br />
Loss / (Gain) on sale <strong>of</strong> property, plant and equipment 5 (4) 8<br />
Loss / (Gain) on currency hedging (528) 202<br />
Income tax expense 10 (160) (1,331)<br />
Operating pr<strong>of</strong>it before changes in working capital and provisions 2,141 599<br />
Change in trade and other receivables 13 698 (297)<br />
Change in inventories 14 (81) (165)<br />
Change in trade and other payables 17 (479) 2,729<br />
Change in provisions and employee benefits 19 (124) 175<br />
2,155 3,041<br />
Income taxes paid / (received) - 458<br />
Net cash from operating activities 2,155 3,499<br />
23. Financial instruments<br />
(i) Financial risk management objectives and policies<br />
The Authority’s principal financial instruments comprise cash and cash equivalents, receivables, payables, interest bearing<br />
borrowings, and finance leases. The Authority has limited exposure to financial risks. The Authority’s overall risk management<br />
program focuses on managing the risks identified below.<br />
Market risk<br />
Market risk is the risk that changes in market prices such as foreign exchange rates and interest rates will affect the<br />
Authority’s income or the value <strong>of</strong> its holdings <strong>of</strong> financial instruments. The Authority does not trade in foreign currency and is<br />
not materially exposed to other price risks.<br />
The Authority’s exposure to market risk for changes in interest rates relates primarily to its long-term debt obligations. The<br />
Authority’s borrowings are all obtained through the <strong>Western</strong> <strong>Australia</strong>n Treasury Corporation (WATC) and are at fixed rates<br />
with varying maturities. The risk is managed by WATC through portfolio diversification and variation in maturity dates. Other<br />
than as detailed in the interest rate sensitivity analysis in the table below, the Authority has limited exposure to interest rate risk<br />
because it has no borrowings other than WATC borrowings and finance leases (fixed interest rate).<br />
Sensitivity analysis<br />
The Authority’s policy is to manage its finance costs using a mix <strong>of</strong> fixed and variable debt with the objective <strong>of</strong> achieving<br />
optimum returns whilst managing interest rate risk to avoid uncertainty and volatility in the market place.<br />
The Authority constantly analyses its interest rate exposure. Within this analysis consideration is given to potential renewals<br />
<strong>of</strong> existing positions and alternative financing structures.<br />
56
23. Financial Instruments (continued)<br />
(i) Financial risk management objectives and policies (continued)<br />
At the balance sheet date, if interest rates had moved as illustrated in the table below, with all other variables held constant,<br />
the effect would be as follows:<br />
+0.50% change (0.25%) change<br />
Carrying Amount Pr<strong>of</strong>it Equity Pr<strong>of</strong>it Equity<br />
$’000 $’000 $’000 $’000 $’000<br />
<strong>2010</strong><br />
Financial Assets<br />
Cash and cash equivalents 6822 34 24 (17) (12)<br />
Total Increase/(Decrease) 34 24 (17) (12)<br />
+0.50% change (0.25%) change<br />
Carrying Amount Pr<strong>of</strong>it Equity Pr<strong>of</strong>it Equity<br />
$’000 $’000 $’000 $’000 $’000<br />
2009<br />
Financial Assets<br />
Cash and cash equivalents 7,953 40 28 (20) (14)<br />
Total Increase/(Decrease) 40 28 (20) (14)<br />
Foreign currency risk<br />
The Port Authority is exposed to foreign currency on purchases that are denominated in a currency other than the functional<br />
currency <strong>of</strong> the Port Authority i.e. <strong>Australia</strong>n dollars. The currency giving rise to this risk is primarily US dollars. The Port<br />
Authority hedges at least 98 percent <strong>of</strong> all trade payables denominated in a foreign currency. The Port Authority uses forward<br />
exchange contracts to hedge its foreign currency risk. One <strong>of</strong> the forward exchange contracts has a maturity <strong>of</strong> less than<br />
one year after the reporting date. Where necessary the forward exchange contracts are rolled over at maturity.<br />
The overall foreign exchange exposure <strong>of</strong> the Port Authority not being significant; no sensitivity analysis is made for the<br />
foreign currency exposure.<br />
Interest Rate Risk<br />
The Port Authority’s exposure to the risk <strong>of</strong> changes in market interest rates relates primarily to the Port Authority’s long-term<br />
debt obligations. The Port Authority’s borrowings are all obtained through the <strong>Western</strong> <strong>Australia</strong>n Treasury Corporation<br />
(WATC) and are at fixed rates with varying maturities or at variable rates. The risk is managed by WATC through portfolio<br />
diversification and variation in maturity dates. All other financial assets and liabilities are non-interest bearing and are not<br />
exposed to interest rate risk.<br />
For the above stated reasons, no sensitivity analysis is made for the interest rate risk.<br />
57
23. Financial Instruments (continued)<br />
(i) Financial risk management objectives and policies (continued)<br />
Liquidity risk<br />
The Authority’s objective is to maintain a balance between continuity <strong>of</strong> funding and flexibility through the use <strong>of</strong> cash<br />
reserves and its borrowing facilities. The Authority manages its exposure to liquidity risk by ensuring appropriate procedures<br />
are in place to manage cash flows, including monitoring forecast cash flows to ensure sufficient funds are available to meet<br />
its commitments.<br />
The table below reflects the contractual maturity <strong>of</strong> financial liabilities. The contractual maturity amounts are representative<br />
<strong>of</strong> the undiscounted amounts at the balance sheet date. The table includes both interest and principal cash flows. An<br />
adjustment has been made where material.<br />
Credit risk<br />
Credit risk arises when there is the possibility <strong>of</strong> the Authority’s receivables defaulting on their contractual obligations resulting<br />
in financial loss to the Authority. The Authority measures credit risk on a fair value basis and monitors risk on a regular basis.<br />
With respect to credit risk arising from cash and cash equivalents, The Authority’s exposure to credit risk arises from default<br />
<strong>of</strong> the counter party, with a maximum exposure equal to the carrying amount <strong>of</strong> the cash and cash equivalents.<br />
The Authority operates predominantly within the shipping and cargo handling industry and accordingly is exposed to risks<br />
affecting that industry. The maximum exposure to credit risk at balance sheet date in relation to each class <strong>of</strong> recognised<br />
financial assets is the gross carrying amount <strong>of</strong> those assets inclusive <strong>of</strong> any provisions for impairment, as shown in the table<br />
at Note 23(ii).<br />
The Authority follows stringent credit control and management procedures in reviewing and monitoring debtor accounts and<br />
outstanding balances as evidenced by the historical aged debtor balances. In addition, management <strong>of</strong> receivable balances<br />
includes frequent monitoring thereby minimising the Authority’s exposure to bad debts. For financial assets that are either<br />
past due or impaired, refer to note 13 ‘Trade and other receivables’.<br />
The Authority’s credit risk management is further supported by rental agreements and sections 116 and 117 <strong>of</strong> the Port<br />
Authorities Act 1999. Section 116 refers to the liability to pay Port charges in respect <strong>of</strong> vessels and Section 117 refers to the<br />
liability to pay Port charges in respect <strong>of</strong> goods. Port charges are defined in Section 115.<br />
Carrying amount 6 mths 6-12 1-2 2-5 More than<br />
or less mths years years 5 years<br />
$’000 $’000 $’000 $’000 $’000 $’000<br />
Financial Liabilities<br />
<strong>2010</strong><br />
Trade and other payables 3,502 3,502<br />
Interest bearing borrowings 88,712 8,151 6,935 5,483 18,672 49,471<br />
92,214 11,653 6,935 5,483 18,672 49,471<br />
2009<br />
Trade and other payables 4,796 4,796<br />
Interest bearing borrowings 79,269 7,450 2,243 8,037 13,766 47,773<br />
84,065 12,246 2,243 8,037 13,766 47,773<br />
58
23. Financial Instruments (continued)<br />
(i) Financial risk management objectives and policies (continued)<br />
The risk implied from the values shown in the table below reflects a balanced view <strong>of</strong> cash inflows and outflows. Leasing<br />
obligations, trade payables and other financial liabilities mainly originate from the financing <strong>of</strong> assets used in the ongoing<br />
operations such as property, plant and equipment and investments in working capital e.g. inventories and trade receivables.<br />
These assets are considered in the Authority’s overall liquidity risk.<br />
Risk associated with the liability on borrowings is reduced by the Authority paying a guarantee charge. This charge<br />
guarantees payment to the WATC by the Government for outstanding borrowings in case <strong>of</strong> default.<br />
Carrying amount 6 mths 6-12 1-2 2-5 More than<br />
or less mths years years 5 years<br />
$’000 $’000 $’000 $’000 $’000 $’000<br />
<strong>2010</strong><br />
Financial assets<br />
Cash and cash equivalents 6,822 6,822<br />
Trade and other receivables 55,195 7,800 2,094 4,397 15,032 25,872<br />
62,017 14,622 2,094 4,397 15,032 25,872<br />
Financial liabilities<br />
Trade and other payables 5,617 5,617<br />
Interest bearing borrowings 88,712 8,151 6,935 5,483 18,672 49,471<br />
94,329 13,768 6,935 5,483 18,672 49,471<br />
Net maturity (32,312) 854 (4,841) (1,086) (3,640) (23,599)<br />
Carrying amount 6 mths 6-12 1-2 2-5 More than<br />
or less mths years years 5 years<br />
$’000 $’000 $’000 $’000 $’000 $’000<br />
2009<br />
Financial assets<br />
Cash and cash equivalents 7,953 7,953<br />
Trade and other receivables 59,783 8,568 1,883 4,122 14,092 31,118<br />
67,736 16,521 1,883 4,122 14,092 31,118<br />
Financial liabilities<br />
Trade and other payables 4,796 4,796<br />
Interest bearing borrowings 79,269 7,450 2,243 8,037 13,766 47,773<br />
84,065 12,246 2,243 8,037 13,766 47,773<br />
Net maturity (16,329) 4,275 (360) (3,915) 326 (16,655)<br />
59
23. Financial Instruments (continued)<br />
(ii) Categories <strong>of</strong> financial instruments by fair value<br />
Set out below are the carrying amounts <strong>of</strong> the Authority’s financial instruments. The Directors consider the carrying amounts<br />
<strong>of</strong> the financial instruments represent their net fair values.<br />
<strong>2010</strong> 2009<br />
$’000 $’000<br />
Financial assets<br />
Cash and cash equivalents 6,822 7,953<br />
Trade and other receivables 10,089 10,451<br />
Receivables (non-current) 45,106 49,332<br />
Financial Liabilities<br />
Trade and other payables 5,315 5,626<br />
Derivative financial instruments 302 830<br />
Variable rate borrowings 12,191 13,039<br />
Fixed rate borrowings 76,521 67,277<br />
The fair value <strong>of</strong> the interest bearing borrowings was provided by the WATC using a lending curve, based on the various<br />
maturing dates for each loan, less a margin. The carrying amount, by maturity, <strong>of</strong> the interest-bearing borrowings that are<br />
exposed to interest rate risk are disclosed in note 17.<br />
All financial assets and liabilities recognised in the Statement <strong>of</strong> Financial Position, whether they are carried at cost or fair<br />
value, are recognised at amounts that represent a reasonable approximation <strong>of</strong> fair value unless otherwise stated in the<br />
applicable notes.<br />
(iii) Weighted average cost <strong>of</strong> capital<br />
Within one year Floating Fixed Non Total<br />
Weighted Average Interest Interest Interest<br />
Interest Rate Rate Bearing Bearing<br />
$’000 $’000 $’000 $’000<br />
<strong>2010</strong><br />
Financial Assets and Liabilities<br />
Cash and Deposits - 6,822 - - 6,822<br />
Receivables - - - 55,195 55,195<br />
WATC Borrowings 5.4% - (12,191) - (12,191)<br />
WATC Borrowings 6.32% - (76,521) - (76,521)<br />
Trade and Other Payables - - - (5,617) (5,617)<br />
Net Financial Assets (Liabilities) - 6,822 (88,712) 49,578 (32,312)<br />
60
23. Financial Instruments (continued)<br />
(iv) Weighted average cost <strong>of</strong> capital (continued)<br />
Within one year Floating Fixed Non Total<br />
Weighted Average Interest Interest Interest<br />
Interest Rate Rate Bearing Bearing<br />
$’000 $’000 $’000 $’000<br />
2009<br />
Financial Assets and Liabilities<br />
Cash and Deposits 3.28% 7,953 - - 7,953<br />
Receivables - - 59,750 59,750<br />
WATC Borrowings 4.47% (12,823) - (12,823)<br />
WATC Borrowings 6.37% (66,446) - (66,446)<br />
Trade and Other Payables - - (6,672) (6,672)<br />
Net Financial Assets (Liabilities) 7,953 (79,269) 53,078 (18,238)<br />
24. Commitments<br />
(i) Capital Expenditure Commitments<br />
<strong>2010</strong> 2009<br />
$’000 $’000<br />
Capital expenditure commitments, being contracted capital<br />
expenditure additional to the amounts reported in the financial<br />
statements, are payable as follows:<br />
Within 1 year 7,000 32,440<br />
Later than 1 year and not later than 5 years - -<br />
Later than 5 years - -<br />
7,000 32,440<br />
(ii) Lease commitments<br />
The Authority has no lease commitments.<br />
(iii) Finance Lease Receivable<br />
<strong>2010</strong> 2009<br />
$’000 $’000<br />
Amounts receivable under finance leases:<br />
Within 1 year 7,211 7,118<br />
Later than 1 year and not later than 5 years 28,845 28,845<br />
Later than 5 years 33,512 40,586<br />
69,568 76,549<br />
Unearned finance income (20,309) (23,433)<br />
Present value <strong>of</strong> minimum lease payments receivable 49,259 53,116<br />
Representing finance lease receivable:<br />
Current (note 13) 4,153 3,784<br />
Non-current (note 13) 45,106 49,332<br />
49,259 53,116<br />
61
24. Commitments (continued)<br />
Finance leases receivable are in respect <strong>of</strong> storage and ship loading facilities. One lease agreement expires on 1 April 2017<br />
and is charged interest at 6.598% per annum. The other agreement expires on 1 July 2027 and is charged interest at 6.3%<br />
per annum.<br />
(iv) Operating leases receivable<br />
<strong>2010</strong> 2009<br />
$’000 $’000<br />
Future minimum rentals receivable for operating leases at reporting date:<br />
Within 1 year 578 692<br />
Later than 1 year and not later than 5 years 1,105 1,391<br />
Later than 5 years 4,654 4,850<br />
6,337 6,933<br />
Operating leases receivable are in respect <strong>of</strong> property rentals.<br />
25. Remuneration <strong>of</strong> Auditor<br />
Remuneration payable to the Auditor General in respect to the audit for the current financial year is as follows:<br />
<strong>2010</strong> 2009<br />
$’000 $’000<br />
Auditing the accounts and financial statements 49 61<br />
26. Related Parties<br />
The following persons held the position <strong>of</strong> Director or Senior Manager during the financial year and until the date <strong>of</strong> this<br />
report:<br />
Current Directors<br />
Senior Managers<br />
• Jim Matijasevich • Michal Frydrych<br />
• Phil Thick • Devinder Grewal<br />
• Phil Chalmer • Neil Pearson<br />
• Tim Shanahan • Kevin Fernance<br />
• Kathy Finlayson • Brant Grundy<br />
There are no transactions in the year with the Directors or other related parties.<br />
62
27. Contingent liabilities<br />
In addition to the liabilities included in the financial statements, there are the following contingent liabilities:<br />
The Directors are <strong>of</strong> the opinion that provisions are not required in respect <strong>of</strong> these matters, as it is not probable that a future<br />
sacrifice <strong>of</strong> economic benefits will be required or the amount is not capable <strong>of</strong> reliable measurement.<br />
<strong>2010</strong> 2009<br />
$’000 $’000<br />
Contingent liabilities not considered remote<br />
Litigation<br />
The Port Authority has received an infringement notice from the NIL 1,350<br />
Department <strong>of</strong> the Environment and Conservation. Liability was<br />
admitted and the Port faced a maximum fine <strong>of</strong> $1.35 million.<br />
The case went to court and the Port received fines totalling<br />
$0.530 million. These have been paid.<br />
63
Directors’ Declaration<br />
In the opinion <strong>of</strong> the Directors <strong>of</strong> Esperance Port Authority (the “Authority”):<br />
(a) the financial statements and notes, set out on pages 31 to 64, are in accordance with the financial reporting provisions<br />
<strong>of</strong> the Port Authorities Act 1999, including:<br />
(i)<br />
(ii)<br />
giving a true and fair view <strong>of</strong> the Authority’s financial position as at 30 June <strong>2010</strong> and <strong>of</strong> its performance for the<br />
financial year ended on that date; and<br />
complying with <strong>Australia</strong>n Accounting Standards (including the <strong>Australia</strong>n Accounting Interpretations) and the Port<br />
Authorities Act 1999;<br />
(b) there are reasonable grounds to believe that the Authority will be able to pay its debts as and when they become due<br />
and payable.<br />
Signed in accordance with a resolution <strong>of</strong> the Directors:<br />
.--J--,\C\.-_/.-______<br />
Tim Shanahan<br />
Acting Chairman<br />
22 September <strong>2010</strong><br />
Esperance<br />
64
Auditor General<br />
INDEPENDENT AUDIT REPORT ON ESPERANCE PORT AUTHORITY<br />
To the <strong>Parliament</strong> <strong>of</strong> <strong>Western</strong> <strong>Australia</strong><br />
I have audited the financial statements <strong>of</strong> the Esperance Port Authority. The financial statements<br />
comprise the Statement <strong>of</strong> Financial Position as at 30 June <strong>2010</strong>, and the Statement <strong>of</strong><br />
Comprehensive Income, Statement <strong>of</strong> Changes in Equity and Statement <strong>of</strong> Cash Flows for the<br />
year ended on that date, a summary <strong>of</strong> significant accounting policies, other explanatory Notes<br />
and the Directors’ Declaration.<br />
Directors’ Responsibility for the Financial Statements<br />
The directors <strong>of</strong> the Esperance Port Authority are responsible for the preparation and fair<br />
presentation <strong>of</strong> the financial statements in accordance with <strong>Australia</strong>n Accounting Standards<br />
and the Port Authorities Act 1999. This responsibility includes establishing and maintaining<br />
internal controls relevant to the preparation and fair presentation <strong>of</strong> the financial statements that<br />
are free from material misstatement, whether due to fraud or error; selecting and applying<br />
appropriate accounting policies; and making accounting estimates that are reasonable in the<br />
circumstances.<br />
Summary <strong>of</strong> my Role<br />
As required by the Port Authorities Act 1999, my responsibility is to express an opinion on the<br />
financial statements based on my audit. This was done by testing selected samples <strong>of</strong> the audit<br />
evidence. I believe that the audit evidence I have obtained is sufficient and appropriate to<br />
provide a basis for my audit opinion. Further information on my audit approach is provided in<br />
my audit practice statement. This document is available on the OAG website under “How We<br />
Audit”.<br />
An audit does not guarantee that every amount and disclosure in the financial statements is error<br />
free, nor does it examine all evidence and every transaction. However, my audit procedures<br />
should identify errors or omissions significant enough to adversely affect the decisions <strong>of</strong> users<br />
<strong>of</strong> the financial statements.<br />
Audit Opinion<br />
In my opinion, the financial statements <strong>of</strong> the Esperance Port Authority are in accordance with<br />
schedule 5 <strong>of</strong> the Port Authorities Act 1999, including:<br />
(a) giving a true and fair view <strong>of</strong> the Authority’s financial position as at 30 June <strong>2010</strong> and<br />
<strong>of</strong> its performance for the year ended on that date; and<br />
(b) complying with <strong>Australia</strong>n Accounting Standards and the Corporations Regulations<br />
2001.<br />
COLIN MURPHY<br />
AUDITOR GENERAL<br />
23 September <strong>2010</strong><br />
4 th Floor Dumas House 2 Havelock Street West Perth 6005 <strong>Western</strong> <strong>Australia</strong> Tel: 08 9222 7500 Fax: 08 9322 5664<br />
65
',a -<br />
/_!,Wel5fOr<br />
w<br />
PO Box 35 Esperance<br />
<strong>Western</strong> <strong>Australia</strong> 6450<br />
Phone: +61 8 9072 3333<br />
Fax: +61 8 9071 1312<br />
A/H +61 8 9072 3333<br />
Email: admin@epsl.com.au<br />
www.epsl.com.au