Endeavour Energy Annual Performance Report - Parliament of New ...
Endeavour Energy Annual Performance Report - Parliament of New ...
Endeavour Energy Annual Performance Report - Parliament of New ...

You also want an ePaper? Increase the reach of your titles
YUMPU automatically turns print PDFs into web optimized ePapers that Google loves.
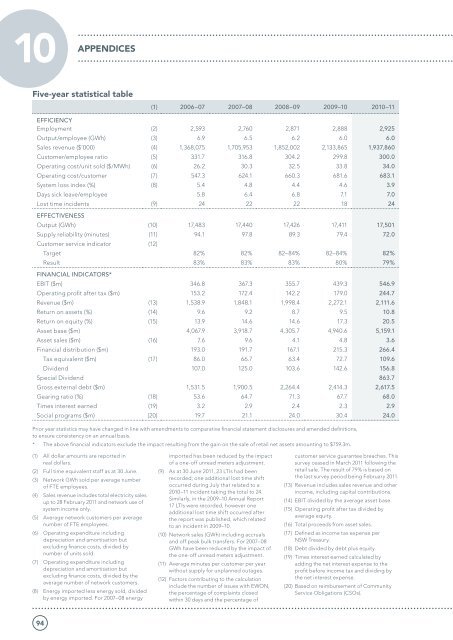
10<br />
Appendices<br />
Five-year statistical table<br />
(1) 2006–07 2007–08 2008–09 2009–10 2010–11<br />
EFFICIENCY<br />
Employment (2) 2,593 2,760 2,871 2,888 2,925<br />
Output/employee (GWh) (3) 6.9 6.5 6.2 6.0 6.0<br />
Sales revenue ($’000) (4) 1,368,075 1,705,953 1,852,002 2,133,865 1,937,860<br />
Customer/employee ratio (5) 331.7 316.8 304.2 299.8 300.0<br />
Operating cost/unit sold ($/MWh) (6) 26.2 30.3 32.5 33.8 34.0<br />
Operating cost/customer (7) 547.3 624.1 660.3 681.6 683.1<br />
System loss index (%) (8) 5.4 4.8 4.4 4.6 3.9<br />
Days sick leave/employee 5.8 6.4 6.8 7.1 7.0<br />
Lost time incidents (9) 24 22 22 18 24<br />
EFFECTIVENESS<br />
Output (GWh) (10) 17,483 17,440 17,426 17,411 17,501<br />
Supply reliability (minutes) (11) 94.1 97.8 89.3 79.4 72.0<br />
Customer service indicator (12)<br />
Target 82% 82% 82–84% 82–84% 82%<br />
Result 83% 83% 83% 80% 79%<br />
FINANCIAL INDICATORS*<br />
EBIT ($m) 346.8 367.3 355.7 439.3 546.9<br />
Operating pr<strong>of</strong>it after tax ($m) 153.2 172.4 142.2 179.0 244.7<br />
Revenue ($m) (13) 1,538.9 1,848.1 1,998.4 2,272.1 2,111.6<br />
Return on assets (%) (14) 9.6 9.2 8.7 9.5 10.8<br />
Return on equity (%) (15) 13.9 14.6 14.6 17.3 20.5<br />
Asset base ($m) 4,067.9 3,918.7 4,305.7 4,940.6 5,159.1<br />
Asset sales ($m) (16) 7.6 9.6 4.1 4.8 3.6<br />
Financial distribution ($m) 193.0 191.7 167.1 215.3 266.4<br />
Tax equivalent ($m) (17) 86.0 66.7 63.4 72.7 109.6<br />
Dividend 107.0 125.0 103.6 142.6 156.8<br />
Special Dividend 863.7<br />
Gross external debt ($m) 1,531.5 1,900.5 2,264.4 2,414.3 2,617.5<br />
Gearing ratio (%) (18) 53.6 64.7 71.3 67.7 68.0<br />
Times interest earned (19) 3.2 2.9 2.4 2.3 2.9<br />
Social programs ($m) (20) 19.7 21.1 24.0 30.4 24.0<br />
Prior year statistics may have changed in line with amendments to comparative financial statement disclosures and amended definitions,<br />
to ensure consistency on an annual basis.<br />
* The above financial indicators exclude the impact resulting from the gain on the sale <strong>of</strong> retail net assets amounting to $759.3m.<br />
(1) All dollar amounts are reported in<br />
real dollars.<br />
(2) Full time equivalent staff as at 30 June.<br />
(3) Network GWh sold per average number<br />
<strong>of</strong> FTE employees.<br />
(4) Sales revenue includes total electricity sales<br />
up to 28 February 2011 and network use <strong>of</strong><br />
system income only.<br />
(5) Average network customers per average<br />
number <strong>of</strong> FTE employees.<br />
(6) Operating expenditure including<br />
depreciation and amortisation but<br />
excluding finance costs, divided by<br />
number <strong>of</strong> units sold.<br />
(7) Operating expenditure including<br />
depreciation and amortisation but<br />
excluding finance costs, divided by the<br />
average number <strong>of</strong> network customers.<br />
(8) <strong>Energy</strong> imported less energy sold, divided<br />
by energy imported. For 2007–08 energy<br />
imported has been reduced by the impact<br />
<strong>of</strong> a one-<strong>of</strong>f unread meters adjustment.<br />
(9) As at 30 June 2011, 23 LTIs had been<br />
recorded; one additional lost time shift<br />
occurred during July that related to a<br />
2010–11 incident taking the total to 24.<br />
Similarly, in the 2009–10 <strong>Annual</strong> <strong>Report</strong><br />
17 LTIs were recorded, however one<br />
additional lost time shift occurred after<br />
the report was published, which related<br />
to an incident in 2009–10.<br />
(10) Network sales (GWh) including accruals<br />
and <strong>of</strong>f peak bulk transfers. For 2007–08<br />
GWh have been reduced by the impact <strong>of</strong><br />
the one-<strong>of</strong>f unread meters adjustment.<br />
(11) Average minutes per customer per year<br />
without supply for unplanned outages.<br />
(12) Factors contributing to the calculation<br />
include the number <strong>of</strong> issues with EWON,<br />
the percentage <strong>of</strong> complaints closed<br />
within 30 days and the percentage <strong>of</strong><br />
customer service guarantee breaches. This<br />
survey ceased in March 2011 following the<br />
retail sale. The result <strong>of</strong> 79% is based on<br />
the last survey period being February 2011.<br />
(13) Revenue includes sales revenue and other<br />
income, including capital contributions.<br />
(14) EBIT divided by the average asset base.<br />
(15) Operating pr<strong>of</strong>it after tax divided by<br />
average equity.<br />
(16) Total proceeds from asset sales.<br />
(17) Defined as income tax expense per<br />
NSW Treasury.<br />
(18) Debt divided by debt plus equity.<br />
(19) Times interest earned calculated by<br />
adding the net interest expense to the<br />
pr<strong>of</strong>it before income tax and dividing by<br />
the net interest expense.<br />
(20) Based on reimbursement <strong>of</strong> Community<br />
Service Obligations (CSOs).<br />
94