APPLIED PHYSICS REVIEWS First-principles calculations for ... - Parc
APPLIED PHYSICS REVIEWS First-principles calculations for ... - Parc
APPLIED PHYSICS REVIEWS First-principles calculations for ... - Parc

You also want an ePaper? Increase the reach of your titles
YUMPU automatically turns print PDFs into web optimized ePapers that Google loves.
JOURNAL OF <strong>APPLIED</strong> <strong>PHYSICS</strong> VOLUME 95, NUMBER 8 15 APRIL 2004<br />
<strong>APPLIED</strong> <strong>PHYSICS</strong> <strong>REVIEWS</strong><br />
<strong>First</strong>-<strong>principles</strong> <strong>calculations</strong> <strong>for</strong> defects and impurities:<br />
Applications to III-nitrides<br />
Chris G. Van de Walle a)<br />
Palo Alto Research Center, 3333 Coyote Hill Road, Palo Alto, Cali<strong>for</strong>nia 94304<br />
Jörg Neugebauer<br />
Universität Paderborn, Fakultät für Naturwissenschaften, Warburger Str. 100, D-33095 Paderborn,<br />
Germany<br />
Received 14 July 2003; accepted 26 January 2004<br />
<strong>First</strong>-<strong>principles</strong> <strong>calculations</strong> have evolved from mere aids in explaining and supporting experiments<br />
to powerful tools <strong>for</strong> predicting new materials and their properties. In the first part of this review we<br />
describe the state-of-the-art computational methodology <strong>for</strong> calculating the structure and energetics<br />
of point defects and impurities in semiconductors. We will pay particular attention to computational<br />
aspects which are unique to defects or impurities, such as how to deal with charge states and how<br />
to describe and interpret transition levels. In the second part of the review we will illustrate these<br />
capabilities with examples <strong>for</strong> defects and impurities in nitride semiconductors. Point defects have<br />
traditionally been considered to play a major role in wide-band-gap semiconductors, and<br />
first-<strong>principles</strong> <strong>calculations</strong> have been particularly helpful in elucidating the issues. Specifically,<br />
<strong>calculations</strong> have shown that the unintentional n-type conductivity that has often been observed in<br />
as-grown GaN cannot be attributed to nitrogen vacancies, but is due to unintentional incorporation<br />
of donor impurities. Native point defects may play a role in compensation and in phenomena such<br />
as the yellow luminescence, which can be attributed to gallium vacancies. In the section on<br />
impurities, specific attention will be focused on dopants. Oxygen, which is commonly present as a<br />
contaminant, is a shallow donor in GaN but becomes a deep level in AlGaN due to a DX transition.<br />
Magnesium is almost universally used as the p-type dopant, but hole concentrations are still limited.<br />
Reasons <strong>for</strong> this behavior are discussed, and alternative acceptors are examined. Hydrogen plays an<br />
important role in p-type GaN, and the mechanisms that underlie its behavior are explained.<br />
Incorporating hydrogen along with acceptors is an example of codoping; a critical discussion of<br />
codoping is presented. Most of the in<strong>for</strong>mation available to date <strong>for</strong> defects and impurities in<br />
nitrides has been generated <strong>for</strong> GaN, but we will also discuss AlN and InN where appropriate. We<br />
conclude by summarizing the main points and looking towards the future. © 2004 American<br />
Institute of Physics. DOI: 10.1063/1.1682673<br />
TABLE OF CONTENTS<br />
I. INTRODUCTION............................ 3852<br />
A. Goals................................... 3852<br />
B. Doping problems in nitrides................ 3852<br />
C. Fundamental causes of doping limitations. .... 3853<br />
1. Solubility............................. 3853<br />
2. Ionization energy...................... 3853<br />
3. Incorporation of impurities in other<br />
configurations......................... 3853<br />
4. Compensation by native point defects. ..... 3853<br />
5. Compensation by <strong>for</strong>eign impurities....... 3853<br />
II. METHODOLOGY.......................... 3854<br />
A. Concentrations of defects. .................. 3854<br />
1. Justification <strong>for</strong> the thermodynamic<br />
equilibrium approach. . ................. 3854<br />
a Electronic mail: vandewalle@parc.com.<br />
2. MBE versus MOCVD growth............ 3854<br />
3. Surface effects........................ 3854<br />
B. Formation energies........................ 3855<br />
1. Techniques <strong>for</strong> estimating or calculating<br />
<strong>for</strong>mation energies..................... 3855<br />
2. Density-functional theory................ 3855<br />
3. Beyond density-functional theory......... 3856<br />
4. Definition of <strong>for</strong>mation energy........... 3856<br />
5. Supercells............................ 3857<br />
6. Special k-points....................... 3858<br />
7. Self-consistent calculation of defect<br />
concentrations. . ....................... 3858<br />
C. Charge states............................. 3859<br />
D. Electronic structure........................ 3859<br />
1. Thermodynamic transition levels versus<br />
optical levels.......................... 3859<br />
2. Configuration coordinate diagrams........ 3860<br />
3. Deep levels versus shallow levels......... 3861<br />
0021-8979/2004/95(8)/3851/29/$22.00 3851<br />
© 2004 American Institute of Physics<br />
Downloaded 26 Apr 2004 to 13.1.101.37. Redistribution subject to AIP license or copyright, see http://jap.aip.org/jap/copyright.jsp
3852 J. Appl. Phys., Vol. 95, No. 8, 15 April 2004 Appl. Phys. Rev.: C. G. Van de Walle and J. Neugebauer<br />
E. Chemical potentials....................... 3861<br />
1. Boundaries and range................... 3861<br />
2. Impurity solubility..................... 3862<br />
F. Complexes. ............................. 3862<br />
G. Diffusion................................ 3863<br />
H. Direct comparison with experiment........... 3864<br />
1. Calculation of hyperfine parameters....... 3864<br />
2. Calculation of vibrational frequencies. ..... 3864<br />
3. Calculation of charge transfer levels....... 3864<br />
I. Accuracy................................ 3864<br />
III. NATIVE POINT DEFECTS.................. 3865<br />
A. Formation energies........................ 3865<br />
B. Nitrogen vacancies........................ 3866<br />
C. Gallium vacancies........................ 3867<br />
1. Yellow luminescence................... 3867<br />
2. Experimental confirmation............... 3867<br />
D. Nitrogen interstitials. . ..................... 3868<br />
E. Gallium interstitials....................... 3868<br />
F. Nitrogen antisites......................... 3868<br />
G. Gallium antisites.......................... 3869<br />
H. Complexes. ............................. 3869<br />
I. Comparison between GaN and GaAs......... 3869<br />
J. Native defects in AlN...................... 3869<br />
K. Native defects in InN...................... 3870<br />
IV. IMPURITIES.............................. 3870<br />
A. Donors in GaN........................... 3870<br />
1. Oxygen.............................. 3871<br />
2. Silicon. .............................. 3871<br />
3. Germanium........................... 3872<br />
B. Acceptors in GaN......................... 3872<br />
1. Magnesium........................... 3872<br />
2. Alternative acceptors................... 3873<br />
3. Compensation. . . . . . . . . . . . . . . . . ........ 3874<br />
C. Hydrogen............................... 3874<br />
1. Isolated interstitial hydrogen............. 3874<br />
2. Acceptor-hydrogen complexes............ 3875<br />
3. Interactions of hydrogen with native<br />
defects............................... 3875<br />
4. Hydrogen in AlN and InN............... 3876<br />
D. Codoping................................ 3876<br />
V. CONCLUSIONS. . .......................... 3876<br />
I. INTRODUCTION<br />
A. Goals<br />
The properties of materials are often controlled by defects<br />
and impurities. This is particularly true in the case of<br />
semiconductors, where the incorporation of impurities in<br />
small concentrations determines the electrical conductivity.<br />
The fabrication of p-type and n-type doped layers underlies<br />
the design of virtually all electronic and optoelectronic devices.<br />
To achieve such control, comprehensive knowledge of<br />
the fundamental processes that control doping is required. In<br />
recent years, first-<strong>principles</strong> <strong>calculations</strong> have made important<br />
contributions to this knowledge.<br />
Thanks to algorithmic developments as well as increases<br />
in computer power, first-<strong>principles</strong> <strong>calculations</strong> are now<br />
reaching unprecedented levels of accuracy in treating increasingly<br />
larger systems at the microscopic level. State-ofthe-art<br />
<strong>calculations</strong> <strong>for</strong> solids are based on density-functional<br />
theory and produce detailed in<strong>for</strong>mation about atomic structure<br />
including relaxations, wave functions, charge densities,<br />
potentials, and energies. All of these data can be used to<br />
elucidate the properties of impurities and point defects, as<br />
will be illustrated with many examples in this review. The<br />
aspect that we will focus on most closely, and that has<br />
proved crucial in relation to studying doping, is the <strong>for</strong>mation<br />
energy of point defects. We will describe a <strong>for</strong>malism<br />
that allows calculation of defect and impurity concentrations<br />
based on first-<strong>principles</strong> <strong>for</strong>mation energies; this <strong>for</strong>malism<br />
also addresses the energetics of charge states, and hence the<br />
thermodynamic transition levels associated with deep and<br />
shallow impurities and defects.<br />
The <strong>for</strong>malism is entirely general in nature and could be<br />
applied to any semiconductor or insulator. The goal of the<br />
first part of the article Sec. II is to provide an overview of<br />
the state-of-the-art methodology <strong>for</strong> per<strong>for</strong>ming first<strong>principles</strong><br />
<strong>calculations</strong> <strong>for</strong> defects and impurities. The aim is<br />
not to address the fundamentals of density-functional or<br />
pseudopotential theory, or to provide a guide on how to run<br />
first-<strong>principles</strong> computer codes–various excellent reviews<br />
are available <strong>for</strong> that purpose. 1–3 Rather, we intend Sec. II to<br />
be useful <strong>for</strong> a computational theorist getting started in defect<br />
<strong>calculations</strong>, as well as <strong>for</strong> more experienced practitioners<br />
looking <strong>for</strong> a reference to some of the details that are<br />
important in practical <strong>calculations</strong>. In addition, this section is<br />
intended to be accessible to experimentalists who are curious<br />
about the background of the computational work or have<br />
questions about some of the underlying assumptions.<br />
The methodology described in Sec. II will be illustrated<br />
with specific examples in the latter half of the review. We<br />
will focus on one specific material system, namely, the III–V<br />
nitrides. Two Applied Physics Reviews have recently appeared<br />
that cover this set of materials. One, by Vurgaftman<br />
and Meyer, 4 presents a comprehensive compilation of band<br />
parameters <strong>for</strong> all of the nitrogen-containing III–V semiconductors<br />
that have been investigated to date. The second, by<br />
Bhuiyan et al., 5 reviews the growth, characterization, and<br />
properties of InN and contains a brief discussion of defects.<br />
In the present article we focus on the properties of defects<br />
and impurities in III-nitrides. Section III contains results <strong>for</strong><br />
native defects, while Sec. IV describes impurities. A review<br />
of computational studies on GaN by Estreicher and Boucher 6<br />
covered developments through 1995, but much has happened<br />
since then.<br />
In the remainder of this Introduction we provide some<br />
additional motivation <strong>for</strong> defect studies in nitrides, an important<br />
issue being the realization of adequate doping. We there<strong>for</strong>e<br />
also provide a discussion of doping limitations in semiconductors<br />
in general.<br />
B. Doping problems in nitrides<br />
Within the past decade the nitride semiconductors have<br />
emerged as a very important materials system because they<br />
are uniquely suited to light emission in the green, blue, and<br />
UV regions of the spectrum–wavelength regions that were<br />
previously not accessible with solid-state light emitters.<br />
Downloaded 26 Apr 2004 to 13.1.101.37. Redistribution subject to AIP license or copyright, see http://jap.aip.org/jap/copyright.jsp
J. Appl. Phys., Vol. 95, No. 8, 15 April 2004 Appl. Phys. Rev.: C. G. Van de Walle and J. Neugebauer<br />
3853<br />
n-type doping of nitrides has never been a problem; in fact,<br />
as-grown material has often exhibited unintentional n-type<br />
conductivity, the cause of which was widely debated. n-type<br />
doping with electron concentrations exceeding 10 19 cm 3<br />
can routinely be achieved. p-type doping, however, has traditionally<br />
been very difficult. p-type doping was first<br />
achieved by Amano et al. in 1989, 7 who observed that Mgdoped<br />
GaN grown by MOCVD metal-organic chemical vapor<br />
deposition was highly resistive after growth, but could<br />
be activated by low-energy electron beam irradiation. Nakamura<br />
et al. 8 subsquently showed that the Mg activation can<br />
also be achieved by thermal annealing at 700 °C under N 2<br />
ambient. Nakamura et al. further observed that the process<br />
was reversible, with p-type GaN reverting to semi-insulating<br />
when annealed in a NH 3 ambient, revealing the crucial role<br />
played by hydrogen. Since then, hole concentrations on the<br />
order of 10 18 cm 3 have been achieved and used in devices.<br />
Still, the limited conductivity of p-type doped layers constitutes<br />
an impediment <strong>for</strong> progress in device applications.<br />
C. Fundamental causes of doping limitations<br />
When discussing doping of semiconductors, and its inherent<br />
limitations and difficulties, a number of factors need<br />
to be considered. Here we enumerate them and illustrate<br />
them with the example of p-type doping of GaN.<br />
1. Solubility<br />
To achieve a high free-carrier concentration, one obviously<br />
needs to achieve a high concentration of the dopant<br />
impurity. The solubility corresponds to the maximum concentration<br />
that the impurity can attain in the semiconductor,<br />
under conditions of thermodynamic equilibrium. This concentration<br />
depends on temperature, and on the abundance of<br />
the impurity as well as the host constituents in the growth<br />
environment. Increasing the abundance of the impurity or its<br />
chemical potential, see Sec. II E does not necessarily increase<br />
the concentration of impurities incorporated in the<br />
solid, because it may become more favorable <strong>for</strong> the impurity<br />
to <strong>for</strong>m a different phase. For instance, we will see that<br />
the solubility of Mg in GaN is limited by <strong>for</strong>mation of<br />
Mg 3 N 2 see Sec. II E. In previous work on wide-band-gap<br />
semiconductors, it was found that the hole concentration in<br />
ZnSe and ZnTe is limited by the solubility of the acceptor<br />
impurities Na, Li, and N. 9<br />
2. Ionization energy<br />
The ionization energy of a dopant determines the fraction<br />
of dopants that will contribute free carriers at a given<br />
temperature. A high ionization energy limits the doping efficiency:<br />
<strong>for</strong> instance, the ionization energy of Mg in GaN<br />
around 200 meV is so large that at room temperature only<br />
about 1% of Mg atoms are ionized. This means that a Mg<br />
concentration of 10 20 cm 3 only leads to a hole concentration<br />
of about 10 18 cm 3 . Ionization energies are largely determined<br />
by intrinsic properties of the semiconductor, such<br />
as effective masses, dielectric constant, etc. Switching to a<br />
different acceptor has there<strong>for</strong>e no dramatic effect on the<br />
ionization energy.<br />
3. Incorporation of impurities in other configurations<br />
In order <strong>for</strong> Mg in GaN to act as an acceptor, it needs to<br />
be incorporated on the gallium site. There has been concern<br />
about Mg incorporating in other positions in the lattice, such<br />
as an interstitial position, or substituting <strong>for</strong> a nitrogen atom<br />
essentially an antisite configuration. For GaN:Mg GaN<br />
doped with Mg, we have shown that these other configurations<br />
are always much higher in energy, and hence will not<br />
<strong>for</strong>m. 10 In other cases, however, such competition may be a<br />
serious issue: <strong>for</strong> instance, while Li on the Ga site in GaN<br />
<strong>for</strong>ms an acceptor, Li on an interstitial site is a donor, and<br />
because of its small size it is energetically very favorable. 11<br />
This can obviously lead to serious self-compensation.<br />
Another instance of impurities incorporating in undesirable<br />
configurations consists of the so-called DX centers. The<br />
prototype DX center is Si in AlGaAs <strong>for</strong> a review, see Ref.<br />
12. In GaAs and in AlGaAs with low Al content, Si behaves<br />
as a shallow donor. But when the Al content exceeds a critical<br />
value, Si behaves as a deep level. This has been explained<br />
in terms of Si moving off the substitutional site, towards<br />
an interstitial position. 13 It has been found that oxygen<br />
<strong>for</strong>ms a DX center in AlGaN, when the Al content exceeds<br />
about 30%. 14 This prediction has been confirmed<br />
experimentally. 15<br />
4. Compensation by native point defects<br />
Native defects are point defects intrinsic to the semiconductor,<br />
such as vacancies missing atoms, self-interstitials<br />
additional atoms incorporated on sites other than substitutional<br />
sites, and antisites in a compound semiconductor, a<br />
cation sitting on a nominal anion site, or vice versa. Native<br />
defects have frequently been invoked to explain doping<br />
problems in semiconductors. For instance, the problem of<br />
achieving p-type ZnSe was long attributed to selfcompensation<br />
by native defects: it was hypothesized that every<br />
attempt to incorporate acceptors would be accompanied<br />
by the spontaneous generation of large numbers of native<br />
defects, acting as donors. In the case of ZnSe, it was shown<br />
that compensation by native defects is not an insurmountable<br />
problem. 16 Some degree of compensation is often unavoidable,<br />
but this problem is not necessarily more severe in wideband-gap<br />
semiconductors than in, say, GaAs. For GaN, we<br />
have found that compensation by vacancies can limit the<br />
doping level in some cases: gallium vacancies (V Ga ) are acceptors<br />
and compensate n-type GaN; nitrogen vacancies<br />
(V N ) are single donors and compensate p-type GaN.<br />
Native defects have sometimes been invoked to play a<br />
role that goes beyond compensation, namely, to act as a<br />
source of doping. For instance, the frequently observed<br />
n-type conductivity of as-grown GaN was long attributed to<br />
nitrogen vacancies. Nitrogen vacancies indeed act as shallow<br />
donors, but their incorporation in n-type GaN costs too much<br />
energy <strong>for</strong> them to be present in the large concentrations<br />
necessary to explain the observed n-type conductivity. 17<br />
5. Compensation by <strong>for</strong>eign impurities<br />
This source of compensation may seem rather obvious,<br />
but we mention it <strong>for</strong> completeness, and it often plays a<br />
Downloaded 26 Apr 2004 to 13.1.101.37. Redistribution subject to AIP license or copyright, see http://jap.aip.org/jap/copyright.jsp
3854 J. Appl. Phys., Vol. 95, No. 8, 15 April 2004 Appl. Phys. Rev.: C. G. Van de Walle and J. Neugebauer<br />
crucial role: <strong>for</strong> instance, when doping with acceptors such<br />
as magnesium in order to obtain p-type conductivity, impurities<br />
that act as donors such as oxygen should be carefully<br />
controlled. Such control may be more difficult than is obvious<br />
at first sight. For instance, <strong>for</strong> reasons that will be explained<br />
in Sec. IV B 3, the presence in the growth system of<br />
a contaminating impurity with donor character may lead to a<br />
much larger incorporation of this impurity in p-type material<br />
than in n-type material.<br />
Each and every one of the factors listed here can be<br />
explicitly examined using a computational approach, and<br />
Secs. III and IV will contain explicit examples of results.<br />
II. METHODOLOGY<br />
Modern first-<strong>principles</strong> <strong>calculations</strong> have had a major<br />
impact on the understanding of defects and impurities in<br />
semiconductors. With the capability to calculate total energies,<br />
it became possible to investigate the atomic structure of<br />
the defect; i.e., the stable position in the host lattice, the<br />
relaxation of the surrounding atoms, as well as the energy<br />
along a migration path. 18–20 More recently, <strong>for</strong>malisms have<br />
been developed to use the total energy of the defect to calculate<br />
its concentration, under the assumption of thermodynamic<br />
equilibrium. 21,22 The same <strong>for</strong>malism can also be applied<br />
to the calculation of impurity solubilities. 9,23 In the<br />
following sections we describe this <strong>for</strong>malism in detail.<br />
A. Concentrations of defects<br />
In thermodynamic equilibrium the concentration c of an<br />
impurity, defect, or complex is given by the expression<br />
cN sites N config expE f /kT . 1<br />
Here, E f is the <strong>for</strong>mation energy see Sec. II B 4, N sites is the<br />
number of sites in the lattice per unit volume where the<br />
defect can be incorporated, k is Boltzmann’s constant, and T<br />
is the temperature. N config is the number of equivalent configurations<br />
in which the defect can be incorporated. For vacancies,<br />
antisites, and subsitutional defects N config 1ifno<br />
symmetry breaking occurs. If symmetry breaking occurs or if<br />
complexes are <strong>for</strong>med it is the number of inequivalent configurations<br />
in which the defect can be incorporated on the<br />
same site.<br />
1. Justification <strong>for</strong> the thermodynamic equilibrium<br />
approach<br />
The expression <strong>for</strong> concentration as a function of <strong>for</strong>mation<br />
energy Eq. 1 is, strictly speaking, only valid in thermodynamic<br />
equilibrium. Growth of semiconductors is obviously<br />
a nonequilibrium process. How then do we justify<br />
using Eq. 1 and attaching relevance to <strong>for</strong>mation energies?<br />
The justification is based on the argument that many growth<br />
situations are close enough to equilibrium to warrant the use<br />
of the equilibrium approach. An important consideration here<br />
is that not all aspects of the process need to be in equilibrium<br />
in order to justify the use of equilibrium expressions <strong>for</strong><br />
defects and impurities. What is required is a sufficiently high<br />
mobility of the relevant impurities and point defects to allow<br />
them to equilibrate at the temperatures of interest.<br />
2. Molecular beam epitaxy (MBE) versus MOCVD<br />
growth<br />
MOCVD growth of GaN is carried out at high temperatures<br />
usually between 1000 and 1100 °C). The mobility of<br />
various point defects, 24 both on the Ga and on the N sublattice,<br />
should be sufficiently high to allow equilibration of the<br />
defects and impurities that are being incorporated in the<br />
bulk. Under these circumstances, point defects will incorporate<br />
in concentrations determined by their <strong>for</strong>mation energies,<br />
which, as discussed below, depend on the relative abundance<br />
of the various species in the growth environment.<br />
MBE growth, on the other hand, is carried out at lower temperatures<br />
(800 °C), and the assumption of thermodynamic<br />
equilibrium is less likely to be satisfied. MBE-grown material<br />
may thus in principle exhibit point-defect concentrations<br />
that deviate from their equilibrium values.<br />
We do want to make the point that, even if the equilibrium<br />
conditions are not met that would justify use of Eq. 1<br />
to derive concentrations, the <strong>for</strong>mation energies defined in<br />
Sec. II B 4 are still physically meaningful. Nonequilibrium<br />
implies that once certain high-energy defects <strong>for</strong>m, kinetic<br />
barriers may preserve them, even if their concentration exceeds<br />
the nominal equilibrium value. It should be clear, however,<br />
that defects with a high <strong>for</strong>mation energy will always<br />
be unlikely to <strong>for</strong>m, since a lot of energy needs to be expended<br />
in their creation, and the driving <strong>for</strong>ce to lowering<br />
the energy is large.<br />
3. Surface effects<br />
An exception of the above argument is the creation of<br />
defects at the surface: There the defect <strong>for</strong>mation energy may<br />
be significantly different from the bulk <strong>for</strong>mation energy, due<br />
to structural as well as electronic effects. The structural effects<br />
can be due, <strong>for</strong> instance, to local strains underneath<br />
specific features of reconstructed surfaces, as discussed by<br />
Tersoff in the case of C incorporation in Si. 25 The electronic<br />
effects are related to the band bending that is usually present<br />
near semiconductor surfaces. As discussed in Sec. II B, the<br />
<strong>for</strong>mation energies of charged defects and impurities depend<br />
sensitively on the Fermi level, and near the surface the position<br />
of the Fermi level with respect to the band edges can be<br />
strongly shifted due to the presence of space-charge layers.<br />
Typically, defect <strong>for</strong>mation energies at the surface are<br />
lower, resulting in high defect concentrations at the surface.<br />
In cases where complete equilibration within the bulk of the<br />
growing material is not accomplished, it may still be possible<br />
<strong>for</strong> limited equilibration to occur within the first few atomic<br />
layers beneath the growing surface, where diffusion over<br />
short length scales may still be possible. Since the defect<br />
<strong>for</strong>mation energy quickly converges to its bulk value when<br />
moving the defect from the surface to bulk see, e.g., Ref.<br />
26 even limited equilibration within the first few atomic<br />
layers is sufficient to achieve bulk defect concentrations.<br />
A comprehensive examination of the effects of surfaces<br />
on the incorporation of defects and impurities is beyond the<br />
scope of the present review. In the nitrides, we are aware of<br />
the following studies: Bungaro et al. 27 investigated Mg incorporation<br />
at GaN0001 surfaces; Zywietz et al. calculated<br />
Downloaded 26 Apr 2004 to 13.1.101.37. Redistribution subject to AIP license or copyright, see http://jap.aip.org/jap/copyright.jsp
J. Appl. Phys., Vol. 95, No. 8, 15 April 2004 Appl. Phys. Rev.: C. G. Van de Walle and J. Neugebauer<br />
3855<br />
oxygen on GaN0001 and (0001¯) surfaces; 28 Northrup 29 investigated<br />
Be incorporation at GaN0001 in the presence of<br />
indium; and Rosa et al. studied Si on GaN0001. 30 Hydrogen<br />
on GaN surfaces, finally, was studied in Ref. 31.<br />
B. Formation energies<br />
1. Techniques <strong>for</strong> estimating or calculating <strong>for</strong>mation<br />
energies<br />
Hartree–Fock based models commonly employ<br />
quantum-chemistry approaches that have been successfully<br />
applied to atoms and molecules. The main problems with the<br />
technique are the neglect of correlation effects and the computational<br />
demands: ab initio Hartree–Fock methods can<br />
only be applied to systems with small numbers of atoms. The<br />
reason is that these methods require the evaluation of a large<br />
number of multicenter integrals. Simpler semiempirical<br />
methods have been developed that either neglect or approximate<br />
some of these integrals. The accuracy and reliability of<br />
these methods is hard to assess.<br />
In<strong>for</strong>mation about point defects and impurities can in<br />
principle also be obtained from tight-binding <strong>calculations</strong>.<br />
Tight-binding methods use the fact that within a local basis<br />
set the Hamilton matrix elements rapidly decrease with increasing<br />
distance between the orbitals. Thus, instead of having<br />
to diagonalize the full Hamiltonian matrix most of the<br />
matrix elements vanish and only a sparse matrix has to be<br />
diagonalized. Depending on how the remaining Hamilton<br />
matrix elements are determined one can distinguish two<br />
main approaches: i empirical tight-binding methods and ii<br />
first-<strong>principles</strong> tight-binding methods.<br />
An important problem <strong>for</strong> the empirical tight-binding approach<br />
is the choice of parameters, <strong>for</strong> which there is no<br />
consistent prescription. The shortcomings of tight-binding<br />
theory were highlighted in early work on point defects in<br />
GaN, where the a 1 state of the nitrogen vacancy was found<br />
to lie close to the bottom of the conduction band. 32,33 In<br />
reality, this state lies near the top of the valence band. 17 The<br />
location of this state is determined by the strong interaction<br />
between Ga dangling bonds surrounding the nitrogen vacancy;<br />
the tight-binding <strong>calculations</strong> of Refs. 32 and 33,<br />
which only took nearest-neighbor interactions into account,<br />
failed to include this interaction, resulting in an incorrect<br />
positioning of the defect levels. The origin of the failing of a<br />
first nearest-neighbor tight-binding method is the extremely<br />
ionic character and the correspondingly small lattice constant<br />
of the group-III nitrides. 17 Second nearest-neighbor interactions<br />
there<strong>for</strong>e play an important role.<br />
<strong>First</strong>-<strong>principles</strong> tight-binding methods use local orbitals<br />
to explicitly calculate the Hamilton matrix elements. The<br />
choice of orbitals is critical: instead of the standard local<br />
orbitals e.g., atomic orbitals, specifically designed and extremely<br />
localized orbitals are used. Approximations are made<br />
in neglecting some of the multi-center integrals and charge<br />
self-consistency. For group-III nitrides which are highly<br />
ionic, this approximation is not well satisfied. Significant improvement<br />
has been found by using a point-charge model to<br />
take charge transfer and polarizability into account. 34<br />
2. Density-functional theory<br />
Density-functional theory DFT <strong>calculations</strong> based on<br />
pseudopotentials, a plane-wave basis set, and a supercell geometry<br />
are now regarded as a standard <strong>for</strong> per<strong>for</strong>ming first<strong>principles</strong><br />
studies of defects in semiconductors. DFT in the<br />
local density approximation LDA 35 allows a description of<br />
the many-body electronic ground state in terms of singleparticle<br />
equations and an effective potential. The effective<br />
potential consists of the ionic potential due to the atomic<br />
cores, the Hartree potential describing the electrostatic<br />
electron-electron interaction, and the exchange-correlation<br />
potential that takes into account the many-body effects. This<br />
approach has proven to describe with high accuracy such<br />
quantities as atomic geometries, charge densities, <strong>for</strong>mation<br />
energies, etc. Most of the results described in Secs. III and<br />
IV are based on an implementation of pseudopotentialdensity-functional<br />
theory described in Ref. 3.<br />
An analysis of GaN defect and bulk <strong>calculations</strong> showed<br />
that the Ga 3d electrons are not chemically inert but play an<br />
important role <strong>for</strong> the chemical bonding. 36–38 Thus, in general<br />
the Ga 3d electrons cannot be simply treated as core<br />
electrons which would be computationally less expensive<br />
but have to be explicitly treated as valence electrons. 38 The<br />
localized nature of the Ga 3d states significantly increases<br />
the computational demand, requiring an energy cutoff of at<br />
least 60 Ry in the plane-wave expansions. An attractive alternative<br />
is to use the so-called ‘‘nonlinear core correction’’<br />
(nlcc), 39 in combination with soft Troullier–Martins<br />
pseudopotentials 40 <strong>for</strong> which an energy cutoff of 40 Ry suffices.<br />
The explicit inclusion of Ga 3d states as valence states<br />
yields demonstrable improvements in the structural properties<br />
as well as in the enthalpy of <strong>for</strong>mation. In large part,<br />
these improvements can also be achieved by using the<br />
nlcc. 41 For the electronic structure, however, the benefit of<br />
explicitly including Ga 3d states is unclear. DFT-LDA places<br />
these d states too high in the band structure, causing them to<br />
be closer to the valence-band maximum VBM; p – d repulsion<br />
then causes the VBM to be pushed up, leading to a<br />
decrease in the band gap. This effect has actually been found<br />
to persist in GW <strong>calculations</strong>. 42 The inclusion of 3d states in<br />
<strong>calculations</strong> of band-structure-related properties such as alloy<br />
band gaps or de<strong>for</strong>mation potentials may there<strong>for</strong>e not necessarily<br />
be an improvement compared to the use of the nlcc,<br />
where the effects of d states are only approximated and the<br />
anomalous repulsion between d states and the VBM is absent.<br />
Defect and impurity <strong>calculations</strong> should be carried out at<br />
the theoretical lattice constant, in order to avoid a spurious<br />
elastic interaction with defects or impurities in neighboring<br />
supercells. Since our purpose is to investigate properties <strong>for</strong><br />
a single, isolated defect or impurity in an infinite solid, the<br />
lattice constant of the supercell should correspond to that of<br />
the unperturbed host. It has sometimes been suggested that,<br />
in the process of relaxing the host atoms around the defect,<br />
the volume of the supercell should be relaxed as well. Such a<br />
volume relaxation would actually correspond to finding the<br />
lattice constant of a bulk system containing an ordered array<br />
of impurities at very high concentration. This could result in<br />
Downloaded 26 Apr 2004 to 13.1.101.37. Redistribution subject to AIP license or copyright, see http://jap.aip.org/jap/copyright.jsp
3856 J. Appl. Phys., Vol. 95, No. 8, 15 April 2004 Appl. Phys. Rev.: C. G. Van de Walle and J. Neugebauer<br />
a very different lattice constant from the one we are interested<br />
in, corresponding to a dilute system.<br />
Well-converged <strong>calculations</strong> with good-quality pseudopotentials<br />
should produce lattice parameters within a few<br />
percent of the experimental value. When the Ga 3d electrons<br />
are explicitly included, with an 80 Ry energy cutoff, 43 we<br />
find a th 3.193 Å compared with a exp 3.19 Å). The calculated<br />
c/a ratio is 1.634 experiment: 1.627, very close to the<br />
ideal c/a ratio of 8/31.633. For zinc-blende GaN, we<br />
find a th 4.518 Å, which is to within 0.002 Å & larger<br />
than the wurtzite lattice constant. Using the nlcc anda40<br />
Ry energy cutoff, the values are a th 3.089 Å and c/a<br />
1.633; and <strong>for</strong> zinc-blende GaN: a th 4.370 Å, again to<br />
within 0.001 Å & larger than the wurtzite lattice constant.<br />
For <strong>calculations</strong> of defects and impurities in semiconductors<br />
within the density-functional approach, use of the<br />
local density approximation seems to be well justified. The<br />
generalized gradient approximation GGA apparently does<br />
not offer any advantages, neither <strong>for</strong> bulk properties 43 nor <strong>for</strong><br />
<strong>for</strong>mation energies of point defects. 44 The quantitative differences<br />
that exist <strong>for</strong> the latter can be explained in terms of<br />
differences in the lattice constant which gives rise to differences<br />
in the band gap and in calculated <strong>for</strong>mation enthalpies<br />
between LDA and GGA. 44,41<br />
3. Beyond density-functional theory<br />
One shortcoming of the DFT approach is its failure to<br />
produce accurate excited-states properties—the band gap is<br />
commonly underestimated. 45,46 Research is currently under<br />
way to overcome this limitation of density-functional theory.<br />
No method is currently available that goes beyond DFT and<br />
provides total-energy capability <strong>for</strong> the large supercell <strong>calculations</strong><br />
required to investigate defects. Even methods aimed<br />
solely at calculating the band structure, such as the GW<br />
approach, 47–49 are currently prohibitively expensive <strong>for</strong> large<br />
cells.<br />
A promising approach that yields bulk band structures in<br />
good agreement with experiment was recently introduced,<br />
based on self-interaction and relaxation-corrected SIRC<br />
pseudopotentials. 50 This approach was used in Ref. 51 to<br />
per<strong>for</strong>m <strong>calculations</strong> of the electronic structure of bulk InN<br />
and of various native point defects. Defects can introduce<br />
levels in the band gap, and when occupied with electrons<br />
these levels contribute to the total energy of the system; it is<br />
there<strong>for</strong>e important to consider the effect of the band-gap<br />
error on the calculated properties of defects.<br />
The study of Ref. 51 indicated that the character of the<br />
defect-induced states is very similar in SIRC <strong>calculations</strong><br />
compared to LDA, but conduction-band related states are<br />
shifted to higher energies. The SIRC approach currently does<br />
not simply allow evaluation of total energies, and there<strong>for</strong>e<br />
the effects of the calculated changes in the band structure on<br />
the total energy of the defect were only estimated, without<br />
inclusion of selfconsistency. Still, it could be concluded that<br />
while total energies may be affected in some instances, at<br />
least <strong>for</strong> InN the shifts do not alter the conclusions based on<br />
the DFT <strong>calculations</strong>.<br />
The SIRC potentials used in Ref. 51 produced a band<br />
gap of wurtzite InN of 1.55 eV, which was considered in<br />
reasonable agreement with the commonly accepted band-gap<br />
value of 1.9 eV. Very recently, 52,53 it has become clear that<br />
the band gap of InN is actually only 0.8 eV. This does not<br />
affect the conclusions reported in Ref. 51: indeed, if the<br />
qualitative conclusions of the LDA conclusions remain valid<br />
even when the band gap is increased to 1.55 eV, then they<br />
should certainly still apply when the band gap is only<br />
0.8 eV.<br />
Other approaches have recently emerged that go beyond<br />
density-functional theory and look promising <strong>for</strong> addressing<br />
properties of defects and impurities. The fixed-node diffusion<br />
quantum Monte Carlo method was applied to the study of<br />
silicon self-interstitials in Ref. 54. The <strong>for</strong>mation energy of<br />
the split-110 interstitial defect was found to be significantly<br />
higher by 1.6 eV in the quantum Monte Carlo approach<br />
than in LDA. While this is a large number, it can probably be<br />
almost completely attributed to the upward shift of defectinduced<br />
levels in the band gap. Indeed, a shift of 0.7 eV<br />
needs to be applied to the LDA conduction band to bring it<br />
into agreement with experiment and, presumably, the quantum<br />
Monte Carlo result. Assuming that the self-interstitialinduced<br />
t 2 level undergoes a similar shift, its occupation with<br />
two electrons would raise the energy by 1.4 eV. In spite of<br />
the lack of selfconsistency, this estimate is close to the calculated<br />
difference between LDA and quantum Monte Carlo.<br />
Finally, we mention another promising approach that<br />
may overcome the limitations of DFT-LDA, namely, the use<br />
of an ‘‘Exact exchange’’ Kohn–Sham <strong>for</strong>malism. It has been<br />
demonstrated that this approach can produce high-quality<br />
band structures <strong>for</strong> semiconductors, 55 and in principle it<br />
lends itself to a self-consistent evaluation of total energies.<br />
Un<strong>for</strong>tunately, the computational requirements are currently<br />
prohibitive, and creative approaches to improve the computational<br />
efficiency will be essential in order to apply the<br />
method to supercell <strong>calculations</strong>.<br />
4. Definition of <strong>for</strong>mation energy<br />
The <strong>for</strong>mation energy of a defect or impurity X in charge<br />
state q is defined as<br />
E f X q E tot X q E tot GaN,bulk<br />
<br />
i<br />
n i i qE F E v V. 2<br />
E tot X is the total energy derived from a supercell calculation<br />
with one impurity or defect X in the cell, and<br />
E tot GaN,bulk is the total energy <strong>for</strong> the equivalent supercell<br />
containing only bulk GaN. n i indicates the number of<br />
atoms of type i host atoms or impurity atoms that have<br />
been added to (n i 0) or removed from (n i 0) the supercell<br />
when the defect or impurity is created, and the i are the<br />
corresponding chemical potentials of these species. Chemical<br />
potentials are discussed in detail in Sec. II E; <strong>for</strong> now, it<br />
suffices to know that these chemical potentials represent the<br />
energy of the reservoirs with which atoms are being exchanged.<br />
E F is the Fermi level, referenced to the valence-band<br />
maximum in the bulk. Due to the choice of this reference, we<br />
need to explicitly put in the energy of the bulk valence-band<br />
Downloaded 26 Apr 2004 to 13.1.101.37. Redistribution subject to AIP license or copyright, see http://jap.aip.org/jap/copyright.jsp
J. Appl. Phys., Vol. 95, No. 8, 15 April 2004 Appl. Phys. Rev.: C. G. Van de Walle and J. Neugebauer<br />
3857<br />
maximum, E v , in our expressions <strong>for</strong> <strong>for</strong>mation energies of<br />
charged states. As discussed in Sec. II C, we also need to add<br />
a correction term V, to align the reference potential in our<br />
defect supercell with that in the bulk.<br />
To illustrate these concepts, let us provide a specific example.<br />
For this we choose a Mg acceptor in GaN, because it<br />
will allow us to address a number of relevant issues.<br />
E f Mg 0 Ga E tot Mg 0 Ga E tot GaN,bulk Mg Ga<br />
E corr ,<br />
E f Mg Ga E tot Mg Ga E tot GaN,bulk Mg Ga<br />
E F E v VMg Ga .<br />
4<br />
The correction term E corr that appears in the <strong>for</strong>mation energy<br />
of Mg Ga is specific to shallow centers, and is discussed<br />
0<br />
in Sec. II D 3.<br />
In principle, the free energy should be used in Eq. 1.<br />
Use of the zero-temperature <strong>for</strong>mation energy as defined in<br />
Eq. 2 implies that contributions from vibrational entropy<br />
are neglected. Explicit <strong>calculations</strong> of such entropies are very<br />
demanding, and currently not feasible <strong>for</strong> the large number<br />
of defects to be addressed. These entropy contributions cancel<br />
to some extent, e.g., when solubilities are calculated; in<br />
general, they are small enough not to affect qualitative conclusions.<br />
Experimental and theoretical results <strong>for</strong> entropies<br />
of point defects show that the entropy is typically in the<br />
range between 0 and 10 k, where k is the Boltzmann constant.<br />
A simple estimate based on an Einstein model <strong>for</strong> the<br />
phonon frequencies gives values between 3 and 5k <strong>for</strong> the<br />
native defects in GaN.<br />
Entropy effects can play an important role under certain<br />
circumstances; <strong>for</strong> instance, they have been suggested to be<br />
responsible <strong>for</strong> the stabilization of a specific configuration of<br />
the Mg–H complex, where the free energy is lowered due to<br />
the large entropy associated with a low-energy excitation. 79<br />
In general, however, the inclusion of entropy does not cause<br />
any qualitative change in the results.<br />
5. Supercells<br />
The most common approach <strong>for</strong> per<strong>for</strong>ming <strong>calculations</strong><br />
<strong>for</strong> impurties and defects is in a supercell geometry. The<br />
defect is surrounded by a finite number of semiconductor<br />
atoms, and that whole structure is periodically repeated. 56–59<br />
This geometry allows the use of various techniques which<br />
require translational periodicity of the system. Provided the<br />
impurities are sufficiently well separated, properties of a<br />
single isolated impurity can be derived.<br />
A major advantage of the supercell method is that the<br />
band structure of the host crystal is well described. Indeed, it<br />
should be clear that per<strong>for</strong>ming a calculation <strong>for</strong> a supercell<br />
that is simply filled with the host crystal, in the absence of<br />
any defect, simply produces the band structure of the host.<br />
This contrasts with cluster approaches, where the host is<br />
modeled by a finite number of semiconductor atoms terminated<br />
at a surface which is typically hydrogenated, in order<br />
to eliminate surface states. Even fairly large clusters typically<br />
still produce sizeable quantum confinement effects<br />
3<br />
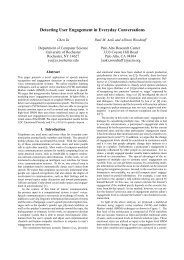
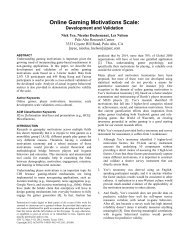
FIG. 1. Top view along 0001 direction of the GaN wurtzite structure:<br />
small circles represent nitrogen, large circles gallium. The shaded area corresponds<br />
to the primitive unit cell. The translation vectors <strong>for</strong> the primitive<br />
unit cell and <strong>for</strong> the 32-, 72-, and 96-atom supercells are also shown.<br />
which significantly affect the band structure, and interactions<br />
between defect wave functions and the cluster surface are<br />
hard to avoid.<br />
An alternative approach that provides a good description<br />
of the band structure of the host crystal is based on the<br />
Green’s function determined <strong>for</strong> the perfect crystal. This<br />
function is then used to calculate changes induced by the<br />
presence of the defect. 60 The Green’s function approach<br />
seems to be more cumbersome and less physically transparent<br />
than the supercell technique. Still, it is occasionally used,<br />
<strong>for</strong> instance in the linear muffin-tin orbital <strong>calculations</strong> of<br />
Gorczyca et al. <strong>for</strong> GaN, AlN, and BN. 61,62 However, their<br />
implementation of the method only allowed treatment of<br />
ideal substitutional defects, without inclusion of relaxations.<br />
In order to study the atomic and electronic structure of<br />
an impurity in the GaN crystal, we construct an artificial unit<br />
cell supercell composed of several primitive GaN unit cells<br />
and containing one impurity. The larger the supercell size,<br />
the closer our results will be to the case of a single, isolated<br />
impurity, because interactions between impurities in neighboring<br />
supercells are suppressed. Convergence as a function<br />
of supercell size should always be checked. Typical supercells<br />
<strong>for</strong> the wurtzite structure contain 32, 72, or 96 atoms.<br />
The 32-atom supercell is composed of eight wurtzite GaN<br />
primitive unit cells each containing four atoms, such that<br />
each translation vector of the supercell is doubled from that<br />
of the basic unit cell see Fig. 1. For the 72-atom supercell,<br />
the primitive unit cell is repeated three times in each of the<br />
basal-plane directions. Both 32- and 72-atom supercells suffer<br />
from the problem that the separation between impurities<br />
in neighboring supercells is quite different when measured<br />
along different directions. The 96-atom supercell avoids this<br />
problem by having translation vectors that are mutually perpendicular,<br />
leading to a cell with orthorombic symmetry.<br />
For the zinc-blende ZB structure, typical supercells<br />
contain 32 or 64 atoms. The 32-atom supercell has bcc symmetry,<br />
while the 64-atom cell is cubic, consisting of the conventional<br />
eight-atom cubic unit cell of the zinc-blende structure<br />
doubled in each direction.<br />
Within the supercell, relaxation of several shells of host<br />
atoms around the impurity or defect is always included. In a<br />
96-atom supercell, relaxing all atoms within a sphere of radius<br />
4.8 Å around a substitutional impurity corresponds to<br />
relaxing 46 atoms seven shells of atoms. In the zinc-blende<br />
64-atom cell, the same relaxation radius leads to at least 44<br />
atoms being relaxed five shells. These relaxation radii are<br />
Downloaded 26 Apr 2004 to 13.1.101.37. Redistribution subject to AIP license or copyright, see http://jap.aip.org/jap/copyright.jsp
3858 J. Appl. Phys., Vol. 95, No. 8, 15 April 2004 Appl. Phys. Rev.: C. G. Van de Walle and J. Neugebauer<br />
typically sufficient to capture all relevant relaxations around<br />
a defect; however, some exceptions exist where longer-range<br />
relaxations are important, <strong>for</strong> instance around divacancies in<br />
silicon 63 and around gallium interstitials in GaN. 24<br />
Convergence tests <strong>for</strong> point defects and impurities indicate<br />
that, <strong>for</strong> zinc blende, 32-atom and 64-atom supercells<br />
yield very similar results, indicating convergence. For wurtzite,<br />
the absolute values of <strong>for</strong>mation energies are not yet<br />
converged in a 32-atom cell. The 96-atom cell results are<br />
expected to be converged; <strong>for</strong> substitional impurities, these<br />
results <strong>for</strong> neutral and singly charged states are very close<br />
to the ZB 64-atom cells. 64<br />
6. Special k-points<br />
Brillouin-zone integrations are carried out using the<br />
Monkhorst–Pack scheme 65 with a regularly spaced mesh of<br />
nnn points in the reciprocal unit cell shifted from the<br />
origin to avoid picking up the point as one of the sampling<br />
points. Symmetry reduces this set to a set of points in<br />
the irreducible part of the Brillouin zone.<br />
When we describe a defect in a supercell approach,<br />
defect–defect interactions between defects in neighboring<br />
supercells lead to dispersion of the defect-induced levels in<br />
the band gap. A truly isolated defect corresponding to the<br />
limit of an infinitely large supercell would lead to a flat,<br />
dispersionless level. The use of special points actually provides<br />
a way of averaging over the defect band that leads to a<br />
result that should be very close to the level of the isolated<br />
defect. Note that this implies that the point, which is sometimes<br />
used <strong>for</strong> Brillouin-zone integrations due to the resulting<br />
numerical simplicity, provides a very poor description<br />
since there the defect-defect interaction reaches its maximum.<br />
These arguments show that <strong>for</strong> a fully occupied defect<br />
level the use of special points will lead to a contribution to<br />
the total energy that is a good approximation to the value<br />
expected <strong>for</strong> an isolated defect. Care should be taken, however,<br />
in cases where the defect level is only partially occupied.<br />
Most computational schemes assume a ‘‘metallic’’ occupation<br />
of electronic levels, meaning that eigenvalues are<br />
filled with electrons up to a Fermi level that is calculated to<br />
yield the correct total number of electrons in the same. If the<br />
partially occupied defect level is the highest occupied electronic<br />
level, then this metallic occupation potentially with<br />
some ‘‘smearing’’ representing a finite temperature results in<br />
a larger fraction of electrons being placed at k points where<br />
the eigenvalues of the defect level are lower. This unequal<br />
occupation of the defect level then produces a poor approximation<br />
to the total energy. Indeed, since averaging over the<br />
dispersion of the defect level produces the best approximation<br />
to the position of the defect level of the isolated defect,<br />
one should make sure that states at different k points corresponding<br />
to the same defect level are equally occupied. Doing<br />
so has been found to yield measurable improvements in<br />
convergence as a function of supercell size. 66<br />
Convergence tests indicate that <strong>for</strong> zinc blende, the<br />
222 sampling yields total energies that are converged to<br />
better than 0.1 eV in both 32-atom and 64-atom supercells.<br />
For the 32-atom wurtzite supercell, a 222 set does not<br />
yield fully converged results. In the 96-atom wurtzite cell,<br />
finally, the 222 k point mesh produces converged results,<br />
i.e., increasing the k point sampling changes the energy<br />
only by 0.01 eV. 24<br />
7. Self-consistent calculation of defect concentrations<br />
In Sec. II A we discussed how concentrations of defects<br />
and impurities depend on <strong>for</strong>mation energies, and in Sec.<br />
II B 4 we showed how these <strong>for</strong>mation energies are defined.<br />
We found that the <strong>for</strong>mation energies depend on atomic and<br />
electronic chemical potentials. The atomic chemical potentials<br />
reflect the experimental conditions that exist during<br />
growth or impurity incorporation, and as such are explicitly<br />
variable. However, the electronic chemical potential i.e., the<br />
Fermi level, isnot a free parameter. It is of course a quantity<br />
that we experimentally want to influence, specifically by<br />
doping of the semiconductor–and within our framework we<br />
do that by including dopant impurities. But the Fermi level<br />
E F cannot be directly varied; ultimately, it is determined by<br />
the condition of charge neutrality. In principle equations such<br />
as Eq. 2 can be <strong>for</strong>mulated <strong>for</strong> every point defect and impurity<br />
in the material; the complete problem including freecarrier<br />
concentrations in valence and conduction bands can<br />
then be solved self-consistently, imposing charge neutrality.<br />
The solution of this problem amounts to finding the root of a<br />
polynomial with xexp(E F /kT) as the variable. 16<br />
The notion of calculating point defect concentrations as<br />
a function of environmental conditions is, of course, not new.<br />
Kröger developed an elaborate <strong>for</strong>malism and applied it to<br />
many solids. 67 The <strong>for</strong>malism described here differs from<br />
Kröger’s approach in three major ways: 1 Instead of working<br />
with mass-action relations, which always relate to specific<br />
defect reactions and thus involve pairs of defects, we<br />
write down equations <strong>for</strong> <strong>for</strong>mation energies Eq. 2 <strong>for</strong><br />
each defect individually. This greatly simplifies the <strong>for</strong>malism,<br />
makes it more transparent, and still allows <strong>for</strong> obtaining<br />
a self-consistent solution <strong>for</strong> all the coupled equations, as<br />
described above. 2 Instead of working with partial pressures,<br />
we prefer to work with chemical potentials, as described<br />
in Sec. II E 1. Again, this renders the <strong>for</strong>malism more<br />
transparent and also allows us to clearly identify the effect of<br />
an abundance of certain species in the environment, even if<br />
equilibration with a gas outside the material cannot be assumed.<br />
As discussed in Ref. 31, the use of chemical potentials<br />
as variables also results in a reduction of the number of<br />
free parameters required to represent a phase diagram. 3<br />
Last but not least, the availability of first-<strong>principles</strong> <strong>calculations</strong><br />
to evaluate the key parameters provides us with an<br />
enormous advantage over Kröger, who had to infer the value<br />
of crucial parameters from limited experimental in<strong>for</strong>mation.<br />
This process often involved serious assumptions, which in<br />
turn could affect the results in uncontrolled ways. The unbiased,<br />
systematic results <strong>for</strong> all potential defects provided by<br />
state-of-the-art <strong>calculations</strong> allow us to approach defect<br />
problems truly from first <strong>principles</strong>.<br />
Rather than just showing results <strong>for</strong> defect concentrations,<br />
it is often very instructive to plot <strong>for</strong>mation energies as<br />
a function of E F in order to examine the behavior of defects<br />
and impurities when the doping level changes. For clarity of<br />
Downloaded 26 Apr 2004 to 13.1.101.37. Redistribution subject to AIP license or copyright, see http://jap.aip.org/jap/copyright.jsp
J. Appl. Phys., Vol. 95, No. 8, 15 April 2004 Appl. Phys. Rev.: C. G. Van de Walle and J. Neugebauer<br />
3859<br />
presentation the atomic chemical potentials may be set equal<br />
to fixed values; a general case can always be addressed by<br />
referring back to Eq. 2. We will see that the dependence of<br />
<strong>for</strong>mation energies on Fermi level provides immediate insight<br />
into the electrical activity donor or acceptor character<br />
of a defect or impurity, the position of its charge transfer<br />
level, and the potential behavior of certain defects as compensating<br />
centers.<br />
C. Charge states<br />
Most point defects and impurities can occur in multiple<br />
charge states. As shown in Eq. 2, the <strong>for</strong>mation energy<br />
depends on the charge state. Formation energies have to be<br />
calculated <strong>for</strong> each relevant charge state. The stable charge<br />
state is then the one which has the lowest <strong>for</strong>mation energy<br />
<strong>for</strong> a given Fermi level.<br />
Equation 2 shows that the <strong>for</strong>mation energy of charged<br />
impurities takes into account that electrons are exchanged<br />
with the Fermi level. The Fermi level E F is referenced with<br />
respect to the valence-band maximum in the bulk, i.e., E F<br />
0 at the top of the valence band (E v ) in bulk GaN. A<br />
problem when calculating E v is that in a supercell approach<br />
the defect or impurity strongly affects the band structure. We<br />
there<strong>for</strong>e cannot simply use E v as calculated in the defect<br />
supercell. To solve this problem a two-step procedure is<br />
used: i The top of the valence band E v is calculated in bulk<br />
GaN by per<strong>for</strong>ming a band-structure calculation at the <br />
point and ii an alignment procedure is used in order to align<br />
the electrostatic potentials between the defect supercell and<br />
the bulk.<br />
The fact that E v found <strong>for</strong> the bulk e.g., in a defect-free<br />
supercell cannot be directly applied to the supercell with<br />
defect can be attributed to the long-range nature of the Coulomb<br />
potential and the periodic boundary conditions inherent<br />
in the supercell approach. The creation of the defect gives<br />
rise to a constant shift in the potential, and this shift cannot<br />
be evaluated from supercell <strong>calculations</strong> alone since no absolute<br />
reference exists <strong>for</strong> the electrostatic potential in periodic<br />
structures. The problem is similar to that of calculating<br />
heterojunction band offsets, 68 and similar techniques can be<br />
used to address these issues. 16 Our preferred method is to<br />
align the electrostatic potentials by inspecting the potential in<br />
the supercell far from the impurity and aligning it with the<br />
electrostatic potential in bulk GaN. This leads to a shift in the<br />
reference level V, which needs to be added to E v in order<br />
to obtain the correct alignment. The resulting shifts are taken<br />
into account in our expressions <strong>for</strong> <strong>for</strong>mation energies in Sec.<br />
IIB4.<br />
Another issue regarding <strong>calculations</strong> <strong>for</strong> charged states is<br />
the treatment of the G0 term in the total energy of the<br />
supercell. This term would diverge <strong>for</strong> a charged system; we<br />
there<strong>for</strong>e assume the presence of a compensating uni<strong>for</strong>m<br />
background jellium and evaluate the G0 term as if the<br />
system were neutral. 59 Makov and Payne 69 have pointed out<br />
that the energy of this cell will converge very slowly as a<br />
function of supercell size, due to the electrostatic interactions<br />
between the periodic array of monopoles, which converge<br />
only as 1/L where L is the linear dimension of the supercell<br />
and is the static dielectric constant. Makov and Payne<br />
proposed to add a correction term essentially the Madelung<br />
energy of a lattice of point charges in a dielectric environment<br />
that would lead to a better estimate of the energy of a<br />
single isolated defect. Note that since this term scales as q 2 ,<br />
it can become quite sizeable <strong>for</strong> more highly charged systems.<br />
While the Makov–Payne approach works well <strong>for</strong><br />
atomic or molecular systems calculated in otherwise empty<br />
supercells, it has been found to lead to an overestimate of the<br />
correction term <strong>for</strong> defects in semiconductors. 66,70 An indiscriminate<br />
application of the Makov–Payne correction may<br />
not necessarily yield a better approximation of the total energy<br />
<strong>for</strong> an isolated defect. The reason has been proposed to<br />
be the improved screening that takes place around the defect<br />
within the supercell, which effectively reduces the strength<br />
of the interactions between defects in neighboring cells. The<br />
conclusions of Schwarz 66 were based on <strong>calculations</strong> <strong>for</strong><br />
GaAs, and it remains to be seen whether they also apply to<br />
GaN which has a smaller dielectric constant. For now,<br />
since more work is clearly needed to better understand these<br />
corrections, we refrain from applying them, and the results<br />
reported below do not include them.<br />
D. Electronic structure<br />
1. Thermodynamic transition levels versus optical<br />
levels<br />
Point defects and impurities almost always introduce<br />
levels in the band gap of the semiconductor or near the band<br />
edges. The experimental detection of these levels often <strong>for</strong>ms<br />
the basis <strong>for</strong> the identification of the defect or impurity. Calculation<br />
of these levels is there<strong>for</strong>e an important priority. The<br />
levels that are of experimental relevance always involve transitions<br />
between different charge states of the center. This<br />
means that the Kohn–Sham levels that result from a bandstructure<br />
calculation <strong>for</strong> the center cannot directly be identified<br />
with any levels that are relevant <strong>for</strong> experiment.<br />
The thermodynamic transition level (q 1 /q 2 ) is defined<br />
as the Fermi-level position where charge states q 1 and q 2<br />
have equal energy. As the name implies, this level would be<br />
observed in experiments where the final charge state can<br />
fully relax to its equilibrium configuration after the transition.<br />
This type of level is there<strong>for</strong>e what is observed in DLTS<br />
deep-level transient spectroscopy experiments, or, in the<br />
case of shallow centers, corresponds to the thermal ionization<br />
energy, as would be derived from an analysis of<br />
temperature-dependent Hall data.<br />
Let us illustrate this concept <strong>for</strong> the case of a shallow<br />
acceptor, such as Mg Ga , in GaN. The relevant charge states<br />
here are q 1 0 and q 2 1, and the thermodynamic transition<br />
level (0/) is usually called the thermal ionization<br />
energy or the acceptor ionization energy E A . By definition<br />
E f Mg Ga E F E A E f Mg 0 Ga . 5<br />
From Eqs. 3 and 3, it then follows that<br />
Downloaded 26 Apr 2004 to 13.1.101.37. Redistribution subject to AIP license or copyright, see http://jap.aip.org/jap/copyright.jsp
3860 J. Appl. Phys., Vol. 95, No. 8, 15 April 2004 Appl. Phys. Rev.: C. G. Van de Walle and J. Neugebauer<br />
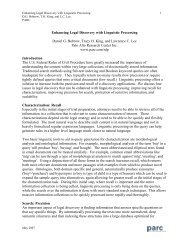
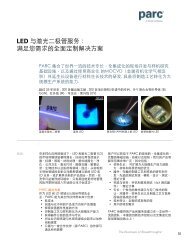
FIG. 2. Schematic configuration coordinate diagram illustrating the difference<br />
between thermal and optical ionization energies <strong>for</strong> an acceptor A. The<br />
curve <strong>for</strong> A 0 is vertically displaced from that <strong>for</strong> A assuming the presence<br />
of an electron in the conduction band. E rel is the Franck–Condon shift, i.e.,<br />
the relaxation energy that can be gained, in the negative charge state, by<br />
relaxing from configuration q 0 equilibrium configuration <strong>for</strong> the neutral<br />
charge states to configuration q equilibrium configuration <strong>for</strong> the negative<br />
charge state. Configuration coordinate diagrams are discussed in Sec.<br />
II D 2.<br />
E A E f Mg Ga E F 0E f Mg 0 Ga <br />
E tot Mg Ga E tot Mg 0 Ga E corr E v VMg Ga .<br />
6<br />
For purposes of defining the thermal ionization energy, it is<br />
implied that <strong>for</strong> each charge state the atomic structure is<br />
relaxed to its equilibrium configuration. The atomic positions<br />
in these equilibrium configurations are not necessarily the<br />
same <strong>for</strong> both charge states. Indeed, it is precisely this difference<br />
in relaxation that leads to the difference between<br />
thermodynamic transition levels and optical levels.<br />
The optical level opt (q 1 /q 2 ) associated with a transition<br />
between charge states q 1 and q 2 is defined similarly to the<br />
thermodynamic transition level, but now the energy of the<br />
final state q 2 is calculated using the atomic configuration of<br />
the initial state q 1 . The optical level would be observed in<br />
experiments where the final charge state cannot relax to its<br />
equilibrium configuration after the transition. This type of<br />
level is there<strong>for</strong>e what is observed, <strong>for</strong> instance, in photoluminescence<br />
experiments. Indeed, it is in<strong>for</strong>mative to consider<br />
the following simplified picture of a photoluminescence experiment,<br />
again illustrated <strong>for</strong> the specific example of a Mg<br />
acceptor: The exciting light creates electron-hole pairs. The<br />
holes can be trapped at Mg <br />
Ga centers, turning them into<br />
Mg 0 Ga . Using our definition of the thermal ionization energy<br />
E A , the equilibrium configuration of the Mg 0 Ga e state<br />
where e is an electron at the bottom of the conduction band<br />
is E g E A higher than the equilibrium configuration of<br />
Mg Ga , where E g is the band gap.<br />
Electrons in the conduction band can then recombine<br />
with the hole on the acceptor, as illustrated in Fig. 2. This<br />
leads to emission of a photon with energy E PL . During this<br />
emission process, the atomic configuration of the acceptor<br />
remains fixed–i.e., in the final state, the acceptor is in the<br />
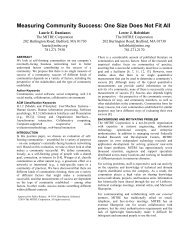
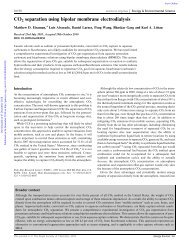
FIG. 3. Calculated configuration coordinate diagram <strong>for</strong> an oxygen DX<br />
center in wurtzite AlN, showing <strong>for</strong>mation energies <strong>for</strong> an impurity in the<br />
neutral open circles and negative closed circles charge states as a function<br />
of displacement along 0001. The Fermi level is assumed to be located<br />
at the bottom of the conduction band, and the zero of energy corresponds to<br />
the <strong>for</strong>mation energy of the neutral charge state at the substitutional site. The<br />
lines are a guide to the eye. U is the energy gain due to DX center <strong>for</strong>mation.<br />
E opt is the optical ionization energy. E c and E e are capture and emission<br />
barriers <strong>for</strong> electrons. From Ref. 14.<br />
negative charge state, but with a structure configuration coordinate<br />
q 0 ) that is the same as that <strong>for</strong> the neutral charge<br />
state. The difference between the energy of this configuration<br />
and that of the equilibrium configuration q is the relaxation<br />
energy E rel the Franck–Condon shift. Figure 2 shows that<br />
E PL E g E A E rel . If the optical ionization energy, E A opt is<br />
defined as the energy difference between the band gap and<br />
the PL line, we find that E A opt E g E PL E A E rel . This<br />
simplified picture ignores excitonic effects, etc., but it does<br />
show that the ionization energy extracted from an optical<br />
measurement should be larger than the thermal ionization<br />
energy E A by an amount E rel . If the atomic configuration in<br />
the two charge states is significantly different, E rel can be<br />
sizable.<br />
2. Configuration coordinate diagrams<br />
Configuration coordinate diagrams can be very useful in<br />
discussing and analyzing the energetics of impurities in different<br />
charge states. In fact, we have already employed a<br />
configuration coordinate diagram in this review, in the context<br />
of our discussion of optical ionization energies in Sec.<br />
II D 1. Underlying the idea of the configuration coordinate<br />
diagram is the notion that the energy of the defect or impurity<br />
depends on its atomic configuration. In many cases, one<br />
can identify a single coordinate or generalized coordinate<br />
that plays the dominant role in the energetics. This could, <strong>for</strong><br />
instance, be the magnitude of the breathing relaxation relevant,<br />
e.g., <strong>for</strong> a nitrogen vacancy, where the surrounding Ga<br />
atoms can undergo large displacements; or the magnitude of<br />
the off-center displacement of an impurity along a specific<br />
direction relevant, e.g., <strong>for</strong> oxygen in AlGaN or in GaN<br />
under pressure, which <strong>for</strong>ms a DX center; see Fig. 3 and Sec.<br />
IVA1.<br />
The energy of the center, in a specific charge state, can<br />
be plotted as a function of this coordinate. In schematic figures,<br />
this dependence is often shown to be parabolic; indeed,<br />
Downloaded 26 Apr 2004 to 13.1.101.37. Redistribution subject to AIP license or copyright, see http://jap.aip.org/jap/copyright.jsp
J. Appl. Phys., Vol. 95, No. 8, 15 April 2004 Appl. Phys. Rev.: C. G. Van de Walle and J. Neugebauer<br />
3861<br />
elastic restoring <strong>for</strong>ces cause the energy to depend quadratically<br />
on displacement <strong>for</strong> small displacements. However,<br />
first-<strong>principles</strong> <strong>calculations</strong> allow us to explicitly calculate<br />
this dependence without making any additional approximations.<br />
Both our examples Figs. 2 and 3 show that the coordinate<br />
value <strong>for</strong> which the minimum in the total energy occurs<br />
can be different in different charge states. In the case of<br />
the DX center, this <strong>for</strong>ms the central feature of the metastability<br />
of the center.<br />
By plotting the dependence of energy on coordinate <strong>for</strong><br />
two different charge states, one can gain immediate insight in<br />
the various processes and their energetics that can be observed<br />
experimentally. For instance, Fig. 3 illustrates that U<br />
is the thermodynamic energy gain due to DX center <strong>for</strong>mation;<br />
E opt is the optical ionization energy no relaxation of<br />
the final state allowed; and E c and E e are capture and emission<br />
barriers <strong>for</strong> electrons.<br />
3. Deep levels versus shallow levels<br />
In the case of a shallow acceptor the level introduced in<br />
the Kohn–Sham band structure due to the presence of the<br />
impurity is merely a perturbation of the host band structure.<br />
This ‘‘acceptor level’’ there<strong>for</strong>e exhibits essentially the same<br />
dispersion as the uppermost valence band. In the negative<br />
charge state, the acceptor level is filled–but in the neutral<br />
charge state, one electron is removed from this level. For a<br />
true, isolated acceptor corresponding to a calculation in a<br />
very large supercell, the electron would be removed from<br />
the top of the valence band, at the point. But in our finitesize<br />
supercells, the electron is actually taken out of the highest<br />
occupied Kohn–Sham level at the special k points, where<br />
the band energy is lower than at the point. A correction is<br />
there<strong>for</strong>e needed, obtained from the energy differences between<br />
the highest occupied state at the point and the special<br />
k points. The magnitude of this correction can be sizeable;<br />
<strong>for</strong> substitutional Be in GaN it was found to range from<br />
0.2 eV in a 96-atom cell to 0.5 eV in a 32-atom cell. 64<br />
This correction term, which we call E corr and which has been<br />
defined as a positive number, needs to be taken into account<br />
in all results <strong>for</strong> neutral acceptors. 71 A similar correction is<br />
needed <strong>for</strong> shallow donors: E corr is then the difference between<br />
the lowest occupied state at the point and the special<br />
k points.<br />
E. Chemical potentials<br />
1. Boundaries and range<br />
The chemical potentials depend on the experimental<br />
growth conditions, which can be Ga-rich or N-rich or anything<br />
in between. They should there<strong>for</strong>e be explicitly regarded<br />
as variable in our <strong>for</strong>malism. However, it is possible<br />
to place firm bounds on the chemical potentials; these<br />
bounds will prove very useful in interpreting the results.<br />
The Ga chemical potential, Ga , is subject to an upper<br />
bound: under extreme Ga-rich conditions, Ga Ga[bulk] .<br />
Indeed, in thermodynamic equilibrium the Ga chemical potential<br />
cannot be higher than the energy of bulk Ga. If we<br />
tried to push it higher, than we would no longer be growing<br />
GaN, but instead precipitating bulk Ga. This is indeed what<br />
is experimentally observed: MBE growth of GaN is often<br />
carried out under Ga-rich conditions, and precipation of Ga<br />
on the growing surface can be explicitly observed. 72,73<br />
Similarly, extreme N-rich conditions place an upper limit<br />
on N given by N N[N2 ] , i.e., the energy of N in a N 2<br />
molecule. It should be kept in mind that these chemical potentials,<br />
which are free energies, are temperature and pressure<br />
dependent.<br />
In addition to the upper bounds defined above, we can<br />
also impose lower bounds, using the following expression:<br />
Ga N E tot GaN,<br />
where E tot GaN is the total energy of a two-atom unit of<br />
bulk GaN. The upper limit on Ga then results in a lower<br />
limit on N<br />
N min E tot GaN Ga[bulk] .<br />
Similarly, the upper limit on N results in a lower limit on<br />
Ga<br />
min Ga E tot GaN N[N2 ] .<br />
9<br />
The total energy of GaN can also be expressed as<br />
E tot GaN Ga[bulk] N[N2 ]H f GaN,<br />
7<br />
8<br />
10<br />
where H f GaN is the enthalpy of <strong>for</strong>mation, which is<br />
negative <strong>for</strong> a stable compound. Our calculated value <strong>for</strong><br />
H f GaN is 1.24 eV including the 3d states as valence<br />
states or 0.48 eV using the nlcc); the experimental value<br />
is 1.17 eV. 74 By combining Eq. 8 or Eq. 9 with Eq.<br />
10 we observe that the host chemical potentials thus vary<br />
over a range corresponding to the magnitude of the enthalpy<br />
of <strong>for</strong>mation of GaN.<br />
The chemical potentials can in principle be related to<br />
partial pressures, using standard thermodynamic expressions.<br />
For instance, the chemical potential <strong>for</strong> hydrogen atoms in a<br />
gas of H 2 molecules is given by<br />
2 H E H2 kT ln pV Q<br />
kT<br />
ln Z rot ln Z vib, 11<br />
where E H2 is the energy of an H 2 molecule, k is the Boltzmann<br />
constant, T is the temperature, and p is the pressure.<br />
V Q (h 2 /2mkT) 3/2 is the quantum volume, and Z rot and<br />
Z vib are the rotational and vibrational partition functions.<br />
When using such expressions <strong>for</strong> the chemical potentials one<br />
should be careful to verify that equilibrium conditions apply.<br />
For instance, when a material is annealed at high temperature<br />
under an overpressure of a certain element, it may be appropriate<br />
to relate the chemical potential of that element to the<br />
partial pressure of the gas, provided the diffusivity of the<br />
species in the solid is high enough to ensure equilibration<br />
between defects inside the solid and the gas outside. Similarly,<br />
MOCVD growth at high temperatures may be close<br />
enough to equilibrium to allow relating the chemical potentials<br />
relevant <strong>for</strong> defect and impurity incorporation to the<br />
partial pressures of the flowing gases. A clear counterexample<br />
is provided by MBE growth: there, no equilibrium can be<br />
assumed between the species in the molecular beam and the<br />
species inside the growing solid. It there<strong>for</strong>e would not make<br />
Downloaded 26 Apr 2004 to 13.1.101.37. Redistribution subject to AIP license or copyright, see http://jap.aip.org/jap/copyright.jsp
3862 J. Appl. Phys., Vol. 95, No. 8, 15 April 2004 Appl. Phys. Rev.: C. G. Van de Walle and J. Neugebauer<br />
sense to relate the chemical potentials relevant <strong>for</strong> defects<br />
and impurities to a partial pressure in the molecular beam.<br />
2. Impurity solubility<br />
For impurities we also need to consider the corresponding<br />
elemental chemical potential X . The lower bound on<br />
X is minus infinity, corresponding to the total absence of<br />
the impurity from the growth environment. An upper bound<br />
on the impurity chemical potential is given by the energy of<br />
the elemental bulk phase. However, stronger bounds usually<br />
arise due to <strong>for</strong>mation of other solubility-limiting phases. For<br />
instance, when Mg is being incorporated in GaN, the Mg can<br />
interact with N and <strong>for</strong>m Mg 3 N 2 . Equilibrium with Mg 3 N 2<br />
implies<br />
3 Mg 2 N 3 Mg[bulk] 2 N[N2 ]H f Mg 3 N 2 ,<br />
12<br />
where H f Mg 3 N 2 is the enthalpy of <strong>for</strong>mation of Mg 3 N 2 .<br />
Equation 12 allows us to relate Mg to N , assuming equilibrium<br />
with Mg 3 N 2 . Combining this in<strong>for</strong>mation with the<br />
expression <strong>for</strong> the <strong>for</strong>mation energy of Mg Ga Eq. 3, we<br />
find that the lowest <strong>for</strong>mation energy and hence the highest<br />
concentration of Mg Ga , i.e., the solubility limit occurs under<br />
nitrogen-rich conditions, i.e., when N N[N2 ] . This may<br />
seem obvious, since N-rich conditions indeed make it easier<br />
<strong>for</strong> Mg to be incorporated on a substitutional Ga site. The<br />
situation is not always this obvious, however. For instance,<br />
when incorporating Si into GaN, the maximum solubility is<br />
achieved under Ga-rich conditions–in spite of the fact that<br />
the substitutional Si donor also incorporates on a Ga site.<br />
The reason is that in the case of GaN:Si the solubilitylimiting<br />
phase is Si 3 N 4 . Nitrogen-rich conditions, which<br />
would make it easier <strong>for</strong> Si to incorporate on a Ga site,<br />
promote the <strong>for</strong>mation of Si 3 N 4 , thereby suppressing the<br />
solubility. The net effect is that Ga-rich conditions are more<br />
favorable. 75<br />
F. Complexes<br />
So far we have implicitly discussed isolated impurities<br />
and point defects. It is possible, of course, <strong>for</strong> defects and<br />
impurities to agglomerate and <strong>for</strong>m complexes. The simplest<br />
situation is a complex AB consisting of two constituents, A<br />
and B. The chemical reaction to <strong>for</strong>m the complex is<br />
AB⇔AB;E b ,<br />
13<br />
where E b is the energy gained by this reaction. This binding<br />
energy E b between the constituents can be defined in terms<br />
of the <strong>for</strong>mation energies<br />
E b E f AE f BE f AB,<br />
14<br />
where the sign has been chosen such that a positive binding<br />
energy corresponds to a stable, bound complex.<br />
Merely having a positive binding energy does not imply<br />
that a complex will necessarily <strong>for</strong>m. Consider, <strong>for</strong> instance,<br />
the situation where the incorporation of the constituents, as<br />
well as the complex, is governed by thermal equilibrium at<br />
the growth temperature. In order <strong>for</strong> the concentration of<br />
complexes to be larger than that of either constituent, its<br />
<strong>for</strong>mation energy should be lower than both E f (A) and<br />
E f (B). This immediately implies that the binding energy E b<br />
needs to be greater than the larger of E f (A) and E f (B). In<br />
other words, unless the binding energy of the complex is<br />
large on the scale of the <strong>for</strong>mation energy of the constituents,<br />
its concentration will be small. The reason is that complexes<br />
generally have a much smaller configurational entropy. For<br />
example, a complex consisting of two constituents can be<br />
<strong>for</strong>med in N sites N config configurations see Eq. 1 whereas if<br />
the two constituents are independently <strong>for</strong>med they can be<br />
2<br />
created in N sites configurations. Thus, to discuss complex<br />
<strong>for</strong>mation it is not sufficient to look at the complex binding<br />
energy but also at the configurational entropy.<br />
Formation of complexes does not always occur under<br />
equilibrium conditions, however. A typical situation occurs<br />
when one of the constituents is incorporated and essentially<br />
‘‘frozen in’’ during the growth process, and complex <strong>for</strong>mation<br />
occurs only during the subsequent cooldown. Let us<br />
give a specific example, namely, <strong>for</strong>mation of Mg–H complexes<br />
in GaN. The Mg concentration is essentially determined<br />
at the growth temperature. As we will see in Sec.<br />
IV C 2, the binding energy of the Mg–H complex is significantly<br />
smaller than a typical <strong>for</strong>mation energy of the Mg<br />
acceptor. There<strong>for</strong>e the concentration of Mg–H complexes at<br />
the growth temperature is small compared to the Mg concentration.<br />
Complexes can <strong>for</strong>m during cooldown, however. A<br />
supply of hydrogen is available because hydrogen was incorporated<br />
during the growth, or because a reservoir of hydrogen<br />
is still available outside the crystal. These hydrogen atoms<br />
are highly mobile and can become bound at the<br />
substitutional Mg atoms. At sufficiently high temperatures<br />
these complexes can also dissociate, but once the temperature<br />
is lowered below a certain value any complexes that<br />
<strong>for</strong>m will be stable.<br />
Let us illustrate these issues with a specific scenario. We<br />
consider the complex AB consisting of two constituents A<br />
and B which can undergo the chemical reaction described in<br />
Eq. 13. The complex <strong>for</strong>mation can be described by the<br />
following mass-action law:<br />
c A c B<br />
N sites<br />
expE<br />
c AB N b /kT,<br />
15<br />
config<br />
where c A , c B , and c AB are the respective concentrations. Let<br />
us first consider the case where c A and c B are equilibrium<br />
concentrations according to Eq. 1. Then c A N sites<br />
expE f (A)/kT and c B N sites expE f (B)/kT. Using<br />
these relations together with Eq. 15 yields<br />
c AB c A c B<br />
N config<br />
N sites<br />
expE b /kT<br />
N config N sites<br />
expE f AE f BE b /kT.<br />
16<br />
Using Eq. 14 the above equation reproduces the concentration<br />
of AB complexes: c AB N config N sites<br />
expE f (AB)/kT.<br />
Let us now consider the case where the number of defects<br />
A and B are fixed but where at least one of the constitu-<br />
Downloaded 26 Apr 2004 to 13.1.101.37. Redistribution subject to AIP license or copyright, see http://jap.aip.org/jap/copyright.jsp
J. Appl. Phys., Vol. 95, No. 8, 15 April 2004 Appl. Phys. Rev.: C. G. Van de Walle and J. Neugebauer<br />
3863<br />
FIG. 4. Ratio of the concentration of complexes AB Mg–H, in the current<br />
example to the total concentration of A hydrogen as a function of temperature.<br />
The dash-dotted line represents thermal equilibrium conditions,<br />
while the solid line represents results in the event that the total concentrations<br />
of A hydrogen and B magnesium are determined by thermal equilibrium<br />
at the growth temperature 1300 K and kept fixed during cooldown.<br />
The <strong>for</strong>mation energies of A and B are taken to be 1 eV, and the binding<br />
energy E b is 0.7 eV, values that apply to the case of Mg–H complexes in<br />
GaN. The concentration ratio c AB /c A tot is small at the growth temperature but<br />
rises rapidly as the temperature is lowered <strong>for</strong> the case where the total<br />
concentrations of A and B are kept fixed.<br />
ents is sufficiently mobile to realize local equilibrium according<br />
to Eq. 13. We can then solve Eq. 15 using the<br />
condition that c tot A c A c AB and c tot B c B c AB are kept fixed.<br />
In this case, decreasing the temperature leads to an increase<br />
in the number of complexes AB and a decrease in the number<br />
of isolated defects A and B. To be specific let us apply<br />
this to the case where the constituents are Mg and H ,as<br />
already mentioned above. Charge neutrality requires that<br />
both are <strong>for</strong>med in roughly the same concentration c Mg <br />
c H assuming that the Fermi level is far enough from the<br />
band edges to lead to negligibly small free-carrier concentrations.<br />
Their <strong>for</strong>mation energies must there<strong>for</strong>e be the same,<br />
i.e., E f (Mg )E f (H ). As we will see in Sec. IV B 1, first<strong>principles</strong><br />
<strong>calculations</strong> show that E f (Mg )E f (H )<br />
1 eV. 76 The binding energy of the Mg–H complex is E b<br />
0.7 eV. 76 Let us further assume that during growth (T<br />
1300 K) the impurity concentration is in thermodynamic<br />
equilibrium and that after growth the sample is cooled down<br />
in a fashion that keeps the impurity concentration constant<br />
i.e., the total numbers of Mg and H atoms are kept fixed to<br />
their values at the growth temperature. The resulting temperature<br />
dependence of the complex concentration c AB expressed<br />
with respect to the total number of atoms of type A,<br />
which is being held constant is shown in Fig. 4. The figure<br />
shows that at the growth temperature the complex concentration<br />
is more than an order of magnitude smaller than the<br />
impurity concentration. However, as the temperature is reduced<br />
the complex concentration rises, and below about 500<br />
K only complexes will be <strong>for</strong>med. In contrast, if the concentrations<br />
of A, B, and AB were all determined by thermal<br />
tot<br />
equilibrium at each temperature, the ratio of c AB to c A<br />
would be significantly smaller. Freezing in the defect or impurity<br />
concentration thus significantly enhances complex <strong>for</strong>mation,<br />
leading to concentrations of complexes significantly<br />
higher than what might be expected from equilibrium arguments.<br />
G. Diffusion<br />
An important question when studying defect concentrations<br />
is to specify whether the system is in thermodynamic<br />
equilibrium or whether it is governed by kinetic processes.<br />
Generally, the system will be in thermodynamic equilibrium<br />
if the defects are sufficiently mobile to follow and eliminate<br />
gradients in the corresponding chemical potential. Calculations<br />
of diffusivities of point defects in the nitrides have only<br />
recently been per<strong>for</strong>med. 24<br />
A powerful tool to study and analyze the mobility of a<br />
defect is the calculation of total energy surfaces. Such surfaces<br />
provide direct insight into stable configurations and<br />
migration paths, and they show the location of saddle points,<br />
providing values <strong>for</strong> migration barriers. Total energy surfaces<br />
are also useful <strong>for</strong> identifying spatial locations where additional<br />
local minima metastable configurations might occur.<br />
We illustrate these concepts by considering the behavior<br />
of an interstitial impurity X i . In order to construct the corresponding<br />
total energy surface, we calculate the total energy<br />
of X i at various locations in the lattice. For each position of<br />
X i , the surrounding host atoms are allowed to relax, resulting<br />
in an adiabatic total energy surface. The resulting energy<br />
values as a function of the coordinates of the X i position,<br />
R Xi , define the potential energy surface: EE(R Xi ). The<br />
energy surface is there<strong>for</strong>e a function of three spatial dimensions.<br />
In order to obtain accurate results, a database of energy<br />
values <strong>for</strong> a sufficently large number of spatial coordinates<br />
is needed.<br />
Symmetry can be used in the calculation and visualization<br />
of the total energy surface. 59 We only need to calculate<br />
positions in the irreducible portion of the unit cell. The chosen<br />
locations are typically not equally spaced in the crystal,<br />
because it is better to increase the density of points near<br />
important locations such as local minima and saddle points.<br />
Since the energy surface is a function of R Xi , it possesses the<br />
full symmetry of the crystal. To make effective use of these<br />
symmetries, an analytic description of the surface is essential.<br />
This can be achieved through expansion in a basis set<br />
with the appropriate symmetry. A fitting of the total-energy<br />
results including the atomic <strong>for</strong>ces to this set of basis functions<br />
is then per<strong>for</strong>med, using a least-squares method. As<br />
basis functions, one can use symmetrized plane waves that<br />
reflect the full symmetry of the crystal zinc blende or wurtzite.<br />
One can also make use of the physical fact that the<br />
interstitial impurity can never approach any host atom too<br />
closely exchange processes, which would carry a very high<br />
energy cost, are not included in the total energy surface. To<br />
this end, some high-energy values near the host atoms can be<br />
added to the calculated data set; these additions does not<br />
affect the shape of the energy surface in the relevant regions<br />
away from the atoms.<br />
Since the energy surface is a function of three spatial<br />
dimensions, it is difficult to present the results in a single<br />
plot. For visualization purposes, we need to show a cut of the<br />
energy surface, restricting the coordinates to a single plane.<br />
Judicious choice of such planes ensures we convey all the<br />
essential in<strong>for</strong>mation, i.e., stable and metastable sites as well<br />
as barriers between them. For GaN, the 11–20 and 0001<br />
Downloaded 26 Apr 2004 to 13.1.101.37. Redistribution subject to AIP license or copyright, see http://jap.aip.org/jap/copyright.jsp
3864 J. Appl. Phys., Vol. 95, No. 8, 15 April 2004 Appl. Phys. Rev.: C. G. Van de Walle and J. Neugebauer<br />
planes are good choices. The energy surface can then be<br />
displayed as a contour plot or as a perspective plot of the<br />
energy along the z-axis as a function of coordinates in the<br />
plane.<br />
H. Direct comparison with experiment<br />
The first-<strong>principles</strong> <strong>calculations</strong> described above can be<br />
used to predict experimental results, and also to help interpret<br />
experimental observations. It is often desirable to be<br />
able to per<strong>for</strong>m a direct comparison between calculated and<br />
measured quantities. Such a comparison can be used, <strong>for</strong><br />
instance, to identify the chemical nature or microscopic<br />
structure of a defect. Here we mention two examples that<br />
have proven particularly useful <strong>for</strong> defect studies.<br />
1. Calculation of hyperfine parameters<br />
The first-<strong>principles</strong> <strong>calculations</strong> provide explicit in<strong>for</strong>mation<br />
about the wave functions in the system; it is there<strong>for</strong>e<br />
possible to calculate hyperfine parameters, which can be directly<br />
compared with the quantities measured by electron<br />
paramagnetic resonance. The wave functions have to be obtained<br />
from a calculation that explicitly includes spin polarization;<br />
i.e., spin-up and spin-down electrons have to be<br />
treated independently. It has been shown that it is very important<br />
to take contributions to the spin density from all the<br />
occupied states into account. One might assume that it would<br />
suffice to only include the wave function of the unpaired<br />
electron in the calculation of hyperfine parameters, but polarization<br />
of the valence states can strongly affect the result;<br />
<strong>for</strong> hydrogen impurities in Si, the difference was as large as<br />
a factor of two. 77<br />
Hyperfine parameters are particularly sensitive to the<br />
wave functions in the core region. When using a pseudopotential<br />
approach, the wave function in the core region is replaced<br />
by a smooth pseudowave function. It has been demonstrated<br />
that the in<strong>for</strong>mation contained in the pseudowave<br />
function, in conjunction with in<strong>for</strong>mation about wave functions<br />
in the free atom, is sufficient to calculate hyperfine<br />
parameters with a high degree of accuracy. The <strong>for</strong>malism is<br />
described in detail in Ref. 77.<br />
The experimental observation of hyperfine signals usually<br />
provides some in<strong>for</strong>mation about the chemical identity<br />
of the atoms in the vicinity of the defect, as well as about the<br />
symmetry. The ability to directly compare with calculated<br />
values <strong>for</strong> specific defect configurations then allows an explicit<br />
identification of the microscopic structure. Examples<br />
can be found in Ref. 77.<br />
2. Calculation of vibrational frequencies<br />
Defects or impurities often give rise to localized vibrational<br />
modes LVM. Light impurities, in particular, exhibit<br />
distinct LVMs that are often well above the bulk phonon<br />
spectrum. The value of the observed frequency often provides<br />
some indication as to the chemical nature of the atoms<br />
involved in the bond, but a direct comparison with first<strong>principles</strong><br />
<strong>calculations</strong> can be very valuable.<br />
Evaluating the vibrational frequency corresponding to a<br />
stretching or wagging mode of a particular bond can be accomplished<br />
by using calculated <strong>for</strong>ces to construct a dynamical<br />
matrix. In the case of light impurities, where a large mass<br />
difference exists between the impurity and the surrounding<br />
atoms, it is often a good approximation to focus on the displacement<br />
of the light impurity only, keeping all other atoms<br />
fixed. A fit to the calculated energies as a function of displacement<br />
then produces a <strong>for</strong>ce constant. This approach actually<br />
lends itself very well to taking higher-order terms anharmonic<br />
corrections into account. In the case of an<br />
impurity such as hydrogen the anharmonic terms can be on<br />
the order of several 100 cm 1 , so an accurate treatment is<br />
required. The <strong>for</strong>malism has been described in Ref. 78, and<br />
applications to LVMs in nitrides are detailed in Refs. 79 and<br />
80.<br />
3. Calculation of charge transfer levels<br />
The calculation of charge transfer levels was discussed<br />
in Sec. II D 1. Thermodynamic transition levels can be derived<br />
from experiments such as DLTS or temperaturedependent<br />
Hall measurements, while optical levels would be<br />
observed in photoluminescence. Comparisons with experiment<br />
should be carried out judiciously. For instance, the error<br />
in the LDA band gap may obviously affect the results. In<br />
the case of shallow levels the results are best expressed by<br />
referencing them to the valence-band maximum <strong>for</strong> acceptors,<br />
and to the conduction-band minimum <strong>for</strong> electrons. For<br />
deep levels, it is also often possible to determine whether the<br />
states have predominantly valence-band or conduction-band<br />
character, as discussed in the case of InN in Ref. 51. Levels<br />
that are valence-band derived <strong>for</strong> instance, the anion dangling<br />
bonds in the case of a cation vacancy are likely to be<br />
only modestly affected by band-gap corrections, while levels<br />
that are conduction-band derived <strong>for</strong> instance, the cation<br />
dangling bonds in an anion vacancy will likely shift up with<br />
the conduction band when band-gap corrections are applied.<br />
I. Accuracy<br />
It is appropriate to ask what the error bar is on the calculated<br />
<strong>for</strong>mation energies. One component of the error is a<br />
purely numerical error bar, associated with the choice of supercell<br />
size, plane-wave-energy cutoff, and k-point sampling.<br />
The magnitude of this error can be estimated simply by increasing<br />
the level of convergence. Well-converged <strong>calculations</strong>,<br />
of the type that will be reported in Secs. III and IV,<br />
have numerical error bars that are smaller than 0.1 eV. Accuracies<br />
better than 0.01 eV can be achieved in cases where<br />
it is considered important, <strong>for</strong> instance when taking energy<br />
differences between configurations of a specific defect in a<br />
single charge state <strong>for</strong> which other types of errors discussed<br />
below would systematically cancel.<br />
Another type of error that, in principle, could be explicitly<br />
checked by increasing the supercell size is the one<br />
caused by the electrostatic interactions between charged defects<br />
induced by the periodic boundary conditions, as discussed<br />
in Sec. II C. Un<strong>for</strong>tunately, the large cell sizes that<br />
would be required to per<strong>for</strong>m these checks often pose unreasonable<br />
computational demands. This emphasizes the need<br />
<strong>for</strong> a reliable method to correct <strong>for</strong> these interactions. We<br />
estimate that <strong>for</strong> 1 or 1 charge states in 96-atom nitride<br />
Downloaded 26 Apr 2004 to 13.1.101.37. Redistribution subject to AIP license or copyright, see http://jap.aip.org/jap/copyright.jsp
J. Appl. Phys., Vol. 95, No. 8, 15 April 2004 Appl. Phys. Rev.: C. G. Van de Walle and J. Neugebauer<br />
3865<br />
supercells this error is on the order of 0.1 eV; however, it<br />
may become more important <strong>for</strong> higher charge states.<br />
Another type of error could potentially be associated<br />
with the use of pseudopotentials. Explicit comparisons with<br />
all-electron <strong>calculations</strong> have shown, however, that the use<br />
of pseudopotentials produces highly accurate results see,<br />
e.g., Ref. 41.<br />
That leaves us with one remaining source of error,<br />
namely, density-functional theory itself, as discussed in Sec.<br />
II B 3. The magnitude of this error depends on how many<br />
electrons reside in defect-related states, and whether those<br />
states are affected by the band-gap error. As discussed in Ref.<br />
51, a qualitative picture based on the physics of the defect<br />
states can often be very illuminating. For instance, one expects<br />
the defect states associated with a cation vacancy in a<br />
III–N semiconductor to be derived from nitrogen dangling<br />
bonds, which have valence-band character and are hence unlikely<br />
to shift significantly when the band gap is corrected.<br />
There<strong>for</strong>e, a correction of the band gap is expected to have<br />
no significant effect on the <strong>for</strong>mation energy, since the energy<br />
of electrons residing in those defect states remains<br />
largely unchanged.<br />
Many cases where accuracy is important involve comparison<br />
of energies of configurations where the number of<br />
atoms and the charge state are kept fixed. In that case the<br />
systematic errors due to charge-state effects or due to<br />
density-functional theory cancel, and the accuracy is determined<br />
by the numerical error bar, as discussed above. An<br />
important example would be the calculation of migration<br />
barriers, which involve the energy difference between the<br />
ground state and the saddle point.<br />
Other types of calculated quantities exhibit larger error<br />
bars. For instance, transition levels see Sec. II D 1 are energy<br />
differences between different charge states, and hence<br />
unavoidably reflect the errors due to electrostatic interactions<br />
and due to the band-gap error. A conservative error bar of at<br />
least several 0.1 eV should always be assumed.<br />
III. NATIVE POINT DEFECTS<br />
A. Formation energies<br />
<strong>First</strong>-<strong>principles</strong> <strong>calculations</strong> <strong>for</strong> native point defects in<br />
GaN have been reported by several groups. The most comprehensive<br />
<strong>calculations</strong>, <strong>for</strong> all types of defects and charge<br />
states, were reported in Ref. 17. Bogusławski et al. 81 also<br />
per<strong>for</strong>med <strong>calculations</strong> <strong>for</strong> all defects, but did not explicitly<br />
report <strong>for</strong>mation energies. They seem to have focused on<br />
neutral charge states. Their results are qualitatively similar to<br />
those of Ref. 17, although some differences were evident in<br />
the interpretation of those results. To the extent that quantitative<br />
differences occur they can probably be attributed to the<br />
use of the point in the Brillouin-zone integrations, and the<br />
neglect of Ga d states in the <strong>calculations</strong> of Ref. 81. Studies<br />
<strong>for</strong> vacancies were also reported in Ref. 82, by Mattila<br />
et al., 83 by Mattila and Nieminen, 84 and neutral defects were<br />
investigated by Gorczyca et al. 62 The <strong>for</strong>mation energies of<br />
most of the defects are quite similar in zinc-blende and<br />
wurtzite; where exceptions occur they will be explicitly<br />
flagged.<br />
FIG. 5. Formation energies as a function of Fermi level <strong>for</strong> native point<br />
defects in GaN. Ga-rich conditions are assumed. The zero of Fermi level<br />
corresponds to the top of the valence band. Only segments corresponding to<br />
the lowest-energy charge states are shown. The slope of these segments<br />
indicates the charge state. Kinks in the curves indicate transitions between<br />
different charge states.<br />
Formation energies <strong>for</strong> all native point defects in GaN,<br />
in all relevant charge states, are shown in Fig. 5. These results<br />
were obtained from first-<strong>principles</strong> <strong>calculations</strong>; 17,75,82<br />
some of the values in Fig. 5 may differ from the earlier<br />
publications due to the fact that <strong>calculations</strong> <strong>for</strong> vacancies<br />
and self-interstitials were updated using 96-atom supercells.<br />
24 For each charge state of each defect Fig. 5 displays<br />
only the line segment that gives rise to the overall lowest<br />
energy. Thus, a change in slope of the lines represents a<br />
change in the charge state of the defect. The corresponding<br />
thermodynamic transition levels, as defined in Sec. II D 1, are<br />
illustrated in Fig. 6. Antisites are not included in Fig. 6 be-<br />
FIG. 6. Thermodynamic transition levels <strong>for</strong> defects in GaN, determined<br />
from <strong>for</strong>mation energies displayed in Fig. 5.<br />
Downloaded 26 Apr 2004 to 13.1.101.37. Redistribution subject to AIP license or copyright, see http://jap.aip.org/jap/copyright.jsp
3866 J. Appl. Phys., Vol. 95, No. 8, 15 April 2004 Appl. Phys. Rev.: C. G. Van de Walle and J. Neugebauer<br />
cause we will see that they are unlikely to ever play any role<br />
in GaN. We refer to Sec. II I <strong>for</strong> a discussion of the error bars<br />
on the quantities displayed in Figs. 5 and 6.<br />
Be<strong>for</strong>e discussing the defects in detail, we point out<br />
some general trends. Figure 5 shows that self-interstitial and<br />
antisite defects are high-energy defects in GaN, and are thus<br />
unlikely to occur during growth. These defects may still be<br />
created under nonequilibrium conditions, of course, <strong>for</strong> instance<br />
by electron irradiation or ion implantation. Selfinterstitials<br />
along with vacancies may also play a role in<br />
high-temperature diffusion. Overall, however, only vacancies<br />
have low enough energies to be present in significant concentrations<br />
in GaN. It is also evident from Fig. 5 that the<br />
neutral charge states have significantly higher energies than<br />
other charge states. An investigation limited only to neutral<br />
charge states would there<strong>for</strong>e not produce a reliable picture<br />
of defect <strong>for</strong>mation.<br />
B. Nitrogen vacancies<br />
Nitrogen vacancies (V N ) behave as shallow donors in<br />
GaN notice the dependence on Fermi energy in Fig. 5; an<br />
increase of <strong>for</strong>mation energy with E F is indicative of donors.<br />
When purposely created, <strong>for</strong> instance during irradiation<br />
or ion implantation, nitrogen vacancies will increase the<br />
electron concentration. 85 However, their high <strong>for</strong>mation energy<br />
under n-type conditions makes it very unlikely that nitrogen<br />
vacancies would <strong>for</strong>m spontaneously during growth<br />
of not-intentionally doped GaN, and hence they cannot be<br />
responsible <strong>for</strong> n-type conductivity.<br />
This conclusion contradicted the conventional wisdom in<br />
the nitride community, where <strong>for</strong> almost 25 years the n-type<br />
‘‘autodoping’’ of GaN had commonly attributed to the nitrogen<br />
vacancy. 86,87 Of course it also raised the question of what<br />
the actual source was of the observed n-type conductivity in<br />
not-intentionally doped GaN. Based on first-<strong>principles</strong><br />
<strong>calculations</strong>, 17,88 it was proposed that unintentional incorporation<br />
of oxygen could explain the conductivity. This possibility<br />
had previously been raised in a couple of experimental<br />
papers. 89,90 It has now become well accepted that impurities<br />
are responsible <strong>for</strong> the unintentional conductivity, and in particular<br />
the role of oxygen has been studied in great detail, as<br />
discussed below.<br />
We note that Fig. 5 does show that nitrogen vacancies<br />
have a low <strong>for</strong>mation energy in p-type GaN, making them a<br />
likely compensating center in the case of acceptor doping.<br />
The electronic structure of the nitrogen vacancy shows a<br />
s-like a 1 state lying close to the valence-band maximum, and<br />
p-like t 2 states above the conduction-band minimum. The<br />
latter are degenerate in the case of zinc-blende GaN, but are<br />
split into a singlet and a doublet state in the wurtzite structure.<br />
In the neutral charge state one electron would be placed<br />
in the t 2 states, but because these are resonant with the conduction<br />
band this electron is transferred to the lower-lying<br />
conduction-band minimum; this cause the nitrogen vacancy<br />
to act as a shallow donor, consistent with experiment. 85<br />
This result qualitatively differs from previous tightbinding<br />
TB <strong>calculations</strong>. 32,33 The main difference is the unusually<br />
large splitting between the a 1 and t 2 defect levels<br />
which is not correctly reproduced in the TB <strong>calculations</strong>.<br />
This large splitting originates from a peculiar property of<br />
GaN: due to the much smaller size of the nitrogen atoms<br />
compared to the Ga atoms, the Ga–Ga distance in GaN is<br />
comparable to that in bulk Ga, resulting in metalliclike bonds<br />
between the Ga atoms surrounding the nitrogen vacancy. 17<br />
This strong interaction between the Ga atoms, which are<br />
second-nearest neighbors, explains the large splitting of the<br />
a 1 and t 2 defect levels. It also explains the failing of tightbinding<br />
<strong>calculations</strong> in which mainly first-nearest neighbor<br />
interactions are taken into account.<br />
The atomic structure of the nitrogen vacancy is characterized<br />
by a small outward breathing relaxation, by about 4%<br />
of the bond length. 24 In the wurtzite structure the four Ga<br />
neighbors can be divided into three equivalent atoms lying in<br />
a plane perpendicular to the c axis and one inequivalent Ga<br />
atom located along the c axis above the defect. The differences<br />
in relaxation among the inequivalent directions are<br />
small.<br />
Figure 5 shows that <strong>for</strong> Fermi levels close to the VBM a<br />
charge state other than the single positive charge state is<br />
more stable. The occurrence of the 3 charge state is associated<br />
with a large breathing relaxation, in which the neighboring<br />
Ga atoms move outward by almost 15% of the bond<br />
length. 24 We note that the 2 charge state is never stable;<br />
this is characteristic of a negative-U impurity, which is usually<br />
associated with a strikingly large lattice relaxation of<br />
one of the charge states here 3). The origin of the stability<br />
of the 3 charge state is similar to what was observed by<br />
Northrup and Zhang <strong>for</strong> the As vacancy in GaAs 91 and by<br />
Garcia and Northrup <strong>for</strong> the Se vacancy in ZnSe: 92 A large<br />
outward relaxation of the four atoms surrounding the vacancy<br />
raises the energy of the a 1 level and eventually shifts<br />
it into the band gap. This rise in the a 1 level can only be<br />
accommodated if the level is empty, i.e., in the 3 charge<br />
state <strong>for</strong> V N in GaN.<br />
The transition level (3/) between the 3 and <br />
charge states occurs at 0.59 eV above the valence-band<br />
maximum VBM, 24 somewhat higher than the value of 0.16<br />
eV reported in Ref. 75 or 0.39 eV reported in Ref. 93, presumably<br />
due to the use of a larger supercell which allows<br />
better relaxation of V N 3 . The low <strong>for</strong>mation energy of the<br />
3 charge state under p-type conditions indicates that nitrogen<br />
vacancies can be a serious source of compensation in<br />
p-type GaN.<br />
C. Gallium vacancies<br />
The gallium vacancy (V Ga ) is the lowest energy defect in<br />
n-type GaN, where it acts as a triple acceptor. This defect<br />
plays a role in donor compensation as well as in the frequently<br />
observed yellow luminescence.<br />
The electronic band structure of V Ga shows levels within<br />
about 1 eV of the valence-band maximum. In the wurtzite<br />
structure these p-like t 2 states are split in a singlet and a<br />
doublet state. An outward breathing relaxation occurs: in the<br />
3 charge state the three equivalent nitrogen atoms move<br />
outward by 11% of the bond length, while the N atom<br />
along the c axis moves outward by 12%. 82<br />
Downloaded 26 Apr 2004 to 13.1.101.37. Redistribution subject to AIP license or copyright, see http://jap.aip.org/jap/copyright.jsp
J. Appl. Phys., Vol. 95, No. 8, 15 April 2004 Appl. Phys. Rev.: C. G. Van de Walle and J. Neugebauer<br />
3867<br />
Gallium vacancies (V 3 Ga ) have relatively low <strong>for</strong>mation<br />
energies in highly doped n-type material (E F high in the<br />
gap; they could there<strong>for</strong>e act as compensating centers. Yi<br />
and Wessels 94 have found evidence of compensation by a<br />
triply charged defect in Se-doped GaN.<br />
The Ga vacancy has a deep level the 2/3 transition<br />
level about 1.1 eV above the valence band. 82,84 Transitions<br />
between the conduction band or shallow donors and this<br />
deep level would there<strong>for</strong>e result in emission around 2.3 eV<br />
see Sec. II.H.3. The gallium vacancy has there<strong>for</strong>e been<br />
proposed as the source of the ‘‘yellow luminescence.’’<br />
1. Yellow luminescence<br />
The yellow luminescence YL in GaN is a broad luminescence<br />
band centered around 2.2 eV. The YL appears to be<br />
a universal feature: It has been observed in bulk GaN crystallites<br />
as well as in epitaxial layers grown by different techniques.<br />
The intensity can vary over a wide range, with good<br />
samples exhibiting almost no YL.<br />
The origins of the YL have been widely debated. Ogino<br />
and Aoki 95 proposed a model in which the YL is a transition<br />
between a shallow donor and a deep acceptor level, as illustrated<br />
in Fig. 7; a variety of experiments have confirmed this<br />
model. Proposals <strong>for</strong> the microscopic nature of the deep level<br />
have included a complex between a Ga vacancy (V Ga ) and a<br />
carbon atom; 95 aN Ga antisite; 96 and an isolated V Ga 82,97 or a<br />
complex between V Ga and oxygen 82 .<br />
At this point in time the gallium vacancy in isolated<br />
<strong>for</strong>m or complexed with an impurity appears to be the most<br />
likely source of the yellow luminescence; evidence is presented<br />
below.<br />
2. Experimental confirmation<br />
a. Complexing with donor impurities Gallium vacancies<br />
can <strong>for</strong>m complexes with donor impurities in GaN. 82 The<br />
V Ga –Si Ga complex has a rather small binding energy, due to<br />
its components being only second-nearest neighbors. The<br />
V Ga –O N complex, on the other hand, has a large binding<br />
energy 1.8 eV, see Refs. 82 and 84, and can there<strong>for</strong>e enhance<br />
the concentration of Ga vacancies. The electronic<br />
structure of this complex is very similar to that of the isolated<br />
gallium vacancy, giving rise to a deep level again about<br />
1.1 eV above the valence band. The presence of oxygen can<br />
there<strong>for</strong>e enhance the concentration of Ga vacancies and<br />
hence the YL.<br />
An increase in V Ga concentrations has indeed been observed<br />
in positron anihilation experiments on oxygen-doped<br />
samples Ref. 98, see next section. The correlation with<br />
oxygen is also a likely explanation <strong>for</strong> the increase in YL<br />
intensity in the neighborhood of the interface with the sapphire<br />
substrate, 99 where the oxygen concentration is known<br />
to be higher. 100,101<br />
We also note that Reshchikov et al. 102 have observed a<br />
yellow luminescence band centered at 2.15 eV and a green<br />
luminescence band centered at 2.43 eV in a 200 m thick<br />
GaN layer grown by hydride vapor phase epitaxy HVPE.<br />
FIG. 7. Schematic illustration of the transition between a shallow donor and<br />
a deep acceptor that leads to the yellow luminescence in GaN. Ogino and<br />
Aoki 95 placed the deep acceptor level at 860 meV above the valence-band<br />
maximum. The calculated 2/3 transition level of the gallium vacancy is<br />
located at 1.1 eV above the valence-band maximum. 82 From Ref. 95.<br />
The microscopic origin of these transitions is still unclear,<br />
but complexing of V Ga with different types of impurities or<br />
defects could be a potential explanation.<br />
The <strong>for</strong>mation of complexes involving Ga vacancies<br />
causes a small shift in the transition energy, contributing to a<br />
broadening of the luminescence line. Other factors contributing<br />
to the width of the line could be strain, proximity to<br />
extended defects, and Coulomb effects in the recombination<br />
of donor-acceptor pairs with varying separations.<br />
b. Positron annihilation The most direct evidence of a<br />
correlation between Ga vacancies and YL has emerged from<br />
positron annihilation measurements by Saarinen and<br />
coworkers. 103 These experiments provide a direct probe of<br />
vacancies in the sample. It was found that the concentration<br />
of V Ga correlates with the intensity of the YL, providing<br />
direct evidence <strong>for</strong> the involvement of the V Ga acceptor levels<br />
in the YL. Saarinen et al. also observed that the concentration<br />
of gallium vacancies in MOCVD-grown GaN increased<br />
from 10 16 to 10 19 cm 3 when the V/III molar ratio<br />
increased from 1000 to 10000, 104 consistent with V Ga being<br />
more favorable in N-rich material. They also found that the<br />
YL was suppressed in p-type material, consistent with easier<br />
<strong>for</strong>mation of V Ga under n-type conditions. 98 However, n-type<br />
doping with oxygen resulted in higher concentrations of V Ga<br />
than doping with silicon, consistent with the <strong>for</strong>mation of<br />
V Ga O N complexes leading to an enhancement in V Ga concentrations.<br />
c. n-type versus p-type GaN Gallium vacancies are<br />
more likely to <strong>for</strong>m in n-type than in p-type GaN. This trend<br />
is consistent with experimental observations indicating suppression<br />
of the YL in p-type material. 98,105–107 Conversely,<br />
an increase in n-type doping increases the intensity of the<br />
YL. 108–110 Schubert et al. 109 also found that the defects giving<br />
rise to the YL act as compensating centers, in agreement<br />
with the gallium-vacancy model.<br />
d. Ga-rich versus N-rich It is obvious that the concentration<br />
of gallium vacancies will be lower in Ga-rich mate-<br />
Downloaded 26 Apr 2004 to 13.1.101.37. Redistribution subject to AIP license or copyright, see http://jap.aip.org/jap/copyright.jsp
3868 J. Appl. Phys., Vol. 95, No. 8, 15 April 2004 Appl. Phys. Rev.: C. G. Van de Walle and J. Neugebauer<br />
The ground state of nitrogen interstitials consists of a<br />
split-interstitial configuration in which the N i <strong>for</strong>ms a N–N<br />
bond with one of the nitrogen host atoms, sharing its lattice<br />
site. 75 This configuration is strongly energetically preferred<br />
over other interstitial positions such as the octahedral (O) or<br />
tetrahedral (T) interstitial sites, due to the large strength of<br />
the N–N bond. The nitrogen interstitial can occur in various<br />
charge states, as shown in Fig. 5. The N–N bond distance<br />
varies from 1.1 Å in the 3 charge comparable to the<br />
bond distance in N 2 )to1.45 Å in the 1 charge state. 24,75<br />
In the neutral charge state N i has two singlet states in the<br />
band gap, occupied with three electrons. Depending on the<br />
position of the Fermi level the nitrogen interstitial may act<br />
both as an acceptor or a donor. However, nitrogen interstitials<br />
have fairly high <strong>for</strong>mation energies <strong>for</strong> all Fermi-level<br />
positions Fig. 5. They are thus unlikely to occur in thermal<br />
equilibrium. However, their <strong>for</strong>mation may be induced under<br />
nonequilibrium conditions, <strong>for</strong> instance under irradiation.<br />
116,117 They could also play a role in diffusion at high<br />
temperatures.<br />
FIG. 8. Schematic representation of atomic positions in the 11-20 plane of<br />
wurtzite GaN. The large circles represent Ga atoms, medium circles N atoms.<br />
The high-symmetry interstitial sites are indicated: O is the octahedral<br />
interstitial site, T the tetrahedral interstitial site.<br />
rial. The YL was indeed found to be suppressed in samples<br />
grown by metal-organic chemical vapor deposition<br />
MOCVD with higher gallium flow rates. 97,98,105 The YL<br />
was also found to be stronger in samples grown under<br />
N-stable conditions in molecular beam epitaxy MBE, consistent<br />
with higher V Ga concentrations when the growth is<br />
more N-rich. 111<br />
e. Recombination mechanism Various experiments have<br />
linked the YL with a deep level located about 1 eV above the<br />
valence band. 96,112,113 This is in agreement with the calculated<br />
position of the defect level induced by the Ga<br />
vacancy 82 see Fig. 7. In addition, the calculated pressure<br />
dependence of this level is also consistent with experiment. 96<br />
f . Similarity with SA centers in II–VI compounds It is<br />
useful to point out the similarity between the YL in GaN and<br />
the so-called self-activated SA luminescence in II– VI<br />
compounds. Metal vacancies and their complexes with donor<br />
impurities are well known in II–VI compounds e.g., ZnS,<br />
ZnSe. The metal vacancy complexes the so-called SA centers<br />
exhibit features which are strikingly similar to the YL:<br />
recombination between a shallow donorlike state and a deep<br />
acceptor state, and a broad luminescence band of Gaussian<br />
shape. 114,115<br />
D. Nitrogen interstitials<br />
E. Gallium interstitials<br />
Obtaining accurate results <strong>for</strong> the atomic configuration<br />
of the gallium interstitial is difficult due to the fairly large<br />
lattice relaxations induced by this defect. In the wurtzite<br />
structure, there are two distinct types of interstitial open<br />
spaces, as shown in Fig. 8. T is the tetrahedral interstititial<br />
site or cage site. This site is equidistant from four Ga and<br />
four N atoms. O is the octahedral interstitial site. This site is<br />
in the ‘‘interstitial channel’’ along the c axis. The O site is<br />
equidistant from six Ga and six N atoms. Both sites are obvious<br />
candidates <strong>for</strong> local minima of an interstitial defect.<br />
The <strong>calculations</strong> reported in Refs. 17 and 75 found the octahedral<br />
site to be most stable <strong>for</strong> Ga i , while it was argued in<br />
Ref. 81 that the tetrahedral site was slightly more stable than<br />
the O site. Based on our recent 96-atom supercells we can<br />
now confidently state that the octahedral interstitial site, at<br />
the center of the hexagonal channel, is the stable site <strong>for</strong> Ga i<br />
in all charge states. 24,75 The T site is not a local minimum,<br />
but plays a role in the diffusion process.<br />
As shown in Fig. 5, the stable charge states are 3 and<br />
1, meaning that Ga i always acts as a donor the lack of<br />
stability of the 2 charge state gain being characteristic of a<br />
‘‘negative-U’’ defect. The <strong>for</strong>mation energy of Ga i 3 is lowest<br />
but still higher than that of the nitrogen vacancy <strong>for</strong><br />
Fermi-level positions near the valence-band maximum<br />
VBM, i.e., under p-type conditions. The 2 state is not<br />
thermodynamically stable, and the 1 charge state is stable<br />
at higher Fermi levels, where the high <strong>for</strong>mation energy renders<br />
its <strong>for</strong>mation unlikely under equilibrium conditions.<br />
However, Ga interstitials can be induced by non-equilibrium<br />
processes, such as in the irradiation experiments of Ref. 118.<br />
The gallium interstitial induces two defect levels, a deep<br />
donor level and a resonance in the conduction band. In the<br />
neutral charge state the deep donor level is doubly occupied<br />
and the level in the conduction band singly occupied. Similar<br />
as <strong>for</strong> the nitrogen vacancy this electron will be donated to<br />
the bottom of the conduction band where it <strong>for</strong>ms a shallow<br />
donor level.<br />
F. Nitrogen antisites<br />
The nitrogen antisite (N Ga ) has a singlet and a doublet<br />
state in the band gap. The atomic configuration reflects a<br />
strong distortion. As in the case of the nitrogen interstitial,<br />
the driving <strong>for</strong>ce is the tendency to <strong>for</strong>m strong N–N bonds:<br />
the nitrogen atom on the Ga site moves toward a N neighbor<br />
and <strong>for</strong>ms a N–N bond. In Ref. 75 the N–N bond length was<br />
found to be sensitive to the charge state: filling up the defect<br />
levels increased the bond length from 1.2 Å in the 2 charge<br />
state up to 1.5 Å in the 4 charge state. The distance to the<br />
other three N neighbors was found to be much larger 2.1 Å<br />
indicating that no bond is <strong>for</strong>med. The nitrogen antisite is<br />
Downloaded 26 Apr 2004 to 13.1.101.37. Redistribution subject to AIP license or copyright, see http://jap.aip.org/jap/copyright.jsp
J. Appl. Phys., Vol. 95, No. 8, 15 April 2004 Appl. Phys. Rev.: C. G. Van de Walle and J. Neugebauer<br />
3869<br />
thus characterized only by a single N–N bond. Mattila<br />
et al. 83 also per<strong>for</strong>med a detailed study of relaxations around<br />
the nitrogen antisite in zinc-blende GaN. A metastability has<br />
been found in the neutral charge state. 62,83<br />
The <strong>for</strong>mation energy of the nitrogen antisite, in any of<br />
its charge states, is quite high see Fig. 5; it is thus unlikely<br />
that N Ga will <strong>for</strong>m in appreciable concentrations.<br />
G. Gallium antisites<br />
The gallium antisite Ga N has a singlet and a doublet state<br />
in the band gap. The substitutional Ga atom <strong>for</strong>ms four covalentlike<br />
bonds to the surrounding nearest neighbor Ga atoms,<br />
with a Ga–Ga bond length of 2.1 Å in the neutral<br />
charge state, 75 much shorter than the bond length in bulk Ga<br />
2.44 Å. 119 In spite of this significant compression the<br />
Ga–Ga bond length is still 12% larger than the bulk Ga–N<br />
bond length, indicative of a large strain. Indeed, atomic relaxation<br />
lowers the <strong>for</strong>mation energy by nearly 5 eV. However,<br />
the <strong>for</strong>mation energy remains too high <strong>for</strong> this defect to<br />
ever occur in appreciable concentrations.<br />
H. Complexes<br />
We already mentioned an example of complex <strong>for</strong>mation<br />
between a native defect and an impurity, namely the V Ga<br />
O N complex. It is also of interest to consider complexes<br />
between two native defects. Mattila and Nieminen 84 per<strong>for</strong>med<br />
<strong>calculations</strong> <strong>for</strong> complexes between nitrogen and gallium<br />
vacancies. They found the dominant charge state of the<br />
complex to be 2, as expected based on the dominant<br />
charge states of the constituents: 3 <strong>for</strong> V Ga and <strong>for</strong> V N .<br />
The binding energy is sizeable, but the <strong>for</strong>mation energy of<br />
the complex did not seem low enough, <strong>for</strong> any position of<br />
the Fermi level, <strong>for</strong> the complex to ever occur in appreciable<br />
concentrations. Put another way: since V N is unlikely to occur<br />
under n-type conditions, and V Ga unlikely to occur under<br />
p-type conditions, no conditions can be identified where both<br />
would be favorable enough <strong>for</strong> a complex to <strong>for</strong>m.<br />
Chadi 120 has proposed that a complex consisting of a<br />
nitrogen antisite and a nitrogen vacancy may be important in<br />
p-type GaN. Such a complex could originate starting from a<br />
gallium vacancy by moving a neigboring nitrogen atom to<br />
the vacancy site. Chadi focused on the significant lowering<br />
in energy that can be achieved by converting V 3<br />
Ga into a<br />
N Ga V N 3 complex: as much as 3.2 eV when the Fermi<br />
level is at the valence-band maximum. 120 However, our <strong>calculations</strong><br />
show that, under Ga-rich conditions and <strong>for</strong> E F<br />
E v , the sum of <strong>for</strong>mation energies of N 2 Ga and V N still<br />
exceeds 5.3 eV. Even a sizeable binding energy and/or a shift<br />
to N-rich conditions cannot bring the <strong>for</strong>mation energy of<br />
N Ga V N 3 to low enough values <strong>for</strong> this complex to occur<br />
in large enough concentrations to affect the electronic properties.<br />
I. Comparison between GaN and GaAs<br />
It is in<strong>for</strong>mative to compare the <strong>for</strong>mation of native<br />
point defects in GaN with the situation in a more conventional<br />
semiconductor such as GaAs. Two main differences<br />
are evident.<br />
<strong>First</strong>, we noted that in GaN only vacancies have low<br />
<strong>for</strong>mation energies. In contrast, in GaAs self-interstitials, antisites,<br />
and vacancies all have comparable <strong>for</strong>mation<br />
energies. 23,91,121 The high <strong>for</strong>mation energy of antisites and<br />
interstitials in GaN can be explained in terms of the large<br />
mismatch in the covalent radii of Ga and N. When a large<br />
atom Ga is brought into the crystal (Ga i ,Ga N ) the atoms<br />
around the defect have to move away from the defect, leading<br />
to large strains. Although atomic relaxation significantly<br />
reduces the <strong>for</strong>mation energy sometimes by several electron<br />
volts, the resulting <strong>for</strong>mation energy remains high. Conversely,<br />
when a small atom N is brought into the crystal<br />
(N i ,N Ga ) the initial bond length is too long to <strong>for</strong>m nearestneighbor<br />
bonds. The system seems to prefer to break the<br />
symmetry and <strong>for</strong>m low-symmetry configurations: <strong>for</strong> both<br />
the N interstitial and the N antisite we find that structures<br />
with one short N–N bond are preferred. Again, however, the<br />
large displacements necessary to allow <strong>for</strong>mation of this<br />
N–N bond lead to significant strains and sizeable <strong>for</strong>mation<br />
energies.<br />
Second, in GaN the defect with the overall lowest <strong>for</strong>mation<br />
energy is the nitrogen vacancy, under both Ga-rich<br />
and N-rich conditions. If deviations from stoichiometry occur<br />
due to point-defect <strong>for</strong>mation, they will there<strong>for</strong>e always<br />
tend toward nitrogen-deficient material even under N-rich<br />
conditions. This was confirmed by explicit self-consistent<br />
<strong>calculations</strong> of point-defect concentrations and stoichiometries<br />
in Ref. 121. In contrast, in GaAs point-defect <strong>for</strong>mation<br />
energies are more ‘‘balanced,’’ and As-rich conditions<br />
would indeed lead to As-rich material. The reason <strong>for</strong> the<br />
asymmetry in GaN can be found in the high binding energy<br />
of nitrogen molecules, which makes it difficult or even impossible<br />
<strong>for</strong> the GaN solid to ever become nitrogen-rich:<br />
Nitrogen atoms much prefer to leave the solid and become<br />
part of N 2 molecules, rather than incorporate in the solid in<br />
the <strong>for</strong>m of nitrogen-rich point defects. This feature is absent<br />
in the case of GaAs, where As molecules exhibit only modest<br />
binding energies.<br />
J. Native defects in AlN<br />
Studies of native defects in AlN are of interest <strong>for</strong> two<br />
main reasons. <strong>First</strong>, AlN is being considered as a candidate<br />
substrate <strong>for</strong> epitaxial growth of nitrides; indeed, bulk crystals<br />
of AlN are somewhat easier to obtain than crystals of<br />
GaN. 122 Second, AlGaN alloys are widely used in device<br />
structures, and knowledge of native defects is important <strong>for</strong><br />
improving the crystal quality. Studies that explicitly address<br />
point defects in alloys are rare so far; indeed, the accurate<br />
calculation of both alloy and defect properties requires large<br />
supercells, and a large number of <strong>calculations</strong> to address all<br />
relevant configurations. Bogusławski and Bernholc 123 focused<br />
on identifying trends in the <strong>for</strong>mation energy of nitrogen<br />
vacancies in AlGaN alloys, finding a strong dependence<br />
on the chemical identities of the nearest neighbors. Lacking<br />
detailed in<strong>for</strong>mation about alloys, the properties of native<br />
defects in AlGaN can, as a first approximation, be obtained<br />
by interpolating between AlN and GaN.<br />
Downloaded 26 Apr 2004 to 13.1.101.37. Redistribution subject to AIP license or copyright, see http://jap.aip.org/jap/copyright.jsp
3870 J. Appl. Phys., Vol. 95, No. 8, 15 April 2004 Appl. Phys. Rev.: C. G. Van de Walle and J. Neugebauer<br />
We will not discuss AlN in as much detail as we have<br />
GaN, but confine ourselves to mentioning the principal studies<br />
that have been per<strong>for</strong>med along with their main conclusions.<br />
<strong>First</strong>-<strong>principles</strong> <strong>calculations</strong> of <strong>for</strong>mation energies of native<br />
defects in AlN were per<strong>for</strong>med by Mattila and<br />
Nieminen, 84 Gorczyca et al., 62 Fara et al., 124 and Stampfl and<br />
Van de Walle. 44,125 The main conclusions are similar to those<br />
<strong>for</strong> GaN: Self-interstitials and antisites are high in energy in<br />
wurtzite AlN, and only vacancies have low enough <strong>for</strong>mation<br />
energies to occur in high enough concentrations to affect the<br />
electronic properties. An interesting exception occurs in zincblende<br />
AlN, where the Al interstitial a triple donor was<br />
found to have lower energy than the nitrogen vacancy in<br />
p-type material. 44 The lower <strong>for</strong>mation energy of Al i in the<br />
zinc-blende phase is probably due to the fact that in the<br />
wurtzite phase the interstitial can only strongly interact with<br />
three N neighbors, while in zinc blende it can <strong>for</strong>m bonds<br />
with four nitrogens. This explanation is similar to the one<br />
proposed in the case of the beryllium interstitial in wurtzite<br />
and zinc-blende GaN. 64<br />
The difference between zinc-blende and wurtzite structures<br />
also leads to interesting differences in the case of the<br />
nitrogen vacancy, related to the position of the higher-lying<br />
defect-induced level: 44,124 In zinc blende, this level is a resonance<br />
in the conduction band causing the vacancy to act as a<br />
shallow donor, while in wurtzite which has a larger band<br />
gap the level lies well below the conduction-band edge<br />
causing the vacancy to act as a deep donor.<br />
K. Native defects in InN<br />
Indium nitride is the least studied of the group<br />
III-nitrides. Bulk InN is difficult to prepare due to its low<br />
thermal stability; reliable experimental in<strong>for</strong>mation about the<br />
properties of InN is there<strong>for</strong>e scarce. In fact, it was only<br />
recently discovered 52,53 that the band gap of InN is not 1.9<br />
eV, as was long believed, but only 0.8 eV. Not intentionally<br />
doped InN has often been found to have very high electron<br />
densities–an observation similar to GaN be<strong>for</strong>e better<br />
doping control of that material was achieved. The unintentional<br />
n-type conductivity of InN has been attributed to the<br />
nitrogen vacancy as well as to the nitrogen antisite. 126,127<br />
Indium-containing nitride alloys are an important constituent<br />
in optoelectronic devices: <strong>for</strong> example, the active layer in<br />
short-wavelength light-emitting diodes and laser diodes usually<br />
consists of In x Ga 1x N. Increasing the In content of the<br />
alloy, in principle, makes it possible to extend the emitting<br />
light range from UV to red. Knowledge of point defects in<br />
InN is once again the first step toward developing an understanding<br />
of defects in InGaN alloys.<br />
Few <strong>calculations</strong> have been per<strong>for</strong>med <strong>for</strong> native defects<br />
in InN. An important problem in InN is the value of the band<br />
gap, which is close to zero in DFT-LDA <strong>calculations</strong>. It<br />
should be emphasized that the closure of the gap occurs only<br />
near the point, affecting only a very small portion of the<br />
Brillouin zone; at the special k-points used <strong>for</strong> reciprocalspace<br />
integrations the material still behaves like a semiconductor.<br />
Still, a critical examination of the DFT-LDA results is<br />
FIG. 9. Formation energy vs Fermi energy <strong>for</strong> native defects nitrogen and<br />
gallium vacancies and donors oxygen and silicon in GaN. The zero of<br />
Fermi energy is located at the top of the valence band. Gallium-rich conditions<br />
and equilibrium with Ga 2 O 3 and Si 3 N 4 are assumed.<br />
appropriate. Stampfl and Van de Walle 51 addressed this problem<br />
by using the self-interaction and relaxation-corrected<br />
SIRC pseudopotentials. 50 As discussed in Sec. II B 3, the<br />
study showed that the conclusions obtained with LDA are<br />
not affected by the computational approach.<br />
The results <strong>for</strong> point defects are again qualitatively similar<br />
to those <strong>for</strong> GaN: Self-interstitials and antisites are high<br />
in energy, and vacancies are mainly important as compensating<br />
centers. The nitrogen vacancy, a shallow donor, is the<br />
lowest energy native defect in InN. In n-type material its<br />
<strong>for</strong>mation energy is high much higher than that of common<br />
impurities such as oxygen, silicon, or hydrogen, which all act<br />
as donors. Nitrogen vacancies thus do not account <strong>for</strong> the<br />
observed n-type conductivity of as-grown InN.<br />
IV. IMPURITIES<br />
A. Donors in GaN<br />
Calculations <strong>for</strong> extrinsic donors have been per<strong>for</strong>med<br />
<strong>for</strong> silicon, germanium, and oxygen. 84,93,128,129 While carbon<br />
could in principle behave as a donor when incorporated on<br />
the gallium site, the <strong>for</strong>mation energy <strong>for</strong> this configuration<br />
is very high, and much larger than <strong>for</strong> incorporation of carbon<br />
on the nitrogen site, where it acts as an acceptor. Silicon<br />
is the most widely used intentional n-type dopant, while oxygen<br />
is the most likely candidate <strong>for</strong> unintentional doping.<br />
Figure 9 summarizes first-<strong>principles</strong> results <strong>for</strong> native<br />
defects and impurities relevant <strong>for</strong> n-type doping see Sec.<br />
II I <strong>for</strong> a discussion of error bars. The figure incorporates<br />
in<strong>for</strong>mation from Refs. 82 and 24. We observe that nitrogen<br />
vacancies (V N ) have high energies in n-type GaN, and are<br />
thus unlikely to occur in significant concentrations. This<br />
Downloaded 26 Apr 2004 to 13.1.101.37. Redistribution subject to AIP license or copyright, see http://jap.aip.org/jap/copyright.jsp
J. Appl. Phys., Vol. 95, No. 8, 15 April 2004 Appl. Phys. Rev.: C. G. Van de Walle and J. Neugebauer<br />
3871<br />
FIG. 10. Schematic illustration of the local environment around an oxygen<br />
impurity in wurtzite AlN. The dotted lines indicate the oxygen position in<br />
the DX configuration.<br />
finding allowed us to conclude that nitrogen vacancies are<br />
not responsible <strong>for</strong> n-type conductivity in GaN. In contrast,<br />
Fig. 9 shows that oxygen and silicon have relatively low<br />
<strong>for</strong>mation energies in n-type GaN, and can thus be readily<br />
incorporated. Both oxygen and silicon <strong>for</strong>m shallow donors<br />
in GaN. The slope of the lines in Fig. 9 indicates the charge<br />
state of the defect or impurity: Si Ga ,O N , and V N all appear<br />
with slope 1, indicating they are single donors.<br />
1. Oxygen<br />
The suggestion that oxygen can be responsible <strong>for</strong><br />
n-type conductivity in GaN was made by Seifert et al. 89 and<br />
by Chung and Gershenzon. 90 Still, the prevailing conventional<br />
wisdom, attributing the n-type behavior to nitrogen<br />
vacancies, proved hard to overcome. After first-<strong>principles</strong><br />
<strong>calculations</strong> showed that nitrogen vacancies could not explain<br />
the observed n-type conductivity, 17 more detailed experiments<br />
were per<strong>for</strong>med, which confirmed that unintentionally<br />
doped n-type GaN samples contained concentrations<br />
of extrinsic donors particularly oxygen high enough to explain<br />
the electron concentrations.<br />
Götz et al. 130 reported electrical characterization of intentionally<br />
Si-doped as well as unintentionally doped<br />
samples grown by MOCVD, and concluded that the n-type<br />
conductivity in the latter was due to silicon. They also found<br />
evidence of another shallow donor with a slightly higher<br />
activation energy, which was attributed to oxygen. Götz<br />
et al. also carried out SIMS secondary-ion mass spectroscopy<br />
and electrical measurements on hydride vapor phase<br />
epitaxy HVPE material, finding levels of oxygen or silicon<br />
in agreement with the electron concentration. 100<br />
High levels of n-type conductivity have always been<br />
found in GaN bulk crystals grown at high temperature and<br />
high pressure. 131 It has been established that the characteristics<br />
of these samples obtained from high-pressure studies<br />
are very similar to epitaxial films which are intentionally<br />
doped with oxygen. 132,133 The n-type conductivity of bulk<br />
GaN can there<strong>for</strong>e be attributed to unintentional oxygen incorporation.<br />
The high-pressure experiments have also shown that<br />
freezeout of carriers occurs at pressures exceeding 20<br />
GPa. 131,133–135 Originally this observation was interpreted as<br />
consistent with the presence of nitrogen vacancies, since the<br />
V N donor gives rise to a resonance in the conduction band,<br />
which emerges into the band gap under pressure. However,<br />
the observations are also entirely consistent with a<br />
‘‘DX-like’’ behavior of the oxygen donor.<br />
The prototype DX center is silicon in GaAs, which undergoes<br />
a transition from a shallow to a deep center when<br />
hydrostatic pressure is applied. 12 <strong>First</strong>-<strong>principles</strong> <strong>calculations</strong><br />
<strong>for</strong> oxygen in GaN under pressure 14 show that at sufficiently<br />
high pressure the oxygen impurity moves off the substitutional<br />
site and assumes an off-center configuration see Fig.<br />
10: a large outward relaxation introduces a deep level in the<br />
band gap, and the center actually becomes negatively<br />
charged i.e., it behaves as an acceptor. Alloying with AlN<br />
increases the band gap similar to the application of hydrostatic<br />
pressure; the behavior of impurities in AlGaN should<br />
there<strong>for</strong>e be similar to that in GaN under pressure. Indeed,<br />
first-<strong>principles</strong> <strong>calculations</strong> 14,93 show that oxygen will undergo<br />
a DX transition in Al x Ga 1x N when x0.3, consistent<br />
with the observed decrease in n-type conductivity of unintentionally<br />
doped AlGaN. 15,136,137 A configuration coordinate<br />
diagram <strong>for</strong> oxygen in AlN is shown in Fig. 3. The conclusion<br />
is that oxygen cannot be used as a shallow donor in<br />
Al x Ga 1x N when x0.3. Even if another donor impurity is<br />
used that does not exhibit DX behavior, the presence of oxygen<br />
in the layer could be detrimental to n-type conductivity:<br />
Indeed, once oxygen undergoes the DX transition it behaves<br />
as a deep acceptor, and there<strong>for</strong>e counteracts the electrical<br />
activity of other donors.<br />
2. Silicon<br />
Si Ga is an energetically very stable configuration; the nitrogen<br />
substitutional site and the interstitial configurations<br />
are energetically unfavorable. 75 This can be understood by<br />
noting that silicon has an atomic radius very similar to gallium.<br />
Thus, while easily fitting in on a Ga site, it causes a<br />
large strain if it replaces a small N atom or goes on an interstitial<br />
site.<br />
Several first-<strong>principles</strong> studies have addressed the issue<br />
whether silicon donors undergo a DX transition. Park and<br />
Chadi 93 reported that Si becomes a DX center in Al x Ga 1x N<br />
at x0.24. Possible geometries <strong>for</strong> the Si DX center are<br />
shown in Fig. 11; Park and Chadi found the -BB configuration<br />
to be most favorable in AlN. Bogusławski and<br />
Bernholc 129 found that Si in Al x Ga 1x N would undergo a<br />
shallow-deep transition at x0.6. Van de Walle, finally, reported<br />
that Si would remain shallow throughout the alloy<br />
range. 14<br />
Experimentally it has been confirmed that Si remains a<br />
shallow donor in GaN under pressure up to 25 GPa 135 and in<br />
Al x Ga 1x N alloys up to x0.44. 15 For higher Al content,<br />
several groups have reported that Si seems to undergo a<br />
shallow-deep transition. 138–140 However, even in the deep<br />
state the activation energy is still modest. A configuration<br />
coordinate diagram based on the experimental work of Zeisel<br />
et al. 139 is shown in Fig. 12. Further work will be necessary<br />
in order to establish whether silicon is a viable dopant in<br />
AlGaN with high Al content.<br />
Downloaded 26 Apr 2004 to 13.1.101.37. Redistribution subject to AIP license or copyright, see http://jap.aip.org/jap/copyright.jsp
3872 J. Appl. Phys., Vol. 95, No. 8, 15 April 2004 Appl. Phys. Rev.: C. G. Van de Walle and J. Neugebauer<br />
FIG. 12. Configuration coordinate diagram <strong>for</strong> a Si DX center in AlN, based<br />
on experimental in<strong>for</strong>mation. From Ref. 139.<br />
FIG. 11. Schematic illustration of the local environment around a silicon<br />
impurity in wurtzite AlN. a shows the ideal wurtzite lattice. b Illustrates<br />
the broken-bond DX configuration with bond breaking along the c axis the<br />
so-called -BB center. c Illustrates another broken-bond configuration,<br />
with bond breaking along a different direction the so-called -BB center.<br />
From Ref. 93.<br />
3. Germanium<br />
Park and Chadi 93 found that Ge is a shallow donor in<br />
both GaN and AlN, i.e., it does not exhibit a DX transition.<br />
In contrast, Bogusławski and Bernholc 129 found that Ge in<br />
Al x Ga 1x N would undergo a DX transition at x0.3. Experimentally,<br />
Zhang et al. 141 found Ge in Al x Ga 1x Ntobea<br />
shallow donor <strong>for</strong> x0.2; the behavior of Ge in AlGaN alloys<br />
with x0.2 remains an open question.<br />
1. Magnesium<br />
Magnesium has emerged as the acceptor dopant of<br />
choice in GaN. It has been found, however, that hole concentrations<br />
obtained with Mg doping are limited. 142,143 In<br />
addition, it is well known that Mg-doped GaN grown by<br />
MOCVD needs to be subjected to post-growth treatments<br />
such as low-energy electron-beam irradiation 7 or thermal<br />
annealing 8 in order to activate the acceptors. All of these<br />
features have been addressed by first-<strong>principles</strong> <strong>calculations</strong>.<br />
Figure 13 shows calculated <strong>for</strong>mation energies <strong>for</strong> impurities<br />
and defects relevant <strong>for</strong> p-type GaN, <strong>for</strong> Ga-rich conditions<br />
see Sec. II I <strong>for</strong> a discussion of error bars. The figure<br />
incorporates in<strong>for</strong>mation from Refs. 10, 24, and 144. The<br />
Mg acceptor has a low enough <strong>for</strong>mation energy to be incorporated<br />
in large concentrations in GaN. For the purposes of<br />
the plot, we have assumed Ga-rich conditions which are<br />
actually the least favorable <strong>for</strong> incorporating Mg on Ga<br />
sites, and equilibrium with Mg 3 N 2 , which determines the<br />
solubility limit <strong>for</strong> Mg. We note that the <strong>for</strong>mation energies<br />
0<br />
<strong>for</strong> Mg Ga and Mg <br />
Ga intersect <strong>for</strong> a Fermi level position<br />
around 200 meV; this transition level would correspond to<br />
the ionization energy of the Mg acceptor. Since the calculated<br />
<strong>for</strong>mation energies are subject to numerical error bars<br />
of 0.1 eV, this value should not be taken as an accurate<br />
assessment of the ionization energy. Nonetheless, it is in reasonable<br />
agreement with the experimental value of 208 meV<br />
B. Acceptors in GaN<br />
FIG. 13. Formation energy as a function of Fermi level <strong>for</strong> Mg in different<br />
configurations Ga-substitutional, N-substitutional, and interstitial configuration.<br />
Also included are the dominant native defect (V N ) and interstitial H.<br />
Gallium-rich conditions and equilibrium with Mg 3 N 2 are assumed.<br />
Downloaded 26 Apr 2004 to 13.1.101.37. Redistribution subject to AIP license or copyright, see http://jap.aip.org/jap/copyright.jsp
J. Appl. Phys., Vol. 95, No. 8, 15 April 2004 Appl. Phys. Rev.: C. G. Van de Walle and J. Neugebauer<br />
3873<br />
TABLE I. Ionization energies of acceptors in GaN, E A , in eV, as calculated<br />
by first-<strong>principles</strong> DFT-LDA, and by effective-mass theory EMT. Experimental<br />
values are listed where available. Values are <strong>for</strong> wurtzite GaN, except<br />
where indicated by ‘‘(zb).’’<br />
Acceptor<br />
DFT-LDA EMT Experiment<br />
E A Reference E A Reference E A Reference<br />
Li Ga 0.39 11 – –<br />
0.16 146 – –<br />
Be Ga 0.17 64 0.209 147 0.090 148, 149<br />
0.06 150 0.187 151 0.150 152<br />
0.200 153<br />
0.250 154<br />
C N 0.26 155 0.230 147 0.230 159<br />
0.18 zb 156 0.152 151 0.215 zb 157<br />
0.65 150<br />
0.2 158<br />
Mg Ga 0.20 164 0.215 147 0.208 145<br />
0.23 150 0.224 151<br />
Ca Ga 0.64 11 0.259 147<br />
0.62 150 0.302 151<br />
Zn Ga 0.23 11 0.331 147 0.328 160<br />
0.33 150 0.364 151<br />
Cd Ga 0.65 150 0.625 151 0.550 161<br />
determined by Götz et al. 145 Other calculated values <strong>for</strong> the<br />
ionization energy of Mg in GaN are included in Table I.<br />
Other positions of Mg in the lattice have been investigated.<br />
‘‘Antisite’’ (Mg N ) configurations and Mg on interstitial<br />
sites (Mg i ) were found to have high <strong>for</strong>mation<br />
energies. 10 In addition, AX center configurations, in which<br />
the Mg moves off the substitutional site similar to the donor<br />
DX centers discussed in Sec. IV A, were also found to be<br />
unfavorable. 93 We there<strong>for</strong>e conclude that Mg overwhelmingly<br />
prefers the Ga site in GaN, the main competition being<br />
with the <strong>for</strong>mation of Mg 3 N 2 , which is the solubilitylimiting<br />
phase. Note that in this discussion we focused on<br />
doping limitations related to point defects. It has also been<br />
proposed 162,163 that the <strong>for</strong>mation of extended defects, in particular<br />
pyramidal inversion domains, causes the compensation<br />
of highly Mg-doped material.<br />
Other potential sources of compensation are also illustrated<br />
in Fig. 13. The nitrogen vacancy, which had a high<br />
<strong>for</strong>mation energy in n-type GaN see Fig. 9 has a significantly<br />
lower <strong>for</strong>mation energy in p-type material, and could<br />
potentially act as a compensating center. However, we also<br />
note that hydrogen, when present, has a <strong>for</strong>mation energy<br />
much lower than that of the nitrogen vacancy. In growth<br />
situations where hydrogen is present such as MOCVD or<br />
HVPE Mg-doped material will preferentially be compensated<br />
by hydrogen, and compensation by nitrogen vacancies<br />
will be suppressed. 164 The role of hydrogen in p-type doping<br />
is discussed below, in Sec. IV C 2.<br />
Figures 5 and 13 show that V N exhibits a 3/ transition<br />
around 0.6 eV see Sec. III B, associated with a large<br />
lattice relaxation in the 3 charge state. Compensation by<br />
V N may there<strong>for</strong>e be responsible <strong>for</strong> the persistent photoconductivity<br />
effects that have been observed in Mg-doped<br />
material. 165–167 The nitrogen vacancy also may give rise to<br />
the blue lines around 2.9 eV commonly observed by photoluminescence<br />
in Mg-doped GaN. 93,167<br />
However, the microscopic origin of the blue luminescence<br />
and the source of compensation are still controversial.<br />
Lee and Chang 168 proposed a variant of the vacancy model,<br />
involving a complex of a Mg interstitial and a nitrogen vacancy,<br />
and Reboredo and Pantelides 169 proposed various<br />
substitutional-interstitial complexes that can bind hydrogen.<br />
2. Alternative acceptors<br />
For Mg, we concluded that achievable doping levels are<br />
mainly limited by the solubility of Mg in GaN. Several<br />
groups have investigated other candidate acceptors in GaN,<br />
and evaluated them in terms of solubility, shallow versus<br />
deep character, and potential compensation due to incorporation<br />
on other sites. 11,64,150,155,156,158,170,171 The impurities<br />
studied include Li, Na, K, Be, Zn, Ca, Cd, and C. The study<br />
of Ref. 11 showed that the incorporation of an acceptor on<br />
the substitutional site is governed by the atomic radius,<br />
which determines the energy cost of relaxation, and by the<br />
bond strength, which can be estimated using the enthalpy of<br />
<strong>for</strong>mation of specific compounds. For instance, when Mg is<br />
placed on a Ga site, it is surrounded by four N atoms, much<br />
like it would be in Mg 3 N 2 , which has an enthalpy of <strong>for</strong>mation<br />
of 4.80 eV Ref. 172. For Be, the comparable number<br />
would be the enthalpy of <strong>for</strong>mation of Be 3 N 2 , which is<br />
6.11 eV. This would indicate that Be Ga is more strongly<br />
bound and should have a lower <strong>for</strong>mation energy than Mg Ga ;<br />
however, this is countered by the fact that the atomic size of<br />
Be is much smaller than that of Mg which is more closely<br />
matched to Ga, leading to a large energy cost due to strain.<br />
The final result is that the <strong>for</strong>mation energy of Be is only<br />
slightly lower than that of Ga. 11<br />
Calculated ionization energies are listed in Table I, and<br />
calculated <strong>for</strong>mation energies of neutral acceptors are summarized<br />
in Table II. The various studies have shown that<br />
none of the investigated impurities per<strong>for</strong>ms better than Mg<br />
in all respects. Only Be has a comparable solubility, and it<br />
may have a lower ionization energy. However, Be may suffer<br />
from compensation due to incorporation on interstitial sites.<br />
Only Be has emerged as a viable acceptor, exhibiting<br />
higher solubility and lower ionization energy than Mg. The<br />
possibility that silicon could incorporate on the nitrogen site<br />
and act as a shallow acceptor has sometimes been considered;<br />
however, the <strong>for</strong>mation energy of Si N is so high 129,150<br />
due to the size mismatch discussed in Sec. IV A 2 that its<br />
<strong>for</strong>mation is highly unlikely.<br />
The ionization energy <strong>for</strong> Be reported in Fig. 13 is 170<br />
meV. 64 This value is slightly lower than the value previously<br />
calculated value <strong>for</strong> Mg. 164 We emphasize that the error bar<br />
on these values which we estimate to be at least 100 meV<br />
does not allow drawing firm conclusions about the magnitude<br />
of the ionization energy. Still, the similarity of the values<br />
<strong>for</strong> Be and Mg is in line with the expectation that the<br />
ionization energy <strong>for</strong> these shallow acceptors is largely determined<br />
by intrinsic properties of the semiconductor, such<br />
as effective masses and dielectric constants. Indeed, predictions<br />
from effective mass theory 147,151 <strong>for</strong> ionization energies<br />
of substitutional acceptors in wurtzite GaN produce values<br />
<strong>for</strong> Be between 185 and 233 meV–only slightly lower than<br />
the calculated value <strong>for</strong> Mg. Bernardini et al. 171 reported a<br />
Downloaded 26 Apr 2004 to 13.1.101.37. Redistribution subject to AIP license or copyright, see http://jap.aip.org/jap/copyright.jsp
3874 J. Appl. Phys., Vol. 95, No. 8, 15 April 2004 Appl. Phys. Rev.: C. G. Van de Walle and J. Neugebauer<br />
TABLE II. Formation energies of neutral substitutional acceptors in GaN, in<br />
eV, calculated by DFT-LDA.<br />
Acceptor E f Ga-rich E f N-rich Reference<br />
Li Ga 3.14 11<br />
4.5 146<br />
Be Ga 1.51 64<br />
2.29 150<br />
C N 2.62 4.4 155<br />
3.0 3.9 75<br />
2.67 3.95 156<br />
1.1 2.8 129<br />
4.24 150<br />
2.6 4.4 62<br />
Mg Ga 2.39 11<br />
1.40 150<br />
1.0 0.6 62<br />
Ca Ga 3.74 11<br />
2.15 150<br />
Zn Ga 2.86 11<br />
1.21 150<br />
2.4 0.5 62<br />
Cd Ga 1.60 150<br />
much smaller value 60 meV <strong>for</strong> the Be ionization energy.<br />
The most likely explanation <strong>for</strong> this discrepancy is that Bernardini<br />
et al. did not include the correction term E corr , discussed<br />
in Sec. II D 3. This correction lowers the <strong>for</strong>mation<br />
energy of the neutral charge state, and hence increases the<br />
ionization energy. Neglect of the correction would thus result<br />
in artificially low acceptor ionization energies.<br />
While the properties of substitutional Be Ga render it attractive<br />
as a shallow acceptor, the <strong>calculations</strong> have also<br />
shown that incorporation of Be on interstitial sites, where it<br />
acts as a donor, may lead to self-compensation. 11,64 In order<br />
to assess the extent of this problem, and avenues <strong>for</strong> overcoming<br />
it, the diffusivity of interstitial Be was investigated in<br />
detail in Ref. 64, using the technique of total energy surfaces<br />
outlined in Sec. II G. A large anisotropy in the diffusion was<br />
found, with a migration barrier in planes perpendicular to the<br />
c axis of 1.2 eV, while the barrier <strong>for</strong> motion along the c-axis<br />
is 2.9 eV. Complexes between interstitial Be and substitutional<br />
Be (Be int –Be Ga ) were also investigated and found to<br />
have a binding energy of 1.35 eV. 64 Northrup 29 has suggested<br />
that the problem of compensation by Be interstitials may be<br />
overcome by controlling Be incorporation at the surface, in<br />
particular in the presence of indium.<br />
Although Be doping of GaN has been reported by various<br />
groups, no conclusive results regarding its doping efficiency<br />
have been obtained. The experimental situation was<br />
discussed in Ref. 64.<br />
Lithium has also been studied as a potential<br />
acceptor, 11,146 but the calculated ionization energy is not as<br />
low as that of Be, and Li also suffers from compensation by<br />
self-interstitials. The migration barriers were investigated in<br />
Ref. 146: the results were 1.42 eV <strong>for</strong> motion in planes perpendicular<br />
to the c axis, and 1.55 eV <strong>for</strong> motion along the<br />
c-axis. The anisotropy is thus much smaller than in the case<br />
of Be.<br />
3. Compensation<br />
It may seem obvious that, when acceptor doping is per<strong>for</strong>med,<br />
the incorporation of unintentional donor-type impurities<br />
should be carefully controlled, since they may cause<br />
compensation. As mentioned in Sec. I C 5, such control can<br />
be a bit tricky. Consider, <strong>for</strong> instance a donor species which<br />
is known to be present as a contaminant in the growth environment,<br />
either introduced through the host-atom sources or<br />
emanating from the walls of a chamber. To a good approximation,<br />
the chemical potential of this species will there<strong>for</strong>e<br />
be roughly constant, <strong>for</strong> the specific temperature and pressure<br />
corresponding to the growth conditions. Equation 2<br />
shows that the <strong>for</strong>mation energy of the donor species then<br />
depends only on the Fermi level. As can be seen in Fig. 9,<br />
the <strong>for</strong>mation energy decreases when the Fermi level moves<br />
towards the valence band. The donor species will there<strong>for</strong>e<br />
have a much higher tendency to incorporate in p-type material<br />
than in n-type.<br />
It would there<strong>for</strong>e be dangerous to base an assessment of<br />
contaminants <strong>for</strong> instance through SIMS studies solely on<br />
data <strong>for</strong> n-type material. An unintentional donor that shows<br />
up in fairly low concentrations in n-type material may indeed<br />
have a much lower <strong>for</strong>mation energy, and hence a higher<br />
concentration, in p-type material.<br />
C. Hydrogen<br />
Hydrogen has strong effects on the properties of GaN.<br />
Many growth techniques, such as metal-organic chemical vapor<br />
deposition MOCVD or hydride vapor phase epitaxy<br />
HVPE expose the growing material to large concentrations<br />
of hydrogen. The presence of hydrogen has particularly important<br />
consequences <strong>for</strong> p-type doping of the material: Hydrogen<br />
incorporated during growth leads to passivation of<br />
acceptors, and a post-growth processing step is required to<br />
render the acceptors electrically active.<br />
A detailed overview of theoretical work on the role of<br />
hydrogen in GaN has been given in a recent review paper. 173<br />
We there<strong>for</strong>e refrain from providing a comprehensive discussion<br />
here. Instead, we merely briefly review the most important<br />
aspects of hydrogen’s behavior, and cite some more recent<br />
work that was not included in Ref. 173.<br />
1. Isolated interstitial hydrogen<br />
Isolated interstitial hydrogen behaves as an amphoteric<br />
impurity in GaN. 76,144,164,174–176 Figure 14 illustrates the<br />
atomic configurations, 176 while Fig. 15 shows the calculated<br />
<strong>for</strong>mation energy of hydrogen in various charge states as a<br />
function of Fermi level. The <strong>for</strong>mation energy is defined as<br />
the energy difference between hydrogen at an interstitial position<br />
in GaN, and hydrogen in a reservoir in this case free<br />
H 2 molecules at T0 K). 76 The values in Fig. 15 are obtained<br />
from 96-atom supercell <strong>calculations</strong> <strong>for</strong> wurtzite GaN<br />
using the nlcc, 80 but the values are quite close to the 32-atom<br />
zinc-blende supercell results of Ref. 76. Error bars are discussed<br />
in Sec. II I. One immediate conclusion from Fig. 15 is<br />
that the <strong>for</strong>mation energy of hydrogen is lower in p-type<br />
GaN than in n-type GaN, corresponding to a much higher<br />
solubility in p-type than in n-type GaN.<br />
Downloaded 26 Apr 2004 to 13.1.101.37. Redistribution subject to AIP license or copyright, see http://jap.aip.org/jap/copyright.jsp
J. Appl. Phys., Vol. 95, No. 8, 15 April 2004 Appl. Phys. Rev.: C. G. Van de Walle and J. Neugebauer<br />
3875<br />
favored; higher Fermi-level positions favor H . The neutral<br />
charge state is never stable, characteristic of a so-called<br />
negative-U center.<br />
FIG. 14. Configurations of hydrogen in wurtzite GaN obtained from<br />
density-functional theory. The projection is orthographic, allowing lattice<br />
relaxations to be discerned. H resides at the bond center, while H 0 and H <br />
are located at the center of the hexagonal channel. The H 2 molecule also<br />
resides at the center of the channel, oriented along the c axis. From Ref.<br />
176.<br />
Myers et al. 176,177 used first-<strong>principles</strong> <strong>for</strong>mation energies<br />
<strong>for</strong> H in various configurations to predict solubilities in<br />
p-type, intrinsic, and n-type material, and compared the results<br />
with experimental observations. They found good<br />
agreement, provided the hydrogen <strong>for</strong>mation energies were<br />
adjusted by 0.22 eV.<br />
In p-type GaN, H behaves as a donor (H ); it thus<br />
compensates acceptors. The preferred locations <strong>for</strong> H are at<br />
the antibonding site behind a nitrogen atom, or at the bondcenter<br />
site; in either case H is strongly bonded to the nitrogen<br />
atom. The diffusion barrier <strong>for</strong> H is only 0.7 eV, which<br />
indicates a high diffusivity at moderate to high temperatures.<br />
In n-type GaN, H behaves as an acceptor (H ); its most<br />
stable site is at the antibonding site behind a Ga atom. The<br />
migration barrier <strong>for</strong> H is high, corresponding to a very low<br />
diffusivity. For Fermi-level positions below 2.1 eV H is<br />
FIG. 15. Formation energies as a function of Fermi level <strong>for</strong> H ,H 0 , and<br />
H solid lines, and <strong>for</strong> a H 2 molecule dashed line in GaN. E F 0 corresponds<br />
to the top of the valence band. The <strong>for</strong>mation energy is referenced<br />
to the free H 2 molecules.<br />
2. Acceptor-hydrogen complexes<br />
The behavior of isolated interstitial hydrogen, as discussed<br />
in Sec. IV C 1 above, provides crucial in<strong>for</strong>mation<br />
about interaction with impurities. Since both the solubility<br />
and the diffusivity of hydrogen in n-type GaN are low,<br />
hydrogen-donor complexes will rarely <strong>for</strong>m, and we focus on<br />
complexes with acceptors.<br />
In p-type GaN hydrogen occurs in the positive charge<br />
state and is electrostatically attracted to negatively charged<br />
acceptors. In the case of Mg acceptors, H sits in an antibonding<br />
position behind a N atom which is a neighbor of the<br />
acceptor, with a binding energy of 0.7 eV. 76,164,176 In the case<br />
of Be acceptors, the H atom favors a bond-center site in the<br />
Be-H complex, with a binding energy of 1.8 eV. 64,171<br />
The hydrogen atom is strongly bonded to a nitrogen<br />
atom in these acceptor-hydrogen complexes; as a consequence<br />
the vibrational frequency of the complex is representative<br />
of a N–H bond. The calculated vibrational frequency<br />
is 3360 cm 1 Ref. 76 or 3284 cm 1 Ref. 176 in the harmonic<br />
approximation, or 3045 cm 1 if anharmonic effects<br />
are taken into account. 80 These values agree well with the<br />
experimental number of 3125 cm 1 , measured by Fouriertrans<strong>for</strong>m<br />
infrared absorption spectroscopy. 178–180 Alternative<br />
structures of the Mg–H complex have been investigated<br />
by Fall et al. 181 and Limpijumnong et al. 79<br />
Figure 15 compares the <strong>for</strong>mation energy of hydrogen in<br />
p-GaN with that of the nitrogen vacancy. In the absence of<br />
hydrogen, nitrogen vacancies are the dominant compensating<br />
centers, and due to charge neutrality the Fermi level will be<br />
<br />
located near the point where the <strong>for</strong>mation energies of V N<br />
and Mg <br />
Ga are equal. When hydrogen is present, however,<br />
compensation by nitrogen vacancies is suppressed. The Mg<br />
concentration is also increased, compared to the hydrogenfree<br />
case. This can be understood by inspection of the <strong>for</strong>mation<br />
energies in Fig. 15: since the <strong>for</strong>mation energy of<br />
hydrogen is lower than that of V N , the Fermi level equilibration<br />
point is moved higher in the gap, leading to a lower<br />
<strong>for</strong>mation energy and hence higher concentration of Mg. Incorporation<br />
of hydrogen is there<strong>for</strong>e beneficial in two respects:<br />
suppression of native defects, and enhancement of the<br />
acceptor concentration. Incorporation of hydrogen of course<br />
has the downside that complete compensation of the acceptors<br />
occurs, hence the need <strong>for</strong> a post-growth anneal to activate<br />
Mg-doped MOCVD-grown GaN. 8,182 The activation can<br />
also be achieved by low-energy electron beam irradiation; 7<br />
this process has recently been investigated in more detail,<br />
experimentally as well as theoretically. 183<br />
Since H acts as a donor in p-type GaN, the improvement<br />
in p-type doping is actually an example of successful codoping;<br />
we return to this issue in Sec. IV D.<br />
3. Interactions of hydrogen with native defects<br />
Interactions of hydrogen with native point defects in<br />
GaN have been studied in Refs. 167, 184 and 185. Since<br />
Downloaded 26 Apr 2004 to 13.1.101.37. Redistribution subject to AIP license or copyright, see http://jap.aip.org/jap/copyright.jsp
3876 J. Appl. Phys., Vol. 95, No. 8, 15 April 2004 Appl. Phys. Rev.: C. G. Van de Walle and J. Neugebauer<br />
antisites and self-interstitials are unlikely to <strong>for</strong>m in GaN<br />
see Sec. III we focus on H interacting with vacancies. This<br />
interaction is often described in terms of tying off dangling<br />
bonds. This picture does not apply in the case of the nitrogen<br />
vacancy, which is surrounded by Ga atoms at a distance of<br />
1.95 Å from the center of the vacancy; a typical Ga–H bond<br />
distance is too large <strong>for</strong> more than one H to fit inside the<br />
vacancy. The calculated binding energy of the (V N H) 2<br />
complex, expressed with respect to interstitial H in the positive<br />
charge state, is 1.56 eV. 167<br />
In the case of the gallium vacancy (V Ga ) one, two, three,<br />
or four H atoms can be accommodated in the vacancy, and<br />
levels are removed from the band gap as more hydrogens are<br />
attached. 167,184 Distinct N–H bonds are <strong>for</strong>med, with stretch<br />
frequencies between 3100 and 3200 cm 1 . Hydrogenated<br />
gallium vacancies with one or two H atoms behave in much<br />
the same way as the unhydrogenated kind; they may there<strong>for</strong>e<br />
contribute to compensation of donors as well as to the<br />
yellow luminescence see Sec. III C.<br />
4. Hydrogen in AlN and InN<br />
The behavior of hydrogen in AlN is very similar to<br />
GaN: 144 H dominates in p-type, H in n-type. Due to the<br />
larger band gap of AlN, the solubility of H could be significantly<br />
larger than in GaN under both p-type and n-type conditions.<br />
Calculations <strong>for</strong> H in InN, however, revealed a true<br />
surprise: 144 hydrogen in InN behaves exclusively as a donor.<br />
I.e., it is not amphoteric as in GaN and AlN, but actually<br />
contributes to the n-type conductivity of the material. This<br />
donor behavior is due to the fact that H 0 and H are always<br />
higher in energy than H , making H the only stable charge<br />
state <strong>for</strong> all positions of the Fermi level. This theoretical<br />
prediction has been confirmed by experimental studies on<br />
MBE-grown samples 186 as well as by investigations of muonium,<br />
a pseudoisotope of hydrogen. 187<br />
D. Codoping<br />
The concept of ‘‘codoping’’ involves the incorporation<br />
of donors along with acceptors when p-type doping is attempted.<br />
Codoping has been proposed as an effective way of<br />
increasing hole concentrations in p-type GaN. Experimentally,<br />
codoping with oxygen has been reported to result in<br />
high hole conductivities in the case of berylliumoxygen<br />
188,189 or magnesium-oxygen 190,191 codoping. Yamamoto<br />
and Katayama-Yoshida 192 have proposed that complexes<br />
consisting of two acceptors and one donor e.g., Mg–<br />
O–Mg would be effective in enhancing the doping<br />
efficiency, and would provide an explanation <strong>for</strong> the experimental<br />
observations. Yamamoto and Katayama-Yoshida 192<br />
per<strong>for</strong>med first-<strong>principles</strong> <strong>calculations</strong>, but their arguments<br />
were based mainly on trends in the electrostatic Madelung<br />
energy. Several first-<strong>principles</strong> studies have now been per<strong>for</strong>med<br />
that investigate these proposed complexes in more<br />
detail.<br />
Be–O–Be complexes in GaN were investigated in Ref.<br />
64. The <strong>for</strong>mation energy of these complexes is not lower<br />
than that of the isolated acceptors at least if equilibrium<br />
with the proper solubility-limiting phases is taken into account.<br />
Formation of acceptor-oxygen complexes which are<br />
electrically neutral is energetically quite favorable, but attaching<br />
a second acceptor impurity to such a complex is only<br />
marginally favored. Finally, the ionization energy of Be–<br />
O–Be was not lower than that of isolated acceptors within<br />
the error bars of the <strong>calculations</strong>. We also note that similar<br />
acceptor-donor-acceptor complexes were investigated by<br />
Zhang et al. in CdTe, 193 and also found neither to increase<br />
the solubility of the acceptor nor improve the shallowness of<br />
the acceptor level. We there<strong>for</strong>e doubt that <strong>for</strong>mation of Be–<br />
O–Be or Mg–O–Mg complexes is a viable approach to increasing<br />
p-type doping of GaN, or provides an explanation<br />
<strong>for</strong> the experimentally observed p-type conductivity 188–191 in<br />
codoped samples. We cannot exclude the possibility, of<br />
course, that the presence of the donor in the growth environment<br />
somehow improves the properties of the p-type layer in<br />
some other fashion, <strong>for</strong> instance by acting as a surfactant.<br />
The main problem with codoping is that the donors that<br />
are incorporated alongside acceptors during the growth cannot<br />
be removed from the acceptor-doped layer after the<br />
growth. For the layer to be p-type, an excess of acceptors<br />
still needs to be present, hence the idea of having two acceptors<br />
<strong>for</strong> every donor. However, the proposed acceptor–<br />
donor–acceptor complexes do not seem to per<strong>for</strong>m as promised.<br />
Going back to the notion of incorporating donors along<br />
with acceptors, such compensation during the growth is in<br />
fact quite desirable. Indeed, it shifts the Fermi level away<br />
from the valence-band edge toward the middle of the gap.<br />
This results in a lowering of the <strong>for</strong>mation energy of acceptors<br />
and hence in an increase of the acceptor solubility, as<br />
well as an increase in the <strong>for</strong>mation energy of compensating<br />
donor-type native defects. However, the compensation by the<br />
intentionally introduced donor will persist after growth, and<br />
the material will not exhibit p-type conductivity.<br />
This problem could be overcome if the donor could be<br />
removed from the p-type layer after growth. This is obviously<br />
not possible with oxygen. It requires that the donor<br />
impurity is not too strongly bound and exhibits a sufficiently<br />
high diffusivity, so that the donors can be removed from the<br />
vicinity of the acceptors during an anneal at modest temperatures<br />
to avoid <strong>for</strong>mation of other compensating defects.<br />
These criteria are fulfilled in the case of hydrogen, as described<br />
in Sec. IV C 2. The concept of codoping thus works<br />
successfully with hydrogen as the codopant.<br />
V. CONCLUSIONS<br />
In the first part of this article, we reviewed the state of<br />
the art in computational approaches <strong>for</strong> calculating defects<br />
and impurities in semiconductors from first <strong>principles</strong>. The<br />
methodology is entirely general and can be applied to any<br />
material. In the second part of the article, we focused on<br />
applications <strong>for</strong> nitride semiconductors. <strong>First</strong>-<strong>principles</strong><br />
theory has played an important role in interpreting and guiding<br />
experiments in this rapidly developing field; in fact, in a<br />
number of areas theory has led experiment, <strong>for</strong> instance in<br />
the prediction of the behavior of hydrogen and its interactions<br />
with acceptor impurities.<br />
Downloaded 26 Apr 2004 to 13.1.101.37. Redistribution subject to AIP license or copyright, see http://jap.aip.org/jap/copyright.jsp
J. Appl. Phys., Vol. 95, No. 8, 15 April 2004 Appl. Phys. Rev.: C. G. Van de Walle and J. Neugebauer<br />
3877<br />
Looking toward the future, we can be confident that<br />
first-<strong>principles</strong> computations will continue to play an important<br />
role in addressing defects and impurities, not only in the<br />
nitrides but also in other semiconductors, including materials<br />
such as ZnO Ref. 194 or transparent p-type conductors<br />
such as SrCu 2 O 2 . 195 New developments in methodology<br />
could make the approach even more powerful. As mentioned<br />
in Sec. II B 3, the band-gap problem inherent in densityfunctional<br />
<strong>calculations</strong> limits the accuracy in some cases, and<br />
solving this problem should be an important goal. Other developments<br />
may render the exploration of migration paths or<br />
of potential configurations <strong>for</strong> low-symmetry configurations<br />
less cumbersome. The latter capability would make it easier<br />
to study complexes between point defects and impurities, an<br />
area that has been only superficially explored so far.<br />
We will also see increased attention being paid to interactions<br />
between point defects or impurities and extended defects.<br />
Finally, as mentioned in Sec. II A 3, interactions between<br />
point defects or impurities need to be explored in<br />
greater detail. Just like point defects in the bulk play an<br />
important role in diffusion, point defects at surfaces are<br />
likely to affect atomic mobilities at surfaces, and hence play<br />
a decisive role in growth. Likewise, a full understanding of<br />
impurity incorporation requires comprehensive <strong>calculations</strong><br />
of the behavior of impurities at and near the surface. Such<br />
first-<strong>principles</strong> <strong>calculations</strong> can then <strong>for</strong>m the foundation <strong>for</strong><br />
realistic simulations of the actual growth process.<br />
ACKNOWLEDGMENTS<br />
This work was supported in part by the Office of Naval<br />
Research, Contract No. N00014-02-C-0433, by the Air Force<br />
Office of Scientific Research, Contract No. F4920-00-C-<br />
0019, and by the Deutsche Forschungsgemeinschaft. The authors<br />
benefited from collaborations and discussions with W.<br />
Götz, N. M. Johnson, M. Kneissl, S. Limpijumnong, M. D.<br />
McCluskey, J. E. Northrup, L. Romano, and C. Stampfl.<br />
C.VdW. is grateful to the Fritz-Haber-Institut, Berlin, <strong>for</strong> its<br />
hospitality, and to the Alexander von Humboldt Foundation<br />
<strong>for</strong> a US Senior Scientist Award.<br />
1 W. E. Pickett, Comput. Phys. Rep. 9, 1151989.<br />
2 M. C. Payne, M. P. Teter, D. C. Allan, T. A. Arias, and J. D. Joannopoulos,<br />
Rev. Mod. Phys. 64, 10451992.<br />
3 M. Bockstedte, A. Kley, J. Neugebauer, and M. Scheffler, Comput. Phys.<br />
Commun. 107, 1871997.<br />
4 I. Vurgaftman and J. R. Meyer, J. Appl. Phys. 94, 3675 2003.<br />
5 A. G. Bhuiyan, A. Hashimoto, and A. Yamamoto, J. Appl. Phys. 94, 2779<br />
2003.<br />
6 S. K. Estreicher and D. E. Boucher, in GaN and Related Materials, edited<br />
by S. J. Pearton Gordon and Breach, New York, 1997, pp. 171–199.<br />
7 H. Amano, M. Kito, K. Hiramatsu, and I. Akasaki, Jpn. J. Appl. Phys., Part<br />
2 28, L2112 1989.<br />
8 S. Nakamura, N. Iwasa, M. Senoh, and T. Mukai, Jpn. J. Appl. Phys., Part<br />
1 31, 12581992.<br />
9 C. G. Van de Walle, D. B. Laks, G. F. Neumark, and S. T. Pantelides,<br />
Phys. Rev. B 47, 9425 1993.<br />
10 J. Neugebauer and C. G. Van de Walle, Mater. Res. Soc. Symp. Proc. 395,<br />
645 1996.<br />
11 J. Neugebauer and Chris G. Van de Walle, J. Appl. Phys. 85, 3003 1999.<br />
12 P. Mooney, in Deep Centers in Semiconductors, edited by S. T. Pantelides<br />
Gordon and Breach, New York, 1992, p. 643.<br />
13 D. J. Chadi and K. J. Chang, Phys. Rev. Lett. 61, 873 1988.<br />
14 C. G. Van de Walle, Phys. Rev. B 57, R2033 1998.<br />
15 M. D. McCluskey, N. M. Johnson, Chris G. Van de Walle, D. P. Bour, M.<br />
Kneissl, and W. Walukiewicz, Phys. Rev. Lett. 80, 4008 1998.<br />
16 D. B. Laks, C. G. Van de Walle, G. F. Neumark, P. E. Blöchl, and S. T.<br />
Pantelides, Phys. Rev. B 45, 10 965 1992.<br />
17 J. Neugebauer and Chris G. Van de Walle, Phys. Rev. B 50, 8067 1994.<br />
18 G. A. Baraff and M. Schlüter, Phys. Rev. B 28, 2296 1983.<br />
19 Y. Bar-Yam and J. D. Joannopoulos, Phys. Rev. Lett. 52, 1129 1984.<br />
20 R. Car, P. J. Kelly, A. Oshiyama, and S. T. Pantelides, Phys. Rev. Lett. 54,<br />
360 1985.<br />
21 S. B. Zhang and J. E. Northrup, Phys. Rev. Lett. 67, 2339 1991.<br />
22 D. B. Laks, C. G. Van de Walle, G. F. Neumark, and S. T. Pantelides,<br />
Phys. Rev. Lett. 66, 648 1991.<br />
23 J. E. Northrup and S. B. Zhang, Phys. Rev. B 47, 6791 1993.<br />
24 S. Limpijumnong and C. G. Van de Walle, Phys. Rev. B 69, 035207<br />
2004.<br />
25 J. Tersoff, Phys. Rev. Lett. 74, 5080 1995.<br />
26 G. Schwarz, A. Kley, J. Neugebauer, and M. Scheffler, Phys. Rev. B 58,<br />
1392 1998.<br />
27 C. Bungaro, K. Rapcewicz, and J. Bernholc, Phys. Rev. B 59, 9771<br />
1999.<br />
28 T. Zywietz, J. Neugebauer, and M. Scheffler, Appl. Phys. Lett. 74, 1695<br />
1999.<br />
29 J. E. Northrup, Appl. Phys. Lett. 78, 2855 2001.<br />
30 A. L. Rosa, J. Neugebauer, J. E. Northrup, C.-D. Lee, and R. M. Feenstra,<br />
Appl. Phys. Lett. 80, 20082002.<br />
31 C. G. Van de Walle and J. Neugebauer, Phys. Rev. Lett. 88, 066 103<br />
2002.<br />
32 D. W. Jenkins and J. D. Dow, Phys. Rev. B 39, 3317 1989.<br />
33 D. W. Jenkins, J. D. Dow, and M. H. Tsai, J. Appl. Phys. 72, 4130 1992.<br />
34 M. Elstner, D. Porezag, G. Jungnickel, J. Elsner, M. Haugk, T. Frauenheim,<br />
S. Suhai, and G. Seifert, Phys. Rev. B 58, 7260 1998.<br />
35 P. Hohenberg and W. Kohn, Phys. Rev. 136, B864 1964; W. Kohn and L.<br />
J. Sham, ibid. 140, A1133 1965.<br />
36 V. Fiorentini, M. Methfessel, and M. Scheffler, Phys. Rev. B 47, 13353<br />
1993.<br />
37 K. Karch, F. Bechstedt, and T. Pletl, Phys. Rev. B 56, 3560 1997.<br />
38 J. Neugebauer and Chris G. Van de Walle, Mater. Res. Soc. Symp. Proc.<br />
339, 687 1994.<br />
39 S. G. Louie, S. Froyen, and M. L. Cohen, Phys. Rev. B 26, 17381982.<br />
40 N. Troullier and J. L. Martins, Phys. Rev. B 43, 1993 1991.<br />
41 M. Fuchs, J. L. F. Da Silva, C. Stampfl, J. Neugebauer, and M. Scheffler,<br />
Phys. Rev. B 65, 245 212 2002.<br />
42 T. Kotani and M. van Schilfgaarde, Solid State Commun. 121, 4612002.<br />
43 C. Stampfl and C. G. Van de Walle, Phys. Rev. B 59, 5521 1999.<br />
44 C. Stampfl and C. G. Van de Walle, Phys. Rev. B 65, 155212 2002.<br />
45 J. P. Perdew and M. Levy, Phys. Rev. Lett. 51, 18841983.<br />
46 L. J. Sham and M. Schlüter, Phys. Rev. Lett. 51, 1888 1983.<br />
47 M. S. Hybertsen and S. G. Louie, Phys. Rev. B 34, 5390 1986.<br />
48 A. Rubio, J. L. Corkill, M. L. Cohen, E. L. Shirley, and S. G. Louie, Phys.<br />
Rev. B 48, 118101993.<br />
49 M. Palummo, L. Reining, R. W. Godby, C. M. Bertoni, and N. Börnsen,<br />
Europhys. Lett. 26, 607 1994.<br />
50 D. Vogel, P. Krüger, and J. Pollmann, Phys. Rev. B 55, 12836 1997.<br />
51 C. Stampfl, C. G. Van de Walle, D. Vogel, P. Krüger, and J. Pollmann,<br />
Phys. Rev. B 61, R7846 2000.<br />
52 V. Yu. Davydov, A. A. Klochikhin, R. P. Seisyan, V. V. Emtsev, S. V.<br />
Ivanov, F. Bechstedt, J. Furthmller, H. Harima, A. V. Mudryi, J. Aderhold,<br />
O. Semchinova, and J. Graul, Phys. Status Solidi B 229, R12002.<br />
53 J. Wu, W. Walukiewicz, K. M. Yu, J. W. Ager III, E. E. Haller, H. Lu, W.<br />
J. Schaff, Y. Saito, and Y. Nanishi, Appl. Phys. Lett. 80, 3967 2002.<br />
54 W.-K. Leung, R. J. Needs, G. Rajagopal, S. Itoh, and S. Ihara, Phys. Rev.<br />
Lett. 83, 2351 1999.<br />
55 M. Städele, M Moukara, J. A. Majewski, P. Vogl, and A. Görling, Phys.<br />
Rev. B 59, 10 031 1999.<br />
56 R. P. Messmer and G. D. Watkins, in Radiation Damage and Defects in<br />
Semiconductors Institute of Physics and Physical Society, London, 1972,<br />
No. 16, p. 255.<br />
57 S. G. Louie, M. Schluter, and J. R. Chelikowsky, Phys. Rev. B 13, 1654<br />
1976.<br />
58 W. E. Pickett, M. L. Cohen, and C. Kittel, Phys. Rev. B 20, 5050 1979.<br />
59 C. G. Van de Walle, P. J. H. Denteneer, Y. Bar-Yam, and S. T. Pantelides,<br />
Phys. Rev. B 39, 107911989.<br />
60 R. Car, P. J. Kelly, A. Oshiyama, and S. T. Pantelides, Phys. Rev. Lett. 52,<br />
1814 1984.<br />
Downloaded 26 Apr 2004 to 13.1.101.37. Redistribution subject to AIP license or copyright, see http://jap.aip.org/jap/copyright.jsp
3878 J. Appl. Phys., Vol. 95, No. 8, 15 April 2004 Appl. Phys. Rev.: C. G. Van de Walle and J. Neugebauer<br />
61 I. Gorczyca, A. Svane, and N. E. Christensen, Solid State Commun. 101,<br />
747 1997.<br />
62 I. Gorczyca, A. Svane, and N. E. Christensen, Phys. Rev. B 60, 8147<br />
1999.<br />
63 S. Öğüt and J. R. Chelikowsky, Phys. Rev. Lett. 83, 3852 1999.<br />
64 C. G. Van de Walle, S. Limpijumnong, and J. Neugebauer, Phys. Rev. B<br />
63, 245205 2001.<br />
65 H. J. Monkhorst and J. D. Pack, Phys. Rev. B 13, 5188 1976.<br />
66 G. Schwarz, Ph.D. Thesis, Technical University, Berlin, 2002.<br />
67 F. A. Kröger, The Chemistry of Imperfect Crystals North Holland, Amsterdam,<br />
1964.<br />
68 A. Franciosi and C. G. Van de Walle, Surf. Sci. Rep. 25, 1–140 1996.<br />
69 G. Makov and M. C. Payne, Phys. Rev. B 51, 4014 1995.<br />
70 G. Schwarz and J. Neugebauer unpublished.<br />
71 A similar correction was also taken into account in Ref. 11; however, there<br />
the correction was applied to the negative charge state, rather than the<br />
neutral charge state. This accounts <strong>for</strong> some of the differences between the<br />
results presented in Ref. 11 and in the present review.<br />
72 E. J. Tarsa, B. Heying, X. H. Wu, P. Fini, S. P. DenBaars, and J. S. Speck,<br />
J. Appl. Phys. 82, 54721997.<br />
73 O. Brandt, R. Muralidharan, P. Waltereit, A. Thamm, A. Trampert, H. von<br />
Kiedrowski, and K. H. Ploog, Appl. Phys. Lett. 75, 4019 1999.<br />
74 CRC Handbook of Chemistry and Physics, 73rd Ed., edited by David R.<br />
Lide CRC Press, Boca Raton, 1992, p.5–18.<br />
75 J. Neugebauer and C. G. Van de Walle, in Festkörperprobleme/Advances<br />
in Solid State Physics, Vol. 35, edited by R. Helbig Vieweg,<br />
Braunschweig/Wiesbaden, 1996, p.25.<br />
76 J. Neugebauer and C. G. Van de Walle, Phys. Rev. Lett. 75, 44521995.<br />
77 C. G. Van de Walle and P. E. Blöchl, Phys. Rev. B 47, 4244 1993.<br />
78 C. G. Van de Walle, Phys. Rev. Lett. 80, 2177 1998.<br />
79 S. Limpijumnong, J. E. Northrup, and C. G. Van de Walle, Phys. Rev. Lett.<br />
87, 205 505 2001.<br />
80 S. Limpijumnong, J. E. Northrup, and C. G. Van de Walle, Phys. Rev. B<br />
68, 075206 2003.<br />
81 P. Bogusławski, E. L. Briggs, and J. Bernholc, Phys. Rev. B 51, 17 255<br />
1995.<br />
82 J. Neugebauer and C. G. Van de Walle, Appl. Phys. Lett. 69, 503 1996.<br />
83 T. Mattila, A. P. Seitsonen, and R. M. Nieminen, Phys. Rev. B 54, 1474<br />
1996.<br />
84 T. Mattila and R. M. Nieminen, Phys. Rev. B 55, 9571 1997.<br />
85 D. C. Look, D. C. Reynolds, J. W. Hemsky, J. R. Sizelove, R. L. Jones,<br />
and R. J. Molnar, Phys. Rev. Lett. 79, 22731997.<br />
86 H. P. Maruska and J. J. Tietjen, Appl. Phys. Lett. 15, 327 1969.<br />
87 M. Ilegems and H. C. Montgomery, J. Phys. Chem. Solids 34, 885 1973.<br />
88 J. Neugebauer and C. G. Van de Walle, in Proceedings of the 22nd International<br />
Conference on the Physics of Semiconductors, edited by D. J.<br />
Lockwood World Scientific, Singapore, 1995, p. 2327.<br />
89 W. Seifert, R. Franzheld, E. Butter, H. Sobotta, and V. Riede, Cryst. Res.<br />
Technol. 18, 383 1983.<br />
90 B.-C. Chung and M. Gershenzon, J. Appl. Phys. 72, 6511992.<br />
91 J. E. Northrup and S. B. Zhang, Phys. Rev. B 50, 4962 1994.<br />
92 A. Garcia and J. E. Northrup, Phys. Rev. Lett. 74, 1131 1995.<br />
93 C. H. Park and D. J. Chadi, Phys. Rev. B 55, 12995 1997.<br />
94 G.-C. Yi and B. W. Wessels, Appl. Phys. Lett. 69, 3028 1996.<br />
95 T. Ogino and M. Aoki, Jpn. J. Appl. Phys. 19, 2395 1980.<br />
96 T. Suski, P. Perlin, H. Teisseyre, M. Leszczyński, I. Grzegory, J. Jun, M.<br />
Boćkowski, and S. Porowski, Appl. Phys. Lett. 67, 2188 1995.<br />
97 X. Zhang, P. Kung, A. Saxler, D. Walker, T. Wang, and M. Razeghi, Acta<br />
Phys. Pol. A 88, 6011995.<br />
98 J. Oila, V. Ranki, J. Kivioja, K. Saarinen, P. Hautojärvi, J. Likonen, J. M.<br />
Baranowski, K. Pakula, T. Suski, M. Leszczynski, and I. Grzegory, Phys.<br />
Rev. B 63, 045205 2001.<br />
99 D. M. Hofmann, D. Kovalev, G. Steude, B. K. Meyer, A. Hoffmann, L.<br />
Eckey, R. Heitz, T. Detchprom, H. Amano, and I. Akasaki, Phys. Rev. B<br />
52, 167021995.<br />
100 W. Götz, J. Walker, L. T. Romano, and N. M. Johnson, Mater. Res. Soc.<br />
Symp. Proc. 449, 525 1997.<br />
101 G. Popovici, W. Kim, A. Botchkarev, H. Tang, H. Morkoç, and J. Solomon,<br />
Appl. Phys. Lett. 71, 3385 1997.<br />
102 M. A. Reshchikov, H. Morkoç, S. S. Park, and K. Y. Lee, Appl. Phys.<br />
Lett. 78, 30412001.<br />
103 K. Saarinen, T. Laine, S. Kuisma, J. Nissilä, P. Hautojärvi, L. Dobrzynski,<br />
J. M. Baranowski, K. Pakula, R. Stepniewski, M. Wojdak, A. Wysmolek,<br />
T. Suski, M. Leszczynski, I. Grzegory, and S. Porowski, Phys. Rev. Lett.<br />
79, 3030 1997.<br />
104 K. Saarinen, P. Seppälä, J. Oila, P. Hautojärvi, C. Corbel, O. Briot, and R.<br />
L. Aulombard, Appl. Phys. Lett. 73, 3253 1998.<br />
105 X. Zhang, P. Kung, D. Walker, A. Saxler, and M. Razeghi, in Gallium<br />
Nitride and Related Materials, edited by R. D. Dupuis, F. A. Ponce, J. A.<br />
Edmond, and S. Nakamura MRS Symposia Proceedings, Pittsburgh,<br />
1996, Vol. 395, p. 625.<br />
106 W. Götz, N. Johnson, J. Walker, D. P. Bour, H. Amano, and I. Akasaki, in<br />
Proceedings of the 6th International Conference on SiC and Related Materials,<br />
Kyoto, Japan, Sept. 18–21, 1995, edited by S. Nakashima, H.<br />
Matsunami, S. Yoshida, and H. Harima, Inst. Phys. Conf. Ser. No 142<br />
IOP Publishing, Bristol, 1996, p. 1031.<br />
107 W. Kim, A. Salvador, A. E. Botchkarev, O. Aktas, S. N. Mohammad, and<br />
H. Morkoç, Appl. Phys. Lett. 69, 559 1996.<br />
108 N. Kaneda, T. Detchprohm, K. Hiramatsu, and N. Sawaki, Jpn. J. Appl.<br />
Phys., Part 2 35, L468 1996.<br />
109 E. F. Schubert, I. D. Goepfert, and J. M. Redwing, Appl. Phys. Lett. 71,<br />
3224 1997.<br />
110 I.-H. Lee, I.-H. Choi, C. R. Lee, and S. K. Noh, Appl. Phys. Lett. 71,<br />
1359 1997.<br />
111 E. J. Tarsa, B. Heying, X. H. Wu, P. Fini, S. P. DenBaars, and J. S. Speck,<br />
J. Appl. Phys. 82, 5472 1997.<br />
112 F. J. Sánchez, D. Basak, M. A. Sánchez-García, E. Calleja, E. Muñoz, I.<br />
Izpura, F. Calle, J. M. G. Tijero, B. Beaumont, P. Lorenzini, P. Gibart, T.<br />
S. Cheng, C. T. Fozon, and J. W. Orton, MRS Internet J. Nitride Semicond.<br />
Res. 1, 71996.<br />
113 E. Calleja, F. J. Sánchez, D. Basak, M. A. Sánchez-García, E. Muñoz, I.<br />
Izpura, F. Calle, J. M. G. Tijero, B. Beaumont, P. Lorenzini, and P. Gibart,<br />
Phys. Rev. B 55, 4689 1997.<br />
114 Point Defects in Crystals, edited by R. K. Watts Wiley, New York,<br />
1977, p. 248ff.<br />
115 P. J. Dean, Phys. Status Solidi A 81, 625 1984.<br />
116 Q. Zhou, M. O. Manasreh, M. Pophristic, S. Guo, and I. T. Ferguson,<br />
Appl. Phys. Lett. 79, 2901 2001.<br />
117 Q. Zhou and M. O. Manasreh, Appl. Phys. Lett. 80, 2072 2002.<br />
118 K. H. Chow, G. D. Watkins, A. Usui, and M. Mizuta, Phys. Rev. Lett. 85,<br />
2761 2000.<br />
119 R. W. G. Wyckoff, Crystal Structures Interscience Publishers, New York,<br />
1963, Vol. 1.<br />
120 D. J. Chadi, Appl. Phys. Lett. 71, 2970 1997.<br />
121 C. G. Van de Walle, J. E. Northrup, and J. Neugebauer, in Proceedings of<br />
the 4th Symposium on Non-Stoichiometric III-V Compounds, Asilomar,<br />
CA, October 2–4, 2002, edited by P. Specht, T. R. Weather<strong>for</strong>d, P. Kiesel,<br />
T. Marek, and S. Malzer, Friedrich-Alexander-Universität, Erlangen,<br />
Germany, 2002, p.11.<br />
122 J. C. Rojo, L. J. Schowalter, R. Gaska, M. Shur, M. A. Khan, J. Yang, and<br />
D. D. Koleske, J. Cryst. Growth 240, 508 2002.<br />
123 P. Bogusławski and J. Bernholc, Phys. Rev. B 59, 156719959.<br />
124 A. Fara, F. Bernardini, and V. Fiorentini, J. Appl. Phys. 85, 2001 1999.<br />
125 C. Stampfl and C. G. Van de Walle, Appl. Phys. Lett. 72, 4591998.<br />
126 T. L. Tansley and C. P. Foley, J. Appl. Phys. 60, 2092 1986.<br />
127 M. Sato, Jpn. J. Appl. Phys., Part 2 36, L658 1997.<br />
128 T. Mattila and R. M. Nieminen, Phys. Rev. B 54, 16 676 1996.<br />
129 P. Bogusławski and J. Bernholc, Phys. Rev. B 56, 94961997.<br />
130 W. Götz, N. M. Johnson, C. Chen, H. Liu, C. Kuo, and W. Imler, Appl.<br />
Phys. Lett. 68, 31141996<br />
131 P. Perlin, T. Suski, H. Teisseyre, M. Leszczyński, I. Grzegory, J. Jun, S.<br />
Porowski, P. Boguslawski, J. Bernholc, J. C. Chervin, A. Polian, and T.<br />
D. Moustakas, Phys. Rev. Lett. 75, 296 1995.<br />
132 C. Wetzel, T. Suski, J. W. Ager III, W. Walukiewicz, S. Fisher, B. K.<br />
Meyer, I. Grzegory, and S. Porowski, Proceedings ICPS-23 World Scientific,<br />
Singapore, 1996, p. 2929.<br />
133 P. Perlin, T. Suski, A. Polian, J. C. Chervin, W. Knap, J. Camassel, I.<br />
Grzegory, S. Porowski, and J. W. Erickson, Mater. Res. Soc. Symp. Proc.<br />
449, 519 1997.<br />
134 C. Wetzel, W. Walukiewicz, E. E. Haller, J. W. Ager III, I. Grzegory, S.<br />
Porowski, and T. Suski, Phys. Rev. B 53, 1322 1996.<br />
135 C. Wetzel, T. Suski, J. W. Ager III, E. R. Weber, E. E. Haller, S. Fischer<br />
B. K. Meyer, R. J. Molnar, and P. Perlin, Phys. Rev. Lett. 78, 3923<br />
1997.<br />
136 Y. Koide, H. Itoh, N. Sawaki, I. Akasaki, and M. Hashimoto, J. Electrochem.<br />
Soc. 133, 1956 1986.<br />
Downloaded 26 Apr 2004 to 13.1.101.37. Redistribution subject to AIP license or copyright, see http://jap.aip.org/jap/copyright.jsp
J. Appl. Phys., Vol. 95, No. 8, 15 April 2004 Appl. Phys. Rev.: C. G. Van de Walle and J. Neugebauer<br />
3879<br />
137 H. G. Lee, M. Gershenzon, and B. L. Goldenberg, J. Electron. Mater. 20,<br />
621 1991.<br />
138 C. Skierbiszewski, T. Suski, M. Leszczynski, M. Shin, M. Skowronski,<br />
M. D. Bremser, and R. F. Davis, Appl. Phys. Lett. 74, 3833 1999.<br />
139 R. Zeisel, M. W. Bayerl, S. T. B. Goennenwein, R. Dimitrov, O. Ambacher,<br />
M. S. Brandt, and M. Stutzmann, Phys. Rev. B 61, 16 283 2000.<br />
140 Y. Taniyasu, M. Kasu, and N. Kobayahsi, Appl. Phys. Lett. 81, 1255<br />
2002.<br />
141 X. Zhang, P. Kung, A. Saxler, D. Walker, T. C. Wang, and M. Razeghi,<br />
Appl. Phys. Lett. 67, 1745 1995.<br />
142 D. P. Bour, H. F. Chung, W. Gtz, L. Romano, B. S. Krusor, D. Hofstetter,<br />
S. Rudaz, C. P. Kuo, F. A Ponce, N. M. Johnson, M. G. Cra<strong>for</strong>d, and R.<br />
D. Bringans, Mater. Res. Soc. Symp. Proc. 449, 509 1997.<br />
143 L. T. Romano, M. Kneissl, J. E. Northrup, C. G. Van de Walle, and D. W.<br />
Treat, Appl. Phys. Lett. 79, 2734 2001.<br />
144 S. Limpijumnong and Chris G. Van de Walle, Phys. Status Solidi B 228,<br />
303 2001.<br />
145 W. Götz, R. S. Kern, C. H. Chen, H. Liu, D. A. Steigerwald, and R. M.<br />
Fletcher, Mater. Sci. Eng. B 59, 2111999.<br />
146 F. Bernardini and V. Fiorentini, Phys. Rev. B 61, 12 598 2000.<br />
147 F. Mireles and S. E. Ulloa, Phys. Rev. B 58, 3879 1998.<br />
148 F. J. Sánchez, F. Calle, M. A. Sánchez-García, E. Calleja, E. Muñoz, C.<br />
H. Molloy, D. J. Somer<strong>for</strong>d, J. J. Serrano, and J. M. Blanco, Semicond.<br />
Sci. Technol. 13, 11301998.<br />
149 D. J. Dewsnip, A. V. Andrianov, I. Harrison, J. W. Orton, D. E. Lacklison,<br />
G. B. Ren, S. E. Hooper, T. S. Cheng, and C. T. Foxon, Semicond. Sci.<br />
Technol. 13, 5001998.<br />
150 V. Fiorentini, F. Bernardini, A. Bosin, and D. Vanderbilt, in Proceedings<br />
of the 23rd International Conference on the Physics of Semiconductors,<br />
edited by M. Scheffler and R. Zimmermann World Scientific, Singapore,<br />
1996, p.2877.<br />
151 H. Wang and A.-B. Chen, Phys. Rev. B 63, 125 212 2001.<br />
152 C. Ronning, E. P. Carlson, D. B. Thomson, and R. F. Davis, Appl. Phys.<br />
Lett. 73, 16221998.<br />
153 T. S. Cheng, S. E. Hooper, L. C. Jenkins, C. T. Foxon, D. E. Lacklison, J.<br />
D. Dewsnip, and J. W. Orton, J. Cryst. Growth 166, 5971996.<br />
154 A. Salvador, W. Kim, Ö. Aktas, A. Botchkarev, Z. Fan, and H. Morkoç,<br />
Appl. Phys. Lett. 69, 2692 1996.<br />
155 A. F. Wright, J. Appl. Phys. 92, 2575 2002.<br />
156 L. E. Ramos, J. Furthmüller, L. M. R. Scolfaro, J. R. Leite, and F. Bechstedt,<br />
Phys. Rev. B 66, 075 209 2002.<br />
157 D. J. As, U. Köhler, and K. Lishka, Mater. Res. Soc. Symp. Proc. 693,<br />
I2.3.1 2002.<br />
158 P. Bogusławski, E. L. Briggs, and J. Bernholc, Appl. Phys. Lett. 69, 233<br />
1996.<br />
159 S. Fischer, C. Wetzel, E. E. Haller, and B. K. Meyer, Appl. Phys. Lett. 67,<br />
1298 1995.<br />
160 B. Monemar, H. P. Gislason, and O. Lagerstedt, J. Appl. Phys. 51, 640<br />
1980.<br />
161 M. Ilegems, R. Dingle, and R. A. Logan, J. Appl. Phys. 43, 37971972.<br />
162 M. Leroux, P. Vennéguès, S. Dalmasso, M. Benaissa, E. Feltin, P. de<br />
Mierry, B. Beaumont, B. Damilano, N. Grandjean, and P. Gibart, Phys.<br />
Status Solidi A 192, 3942002.<br />
163 P. Vennéguès, M. Benaissa, S. Dalmasso, M. Leroux, E. Feltin, P. De<br />
Mierry, B. Beaumont, B. Damilano, N. Grandjean, and P. Gibart, Mater.<br />
Sci. Eng. B 93, 2242002.<br />
164 J. Neugebauer and C. G. Van de Walle, Appl. Phys. Lett. 68, 1829 1996.<br />
165 C. Johnson, J. Y. Lin, H. X. Jiang, M. A. Khan, and C. J. Sun, Appl. Phys.<br />
Lett. 68, 18081996.<br />
166 J. Z. Li, J. Y. Lin, H. X. Jiang, A. Salvador, A. Botchkarev, and H.<br />
Morkoc, Appl. Phys. Lett. 69, 1474 1996.<br />
167 C. G. Van de Walle, Phys. Rev. B 56, 10 020 1997.<br />
168 S.-G. Lee and K. J. Chang, Semicond. Sci. Technol. 14, 1381999.<br />
169 F. A. Reboredo and S. T. Pantelides, Phys. Rev. Lett. 82, 18871999.<br />
170 J. Neugebauer and C. G. Van de Walle, in Proceedings of the 23rd International<br />
Conference on the Physics of Semiconductors, Berlin, 1996, edited<br />
by M. Scheffler and R. Zimmermann World Scientific Publishing<br />
Co. Pte Ltd., Singapore, 1996, p. 2849.<br />
171 F. Bernardini, V. Fiorentini, and A. Bosin, Appl. Phys. Lett. 70, 2990<br />
1997.<br />
172 Lange’s Handbook of Chemistry, 13th Ed., edited by J. A. Dean,<br />
McGraw-Hill, New York, 1985.<br />
173 J. Neugebauer and Chris G. Van de Walle, in Hydrogen in Semiconductors<br />
II, edited by N. H. Nickel, Semiconductors and Semimetals Vol. 61,<br />
Treatise editors R. K. Willardson and E. R. Weber Academic Press,<br />
Boston, 1999, p. 479.<br />
174 A. Bosin, V. Fiorentini, and D. Vanderbilt, Mater. Res. Soc. Symp. Proc.<br />
395, 503 1996.<br />
175 A. F. Wright, Phys. Rev. B 60, 5101 1999.<br />
176 S. M. Myers, A. F. Wright, G. A. Petersen, C. H. Seager, W. R. Wampler,<br />
M. H. Craw<strong>for</strong>d, and J. Han, J. Appl. Phys. 88, 4676 2000.<br />
177 S. M. Myers, A. F. Wright, G. A. Petersen, W. R. Wampler, C. H. Seager,<br />
M. H. Craw<strong>for</strong>d, and J. Han, J. Appl. Phys. 89, 3195 2001.<br />
178 W. Götz, N. M. Johnson, D. P. Bour, M. D. McCluskey, and E. E. Haller,<br />
Appl. Phys. Lett. 69, 3725 1996.<br />
179 H. Harima, T. Inoue, S. Nakashima, M. Ishida, and M. Taneya, Appl.<br />
Phys. Lett. 75, 1383 1999.<br />
180 B. Clerjaud, D. Côte, A. Lebkiri, C. Naud, J. M. Baranowski, K. Pakula,<br />
D. Wasik, and T. Suski, Phys. Rev. B 61, 8238 2000.<br />
181 C. J. Fall, R. Jones, P. R. Briddon, and S. Öberg, Mater. Sci. Eng. B 82,<br />
88 2001.<br />
182 W. Götz, N. M. Johnson, J. Walker, D. P. Bour, and R. A. Street, Appl.<br />
Phys. Lett. 68, 667 1996.<br />
183 S. M. Myers, C. H. Seager, A. F. Wright, B. L. Vaandrager, and J. S.<br />
Nelson, J. Appl. Phys. 92, 6630 2002.<br />
184 A. F. Wright, J. Appl. Phys. 90, 11642001.<br />
185 A. F. Wright, J. Appl. Phys. 90, 6526 2001.<br />
186 D. C. Look, H. Lu, W. J. Schaff, J. Jasinski, and Z. Lilienthal-Weber,<br />
Appl. Phys. Lett. 80, 258 2002.<br />
187 E. A. Davis, S. F. J. Cox, R. L. Lichti, and C. G. Van de Walle, Appl.<br />
Phys. Lett. 82, 592 2003.<br />
188 O. Brandt, H. Yang, H. Kostial, and K. H. Ploog, Appl. Phys. Lett. 69,<br />
2707 1996.<br />
189 K. H. Ploog and O. Brandt, J. Vac. Sci. Technol. A 16, 1609 1998.<br />
190 R. Y. Korotkov, J. M. Gregie, and B. W. Wessels, Appl. Phys. Lett. 78,<br />
222 2001.<br />
191 G. Kipshidze, V. Kuryatkov, B. Borisov, Yu. Kudryavtsev, R. Asomoza,<br />
S. Nikishin, and H. Temkin, Appl. Phys. Lett. 80, 2910 2002.<br />
192 T. Yamamoto and H. Katayama-Yoshida, in Proceedings of the 19th International<br />
Conference on Defects in Semiconductors, Aveiro, Portugal,<br />
1997, edited by G. Davies and M. H. Nazaré, Mat. Sci. Forum 258-263<br />
Trans Tech, Zürich, 1997, p. 1185.<br />
193 S. B. Zhang, S.-H. Wei, and Y. Yan, Physica B 302, 135 2001.<br />
194 C. G. Van de Walle, Phys. Rev. Lett. 85, 1012 2000.<br />
195 X. Nie, S.-H. Wei, and S. B. Zhang, Phys. Rev. B 65, 075 111 2002.<br />
Downloaded 26 Apr 2004 to 13.1.101.37. Redistribution subject to AIP license or copyright, see http://jap.aip.org/jap/copyright.jsp