CO2 separation using bipolar membrane electrodialysis - Parc
CO2 separation using bipolar membrane electrodialysis - Parc
CO2 separation using bipolar membrane electrodialysis - Parc

You also want an ePaper? Increase the reach of your titles
YUMPU automatically turns print PDFs into web optimized ePapers that Google loves.
View Online<br />
PAPER<br />
www.rsc.org/ees | Energy & Environmental Science<br />
CO 2 <strong>separation</strong> <strong>using</strong> <strong>bipolar</strong> <strong>membrane</strong> <strong>electrodialysis</strong><br />
Matthew D. Eisaman,* Luis Alvarado, Daniel Larner, Peng Wang, Bhaskar Garg and Karl A. Littau<br />
Received 23rd July 2010, Accepted 29th October 2010<br />
DOI: 10.1039/c0ee00303d<br />
Downloaded on 07 December 2010<br />
Published on 06 December 2010 on http://pubs.rsc.org | doi:10.1039/C0EE00303D<br />
Caustic solvents such as sodium or potassium hydroxides, converted via CO 2 capture to aqueous<br />
carbonates or bicarbonates, are a likely candidate for atmospheric CO 2 <strong>separation</strong>. We have performed<br />
a comprehensive experimental investigation of CO 2 gas regeneration from aqueous potassium<br />
carbonate and bicarbonate solutions <strong>using</strong> <strong>bipolar</strong> <strong>membrane</strong> <strong>electrodialysis</strong> (BPMED). This system<br />
allows the regeneration of pure CO 2 gas, suitable for subsequent sequestration or reaction to synthetic<br />
hydrocarbons and their products, from aqueous carbonate/bicarbonate solutions. Our results indicate<br />
that the energy consumption required to regenerate CO 2 gas from aqueous bicarbonate (carbonate)<br />
solutions <strong>using</strong> this method can be as low as 100 kJ (200 kJ) per mol of CO 2 in the small-current-density<br />
limit.<br />
Introduction<br />
As the concentration of atmospheric CO 2 continues to rise, 1 it is<br />
becoming increasingly imperative to invent efficient and costeffective<br />
technologies for controlling the atmospheric CO 2<br />
concentration. The most well-known approach to this problem is<br />
Carbon Capture and Sequestration (CCS): the <strong>separation</strong> of CO 2<br />
emissions from power-plant flue gas, followed by the pressurization<br />
and sequestration of this CO 2 in long-term storage sites,<br />
such as geological formations. 2<br />
While CCS is a promising technology that will likely be relied<br />
upon in the near-term to help control the atmospheric CO 2<br />
concentration, this approach is unable to capture emissions from<br />
mobile emitters, such as cars and planes. In the future, it will<br />
prove important to control these emissions as well, considering<br />
that in 2007 the transportation sector accounted for 31.6% of all<br />
CO 2 emitted in the United States. 3 Moreover, since combusting<br />
one gallon of motor gasoline creates 19.4 lbs of CO 2 , 4 it is not<br />
feasible to capture and store these emissions onboard. Consequently,<br />
capturing the emissions from mobile emitters will<br />
require the ability to capture CO 2 directly from the atmosphere.<br />
Palo Alto Research Center (PARC), 3333 Coyote Hill Rd, Palo Alto, CA,<br />
94304, USA. E-mail: Matt.Eisaman@parc.com; Fax: +1 650-812-4321;<br />
Tel: +1 650-812-4847<br />
Although the relatively low concentration of CO 2 in the atmosphere<br />
(about 386 ppm in 2009, rising at a rate of about 1.9 ppm<br />
per year 5 ) makes it more energetically costly to separate CO 2 from<br />
the air than from flue gas (with CO 2 concentrations of about 10%),<br />
the thermodynamic minimum energy for this <strong>separation</strong> scales as<br />
the natural logarithm of the CO 2 partial pressure, meaning that it<br />
only costs about 3.4 times more energy to separate CO 2 from air<br />
than from flue gas, even though flue gas has a CO 2 concentration<br />
that is about 260 times larger than that of air. In addition to<br />
mitigating CO 2 emissions from mobile sources, separating CO 2<br />
directly from the air has other advantages, including: eliminating<br />
the need for long-distance transport of separated CO 2 by colocating<br />
capture sites near sequestration sites; the ability to<br />
synthesize hydrocarbon liquid fuels in remote locations by <strong>using</strong><br />
available energy resources to separate CO 2 , generate H 2 , and react<br />
them to form liquid fuels; 6 the ability to synthesize liquid fuels that<br />
are carbon neutral 7–9 (<strong>using</strong> CO 2 separated from flue gas would<br />
not create a carbon-neutral fuel because the CO 2 emitted upon<br />
combustion could not be re-separated for a subsequent fuel<br />
synthesis and combustion cycle); and the ability to actually<br />
decrease the atmospheric CO 2 concentration via atmospheric<br />
<strong>separation</strong> and sequestration (flue-gas capture would only slow<br />
the increase of the atmospheric CO 2 concentration).<br />
Given the clear advantages and potentially modest energy<br />
penalty of <strong>separation</strong> directly from the atmosphere, research into<br />
Broader context<br />
Although the transportation sector accounts for over thirty percent of all CO 2 emitted in the United States, the weight of CO 2<br />
created upon combustion makes onboard capture and storage of these emissions impractical. As a result, the ability to capture CO 2<br />
directly from the atmosphere will be required in order to control CO 2 emissions from ‘‘mobile emitters’’ such as cars, buses, and<br />
planes. Aqueous hydroxides, converted via CO 2 capture to aqueous carbonates or bicarbonates, are likely capture-solvent candidates<br />
for atmospheric CO 2 <strong>separation</strong>. We present a comprehensive experimental investigation of CO 2 gas regeneration from<br />
potassium carbonate and bicarbonate solutions <strong>using</strong> <strong>bipolar</strong> <strong>membrane</strong> <strong>electrodialysis</strong>. This system allows the regeneration of pure<br />
CO 2 gas, suitable for subsequent sequestration or use, from aqueous capture solutions. We demonstrate that this system can be quite<br />
efficient, with an energy consumption as low as 100 kJ per mol of CO 2 from bicarbonate solutions. This approach represents an<br />
alternative to conventional regeneration approaches such as steam stripping, and is applicable to other capture solvents such as<br />
MEA.<br />
This journal is ª The Royal Society of Chemistry 2010<br />
Energy Environ. Sci.
View Online<br />
Downloaded on 07 December 2010<br />
Published on 06 December 2010 on http://pubs.rsc.org | doi:10.1039/C0EE00303D<br />
atmospheric CO 2 <strong>separation</strong> has gained momentum over the past<br />
decade, with many groups worldwide pursuing a variety of<br />
strategies. 10–27 Moreover, techno-economic analysis indicates<br />
that atmospheric CO 2 <strong>separation</strong> is a potentially cost-effective<br />
strategy and should be investigated at least as thoroughly as<br />
other approaches. 28,29<br />
The <strong>separation</strong> of CO 2 , whether from the atmosphere or from<br />
flue gas, generally involves two steps: capture and regeneration.<br />
In the capture step, CO 2 is usually absorbed or adsorbed, either<br />
physically or chemically, into a solid or liquid by contacting the<br />
CO 2 source (flue gas, the atmosphere, etc.) with the absorber/<br />
adsorber. In the regeneration step, CO 2 is selectively removed<br />
from the absorber/adsorber, often <strong>using</strong> some combination of<br />
thermal, chemical, or electrical means, resulting in a flow of pure<br />
CO 2 gas.<br />
Although not the only option, caustic solvents such as sodium<br />
or potassium hydroxides, converted via CO 2 capture to aqueous<br />
carbonates or bicarbonates, are a likely candidate for atmospheric<br />
CO 2 <strong>separation</strong>. 20,24 In this paper we experimentally<br />
investigate an electrochemical approach to CO 2 regeneration<br />
from potassium carbonate and bicarbonate solutions. These<br />
solutions are meant to mimic typical ‘‘capture solutions’’ that<br />
result from the capture of CO 2 gas into hydroxide solutions. The<br />
CO 2 exists in solution as negatively charged carbonate (CO 32 )or<br />
bicarbonate (HCO 3 ) anions. This solution is fed into a Bipolar<br />
Membrane Electrodialysis (BPMED) unit, which separates the<br />
carbonate/bicarbonate solution into an acid and a base by<br />
applying a voltage across an alternating stack of ion-selective<br />
anion-exchange <strong>membrane</strong>s (AEMs) and water-dissociating<br />
2<br />
<strong>bipolar</strong> <strong>membrane</strong>s (BPMs), and transporting CO 2 (via CO 3 or<br />
HCO 3 transport) into the acidic solution. The acidic solution<br />
2<br />
converts the transported CO 3 or HCO 3 into CO 2 gas, and the<br />
low solubility of total dissolved CO 2 in the acidic solution results<br />
in CO 2 gas evolution.<br />
The goal of this work was to measure and understand the<br />
performance of this system for various mixtures of KHCO 3 ,<br />
K 2 CO 3 , and KOH. These measurements were intended to<br />
identify areas with the promise for a significant improvement of<br />
the system performance.<br />
While some limited studies of CO 2 gas recovery from aqueous<br />
solutions <strong>using</strong> <strong>electrodialysis</strong> have been performed in the<br />
past, 11,30,31 the work presented in this paper represents the most<br />
detailed study of this process to date, including the investigation<br />
of a wide range of process and solution parameters.<br />
Experimental methodology<br />
Setup and equipment<br />
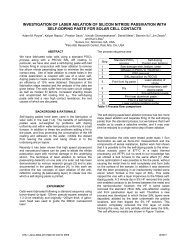
Fig. 1 shows a schematic (panel a) and labeled photograph (panel<br />
b) of the experimental setup. At the center of the schematic is the<br />
BPMED unit, which is shown in Fig. 2 and described in more<br />
detail below.<br />
As shown in Fig. 1b, the solution tanks are connected to the<br />
<strong>membrane</strong> stack via pumps (on the bottom of the pictured rack)<br />
and tubing, allowing us to flow separate solutions through the<br />
acid, base, and electrode compartments, respectively. We have<br />
outfitted the unit with an array of sensors that allow us to<br />
measure various experimental parameters. Using control software,<br />
we automatically record these measured parameters every<br />
5 seconds, and save the data to a file for later analysis. We<br />
measure and record the following parameters: voltage and<br />
current (current is kept constant <strong>using</strong> the XHR40-25<br />
programmable DC power supply from Xantrex Technology,<br />
Inc.); base and acid solution flow rate (model FP-5600, Omega<br />
Engineering, Inc.); the pressure at both the input and output to<br />
the base, acid, and electrode compartments (model PX219,<br />
Omega Engineering, Inc.); the flow rate of CO 2 gas emitted from<br />
the acid compartment (we have sealed the acid compartment to<br />
be gas-tight to ensure that all gas generated in the acid<br />
compartment flows through the CO 2 gas flow meter, model<br />
FMA1605A from Omega Engineering, Inc.); and the pH and<br />
conductivity of the acid and base solutions (pH: Thermo<br />
Fig. 1<br />
(a) Schematic of the experimental setup. BPM ¼ <strong>bipolar</strong> <strong>membrane</strong>; AEM ¼ anion exchange <strong>membrane</strong>. (b) Photo of experimental setup.<br />
Energy Environ. Sci. This journal is ª The Royal Society of Chemistry 2010
View Online<br />
Downloaded on 07 December 2010<br />
Published on 06 December 2010 on http://pubs.rsc.org | doi:10.1039/C0EE00303D<br />
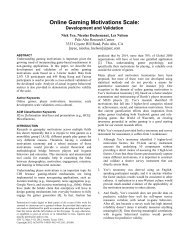
Fig. 2 (a) Picture and (b) schematic of the BPMED unit. ES ¼ electrode solution, AS ¼ acid solution, BS ¼ base solution, CEM ¼ cation exchange<br />
<strong>membrane</strong>, AEM ¼ anion exchange <strong>membrane</strong>, BPM ¼ <strong>bipolar</strong> <strong>membrane</strong>.<br />
Scientific Orion 3-Star Plus with probe 9107BNMD; conductivity:<br />
Thermo Scientific Orion 3-Star Plus with probe<br />
013005MD).<br />
Fig. 2 shows the BPMED unit in more detail. The unit is<br />
a EUR2C-7-Bip (assembled in the two-compartment configuration)<br />
purchased from Ameridia Corp. consisting of seven cells in<br />
series, each cell containing an AEM (Neosepta AHA supplied by<br />
Ameridia Corp.) in series with a BPM (Neosepta BP-1E supplied<br />
by Ameridia Corp.). At each end of the stack of seven cells is<br />
a cation exchange <strong>membrane</strong> (CEM) (Neosepta C66-10F<br />
supplied by Ameridia Corp.) separating the cells from the electrode<br />
compartment. The spaces between adjacent <strong>membrane</strong>s are<br />
filled with 762 mm thick polyethylene mesh spacers. Fig. 2b shows<br />
the configuration of the <strong>membrane</strong> stack. Each <strong>membrane</strong> has an<br />
area of 200 cm 2 , corresponding to a total AEM <strong>membrane</strong> area<br />
of 0.14 m 2 .<br />
Procedure<br />
In the experiments we describe below, the pH of the acid and base<br />
solutions is kept constant, resulting in steady-state behavior for<br />
measured quantities such as the rate of CO 2 gas evolution from<br />
the acid compartment, voltage, and energy consumption. As<br />
shown in Fig. 1a, a solution of 0.3 M KH 2 PO 4 and 15 mL of<br />
H 3 PO 4 in 2.5 L de-ionized (DI) water is loaded into the acid tank.<br />
A solution of KHCO 3 ,K 2 CO 3 , and KOH in 2.5 L DI water is<br />
loaded into the base tank—various concentrations of each of<br />
these solutes were used for different experimental runs. A solution<br />
of 2 M KOH in 2.5 L DI water is loaded into the electrode<br />
tank. All solutes were ACS reagent grade, purchased from<br />
Sigma-Aldrich.<br />
The pumps are turned on to allow volumetric flow rates of 300<br />
L h 1 and 140 L h 1 in the electrode and acid/base tanks,<br />
respectively. Each solution flows from the tank, through the<br />
<strong>membrane</strong> stack, and then returns to the tank to be pumped<br />
again through the <strong>membrane</strong> stack. The solutions are allowed to<br />
flow for 5–10 minutes until the pH and conductivity values<br />
stabilize after mixing with the small amounts of water left behind<br />
in the setup. The gas headspace of the acid tank is flushed for 5<br />
minutes with pure CO 2 to ensure accurate readings. The power<br />
supply is then connected to the <strong>membrane</strong> stack electrodes and<br />
the control software is used to set a desired constant-current<br />
value. A voltage ceiling is also entered into the control software,<br />
and the power supply finds the required voltage less than or equal<br />
to the ceiling voltage that allows the desired current to be achieved.<br />
All experiments are run at a constant current.<br />
Once the current starts to flow, ion transport begins and CO 2<br />
gas starts to flow from the acid compartment. As HCO 3 and<br />
2<br />
CO 3 ions are transported into the acid compartment and CO 2<br />
gas is released, the pH of the acid compartment generally<br />
remains constant at about 2.5. However, after 5 hours of<br />
continuous operation, the pH of the acid solution will begin<br />
to rise. If this occurs, additional H 3 PO 4 is added to the acid<br />
solution in order to keep the pH in the range 2.5–2.8. As HCO 3<br />
2<br />
and CO 3 ions are transported out of the base solution and<br />
replaced with OH ions from the dissociation of water in the<br />
<strong>bipolar</strong> <strong>membrane</strong>s, the pH of the base solution increases. In<br />
order to keep the base solution pH constant at its starting value<br />
for a given experiment, pure CO 2 gas is bubbled directly into the<br />
base solution from a pressurized tank of CO 2 gas. In this way, the<br />
acid and base solution pH values are kept constant for enough<br />
time during the experimental run to allow steady-state behavior<br />
to be achieved. In practice, during an experimental run, we<br />
continue the run until we have observed the pH, CO 2 rate, and<br />
energy consumption per mol of CO 2 to all have been constant for<br />
at least ten minutes.<br />
At the beginning of each run, the rate of CO 2 gas flowing from<br />
the acid compartment fluctuates as we tune the rate at which we<br />
bubble CO 2 gas into the base solution in order to keep the<br />
pH constant. Once the CO 2 bubbling rate has been properly<br />
tuned to match the CO 2 transport rate out of the base solution,<br />
the rate of CO 2 flow out of the acid compartment reaches<br />
This journal is ª The Royal Society of Chemistry 2010<br />
Energy Environ. Sci.
View Online<br />
Control experiments<br />
Several control experiments were performed to verify that the gas<br />
bubbling out of the acid solution was indeed CO 2 . First, a control<br />
experiment was performed <strong>using</strong> 0.5 M KOH as the base solution<br />
to confirm that no gas flows from the acid compartment in this<br />
case. In addition, an experiment with 0.5 M K 2 CO 3 base solution<br />
was performed in which the gas evolving from the acid<br />
compartment was sampled and analyzed <strong>using</strong> a gas chromatograph<br />
(Hewlett-Packard 5890 Series II). This experiment<br />
confirmed that the gas sampled from the acid compartment was<br />
indeed CO 2 .<br />
Downloaded on 07 December 2010<br />
Published on 06 December 2010 on http://pubs.rsc.org | doi:10.1039/C0EE00303D<br />
Results and discussion<br />
Constant-current experiments were performed under steady state<br />
conditions to explore the effect of varying the base-solution pH/<br />
ionic species concentrations. Experiments were performed for six<br />
different base solutions, each at seven different values of constant<br />
current (1 A, 2 A, 4 A, 8 A, 12 A, 16 A, and 20 A). An experiment<br />
was not performed at 20 A for KHCO 3 because the low rate of<br />
CO 2 capture in the base solution at this low pH combined with<br />
the high rate of CO 2 transport out of the base solution into the<br />
acid solution meant that we were not able to keep the base pH<br />
constant and achieve steady-state behavior for these conditions.<br />
All experiments were performed with an acid-solution pH in the<br />
range 2.51–2.83.<br />
Rate of CO 2 concentration<br />
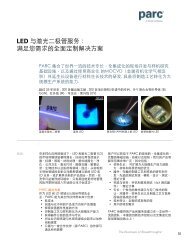
Effect of base pH. Fig. 3a shows the measured rate of CO 2 gas<br />
emitted from the acid tank as a function of current for the six<br />
different base solutions studied. The color of the data points<br />
represents the pH of the base solution. For a fixed current value,<br />
the KHCO 3 solution results in a CO 2 rate that is about twice as<br />
large as K 2 CO 3 solution for the same value of current. This<br />
behavior is expected, since CO 2 transport for KHCO 3 solution<br />
via HCO 3 requires half the charge per CO 2 as CO 2 transport for<br />
K 2 CO 3 solution via CO 32 . The CO 2 rate for mixtures of KHCO 3<br />
and K 2 CO 3 for a given current fall between the values for pure<br />
KHCO 3 and pure K 2 CO 3 . The CO 2 rates at a given current for<br />
K 2 CO 3 /KOH mixtures are much lower than for solutions<br />
without any KOH because the presence of a significant concentration<br />
of KOH allows a significant fraction of the current to be<br />
carried via OH ions.<br />
Fig. 3 Measured rate of CO 2 gas (in slpm) emitted from the acid<br />
compartment vs. current for (a) base solutions composed of various<br />
mixtures of KOH, K 2 CO 3 , and KHCO 3 , and (b) 0.125 M, 0.5 M, and 2 M<br />
K 2 CO 3 base solutions. Color represents base pH.<br />
a constant steady-state value. As discussed above, we continue<br />
the experiment until we observe that the pH, CO 2 rate, and<br />
energy consumption have all been constant for ten minutes. The<br />
data measured during the last five minutes of the ten-minute<br />
steady-state period are used to calculate the steady-state average<br />
values plotted in Fig. 3–7. The base pH never deviated more than<br />
0.05 units of pH from its mean value within this five-minute<br />
window. We have found this to be true of the base pH and acid<br />
pH for all experiments we performed.<br />
Effect of base concentration. Fig. 3b shows the measured rate<br />
of CO 2 gas emitted from the acid tank versus current for three<br />
concentrations of K 2 CO 3 base solution: 0.125 M, 0.5 M, and<br />
2 M. Color represents the pH of the base solution. Fig. 3b shows<br />
that the maximum CO 2 generation rate for a given current occurs<br />
for 0.5 M K 2 CO 3 . From Fig. 4b (discussed in the next section),<br />
we see that the maximum CO 2 rate occurs at 0.5 M because the<br />
efficiency is also maximized for 0.5 M. Since the efficiency is<br />
simply defined as the number of CO 2 molecules transported per<br />
charge transported, then for a given value of current density, the<br />
CO 2 rate and the efficiency will be maximized for the same value<br />
of concentration. The reason that the maximum in efficiency<br />
occurs at a concentration of 0.5 M is explained in the next<br />
section.<br />
Energy Environ. Sci. This journal is ª The Royal Society of Chemistry 2010
View Online<br />
Downloaded on 07 December 2010<br />
Published on 06 December 2010 on http://pubs.rsc.org | doi:10.1039/C0EE00303D<br />
Fig. 4 Efficiency vs. current for (a) base solutions composed of various<br />
mixtures of KOH, K 2 CO 3 , and KHCO 3 , and (b) 0.125 M, 0.5 M, and 2 M<br />
K 2 CO 3 base solutions. Color represents base pH.<br />
Efficiency<br />
Effect of base pH. To determine the efficiency with which<br />
charge transport results in CO 2 transport, we define efficiency as<br />
the measured number of CO 2 molecules transported per charge<br />
transported, divided by the ideal case for KHCO 3 of one CO 2<br />
molecule per electron charge. Defined in this way, the ideal<br />
efficiency for a solution of KHCO 3 (where all the charge would<br />
be carried by HCO 3 ions) is 1, while the ideal efficiency for<br />
a solution of K 2 CO 3 (where all the charge would be carried by<br />
2<br />
CO 3 ions) is 0.5. Transport of non-CO 2 transporting ions such<br />
as OH ions will reduce the efficiency from these ideal values.<br />
This journal is ª The Royal Society of Chemistry 2010<br />
Fig. 4a shows the efficiency as a function of current for the six<br />
different base solutions studied. The color of the data points<br />
represents the pH of the base solution. The efficiency is seen to<br />
approach the ideal values of 1.0 (0.5) for KHCO 3 (K 2 CO 3 ) for<br />
currents greater than 8 A. The efficiencies for solutions containing<br />
KOH are seen to be very low because the transport of<br />
OH (which does not transport any CO 2 ) is a significant<br />
contribution to the total current.<br />
The energy consumed per mol of CO 2 can be thought of as<br />
having two contributions: (1) Which ion is transporting CO 2 ? and<br />
(2) Given that CO 2 is transported by a certain ion, over what<br />
voltage must this ion be transported? The efficiency shown in<br />
Fig. 4a gives us a measure of which ions are being transported.<br />
For example, in the case of KHCO 3 for currents greater than 8 A<br />
where the efficiency is very close to one, we know that almost all<br />
the CO 2 transport must be performed by the singly charged<br />
HCO 3 .<br />
We observe in Fig. 4a that as a function of current, the efficiencies<br />
increase from low starting values at 1 A (0.3 for K 2 CO 3<br />
and 0.6 for KHCO 3 , each about 60% of their respective theoretical<br />
maxima), and asymptotically approach fairly constant<br />
values of efficiency at high currents. The efficiencies at high<br />
currents are quite close to the theoretical maxima for the various<br />
solutions: about 0.95 for KHCO 3 and about 0.45 for K 2 CO 3 ,<br />
with values in between for the mixtures of KHCO 3 and K 2 CO 3 .<br />
Much of the behavior shown in Fig. 4a can be understood in<br />
terms of the acid/alkaline <strong>membrane</strong>-state model developed by<br />
J€orissen and Simmrock. 32,33 In this model, depending on the<br />
relative concentrations of H + and OH ions in the acidic and<br />
basic solutions on either side of the AEM, the <strong>membrane</strong> is either<br />
in an ‘‘acidic state’’ or ‘‘alkaline state’’. In the case where the H +<br />
concentration in the acid solution dominates the OH concentration<br />
in the base solution, the <strong>membrane</strong> is in the acidic state<br />
throughout its entire thickness, and an acidic boundary layer<br />
develops on the side of the <strong>membrane</strong> adjacent to the base<br />
solution. Conversely, when the OH ion concentration in the<br />
base solution dominates the H + concentration in the acid solution,<br />
the <strong>membrane</strong> is in the alkaline state throughout its entire<br />
thickness, and an alkaline boundary layer develops on the side of<br />
the <strong>membrane</strong> adjacent to the acid solution.<br />
First we consider the four curves in Fig. 4a that contain no<br />
KOH. The acid solution for all experiments shown in Fig. 4 had<br />
a pH of around 2.5, corresponding to an H + concentration of<br />
about 3 10 3 M. The OH concentration in the base solution<br />
ranged from about 4.5 10 3 M for the (pH ¼ 11.66) 0.5 M<br />
K 2 CO 3 solution to 4.5 10 6 M for the (pH ¼ 8.66) 0.5 M<br />
KHCO 3 solution. This means that the AEMs are likely in the<br />
acidic state for the experiments with KHCO 3 , and mixtures of<br />
KHCO 3 /K 2 CO 3 , and just on the dividing line between acidic and<br />
alkaline for the experiments with pure K 2 CO 3 . The rapid increase<br />
in efficiency at the current is increased from 1 A to 8 A is likely<br />
due to co-ion leakage of H + ions through the AEMs. This<br />
suggests that indeed the AEMs are in the acidic state for the<br />
experiments with 0.5 M KHCO 3 , mixtures of KHCO 3 and<br />
K 2 CO 3 , and 0.5 M K 2 CO 3 , because if the AEMs were in the<br />
alkaline state, the alkaline boundary layer on the acidic side of<br />
the AEM would neutralize any H + ions before they could leak<br />
through the AEM. 32,33 The effect of H + leakage decreases with<br />
increasing current, becoming effectively negligible at currents<br />
Energy Environ. Sci.
View Online<br />
Downloaded on 07 December 2010<br />
Published on 06 December 2010 on http://pubs.rsc.org | doi:10.1039/C0EE00303D<br />
above 8 A. At low currents, the maximum possible current due to<br />
H + co-ion leakage can be a significant fraction of the total<br />
current, but as the total current increases beyond the maximum<br />
possible H + co-ion current, the H + current becomes a negligible<br />
fraction of the total current.<br />
We have performed tests to verify that the decreased efficiency<br />
at low current values is due to H + co-ion transport through the<br />
AEMs, rather than some other mechanism such as K + co-ion<br />
transport. To test for H + transport, we measured the efficiency<br />
versus current for four different acid solutions with varying pH<br />
values. Each of these solutions had a K + concentration of 0.3 M,<br />
but the pH of the solutions was varied by adding different<br />
amounts of KH 2 PO 4 ,K 2 HPO 4 , and H 3 PO 4 , producing solutions<br />
with pH values of 2.7, 3.6, 5.0, and 6.1. The base solution in all<br />
cases was 0.5 M KHCO 3 . At low current values we observe much<br />
lower efficiency for the low-pH solutions (0.4 for an acid pH of<br />
2.7 compared to 0.6 for an acid solution with pH of 6.1), while<br />
the efficiency of all solutions approaches the same asymptotic<br />
value of about 0.9 at high current values. This demonstrates the<br />
importance of H + co-ion transport in decreasing the efficiency at<br />
low current values. To test whether K + co-ion transport also<br />
affects efficiency, we measured the efficiency versus current for<br />
three different acid solutions with varying K + concentrations.<br />
Each had a pH of 5.7, but the K + concentration of the solutions<br />
was varied by adding different amounts of K 2 HPO 4 and<br />
KH 2 PO 4 , producing solutions with K + concentrations of 0.1 M,<br />
0.5 M, and 0.9 M. The base solution in all cases was 0.5 M<br />
KHCO 3 . The efficiency appears to increase only slightly with<br />
increasing K + concentration at low current values, suggesting<br />
that K + co-ion transport does not significantly contribute to the<br />
observed decrease in current efficiency at low current values.<br />
From these tests, we conclude that H + co-ion transport through<br />
the AEMs is the primary cause of low efficiencies at low current<br />
values.<br />
The asymptotic value of efficiency achieved at currents above<br />
10 A increases from about 0.5 for 0.5 M K 2 CO 3 to about 1.0 for<br />
KHCO 3 , with values in between for mixtures of KHCO 3 and<br />
2<br />
K 2 CO 3 . This is simply due to the fact that CO 3 transports one<br />
CO 2 molecule for every two charges transported, whereas<br />
HCO 3 transports one CO 2 molecule for every one charge<br />
transported. For these four curves, the maximum pH (for the<br />
case of 0.5 M K 2 CO 3 ) is only 11.55, corresponding to an OH<br />
concentration of 3.5 10 3 M. Therefore for these four solutions<br />
of KHCO 3 and K 2 CO 3 , the effect on efficiency due to OH<br />
2<br />
transport competing with HCO 3 and CO 3 transport is negligible.<br />
However, for the two curves in Fig. 4a that do contain KOH,<br />
2<br />
the ratio of OH concentration to CO 3 concentration is close to<br />
one, and the OH transport carries a significant fraction of the<br />
total current. This results in the very low efficiencies observed for<br />
these solutions.<br />
From Fig. 4a, we also see that for the two solutions containing<br />
KOH, there is no sharp decrease in efficiency at low current<br />
values as seen for the other four solutions. This can be understood<br />
<strong>using</strong> the acid/alkaline <strong>membrane</strong>-state model of J€orissen<br />
and Simmrock. 32,33 For the 0.5 M K 2 CO 3 /0.1 M KOH (0.5 M<br />
K 2 CO 3 /0.5 M KOH) solution, the pH is 13.2 (13.5), corresponding<br />
to an OH concentration of 0.16 M (0.3 M), much<br />
larger than the H + concentration in the (pH ¼ 2.5) acid solution<br />
of 3 10 3 M. Therefore, the AEMs were likely in the alkaline<br />
state for these experiments. According to the model, this means<br />
there should be an alkaline boundary layer on the side of the<br />
anion-exchange <strong>membrane</strong> adjacent to the acid solution. In this<br />
case, H + co-ion transport through the AEM does not occur<br />
because any H + is neutralized by the alkaline boundary layer<br />
before entering the AEM.<br />
We also observe that a maximum of efficiency with respect to<br />
current appears to occur for both KHCO 3 and K 2 CO 3 at around<br />
10 A for KHCO 3 and 8 A for K 2 CO 3 . These maxima are<br />
approximately 1.0 (0.5) for KHCO 3 (K 2 CO 3 ), indicating that at<br />
these current values all ion transport across the anion exchange<br />
Fig. 5 Voltage vs. current for (a) base solutions composed of various<br />
mixtures of KOH, K 2 CO 3 , and KHCO 3 , and (b) 0.125 M, 0.5 M, and 2 M<br />
K 2 CO 3 base solutions. Color represents base pH.<br />
Energy Environ. Sci. This journal is ª The Royal Society of Chemistry 2010
View Online<br />
Downloaded on 07 December 2010<br />
Published on 06 December 2010 on http://pubs.rsc.org | doi:10.1039/C0EE00303D<br />
2<br />
<strong>membrane</strong>s is carried by HCO 3 and CO 3 ions, for the KHCO 3<br />
and K 2 CO 3 solutions, respectively.<br />
For all six solutions shown in Fig. 4, we observe that as the<br />
current is increased past some optimum value (around 8 A), the<br />
efficiency decreases slightly with increasing current density.<br />
There are two likely explanations for this effect, both of which<br />
probably contribute to the observed behavior: (1) loss of permselectivity<br />
of the BPMs at high current densities due to the<br />
required high rate of water transfer through the AEM and CEM<br />
layers of the BPM, 34 and (2) increased water splitting in the<br />
AEMs with increasing current density, auto-catalyzed by the<br />
functional groups in the <strong>membrane</strong>. 35–37<br />
Effect of base concentration. Fig. 4b shows the efficiency versus<br />
current for three concentrations of K 2 CO 3 base solution: 0.125<br />
M, 0.5 M, and 2 M. Color represents the pH of the base solution.<br />
This plot shows that there is an optimum concentration of<br />
around 0.5 M K 2 CO 3 that allows an efficiency close to the<br />
maximum for K 2 CO 3 of 0.5.<br />
The pH values of the (0.125 M, 0.5 M, and 2 M) K 2 CO 3<br />
solutions shown in Fig. 5b were (11.55, 11.55, and 12.4), corresponding<br />
to OH concentrations of (3.5 10 3 M, 3.5 10 3 M,<br />
and 2.5 10 2 2<br />
M). The CO 3 concentrations of (0.125 M, 0.5<br />
M, 2 M) for these solutions correspond to concentration ratios of<br />
2<br />
CO 3 to OH of (63, 250, and 80). From Fig. 4b, we see that the<br />
efficiency at high current values can be qualitatively related to the<br />
2<br />
ratio of CO 3 to OH ions—the efficiency is close to the theoretical<br />
maximum of 0.5 for 0.5 M K 2 CO 3 (CO 3 to OH ratio of<br />
2<br />
2<br />
250), decreases to 0.4–0.45 for 2 M (CO 3 to OH ratio of 80),<br />
2<br />
and decreases further for 0.125 M (CO 3 to OH ratio of 63).<br />
2<br />
The actual fraction of current carried by CO 3 compared to that<br />
carried by OH as a function of their concentration ratio in the<br />
base solution will depend on many factors, including their relative<br />
transport numbers in the specific AEM used in our system.<br />
As was described above in the discussion of Fig. 4a, the sharp<br />
decrease in current efficiency at low current values seen in Fig. 4b<br />
is due to the large fractional contribution of H + co-ion transport<br />
to the total current.<br />
Voltage<br />
Effect of base pH. Fig. 5a shows the other contribution to the<br />
energy consumption—the measured voltage drop over the entire<br />
<strong>electrodialysis</strong> unit. As expected, due to resistive losses (for<br />
example in the electrodes, in each <strong>membrane</strong>, in the base and acid<br />
solutions, etc.) the voltage increases with current for all six base<br />
solutions studied. We also see that the slope of the voltage versus<br />
current is different for each of the six base solutions studied,<br />
implying that each of these solutions has a different effective<br />
resistance to current flow. While some of this difference is<br />
certainly due to the different behavior of the different transport<br />
ions, some of this effect may be due to the different amount of<br />
CO 2 gas bubbles in the stack due to different rates of CO 2<br />
evolution for each of the six base solutions. For example, at<br />
a given current, we have seen from Fig. 3a that the CO 2 generation<br />
rate differs for the various base solutions. For a given<br />
current, KHCO 3 yields the highest rate (the transport of only one<br />
charge is required to transport each CO 2 molecule, compared to<br />
two charges per CO 2 molecule for K 2 CO 3 ), while the solutions<br />
This journal is ª The Royal Society of Chemistry 2010<br />
with KOH yield the lowest rate because a significant fraction of<br />
the current is carried by non-CO 2 transporting OH ions. This<br />
likely results in a greater number of gas bubbles trapped in the<br />
<strong>membrane</strong> stack for solutions that yield higher CO 2 rates at<br />
a given current. The greater number of gas bubbles results in<br />
a higher resistance by reducing the effective area of the<br />
<strong>membrane</strong>s, resulting in a larger voltage for a given current. This<br />
is exactly what we observe in Fig. 5a. The order of solutions from<br />
highest voltage (0.5 M KHCO 3 ) to lowest voltage (0.5 M K 2 CO 3 /<br />
0.5 M KOH) is the same as the order of solutions in Fig. 3a from<br />
highest to lowest CO 2 generation rate at a given current.<br />
Recent experiments in our lab have demonstrated (to our<br />
knowledge for the first time) <strong>electrodialysis</strong> at elevated pressures<br />
as high as 10 atm. By pressurizing the <strong>membrane</strong> stack to 10 atm,<br />
the CO 2 is kept in solution until the pressure is released downstream<br />
of the <strong>membrane</strong> stack in the acid solution tank. This<br />
eliminates the increased resistance due to the bubbles in the<br />
<strong>membrane</strong> stack, thus decreasing the voltage and energy for<br />
a given current density. At large current densities (139 mA cm 2 ),<br />
we have observed a 30% reduction in the energy per mol of CO 2<br />
at 10 atm relative to the energy required at 1.5 atm. These results<br />
will be presented in greater detail in a forthcoming article.<br />
Effect of base concentration. Fig. 5b shows voltage versus<br />
current for three concentrations of K 2 CO 3 base solution (0.125<br />
M, 0.5 M, and 2 M). This plot shows that within the concentration<br />
range studied, at a fixed current the voltage decreases<br />
monotonically with increasing K 2 CO 3 concentration. This<br />
effect is primarily due to the increasing conductivity of the<br />
base solution with increasing K 2 CO 3 concentration. In our<br />
seven-cell <strong>membrane</strong> stack, the space between the <strong>membrane</strong>s<br />
through which the acid and base solutions flow is each 762 mm<br />
thick. The geometry of the <strong>membrane</strong> stack means that there<br />
are seven spaces through which acid solution flows, and eight<br />
through which base solution flows (see Fig. 2b). Using the<br />
distance between the <strong>membrane</strong>s (762 mm), the 200 cm 2 active<br />
area of the <strong>membrane</strong>s, the acid and base solution conductivity<br />
data, and the applied current, we have calculated the voltage<br />
attributable only to the seven acid-solution spaces and eight<br />
base-solution spaces between the <strong>membrane</strong>s. The conductivity<br />
of the acid solution was measured to be the same for all three<br />
experiments testing different base solution concentrations<br />
(0.125 M, 0.5 M, and 2 M K 2 CO 3 ), with an average value<br />
of about 20 mS cm 1 . The average conductivity of the base<br />
solution for a K 2 CO 3 concentration of (0.125 M, 0.5 M, 2 M)<br />
was measured to be about (27 mS cm 1 ,78mScm 1 , and 203 mS<br />
cm 1 ). For different K 2 CO 3 concentrations, we compared<br />
the difference in voltage attributable only to the varying basesolution<br />
conductivity to the difference in total voltage, and<br />
calculated the fraction of total voltage difference that is attributable<br />
to the changing base conductivity. We observe that for<br />
each of the three possible comparisons (0.125 M to 0.5 M, 0.125<br />
M to 2 M, and 0.5 M to 2 M) about 50–80% of the total voltage<br />
difference is attributable to the difference in base conductivity.<br />
The remainder of the observed differences in total voltage for the<br />
three solutions is likely due the different conductivity values<br />
2<br />
within the anion-exchange <strong>membrane</strong>s due to the different CO 3<br />
2<br />
concentrations, and different ratios of CO 3 to OH in the three<br />
solutions.<br />
Energy Environ. Sci.
View Online<br />
Downloaded on 07 December 2010<br />
Published on 06 December 2010 on http://pubs.rsc.org | doi:10.1039/C0EE00303D<br />
Energy consumption<br />
Effect of base pH. The energy expended per mol of CO 2<br />
generated is calculated by dividing the energy per second (voltage<br />
times current) by the moles of CO 2 generated per second. Fig. 6a<br />
shows the energy per mol of CO 2 generated from the acid solution<br />
as a function of current for four of the six base solutions<br />
studied (those that are mixtures of K 2 CO 3 and KHCO 3 ). Results<br />
for all six solutions studied, including those containing KOH, are<br />
shown in Table 1. We observe a minimum of energy occurring<br />
not at the minimum current of 1 A, but rather at 2 A, for all six<br />
base solutions studied. This behavior results from a tradeoff<br />
Fig. 6 Energy vs. current for (a) base solutions composed of various<br />
mixtures of K 2 CO 3 and KHCO 3 , and (b) 0.125 M, 0.5 M, and 2 M<br />
K 2 CO 3 base solutions. Color represents base pH.<br />
between efficiency and voltage: the poor efficiency at very low<br />
currents (see Fig. 4) tends to increase the energy consumption as<br />
the current decreases, while the large resistive losses at high<br />
currents (see Fig. 5) tends to increase the energy consumption as<br />
the current increases.<br />
Effect of base concentration. The efficiency and voltage<br />
dependence on concentration combine to give the energy<br />
dependence shown in Fig. 6b. Here we see that the higher efficiency<br />
observed for 0.5 M K 2 CO 3 compared to 2 M K 2 CO 3<br />
outweighs the slightly higher voltages required for 0.5 M relative<br />
to 2 M, resulting in a minimum of energy consumption occurring<br />
for 0.5 M K 2 CO 3 .<br />
These measurements have important implications for the<br />
practical design of CO 2 capture units. The data in Fig. 6 and<br />
Table 1 demonstrate that in order to minimize the energy of<br />
regeneration, the capture unit should be designed to produce an<br />
approximately 0.5 M KHCO 3 solution as output. However, the<br />
rate of CO 2 capture decreases substantially as the pH of the<br />
capture solution decreases, and catalysed capture will likely be<br />
necessary for capture at these pH values. 38 As a result, in the<br />
design of a CO 2 <strong>separation</strong> system including a CO 2 capture unit<br />
and CO 2 regeneration unit, there will be a tradeoff between the<br />
energy of regeneration and the rate of CO 2 capture, which itself<br />
can affect the energy of the capture process. The data presented<br />
here can be used to inform decisions in the design process related<br />
to these tradeoffs.<br />
Contribution of end electrodes. The energies shown in Fig. 6a<br />
were calculated <strong>using</strong> the voltage values shown in Fig. 5a, which<br />
correspond to the total voltage across the entire <strong>electrodialysis</strong><br />
unit, including the contribution from the electrodes.<br />
From Fig. 2, we see that each end electrode is adjacent to<br />
a CEM, with a 2 M KOH electrode solution flowing between<br />
each electrode and the adjacent CEM. In between these end<br />
compartments is stack of seven ‘‘cells’’, each cell comprised of an<br />
adjacent series of: base solution, <strong>bipolar</strong> <strong>membrane</strong>, acid solution,<br />
and anion exchange <strong>membrane</strong>. While our lab-scale <strong>electrodialysis</strong><br />
unit only has seven cells between end electrode<br />
compartments, a commercial unit typically has over 100. For<br />
such a commercial unit, the fraction of the total voltage drop<br />
(and energy consumed) that occurs at the end electrode<br />
compartment is negligible (100). For our seven-cell lab unit, the<br />
fractional voltage drop and energy consumed at the end electrode<br />
compartments are not negligible. However, by making the<br />
measurements described below, we can determine the contribution<br />
to the total voltage and energy from the end electrode<br />
compartments, and the contribution from the cells themselves.<br />
Subtracting the contribution of the end electrode compartments<br />
from the total voltage in order to determine the voltage drop and<br />
energy consumption of the cells alone tells us what the voltage<br />
drop and energy consumption would be if we scaled our system<br />
to commercial size (>100 cells).<br />
Experiments were performed for two different base solutions:<br />
0.5 M KHCO 3 and 0.5 M K 2 CO 3 . The experimental setup and<br />
steady-state experimental procedure employed were identical to<br />
that described in previous sections. This series of experiments<br />
were repeated for an <strong>electrodialysis</strong> unit containing seven, six,<br />
Energy Environ. Sci. This journal is ª The Royal Society of Chemistry 2010
View Online<br />
Table 1 Measured energy consumption (in kJ mol 1 CO 2 ) for various base solutions. ‘‘Total’’ ¼ energy consumption across entire seven-cell stack,<br />
including electrodes; ‘‘zero cell’’ ¼ energy consumed by a system with zero cells (i.e. a system with just end electrodes and two cation exchange<br />
<strong>membrane</strong>s); ‘‘corrected’’ ¼ total energy minus zero-cell energy. There is no data for KHCO 3 at 20 A because the slow reaction rate of CO 2 gas in<br />
KHCO 3 and the high rate of HCO 3 transport out of the base solution prevented steady-state behavior from being achieved. Data for 0.5 M K 2 CO 3 and<br />
0.5 M KHCO 3 are plotted in Fig. 7.<br />
Base solution Energy 1 A 2 A 4 A 8 A 12 A 16 A 20 A<br />
Downloaded on 07 December 2010<br />
Published on 06 December 2010 on http://pubs.rsc.org | doi:10.1039/C0EE00303D<br />
0.5 M K 2 CO 3 /0.5 M KOH Total 1495.4 1062.3 1443.0 2399.4 2192.8 3272.9 4235.3<br />
0.5 M K 2 CO 3 /0.1 M KOH Total 1106.0 587.5 1283.1 1573.1 1963.4 3282.9 4714.3<br />
0.5 M K 2 CO 3 Total 296.5 231.5 256.3 342.8 462.7 535.3 603.9<br />
Zero cell 80.7 60.2 66.6 84.1 108.5 144.8 147.0<br />
Corrected 215.9 171.4 189.7 258.7 354.3 390.5 456.9<br />
0.125 M KHCO 3 /0.375 M K 2 CO 3 Total 191.4 166.0 194.8 260.7 373.4 423.0 484.0<br />
0.25 M KHCO 3 /0.25 M K 2 CO 3 Total 161.4 151.1 162.0 220.1 291.8 327.9 380.9<br />
0.5 M KHCO 3 Total 148.4 143.8 169.7 208.5 270.8 325.2<br />
Zero cell 49.2 38.7 57.0 59.1 101.3 106.4<br />
Corrected 99.2 105.1 112.7 149.4 169.6 218.8<br />
five, and four cells. Altering the unit from seven cells to six cells,<br />
for example, was accomplished by opening up the unit and<br />
removing one BPM, one AEM, and their adjacent spacers and<br />
gaskets. We cannot directly measure the voltage for fewer than<br />
four cells because of the geometry of the <strong>electrodialysis</strong> unit. For<br />
each current, a linear fit is performed to the voltages measured<br />
for seven, six, five, and four cells in order to extrapolate to the<br />
zero-cell case. The extrapolated zero-cell voltage corresponds to<br />
the voltage contribution from the end electrode compartments<br />
(end electrodes and adjacent CEMs).<br />
Table 1 and Fig. 7 compare the ‘‘corrected’’ energy calculated<br />
by subtracting off the energy consumption of the end electrodes<br />
with the total energy consumption calculated by including the<br />
electrode contribution. From Fig. 7 we see that the minimum<br />
energy (for the low-current limit of KHCO 3 ) consumed per mol<br />
of CO 2 in a commercial-scale unit (where the electrode contribution<br />
to the voltage and energy can be ignored) is about 100 kJ<br />
mol 1 CO 2 .<br />
Relevance to CO 2 <strong>separation</strong> and liquid-fuel synthesis. Separating<br />
CO 2 from a dilute source like the atmosphere typically<br />
involves two steps: capture and regeneration. We have demonstrated<br />
the possibility for CO 2 regeneration from KHCO 3 solutions<br />
for 100 kJ mol 1 CO 2 . The energy required to capture CO 2<br />
from the atmosphere into a hydroxide solution has been<br />
measured to be about 200 kJ mol 1 CO 2 , although lower energies<br />
are expected in full-scale systems. 20 This implies that <strong>using</strong><br />
BPMED for regeneration, CO 2 can be separated from the<br />
atmosphere for a total energy cost of about 300 kJ mol 1 CO 2 .To<br />
put this number into context, the thermodynamic minimum<br />
energy for separating CO 2 from the atmosphere (at a concentration<br />
of 386 ppm) is about 20 kJ mol 1 (CO 2 ); the energy for<br />
amine-based <strong>separation</strong> of CO 2 from power-plant flue gas<br />
(typically about 10% CO 2 ) is expected to be 45–65 kJ mol 1<br />
(CO 2 ) (not including the energy to pressurize CO 2 in preparation<br />
for sequestration), with improved configurations possibly<br />
reducing this energy to less than 30 kJ mol 1 (CO 2 ). 39,40<br />
A promising use of CO 2 captured directly from the air is to<br />
react it with renewably produced H 2 to synthesize carbon-neutral<br />
liquid hydrocarbon fuels. 7–9 To put the energy consumption in<br />
the context of liquid fuel synthesis, 300 kJ mol 1 CO 2 corresponds<br />
to 47% of the methanol lower heating value (LHV) of<br />
638.1 kJ mol 1 (CH 3 OH). If we assume a 40% overall conversion<br />
efficiency to go from the primary energy source (for example,<br />
solar or wind) to methanol, 300 kJ mol 1 CO 2 corresponds to<br />
19% of the total input energy required (assuming a one-to-one<br />
molar correspondence between methanol and CO 2 :3H 2 +CO 2<br />
/ CH 3 OH + H 2 O).<br />
Finally, we note that the regeneration of CO 2 <strong>using</strong> BPMED is<br />
not limited to bicarbonate/carbonate capture solutions, but can<br />
also be applied to more conventional capture solvents such as<br />
monoethanolamine. 31<br />
Fig. 7 Energy vs. current for K 2 CO 3 (squares) and KHCO 3 (circles).<br />
Filled ¼ measured, Open ¼ corrected by excluding voltage contribution<br />
of end electrodes. Energy data for all solutions studied are shown in<br />
Table 1.<br />
This journal is ª The Royal Society of Chemistry 2010<br />
Conclusions<br />
Caustic solvents such as sodium or potassium hydroxides, converted<br />
via CO 2 capture to aqueous carbonates or bicarbonates,<br />
Energy Environ. Sci.
View Online<br />
Downloaded on 07 December 2010<br />
Published on 06 December 2010 on http://pubs.rsc.org | doi:10.1039/C0EE00303D<br />
are a likely candidate for atmospheric CO 2 <strong>separation</strong>. 20,24 We<br />
have experimentally investigated an electrochemical approach<br />
to CO 2 gas regeneration from potassium carbonate and bicarbonate<br />
solutions. The CO 2 exists in solution as CO 3<br />
2<br />
or HCO 3<br />
ions. This solution is fed into a Bipolar Membrane Electrodialysis<br />
(BPMED) unit, which separates the carbonate/bicarbonate<br />
solution into an acid and a base by applying a voltage across an<br />
alternating stack of ion-selective AEMs and water-dissociating<br />
BPMs, and transporting CO 2 (via CO 3<br />
2<br />
or HCO 3 transport)<br />
into the acidic solution. The acidic solution converts the transported<br />
CO 3<br />
2<br />
or HCO 3 into CO 2 gas, and the low solubility of<br />
total dissolved CO 2 in the acidic solution results in CO 2 gas<br />
evolution.<br />
We have characterized the performance of this system on six<br />
different mixtures of KHCO 3 ,K 2 CO 3 , and KOH by measuring<br />
the CO 2 gas generation rate, efficiency, voltage, and energy<br />
consumption for a wide range of constant-current values. Our<br />
results indicate that the energy consumption required to separate<br />
CO 2 gas from aqueous bicarbonate (carbonate) solutions <strong>using</strong><br />
this method can be as low as 100 kJ (200 kJ) per mol of CO 2 in<br />
the small-current-density limit.<br />
Separating CO 2 from a dilute source like the atmosphere<br />
typically involves two steps: capture and regeneration. Our<br />
measured minimum energy of 100 kJ mol 1 CO 2 for CO 2<br />
regeneration <strong>using</strong> BPMED, and the previously measured value<br />
of 200 kJ mol 1 CO 2 for the capture of CO 2 into hydroxide<br />
solutions, 20 suggests that CO 2 can be separated from the atmosphere<br />
for a total energy cost of about 300 kJ mol 1 CO 2 . To put<br />
the measured energy consumption in the context of liquid fuel<br />
synthesis, 300 kJ mol 1 CO 2 corresponds to 19% of the total<br />
input energy required to synthesize methanol, assuming an<br />
overall conversion efficiency to go from energy to methanol<br />
of 40%, and a one-to-one molar correspondence of CO 2 to<br />
methanol.<br />
Acknowledgements<br />
We thank F. Torres, J. Paschkewitz, D. Bar, and B. Boissier for<br />
helpful discussions. This work was supported by DARPA<br />
contract NBCHC090074. The views, opinions, and/or findings<br />
contained in this article/presentation are those of the author/<br />
presenter and should not be interpreted as representing the official<br />
views or policies, either expressed or implied, of the Defense<br />
Advanced Research Projects Agency or the Department of<br />
Defense. Approved for Public Release, Distribution Unlimited.<br />
Notes and references<br />
1 IPCC, Climate Change 2007: Synthesis Report. Contribution of<br />
Working Groups I, II and III to the Fourth Assessment Report of the<br />
Intergovernmental Panel on Climate Change, ed. Core Writing<br />
Team, R. K. Pachauri and A. Reisinger,IPCC, Geneva,<br />
Switzerland, 2007, 104p.<br />
2 IPCC, Carbon Dioxide Capture and Storage, ed. B. Metz, O.<br />
Davidson, H. de Coninck, M. Loos and L. Meyer, Cambridge<br />
University Press, UK, 2005, p. 431.<br />
3 S. C. Davis, S. W. Diegel and R. G. Boundy, Transportation Energy<br />
Data Book: Edition 28, 2009, ORNL-6984 (Edition 28 of ORNL-<br />
5198), Table 11.4.<br />
4 EPA, Average Carbon Dioxide Emissions Resulting from Gasoline and<br />
Diesel Fuel, 2005, EPA420-F-05-001.<br />
5 Dr Pieter Tans, NOAA/ESRL, www.esrl.noaa.gov/gmd/ ccgg/trends.<br />
6 K. Ushikoshi, et al., Appl. Organomet. Chem., 2000, 14, 819–825.<br />
7 F. Zeman and D. W. Keith, Philos. Trans. R. Soc., A, 2008, 366, 3901–<br />
3918.<br />
8 G. A. Olah, A. Goeppert and G. K. S. Prakash, J. Org. Chem., 2009,<br />
74, 487–498.<br />
9 Z. Jiang, T. Xiao, V. L. Kuznetsov and P. P. Edwards, Philos. Trans.<br />
R. Soc., A, 2010, 368, 3343–3364.<br />
10 S. Stucki, A. Schuler and M. Constantinescu, Int. J. Hydrogen Energy,<br />
1995, 20, 653–663.<br />
11 A. Bandi, M. Specht, T. Weimer and K. Schaber, Energy Convers.<br />
Manage., 1995, 36, 899–902.<br />
12 T. Weimer, K. Schaber, M. Specht and A. Bandi, Energy Convers.<br />
Manage., 1996, 37, 1351–1356.<br />
13 S. Elliott, et al., Geophys. Res. Lett., 2001, 28, 1235–1238.<br />
14 K. Lackner, P. Grimes, and H.-J. Ziock, Proc. of the First National<br />
Conference on Carbon Sequestration, Capturing Carbon Dioxide<br />
from Air, http://www.netl.doe.gov/publications/proceedings/01/<br />
carbon_seq/7b1.pdf.<br />
15 A. B. Wright and K. S. Lackner, inventors; 2006 March 9, Removal of<br />
Carbon Dioxide from Air, US patent application publication 2006/<br />
0051274.<br />
16 V. Nikulshina, D. Hirsch, M. Mazzotti and A. Steinfeld, Energy,<br />
2006, 31, 1379–1389.<br />
17 V. Nikulshina, M. E. Galvez and A. Steinfeld, Chem. Eng. J., 2007,<br />
129, 75–83.<br />
18 F. Zeman, Environ. Sci. Technol., 2007, 41, 7558–7563.<br />
19 F. Zeman, AIChE J., 2008, 54, 1396–1399.<br />
20 J. K. Stolaroff, D. W. Keith and G. Lowry, Environ. Sci. Technol.,<br />
2008, 42, 2728–2735.<br />
21 V. Nikulshina, N. Ayesa, M. E. Galvez and A. Steinfeld, Chem. Eng.<br />
J., 2008, 140, 62–70.<br />
22 K. A. Littau and F. E. Torres, inventors; 2010 March 11, System and<br />
method for recovery of CO 2 by aqueous carbonate flue gas capture<br />
and high efficiency <strong>bipolar</strong> <strong>membrane</strong> <strong>electrodialysis</strong>, US patent<br />
application publication 2010/0059377.<br />
23 M. D. Eisaman, D. E. Schwartz, S. Amic, D. Larner, J. Zesch,<br />
K. Littau, Technical Proceedings of the 2009 Clean technology<br />
Conference and Trade show, 2009, pp. 175–178.<br />
24 M. Mahmoudkhani, K. R. Heidel, J. C. Ferreira, D. W. Keith and<br />
R. S. Cherry, Energy Procedia, 2009, 1, 1535–1542.<br />
25 M. Mahmoudkhani and D. W. Keith, Int. J. Greenhouse Gas Control,<br />
2009, 3, 376–384.<br />
26 V. Nikulshina, C. Gebald and A. Steinfeld, Chem. Eng. J., 2009, 146,<br />
244–248.<br />
27 V. Nikulshina and A. Steinfeld, Chem. Eng. J., 2009, 155, 867–873.<br />
28 D. A. Keith, M. Ha-Duong and J. K. Stolaroff, Clim. Change, 2005,<br />
74, 17–45.<br />
29 R. A. Pielke, Jr, Environ. Sci. Policy, 2009, 12, 216.<br />
30 H. Nagasawa, et al., Carbon Dioxide Recovery from Carbonate<br />
Solutions by an Electrodialysis Method, Proceedings of the Sixth<br />
Annual Conference on Carbon Capture and Sequestration, May 07,<br />
2007.<br />
31 V. I. Zabolotskii, et al., J. Appl. Chem., 1985, 58, 2222–2225.<br />
32 J. J€orissen and K. H. Simmrock, J. Appl. Electrochem., 1991, 21, 869–<br />
876.<br />
33 M. Paleologou, et al., Sep. Purif. Technol., 1997, 11, 159–171.<br />
34 R. El Moussaoui, et al., J. Membr. Sci., 1994, 90, 283–292.<br />
35 Ion Exchange Membranes: Fundamentals and Applications, ed. Y.<br />
Tanaka, Elsevier, San Francisco, 2007.<br />
36 Y. Tanaka, J. Membr. Sci., 2007, 303, 234–243.<br />
37 Y. Tanaka, J. Membr. Sci., 2010, 350, 347–360.<br />
38 G. M. Bond, et al., Energy Fuels, 2001, 15, 309–316.<br />
39 G. T. Rochelle, Science, 2009, 325, 1652–1654.<br />
40 B. Oyenekan, Thesis, The University of Texas at Austin, 2007.<br />
Energy Environ. Sci. This journal is ª The Royal Society of Chemistry 2010