4 C C CQ C) C Q
4 C C CQ C) C Q
4 C C CQ C) C Q

You also want an ePaper? Increase the reach of your titles
YUMPU automatically turns print PDFs into web optimized ePapers that Google loves.
c.) ...<br />
I<br />
C<br />
L)<br />
C<br />
C<br />
Q<br />
C)<br />
E<br />
—<br />
I<br />
—<br />
-<br />
.—<br />
rJ)<br />
C<br />
4 C<br />
—.<br />
C<br />
C Z c)<br />
Q
_____________<br />
2. Determine whether the following situations would yield a normal distribution. JustifSi<br />
your answer.<br />
a. The results of throwing a die 1000 times<br />
b. The lengths of randomly selected white pine needles<br />
c. The number of people standing in line at five cash registers<br />
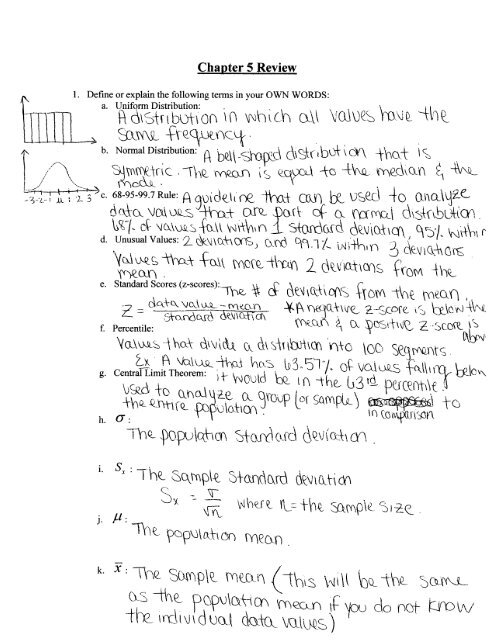
3. Sketch a normal curve with a mean of 52 and a standard deviation of 8. Label the x<br />
axis at one, two, and three standard deviations from the mean.<br />
4. The area under the curve of a normal distribution should equal<br />
5. When can the 68-95-99.7 Rule be used? And what is it used for?<br />
6. Use the 68-95-99.7 Rule to state the percentage of values that fall:<br />
(Hint: It may be helpful to draw diagrams for some)<br />
a. Within two standard deviations:<br />
b. Between 0 and 1 deviation above the mean:<br />
c. L4s than 2 deviations below the mean:<br />
d. Betweefl 2 and 3 deviations below the mean:
-<br />
-<br />
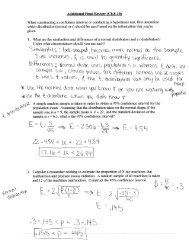
7. Assuming the weights of quarters are normally distributed with a mean of 5.67 grams<br />
and a standard deviation of 0.07 grams. Find the following quantities.<br />
a. Percentage of weights more than 5.74 grams<br />
t_I (ji<br />
-<br />
- - c.<br />
b. Relative frequency of weights greater than 5.53 grams<br />
i \ C’ --<br />
7<br />
Percentage of weights between 5.81 and 5.53 grams<br />
X<br />
‘ EI_ (j ‘ C i<br />
- L<br />
1J rhc<br />
1<br />
j<br />
U<br />
1 —<br />
d. Relative frequency of weights between 5.46 and 5.74 grams<br />
I-t<br />
.<br />
L ç(If ‘-r( i C ftrc ) lia c<br />
crt; Ld\, —itc yc’y y*<br />
‘<br />
8. The lifetimes of light bulbs of a particular type are normally distributed with a mean<br />
of 370 hours and a standard deviation of 5 hours. If 500 light bulbs were tested,<br />
how many would have lifetimes that lie within 1 standard deviation of the<br />
mean?<br />
-<br />
I<br />
— zi<br />
9. When a data value is not exactly 1, 2, or 3 deviations from the mean, what must you<br />
do in order to find the percentage of values that fall below that value?<br />
— —.<br />
—<br />
—<br />
10. A set of data has a mean of 50 and a standard deviation of 4. Find the z-score of the<br />
value-&7.<br />
—Th<br />
11. Using #10, determine what percentile is7 in.<br />
5 r<br />
I<br />
L ‘ cr- i_ —r -<br />
--<br />
7iLL-i<br />
—<br />
C—<br />
1- —<br />
‘_i_i)
12. The amount of Jen’s monthly phone bill is normally distributed with a mean of $50<br />
and a standard deviation of $10. Find the dollar value that corresponds to the 25 th<br />
percentile.<br />
13. At one college, GPA’ s are normally distributed with a mean of 3 and a standard<br />
deviation of 0.6.Find the GPA that corresponds to the 80th percentile.<br />
11, Assume that the income distribution for assembly line workers at a large<br />
manufacturing company is nearly normal with a mean of $ 31,250 and a standard<br />
deviation of$ 6,050. Estimate the percentage of workers who earn between $25,000<br />
and $ 35,000.<br />
14. What are the characteristics of The Central Limit Theore ido>u use the<br />
C.L.T.?<br />
t5. The heights of a large populations of students have a mean of 66” with a standard<br />
deviation of 4”. What is the mean of the distribution of sample means for samples<br />
of 16 students?<br />
t6. The mean salary of the 9,000 em5Ioyees at Holley.com is p = $26,400 with a<br />
standard deviation of o $2. 420. What is the sample standard deviation (Si) for a<br />
random sample of 400 employees?
17. A final exam in Math 160 has a mean of 73 with standard deviation 7.73. Assume<br />
that a random sample of 24 students is selected and the mean test score of the<br />
sample is computed. What percentage ofsans are less than 70?<br />
18. The mean score on a dexterity test for 12 year olds isp = 30. The standard<br />
deviation is 5. If a psychologist administers the test to a class of 22 students, what<br />
are the chances that the mean of the sj1e is between 27 and 31?