Pinal County Air Quality
Pinal County Air Quality
Pinal County Air Quality

Create successful ePaper yourself
Turn your PDF publications into a flip-book with our unique Google optimized e-Paper software.
<strong>Pinal</strong> <strong>County</strong> <strong>Air</strong> <strong>Quality</strong><br />
Speciation Study Final Report<br />
Kale Walch<br />
TEOM Comparison Studies<br />
Joe Pisano<br />
January 9, 2005
Speciation Project Description<br />
Speciation Project Description<br />
The project was designed to identify sources of particulate<br />
matter in the <strong>Pinal</strong> <strong>County</strong> agricultural basin.<br />
PM10 and PM2.5 Mini-Vol samplers utilizing Pallflex quartz<br />
filters and Teflon filters were operated at five sites on a 1 in 3<br />
schedule. (At least one FRM sampler was also located at each<br />
site.)<br />
Soil samples were collected from feedlots, dirt roads, and<br />
agricultural fields.<br />
Sampling took place from October 1, 2003 to November 10,<br />
2003. The ten runs with the best data recovery were chosen for<br />
analysis.<br />
DRI performed speciation and source apportionment analysis<br />
on the Mini-Vol filters.
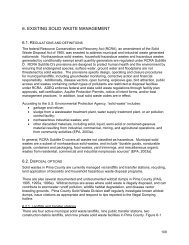
Method Comparison<br />
Figure 1: Hi-Vol vs M ini-Vol: PM 10<br />
Conc. (ug/m3)<br />
140<br />
120<br />
100<br />
80<br />
60<br />
40<br />
20<br />
0<br />
1 2 3 4 5 6 7 8 9 10 11 12 13 14 15<br />
HiVol<br />
MiniVol<br />
Run #<br />
Figure 2: Hi-Vol vs Mini-Vol: PM10<br />
Min-Vol<br />
120<br />
100<br />
80<br />
60<br />
40<br />
20<br />
FRM HiVol to MiniVol<br />
PM10<br />
Linear (FRM HiVol to<br />
MiniVol PM10)<br />
0<br />
0 20 40 60 80 100 120<br />
FRM Hi-Vol
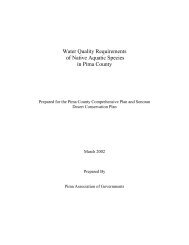
Method Comparison<br />
Figure 3: TEOM vs Mini-Vol: PM10<br />
Conc. (ug/m3)<br />
400<br />
350<br />
300<br />
250<br />
200<br />
150<br />
100<br />
50<br />
0<br />
TE OM<br />
MiniVol<br />
1 2 3 4 5 6 7 8 9 10 11 12 13 14 15 16 17 18 19<br />
Figure 4: TEOM vs Mini-Vol: PM10<br />
Run #<br />
Mini-Vol<br />
350<br />
300<br />
250<br />
200<br />
150<br />
100<br />
50<br />
0<br />
0 50 100 150 200 250 300 350<br />
TEOM<br />
TEOM vs MiniVol<br />
PM10<br />
Linear (TEOM vs<br />
MiniVol PM10)
Method Comparison<br />
Table 5: FRM PM 2.5<br />
vs Mini-Vol PM 2.5<br />
0.32<br />
Date<br />
FRM PM 2.5<br />
Mini-Vol PM 2.5<br />
10/18/2003<br />
10/30/2003<br />
11/5/2003<br />
10.1<br />
26.7<br />
10.7<br />
14.1<br />
49.5<br />
20.2<br />
Table 6: Mini-Vol PM 2.5<br />
/PM 10<br />
ratios<br />
Site<br />
Avg. Mini-Vol<br />
PM 10<br />
µg/m 3<br />
Avg. Mini-Vol<br />
PM 2.5<br />
µg/m 3<br />
Avg. Mini-Vol<br />
PM 2.5<br />
/PM 10<br />
Ratio<br />
Casa Grande<br />
44<br />
18<br />
0.41<br />
Coolidge<br />
47<br />
25<br />
0.53<br />
Cowtown<br />
127<br />
67<br />
0.53<br />
<strong>Pinal</strong> <strong>County</strong> Housing<br />
60<br />
25<br />
0.42<br />
Stanfield<br />
55<br />
18
Iron<br />
OC1<br />
Iron<br />
OC1<br />
Iron<br />
OC1<br />
Calcium<br />
Calcium<br />
Calcium<br />
Potassium<br />
Potassium<br />
Potassium<br />
Silicon<br />
Silicon<br />
Silicon<br />
40<br />
30<br />
20<br />
10<br />
0<br />
Chemical Fingerprint - Agricultural Dust, PM10<br />
OC2<br />
OC3<br />
OC4<br />
OPT<br />
EC1<br />
EC2<br />
EC3<br />
TC<br />
Aluminum<br />
Chemical Fingerprint - Road Dust, PM10<br />
OC2<br />
OC3<br />
OC4<br />
OPT<br />
EC1<br />
EC2<br />
EC3<br />
TC<br />
Aluminum<br />
Chemical Species<br />
Ammonium<br />
Ammonium<br />
Sulfate<br />
Sulfate<br />
Nitrate<br />
Nitrate<br />
40<br />
30<br />
20<br />
10<br />
0<br />
40<br />
30<br />
20<br />
10<br />
0<br />
Chemical Fingerprint - Feedlot Dust, PM10<br />
OC2<br />
OC3<br />
OC4<br />
OPT<br />
EC1<br />
EC2<br />
EC3<br />
TC<br />
Aluminum<br />
Chemical Species<br />
Chemical Species<br />
Ammonium<br />
Sulfate<br />
Nitrate<br />
% Concentration<br />
% Concentration<br />
% Concentration
Iron<br />
Iron<br />
Iron<br />
Calcium<br />
Calcium<br />
Calcium<br />
Potassium<br />
Potassium<br />
Potassium<br />
Silicon<br />
Silicon<br />
Silicon<br />
40<br />
30<br />
20<br />
10<br />
0<br />
Chemical Fingerprint - Feedlot Dust, PM2.5<br />
OC2<br />
OC3<br />
OC4<br />
OPT<br />
EC1<br />
EC2<br />
EC3<br />
TC<br />
Aluminum<br />
OC1<br />
Chemical Species<br />
Chemical Fingerprint - Agricultural Dust, PM2.5<br />
OC2<br />
OC3<br />
OC4<br />
OPT<br />
EC1<br />
EC2<br />
EC3<br />
TC<br />
Aluminum<br />
OC1<br />
Ammonium<br />
Ammonium<br />
Sulfate<br />
Sulfate<br />
Nitrate<br />
Nitrate<br />
40<br />
30<br />
20<br />
10<br />
0<br />
Chemical Species<br />
Chemical Fingerprint - Road Dust, PM2.5<br />
OC2<br />
OC3<br />
OC4<br />
OPT<br />
EC1<br />
EC2<br />
EC3<br />
TC<br />
Aluminum<br />
OC1<br />
Ammonium<br />
Sulfate<br />
% Concentration<br />
% Concentration<br />
40<br />
30<br />
20<br />
10<br />
0<br />
Chemical Species<br />
Nitrate<br />
% Concentration
Casa Grande Source<br />
Apportionment<br />
Casa Grande PM 10<br />
Casa Grande PM 2.5<br />
1%<br />
6%<br />
0% 3% 3%<br />
5%<br />
Soil<br />
Feedlot<br />
MvEmi<br />
4%<br />
1%<br />
13%<br />
43%<br />
VgBrn<br />
20%<br />
62%<br />
ColPP<br />
AmSulf<br />
AmNitr<br />
17%<br />
Other<br />
10%<br />
12%<br />
0%
Coolidge Source Apportionment<br />
Coolidge PM 10<br />
Coolidge PM 2.5<br />
2%<br />
9%<br />
5%<br />
3%<br />
0% 0%<br />
8%<br />
Soil<br />
Feedlot<br />
MvEmi<br />
VgBrn<br />
ColPP<br />
3%<br />
1%<br />
20%<br />
40%<br />
AmSulf<br />
AmNitr<br />
15%<br />
73%<br />
Other<br />
9%<br />
7%<br />
5%
Cowtown Source Apportionment<br />
Cowtown PM 10<br />
32%<br />
Cowtown PM 2.5<br />
24%<br />
0% 2% 4%<br />
Soil<br />
1%<br />
1%<br />
1%<br />
59%<br />
Feedlot<br />
MvEmi<br />
VgBrn<br />
ColPP<br />
AmSulf<br />
AmNitr<br />
Other<br />
0%<br />
9%<br />
7%<br />
3%<br />
4% 4%<br />
49%
<strong>Pinal</strong> <strong>County</strong> Housing Source<br />
Apportionment<br />
<strong>Pinal</strong> <strong>County</strong> Housing PM 10<br />
0%<br />
6%<br />
0% 3%<br />
2%<br />
3%<br />
Soil<br />
Feedlot<br />
MvEmi<br />
<strong>Pinal</strong> <strong>County</strong> Housing PM 2.5<br />
50%<br />
0%<br />
17%<br />
3%<br />
7%<br />
19%<br />
VgBrn<br />
ColPP<br />
AmSulf<br />
7%<br />
67%<br />
AmNitr<br />
Other<br />
8%<br />
8%
Stanfield Source Apportionment<br />
Stanfield PM 10<br />
Stanfield PM 2.5<br />
0% 3% 7%<br />
4%<br />
4%<br />
0%<br />
Soil<br />
Feedlot<br />
MvEmi<br />
VgBrn<br />
5%<br />
2%<br />
17%<br />
6%<br />
48%<br />
19%<br />
63%<br />
ColPP<br />
AmSulf<br />
AmNitr<br />
Other<br />
15%<br />
7% 0%
Speciation Project Conclusions<br />
Crustal Material emissions are a significant source of<br />
PM10 and PM2.5 in <strong>Pinal</strong> <strong>County</strong><br />
Manure emissions are a significant source of PM10<br />
and to a lesser extent PM2.5 in <strong>Pinal</strong> <strong>County</strong><br />
Chemically construction dust and agricultural dust are<br />
identical in an urban interface environment<br />
The Mini-Vol Samplers likely over estimated ambient<br />
PM2.5 concentrations<br />
It is still possible that <strong>Pinal</strong> <strong>County</strong> will have difficulty<br />
meeting the proposed PM2.5 standard
TEOM Comparison Studies<br />
Monitoring Site : Cowtown Road<br />
4 miles SE of Maricopa, surrounded by active and<br />
retired agricultural operations to the north, northeast,<br />
and east, and three cattle feedlots and a grain<br />
processing complex to the south southwest and<br />
southeast.<br />
Current Site Status: 1 R&P TEOM 1400ab sampler, 1<br />
R&P FDMS sampler, 1 MET station, 2 FRM Andersen<br />
47mm filter samplers (1 PM 10 & 1 PM 2.5 ), and a timelapse<br />
video system.
2 Key Issues / Inaccuracies<br />
In April 2005 the FDMS and TEOM 1400 were installed<br />
side by side sampling PM 10 . TEOM was found to be<br />
recording 24 hour average concentrations 30% higher<br />
than the FDMS.<br />
The first issue: TEOM 1400 was recording large 5<br />
minute negative concentrations after an extremely large<br />
positive number (1000 ug/m 3 )<br />
The second issue: TEOM 1400 was recording elevated<br />
noise levels during these same episodes.
2006 Cowtown PM 10 24-hour avg.<br />
January February March April May June July August September October November December<br />
1 12.1 14.2 42.6 79.1 419.6 41.6 393.2 769.6 341.5 308.8<br />
2 15.6 26.0 49.3 210.0 342.4 166.6 197.6 742.6 259.9 266.3<br />
3 4.5 21.7 47.1 255.3 314.0 282.2 177.5<br />
4 9.3 23.3 66.6 228.2 32.4 199.8 166.8 218.5 170.0<br />
5 11.6 36.7 8.8 640.2 196.1 201.8 213.3 170.5 208.0 358.5<br />
6 19.2 29.6 9.8 297.0 198.6 205.6 68.0 392.2 189.8 268.1<br />
7 42.7 15.7 291.4 225.8 342.0 62.3 367.8 219.3 275.6<br />
8 24.7 55.6 26.1 272.1 167.5 325.6 35.7 132.8 233.4 257.8<br />
9 20.3 90.8 36.7 270.3 49.9 192.8 287.9 302.3<br />
10 28.5 55.2 40.2 273.2 340.8 382.9 321.2 215.8 245.2<br />
11 81.5 59.8 320.2 215.8 323.9 45.5 304.0 125.0 260.7<br />
12 40.9 9.1 52.8 581.5 414.7 66.8 343.1 162.8 261.6<br />
13 34.3 10.4 46.9 391.0 45.0 249.6 278.2 211.3<br />
14 56.9 13.2 55.9 243.2 326.1 84.2 219.6 196.2 213.7<br />
15 43.6 16.7 32.3 326.9 328.4 235.5 94.2 431.7 343.2 172.2 151.2<br />
16 40.7 24.6 115.6 229.5 335.2 303.8 129.9 299.9 379.5 110.3<br />
17 115.4 32.7 80.2 373.9 308.9 315.2 350.8 163.7 356.7<br />
18 111.7 8.4 93.3 517.0 323.7 297.3 337.1 156.5 379.1 164.1<br />
19 108.8 4.5 44.6 284.3 368.3 279.1 179.7 126.8 606.9 405.0<br />
20 7.9 55.4 455.7 226.1 352.1 171.1 316.0 251.6 101.5<br />
21 16.2 99.2 371.9 264.3 470.0 234.2 279.3 250.5 90.7 384.2<br />
22 11.0 60.9 368.8 306.5 167.8 211.8 277.8 90.0<br />
23 13.1 111.0 281.5 269.7 142.7 153.0 341.4 79.1 294.6<br />
24 13.9 60.8 346.6 118.6 533.4 132.8<br />
25 19.7 97.4 439.6 392.1 142.1 197.3<br />
26 17.5 31.4 122.9 138.5 183.5 456.9 108.6 158.5<br />
27 13.3 28.8 100.1 164.3 377.5 160.0 151.4 395.1 118.4 228.6<br />
28 12.8 34.5 165.3 179.7 193.1 415.6 353.8<br />
29 24.5 175.6 155.3 113.3 107.9 585.2 95.7 225.6<br />
30 10.9 209.3 133.8 300.3 58.7 222.2 653.8 141.0 252.3<br />
31 22.0 67.6 378.0 14.2 288.6 207.0
TEOM PM 10 Hourly data w/ main flow at 3 LPM<br />
1 HOUR AVG 24 HOUR AVG DATE TIME<br />
45.7 353.7 5-Apr-05 12:00:05<br />
21.6 338.6045455 5-Apr-05 13:00:05<br />
12.2 324.4130435 5-Apr-05 14:00:05<br />
38.2 296.1434783 5-Apr-05 15:00:05<br />
30.7 270.5347826 5-Apr-05 16:00:05<br />
37.3 233.7347826 5-Apr-05 17:00:05<br />
35.2 214.9434783 5-Apr-05 18:00:05<br />
191.2 201.4565217 5-Apr-05 19:00:05<br />
6444.5 440.4043478 5-Apr-05 20:00:05<br />
4381 600.4608696 5-Apr-05 21:00:05<br />
829.6 626.2086957 5-Apr-05 22:00:05<br />
413.4 640.226087 5-Apr-05 23:00:05<br />
332 648.9478261 6-Apr-05 0:00:05<br />
156.7 651.126087 6-Apr-05 1:00:05<br />
178.1 652.9086957 6-Apr-05 2:00:05<br />
277.7 659.1304348 6-Apr-05 3:00:05<br />
265.6 665.6304348 6-Apr-05 4:00:05<br />
175.2 668.1608696 6-Apr-05 5:00:05<br />
381.1 661.1434783 6-Apr-05 6:00:05<br />
400.2 656.626087 6-Apr-05 7:00:05<br />
376.7 656.9521739 6-Apr-05 8:00:05<br />
179.6 661.0217391 6-Apr-05 9:00:05<br />
71.6 664.1347826 6-Apr-05 10:00:05<br />
143.1 642.425 6-Apr-05 11:00:05
TEOM PM 10 Hourly data w/ main flow at 1 LPM<br />
1 HOUR AVG 24 HOUR AVG DATE TIME<br />
36.4 663.9478261 1-Oct-05 15:00:05<br />
22.3 664.3347826 1-Oct-05 16:00:05<br />
67 667.2478261 1-Oct-05 17:00:05<br />
432.5 682.2391304 1-Oct-05 18:00:05<br />
4272.4 860.3130435 1-Oct-05 19:00:05<br />
4101.3 899.2130435 1-Oct-05 20:00:05<br />
1397.8 835.1565217 1-Oct-05 21:00:05<br />
493.3 801.4608696 1-Oct-05 22:00:05<br />
591.1 769.6695652 1-Oct-05 23:00:05<br />
455.8 728.3782609 2-Oct-05 0:00:05<br />
989.8 725.1 2-Oct-05 1:00:05<br />
474.4 711.4869565 2-Oct-05 2:00:05<br />
110.3 681.973913 2-Oct-05 3:00:05<br />
132 682.126087 2-Oct-05 4:00:05<br />
73.5 667.4043478 2-Oct-05 5:00:05<br />
388 672.826087 2-Oct-05 6:00:05<br />
357 668.7478261 2-Oct-05 7:00:05<br />
337.8 665.3478261 2-Oct-05 8:00:05<br />
189.9 664.5913043 2-Oct-05 9:00:05
Before 1 LPM flow restrictor (PM 10 )<br />
FDMS v.s. 1400ab<br />
500<br />
450<br />
400<br />
350<br />
300<br />
250<br />
200<br />
150<br />
100<br />
50<br />
0<br />
24 hr avg Mass Concentration (ug/m3)<br />
04/23/2005<br />
04/30/2005<br />
05/07/2005<br />
05/14/2005<br />
05/21/2005<br />
05/28/2005<br />
06/04/2005<br />
06/11/2005<br />
06/18/2005<br />
Days<br />
FDMS<br />
1400 ab
Troubleshooting TEOM 1400<br />
After working with R&P to resolve the issues,<br />
R&P recommended putting a 1.0 LPM flow<br />
restrictor on the main line inlet. (August 2, 2005)<br />
The assumption was that too much material was<br />
entering into the sample line and disrupting the<br />
microbalance. (Noise & Negative readings)
Result of 1.0 LPM Flow Restrictor<br />
Reduction in large negative concentration<br />
readings.<br />
A dramatic noise reduction within the<br />
microbalance.<br />
Brought the TEOM 1400 and FDMS units to a<br />
15% difference in recorded 24 hour<br />
concentrations.
After 1 LPM flow restrictor (PM 10 )<br />
After 1 LPM flow restrictor (PM 10 )<br />
FDMS vs 1400 ab (After 1.0L)<br />
450<br />
400<br />
350<br />
300<br />
250<br />
200<br />
150<br />
100<br />
50<br />
0<br />
24 hr avg. Mass Concentration<br />
(ug/m3)<br />
10/21/2005<br />
10/28/2005<br />
11/04/2005<br />
11/11/2005<br />
11/18/2005<br />
11/25/2005<br />
12/02/2005<br />
12/09/2005<br />
Run Days<br />
FDMS<br />
1400ab
Filter-based / TEOM Comparison<br />
Installed 2 FRM Andersen 47mm filter-based<br />
monitors (1 PM 10 and 1 PM 2.5 ) that operate on a<br />
6-day schedule.<br />
Began sampling on August 14, 2005.<br />
The purpose or intent of these two monitors is to<br />
be used as comparisons to TEOM / FDMS.
Cowtown PM 10 FRM (filter based)<br />
RUN DATE PM 10 STATUS CODES<br />
(µg/m3)<br />
8/14/2005 82.6384 0<br />
8/20/2005 271.4979 FILTER DAMAGED<br />
8/26/2005 107.6425 0<br />
9/1/2005 366.1906 0<br />
9/7/2005 327.0518 0<br />
9/13/2005 259.2250 0<br />
9/19/2005 604.4240 0<br />
9/25/2005 412.4626 0<br />
10/1/2005 677.7994 0<br />
10/7/2005 178.6250 0<br />
10/11/2005 FIELD BLANK<br />
10/13/2005 756.1905 0<br />
10/19/2005 INVALID RUN - STOR<br />
10/31/2005 223.5771 0<br />
11/6/2005 197.4814 0<br />
11/12/2005 181.5310 0<br />
11/18/2005 152.1459 0<br />
11/24/2005 138.0572 0<br />
11/30/2005 266.4094 0<br />
12/3/2005 150.0138 0<br />
12/6/2005 276.5912 0<br />
12/9/2005 333.0680 0<br />
12/12/2005 284.9892 0
PM 10 Method Comparisons<br />
1400ab v.s. 47mm v.s. FDMS<br />
900<br />
800<br />
700<br />
600<br />
500<br />
400<br />
300<br />
200<br />
0<br />
100<br />
08/14/2005<br />
08/28/2005<br />
09/11/2005<br />
09/25/2005<br />
10/09/2005<br />
10/23/2005<br />
11/06/2005<br />
11/20/2005<br />
12/04/2005<br />
Days<br />
1400 ab<br />
47 mm<br />
FDMS<br />
24 hr avg Mass Concentration<br />
(ug/m3)
Cowtown PM 2.5 FRM (filter based)<br />
RUN DATE PM 2.5 STATUS CODES<br />
(µg/m3)<br />
8/14/2005 9.7519 0<br />
8/20/2005 20.7532 0<br />
8/26/2005 16.0860 0<br />
9/1/2005 25.6719 0<br />
9/7/2005 29.7556 0<br />
9/13/2005 23.3821 0<br />
9/19/2005 57.3465 0<br />
9/25/2005 50.8490 0<br />
10/1/2005 144.8109 0<br />
10/7/2005 22.3416 0<br />
10/11/2005 FIELD BLANK<br />
10/13/2005 78.9316 0<br />
10/19/2005 INVALID RUN - STORM<br />
10/31/2005 25.6279 0<br />
11/6/2005 26.2138 0<br />
11/12/2005 20.5045 0<br />
11/18/2005 16.2133 0<br />
11/24/2005 15.4200 0<br />
11/30/2005 29.5949 0<br />
12/3/2005 13.9608 0<br />
12/6/2005 25.6447 0<br />
12/9/2005 29.1029 0<br />
12/12/2005 29.9331 0
FRM PM 10 / PM 2.5 / Coarse<br />
Cowtown ~PM10-2.5<br />
800<br />
700<br />
600<br />
500<br />
400<br />
300<br />
200<br />
100<br />
0<br />
08/14/2005<br />
08/21/2005<br />
08/28/2005<br />
09/04/2005<br />
09/11/2005<br />
09/18/2005<br />
09/25/2005<br />
10/02/2005<br />
10/09/2005<br />
10/16/2005<br />
10/23/2005<br />
10/30/2005<br />
11/06/2005<br />
Run Days<br />
PM10 PM2.5 PM10-2.5<br />
24 hr avg Mass Concentration<br />
(ug/m3)
Future Plans<br />
Change FDMS unit over PM 2.5 sampling.<br />
Compare FDMS PM 2.5 to 47mm PM 2.5<br />
Expanding other PCAQCD monitoring sites for<br />
PM 2.5 and PM 10-2.5 .<br />
Still working with R&P on the 15% difference and<br />
troubleshooting FDMS. (R&P conclusion)