Water Quality in Pima County - Pima Association of Governments
Water Quality in Pima County - Pima Association of Governments
Water Quality in Pima County - Pima Association of Governments

Create successful ePaper yourself
Turn your PDF publications into a flip-book with our unique Google optimized e-Paper software.
<strong>Water</strong> <strong>Quality</strong> <strong>in</strong> <strong>Pima</strong> <strong>County</strong><br />
Prepared for the <strong>Pima</strong> <strong>County</strong> Comprehensive Plan and Sonoran<br />
Desert Conservation Plan<br />
March 2002<br />
Prepared by<br />
<strong>Pima</strong> <strong>Association</strong> <strong>of</strong> <strong>Governments</strong>
PIMA ASSOCIATION OF GOVERNMENTS<br />
REGIONAL COUNCIL<br />
Chair Vice-Chair Treasurer<br />
Zachery Freeland Paul Loomis Shirley Villegas<br />
Mayor Mayor Mayor<br />
Town <strong>of</strong> Sahuarita Town <strong>of</strong> Oro Valley City <strong>of</strong> South Tucson<br />
Member Member Member<br />
Ann Day Bobby Sutton Jr. Robert Walkup<br />
Supervisor Mayor Mayor<br />
<strong>Pima</strong> <strong>County</strong> Town <strong>of</strong> Marana City <strong>of</strong> Tucson<br />
Member<br />
Katie Dusenberry<br />
Representative<br />
ADOT State Transp. Board<br />
MANAGEMENT COMMITTEE<br />
Mike He<strong>in</strong>, Manager, Town <strong>of</strong> Marana<br />
Fernando Castro, Manager, City <strong>of</strong> South Tucson<br />
Charles Huckelberry, Adm<strong>in</strong>istrator, <strong>Pima</strong> <strong>County</strong><br />
James Keene, Manager, City <strong>of</strong> Tucson<br />
Chuck Sweet, Manager, Town <strong>of</strong> Oro Valley<br />
Jim Stahle, Manager, Town <strong>of</strong> Sahuarita<br />
Executive Director<br />
Thomas L. Swanson<br />
Environmental Plann<strong>in</strong>g Director<br />
Charles H. Matthewson<br />
<strong>Water</strong> <strong>Quality</strong> Plann<strong>in</strong>g Manager<br />
Greg Hess<br />
Senior <strong>Water</strong> <strong>Quality</strong> Planner <strong>Water</strong> <strong>Quality</strong> Planner Project Technical Assistants<br />
Claire L. Zucker Staffan Schorr Jason Bill<br />
Jean Boyce<br />
Support Staff<br />
Karen Baz<strong>in</strong>et<br />
Jacki Ontiveros<br />
January 2002
Acknowledgments<br />
PAG would like to thank Maeveen Behan and Julia Fonseca at <strong>Pima</strong> <strong>County</strong> for <strong>in</strong>clud<strong>in</strong>g this<br />
project <strong>in</strong> PAG’s work program and the <strong>Pima</strong> <strong>County</strong>’s Adm<strong>in</strong>istrators Office for provid<strong>in</strong>g the<br />
fund<strong>in</strong>g to make this project possible.<br />
In addition PAG would like to thank the follow<strong>in</strong>g people who graciously provided <strong>in</strong>formation<br />
and <strong>in</strong>put <strong>in</strong> this project: Ed Curley, Byron McMillan, and Glen Peterson at <strong>Pima</strong> <strong>County</strong><br />
Wastewater Management Department; Karen Dotson, Jean Melillo, Tom Jefferson, and other<br />
staff at Tucson <strong>Water</strong>; Catesby Knight at the City <strong>of</strong> Tucson Transportation Department; and<br />
Eric Shepp and Adam Amante at <strong>Pima</strong> <strong>County</strong> Department <strong>of</strong> Environmental <strong>Quality</strong>.
Table <strong>of</strong> Contents<br />
Introduction.................................................................................................................................................1<br />
Background...................................................................................................................................................1<br />
Purpose..........................................................................................................................................................1<br />
Information and Data Sources.......................................................................................................................2<br />
Scope and Limitations...................................................................................................................................2<br />
Study Area Description.................................................................................................................................3<br />
Natural Sett<strong>in</strong>g ..........................................................................................................................................3<br />
Climate......................................................................................................................................................3<br />
Pr<strong>in</strong>cipal <strong>Water</strong> Sources <strong>of</strong> <strong>Pima</strong> <strong>County</strong>.................................................................................................7<br />
Groundwater .................................................................................................................................................7<br />
Surface <strong>Water</strong>bodies .....................................................................................................................................8<br />
Stormwater Run<strong>of</strong>f......................................................................................................................................11<br />
CAP <strong>Water</strong>..................................................................................................................................................13<br />
Treated Wastewater ....................................................................................................................................17<br />
<strong>Water</strong> <strong>Quality</strong> <strong>in</strong> <strong>Pima</strong> <strong>County</strong>................................................................................................................23<br />
Groundwater <strong>Quality</strong> ................................................................................................................................23<br />
Broadway-Pantano WQARF Site ..........................................................................................................25<br />
Davis Monthan Air Force Base..............................................................................................................25<br />
Downtown Tucson .................................................................................................................................25<br />
El Cam<strong>in</strong>o del Cerro WQARF Site........................................................................................................26<br />
Tucson Airport Area Remediation Project (TARP)...............................................................................26<br />
Air Force Plant 44..................................................................................................................................26<br />
Los Reales WQARF Site .......................................................................................................................26<br />
Price Service Center...............................................................................................................................26<br />
Silverbell Jail Annex/Miracle Mile WQARF Site .................................................................................29<br />
Shannon Road-Rillito Creek WQARF Site............................................................................................29<br />
Other Sites..............................................................................................................................................29<br />
Surface <strong>Water</strong>bodies <strong>Water</strong> <strong>Quality</strong> ...........................................................................................................29<br />
ADEQ Monitor<strong>in</strong>g .................................................................................................................................30<br />
Sonoran Desert Conservation Plan Studies............................................................................................31<br />
Stormwater Run<strong>of</strong>f <strong>Water</strong> <strong>Quality</strong>..............................................................................................................33<br />
Historical Data .......................................................................................................................................33<br />
Municipal NPDES Monitor<strong>in</strong>g Data......................................................................................................35<br />
CAP <strong>Water</strong> <strong>Quality</strong>.....................................................................................................................................41<br />
Treated Wastewater <strong>Water</strong> <strong>Quality</strong>.............................................................................................................45<br />
Roger and Ina Road Effluent .................................................................................................................45<br />
Reclaimed <strong>Water</strong>....................................................................................................................................51<br />
i
Summary and Conclusions.......................................................................................................................53<br />
Summary..................................................................................................................................................53<br />
Conclusions..............................................................................................................................................54<br />
Groundwater...........................................................................................................................................54<br />
CAP <strong>Water</strong> .............................................................................................................................................54<br />
Treated Wastewater................................................................................................................................54<br />
Stormwater Run<strong>of</strong>f.................................................................................................................................54<br />
Surface <strong>Water</strong>bodies ..............................................................................................................................54<br />
References……………………………………………………………………………………………...…55<br />
Appendix A- Arizona Department <strong>of</strong> Environmental <strong>Quality</strong>. Santa Cruz-Rio Magdalena-Rio Sonoyta<br />
<strong>Water</strong>shed Stream Assessments and Stream Monitor<strong>in</strong>g Data.<br />
Appendix B- Priority Pollutant Quarterly Sampl<strong>in</strong>g 2000 for Ina Road WPCF and Roger Road WWTP<br />
ii
List <strong>of</strong> Figures<br />
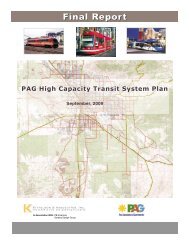
Figure 1. Study Area…………………………………………………………………………………5<br />
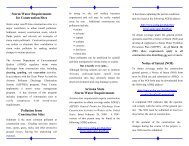
Figure 2. Locations <strong>of</strong> Perennial and Intermittent <strong>Water</strong>bodies <strong>in</strong> Eastern <strong>Pima</strong> <strong>County</strong>………..…11<br />
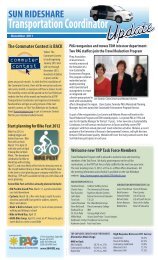
Figure 3. Locations <strong>of</strong> Central Arizona Project (CAP) Canal and Underground Storage Facilities<br />
<strong>in</strong> <strong>Pima</strong> <strong>County</strong>………………………………………………………………………….….17<br />
Figure 4. Wastewater Treatment Facilities (WWTF) and Effluent Use <strong>in</strong> Eastern <strong>Pima</strong> <strong>County</strong>…..21<br />
Figure 5. Locations <strong>of</strong> State (WQARF) and Federal Superfund Sites <strong>in</strong> <strong>Pima</strong> <strong>County</strong>………….…27<br />
Figure 6. Stormwater Sampl<strong>in</strong>g Locations <strong>in</strong> Eastern <strong>Pima</strong> <strong>County</strong>…………………………….….39<br />
iii
List <strong>of</strong> Tables<br />
Table 1. Perennial Streams <strong>in</strong> <strong>Pima</strong> <strong>County</strong> .................................................................................................9<br />
Table 2. Intermittent Streams <strong>in</strong> <strong>Pima</strong> <strong>County</strong>............................................................................................10<br />
Table 3. Concentrations <strong>of</strong> Selected Constituents In Tucson-Area Groundwater, 2000-2001 ..................24<br />
Table 4. Detected Inorganic <strong>Water</strong> <strong>Quality</strong> Constituents, Arizona <strong>Water</strong> Company, Ajo, Arizona .........24<br />
Table 5. Selected Stream <strong>Water</strong> <strong>Quality</strong> Data, 1989-2000, From ADEQ Database..................................31<br />
Table 6. Average Values, <strong>Water</strong> <strong>Quality</strong> Data for Selected Streams <strong>in</strong> <strong>Pima</strong> <strong>County</strong> ..............................32<br />
Table 7. Chemical Constituents <strong>in</strong> <strong>Water</strong> at Quitobaquito, Arizona..........................................................32<br />
Table 8. Stormwater <strong>Quality</strong> Data for the Santa Cruz River at Congress Street Bridge...........................33<br />
Table 9. 1986-1993 Stormwater <strong>Quality</strong> Data for Tanque Verde Creek at Sab<strong>in</strong>o Canyon Road .............34<br />
Table 10. 1986-1993 Stormwater <strong>Quality</strong> Data for Rillito Creek at Dodge Boulevard.............................35<br />
Table 11. Fiscal Year 1998-99 Monitor<strong>in</strong>g Results for City <strong>of</strong> Tucson Stormwater..................................36<br />
Table 12. Monitor<strong>in</strong>g Results for <strong>Pima</strong> <strong>County</strong> Stormwater, Second Report<strong>in</strong>g Period, Sept. 2000.. ......37<br />
Table 13. Summary <strong>of</strong> <strong>Water</strong> <strong>Quality</strong> for Untreated CAP <strong>Water</strong> at the Clearwater Site............................42<br />
Table 14. <strong>Water</strong> <strong>Quality</strong> Monitor<strong>in</strong>g Results, Source <strong>Water</strong>, <strong>Pima</strong> M<strong>in</strong>e Road Recharge.........................43<br />
Table 15. Roger Road WWTF Monitor<strong>in</strong>g Requirements.........................................................................45<br />
Table 16. Ina Road WPCF Monitor<strong>in</strong>g Requirements................................................................................ 45<br />
Table 17. Roger Road Wastewater Treatment Facility Discharge Monitor<strong>in</strong>g Report Summarized<br />
Information, Year 2000……………………………………………………………………………...46<br />
Table 18. Ina Road <strong>Water</strong> Pollution Control Facility Discharge Monitor<strong>in</strong>g Report Summarized<br />
Information, Year 2000…………………………………………………...........................................46<br />
Table 19. Quarterly Priority Pollutant Organic Compounds Detected <strong>in</strong> Effluent from Ina Road.............47<br />
Table 20. Quarterly Priority Pollutant Organic Compounds Detected <strong>in</strong> Effluent from Roger Road ........47<br />
Table 21. Summary <strong>of</strong> Dissolved Oxygen Field Measurements <strong>in</strong> the Santa Cruz River………………..49<br />
Table 22. Priority Pollutant- Metals, Quarterly Sampl<strong>in</strong>g for 2000...........................................................50<br />
Table 23. Average Values, <strong>Water</strong> <strong>Quality</strong> Data, Tucson <strong>Water</strong> Reclaim System .....................................51<br />
Table 24. Analytical Results for Reclaimed <strong>Water</strong>, Sample Dates January 4, 2001 and April 12, 2001. ..52<br />
Table 25. Average <strong>Water</strong> <strong>Quality</strong> Data for Selected Tucson Area <strong>Water</strong> Sources....................................53<br />
iv
<strong>Pima</strong> <strong>County</strong> Comprehensive Plan and Sonoran Desert Conservation<br />
Plan<br />
<strong>Water</strong> <strong>Quality</strong> <strong>in</strong> <strong>Pima</strong> <strong>County</strong><br />
Introduction<br />
Background<br />
S<strong>in</strong>ce 1998, <strong>Pima</strong> <strong>County</strong> has been work<strong>in</strong>g toward a comprehensive assessment <strong>of</strong> urban growth<br />
and the environment which has led to the creation <strong>of</strong> the Sonoran Desert Conservation Plan.<br />
Development <strong>of</strong> this plan has been prompted <strong>in</strong> part by the federal Endangered Species Act. In<br />
addition, the <strong>County</strong> is updat<strong>in</strong>g its Comprehensive Plan as required by the state’s recently<br />
adopted Grow<strong>in</strong>g Smarter legislation. The two plans will conta<strong>in</strong> a water quality element <strong>in</strong><br />
order to meet the requirements <strong>of</strong> the Grow<strong>in</strong>g Smarter legislation, and to ensure the preservation<br />
<strong>of</strong> species dependent on surface water or shallow groundwater <strong>in</strong> <strong>Pima</strong> <strong>County</strong>.<br />
<strong>Pima</strong> <strong>Association</strong> <strong>of</strong> <strong>Governments</strong> (PAG) is assist<strong>in</strong>g with the preparation <strong>of</strong> the <strong>Water</strong> <strong>Quality</strong><br />
Element at the <strong>County</strong>’s request. This request was prompted <strong>in</strong> part by the fact that PAG is the<br />
state-designated <strong>Water</strong> <strong>Quality</strong> Plann<strong>in</strong>g Agency for <strong>Pima</strong> <strong>County</strong> under Section 208 <strong>of</strong> the<br />
Clean <strong>Water</strong> Act.<br />
PAG's Section 208 <strong>Water</strong> <strong>Quality</strong> Management Plan consists <strong>of</strong> a document written <strong>in</strong> 1978 and<br />
all <strong>of</strong> the subsequent amendments and updates to that document. The 208 Plan addresses one <strong>of</strong><br />
the major water quality concerns associated with growth, which is the disposition <strong>of</strong> waste. The<br />
orig<strong>in</strong>al PAG 208 Plan and several amendments also identified various po<strong>in</strong>t- and non-po<strong>in</strong>t<br />
sources <strong>of</strong> pollutants. However, the 208 Plan has not had a recent comprehensive, countywide<br />
update and it does not <strong>in</strong>clude site-specific programs for unique aquatic habitats identified <strong>in</strong> the<br />
Sonoran Desert Conservation Plan. Therefore, reliance on the exist<strong>in</strong>g 208 Plan would probably<br />
not meet the <strong>County</strong>'s needs, and development <strong>of</strong> additional plann<strong>in</strong>g materials is warranted.<br />
Purpose<br />
The purpose <strong>of</strong> this report is to provide, us<strong>in</strong>g exist<strong>in</strong>g literature to the extent possible, a brief,<br />
descriptive overview <strong>of</strong> the quality <strong>of</strong> various water sources found <strong>in</strong> <strong>Pima</strong> <strong>County</strong>. By<br />
identify<strong>in</strong>g high-quality water sources as well as areas with potential water quality problems, it<br />
will be possible to prioritize regional water quality plann<strong>in</strong>g efforts. These plans could <strong>in</strong>clude<br />
additional monitor<strong>in</strong>g, assign<strong>in</strong>g appropriate uses for some water sources, improv<strong>in</strong>g the quality<br />
<strong>of</strong> some sources where necessary, and protect<strong>in</strong>g the water quality <strong>of</strong> other sources. This report,<br />
along with a separate report summariz<strong>in</strong>g exist<strong>in</strong>g regulations, plans and programs related to<br />
water quality management and protection, will provide a foundation on which the water quality<br />
element <strong>of</strong> the <strong>County</strong> plan can be developed.<br />
1
Information and Data Sources<br />
Much <strong>of</strong> the <strong>in</strong>formation <strong>in</strong> this report comes from previously published documents conta<strong>in</strong><strong>in</strong>g<br />
<strong>in</strong>formation about water quality <strong>in</strong> <strong>Pima</strong> <strong>County</strong>. In particular, this report relies heavily on the<br />
follow<strong>in</strong>g: <strong>Water</strong> <strong>Quality</strong> State <strong>of</strong> the Region Report (PAG, 1994); Tucson Active Management<br />
Area Third Management Plan (ADWR, 1999); The Status <strong>of</strong> <strong>Water</strong> <strong>Quality</strong> <strong>in</strong> Arizona - Clean<br />
<strong>Water</strong> Act Section 305b Report (ADEQ, 2000); <strong>Water</strong> <strong>Quality</strong> Assessment for the Tucson Active<br />
Management Area Northwest Replenishment Program Feasibility Study (PAG, 1996); City <strong>of</strong><br />
Tucson’s Municipal Stormwater Annual Report for Fiscal Year 1998-1999; and <strong>Pima</strong> <strong>County</strong><br />
NPDES Stormwater Discharge Permit (No. AZS000002) Third Annual Report, September 2000.<br />
Scope and Limitations<br />
This report is the first deliverable under PAG's contract with <strong>Pima</strong> <strong>County</strong> to provide assistance<br />
with develop<strong>in</strong>g the <strong>Water</strong> <strong>Quality</strong> Element <strong>of</strong> the Sonoran Desert Conservation Plan and the<br />
Comprehensive Land Use Plan. The study area is all <strong>of</strong> <strong>Pima</strong> <strong>County</strong>, exclud<strong>in</strong>g Indian<br />
reservations. However, the emphasis is on eastern <strong>Pima</strong> <strong>County</strong>.<br />
This report, <strong>in</strong> accordance with the PAG-<strong>Pima</strong> <strong>County</strong> contract, relied primarily on data that<br />
were readily available <strong>in</strong> exist<strong>in</strong>g literature. No orig<strong>in</strong>al data were collected for this project, and<br />
PAG did not attempt to verify the accuracy <strong>of</strong> the data conta<strong>in</strong>ed <strong>in</strong> the sources used. In<br />
addition, the time and budget available for this project did not permit an exhaustive search for all<br />
literature that might be available on water quality <strong>in</strong> <strong>Pima</strong> <strong>County</strong>. Additional data, <strong>in</strong>clud<strong>in</strong>g<br />
monitor<strong>in</strong>g results more current than the data used for this report, are probably available.<br />
However, it is assumed that the data used for this report are adequate to provide a general,<br />
descriptive overview <strong>of</strong> water quality <strong>in</strong> the county. PAG only used data from previously<br />
published, peer-reviewed literature, or data provided by organizations with an extensive history<br />
<strong>of</strong> water quality monitor<strong>in</strong>g and data report<strong>in</strong>g, for this project.<br />
This report should not be used for a detailed, quantitative comparison <strong>of</strong> the different water<br />
sources, or for conclud<strong>in</strong>g that one water source is "better" or "worse" than another. In order to<br />
conduct such an analysis, a consistent set <strong>of</strong> data, from samples collected at approximately the<br />
same time and by consistent methods and under the same QA/QC protocols, would be necessary.<br />
The data <strong>in</strong> this report represent sampl<strong>in</strong>g and analyses that were completed by various<br />
organizations at different times and for different purposes. PAG did not verify that consistent<br />
methods and QA/QC standards were followed. Therefore, variability <strong>in</strong> the data from one water<br />
source to the next could be due, at least <strong>in</strong> part, to differences <strong>in</strong> sampl<strong>in</strong>g programs. The<br />
sampl<strong>in</strong>g programs would not be expected to be the same for different water sources, because<br />
different water sources are used for different purposes, regulated under different programs, and<br />
monitored for different reasons, for different constituents and at different frequencies.<br />
A more appropriate use <strong>of</strong> this report is to review the <strong>in</strong>formation for the <strong>in</strong>dividual water<br />
sources, and use the <strong>in</strong>formation as the basis for discussions <strong>of</strong>: (1) adequacy <strong>of</strong> the quality <strong>of</strong><br />
each source for its current or <strong>in</strong>tended use; (2) potential suitable uses for each water source <strong>in</strong> the<br />
future; (3) data gaps and regional priorities for additional monitor<strong>in</strong>g; and (4) regional priorities<br />
for water quality protection and/or improvements. In this way, the report should be a useful<br />
start<strong>in</strong>g po<strong>in</strong>t for an update to exist<strong>in</strong>g countywide water quality plans.<br />
2
Study Area Description<br />
<strong>Pima</strong> <strong>County</strong> is large and diverse. It is 9,240 square miles <strong>in</strong> area and with<strong>in</strong> its boundaries are<br />
some <strong>of</strong> the most prist<strong>in</strong>e, unfrequented landscapes <strong>in</strong> the United States, as well as one <strong>of</strong> the<br />
nation's fastest grow<strong>in</strong>g metropolitan areas. It <strong>in</strong>cludes the second largest Indian reservation <strong>in</strong><br />
the country, irrigated farmlands, open pit copper m<strong>in</strong>es, military facilities, National Parks and<br />
Monuments, National Forests, National Wildlife Refuges, <strong>County</strong>-managed natural preserves,<br />
major corporate and university research facilities, world-class tourist resorts, urban districts,<br />
suburbs, and commercial areas.<br />
Based on 2000 Census data, the population <strong>of</strong> <strong>Pima</strong> <strong>County</strong> is approximately 840,000; the<br />
population <strong>of</strong> Tucson, the largest <strong>in</strong>corporated city, is approximately 490,000. The towns <strong>of</strong><br />
Marana and Oro Valley were the fastest and second-fastest grow<strong>in</strong>g towns <strong>in</strong> Arizona <strong>in</strong> the<br />
1990s.<br />
Natural Sett<strong>in</strong>g<br />
<strong>Pima</strong> <strong>County</strong> is <strong>in</strong> the Bas<strong>in</strong> and Range physiographic prov<strong>in</strong>ce, which is characterized by<br />
northwest-trend<strong>in</strong>g mounta<strong>in</strong> ranges separated by alluvial bas<strong>in</strong>s. Land surface elevations <strong>in</strong><br />
<strong>Pima</strong> <strong>County</strong> range from less than 2,000 feet above sea level on the bas<strong>in</strong> floors to more than<br />
9,000 feet above sea level <strong>in</strong> the mounta<strong>in</strong>s. Most <strong>of</strong> the Tucson metropolitan area lies with<strong>in</strong><br />
the Tucson bas<strong>in</strong>, a gently slop<strong>in</strong>g pla<strong>in</strong> between 2,000 and 3,000 feet <strong>in</strong> elevation, which is<br />
r<strong>in</strong>ged by eight mounta<strong>in</strong> ranges. The highest <strong>of</strong> these are the Santa Rita, Santa Catal<strong>in</strong>a and<br />
R<strong>in</strong>con ranges, all <strong>of</strong> which reach elevations above 8,000 feet.<br />
A large portion <strong>of</strong> eastern <strong>Pima</strong> <strong>County</strong> lies <strong>in</strong> two alluvial bas<strong>in</strong>s: Avra Valley <strong>in</strong> the west and<br />
the Tucson bas<strong>in</strong> <strong>in</strong> the east. The bas<strong>in</strong>s are separated by the Tucson Mounta<strong>in</strong>s. Land use <strong>in</strong><br />
Avra Valley consists mostly <strong>of</strong> open space and agriculture. Much <strong>of</strong> the Tucson bas<strong>in</strong> is<br />
urbanized, but outside the Tucson metropolitan area, the predom<strong>in</strong>ant land uses are agriculture,<br />
m<strong>in</strong><strong>in</strong>g, and open space.<br />
The Santa Cruz River and its tributaries form eastern <strong>Pima</strong> <strong>County</strong>'s regional dra<strong>in</strong>age network.<br />
The Santa Cruz River is a tributary <strong>of</strong> the Gila River, which <strong>in</strong> turn flows <strong>in</strong>to the Colorado<br />
River.<br />
Climate<br />
The climate is arid to semi-arid <strong>in</strong> the bas<strong>in</strong>s, with summertime temperatures <strong>of</strong>ten exceed<strong>in</strong>g<br />
100 degrees Fahrenheit. Precipitation <strong>in</strong> the Tucson bas<strong>in</strong> averages 12 <strong>in</strong>ches per year (NOAA,<br />
1998). Most <strong>of</strong> the precipitation occurs <strong>in</strong> the form <strong>of</strong> <strong>in</strong>tense, localized thunderstorms dur<strong>in</strong>g<br />
the summer and gentle, regional ra<strong>in</strong>s dur<strong>in</strong>g the w<strong>in</strong>ter. Natural vegetation <strong>in</strong> the bas<strong>in</strong>s is<br />
sparse, rang<strong>in</strong>g from Lower Sonoran Desert shrubs and cacti to Upper Sonoran Desert<br />
grasslands. Lower temperatures and <strong>in</strong>creased precipitation <strong>in</strong> the mounta<strong>in</strong>s support midelevation<br />
oak and juniper woodlands, and at the highest elevations, coniferous forests.<br />
3
Figure 1. Study Area.<br />
!(<br />
§¨¦ I-10 77<br />
!(<br />
86<br />
TUCSON<br />
286<br />
!(<br />
§¨¦ I-19<br />
§¨¦ I-10<br />
!(<br />
83<br />
Arizona<br />
Incorporated and Un<strong>in</strong>corporated <strong>Pima</strong> <strong>County</strong> (<strong>in</strong>cluded <strong>in</strong> study)<br />
Tohono O'odham and Pasqua Yaqui Nations (not <strong>in</strong>cluded <strong>in</strong> study)<br />
Major <strong>Water</strong>course<br />
<strong>Pima</strong><br />
Major Street<br />
<br />
0<br />
10 20 40 60 80<br />
Miles<br />
March 2002<br />
5
Pr<strong>in</strong>cipal <strong>Water</strong> Sources <strong>of</strong> <strong>Pima</strong> <strong>County</strong><br />
Five pr<strong>in</strong>cipal categories <strong>of</strong> water sources are present <strong>in</strong> <strong>Pima</strong> <strong>County</strong>:<br />
• Groundwater pumped from wells;<br />
• Naturally occurr<strong>in</strong>g perennial and <strong>in</strong>termittent surface waterbodies, such as streams,<br />
spr<strong>in</strong>gs, and spr<strong>in</strong>g-fed ponds and pools;<br />
• Stormwater run<strong>of</strong>f;<br />
• Imported Central Arizona Project (CAP) water; and<br />
• Treated wastewater.<br />
These water sources are closely l<strong>in</strong>ked <strong>in</strong> many ways. Therefore, <strong>in</strong> many aspects <strong>of</strong> plann<strong>in</strong>g,<br />
they should not be treated entirely separately. For example, spr<strong>in</strong>gs and many perennial and<br />
<strong>in</strong>termittent streams are directly fed by groundwater. Wastewater is also primarily derived from<br />
groundwater that is used for domestic, commercial and <strong>in</strong>dustrial purposes. Therefore, the<br />
quality <strong>of</strong> wastewater and many surface waters can be <strong>in</strong>fluenced by the quality <strong>of</strong> local<br />
groundwater. Also, stormwater, CAP water, and wastewater recharge groundwater <strong>in</strong> many<br />
locations <strong>of</strong> the <strong>County</strong>, either naturally or artificially. The quality <strong>of</strong> these sources can therefore<br />
affect the quality <strong>of</strong> local groundwater.<br />
Each <strong>of</strong> these water source categories is described briefly below. A detailed report on water<br />
resources, entitled <strong>Water</strong> Resources <strong>in</strong> <strong>Pima</strong> <strong>County</strong>, July 2001, has been prepared by the <strong>Water</strong><br />
Resources Research Center.<br />
Groundwater<br />
Historically, groundwater has been the most widely used water resource <strong>in</strong> <strong>Pima</strong> <strong>County</strong>.<br />
Throughout most <strong>of</strong> the <strong>County</strong>, groundwater is drawn from wells that tap deep aquifers found <strong>in</strong><br />
the alluvial bas<strong>in</strong>s. These aquifers consist <strong>of</strong> unconsolidated to semi-consolidated silts, sands,<br />
gravels, and clays derived from the mounta<strong>in</strong> ranges surround<strong>in</strong>g the bas<strong>in</strong>s. Elsewhere,<br />
groundwater is drawn from shallow wells tapp<strong>in</strong>g comparatively localized sources, such as<br />
fractured bedrock, flood pla<strong>in</strong> aquifers, or perched aquifers.<br />
Most <strong>of</strong> the groundwater development has occurred <strong>in</strong> eastern <strong>Pima</strong> <strong>County</strong>, <strong>in</strong> the Upper Santa<br />
Cruz Bas<strong>in</strong> and Avra Valley. Groundwater <strong>in</strong> these areas is used for public dr<strong>in</strong>k<strong>in</strong>g water<br />
supply, landscape and crop irrigation, and <strong>in</strong>dustry. Pumpage <strong>of</strong> groundwater for these uses<br />
totals more than 300,000 acre-feet per year <strong>in</strong> the Tucson Active Management Area, which<br />
<strong>in</strong>cludes most <strong>of</strong> eastern <strong>Pima</strong> <strong>County</strong> and part <strong>of</strong> P<strong>in</strong>al <strong>County</strong> (ADWR, 1999). This greatly<br />
exceeds the volume <strong>of</strong> groundwater recharge, result<strong>in</strong>g <strong>in</strong> water-table decl<strong>in</strong>es <strong>of</strong> over 200 feet<br />
(Tucson <strong>Water</strong>, 1998). Depths to groundwater <strong>in</strong> eastern <strong>Pima</strong> <strong>County</strong> currently range from less<br />
than 50 feet to greater than 700 feet below land surface (Tucson <strong>Water</strong>, 2000a). In general,<br />
water level decl<strong>in</strong>es can lead to lower well productivity, <strong>in</strong>creased pump<strong>in</strong>g costs, decl<strong>in</strong><strong>in</strong>g<br />
water quality, and land subsidence (<strong>Water</strong> Resources Research Center, 1999). For these and<br />
other reasons, there is widespread <strong>in</strong>terest <strong>in</strong> develop<strong>in</strong>g and us<strong>in</strong>g other water sources <strong>in</strong>stead <strong>of</strong><br />
rely<strong>in</strong>g entirely on groundwater pumpage.<br />
7
Surface <strong>Water</strong>bodies<br />
Accord<strong>in</strong>g to the Arizona Department <strong>of</strong> <strong>Water</strong> Resources, <strong>in</strong> its Third Management Plan for the<br />
Tucson Active Management Area (TAMA), the ma<strong>in</strong> surface water dra<strong>in</strong>age <strong>in</strong> the TAMA is the<br />
Santa Cruz River. The river, which is about 60 miles long with<strong>in</strong> the AMA, flows north through<br />
the Upper Santa Cruz Valley Subbas<strong>in</strong> and then northwest <strong>in</strong>to the Avra Valley Subbas<strong>in</strong>. From<br />
the Roger Road wastewater treatment plant an approximately n<strong>in</strong>e mile reach <strong>of</strong> the Santa Cruz<br />
has perennial flow due to treated effluent discharged <strong>in</strong>to the channel at Roger Road and Ina<br />
Road. The rema<strong>in</strong>der <strong>of</strong> the Santa Cruz with<strong>in</strong> the TAMA is ephemeral (ADWR, 1999).<br />
Major tributaries <strong>of</strong> the Santa Cruz River <strong>in</strong> the Upper Santa Cruz Valley Subbas<strong>in</strong> <strong>in</strong>clude the<br />
Canada del Oro, which dra<strong>in</strong>s the northern part <strong>of</strong> the Upper Santa Cruz Valley Subbas<strong>in</strong>, and<br />
Rillito Creek and its tributaries, which dra<strong>in</strong> the area north and east <strong>of</strong> Tucson. Tributaries to<br />
Rillito Creek <strong>in</strong>clude Pantano Wash and Tanque Verde Creek. Pantano Wash receives flow from<br />
R<strong>in</strong>con Creek and Cienega Creek. Tanque Verde Creek receives flow from Sab<strong>in</strong>o Creek. In the<br />
Avra Valley Subbas<strong>in</strong>, Altar Wash orig<strong>in</strong>ates <strong>in</strong> the southern part <strong>of</strong> the valley and flows north to<br />
become Brawley Wash. Brawley Wash flows to the north and northwest through Avra Valley to<br />
its confluence with the Santa Cruz River southwest <strong>of</strong> Red Rock.<br />
The San Pedro River is a tributary <strong>of</strong> the Gila River and dra<strong>in</strong>s 4485 square miles <strong>of</strong> Arizona and<br />
Mexico. The San Pedro River enters the northeastern corner <strong>of</strong> <strong>Pima</strong> <strong>County</strong> <strong>in</strong> what is<br />
considered the Lower San Pedro Bas<strong>in</strong>. The river is fed by flow from the northeast side <strong>of</strong> the<br />
Santa Catal<strong>in</strong>a Mounta<strong>in</strong>s and by two significant dra<strong>in</strong>ages from the Galiuro Mounta<strong>in</strong>s. Most <strong>of</strong><br />
the stream reaches on the San Pedro are <strong>in</strong>termittent, but <strong>in</strong> the area around B<strong>in</strong>gham Cienega<br />
there is both perennial and <strong>in</strong>termittent flow (Royayne, M.J. and T. Maddock III, 1996).<br />
The vast majority <strong>of</strong> the watercourses <strong>in</strong> <strong>Pima</strong> <strong>County</strong> are ephemeral, and do not represent a<br />
significant water source, except for stormwater run<strong>of</strong>f. In contrast, the number <strong>of</strong> perennial and<br />
<strong>in</strong>termittent watercourses is relatively small, but the surface water <strong>in</strong> these waterbodies is very<br />
important habitat for terrestrial and aquatic species.<br />
Prior to the <strong>in</strong>itiation <strong>of</strong> research for the Sonoran Desert Conservation Plan (SDCP), a<br />
comprehensive assessment <strong>of</strong> perennial and <strong>in</strong>termittent streams <strong>in</strong> <strong>Pima</strong> <strong>County</strong> was not<br />
available. In January 2000, however, a countywide assessment <strong>of</strong> these watercourses was<br />
completed, and a GIS coverage show<strong>in</strong>g the locations <strong>of</strong> perennial and <strong>in</strong>termittent streams was<br />
created for the SDCP. Fifty-five perennial stream reaches and eighty-two <strong>in</strong>termittent stream<br />
reaches from a total <strong>of</strong> seventy-four different streams were identified (PAG, 2000a).<br />
The identified perennial and <strong>in</strong>termittent streams <strong>of</strong> <strong>Pima</strong> <strong>County</strong> are <strong>in</strong> a variety <strong>of</strong> locations and<br />
environments, and most are located <strong>in</strong> eastern <strong>Pima</strong> <strong>County</strong>. This is likely due to the presence <strong>of</strong><br />
higher land elevations and greater precipitation. Thirty-eight streams that had perennial or<br />
<strong>in</strong>termittent reaches had flows that orig<strong>in</strong>ated <strong>in</strong> the Santa Catal<strong>in</strong>a, R<strong>in</strong>con or Santa Rita<br />
Mounta<strong>in</strong>s (PAG, 2000a).<br />
The identified natural perennial and <strong>in</strong>termittent streams flow<strong>in</strong>g <strong>in</strong> eastern <strong>Pima</strong> <strong>County</strong> are<br />
shown on the follow<strong>in</strong>g tables. Some <strong>of</strong> the streams are listed on both tables because they<br />
conta<strong>in</strong> both perennial and <strong>in</strong>termittent reaches.<br />
8
Table 1. Perennial Streams <strong>in</strong> <strong>Pima</strong> <strong>County</strong> (PAG, 2000a).<br />
Apache Spr<strong>in</strong>g 0.03 miles Montosa Creek 0.2 miles<br />
Arivaca Creek * 2.7 miles<br />
Nogales Spr<strong>in</strong>g 0.3 miles<br />
B<strong>in</strong>gham Cienega<br />
Posta Quemada 0.3 miles<br />
Buehman Canyon (three reaches) * 5.1 miles<br />
Quitobaquito (Pond and Spr<strong>in</strong>g)<br />
Bullock Canyon 0.7 miles<br />
Romero Canyon 0.4 miles<br />
Canada Del Oro 4.2 miles<br />
Ruelas Canyon 0.1 miles<br />
Cienega Creek (n<strong>in</strong>e reaches) * 10.5 miles<br />
Sab<strong>in</strong>o Creek (3 reaches) * 15 miles<br />
C<strong>in</strong>co Canyon 0.2 miles<br />
San Pedro River (2 reaches) * 1.2 miles<br />
Davidson Canyon 0.7 miles<br />
Santa Cruz River (effluent dependent) * 6.8 miles<br />
Edgar Canyon * 0.7 miles<br />
Scholefield Spr<strong>in</strong>g 0.04 miles<br />
Empire Gulch (two reaches) 1.4 miles<br />
Simpson Spr<strong>in</strong>g 0.4 miles<br />
Espiritu Canyon 2.2 miles<br />
Tanque Verde 0.5 miles<br />
Honey Bee Canyon 0.2 miles<br />
Wakefield Canyon (3 reaches) 1.2 miles<br />
Lemmon Creek 2.7 miles<br />
Wild Burro Canyon (5 reaches) 0.6 miles<br />
Little Nogales Spr<strong>in</strong>g 0.2 miles<br />
Wild Cow Spr<strong>in</strong>g 0.05 miles<br />
Mattie Canyon 1.3 miles<br />
Youtcy Canyon (2 reaches) 1.3 miles<br />
*- Indicates water quality data are available on these streams and are <strong>in</strong>cluded <strong>in</strong> this report.<br />
9
Table 2. Intermittent Streams <strong>in</strong> <strong>Pima</strong> <strong>County</strong> (PAG, 2000a)<br />
Agua Verde Creek 15.0 miles<br />
Madrona Canyon 3.4 miles<br />
Alder Canyon 1.2 miles<br />
Mattie Canyon 0.4 miles<br />
Arivaca Creek* 0.7 miles<br />
Miller Creek 4.1 miles<br />
Ash Creek 3.1 miles<br />
Mol<strong>in</strong>o Canyon 5.2 miles<br />
Atchley Canyon 1.8 miles<br />
Mud Spr<strong>in</strong>g Canyon 2.6 miles<br />
Barrel Canyon 1.3 miles<br />
Paige Creek (2 reaches) 3.0 miles<br />
Bear Canyon (2 reaches) 9 miles<br />
Palisade Canyon Creek (2 reaches) 4.5 miles<br />
Bear Creek 3.2 miles<br />
Peck Bas<strong>in</strong> 1.2 miles<br />
Bootlegger Spr<strong>in</strong>g 0.1 miles<br />
<strong>Pima</strong> Canyon 1.8 miles<br />
Box Canyon 4.1 miles<br />
R<strong>in</strong>con Creek 11.3 miles<br />
Brown Canyon 3.4 miles<br />
Romero Canyon (2 reaches) 4.8 miles<br />
Buehman Canyon (2 reaches)* 2.5 miles<br />
Rose Canyon Creek 0.4 miles<br />
Bullock Canyon (3 reaches) 3.1 miles<br />
Sab<strong>in</strong>o Canyon 3.4 miles<br />
Canada Agua 0.01 miles<br />
San Pedro River (3 reaches) 10.6 miles<br />
Canada del Oro 1.2 miles<br />
Santa Cruz River (2 reaches) 20.4 miles<br />
Cargodera Canyon 0.2 miles<br />
Smitty Spr<strong>in</strong>g 0.1 miles<br />
Chim<strong>in</strong>ea Creek 4.1 miles<br />
Soldier Creek 2.9 miles<br />
Chimney Canyon 3.3 miles<br />
Sutherland Wash 6.5 miles<br />
Cienega Creek (8 reaches)* 9.4 miles<br />
Sycamore Canyon 1.1 miles<br />
Davidson Canyon (3 reaches) 1.2 miles<br />
Tanque Verde Creek (5 reaches) 17.1 miles<br />
Deer Creek 2.5 miles<br />
Thomas Canyon 3.0 miles<br />
Distillery Canyon 3.3 miles<br />
Turkey Creek 3.2 miles<br />
East Fork Sab<strong>in</strong>o Canyon 1.3 miles<br />
Unnamed tributary to Ash Creek 1.2 miles<br />
Espiritu Canyon 6.9 miles<br />
Unnamed Spr<strong>in</strong>g 0.2 miles<br />
F<strong>in</strong>ger Rock Canyon 2.8 miles<br />
Unnamed Spr<strong>in</strong>g 0.9 miles<br />
Florida Canyon 3.4 miles<br />
Ventana Canyon (3 reaches) 9.2 miles<br />
Gardner Canyon 0.5 miles<br />
Wakefield Canyon 0.8 miles<br />
Geesaman Wash 1.1 miles<br />
West Fork Sab<strong>in</strong>o Creek 2.4 miles<br />
La Milagrosa Canyon 0.9 miles<br />
Youtcy Canyon (2 reaches) 1.6 miles<br />
Madera Canyon * 1.5 miles<br />
*- Indicates water quality data are available on these streams and are <strong>in</strong>cluded <strong>in</strong> this report.<br />
Many <strong>of</strong> the streams <strong>in</strong> <strong>Pima</strong> <strong>County</strong> are located, totally or partially, <strong>in</strong> areas protected by the<br />
National Park Service, National Forest Service or <strong>Pima</strong> <strong>County</strong> Parks and Recreation. However,<br />
a number <strong>of</strong> important stream reaches are outside protected areas. These <strong>in</strong>clude Davidson<br />
Canyon south <strong>of</strong> Interstate 10, the San Pedro River, portions <strong>of</strong> Arivaca Creek, several streams<br />
dra<strong>in</strong><strong>in</strong>g the northeast side <strong>of</strong> the Santa Catal<strong>in</strong>a Mounta<strong>in</strong>s, Agua Verde Creek, Wakefield<br />
Canyon, R<strong>in</strong>con Creek, Tanque Verde Creek, and others.<br />
One <strong>of</strong> the perennial streams, Cienega Creek, is an important water, recreation and wildlife<br />
resource located southeast <strong>of</strong> Tucson <strong>in</strong> the Santa Cruz watershed. It is one <strong>of</strong> the few lowelevation<br />
streams <strong>in</strong> <strong>Pima</strong> <strong>County</strong> that exhibits significant perennial flow. The section <strong>of</strong><br />
Cienega Creek that flows from Interstate 10 to the Del Lago dam has been designated by the<br />
Arizona Department <strong>of</strong> Environmental <strong>Quality</strong> (ADEQ) as a “Unique <strong>Water</strong>”, which means it<br />
has been classified as an “outstand<strong>in</strong>g state resource water”. Buehman Canyon, another<br />
perennial stream <strong>in</strong> <strong>Pima</strong> <strong>County</strong>, has also been designated a “Unique <strong>Water</strong>” by the State.<br />
10
Rillito River<br />
!(<br />
77<br />
B<strong>in</strong>gham Cienega<br />
Unique <strong>Water</strong>s<br />
§¨¦ I-10 §¨¦ I-19<br />
Brawley Wash<br />
C anada del Oro<br />
!(<br />
86<br />
Santa Cruz River<br />
TUCSON<br />
Panta<br />
§¨¦ I-10<br />
no Wash<br />
286<br />
!(<br />
!(<br />
83<br />
Cienega Creek<br />
Unique <strong>Water</strong>s<br />
Altar Wash<br />
Figure 2.<br />
Locations <strong>of</strong> Perennial and Intermittent <strong>Water</strong>bodies<br />
<strong>in</strong> Eastern <strong>Pima</strong> <strong>County</strong><br />
Perennial or Intermittent <strong>Water</strong>body<br />
Major <strong>Water</strong>course<br />
<br />
0<br />
Major Street<br />
Mounta<strong>in</strong> Range<br />
8 16 24 32 Miles<br />
Data Source: GIS Coverage <strong>of</strong> Perennial Streams, Intermittent<br />
Streams, and Areas <strong>of</strong> Shallow Groundwater (PAG, 2000).<br />
March 2002<br />
11
Stormwater Run<strong>of</strong>f<br />
Because stormwater run<strong>of</strong>f is typically short-term and occurs <strong>in</strong> response to precipitation events,<br />
the direct use <strong>of</strong> this surface water has been limited. However, surface water flow is an important<br />
source <strong>of</strong> recharge to the aquifer <strong>in</strong> the Tucson AMA. Groundwater conditions can be greatly<br />
affected by occasionally large surface water flows <strong>in</strong> the Santa Cruz River and its tributaries.<br />
Surface water flows recharge the groundwater system <strong>in</strong> the vic<strong>in</strong>ity <strong>of</strong> the stream as water<br />
<strong>in</strong>filtrates through the stream channel sediments to the underly<strong>in</strong>g aquifer. Stream channel<br />
recharge <strong>in</strong> the Upper Santa Cruz Valley Subbas<strong>in</strong> is estimated at 30,960 acre-feet per year and<br />
<strong>in</strong> the Avra Valley Subbas<strong>in</strong> at around 6695 acre-feet per year (ADWR, 1999).<br />
Stormwater run<strong>of</strong>f <strong>in</strong> major urbanized areas is regulated by the USEPA’s National Pollutant<br />
Discharge Elim<strong>in</strong>ation System program (NPDES), and these urban areas are required to obta<strong>in</strong><br />
stormwater permits. The <strong>in</strong>tent <strong>of</strong> the permit program is to improve the quality <strong>of</strong> the stormwater<br />
run<strong>of</strong>f and its subsequent impact, if any, on surface water. Regulated municipalities must<br />
develop a plan with mechanisms designed to locate and elim<strong>in</strong>ate discharge <strong>in</strong>to storm sewers<br />
from sources other than stormwater. They must also have a mechanism for erosion and sediment<br />
control for prevent<strong>in</strong>g and reduc<strong>in</strong>g other pollutants associated with construction activity. In<br />
addition, they must also <strong>in</strong>spect <strong>in</strong>dustrial facilities to ensure that measures are <strong>in</strong> place to<br />
prevent stormwater contam<strong>in</strong>ation. F<strong>in</strong>ally, they must have an operation and ma<strong>in</strong>tenance<br />
program to prevent or reduce pollutant run<strong>of</strong>f from all municipal operations (City <strong>of</strong> Tucson,<br />
1999). Stormwater NPDES permits have been issued to <strong>Pima</strong> <strong>County</strong> and the City <strong>of</strong> Tucson.<br />
Both entities conduct stormwater monitor<strong>in</strong>g and implement programs to reduce pollutant run<strong>of</strong>f.<br />
Although the use <strong>of</strong> stormwater is currently very limited, it is an important resource that should<br />
be considered <strong>in</strong> water-related plann<strong>in</strong>g efforts. Stormwater run<strong>of</strong>f supports riparian vegetation<br />
along washes, and it can create aquatic habitats at retention bas<strong>in</strong>s. For example, the Ajo<br />
Detention Bas<strong>in</strong> has recently been constructed and designed to utilize stormwater. In addition,<br />
stormwater has been considered as a potential source water for artificial groundwater recharge<br />
projects <strong>in</strong> <strong>Pima</strong> <strong>County</strong>. In particular, Rillito Creek has been proposed as a site for artificial<br />
recharge <strong>of</strong> stormwater (<strong>Pima</strong> <strong>County</strong> Department <strong>of</strong> Transportation and Flood Control District,<br />
1986). However, CH2M Hill and others (1988) reported <strong>in</strong> a recharge feasibility assessment for<br />
the Tucson area that the potential for artificial recharge us<strong>in</strong>g stormwater is limited to 17,000<br />
acre-feet annually. The variability <strong>of</strong> flows complicates recharge and the design <strong>of</strong> any <strong>in</strong>-stream<br />
recharge system must take <strong>in</strong>to account the heavy sediment loads associated with stormwater. A<br />
major problem with recharg<strong>in</strong>g stormwater is the clogg<strong>in</strong>g caused by the settl<strong>in</strong>g <strong>of</strong> suspended<br />
sediment (CH2M Hill, 1988).<br />
CAP <strong>Water</strong><br />
To address groundwater depletion throughout the state, the Central Arizona Project (CAP)<br />
aqueduct was constructed. The CAP aqueduct is 326 miles long and transports water from the<br />
Colorado River to southern Arizona. The CAP aqueduct delivers Colorado River <strong>Water</strong> from<br />
Lake Havasu to cities, towns, and agricultural areas <strong>in</strong> central and southern Arizona. Some <strong>of</strong><br />
the water is stored along the way <strong>in</strong> Lake Pleasant, which is impounded by the New Waddell<br />
13
Dam on the Agua Fria River northwest <strong>of</strong> Phoenix. Releases <strong>of</strong> stored water from Lake Pleasant<br />
contribute to variations <strong>in</strong> the chemistry <strong>of</strong> the water delivered to Tucson.<br />
Tucson <strong>Water</strong> has the largest allocation <strong>of</strong> CAP water <strong>in</strong> the area with approximately 138,920<br />
acre-feet per year. Other jurisdictions, water companies, and public and private entities also have<br />
CAP water allocations. These <strong>in</strong>clude: Metropolitan Domestic <strong>Water</strong> Improvement District<br />
(8858 acre-feet), Spanish Trail <strong>Water</strong> Company (3037 acre-feet), Community <strong>Water</strong> Company <strong>of</strong><br />
Green Valley (1337 acre-feet), Green Valley <strong>Water</strong> Company (1900 acre-feet), the Town <strong>of</strong> Oro<br />
Valley (1500 acre-feet) and others (ADWR, 1999).<br />
Tucson <strong>Water</strong> began direct delivery <strong>of</strong> CAP water <strong>in</strong> November <strong>of</strong> 1992, but ended it <strong>in</strong> October<br />
<strong>of</strong> 1994, due to persistent problems <strong>of</strong> corrosion <strong>in</strong> the public and private water l<strong>in</strong>es. In April <strong>of</strong><br />
1996 Tucson <strong>Water</strong> began a recharge and recovery pilot project <strong>in</strong> Avra Valley called the Central<br />
Avra Valley Storage and Recovery Project (CAVSARP). Recharge operations began <strong>in</strong> the<br />
summer <strong>of</strong> 1996. In June <strong>of</strong> 1999, Tucson <strong>Water</strong> began deliver<strong>in</strong>g a blend <strong>of</strong> recovered CAP<br />
water and groundwater to the first <strong>of</strong> four neighborhoods <strong>in</strong> its service area as a demonstration<br />
that the blended water would be acceptable to area residences and that it would not cause the<br />
same corrosion problems as before (PAG, 1999a). The demonstration projects were successful<br />
and Tucson <strong>Water</strong> began system-wide delivery <strong>of</strong> the blended groundwater/recovered CAP water<br />
<strong>in</strong> May <strong>of</strong> 2001.<br />
Permits from the Arizona Department <strong>of</strong> <strong>Water</strong> Resources (ADWR) are required whenever water<br />
is <strong>in</strong>tentionally added to an aquifer. As <strong>of</strong> 2001 there were four Underground Storage Facilities<br />
(USF) for CAP water <strong>in</strong> the TAMA. They <strong>in</strong>clude: CAVSARP, <strong>Pima</strong> M<strong>in</strong>e Road Recharge<br />
Project (PMRRP), Avra Valley Recharge Project, and the Lower Santa Cruz Recharge Project<br />
(ADWR, 1999; CAP, 2001).<br />
Tucson <strong>Water</strong>’s Clearwater Renewable Resource Facility is a water supply project <strong>in</strong> Avra<br />
Valley designed to recharge Colorado River water to blend with native groundwater <strong>in</strong> the<br />
aquifer. The blend is then piped to the greater Tucson area and distributed to Tucson <strong>Water</strong>’s<br />
customers. CAVSARP is the primary structural element <strong>of</strong> the larger Clearwater Facility. It<br />
provides the means to take water from the CAP canal, recharge the water <strong>in</strong> bas<strong>in</strong>s <strong>in</strong> Avra<br />
Valley, and then recover and pump the water as far as the Hayden-Udall <strong>Water</strong> Treatment Plant.<br />
The Clearwater Project also <strong>in</strong>cludes blend<strong>in</strong>g <strong>of</strong> the recovered water with waters from other<br />
wellfields, delivery <strong>of</strong> the blended water to water customers, and ultimately the shut-down <strong>of</strong><br />
many wells <strong>in</strong> the central wellfield (Tucson <strong>Water</strong>, 2000b). As <strong>of</strong> December 31, 2000 the total<br />
net recharge volume for the Clearwater Renewable Resources Facility was 43,290 acre-feet.<br />
The <strong>Pima</strong> M<strong>in</strong>e Road Recharge Project is a constructed facility located approximately 15 miles<br />
south <strong>of</strong> Tucson which is jo<strong>in</strong>tly owned by the Central Arizona <strong>Water</strong> Conservation District and<br />
Tucson <strong>Water</strong>. The pilot test<strong>in</strong>g was conducted from March 1997- March 1999. A full-scale<br />
underground storage facility permit, allow<strong>in</strong>g up to 30,000 acre-feet <strong>of</strong> CAP water to be<br />
recharged per year, was issued <strong>in</strong> September <strong>of</strong> 2000. As <strong>of</strong> December 31, 2000, the total net<br />
recharge volume for the project was 25,185.29 acre-feet. (CAWCD, 2001).<br />
The Avra Valley Recharge Project is operated by the Central Arizona Project, us<strong>in</strong>g CAP water<br />
purchased by Metropolitan Domestic <strong>Water</strong> Improvement District and the Arizona <strong>Water</strong> Bank<br />
(PAG, 1999). It consists <strong>of</strong> four <strong>of</strong>f-channel constructed shallow spread<strong>in</strong>g bas<strong>in</strong>s which have a<br />
comb<strong>in</strong>ed area <strong>of</strong> about 11.4 acres (PAG, 1999a). The facility is located northeast <strong>of</strong> the Avra<br />
14
Valley airport. The permit for the pilot project allowed for 8,300 acre-feet maximum volume<br />
and the full-scale facility permit allows for 11,000 acre-feet annually (ADWR, 1999).<br />
The Lower Santa Cruz Recharge Project was dedicated <strong>in</strong> November 2000. This project is a jo<strong>in</strong>t<br />
effort by CAP, Town <strong>of</strong> Marana, <strong>Pima</strong> <strong>County</strong> Flood Control District and BKW Farms.<br />
Approximately 30,000 acre-feet <strong>of</strong> Colorado River water will be recharged each year at this<br />
facility (CAP, 2001).<br />
Additional uses for CAP water <strong>in</strong>clude agriculture and <strong>in</strong>dustry. Many potential agricultural<br />
users <strong>in</strong> the Tucson AMA decl<strong>in</strong>ed their CAP water allocations ma<strong>in</strong>ly due to the high cost <strong>of</strong> the<br />
water and <strong>in</strong>frastructure. In 1997 agriculture use <strong>of</strong> CAP was approximately 25,000 acre-feet.<br />
The City <strong>of</strong> Tucson also has groundwater sav<strong>in</strong>gs facilities <strong>in</strong>volv<strong>in</strong>g several irrigation districts,<br />
where CAP water is utilized for irrigation <strong>in</strong> lieu <strong>of</strong> groundwater. ADWR (1999) has <strong>in</strong>dicated<br />
that <strong>in</strong>dustrial uses <strong>of</strong> CAP water are limited due to costs and water quality concerns. The m<strong>in</strong>es<br />
are the largest volume <strong>in</strong>dustrial water users <strong>in</strong> the TAMA. The lack <strong>of</strong> delivery <strong>in</strong>frastructure,<br />
costs associated with CAP water quality as it affects operations, and the cost <strong>of</strong> the water may<br />
preclude direct CAP use (ADWR, 1999).<br />
15
Rillito River<br />
Lower Santa Cruz<br />
Recharge Project<br />
!(<br />
77<br />
Avra Valley<br />
Recharge Project<br />
Ca n ada del Oro<br />
§¨¦ I-10 §¨¦ I-10<br />
Brawley Wash<br />
Central Avra Valley<br />
Storage and Recovery<br />
Project (CAVSARP)<br />
TUCSON<br />
Santa Cruz River<br />
!(<br />
86<br />
§¨¦ I-19<br />
<strong>Pima</strong> M<strong>in</strong>e Road<br />
Recharge Project<br />
286<br />
!(<br />
Figure 3. Locations <strong>of</strong> Central Arizona Project (CAP) Canal and<br />
Underground Storage Facilities <strong>in</strong> <strong>Pima</strong> <strong>County</strong><br />
CAP Canal<br />
Mounta<strong>in</strong> Range<br />
<br />
Major <strong>Water</strong>course<br />
Major Street<br />
0 5 10 15 20 Miles<br />
Data Source: Location <strong>of</strong> CAP canal provided by <strong>Pima</strong> <strong>County</strong> Land Information System (PCLIS) CD-ROM.<br />
Names and locations <strong>of</strong> recharge facilities from ADWR (1998) and CAP (2001).<br />
March 2002<br />
17
Treated Wastewater<br />
For purposes <strong>of</strong> this report, treated wastewater is def<strong>in</strong>ed as water that has been used for<br />
domestic, commercial or <strong>in</strong>dustrial purposes, conveyed via sewer l<strong>in</strong>es to either the Ina Road or<br />
Roger Road wastewater treatment facility, and either reused directly, discharged to the Santa<br />
Cruz River, or further treated and distributed through the City's reclaimed water system.<br />
Additional wastewater treatment facilities are located throughout <strong>Pima</strong> <strong>County</strong>. Effluent from<br />
these plants is not addressed <strong>in</strong> this report, because the vast amount <strong>of</strong> effluent generated for<br />
reuse comes from the two above- referenced facilities. The capacities <strong>of</strong> the Ina Road and Roger<br />
Road treatment facilities are 25 mgd and 41 mgd, respectively (PAG, 1999a). These two plants<br />
treated approximately 68,664 acre-feet <strong>of</strong> wastewater dur<strong>in</strong>g fiscal year 1999-2000 (PCWMD,<br />
2001). The discharges support an effluent dependent stream and a diverse riparian habitat,<br />
subject to flood events, along a river channel that would otherwise be ephemeral. <strong>Pima</strong> <strong>County</strong><br />
also supplies approximately 500 acre-feet per year <strong>of</strong> treated effluent to the Arthur Pack Golf<br />
Course for irrigation. The effluent discharges also recharge the regional aquifer for many miles<br />
along the Santa Cruz River.<br />
The reclaimed water treatment process beg<strong>in</strong>s at <strong>Pima</strong> <strong>County</strong>’s Roger Road Treatment Facility.<br />
The <strong>County</strong> treats the wastewater to secondary standards required by state and federal agencies.<br />
A portion <strong>of</strong> this treated wastewater is piped <strong>in</strong>to Tucson <strong>Water</strong>’s reclaimed water filtration<br />
plant. The water is filtered through pressure filters conta<strong>in</strong><strong>in</strong>g anthracite coal and sand, and<br />
dis<strong>in</strong>fected. The treated reclaimed water is gravity-fed to a 3-million-gallon reservoir on-site,<br />
ready for distribution to customers (Malcolm Pirnie, 1999). The delivery system <strong>in</strong>cludes more<br />
than 85 miles <strong>of</strong> separate pip<strong>in</strong>g and five separate reservoirs with a comb<strong>in</strong>ed storage capacity <strong>of</strong><br />
15 million gallons (Tucson <strong>Water</strong> 2001a).<br />
Accord<strong>in</strong>g to Tucson <strong>Water</strong> (2001a), more than 3 billion gallons <strong>of</strong> reclaimed water were<br />
delivered to customers <strong>in</strong> 1999. Currently, over eight percent <strong>of</strong> Tucson <strong>Water</strong>’s total demand<br />
for water is met with reclaimed water. There are over 250 reclaimed water customers <strong>in</strong>clud<strong>in</strong>g<br />
14 golf courses, 34 schools, and 30 parks. It is anticipated that <strong>in</strong> the future 15 percent <strong>of</strong> total<br />
water demand will be met by the use <strong>of</strong> reclaimed water.<br />
Some <strong>of</strong> the water treated at the Roger Road Facility is piped to Tucson <strong>Water</strong>’s Sweetwater<br />
Recharge Facilities where it is naturally filtered through the earth and stored underground for<br />
future use. The filtered water is recovered through wells and piped to the chlor<strong>in</strong>e contact<br />
chamber where it is chlor<strong>in</strong>ated and mixed with the filtered water produced at the plant (Tucson<br />
<strong>Water</strong>, 2001a).<br />
Tucson <strong>Water</strong> operates the Sweetwater Wetlands on the east side <strong>of</strong> the Santa Cruz River. The<br />
constructed wetlands occupy 17 acres and consist <strong>of</strong> two settl<strong>in</strong>g ponds and two polish<strong>in</strong>g ponds.<br />
The backwash water from the filtration plant is piped to the Sweetwater Wetlands where it is<br />
naturally treated before it is released <strong>in</strong>to the recharge bas<strong>in</strong> (Tucson <strong>Water</strong>, 2001; PAG, 1999a).<br />
19
+C<br />
+C<br />
+C+C<br />
+C<br />
pq pq<br />
§¨¦ I-10 §¨¦ I-19<br />
!(<br />
77<br />
+C<br />
+C<br />
Ina Rd WWTF<br />
Roger Rd WWTF<br />
+C<br />
+C<br />
+C<br />
!(<br />
86<br />
+C<br />
pq pq<br />
pqpq pq<br />
pq<br />
pq<br />
pqpqpqpq pq<br />
pq<br />
pqpqpq pqpq<br />
pq<br />
pq pq pqpq<br />
pq pq pq<br />
pq pq<br />
pqpqpqpqpqpqpqpqpqpq pqpqpq<br />
pq pq pq<br />
pqpq pq pq pq<br />
pqpqpqpqpqpqpqpqpqpqpqpqpqpqpqpqpqpqpqpq<br />
pq<br />
pq<br />
pqpqpq pqpqpqpqpqpqpqpqpqpqpqpqpqpqpqpqpqpqpq<br />
pq<br />
pqpq<br />
pq<br />
pqpq<br />
pq pq pq<br />
pqpq<br />
pq TUCSON<br />
pqpq pq pq<br />
pq<br />
pq<br />
pqpq pq pq pq<br />
pqpq<br />
pqpq<br />
pqpqpq<br />
pq<br />
pqpqpq pq pq<br />
pq<br />
pq<br />
pq pq<br />
pq<br />
pq pqpq pq pq<br />
pqpq<br />
pq pqpq<br />
pq<br />
pq pq<br />
pqpqpqpqpqpqpqpqpqpqpqpqpqpqpqpqpqpqpqpqpqpqpqpqpqpqpqpqpqpqpqpqpqpqpqpqpqpq<br />
Rillito River<br />
+C+C pq<br />
San ta C ruz River<br />
Pantano Wash<br />
+C<br />
+C<br />
+C<br />
§¨¦ I-10<br />
286<br />
!(<br />
+C<br />
!(<br />
83<br />
+C<br />
+C<br />
Figure 4. Wastewater Treatment Facilities (WWTF) and Effluent Use<br />
<strong>in</strong> Eastern <strong>Pima</strong> <strong>County</strong><br />
pq<br />
Effluent User<br />
Major <strong>Water</strong>course<br />
March<br />
+C Exist<strong>in</strong>g Wastewater Treatment Facility<br />
Effluent Dom<strong>in</strong>ated <strong>Water</strong> (EDW)<br />
Major Street<br />
Mounta<strong>in</strong> Range<br />
0 7.5 15 22.5 30 Miles<br />
Data Source: Locations <strong>of</strong> effluent users provided by Tucson <strong>Water</strong>. Locations <strong>of</strong><br />
wastewater treatment facilities based on PAG WWTF <strong>in</strong>ventory (1999c).<br />
2002<br />
21
<strong>Water</strong> <strong>Quality</strong> <strong>in</strong> <strong>Pima</strong> <strong>County</strong><br />
Groundwater <strong>Quality</strong><br />
Natural factors and human activities affect groundwater quality. Natural factors that have the<br />
most effect <strong>in</strong> the bas<strong>in</strong>s <strong>of</strong> south-central Arizona are depth <strong>in</strong> the aquifer and distance from<br />
major faults. Groundwater temperatures and pH significantly <strong>in</strong>crease with well depth. In a<br />
United States Geological Survey (USGS) study, concentrations <strong>of</strong> dissolved solids, alkal<strong>in</strong>ity,<br />
calcium, potassium, chloride and sulfate were significantly higher <strong>in</strong> samples collected from<br />
wells less than 2 kilometers from major fault l<strong>in</strong>es. The groundwater quality <strong>in</strong> bas<strong>in</strong>s that do not<br />
have significant urban or agricultural development is primarily a factor <strong>of</strong> natural processes such<br />
as <strong>in</strong>teraction with sediments and rock. Natural sources <strong>of</strong> dissolved solids and nitrate can<br />
impact water quality <strong>in</strong> these bas<strong>in</strong>s. However, areas with urban or agricultural development can<br />
also impact nitrate concentrations (USGS, 1999; USGS, 2000). The m<strong>in</strong>eralogy <strong>of</strong> the aquifer<br />
material also <strong>in</strong>fluences water quality.<br />
Most exist<strong>in</strong>g groundwater quality data for <strong>Pima</strong> <strong>County</strong> is representative <strong>of</strong> eastern <strong>Pima</strong><br />
<strong>County</strong>, because more groundwater development has occurred there. Monitor<strong>in</strong>g data <strong>in</strong> this<br />
area are abundant, due to a variety <strong>of</strong> regulatory requirements. In general, groundwater <strong>in</strong> the<br />
Tucson AMA is <strong>of</strong> acceptable quality for most uses. Most <strong>of</strong> the groundwater resources meet<br />
federal and state dr<strong>in</strong>k<strong>in</strong>g water standards, though contam<strong>in</strong>ant levels exceed primary safe<br />
dr<strong>in</strong>k<strong>in</strong>g water standards <strong>in</strong> a few areas. Groundwater withdrawals from wells with<strong>in</strong> these<br />
identified areas have been discont<strong>in</strong>ued or are <strong>in</strong> the process <strong>of</strong> remediation. Other areas <strong>of</strong><br />
known contam<strong>in</strong>ation not currently under remediation are monitored to ensure that contam<strong>in</strong>ants<br />
do not spread (ADWR, 1999). In addition, the concentration <strong>of</strong> arsenic <strong>in</strong> groundwater would<br />
likely be <strong>of</strong> concern <strong>in</strong> several areas if an arsenic standard <strong>of</strong> 10 ppb is enacted.<br />
Groundwater is the ma<strong>in</strong> dr<strong>in</strong>k<strong>in</strong>g water source for <strong>Pima</strong> <strong>County</strong>. For this report general water<br />
quality data from various dr<strong>in</strong>k<strong>in</strong>g water providers <strong>in</strong> the <strong>County</strong> were reviewed. Dr<strong>in</strong>k<strong>in</strong>g water<br />
providers are required to sample the water that is delivered to their customers and report those<br />
constituents that were detected dur<strong>in</strong>g the required monitor<strong>in</strong>g. A detected result means a<br />
concentration that is above the m<strong>in</strong>imum value that can be measured by a laboratory. In most<br />
cases, the m<strong>in</strong>imum detectable level <strong>of</strong> a constituent is well below the USEPA’s regulatory limit<br />
for that constituent (Tucson <strong>Water</strong>, 2000). A review <strong>of</strong> water quality data from <strong>Pima</strong> <strong>County</strong><br />
dr<strong>in</strong>k<strong>in</strong>g water providers for the 1998-2000 sampl<strong>in</strong>g years <strong>in</strong>dicated the most common regulated<br />
constituents detected were nitrate, fluoride, arsenic, and chromium. Though these constituents<br />
were detected <strong>in</strong> the dr<strong>in</strong>k<strong>in</strong>g water supplies, none were seen at levels that exceeded the<br />
established dr<strong>in</strong>k<strong>in</strong>g water maximum contam<strong>in</strong>ant levels (MCLs).<br />
Concentrations <strong>of</strong> selected constituents <strong>in</strong> eastern <strong>Pima</strong> <strong>County</strong> groundwater are shown on<br />
Table 3. The data are from Tucson <strong>Water</strong>'s wellfields, which encompass large areas <strong>of</strong> the<br />
Tucson bas<strong>in</strong> and Avra Valley <strong>in</strong> eastern <strong>Pima</strong> <strong>County</strong>. The wells vary <strong>in</strong> depths, are regularly<br />
monitored, and for the purpose <strong>of</strong> this report are considered to be fairly representative <strong>of</strong> the<br />
area. Table 4 shows groundwater quality data from western <strong>Pima</strong> <strong>County</strong>.<br />
23
Table 3. Concentrations <strong>of</strong> Selected Constituents In Tucson-Area Groundwater, 2000-2001<br />
(Tucson <strong>Water</strong> web site 2001).<br />
Tucson <strong>Water</strong> Supply Source<br />
Parameter<br />
Avra Valley Santa Cruz Central South Side /<br />
Clearwater<br />
Wells Wells Wells TARP<br />
Fluoride, mg/L F 0.51 0.46 0.85 0.37 0.72<br />
Hardness, mg/L CaCO3 83 79 178 106 226<br />
Nitrate as Nitrogen, mg/L N 1.36 2.04 4.53 2.04 1.94<br />
Sodium, mg/L Na 44 37 38 39 66<br />
TDS, mg/L 227 In Progress In Progress 258 In Progress<br />
pH, Std. Units 8.04 8.13 7.66 7.85 7.96<br />
“In Progress” <strong>in</strong>dicates that the data is under development and will be <strong>in</strong>cluded <strong>in</strong> the table as the data<br />
becomes available.<br />
Arsenic <strong>in</strong> groundwater <strong>in</strong> the Tucson <strong>Water</strong> well fields was measured dur<strong>in</strong>g 2000.<br />
Four <strong>of</strong> the 161 po<strong>in</strong>ts <strong>of</strong> entry (POE) tested had maximum arsenic concentrations greater than<br />
9.0 µg/l, with the highest maximum value <strong>of</strong> 10 µg/l found at one site. 56 <strong>of</strong> the POEs had<br />
maximum arsenic values <strong>of</strong> < 2 µg/l (Tucson <strong>Water</strong>, 2001b).<br />
Table 4. Detected Inorganic <strong>Water</strong> <strong>Quality</strong> Constituents, Arizona <strong>Water</strong> Company, Ajo,<br />
Arizona, 2000 Annual Report. (Arizona <strong>Water</strong> Co., 2001)<br />
Parameter Units MCLG MCL Highest Level<br />
detected<br />
Sample Year<br />
Arsenic ppb 0 50 22 2000<br />
Chromium ppb 100 100 20 2000<br />
Fluoride ppm 4 4 1.7 2000<br />
Nitrate ppm 10 10 3 2000<br />
Sodium ppm 190 1998<br />
Sulfate ppm 160 1998<br />
24
In the 1970’s and 1980’s some additional groundwater studies were conducted <strong>in</strong> western <strong>Pima</strong><br />
<strong>County</strong> by the USGS. Samples from three groundwater sources Bonita Well, Pozo Salado Well,<br />
and Quitobaquito Spr<strong>in</strong>g, all located with<strong>in</strong> the Organ Pipe Cactus National Monument, <strong>in</strong>dicate<br />
that the major-ion chemistry is similar to chemistry <strong>of</strong> groundwater <strong>in</strong> other alluvial bas<strong>in</strong>s <strong>in</strong><br />
southern Arizona. The upgradient well, Bonita Well had dissolved solids measures at 338 mg/l<br />
and 0.4 mg/l <strong>of</strong> fluoride. This is similar to analyses <strong>of</strong> groundwater sampled from recharge areas<br />
<strong>in</strong> other alluvial bas<strong>in</strong>s <strong>in</strong> southern Arizona (Robertson, 1991). Read<strong>in</strong>gs for pH ranged from 7.4<br />
<strong>in</strong> the upgradient well to 8.4 <strong>in</strong> the downgradient well. Dissolved solids and fluoride also<br />
<strong>in</strong>creased from the upgradient well to the downgradient site and ranged from 338mg/l to<br />
1500mg/l and 0.4 mg/l to 5.4 mg/l respectively (Carruth, 1996)<br />
Land uses that have reportedly led to historic groundwater contam<strong>in</strong>ation <strong>in</strong> eastern <strong>Pima</strong> <strong>County</strong><br />
<strong>in</strong>clude: landfills and disturbed areas, wells no longer <strong>in</strong> service that have not been capped<br />
properly, irrigated agriculture, animal impoundments, underground storage tanks, surface<br />
impoundments, wastewater treatment facilities, m<strong>in</strong>es, and <strong>in</strong>dustry and commerce (PAG, 1994).<br />
Common groundwater contam<strong>in</strong>ants <strong>in</strong> the Tucson area groundwater <strong>in</strong>clude volatile organic<br />
compounds (VOC), nitrates, petroleum hydrocarbons, and heavy metals.<br />
Areas <strong>of</strong> contam<strong>in</strong>ation <strong>in</strong> eastern <strong>Pima</strong> <strong>County</strong> <strong>in</strong>clude: Broadway- Pantano WQARF Site,<br />
Davis Monthan Air Force Base, Downtown Tucson, El Cam<strong>in</strong>o Del Cerro WQARF Site, Tucson<br />
Airport Area Remediation Project (TARP), Air Force Plant 44, Los Reales WQARF Site, Price<br />
Service Center, Silverbell Jail Annex Landfill/Miracle Mile WQARF Site and Shannon Road-<br />
Rillito Creek WQARF Site. The groundwater is usually considered contam<strong>in</strong>ated if the most<br />
recent well sample data available <strong>in</strong>dicated an MCL exceedance (PAG, 1994).<br />
Broadway-Pantano WQARF Site<br />
The Broadway landfill was closed <strong>in</strong> 1971 and s<strong>in</strong>ce that time a groundwater contam<strong>in</strong>ant plume<br />
has developed beneath the site. Four public dr<strong>in</strong>k<strong>in</strong>g water wells have been removed from<br />
service due to the PCE contam<strong>in</strong>ation at this site. Contam<strong>in</strong>ant levels near the edge <strong>of</strong> the plume<br />
are 5ppb. The highest concentration measured was 100 ppb directly adjacent to the landfill. An<br />
activated carbon adsorption system has been selected to treat the contam<strong>in</strong>ated groundwater.<br />
Treatment will focus on pump<strong>in</strong>g the aquifer and re-<strong>in</strong>ject<strong>in</strong>g the water to achieve hydraulic<br />
conta<strong>in</strong>ment (PAG, 2000b).<br />
Davis Monthan Air Force Base<br />
In 1985 groundwater contam<strong>in</strong>ated with jet fuel was found on the base <strong>in</strong> the area <strong>of</strong> the air strip<br />
called the J-3 pump house. A soil vapor extraction system was used to remove jet fuel from the<br />
soil and reduce the groundwater contam<strong>in</strong>ation. This system has been <strong>in</strong> operation s<strong>in</strong>ce the<br />
early 1990’s and the contam<strong>in</strong>ation rema<strong>in</strong>s localized on the Air Force Base. (PAG, 1994).<br />
Downtown Tucson<br />
Groundwater <strong>in</strong> the vic<strong>in</strong>ity <strong>of</strong> downtown Tucson conta<strong>in</strong>s petroleum products and VOCs at<br />
various locations. Diesel fuel is the most widespread contam<strong>in</strong>ant. Chlor<strong>in</strong>ated VOCs such as<br />
TCE and PCE are present <strong>in</strong> more localized areas, <strong>in</strong>clud<strong>in</strong>g the Mission L<strong>in</strong>en site, where PCE<br />
concentrations have been reported at levels as high as 11,000 µg/l (ADWR, 1999). The 7 th Street<br />
25
and Arizona Avenue and Park-Euclid WQARF sites are located with<strong>in</strong> the downtown Tucson<br />
area (ADEQ, 2001).<br />
El Cam<strong>in</strong>o del Cerro WQARF Site<br />
The El Cam<strong>in</strong>o del Cerro WQARF site is located <strong>in</strong> northwest Tucson. The primary<br />
contam<strong>in</strong>ants <strong>of</strong> concern <strong>in</strong>clude PCE, TCE, v<strong>in</strong>yl chloride, and benzene (ADEQ web site,<br />
2001). Nitrate contam<strong>in</strong>ation is also present (PAG, 1994). Groundwater monitor<strong>in</strong>g and field<br />
<strong>in</strong>vestigations are underway. <strong>Pima</strong> <strong>County</strong> is operat<strong>in</strong>g a landfill gas extraction system at the<br />
closed El Cam<strong>in</strong>o del Cerro landfill. VOCs have been removed at a rate <strong>of</strong> 30 to 40 pounds per<br />
week (PAG, 2000b).<br />
Tucson Airport Area Remediation Project (TARP)<br />
This is a federal Superfund site. Groundwater <strong>in</strong> the area is contam<strong>in</strong>ated with TCE, and a pump<br />
and treat remediation system has been <strong>in</strong> operation s<strong>in</strong>ce 1994. Contam<strong>in</strong>ants are be<strong>in</strong>g removed<br />
us<strong>in</strong>g three air stripp<strong>in</strong>g towers. The design rate was 5,800 gpm and the average expected TCE<br />
concentration <strong>of</strong> the <strong>in</strong>fluent was approximately 15-35 µg/l. By the end <strong>of</strong> 1999 the system had<br />
treated approximately 13.4 billion gallons <strong>of</strong> water and had removed 1,400 pounds <strong>of</strong> TCE. This<br />
plant supplies almost 9% <strong>of</strong> Tucson’s total dr<strong>in</strong>k<strong>in</strong>g water supply (PAG, 2000b).<br />
Air Force Plant 44<br />
This location is part <strong>of</strong> the Tucson Area Superfund Site plume, south <strong>of</strong> Los Reales Road <strong>in</strong> the<br />
Tucson metropolitan area. The groundwater contam<strong>in</strong>ation plume beneath the site conta<strong>in</strong>s<br />
chromium and TCE. Remediation at this site began <strong>in</strong> 1987 and uses air strippers with carbon<br />
adsorption and a re-<strong>in</strong>jection system (PAG, 1994).<br />
Los Reales WQARF Site<br />
Groundwater downstream <strong>of</strong> the Los Reales Landfill is contam<strong>in</strong>ated with TCE and PCE <strong>in</strong> a<br />
plume that measured approximately ½ mile wide by ½ mile long. No public water supply wells<br />
have been impacted by this contam<strong>in</strong>ation, which is trapped <strong>in</strong> the upper aquifer. An air stripper<br />
remediation system was <strong>in</strong>stalled to conta<strong>in</strong> the groundwater plumes. The average concentration<br />
<strong>of</strong> TCE <strong>in</strong> the groundwater enter<strong>in</strong>g the treatment system is approximately 7 ppb (PAG, 1994;<br />
PAG 2000a).<br />
Price Service Center<br />
Petroleum contam<strong>in</strong>ated groundwater is present <strong>in</strong> the area <strong>of</strong> the City <strong>of</strong> Tucson’s Price Service<br />
Center. This contam<strong>in</strong>ation resulted from leaks and damage to several underground storage<br />
tanks. The shallow groundwater has had benzene detected at concentrations as high as<br />
30,000 ppb. No public water wells have been impacted by this contam<strong>in</strong>ation (PAG, 1994).<br />
26
Rillito River<br />
§¨¦ I-10 §¨¦ I-19 §¨¦ I-10<br />
Santa Cruz River<br />
TUCSON<br />
Pantano Wash<br />
!(<br />
83<br />
Figure 5. Locations <strong>of</strong> State (WQARF) and Federal Superfund Sites <strong>in</strong> <strong>Pima</strong> <strong>County</strong><br />
WQARF or Superfund Site<br />
Major <strong>Water</strong>course<br />
<br />
0<br />
Major Street<br />
Mounta<strong>in</strong> Range<br />
4 8 12 16 Miles<br />
Data Source: Locations <strong>of</strong> WQARF and Superfund Sites provided electronically<br />
by Arizona Department <strong>of</strong> Environmental <strong>Quality</strong> (ADEQ).<br />
March 2002<br />
27
Silverbell Jail Annex/Miracle Mile WQARF Site<br />
TCE and PCE have been found at concentrations <strong>of</strong> 13.5 ppb and 154 ppb respectively. In<br />
addition, the <strong>in</strong>organic groundwater quality <strong>of</strong> the area is naturally poor with high TDS, sulfate,<br />
and chloride concentrations. High nitrate concentrations have also been present s<strong>in</strong>ce the 1950’s.<br />
This contam<strong>in</strong>ation has impacted two public-supply wells serv<strong>in</strong>g mobile home parks <strong>in</strong> the area.<br />
(PAG, 1994). A pilot remediation project us<strong>in</strong>g a re-circulation well system at Silverbell Landfill<br />
has been <strong>in</strong> use for several years (PAG, 2000b).<br />
Shannon Road-Rillito Creek WQARF Site<br />
PCE was detected <strong>in</strong> the groundwater at this site <strong>in</strong> 1993. Metro <strong>Water</strong> <strong>in</strong>stalled a well head<br />
treatment system on the South Shannon well. Two public supply wells have been impacted. One<br />
owned by the City <strong>of</strong> Tucson has been shut down and the other, owned by a mobile home park,<br />
has been equipped with a carbon treatment system s<strong>in</strong>ce July 1997 (PAG, 2000b).<br />
Other Sites<br />
In addition to the above listed sites, there are a number <strong>of</strong> former landfill sites and underground<br />
storage tank sites that may have impacted the local groundwater. Also, an area encompass<strong>in</strong>g 42<br />
square miles <strong>in</strong> the south Santa Cruz area, which extends from two miles south <strong>of</strong> the Tucson<br />
City limit to just north <strong>of</strong> Green Valley, conta<strong>in</strong>s seven public supply wells that have exceeded<br />
the MCL for nitrate. Historical data <strong>in</strong>dicate the high nitrate concentrations <strong>in</strong> this area<br />
developed between the late 1940’s and the mid-1960s. The nitrate contam<strong>in</strong>ation <strong>in</strong> this area<br />
appears to be a result <strong>of</strong> a comb<strong>in</strong>ation <strong>of</strong> irrigated agriculture, sewage effluent, septic tanks and<br />
animal feed lots (PAG, 1992).<br />
Surface <strong>Water</strong>bodies <strong>Water</strong> <strong>Quality</strong><br />
Stream water quality <strong>in</strong> the higher elevations <strong>of</strong> <strong>Pima</strong> <strong>County</strong> is primarily determ<strong>in</strong>ed by natural<br />
factors. Processes such as chemical weather<strong>in</strong>g <strong>of</strong> bedrock and soils, biological activity <strong>in</strong> soils,<br />
groundwater discharge to streams, and run<strong>of</strong>f determ<strong>in</strong>e the water quality <strong>of</strong> these streams.<br />
Locally, stream water quality may be affected by agriculture, m<strong>in</strong><strong>in</strong>g and urban land use.<br />
Nutrient and dissolved-solids concentrations fluctuate seasonally <strong>in</strong> these streams. The patterns<br />
<strong>of</strong> ra<strong>in</strong>fall and snowmelt account for the seasonal fluctuations <strong>in</strong> concentrations <strong>of</strong> nutrients.<br />
Concentrations <strong>in</strong>crease <strong>in</strong> streams dur<strong>in</strong>g times <strong>of</strong> ra<strong>in</strong>fall and snowmelt run<strong>of</strong>f because the<br />
run<strong>of</strong>f carries nutrients washed <strong>of</strong>f the land surface <strong>in</strong>to the streams. Seasonal patterns <strong>of</strong><br />
dissolved solids are opposite to those <strong>of</strong> nutrients. Dur<strong>in</strong>g periods <strong>of</strong> run<strong>of</strong>f, flow <strong>in</strong> streams is<br />
diluted and the dissolved-solids concentrations are lower. Streams affected by human activities<br />
may have elevated concentrations <strong>of</strong> dissolved solids from a variety <strong>of</strong> activities <strong>in</strong>clud<strong>in</strong>g urban<br />
and agricultural run<strong>of</strong>f. Man made compounds such as pesticides and volatile organic<br />
compounds (VOC) <strong>in</strong> streams are a direct result <strong>of</strong> human activities (USGS, 2000).<br />
29
ADEQ Monitor<strong>in</strong>g<br />
Arizona Department <strong>of</strong> Environmental <strong>Quality</strong> (ADEQ) assessed 281 miles <strong>of</strong> streams and six<br />
lakes <strong>in</strong> the Santa Cruz-Rio Magdalena-Rio Sonoyta <strong>Water</strong>shed, which <strong>in</strong>cludes Santa Cruz<br />
<strong>County</strong> and a large portion <strong>of</strong> eastern <strong>Pima</strong> <strong>County</strong>. This watershed is 11,096 square miles and<br />
makes up about 10% <strong>of</strong> the state’s land. The watershed is a composite <strong>of</strong> two surface water<br />
bas<strong>in</strong>s: the Santa Cruz which flows north to the Gila River, and the Rio Magdalena and Rio<br />
Sonoyta dra<strong>in</strong>ages which flow south <strong>in</strong>to Mexico. In its report, The Status <strong>of</strong> <strong>Water</strong> <strong>Quality</strong> <strong>in</strong><br />
Arizona, Clean <strong>Water</strong> Act Section 305(b) Report 2000, ADEQ tabulated the results <strong>of</strong> the stream<br />
assessments. The data for streams and lakes <strong>in</strong> <strong>Pima</strong> <strong>County</strong> are <strong>in</strong>cluded <strong>in</strong> Appendix A.<br />
ADEQ performs two types <strong>of</strong> assessments: “monitored” and “evaluated.” Monitored<br />
assessments are based on current data that are less than five years old and normally there are at<br />
least four monitor<strong>in</strong>g events with<strong>in</strong> a year. Evaluated assessments are based on less data and<br />
<strong>in</strong>formation. Assessment reliability generally <strong>in</strong>creases with <strong>in</strong>creased quantity and diversity <strong>of</strong><br />
data.<br />
Three lakes, Arivaca Lake, Kennedy Lake, and Lakeside Lake, <strong>in</strong> <strong>Pima</strong> <strong>County</strong> were assessed by<br />
ADEQ. Though none were found to be <strong>in</strong> full support <strong>of</strong> their designated uses, ADEQ<br />
recognized that smaller lakes were more likely to be <strong>in</strong> the partial support or non-support<br />
category. Through its monitored assessment ADEQ found Arivaca Lake to be non-support<strong>in</strong>g <strong>of</strong><br />
its designated use due to high pH, low dissolved oxygen and mercury.<br />
The follow<strong>in</strong>g area streams were monitored or evaluated by ADEQ and determ<strong>in</strong>ed to be <strong>in</strong> full<br />
support <strong>of</strong> their designated uses: Arivaca Creek (headwaters to Altar Wash), Canada del Oro<br />
(headwaters to Big Wash), Cienega Creek (headwaters to Del Ago Dam), Sab<strong>in</strong>o Canyon Creek<br />
(headwaters to the Tanque Verde Creek), Tanque Verde Creek, and Madera Canyon Creek<br />
(headwaters to the Santa Cruz River). Only the Santa Cruz River (Canada del Oro to Guild<br />
Wash) was found to be non-support<strong>in</strong>g due to some <strong>of</strong> the samples <strong>in</strong>dicat<strong>in</strong>g low dissolved<br />
oxygen, but this reach is <strong>in</strong> full support with regard to turbidity.<br />
The State is required to develop water quality improvement plans for any streams and lakes that<br />
have been identified as impaired. The TMDL Program (Total Maximum Daily Load) is a<br />
separate but closely related effort to the <strong>Water</strong> <strong>Quality</strong> Assessment Program. The purpose <strong>of</strong> the<br />
program is to identify the sources and quantities <strong>of</strong> pollutants be<strong>in</strong>g delivered to a waterbody and<br />
to identify the maximum quantities <strong>of</strong> the pollutant that the waterbody can assimilate and still<br />
meet water quality standards. The goal is to develop a plan which identifies how all the various<br />
contributors <strong>of</strong> pollutants can work together to reduce pollutant load<strong>in</strong>g and help get the water<br />
body back <strong>in</strong>to compliance with the water quality standard. <strong>Water</strong>bodies that are scheduled for<br />
development <strong>of</strong> TMDLs are identified on the state’s “water quality limited waters” list, which is<br />
commonly referred to as the “303(d) list”(ADEQ, 2000).<br />
Only one water <strong>in</strong> <strong>Pima</strong> <strong>County</strong> was on the state’s 1998 303(d) list. Arivaca Lake was listed<br />
with mercury as the primary stressor, along with a fish consumption advisory. Arivaca Creek<br />
was de-listed <strong>in</strong> 1998 for dissolved oxygen, which was determ<strong>in</strong>ed to be a natural condition.<br />
ADEQ has additional water quality monitor<strong>in</strong>g data for area streams. The follow<strong>in</strong>g table<br />
<strong>in</strong>cludes selected data from ADEQ’s surface water quality database.<br />
30
Table 5. Selected Stream <strong>Water</strong> <strong>Quality</strong> Data, 1989-2000, From ADEQ Database<br />
Site<br />
Arivaca<br />
Creek at<br />
Ruby Rd<br />
3/23/93<br />
Madera at<br />
Whitehouse,<br />
12/19/90<br />
Tanque<br />
Verde Creek<br />
8/1/89<br />
Sab<strong>in</strong>o Creek<br />
5/13/91<br />
San Pedro<br />
River<br />
8/31/91<br />
Buehman<br />
Canyon<br />
5/18/00<br />
Ca<br />
Total<br />
(mg/l)<br />
Mg<br />
Total<br />
(mg/l)<br />
Na<br />
Total<br />
(mg/l)<br />
K<br />
Total<br />
(mg/l)<br />
Bicarbonate<br />
Total<br />
(mg/l)<br />
SO4<br />
Total<br />
(mg/l)<br />
Cl<br />
Total<br />
(mg/l)<br />
F<br />
Total<br />
(mg/l)<br />
Arsenic<br />
Total<br />
(mg/l)<br />
70.7 9.9 16.2 1.88 265 ND 9.8 0.23 ND 287<br />
71.3 12.6 17.7 1.1 141 100 6.9 0.36
Table 6. Average Values, <strong>Water</strong> <strong>Quality</strong> Data for Selected Streams <strong>in</strong> <strong>Pima</strong> <strong>County</strong><br />
September 1998-June 2000 (PAG, 2001; PAG 2000).<br />
Site<br />
Cienega<br />
Creek<br />
B<strong>in</strong>gham<br />
Cienega<br />
San<br />
Pedro<br />
River<br />
Edgar<br />
Canyon<br />
Ca<br />
dissolved<br />
(mg/l)<br />
Mg<br />
dissolved<br />
(mg/l)<br />
Na<br />
dissolved<br />
(mg/l)<br />
K<br />
dissolved<br />
(mg/l)<br />
Alkal<strong>in</strong>ity<br />
CaCO3<br />
(mg/l)<br />
SO4<br />
dissolved<br />
(mg/l)<br />
Cl<br />
dissolved<br />
(mg/l)<br />
F<br />
dissolved<br />
(mg/l)<br />
Arsenic<br />
dissolved<br />
(mg/l)<br />
109 32 61 5.9 252 257 14 0.57 0.0006 737<br />
64 12 40 1.7 219 55.8 11 1.14 .0043 280<br />
64 16 55 2 222 90.2 18 0.92 0.0022 344<br />
64 15 24 1.1 238 18.6 6.9 0.39 0 287<br />
Notes: 0 = constituent was not detected at the Practical Quantitation Limit (PQL).<br />
mg/l= milligrams per liter<br />
Most <strong>of</strong> the natural surface water sources are located <strong>in</strong> eastern <strong>Pima</strong> <strong>County</strong>. An exception is<br />
the Quitobaquito Spr<strong>in</strong>g and pond, which are located <strong>in</strong> Organ Pipe National Monument near<br />
Lukeville Arizona and the Mexican border. <strong>Water</strong> quality data collected from several aquatic<br />
studies are shown below.<br />
Table 7. Chemical Constituents <strong>in</strong> <strong>Water</strong> at Quitobaquito, Arizona. From: Description<br />
and Conservation Status <strong>of</strong> Cypr<strong>in</strong>odan macularius eremus. A New Subspecies <strong>of</strong> Pupfish<br />
from Organ Pipe Cactus National Monument, Arizona. (Miller and Fuiman, 1987).<br />
*Parameter<br />
Quitobaquito Pond,<br />
1982,<br />
Quitobaquito<br />
Pond, 1963, 1964<br />
Quitobaquito<br />
Spr<strong>in</strong>g, 1982<br />
Quitobaquito Spr<strong>in</strong>g,<br />
1963-64<br />
TDS 820 670<br />
TSS
Stormwater Run<strong>of</strong>f <strong>Water</strong> <strong>Quality</strong><br />
For the purpose <strong>of</strong> this report PAG reviewed historical stormwater quality data from the 1996<br />
<strong>Water</strong> <strong>Quality</strong> Assessment for the Tucson Active Management Area Northwest Replenishment<br />
Program Feasibility Study, and NPDES stormwater monitor<strong>in</strong>g reports submitted by the City <strong>of</strong><br />
Tucson and <strong>Pima</strong> <strong>County</strong> to the EPA.<br />
Historical Data<br />
The Lower Santa Cruz River<br />
For the Lower Santa Cruz River, PAG (1991) reported water quality data for a sample collected<br />
by ADEQ on October 6, 1989, from the Santa Cruz River and Congress Street Bridge.<br />
Concentrations <strong>of</strong> the major constituents are shown on the follow<strong>in</strong>g table.<br />
Table 8. Stormwater <strong>Quality</strong> Data for the Santa Cruz River at Congress Street Bridge<br />
Collected by ADEQ October 6, 1989 (PAG, 1991).<br />
Parameter<br />
Concentration (mg/l) milligrams per liter<br />
Calcium 17.6<br />
Magnesium 2.32<br />
Sodium 9.1<br />
Potassium 9.3<br />
Bicarbonate 75<br />
Chloride 1.1<br />
Sulfate 10<br />
NO2+NO3 0.61<br />
TDS (total dissolved solids) 90<br />
TSS (total suspended solids) 10,600<br />
In addition Hard<strong>in</strong>g Lawson Associates (1987) reported water quality data for a Santa Cruz River<br />
sample collected upstream <strong>of</strong> the Roger Road treatment plant <strong>in</strong> 1985. The results were as<br />
follows: Bicarbonate 104 mg/l, TDS 230 mg/l, and TSS 11,724 mg/l. No other data for this<br />
sample were reported.<br />
33
The Rillito Creek Bas<strong>in</strong><br />
<strong>Water</strong> <strong>Quality</strong> data (PAG, 1996) for the Rillito Creek bas<strong>in</strong> <strong>in</strong>cluded concentrations <strong>of</strong> major<br />
ions, nutrients, trace metals, suspended sediments and organics reported by the USGS for the<br />
years 1986-1993. Slightly less than two thirds <strong>of</strong> the samples were collected automatically.<br />
Automatic samplers were programmed to activate when the flow stage exceeded a threshold<br />
value <strong>of</strong> 0.2 feet <strong>in</strong> 2 m<strong>in</strong>utes. A sample was collected every 5 m<strong>in</strong>utes dur<strong>in</strong>g a ris<strong>in</strong>g stage, and<br />
every 10 m<strong>in</strong>utes dur<strong>in</strong>g a fall<strong>in</strong>g stage. The samples were composited. Samples were not<br />
collected on a regular basis (e.g. once a month), or at a consistent time <strong>of</strong> day, presumably<br />
because the frequency <strong>of</strong> run<strong>of</strong>f events <strong>in</strong> the Tucson area is highly irregular. However, the data<br />
represented nearly equal numbers <strong>of</strong> w<strong>in</strong>ter and summer storms (PAG, 1996). The data are<br />
shown on Tables 9 and 10.<br />
Table 9. 1986-1993 Stormwater <strong>Quality</strong> Data for Tanque Verde Creek at Sab<strong>in</strong>o Canyon<br />
Road (USGS, 1995; USGS, 1994)<br />
Constituent Average (mg/l)* M<strong>in</strong>imum (mg/l) Maximum (mg/l)<br />
Calcium 10.4 4.3 25<br />
Magnesium 1.6 0.98 4.6<br />
Sodium 6.0 4.1 10<br />
Potassium 2.2 0.7 6.5<br />
Alum<strong>in</strong>um (total) 117 0.47 410<br />
Bicarbonate 34 14 68<br />
Chloride 4.0 2.1 7.2<br />
Sulfate 9.9 4.5 16<br />
Nitrate 0.3 0.07 0.81<br />
TDS 93 41 205<br />
TOC 84 8.8 240<br />
TSS 2891 22 10300<br />
*mg/l= milligrams per liter.<br />
34
Table 10. 1986-1993 Stormwater <strong>Quality</strong> Data for Rillito Creek at Dodge Boulevard<br />
(USGS, 1995;USGS 1994).<br />
Constituent Average (mg/l)* M<strong>in</strong>imum (mg/l) Maximum (mg/l)<br />
Calcium 15 8.2 46<br />
Magnesium 1.9 0.8 5.9<br />
Sodium 6.6 1.9 15<br />
Potassium 2.5 0.8 5.1<br />
Alum<strong>in</strong>um (total) 195 44 550<br />
Bicarbonate 53 28 121<br />
Chloride 3.8 1.5 12<br />
Sulfate 13 4.6 52<br />
Nitrate 0.5 0.18 1.3<br />
TDS 100 19 243<br />
TOC 117 19 210<br />
TSS 12089 21 36700<br />
*mg/l= milligrams per liter<br />
Brown and Caldwell (1984) and CH2M Hill and others (1988) have reported that stormwater<br />
run<strong>of</strong>f can conta<strong>in</strong> elevated levels <strong>of</strong> trace metals. Some <strong>of</strong> the undissolved metals <strong>in</strong> the<br />
stormwater samples (particularly alum<strong>in</strong>um, which is abundant <strong>in</strong> clays) may be naturally<br />
occurr<strong>in</strong>g <strong>in</strong> sediments that are eroded dur<strong>in</strong>g storm events. These sediments are carried<br />
downstream <strong>in</strong> suspension, and metals conta<strong>in</strong>ed <strong>in</strong> (or sorbed onto) these sediments are <strong>in</strong>cluded<br />
<strong>in</strong> the analysis <strong>of</strong> total metals (PAG, 1996).<br />
Municipal NPDES Monitor<strong>in</strong>g Data<br />
The City <strong>of</strong> Tucson’s Municipal Stormwater Permit stipulates that the City will implement the<br />
stormwater monitor<strong>in</strong>g program as described <strong>in</strong> the City’s October 1996 permit application.<br />
EPA amended the monitor<strong>in</strong>g program slightly by add<strong>in</strong>g the chemical DDE to the list <strong>of</strong><br />
pollutants for which sampl<strong>in</strong>g and analysis was to be conducted. The purpose <strong>of</strong> the monitor<strong>in</strong>g<br />
program was to develop a substantial local database <strong>of</strong> land-use-specific stormwater quality data,<br />
and to develop a focused management program (City <strong>of</strong> Tucson, 1999).<br />
Analysis <strong>of</strong> 15 constituents is required under the monitor<strong>in</strong>g program approved for the City’s<br />
NPDES Municipal Stormwater permit (permit # AZS000001) and <strong>in</strong>cludes the follow<strong>in</strong>g<br />
constituents: Arsenic (As), copper (Cu), lead (Pb), z<strong>in</strong>c (Zn), biochemical oxygen demand<br />
(BOD), chemical oxygen demand (COD), nitrogen as nitrite, nitrogen as nitrate, total dissolved<br />
solids (TDS), total suspended solids (TSS), total kjeldahl nitrogen (TKN), DDE, oil and grease,<br />
total phenols and total phosphorous. Under the approved monitor<strong>in</strong>g program each sampl<strong>in</strong>g site<br />
was automated <strong>in</strong> 1999 to allow better response to storm events with the goal <strong>of</strong> sampl<strong>in</strong>g each<br />
site once dur<strong>in</strong>g the w<strong>in</strong>ter ra<strong>in</strong>y season and once dur<strong>in</strong>g the summer ra<strong>in</strong>y season. Because the<br />
automated units were not yet operat<strong>in</strong>g accord<strong>in</strong>g to EPA protocol manual, samples were<br />
manually collected for the 1998-99 report<strong>in</strong>g period (City <strong>of</strong> Tucson, 1999).<br />
Stormwater was monitored at five locations represent<strong>in</strong>g different land uses typical to Tucson.<br />
They <strong>in</strong>clude: s<strong>in</strong>gle family residential site, multi-family residential site, commercial site,<br />
35
<strong>in</strong>dustrial site, and a mixed-use site. Table 11 summarizes the analyses results for the events<br />
sampled dur<strong>in</strong>g the 1998-99 fiscal year.<br />
Table 11. Fiscal Year 1998-99 Monitor<strong>in</strong>g Results for City <strong>of</strong> Tucson Stormwater.<br />
Municipal Stormwater Annual Report, City <strong>of</strong> Tucson (City <strong>of</strong> Tucson, 1999).<br />
DATE 7/22/98 7/31/98 4/01/99 8/05/98 9/16/98 10/21/98 MAX MIN<br />
Facility Mfr Sfr Sfr Mxu Ind Com<br />
Ra<strong>in</strong>fall (<strong>in</strong>) 0.55 0.50 1.20 0.15 0.10 0.10 1.20 0.10<br />
Duration (hours) 3 hours 2 hours<br />
20 m<strong>in</strong><br />
16<br />
hours<br />
3 hours 2 hours 1 hour<br />
20 m<strong>in</strong>.<br />
16 hour 1 hour<br />
20 m<strong>in</strong><br />
Last Ra<strong>in</strong> (days) 4 9 115 3 12 47 115 3<br />
Temperature 25.9 27.1 N/T N/T 27.5 18.2 27.5 18.2<br />
pH 7.1 7.4 7.2 6.7 6.7 6.5 7.4 6.5<br />
Total Flow (gal) 151,814 92,111 356,823 269,451 148,672 21,790 356,823 21,790<br />
As (mg/l)
Table 12. Monitor<strong>in</strong>g Results for <strong>Pima</strong> <strong>County</strong> Stormwater, Second Report<strong>in</strong>g Period,<br />
September 2000. From the Third Annual Report, <strong>Pima</strong> <strong>County</strong> NPDES<br />
Stormwater Discharge Permit (<strong>Pima</strong> <strong>County</strong>, 2000).<br />
Facility Site 1 Site 1 Site 1 Site2A Site 3 Site 3 Site 3 Site 4 Site 4 Site 4 Site 5 Site 5<br />
Date 7/14/99 3/6/00 6/22/00 7/6/99 7/14/99 3/6/00 6/22/00 7/14/99 3/6/00 6/22/00 7/5/99 6/19/00<br />
H2O<br />
29.3 9.6 23.0 24.0 31.3 10.5 24.5 30.0 10.4 26.4 27.2 22.2<br />
Temperature on<br />
arrival °C<br />
H2O<br />
- 9.0 - 23.9 - 10.1 27.1 - 11.1 25.7 27.8 25.1<br />
Temperature + 1<br />
hour °C<br />
H2O<br />
- - - - - 9.7 - - 11.5 25.8 27.9 29.8<br />
Temperature +2<br />
hours °C<br />
H2O<br />
30.7 9.2 23.3 24.6 29.6 9.7 25.6 28.4 11.6 25.6 - 30.7<br />
Temperature +<br />
3 hours °C<br />
pH at arrival s.u. 9.07 6.97 8.03 7.94 6.58 7.43 7.79 7.32 7.39 7.76 8.03 8.65<br />
pH + 1 hour s.u. - 7.45 - 7.91 - 7.55 7.05 - 7.44 7.67 7.84 8.06<br />
pH+ 2 hours s.u. - - - - - 7.51 - - 7.54 7.81 7.94 7.90<br />
pH + 3 hours s.u. 8.16 7.5 7.42 7.25 7.72 7.45 7.15 8.24 7.46 7.95 - 7.90<br />
Fecal coliform on 3000 500 3000 160000 3000 11000 900 9000 17000 50000 5000 900<br />
arrival<br />
Mpn/100ml<br />
Fecal coliform +1 - - - - - - - - - - - -<br />
hour Mpn/100ml<br />
Fecal coliform + - - - - - - - - - - - -<br />
2 hours<br />
Mpn/100ml<br />
Fecal coliform + 220 1300 2400 30000 1700 30000 1600 2400 1700 900 300 16000<br />
3 hours<br />
MPn/100ml<br />
Cu (µg/l)(total) 183 13.6 21.6 21.5 27.9 18.4 31.9 34.0 29.8 50.0 81.2 107<br />
Pb (µg/l)(total) 210 ND 17.4 T ND ND T T T T 93.3 136<br />
Zn (µ/l)(total) 476 36.2 48.9 78.6 161 129 183 46.5 165 155 214 305<br />
Hardness 876 46.1 57.5 41.1 32.2 27.7 54.3 88 36.0 58.0 285 272<br />
(calculated) mg/l<br />
TSS mg/l 5631 49 273 125 55 29 32 120 65 52 712 596<br />
4,4-DDE (µg/l) ND ND ND ND ND ND ND ND ND ND ND ND<br />
s.u.-standard units, °C- degrees Celsius, Mpn/100mg/l- most probable number per 100mg/l, mg/lmilligrams<br />
per liter, µg/l-micrograms per liter, --- no measurement taken or no sample collected, ND- not<br />
detected at or above the laboratory detection limit. T-trace<br />
Site 1-Residential, low density<br />
Site 2A- Residential, medium density<br />
Site 3- Residential, high density<br />
Site 4- Commercial<br />
Site 5- Industrial<br />
37
§¨¦ I-10<br />
Rillito River<br />
UTpq<br />
Uv<br />
Uv<br />
UTpqUTpq<br />
UTpq<br />
Santa Cruz Rive r<br />
Uv<br />
TUCSON<br />
Pantano Wash<br />
Uv<br />
Uv<br />
UTpq<br />
§¨¦ I-19<br />
§¨¦ I-10<br />
Figure 6. Stormwater Sampl<strong>in</strong>g Locations <strong>in</strong> Eastern <strong>Pima</strong> <strong>County</strong><br />
<br />
0<br />
Uv<br />
UTpq<br />
Sampl<strong>in</strong>g Site (City <strong>of</strong> Tucson)<br />
Sampl<strong>in</strong>g Site (<strong>Pima</strong> <strong>County</strong>)<br />
Major <strong>Water</strong>course<br />
Major Street<br />
Mounta<strong>in</strong> Range<br />
3 6 9 12 Miles<br />
Data Source: Stormwater sampl<strong>in</strong>g locations provided by <strong>Pima</strong> <strong>County</strong> Department <strong>of</strong><br />
Environmental <strong>Quality</strong> and City <strong>of</strong> Tucson DOT Stormwater Managment Division.<br />
March 2002<br />
39
CAP <strong>Water</strong> <strong>Quality</strong><br />
The CAP water delivered to the Tucson area is a mixture <strong>of</strong> Colorado River <strong>Water</strong>, Bill Williams<br />
River water, and Agua Fria River water. However, the Colorado River water is the most<br />
significant source. The CAP water delivered to the Tucson area is a sodium-sulfate water type<br />
and with the exception <strong>of</strong> turbidity and total coliform bacteria, which is expected <strong>in</strong> surface<br />
water, meets all primary dr<strong>in</strong>k<strong>in</strong>g water standards established by the USEPA and ADEQ<br />
(Tucson <strong>Water</strong>, 2000b).<br />
Total dissolved solids (TDS) concentrations <strong>in</strong> Colorado River water between 1972 and 1999<br />
ranged between 535 and 747 and averaged 644 mg/l. Review <strong>of</strong> the data <strong>in</strong>dicates the TDS<br />
concentration <strong>in</strong> Colorado River water is generally lower dur<strong>in</strong>g periods <strong>of</strong> abundant<br />
precipitation with<strong>in</strong> the Colorado River watershed (Tucson <strong>Water</strong>, 2000b).<br />
Analytical results for common constituents for all CAP water samples collected at the pump<br />
station at the CAP aqueduct (Tucson <strong>Water</strong> sample po<strong>in</strong>t 713) between October 1997 and April<br />
2000 are summarized on Table13. The data were collected by Tucson <strong>Water</strong>, which conducts<br />
extensive monitor<strong>in</strong>g <strong>of</strong> CAP water delivered to the Clearwater Renewable Resource Facility.<br />
CAP water quality was also monitored at the <strong>Pima</strong> M<strong>in</strong>e Road Recharge Project dur<strong>in</strong>g the year<br />
2000. Analytical results <strong>of</strong> the source water samples did not <strong>in</strong>dicate the presence <strong>of</strong> any analyte<br />
at concentrations exceed<strong>in</strong>g the Arizona Aquifer <strong>Water</strong> <strong>Quality</strong> Standards (AWQS). No<br />
pesticides or herbicides were detected above the laboratory report<strong>in</strong>g limits. Results <strong>of</strong> the<br />
general m<strong>in</strong>erals, and physical parameters (except temperature) were remarkably consistent<br />
among the three sampl<strong>in</strong>g periods conducted <strong>in</strong> 2000 (CAWCD, 2001). Results <strong>of</strong> the source<br />
water samples for m<strong>in</strong>eral and physical parameters are shown on Table14.<br />
41
Table 13. Summary <strong>of</strong> <strong>Water</strong> <strong>Quality</strong> for Untreated CAP <strong>Water</strong> at the Clearwater Site,<br />
October 1997-April 2000 (Tucson <strong>Water</strong>, 2000b).<br />
Constituent<br />
(mg/l)<br />
Mean Std. Dev. M<strong>in</strong>. Max. MCL No.<strong>of</strong><br />
samples<br />
Cations (mg/l)<br />
Calcium 66 4.53 56 75 - 14<br />
Magnesium 28 3.05 26 38 - 14<br />
Potassium 5.0 0.76 4.5 7.5 - 14<br />
Sodium 92 12.8 85 135 - 14<br />
Anions (mg/l)<br />
Bicarbonate* 133 24.4 70 156 - 18<br />
Bromide @0.015 0.041
Table 14. <strong>Water</strong> <strong>Quality</strong> Monitor<strong>in</strong>g Results, Source <strong>Water</strong>, <strong>Pima</strong> M<strong>in</strong>e Road Recharge<br />
Project M<strong>in</strong>eral and Physical Parameters (CAWCD, 2001).<br />
Parameter Units AWQS<br />
limit<br />
Sample date<br />
01/06/2000<br />
Results<br />
Sample Date<br />
03/03/2000<br />
Results<br />
Sample Date<br />
10/19/2000<br />
Results<br />
Alkal<strong>in</strong>ity, total mg/l 109 110 104<br />
Alkal<strong>in</strong>ity, bicarbonate mg/l 133 133 126<br />
Alkal<strong>in</strong>ity, Carbonate mg/l 0.864 1.72 1.30<br />
Chloride mg/l 76.3 72.2 88.7<br />
Fluoride mg/l 4 0.32 0.31 0.36<br />
Nitrate (as N) mg/l 10 ND ND ND<br />
pH Std unit 8.0 8.3 8.2<br />
Specific Conductance Us/cm 915 855 905<br />
Sulfate mg/l 253 236 267<br />
Total Dissolved Solids mg/l 530 530 650<br />
Temp (field) °F 65.5 74.1 nm<br />
Alum<strong>in</strong>um, dissolved mg/l ND ND ND<br />
Antimony, dissolved mg/l 0.006 ND ND ND<br />
Arsenic, dissolved mg/l 0.05 0.0045 0.0025 0.004<br />
Barium, dissolved mg/l 2 0.066 0.091 0.105<br />
Beryllium, dissolved mg/l 0.004 ND ND ND<br />
Cadmium, dissolved mg/l 0.005 ND ND ND<br />
Calcium mg/l 120* 68 62<br />
Chromium, dissolved mg/l 0.1 ND 0.0041 ND<br />
Copper, dissolved mg/l ND 0.0037 0.021<br />
Iron, dissolved mg/l ND ND ND<br />
Lead, dissolved mg/l 0.05 0.019 ND 0.66<br />
Magnesium mg/l 18.1* 29 31<br />
Mercury, dissolved mg/l 0.002 ND ND ND<br />
Nickel, dissolved mg/l 0.01 ND 0.005 ND<br />
Potassium mg/l 3.5* 4.1 5.5<br />
Selenium, dissolved mg/l 0.05 ND ND ND<br />
Silver, dissolved mg/l ND ND ND<br />
Sodium, dissolved mg/l 51.5* 84 100<br />
Thallium, dissolved mg/l 0.002 ND ND ND<br />
Z<strong>in</strong>c, dissolved mg/l 0.14 0.015 0.088<br />
TOC mg/l 0.9 2.8 3<br />
nm=not measured Nd= Not detected above Laboratory report<strong>in</strong>g limit<br />
* results are questionable for these analytes, laboratory results appear to have been switched with another<br />
sample but could not be confirmed by the laboratory.<br />
43
Treated Wastewater <strong>Water</strong> <strong>Quality</strong><br />
Roger and Ina Road Effluent<br />
The Roger Road Wastewater Treatment Facility (WWTF) and the Ina Road <strong>Water</strong> Pollution<br />
Control Facility (WPCF) are required to monitor for a number <strong>of</strong> parameters to comply with<br />
NPDES (1999) and Aquifer Protection Permits (2001). These monitor<strong>in</strong>g requirements,<br />
provided by <strong>Pima</strong> <strong>County</strong> Wastewater Management Department, are shown on Tables 15 and 16.<br />
Table 15. Roger Road WWTF Monitor<strong>in</strong>g Requirements<br />
Daily Monthly Bi-monthly Quarterly<br />
BOD Enteric Virus As, Cd, Cu, Cr 1,1,1-TCA<br />
TSS Acute Toxicity Cyanide<br />
Fecal Coliform Chronic Toxicity Pb, Hg, Se, Ag, Zn<br />
Settleable Solids Alkal<strong>in</strong>ity phenols<br />
Residual Chlor<strong>in</strong>e<br />
pH<br />
phthalates<br />
methylene chloride<br />
chlor<strong>of</strong>orm<br />
PCE, PCA<br />
Table 16. Ina Road WPCF Monitor<strong>in</strong>g Requirements<br />
Daily Monthly Bi-monthly<br />
BOD Enteric Virus As, Cd, Cu, Cr<br />
TSS Acute Toxicity Cyanide<br />
Fecal Coliform Chronic Toxicity Pb, Hg, Se, Ag, Zn<br />
Settleable Solids Alkal<strong>in</strong>ity phenols<br />
Residual Chlor<strong>in</strong>e<br />
pH<br />
PCE<br />
Total Ammonia<br />
Temperature<br />
Dissolved Oxygen<br />
The data collected from the <strong>County</strong>'s monitor<strong>in</strong>g have been summarized <strong>in</strong> several previous<br />
studies, <strong>in</strong>clud<strong>in</strong>g those by PAG (1994b, 1996) and Malcolm Pirnie (1994). In addition, more<br />
recent monitor<strong>in</strong>g data were provided by <strong>Pima</strong> <strong>County</strong> Wastewater Management Department for<br />
this report; these data <strong>in</strong>cluded <strong>in</strong>formation summarized from year 2000 discharge monitor<strong>in</strong>g<br />
reports. The recent data, shown on Table 17 and 18, <strong>in</strong>dicate that the effluent water quality is<br />
well with<strong>in</strong> the NPDES and APP permit limits.<br />
45
Table 17. Roger Road Wastewater Treatment Facility Discharge Monitor<strong>in</strong>g Report<br />
Summarized Information Year 2000 (PCWMD, 2001a).<br />
Constituent<br />
(Units)*<br />
Permit Limit<br />
1 st Quarter<br />
Averages<br />
Jan- Mar<br />
2 nd Quarter<br />
Averages<br />
Apr-June<br />
3 rd Quarter<br />
Averages<br />
July-Sept<br />
4 th Quarter<br />
Averages<br />
Oct-Dec<br />
Flow (MGD) Up to 41 26.3 23.2 28.0 29.2<br />
Suspended 4,654 2,217 2,090 1,470 2,247<br />
Solids (Kg/day)<br />
Suspended 45 25 30 16 23.5<br />
Solids (mg/l)<br />
Fecal Coliform 200 4 16 35 12<br />
(#/100ml)<br />
pH 6.5 - 9.0 7.6 7.6 7.6 7.6<br />
Dis<strong>in</strong>fectant 0.5 0.22 0.07 0.15 0.09<br />
Residual<br />
(mg/l)<br />
*MGD- Million gallons per day, Kg/day- Kilograms per day, mg/l- Milligrams per liter<br />
#/100 ml- counts per 100 milliliters.<br />
Table 18. Ina Road <strong>Water</strong> Pollution Control Facility Discharge Monitor<strong>in</strong>g Report<br />
Summarized Information Year 2000 (PCWMD, 2001a).<br />
Constituents<br />
(Units)*<br />
Permit Limits<br />
1 st Quarter<br />
Averages<br />
Jan - Mar<br />
2 nd Quarter<br />
Averages<br />
Apr - Jun<br />
3 rd Quarter<br />
Averages<br />
Jul - Sept<br />
4 th Quarter<br />
Averages<br />
Oct-Dec<br />
Flow (MGD) Up to 25 22.5 23.1 22.1 24.3<br />
Suspended 2,839 1,516 1,398 1,151 2,103<br />
Solids (Kg/day)<br />
Suspended<br />
Solids (mg/l)<br />
45 19 18 16 31<br />
Fecal Coliform<br />
(#/100ml)<br />
200 5 14 31 28<br />
pH 6.5 - 9.0 7.1 7.1 7.2 7.2<br />
Dis<strong>in</strong>fectant 0.5 0.30 0.44 0.15 0.35<br />
Residual (mg/l)<br />
*MGD- Million gallons per day, Kg/day- Kilograms per day, mg/l- Milligrams per liter<br />
#/100 ml- counts per 100 milliliters.<br />
Appendix B <strong>in</strong>cludes priority pollutant quarterly sampl<strong>in</strong>g results for the Roger Road and Ina<br />
Road facilities. Most <strong>of</strong> the parameters that the county tests for are not detected <strong>in</strong> the effluent<br />
water samples. When a parameter is detected the result is compared to the water quality<br />
standard. Tables 19 and 20 lists those compounds that were detected <strong>in</strong> the quarterly monitor<strong>in</strong>g<br />
dur<strong>in</strong>g 2000.<br />
46
Table 19. Quarterly Priority Pollutant Organic Compounds Detected <strong>in</strong> Effluent from Ina<br />
Road WPCF, 2000 (PCWMD, 2001a).<br />
Parameter<br />
Ina Road<br />
number <strong>of</strong><br />
samples<br />
detected<br />
Ina Road Results<br />
mean – max. µg/l<br />
<strong>Water</strong> <strong>Quality</strong><br />
Standard<br />
Chlor<strong>of</strong>orm 4 <strong>of</strong> 4 1.6- 2.0 1400 No<br />
1,4-Dichlorobenzene 4 <strong>of</strong> 4 4.0-6.4 1880 No<br />
Methylene Chloride 4 <strong>of</strong> 4
Additional sampl<strong>in</strong>g data are available <strong>in</strong> ADEQ's Year 2000 305(b) report and 1998 <strong>Water</strong><br />
<strong>Quality</strong> Limited <strong>Water</strong>s 303(d) List, and the United States Geological Survey's 2000 report<br />
<strong>Water</strong> <strong>Quality</strong> <strong>in</strong> the Central Arizona Bas<strong>in</strong>s, 1995 - 98. These data are for the effluent<br />
dependent reach <strong>of</strong> the Santa Cruz River downstream from the treatment facilities. Stressors <strong>of</strong><br />
concern noted <strong>in</strong> this literature <strong>in</strong>cluded turbidity and dissolved oxygen, with the standard for<br />
dissolved oxygen be<strong>in</strong>g exceeded <strong>in</strong> 6 <strong>of</strong> 12 samples collected by the USGS and the standard for<br />
turbidity be<strong>in</strong>g exceeded <strong>in</strong> only 1 <strong>of</strong> 12 samples. In its 1998 303(d) report, ADEQ de-listed this<br />
reach <strong>of</strong> the Santa Cruz, not<strong>in</strong>g that only one sample had exceeded the turbidity standard.<br />
Although the USGS (2000) suggested that the quality <strong>of</strong> effluent-dependent streams, <strong>in</strong>clud<strong>in</strong>g<br />
low dissolved oxygen, limits restoration <strong>of</strong> <strong>in</strong> stream communities and presents a challenge for<br />
fish survival, they also noted that these streams provide a variety <strong>of</strong> benefits, <strong>in</strong>clud<strong>in</strong>g riparian<br />
communities with a high level <strong>of</strong> terrestrial plant and animal diversity. This observation is<br />
supported by literature available from <strong>Pima</strong> <strong>County</strong>'s <strong>Water</strong> <strong>Quality</strong> Research Project, which<br />
seeks to identify appropriate water quality standards for ephemeral and effluent-dependent<br />
streams <strong>in</strong> the arid western United States (PCWMD, 2001).<br />
Additional data for surface water samples collected from 10 locations <strong>in</strong> the Santa Cruz River<br />
downstream from the two wastewater treatment facilities dur<strong>in</strong>g the year 2001, <strong>in</strong>dicate<br />
acceptable levels <strong>of</strong> dissolved oxygen. The results are shown on Table 21.<br />
Also, extensive monitor<strong>in</strong>g at three locations <strong>in</strong> the effluent dependent Santa Cruz River was<br />
conducted over a 32 month period between 1992 and 1994. The results <strong>in</strong>dicated acceptable<br />
dissolved oxygen levels. The samples were collected at the Ina Road outfall, the Cortaro Road<br />
Bridge, and the Avra Valley Road Bridge. Out <strong>of</strong> the 228 DO samples collected, only two<br />
samples showed a concentration <strong>of</strong> DO less than 3.0 mg/l. Those results were 2.9 mg/l and 2.8<br />
mg/l. (PCWMD, 2000).<br />
48
Table 21. Summary <strong>of</strong> Dissolved Oxygen Field Measurements <strong>in</strong> the Santa Cruz River<br />
(PCWMD, 2001a).<br />
Sample<br />
Location<br />
Sample Date<br />
# <strong>of</strong> Miles<br />
downstream from<br />
Roger Rd WWTP<br />
# <strong>of</strong> Miles<br />
downstream from<br />
Ina Road WPCF<br />
SC-01 1/24/01<br />
8/13/01<br />
0.60 -- 5.36<br />
5.47<br />
SC-02 2/28/01<br />
8/13/01<br />
2.93 -- 8.43<br />
4.83<br />
SC-03 1/24/01<br />
2/28/01<br />
8/13/01<br />
5.93 0.08 7.49<br />
10.13<br />
5.18<br />
SC-04 8/13/01 7.70 1.85 3.28<br />
SC-05 1/24/01<br />
8/14/01<br />
8.94 3.09 5.36<br />
4.83<br />
SC-06 8/14/01 10.02 4.17 5.05<br />
SC-07 1/24/01<br />
8/17/01<br />
12.11 6.26 6.81<br />
4.56<br />
SC-08 2/13/01<br />
5/10/01<br />
8/16/01<br />
13.23 7.38 6.58<br />
7.08<br />
4.31<br />
SC-09 2/13/01<br />
5/10/01<br />
8/16/01<br />
SC-10 2/13/01<br />
5/10/01<br />
8/16/01<br />
16.65 10.80 6.73<br />
8.99<br />
8.51<br />
17.93 12.08 7.92<br />
8.97<br />
7.88<br />
Dissolved Oxygen<br />
(mg/l)<br />
Note: Samples are collected as a grab sample from a free flow portion <strong>of</strong> the stream. Each sample<br />
location is adjacent to groundwater monitor well locations.<br />
49
Table 22 shows results from the year 2000 effluent sampl<strong>in</strong>g for metals at the Roger Road and<br />
Ina Road wastewater treatment facilities.<br />
Table 22. Priority Pollutant- Metals, Quarterly Sampl<strong>in</strong>g for 2000 (PCWMD, 2001a).<br />
Parameter<br />
Ina Road WPCF<br />
12 month mean<br />
mg/l<br />
Ina Road<br />
WPCF<br />
12 month max.<br />
mg/l<br />
Roger Road WWTP<br />
12 month mean<br />
mg/l<br />
Roger Road<br />
WWTP<br />
12 month max<br />
mg/l<br />
Antimony
Reclaimed <strong>Water</strong><br />
Reclaimed water is ideally suited for turf irrigation and other commercial and <strong>in</strong>dustrial uses<br />
(Tucson <strong>Water</strong>, 2001; PAG, 1994a). Under a state wastewater reuse permit the reclaimed water<br />
is monitored for flow, turbidity, fecal coliform, pH, enteric virus, and Ascaris lumbricoides<br />
(Dotson, 2001). <strong>Water</strong> is sampled at a po<strong>in</strong>t that is representative <strong>of</strong> the quality <strong>of</strong> water<br />
received by the reclaimed water customers. The reclaimed water has a higher TDS concentration<br />
than secondary effluent. This is due <strong>in</strong> part to mix<strong>in</strong>g with groundwater at the facility, where<br />
background TDS levels are higher than most Tucson <strong>Water</strong> wellfields<br />
(PAG, 1994a). Tables 23 and 24 present data provided by Tucson <strong>Water</strong> for this sample po<strong>in</strong>t.<br />
All <strong>of</strong> the data are with<strong>in</strong> permitted limits.<br />
Table 23. Average Values, <strong>Water</strong> <strong>Quality</strong> Data, Tucson <strong>Water</strong> Reclaim System,<br />
January--July 2001. Data from Tucson <strong>Water</strong>.<br />
Constituent Average No. <strong>of</strong> Samples<br />
Total Dissolved Solids 657 mg/l 6<br />
Total Kjeldahl Nitrogen 10.09 mg/l 6<br />
Total Organic Carbon 7.75 mg/l 6<br />
Total Suspended Solids 1.6 mg/l* 7<br />
Turbidity 3.28 NTU 6<br />
Ammonia as N 6.29 mg/l 6<br />
Nitrate as N 3.87 mg/l 7<br />
Chloride 107.43 mg/l 7<br />
pH 7.7 su 6<br />
Conductivity 1012.66 umhos/cm 6<br />
Fluoride 0.9 7<br />
Potassium 8.2 mg/l 2<br />
Phosphate as P 1.52 mg/l 6<br />
Sulfate 120.8 7<br />
Calcium 59.5 2<br />
Total Alkal<strong>in</strong>ity 247 3<br />
Sodium 130 mg/l 2<br />
*- This value calculated us<strong>in</strong>g a value <strong>of</strong> zero for one sample with a result <strong>of</strong>
Table 24. Analytical Results for Reclaimed <strong>Water</strong>, Sample Dates January 4, 2001 and<br />
April 12, 2001. Data provided by Tucson <strong>Water</strong>.<br />
Constituent (mg/l) Sample Date 1/4/01 Sample Date 4/12/01<br />
Alum<strong>in</strong>um, Total
Summary and Conclusions<br />
Summary<br />
This report summarizes general f<strong>in</strong>d<strong>in</strong>gs about water sources and their quality <strong>in</strong> <strong>Pima</strong> <strong>County</strong>.<br />
<strong>Water</strong> sources <strong>in</strong> <strong>Pima</strong> <strong>County</strong> <strong>in</strong>clude groundwater, CAP water, treated wastewater, stormwater<br />
run<strong>of</strong>f, and perennial and <strong>in</strong>termittent surface waterbodies.<br />
General water quality <strong>in</strong> <strong>Pima</strong> <strong>County</strong> is summarized on the follow<strong>in</strong>g table. Mean values are<br />
presented for each constituent. Reclaimed water has the highest TDS <strong>of</strong> the water sources, with<br />
a mean value <strong>of</strong> 657 mg/l. <strong>Water</strong> from stormwater has the lowest TDS, with a mean value <strong>of</strong> 93<br />
mg/l. Mean hardness values for the CAP water are higher than well water with CAP water at 280<br />
mg/l as CaCO3 and well water hav<strong>in</strong>g a mean value <strong>of</strong> 119 mg/l as CaCO3 (PAG, 1994).<br />
Table 25. Average <strong>Water</strong> <strong>Quality</strong> Data (mg/l) for Selected Tucson Area <strong>Water</strong> Sources<br />
Constituent<br />
Tucson<br />
<strong>Water</strong> 2001<br />
Systemwide<br />
average*<br />
Comb<strong>in</strong>ed<br />
Effluent**<br />
Reclaimed<br />
<strong>Water</strong><br />
(avg.)***<br />
CAP<br />
<strong>Water</strong> ‡<br />
(avg.)<br />
Stream<br />
<strong>Water</strong><br />
(avg.)+<br />
Stormwater<br />
(avg.)†<br />
TDS 322 509 657 603 232 93<br />
Hardness as 115 139 - 280 56.2 -<br />
CaCO3<br />
Sodium 40.0 109 130 92 18.1 6.0<br />
Chloride 16.6 83.2 107.4 82 7.6 4.0<br />
Calcium 38 46.6 59.5 66 48.8 10.4<br />
Magnesium 4.7 6.25 10 28 7.9 1.6<br />
Sulfate 44 85 120.8 248 37.76 9.9<br />
Alkal<strong>in</strong>ity 130 224 247 129 - -<br />
* Average dr<strong>in</strong>k<strong>in</strong>g water quality for Tucson <strong>Water</strong> ma<strong>in</strong> system, 2001 data supplied by Tucson <strong>Water</strong>.<br />
Hardness is Total, mg/l, TDS Calculated<br />
** Comb<strong>in</strong>ed effluent is flow-weighted average secondary effluent quality for Ina and Roger Road<br />
Wastewater Treatment Plants. Data from PCWMD.<br />
***- Reclaimed <strong>Water</strong>, average values from January 2001- July 2001. Data from Tucson <strong>Water</strong>.<br />
‡ Data from CAP water at the Clearwater Site October 1997-April 2000. Tucson <strong>Water</strong><br />
+ Average stream water quality for 6 streams <strong>in</strong> <strong>Pima</strong> <strong>County</strong>, data from ADEQ<br />
† Average Stormwater quality data from USGS measurements at Tanque Verde Creek at the Sab<strong>in</strong>o<br />
Canyon confluence.<br />
53
Conclusions<br />
Groundwater<br />
Groundwater is the most widely used water resource <strong>in</strong> <strong>Pima</strong> <strong>County</strong>. <strong>Water</strong> quality data for this<br />
source are abundant, due to its extensive use and regulatory monitor<strong>in</strong>g requirements. It is<br />
generally <strong>of</strong> very good quality and suitable for its <strong>in</strong>tended uses, which <strong>in</strong>clude dr<strong>in</strong>k<strong>in</strong>g water,<br />
irrigation and <strong>in</strong>dustry. Groundwater contam<strong>in</strong>ation has occurred <strong>in</strong> several locations. Nitrates<br />
and VOCs are the predom<strong>in</strong>ant contam<strong>in</strong>ants. Other contam<strong>in</strong>ants, such as metals and pesticides,<br />
are <strong>in</strong>significant compared to VOCs. Contam<strong>in</strong>ated groundwater is generally not used for<br />
potable purposes, with the exception <strong>of</strong> locations where it is either treated or blended to meet<br />
dr<strong>in</strong>k<strong>in</strong>g water standards. Contam<strong>in</strong>ated groundwater <strong>in</strong> <strong>Pima</strong> <strong>County</strong> is <strong>in</strong>tensively monitored,<br />
and <strong>in</strong> most cases is either under remediation or further <strong>in</strong>vestigation.<br />
CAP <strong>Water</strong><br />
CAP water is be<strong>in</strong>g used <strong>in</strong> <strong>in</strong>creas<strong>in</strong>g quantities <strong>in</strong> <strong>Pima</strong> <strong>County</strong>. Current uses <strong>in</strong>clude potable<br />
supply, artificial groundwater recharge and crop irrigation. The quality <strong>of</strong> this water is<br />
extensively monitored, and its quality is sufficient for its <strong>in</strong>tended uses, which <strong>in</strong>clude dr<strong>in</strong>k<strong>in</strong>g<br />
water, aquifer recharge, irrigation and <strong>in</strong>dustry.<br />
Treated Wastewater<br />
Treated wastewater is also be<strong>in</strong>g used <strong>in</strong> <strong>in</strong>creas<strong>in</strong>g quantities. It is extensively monitored, and<br />
its quality meets standards for its <strong>in</strong>tended uses, which <strong>in</strong>clude reuse for turf irrigation,<br />
agriculture and discharge to an effluent dependent stream. The effluent discharges currently<br />
support valuable riparian habitat subject to major stormwater events.<br />
Stormwater Run<strong>of</strong>f<br />
This water is not widely used as a resource. However, it is extensively monitored under exist<strong>in</strong>g<br />
regulations. The water quality meets NPDES permit requirements.<br />
Surface <strong>Water</strong>bodies<br />
Although it is relatively scarce, naturally occurr<strong>in</strong>g surface water <strong>in</strong> perennial and <strong>in</strong>termittent<br />
streams provides very important habitat <strong>in</strong> <strong>Pima</strong> <strong>County</strong>. Most <strong>of</strong> the streams that have been<br />
monitored are <strong>of</strong> a quality sufficient for their <strong>in</strong>tended use or habitat. However, monitor<strong>in</strong>g is<br />
very limited compared to the other water sources. The vast majority <strong>of</strong> perennial and<br />
<strong>in</strong>termittent streams <strong>in</strong> <strong>Pima</strong> <strong>County</strong> are not regularly monitored for water quality.<br />
54
References<br />
Arizona Department <strong>of</strong> Environmental <strong>Quality</strong>, 2001. Web Site: www.adeq.state.az.us<br />
Arizona Department <strong>of</strong> Environmental <strong>Quality</strong>, 2000. The Status <strong>of</strong> <strong>Water</strong> <strong>Quality</strong> <strong>in</strong><br />
Arizona, Clean <strong>Water</strong> Act Section 305(b) Report 2000.<br />
Arizona Department <strong>of</strong> Environmental <strong>Quality</strong>, 1998. Arizona’s 1998 <strong>Water</strong> <strong>Quality</strong><br />
Limited <strong>Water</strong>s List.<br />
Arizona Department <strong>of</strong> <strong>Water</strong> Resources, 1999. Third Management Plan 2000-2010.<br />
Arizona Department <strong>of</strong> <strong>Water</strong> Resources, 1998. Regional Recharge Plan.<br />
Arizona Department <strong>of</strong> <strong>Water</strong> Resources, 1996. State <strong>of</strong> the AMA, Tucson Active<br />
Management Area, Draft, April 1996.<br />
Arizona <strong>Water</strong> Company, 2001. 2000 Annual <strong>Water</strong> <strong>Quality</strong> Report for Ajo, Arizona,<br />
PWSID# 10-003, June 2001.<br />
Brown and Caldwell, 1984. Fresno Nationwide Urban Run<strong>of</strong>f Program Project, Fresno Metropolitan<br />
Flood Control District. F<strong>in</strong>al Report.<br />
Carruth, R.L., 1996. Hydrogeology <strong>of</strong> the Quitobaquito Spr<strong>in</strong>gs and La Abra Pla<strong>in</strong> Area, Organ Pipe<br />
Cactus National Monument, Arizona and Sonora, Mexico.<br />
Cella Barr, URS Consultants, Rillito Consult<strong>in</strong>g Group, 1989. Tucson Stormwater Management Study,<br />
Concept Bas<strong>in</strong> Plans, December 1989.<br />
Central Arizona Project (CAP), 2001. Central Arizona <strong>Water</strong> Conservation District 2000 Annual Report.<br />
Central Arizona <strong>Water</strong> Conservation District, 2001. Comb<strong>in</strong>ed Fourth Quarter Report and Annual<br />
Monitor<strong>in</strong>g Report, <strong>Pima</strong> M<strong>in</strong>e Road Recharge Project, March 2001.<br />
CH2M Hill, E. L. Montgomery and Associates, and L.G. Wilson, 1988. Tucson<br />
Recharge Feasibility Assessment, Phase A, Task 6, <strong>Water</strong> Sources Evaluations for Recharge<br />
Sites. Prepared for Tucson <strong>Water</strong>.<br />
City <strong>of</strong> Tucson, 1999. Municipal Stormwater Annual Report for Fiscal Year 1998-1999.<br />
Dotson, Karen, 2001. Personal communication with Tucson <strong>Water</strong> staff.<br />
Hard<strong>in</strong>g Lawson Associates, 1987. Site Specific <strong>Water</strong> <strong>Quality</strong> Criteria Study for the Santa Cruz River.<br />
Prepared for <strong>Pima</strong> <strong>County</strong> Wastewater Management Department.<br />
Malcolm Pirnie, 1999. Reclaimed <strong>Water</strong> System Master Plan for Tucson <strong>Water</strong>, December 1999.<br />
Malcolm Pirnie, 1994. Tucson Metropolitan Wastewater Reuse Assessment Update. Prepared for Tucson<br />
<strong>Water</strong>.<br />
55
Miller, R. and Fuiman, L., 1987. Description and Conservation Status <strong>of</strong> Cypr<strong>in</strong>odon macularis eremus,<br />
A new Subspecies <strong>of</strong> Pupfish from Organ Pipe Cactus National Monument, Arizona. Copeia,<br />
1987, No. 3 pp. 93-609.<br />
National Oceanic and Atmospheric Adm<strong>in</strong>istration, 1998. Local Climatological Data Annual<br />
Summary with Comparative Data, Tucson Arizona, 1961-1990.<br />
Oro Valley <strong>Water</strong> Utility, 2001. Oro Valley <strong>Water</strong> Utility 2000 Annual <strong>Water</strong> <strong>Quality</strong> Report, June 2001.<br />
<strong>Pima</strong> <strong>Association</strong> <strong>of</strong> <strong>Governments</strong>, 2001. B<strong>in</strong>gham Cienega Source <strong>Water</strong> Study, February 2001.<br />
<strong>Pima</strong> <strong>Association</strong> <strong>of</strong> <strong>Governments</strong>, 2000. Lower Cienega Bas<strong>in</strong> Source <strong>Water</strong> Study, October 2000.<br />
<strong>Pima</strong> <strong>Association</strong> <strong>of</strong> <strong>Governments</strong>, 2000a. Sonoran Desert Conservation Plan. GIS Coverage <strong>of</strong><br />
Perennial Streams, Intermittent Streams and Areas <strong>of</strong> Shallow Groundwater, January 2000.<br />
<strong>Pima</strong> <strong>Association</strong> <strong>of</strong> <strong>Governments</strong>, 2000b. Tucson –Area Remediation Projects Update, December 2000.<br />
<strong>Pima</strong> <strong>Association</strong> <strong>of</strong> <strong>Governments</strong>, 1999. Avra Valley Recharge Project Stable Isotope<br />
Study, January 1999.<br />
<strong>Pima</strong> <strong>Association</strong> <strong>of</strong> <strong>Governments</strong>, 1999a. Community Information Data Summary, Seventh Edition,<br />
November 1999.<br />
<strong>Pima</strong> <strong>Association</strong> <strong>of</strong> <strong>Governments</strong>, 1999b. <strong>Water</strong> <strong>Quality</strong> Permits <strong>in</strong> <strong>Pima</strong> <strong>County</strong>, August 1999.<br />
<strong>Pima</strong> <strong>Association</strong> <strong>of</strong> <strong>Governments</strong>, 1999c. Exist<strong>in</strong>g, Proposed, and Historic Wastewater Treatment<br />
Facilities and 208 Plann<strong>in</strong>g Area Boundaries <strong>in</strong> Eastern <strong>Pima</strong> <strong>County</strong>.<br />
<strong>Pima</strong> <strong>Association</strong> <strong>of</strong> <strong>Governments</strong>, 1998. Summary and Evaluation <strong>of</strong> Cienega Creek Surface <strong>Water</strong> and<br />
Groundwater Monitor<strong>in</strong>g Program, Volume 1, February 1998.<br />
<strong>Pima</strong> <strong>Association</strong> <strong>of</strong> <strong>Governments</strong>, 1996. <strong>Water</strong> <strong>Quality</strong> Assessment for the Tucson Active Management<br />
Area Northwest Replenishment Program Feasibility Study.<br />
<strong>Pima</strong> <strong>Association</strong> <strong>of</strong> <strong>Governments</strong>, 1994. <strong>Water</strong> <strong>Quality</strong> State <strong>of</strong> the Region Report, December 1994.<br />
<strong>Pima</strong> <strong>Association</strong> <strong>of</strong> <strong>Governments</strong>, 1994a. CAP <strong>Water</strong> Sal<strong>in</strong>ity Impacts on <strong>Water</strong> Resources <strong>of</strong> the<br />
Tucson Bas<strong>in</strong>, Prepared for Tucson <strong>Water</strong>, October 1994.<br />
<strong>Pima</strong> <strong>Association</strong> <strong>of</strong> <strong>Governments</strong>, 1992. Application <strong>of</strong> Historic Well Closure Information for<br />
Protection <strong>of</strong> Exist<strong>in</strong>g Wells.<br />
<strong>Pima</strong> <strong>Association</strong> <strong>of</strong> <strong>Governments</strong>, 1991. National Pollution Discharge Elim<strong>in</strong>ation System Part I,<br />
Permit Application Project.<br />
<strong>Pima</strong> <strong>County</strong>, 2000. <strong>Pima</strong> <strong>County</strong> NPDES Stormwater Discharge Permit Third Annual Report,<br />
September 2000.<br />
56
<strong>Pima</strong> <strong>County</strong> Department <strong>of</strong> Transportation and Flood Control District, 1986. Rillito Creek-Alvernon to<br />
Craycr<strong>of</strong>t Flood Storage/ Groundwater Recharge/ Natural River<strong>in</strong>e Preservation Project<br />
Concept Report.<br />
<strong>Pima</strong> <strong>County</strong> Wastewater Management Department, 2001. Arid West <strong>Water</strong> <strong>Quality</strong> Research Project,<br />
F<strong>in</strong>al Report –Draft July 2001.<br />
<strong>Pima</strong> <strong>County</strong> Wastewater Management Department, 2001a. Discharge Monitor<strong>in</strong>g Report: Summarized<br />
Information; Priority Pollutant Quarterly Sampl<strong>in</strong>g; Quarterly Priority Pollutant Organic<br />
Compounds Detected-2000.<br />
<strong>Pima</strong> <strong>County</strong> Wastewater Management Department, 2000. Comments Regard<strong>in</strong>g Arizona <strong>Water</strong> <strong>Quality</strong><br />
Assessment – Draft CWA 305b Report 2000.<br />
Ronayne, M.J. and T. Maddock III. 1996. Flow Model for the B<strong>in</strong>gham Cienega area, San Pedro<br />
Bas<strong>in</strong>, Arizona: A Management and Restoration Tool, HWR No. 96-050. Department <strong>of</strong><br />
Hydrology and <strong>Water</strong> Resources, University <strong>of</strong> Arizona, Tucson, Arizona.<br />
Robertson, F.N., 1991. Geochemistry <strong>of</strong> Groundwater <strong>in</strong> Alluvial Bas<strong>in</strong>s <strong>of</strong> Arizona and Adjacent<br />
Parts <strong>of</strong> Nevada, New Mexico, and California: U.S. Geological Survey Pr<strong>of</strong>essional Paper 1406C.<br />
Tucson <strong>Water</strong>, 2001. Annual <strong>Water</strong> <strong>Quality</strong> Report, 2000.<br />
Tucson <strong>Water</strong>, 2001a. Draft Brochure: Reclaimed <strong>Water</strong> System, 2001.<br />
Tucson <strong>Water</strong>, 2001b. Tucson <strong>Water</strong> Website<br />
Tucson <strong>Water</strong> 2000. 1999 Annual <strong>Water</strong> <strong>Quality</strong> Report.<br />
Tucson <strong>Water</strong>, 2000a. Annual Static <strong>Water</strong> Level Basic Data Report Tucson Bas<strong>in</strong> and Avra Valley,<br />
<strong>Pima</strong> <strong>County</strong> Arizona, 1997.<br />
Tucson <strong>Water</strong>, 2000b. Clearwater Renewable Resource Facility, Implementation and Operation<br />
Plan, Full-Scale Recharge, Recovery & <strong>Water</strong> Delivery Facilities,<br />
September 2000.<br />
Tucson <strong>Water</strong>, 1998. Status <strong>of</strong> the Aquifer.<br />
Tucson <strong>Water</strong>, 1990. City <strong>of</strong> Tucson Sweetwater Underground Storage and Recovery Facility,<br />
April 1990.<br />
United States Geological Survey, 2000. <strong>Water</strong> <strong>Quality</strong> <strong>in</strong> the Central Arizona Bas<strong>in</strong>s,<br />
Arizona, 1995-1998.<br />
United States Geological Survey, 1999. Ground-<strong>Water</strong> <strong>Quality</strong> <strong>in</strong> Alluvial Bas<strong>in</strong>s that<br />
Have M<strong>in</strong>imal Urban Development, South-Central Arizona, 1999.<br />
United States Geological Survey, 1995. <strong>Quality</strong> <strong>of</strong> <strong>Water</strong> and Chemistry <strong>of</strong> Bottom Sediment <strong>in</strong> the<br />
Rillito Creek Bas<strong>in</strong>, Tucson Arizona, 1992-93 U.S.G.S. <strong>Water</strong>-Resources Investigation Report<br />
95-4062.<br />
57
United States Geological Survey, 1995a. Statistical Summary <strong>of</strong> selected Physical, Chemical, and<br />
Microbial Characteristics, and Estimates <strong>of</strong> Constituent Loads <strong>in</strong> Urban Stormwater, Maricopa<br />
<strong>County</strong> Arizona U.S.G.S. <strong>Water</strong>-Resources Investigations Report 94-4240.<br />
United States Geological Survey, 1994. <strong>Quality</strong> <strong>of</strong> <strong>Water</strong> and Chemistry <strong>of</strong> Bottom Sediments<br />
Sediment <strong>in</strong> the Rillito Creek Bas<strong>in</strong>, Tucson, Arizona, 1986-92, U.S.G.S. <strong>Water</strong>- Resources<br />
Investigations Report 94-4114.<br />
<strong>Water</strong> Resource Research Center, 1999. <strong>Water</strong> <strong>in</strong> the Tucson Area: Seek<strong>in</strong>g Susta<strong>in</strong>ability.<br />
58
APPENDIX A<br />
Arizona Department <strong>of</strong> Environmental <strong>Quality</strong><br />
Santa Cruz-Rio Magdalena-Rio Sonoyta<br />
<strong>Water</strong>shed Stream Assessments and Stream Monitor<strong>in</strong>g Data
Appendix A: Santa Cruz-Rio Magdalena-Rio Sonoyta <strong>Water</strong>shed Streams Assessments and Streams Monitor<strong>in</strong>g Data (ADEQ).<br />
SANTA CRUZ - RIO MAGDALENA - RIO SONOYTA WATERSHED STREAMS ASSESSMENTS<br />
WATERBODY NAME<br />
SEGMENT<br />
WATERBODY SIZE<br />
WATERBODY ID<br />
TYPE OF<br />
ASSESSMENT<br />
BIOASSESSMENT*<br />
YEAR ADDED TO<br />
DESIGNATED STRESSORS<br />
USE SUPPORT<br />
POTENTIAL SOURCES ASSESSMENT COMMENTS<br />
Alamo Wash<br />
headwaters-Rillito Creek<br />
9 miles<br />
AZ15050302-002<br />
Arivaca Creek<br />
headwaters-<br />
Puertocito/Altar Wash<br />
15 miles<br />
AZ15050304-008<br />
Canada del Oro<br />
headwaters-Big Wash<br />
31miles<br />
AZ15050301-017<br />
Cienega Creek<br />
Interstate 10 to Del Lago<br />
Dam<br />
11 miles<br />
AZ15050302-006B<br />
Cienega Creek<br />
headwaters-Interstate 10<br />
38 miles<br />
AZ15050302-006A<br />
303(d) LIST<br />
Monitored<br />
--<br />
--<br />
Evaluated<br />
--<br />
--<br />
Evaluated<br />
--<br />
--<br />
Monitored<br />
Exceptional<br />
community<br />
--<br />
Evaluated<br />
--<br />
--<br />
Partial Copper Urban run<strong>of</strong>f USGS study <strong>of</strong> water and sediment from<br />
stormwater discharges <strong>in</strong> Alamo<br />
Wash <strong>in</strong> 1993, 5 samples: copper exceeded<br />
standard once (Tadayon, 1995).<br />
Fully ADEQ 3 stations 1991-93 with a total <strong>of</strong> 39<br />
samples: full support. Low<br />
dissolved oxygen due to spr<strong>in</strong>g sources and<br />
low flows (all natural).<br />
Fully ADEQ bioassessment site (phys/chem<br />
monitor<strong>in</strong>g) 1992-94, 3 samples: full<br />
support. Biassessment not appropriate,<br />
because Index <strong>of</strong> Biological Integrity<br />
developed for perennial waters cannot be<br />
applied to <strong>in</strong>termittent waters.<br />
Fully ADEQ monitor<strong>in</strong>g at 6 sites 1991-1998, 26<br />
samples: full support.<br />
Fully ADEQ monitor<strong>in</strong>g 1992-1998, 5 sites, 8<br />
samples: full support.
Madera Canyon Creek<br />
headwaters-Santa Cruz<br />
13 miles<br />
AZ15050301-322<br />
Sab<strong>in</strong>o Canyon Creek<br />
headwaters-Tanque Verde<br />
River<br />
20 miles<br />
AZ15050302-014<br />
Santa Cruz River<br />
Canada del Oro-Guild<br />
Wash<br />
9 miles<br />
AZ15050301-001<br />
Santa Cruz River<br />
Joseph<strong>in</strong>e Canyon-Tubac<br />
Bridge<br />
6 miles<br />
AZ15050301-008A<br />
Santa Cruz River Tubac<br />
Bridge-Sopori Wash<br />
9 miles<br />
AZ15050301-008B<br />
Tanque Verde Creek<br />
Wentworth Road-Rillito<br />
Creek<br />
10 miles<br />
AZ15050302-009B<br />
Evaluated<br />
--<br />
--<br />
Evaluated<br />
Good community<br />
--<br />
Monitored<br />
--<br />
--<br />
Monitored<br />
--<br />
1992<br />
Monitored<br />
--<br />
--<br />
Evaluated<br />
--<br />
--<br />
Fully ADEQ 2 stations <strong>in</strong> 1991 (Roundup and<br />
Whitehorse) 2 samples: full support.<br />
ADEQ Biocriteria Development Reference<br />
Site (phys/chem monitor<strong>in</strong>g)<br />
1992-94, 3 samples: full support.<br />
Fully ADEQ monitor<strong>in</strong>g (Summerhaven) 1990-93,<br />
10 samples: full support. ADEQ<br />
Biocriteria Development Sit 1992-96, 4<br />
samples: full support.<br />
Not support<strong>in</strong>g Low dissolved<br />
oxygen<br />
Po<strong>in</strong>t source, sand and<br />
gravel<br />
operations, bridge repair,<br />
natural<br />
conditons<br />
Not support<strong>in</strong>g Turbidity, Land development,<br />
unknown toxic graz<strong>in</strong>g, natural,<br />
wastewater treatment<br />
plant<br />
USGS NAWQA site 1996-1997, 12 samples:<br />
dissolved oxygen did not meet<br />
standards <strong>in</strong> half <strong>of</strong> the samples. <strong>Pima</strong><br />
<strong>County</strong> Wastewater Management<br />
Department <strong>in</strong>stream monitor<strong>in</strong>g 1992-1994,<br />
2 sites, total <strong>of</strong> 130 dissolved<br />
oxygen and ammonia samples: full support<br />
but median value for dissolved<br />
oxygen dropped every year. ADEQ fixed site<br />
1991-1993, 20 samples: full<br />
support.<br />
USGS NAWQA site 1996-97, 25 samples:<br />
full support (no turbidity samples).<br />
ADEQ monitor<strong>in</strong>g 2 sites 1991-95, 13<br />
samples: turbidity exceeds standards.<br />
USFWS report (K<strong>in</strong>g et al., 1999) <strong>in</strong>dicates<br />
toxicity is occurr<strong>in</strong>g.<br />
Fully ADEQ monitor<strong>in</strong>g at Chavez Sid<strong>in</strong>g Road, 19<br />
samples 1992-1995: full support.<br />
Fully USGS monitor<strong>in</strong>g 1990-94, 9 samples: full<br />
support.
Appendix A SANTA CRUZ - RIO MAGDALENA - RIO SONOYTA WATERSHED STREAMS<br />
ASSESSMENTS<br />
WATERBODY NAME<br />
SEGMENT<br />
WATERBODY SIZE<br />
WATERBODY ID<br />
TYPE OF<br />
ASSESSMENT<br />
BIOASSESSMENT*<br />
DESIGNATEDSTRESSORS<br />
USE<br />
SUPPORT<br />
POTENTIAL<br />
SOURCES<br />
ASSESSMENT COMMENTS<br />
Arivaca Lake<br />
119 acres<br />
AZL15050304-0080<br />
Kennedy Lake<br />
10 acres<br />
AZL15050301-0720<br />
Lakeside Lake<br />
15 acres<br />
AZL15050302-0760<br />
YEAR ADDED TO<br />
303(d) LIST<br />
Monitored<br />
Hypereutrophic<br />
1996<br />
Monitored<br />
Eutrophic<br />
--<br />
Monitored<br />
Hypereutrophic<br />
--<br />
Not support<strong>in</strong>gMercury, low<br />
dissolved<br />
oxygen, high<br />
pH<br />
Not support<strong>in</strong>gHigh pH<br />
Partial<br />
High pH, low<br />
dissolved<br />
oxygen<br />
Resource extraction,<br />
lake design and<br />
ma<strong>in</strong>tenance, natural,<br />
unknown,<br />
atmospheric deposition<br />
Po<strong>in</strong>t source, lake design<br />
and<br />
ma<strong>in</strong>tenance, natural<br />
Po<strong>in</strong>t source, lake design<br />
and<br />
ma<strong>in</strong>tenance, natural<br />
Fish advisory due to mercury <strong>in</strong> fish tissue<br />
1995 (AGFD and ADEQ samples).<br />
ADEQ and EPA water samples collected <strong>in</strong><br />
1997-1998, total <strong>of</strong> 52 samples:<br />
high pH and low dissolved oxygen. TMDL<br />
completed <strong>in</strong> 1999 for mercury.<br />
AGFD rout<strong>in</strong>e monitor<strong>in</strong>g 1994-1997, 3<br />
sampl<strong>in</strong>g events: high pH. AGFD<br />
urban lakes project, 11 field measurements,<br />
4 lab samples: high pH (some<br />
low dissolved oxygen).<br />
AGFD rout<strong>in</strong>e monitor<strong>in</strong>g 1994-1997, 4<br />
sampl<strong>in</strong>g events: low dissolved<br />
oxygen. AGFD urban lakes project<br />
monitor<strong>in</strong>g 1998, 11 field measurements, 4<br />
lab chemistries: partial support due to low<br />
DO and high pH.<br />
From: Arizona Department <strong>of</strong> Environmental <strong>Quality</strong>, The Status <strong>of</strong> <strong>Water</strong> <strong>Quality</strong> <strong>in</strong> Arizona, Clean <strong>Water</strong> Act Section 305(b) Report 2000.
Appendix A: Santa Cruz-Rio Madalena-Rio Sonoyta <strong>Water</strong>shed Streams Assessments and Streams Monitor<strong>in</strong>g Data (ADEQ).<br />
. SANTA CRUZ-RIO MAGDALENA-RIO SONOYTA WATERSHED -- STREAMS MONITORING DATA<br />
STREAM NAME<br />
SEGMENT<br />
WATERBODY ID<br />
DESIGNATED USES<br />
AGENCY<br />
PROGRAM<br />
SITE DESCRIPTION<br />
SITE ID<br />
SAMPLES PARAMETER<br />
UNITS<br />
STANDARD RANGE OF<br />
RESULTS<br />
(MEDIAN)<br />
Agua Caliente<br />
ADEQ<br />
headwaters-Coronado Forest Biocriteria Program<br />
AZ15050302-348A Above Coronado Natl<br />
A&Ww, FC, FBC, AgL Forest<br />
Boundary<br />
SCACW004.93<br />
Alamo Wash<br />
headwaters-Rillito Creek<br />
AZ15050302-002<br />
A&We, PBC<br />
Arivaca Creek<br />
headwaters-Puertocito/Alta<br />
AZ15050304-008<br />
A&Ww, FC, FBC, AgL<br />
Cave Creek<br />
headwaters-Cienega Creek<br />
AZ15050302-185<br />
A&Ww, FC, FBC, AgL<br />
USGS #09485570<br />
USGS report 95-4062<br />
At Fort Lowell Road<br />
SCAAW001.27<br />
ADEQ<br />
Fixed Station Network<br />
At Figueroa Spr<strong>in</strong>g<br />
SCARI008.19<br />
ADEQ<br />
Fixed Station Network<br />
At Ruby Road<br />
SCARI010.54<br />
ADEQ<br />
Fixed Station Network<br />
Near headwater spr<strong>in</strong>g<br />
SCARI010.86<br />
ADEQ<br />
Biocriteria Program<br />
Near Mount Wrightson<br />
Wilderness<br />
SCCAV002.95<br />
FREQUENCY<br />
EXCEEDED<br />
STANDARDS<br />
USE SUPPORT*<br />
COMMENTS<br />
1995 - 1 water, bugs Ok Need more <strong>in</strong>formation to<br />
assess.<br />
1991-1994 - 9 water Copper<br />
(dissolved)µg/l<br />
1991 - 6 water<br />
1992 - 6 water<br />
1993 - 4 water<br />
1991 - 8 water<br />
1992 - 6 water<br />
1993 - 4 water<br />
1991 - 4 water<br />
1992 - 1 water<br />
1993 - 1 water<br />
Dissolved oxygen<br />
mg/l<br />
Dissolved oxygen<br />
mg/l<br />
Dissolved oxygen<br />
mg/l<br />
varies (12)
Appendix A SANTA CRUZ-RIO MAGDALENA-RIO SONOYTA WATERSHED -- STREAMS MONITORING DATA (ADEQ)<br />
Canada del Oro<br />
headwaters-Big Wash<br />
AZ15050301-017<br />
ADEQ<br />
Biocriteria Program<br />
South <strong>of</strong> P<strong>in</strong>al <strong>County</strong> L<strong>in</strong>e<br />
1992 - 1 water, bugs<br />
1993 - 1 water, bugs<br />
1994 - 1 water, bugs<br />
Ok Full<br />
A&Ww, FC, FBC, DWS, AgI, SCCDO016.55<br />
AgL<br />
Cienega Creek<br />
Interstate 10-Del Lago Dam<br />
AZ15050302-006B<br />
A&Ww, FBC, FC, AgL<br />
ADEQ<br />
1998 - 1 water, bugs,<br />
Stream Ecosystem Monitor<strong>in</strong>g physical<br />
Above Diversion Dam<br />
SCCIE000.4<br />
ADEQ<br />
1998 - 1 water, bugs,<br />
Stream Ecosystem Monitor<strong>in</strong>g physical<br />
Below Davidson Canyon<br />
SCCIE001.1<br />
ADEQ<br />
1998 - 1 water, bugs,<br />
Stream Ecosystem Monitor<strong>in</strong>g physical<br />
Above Davidson Canyon<br />
SCCIE001.2<br />
ADEQ<br />
Fixed Station Network<br />
At Marsh Station Road<br />
SCCIE002.86<br />
1991 - 6 water<br />
1992 - 6 water<br />
1993 - 4 water<br />
1995 - 4 water<br />
Dissolved oxygen<br />
mg/l<br />
6.0<br />
(90% saturation)<br />
Ok Full<br />
Dissolved oxygen<br />
mg/l<br />
Dissolved oxygen<br />
mg/l<br />
6.0<br />
(90% saturation)<br />
6.0<br />
(90% saturation)<br />
4.59 1 <strong>of</strong> 1 Full Naturally low DO. Interrupted stream flow<br />
with spr<strong>in</strong>g source.<br />
5.4 1 <strong>of</strong> 1 Full Naturally low DO. Interrupted stream flow<br />
with spr<strong>in</strong>g source.<br />
4.75-11.2<br />
(60.6-110%)<br />
1 <strong>of</strong> 25 Full<br />
ADEQ<br />
1998 - 1 water, bugs, Ok Full<br />
Stream Ecosystem Monitor<strong>in</strong>g physical<br />
Below tilted beds<br />
SCCIE003.5<br />
ADEQ<br />
1993 - 2 water Ok Full<br />
Fixed Station Network<br />
At Tilted Bed site<br />
SCCIE005.36
Appendix A SANTA CRUZ-RIO MAGDALENA-RIO SONOYTA WATERSHED -- STREAMS MONITORING DATA (ADEQ)<br />
STREAM NAME<br />
SEGMENT<br />
WATERBODY ID<br />
DESIGNATED USES<br />
AGENCY<br />
PROGRAM<br />
SITE DESCRIPTION<br />
SITE ID<br />
SAMPLES PARAMETER<br />
UNITS<br />
STANDARD RANGE OF<br />
RESULTS<br />
(MEDIAN)<br />
FREQUENCY<br />
EXCEEDED<br />
STANDARDS<br />
Cienega Creek<br />
Headwaters-Interstate 10<br />
AZ15050302-006A<br />
A&Ww, FC, FBC, AgL<br />
Gardner Canyon Creek<br />
headwaters-Cienega Creek<br />
AZ15050302-195<br />
BLM<br />
Rout<strong>in</strong>e Monitor<strong>in</strong>g<br />
At Narrows<br />
SCCIE010.99<br />
ADEQ<br />
Stream Ecosystem<br />
Monitor<strong>in</strong>g<br />
Below Stevenson Canyon<br />
SCCIE011.8<br />
ADEQ<br />
Stream Ecosystem<br />
Monitor<strong>in</strong>g<br />
Below narrows<br />
SCCIE012.4<br />
ADEQ<br />
Biocriteria Program<br />
Above the Narrows<br />
SCCIE012.55<br />
ADEQ<br />
Fixed Station Network<br />
Below E.C. Conserv.<br />
SCCIE013.61<br />
ADEQ<br />
Biocriteria Program<br />
Near Mount Wrightson<br />
1993 - 1 water (2<br />
sites)<br />
1998 - 1 water, bugs,<br />
physical<br />
1998 - 1 water, bugs,<br />
physical<br />
1992 - 1 water, bugs<br />
1993 - 1 water, bugs<br />
1994 - 1 water, bugs<br />
1996 - 1 water, bugs<br />
1992 - 1 water<br />
1993 - 1 water<br />
Ok Full<br />
Ok Full<br />
Ok Full<br />
Ok Full<br />
Ok Full<br />
USE SUPPORT*<br />
COMMENTS<br />
1992 - 1 water, bugs Ok Need more <strong>in</strong>formation to<br />
assess.<br />
A&Ww, FC, FBC<br />
Wilderness<br />
SCGDN010.49
Appendix A SANTA CRUZ-RIO MAGDALENA-RIO SONOYTA WATERSHED -- STREAMS MONITORING DATA (ADEQ)<br />
Madera Canyon Creek<br />
headwaters-Santa Cruz<br />
AZ15050301-322<br />
A&Ww, FC, FBC, AgL<br />
ADEQ<br />
Fixed Station Network<br />
2 sites (Whitehorse and<br />
Roundup)<br />
SCMAD006.20<br />
1991 - 1 sample (2<br />
sites)<br />
Ok Full<br />
ADEQ<br />
1992 - 1 water, bugs Ok Full<br />
Biocriteria Program 1993 - 1 water, bugs<br />
1 mile below Sprung Spr<strong>in</strong>g 1994 - 1 water, bugs<br />
SCMAD007.63<br />
Sab<strong>in</strong>o Canyon Creek<br />
Headwaters-Tanque Verde<br />
RAZ15050302-014<br />
A&Wc, FC, FBC, DWS, AgI<br />
STREAM NAME<br />
SEGMENT<br />
WATERBODY ID<br />
DESIGNATED USES<br />
Santa Cruz<br />
Josephene-Tubac bridge<br />
AZ15050301-008A<br />
A&Wedw, PBC, AgL<br />
Santa Cruz River<br />
Tubac bridge-Sopori Wash<br />
AZ15050301-008B<br />
A&We, PBC, AgL<br />
ADEQ<br />
Fixed Station Network<br />
At USGS gage<br />
SCSAB003.66<br />
ADEQ<br />
Biocriteria Program<br />
Above East Fork Sab<strong>in</strong>o<br />
Canyon<br />
SCSAB007.56<br />
ADEQ<br />
Fixed Station Network<br />
Below Summerhaven on<br />
Mount<br />
Lemmon<br />
SCSAB012.35<br />
AGENCY<br />
PROGRAM<br />
SITE DESCRIPTION<br />
SITE ID<br />
ADEQ<br />
Fixed Station Network<br />
At Tubac bridge<br />
SCSCR077.08<br />
ADEQ<br />
Fixed Station Network<br />
At Tumacacori<br />
SCSCR080.43<br />
ADEQ<br />
Fixed Station Network<br />
Chavez Sid<strong>in</strong>g Road<br />
SCSCR074.67<br />
1991 - 2 water Ok Full<br />
1992 - 1 water, bugs<br />
1993 - 1 water, bugs<br />
1994 - 1 water, bugs<br />
1996 - 1 water, bugs<br />
1991 - 9 water<br />
1992 - 1 water &<br />
5 bacts<br />
1993 - 3 bacts<br />
SAMPLES<br />
Dissolved oxygen<br />
mg/l<br />
7.0<br />
(90% saturation)<br />
Ok Full<br />
PARAMETER<br />
UNITS<br />
STANDARD<br />
3.99-9.5 1 <strong>of</strong> 4 Full Only a few isolated slow<br />
mov<strong>in</strong>g pools - natural low<br />
DO.<br />
RANGE OF<br />
RESULTS<br />
(MEDIAN)<br />
FREQUENCY<br />
EXCEEDED<br />
STANDARDS<br />
USE SUPPORT*<br />
1991 - 1 water Ok Full<br />
1992 - 2 water Turbidity 50 6.25-72 1 <strong>of</strong> 3 Partial A&Wedw<br />
NTU<br />
1993 - 5 water Copper varies (35) 4-70 1 <strong>of</strong> 3 Partial A&Wedw<br />
1995 - 6 water (limited) (dissolved)<br />
µg/l<br />
Cyanide (total)<br />
µg/l<br />
41 7-1500 1 <strong>of</strong> 5 Partial A&Wedw<br />
Turbidity 50 6.5-114 1 <strong>of</strong> 16 Full<br />
NTU<br />
1992 - 1 water Ok Full<br />
1993 - 9 water<br />
1995 - 6 water<br />
COMMENTS
Santa Cruz River<br />
Airport Wash-Rillito Creek<br />
AZ15050301-003<br />
A&We, PBC, AgL<br />
ADEQ<br />
Fixed Station Network<br />
At Congress Street<br />
SCSCR038.95<br />
Santa Cruz River<br />
USGS<br />
Canada del Oro-Guild Wash NAWQA Site #09486500<br />
AZ15050301-001<br />
At Cortaro, AZ<br />
A&Wedw, PBC<br />
SCSCR029.16<br />
ADEQ<br />
Fixed Station Network<br />
At Cortaro Road bridge<br />
SCSCR029.18<br />
Tanque Verde Creek USGS #09484500<br />
Wentworth Road-Rillito Creek USGS report 95-4062<br />
AZ15050302-009B At Sab<strong>in</strong>o Canyon Road<br />
A&We, PBC, AgL<br />
SCTAN001.29<br />
1991 - 1 water Ok Need more <strong>in</strong>formation to<br />
assess.<br />
1996 - 8 water<br />
1997 - 4 water<br />
1991 - 8 water<br />
1992 - 6 water<br />
1993 - 6 water<br />
Dissolved<br />
oxygen<br />
mg/l<br />
Turbidity<br />
NTU<br />
3.0 (3 hours after 2.0-3.7 6 <strong>of</strong> 12 Non A&Wedw<br />
sunrise to sunset)<br />
50 10.3-8970 1 <strong>of</strong> 12 Full<br />
1991-1994 - 9 water Ok Full Stormwater only.<br />
From: Arizona Department <strong>of</strong> Environmental <strong>Quality</strong>,The Status <strong>of</strong> <strong>Water</strong> <strong>Quality</strong> <strong>in</strong> Arizona, Clean <strong>Water</strong> Act Section 305 (b)<br />
Report 2000.
Appendix B<br />
Priority Pollutant Quarterly Sampl<strong>in</strong>g 2000<br />
For Ina Road WPCF and Roger Road WWTP<br />
(Note: Appendix B is only available <strong>in</strong> hardcopy formats <strong>of</strong> the report)