View Document - OSTI
View Document - OSTI
View Document - OSTI

You also want an ePaper? Increase the reach of your titles
YUMPU automatically turns print PDFs into web optimized ePapers that Google loves.
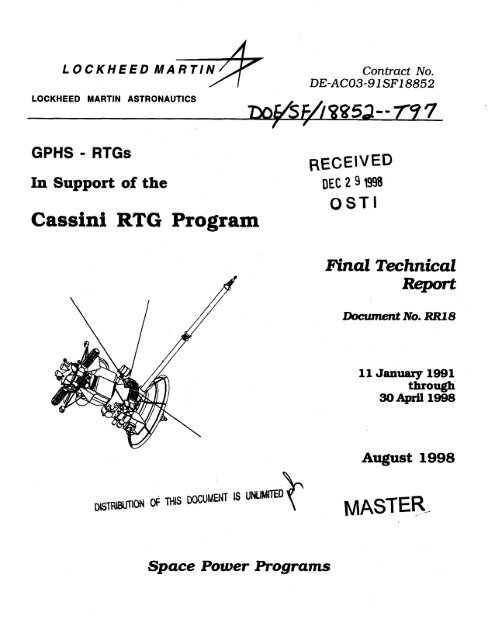
LOCKHEED MARTIN<br />
LOCKHEED MARTIN ASTRONAUTICS<br />
Contract No.<br />
DE-ACO3-91 SF18852<br />
DoV5 885a--T9 7<br />
GPHS - RTGs<br />
In Support of the<br />
Cassini RTG Program<br />
RECEIVED<br />
DEC 29 1998<br />
<strong>OSTI</strong><br />
Final Technical<br />
Report<br />
<strong>Document</strong> No. RR18<br />
11 January 1991<br />
through<br />
30 April 1998<br />
August 1998<br />
DISTRIBUTION Of MIS DOCUMENT IS uNumrrEogk.\<br />
MASTER<br />
Space Power Programs
DISCLAIMER<br />
This report was prepared as an account of work sponsored by an agency of the<br />
United States Government. Neither the United States Government nor any agency<br />
thereof, nor any of their employees, makes any warranty, express or implied, or<br />
assumes any legal liability or responsibility for the accuracy, completeness, or usefulness<br />
of any information, apparatus, product, or process disclosed, or represents<br />
that its use would not infringe privately owned rights. Reference herein to any specific<br />
commercial product, process, or service by trade name, trademark, inanufacturer,<br />
or otherwise does not necessarily constitute or imply its endorsement, recommendation,<br />
or favoring by the United States Government or any agency thereof.<br />
The views and opinions of authors expressed herein do not necessarily state or<br />
reflect those of the United States Government or any agency thereof.
DISCLAIMER<br />
Portions of this document may be illegible<br />
in electronic image products. Images are<br />
produced from the best available original<br />
document.
Final Technical<br />
Report<br />
Contract No.<br />
DE-ACO3-91SF18852<br />
GPHS-RTGs in<br />
Support of the<br />
Cassini Mission<br />
<strong>Document</strong> No. RR18<br />
11 January 1991<br />
through<br />
30 April 1998<br />
Prepared for:<br />
U.S. Department of Energy<br />
Oakland Operations Office<br />
1301 Clay Street<br />
Oakland, CA 94612-5208<br />
Prepared by:<br />
LOCKHEED MARTIN<br />
Lockheed Martin Astronautics<br />
Valley Forge Operations<br />
P.O. Box 8555<br />
Philadelphia, PA 19101<br />
August 1998<br />
Space Power Programs
Final Technical Report<br />
GPHS-RTGs for the Cassini Mission<br />
Lockheed Martin <strong>Document</strong> No. RR18<br />
August 1998<br />
Final Technical Progress Report<br />
Table of Contents<br />
Task<br />
Page<br />
FINAL TECHNICAL REPORT ACRONYMS AC R-1<br />
1 INTRODUCTION 1 -1<br />
1.1 SCOPE OF CASSINI GPHS-RTG PROGRAM 1 -1<br />
1.2 SCOPE OF FINAL REPORT 1 -5<br />
1.3 REFERENCE DOCUMENTATION 1 -6<br />
2 REQUIREMENTS 2-1<br />
2.1 GPHS REQUIREMENTS 2-1<br />
2.1.1 Operating Life 2-1<br />
2.1.2 Storage Life 2-2<br />
2.1.3 Fuel 2-2<br />
2.1.4 Thermal Power 2-2<br />
2.1.4.1 Fuel Pellet 2-2<br />
2.1.4.2 Fueled Clad 2-2<br />
2.1.4.3 Module 2-2<br />
2.1.4.4 Heat Source Assembly 2-3<br />
2.1.5 Mission Temperature 2-3<br />
2.1.6 Neutron Emission Rate 2-3<br />
2.1.7 Weight 2-3<br />
2.1 .8 Coatings 2-3<br />
2.1.9 Cleanliness 2-4<br />
2.2 RTG REQUIREMENTS 2-4<br />
2.2.1 Operating Life 2-5<br />
2.2.2 Storage Life 2-5<br />
2.2.3 Electrical Requirements 2-5<br />
2.2.3.1 Voltage 2-5<br />
2.2.3.2 Acceptance Power 2-5<br />
2.2.3.3 Launch Power 2-5<br />
iii
Final Technical Report<br />
GPHS-RTGs for the Cassini Mission<br />
Lockheed Martin <strong>Document</strong> No. RR18<br />
August 1998<br />
Final Technical Progress Report<br />
Table of Contents (Cont'd)<br />
Page<br />
2.2.3.4 Mission Power 2-6<br />
2.2.3.5 Circuit Condition 2-6<br />
2.2.3.6 Dynamic Capability 2-6<br />
2.2.3.7 Thermal Requirements 2-7<br />
2.2.3.8 Magnetics 2-7<br />
2.2.3.9 Instrumentation 2-8<br />
2.2.3.10 Multiple Heat Source Criticality 2-8<br />
2.2.3.11 Pressurization 2-8<br />
2.2.3.12 Venting of Cover Gas 2-9<br />
2.2.3.13 General Purpose Heat Source 2-9<br />
2.2.3.14 Insulation Resistance 2-9<br />
2.2.3.15 Electrostatic Cleanliness Requirements 2-9<br />
2.2.3.16 Internal Charging 2-10<br />
2.2.3.17 Electrostatic Discharge Susceptibility 2-11<br />
2.2.3.18 Miscellaneous 2-11<br />
2.2.3.19 Physical Characteristics 2-11<br />
2.2.3.20 Connections 2-12<br />
2.3 PHYSICAL REQUIREMENTS 2-14<br />
2.3.1 Static Envelope Dimensions 2-14<br />
2.3.2 Mounting 2-14<br />
2.3.3 Electrical Power Connector 2-14<br />
2.3.4 Instrumentation Connector 2-14<br />
2.3.5 Handling Attachment Points 2-14<br />
2.3.6 PRD Safety Pin 2-14<br />
2.4 VERIFICATION OF REQUIREMENTS 2-15<br />
iv
Final Technical Report<br />
GPHS-RTGs for the Cassini Mission<br />
Lockheed Martin <strong>Document</strong> No. RR18<br />
August 1998<br />
Final Technical Progress Report<br />
Table of Contents (Cont'd)<br />
Task<br />
Page<br />
3 CASSINI RTG DESIGN DESCRIPTION 3-1<br />
3.1 FLIGHT UNIT DESCRIPTION 3-1<br />
3.1.1 General Purpose Heat Source 3-2<br />
3.1.1.1 Radioisotope Fuel 3-3<br />
3.1.1.2 Fueled Clad (FC) 3-4<br />
3.1.1.3 Graphite Impact Shell (GIS) 3-5<br />
3.1.1.4 Aeroshell 3-5<br />
3.1.1.5 Materials and Weights 3-9<br />
3.1.2 Thermopile Assembly and Outer Shell 3-9<br />
3.1.3 Electrically Heated Thermoelectric Generator 3-12<br />
3.1.4 Mass Summary 3-12<br />
3.2 GROUND SUPPORT EQUIPMENT 3-16<br />
3.2.1 ETG Shipping Container (ETG-SC) 3-17<br />
3.2.2 Base and Protective Cover Assembly (BPCA) 3-18<br />
3.2.3 Readout Console (ROC) 3-20<br />
3.2.4 Portable Test Unit (PTU) 3-21<br />
3.2.5 Gas Service Cart (GSC) 3-22<br />
3.2.6 ETG/RTG Handling Fixtures 3-22<br />
4 DETAILED DESIGN HISTORY AND SPECIAL STUDIES 4-1<br />
4.1 HERITAGE FROM GPHS-RTG PROGRAM 4-1<br />
4.1.1 GPHS 4-1<br />
4.1.2 Converter Assembly 4-4<br />
4.1.2.1 Electric Heat Source 4-4<br />
4.1.2.2 Heat Source Supports 4-9<br />
4.1.2.3 Thermopile 4-16<br />
4.1.2.4 Outer Shell 4-26
Final Technical Report<br />
GPHS-RTGs for the Cassini Mission<br />
Lockheed Martin <strong>Document</strong> No. RR18<br />
August 1998<br />
Final Technical Progress Report<br />
Task<br />
4.3<br />
Table of Contents (Cont'd)<br />
4.2 NEW DESIGN ELEMENTS<br />
4.2.1 PRD<br />
4.2.1.1 PRD New Design Overview<br />
4.2.1.2 PRD Reliability Testing<br />
4.2.1.3 PRD Qualification Program<br />
4.2.1.4 PRD Acceptance Test Program<br />
4.2.1.5 PRD <strong>Document</strong>ation<br />
4.2.2 Resistance Temperature Device (RTD) Assembly<br />
SMALL RTG DESIGN STUDY<br />
4.3.1 Objective<br />
4.3.2 Design Options<br />
4.3.2.1 Baseline Description<br />
4.3.2.2 Option 1 Description<br />
4.3.2.3 Option 2 Description<br />
4.3.2.4 Option 3 Description<br />
4.3.2.5 Option 4 Description<br />
4.3.3 Summary<br />
4.3.4 Design Recommendation<br />
4.3.5 Structural Analyses Details<br />
4.3.5.1 Loads Environment<br />
4.3.5.2 Heat Source Module Finite Element Model<br />
4.3.5.3 Options 1 and 2<br />
4.3.5.4 Option 3<br />
4.3.5.5 Option 4<br />
4.3.5.6 Conclusions<br />
Page<br />
4-35<br />
4-35<br />
4-37<br />
4-38<br />
4-46<br />
4-49<br />
4-50<br />
4-50<br />
4-57<br />
4-57<br />
4-57<br />
4-57<br />
4-58<br />
4-58<br />
4-59<br />
4-59<br />
4-60<br />
4-60<br />
4-61<br />
4-61<br />
4-62<br />
4-63<br />
4-68<br />
4-69<br />
4-72<br />
vi
Final Technical Report<br />
GPHS-RTGs for the Cassini Mission<br />
Lockheed Martin <strong>Document</strong> No. RR18<br />
August 1998<br />
Final Technical Progress Report<br />
Table of Contents (Cont'd)<br />
Task<br />
Page<br />
4.3.6 Thermal/Power Analysis Details 4-73<br />
4.3.6.1 Baseline Models 4-73<br />
4.3.6.2 Six and Five Module Designs - Cassini Fuel 4-74<br />
4.3.6.3 Six and Five Module Designs - F-5 Fuel 4-76<br />
4.3.6.4 Six and Five Module Designs - New Fuel 4-77<br />
4.3.6.5 Summary 4-77<br />
4.3.6.6 Fin Optimization Study 4-78<br />
5 PERFORMANCE 5-1<br />
5.1 FLIGHT UNIT PERFORMANCE AS ETGs 5-1<br />
5.2 FLIGHT RTG ACCEPTANCE TESTING 5-11<br />
5.2.1 IAAC Assembly and Performance Testing 5-11<br />
5.2.2 Vibration Testing 5-20<br />
5.2.3 Magnetic Testing 5-24<br />
5.2.4 Mass Properties 5-27<br />
5.2.5 Thermal Vacuum Tests 5-28<br />
5.2.6 RTG Power Projections 5-45<br />
5.3 QUALIFICATION PROGRAM 5-50<br />
5.4 GALILEO AND ULYSSES FLIGHT PERFORMANCE 5-54<br />
5.4.1 Galileo 5-54<br />
5.4.2 Ulysses 5-58<br />
6 SAFETY 6-1<br />
6.1 MISSION AND SYSTEM DESCRIPTION 6-1<br />
6.1.1 Mission Overview 6-1<br />
6.1.2 Launch Vehicle and Space Vehicle 6-3<br />
6.1.2.1 Launch Vehicle 6-3<br />
6.1.2.2 Space Vehicle 6-7<br />
vii
Final Technical Report<br />
GPHS-RTGs for the Cassini Mission<br />
Lockheed Martin <strong>Document</strong> No. RR18<br />
August 1998<br />
Final Technical Progress Report<br />
Table of Contents (Cont'd)<br />
Task<br />
Page<br />
6.2 LAUNCH SAFETY RISK ANALYSIS PROCESS 6-9<br />
6.2.1 Analysis Objectives 6-9<br />
6.2.2 Analysis Overview 6-9<br />
6.2.3 Analysis Methods 6-10<br />
6.3 SAFETY ANALYSIS REPORTS 6-15<br />
6.3.1 Overview of Safety Analysis Reporting Activities 6-15<br />
6.3.2 Summary of Safety Analysis Results 6-19<br />
6.4 POSTULATED ACCIDENT SCENARIOS 6-25<br />
6.4.1 Launch Accidents 6-25<br />
6.4.1.1 Out-of-Orbit Reentry 6-27<br />
6.4.2 Earth Gravity Assist (EGA) Reentry 6-29<br />
6.5 ACCIDENT MODELING 6-32<br />
6.5.1 On-Pad and Early Launch Accidents 6-32<br />
6.5.1.1 Model Structure 6-32<br />
6.5.1.2 Model Description 6-35<br />
6.5.1.3 SRMU Propellant Fallback Code 6-40<br />
6.5.1.4 Full Stack Intact Impact (FSII) Code 6-41<br />
6.5.1.5 Phase 0 On-Pad Propellant Explosion Code 6-43<br />
6.5.1.6 Summary of Source Term Results 6-44<br />
6.5.2 Late Launch Accidents 6-47<br />
6.5.2.1 Reentry Envelope 6-48<br />
6.5.2.2 Out-of-Orbit Aerothermal Model 6-50<br />
6.5.2.3 Out-of-Orbit Reentry Ground Impact Analysis 6-54<br />
6.5.3 Earth Gravity Assist (EGA) Reentry Accidents 6-60<br />
6.5.3.1 VVEJGA Reentry Environments 6-61<br />
6.5.3.2 EGA Reentry Analysis Approach 6-63<br />
viii
Final Technical Report<br />
GPHS-RTGs for the Cassini Mission<br />
Lockheed Martin <strong>Document</strong> No. RR18<br />
August 1998<br />
Final Technical Progress Report<br />
Table of Contents (Cont'd)<br />
Task<br />
6.6<br />
6.5.3.3 EGA Reentry Analysis Results<br />
6.5.3.4 EGA Variability Treatment<br />
6.5.3.5 EGA Source Terms<br />
TRANSPORT/BIOLOGICAL EFFECTS MODELING<br />
Page<br />
6-72<br />
6-93<br />
6-98<br />
6-101<br />
6.6.1 Model Description 6-101<br />
6.6.1.1 SATRAP Model 6-104<br />
6.6.1.2 GEOTRAP Model 6-106<br />
6.6.1.3 HIAD Model 6-107<br />
6.6.1.4 PARDOS Model 6-109<br />
6.6.2 Pre-Launch/Early Launch Accidents 6-111<br />
6.6.3 Late Launch Accidents 6-116<br />
6.6.4 EGA Reentry 6 - 1 1 8<br />
6.7 CONSEQUENCE AND RISK PREDICTIONS 6-122<br />
6.7.1 Mission Consequence and Risk Predictions 6-122<br />
6.7.2 Discussion of Mission Consequence and Risk Predictions 6-127<br />
6.7.2.1 Pre-Launch Accidents 6-127<br />
6.7.2.2 Early Launch Accidents 6-128<br />
6.7.2.3 Late Launch Accidents 6-129<br />
6.72.4 EGA Reentry Accidents 6-129<br />
6.8 CONSEQUENCE UNCERTAINTY ANALYSIS 6-132<br />
6.8.1 Analysis Methodology 6-132<br />
6.8.2 Uncertainty Analysis Results 6-136<br />
6.9 CASSINI SAFETY TEST PROGRAM 6-140<br />
6.9.1 RTG End-On Impact Test 6-140<br />
6.9.1.1 Background 6-140<br />
6.9.1.2 Test Description 6-140<br />
ix
Final Technical Report<br />
GPHS-RTGs for the Cassini Mission<br />
Lockheed Martin <strong>Document</strong> No. RR18<br />
August 1998<br />
Task<br />
Final Technical Progress Report<br />
Table of Contents (Cont'd)<br />
Page<br />
6.9.1.3 Test Hardware 6-143<br />
6.9.1.4 Test Results 6-144<br />
6.9.2 Edge-On Fragment Test 6-155<br />
6.9.2.1 Background 6-155<br />
6.9.2.2 Test Description 6-155<br />
6.9.2.3 Test Hardware 6-157<br />
6.9.2.4 Test Results 6-159<br />
6.10 RTG TRANSPORTATION SYSTEM ANALYSIS 6-163<br />
6.10.1 Assessment Study 6-163<br />
6.10.2 Conclusion 6 - 166<br />
7 ETG MANUFACTURE, TEST, AND QUALITY ASSURANCE 7-1<br />
7.1 REESTABLISHMENT OF UNICOUPLE FABRICATION AND PROCESS<br />
IMPROVEMENTS 7-1<br />
7.1.1 Equipment Upgrades 7-2<br />
7.2 UNICOUPLE PRODUCTION 7-3<br />
7.3 CONVERTER PRODUCTION 7-5<br />
7.4 ETG PROCESSING 7-7<br />
7.4.1 Test Sequence 7-7<br />
7.4.2 E-6 ETG Processing and Acceptance Testing 7-8<br />
7.4.3 E-7 ETG Processing and Acceptance Testing 7-9<br />
7.5 QUALITY ASSURANCE PROGRAM 7-13<br />
8 GENERAL PURPOSE HEAT SOURCE FABRICATION SUPPORT 8-1<br />
9 LAUNCH SITE OPERATIONS 9-1<br />
10 MATERIALS AND EQUIPMENT STATUS 10-1<br />
10.1 RESIDUAL CASSINI UNICOUPLE HARDWARE 10-1<br />
x
Final Technical Report<br />
GPHS-RTGs for the Cassini Mission<br />
Lockheed Martin <strong>Document</strong> No. RR18<br />
August 1998<br />
Final Technical Progress Report<br />
Table of Contents (Cont'd)<br />
Task<br />
10.2 DOE THERMOELECTRIC MANUFACTURING EQUIPMENT<br />
10.3 DOE LOADING AND ASSEMBLY STATION<br />
Page<br />
10-3<br />
10-3<br />
10.3.1 Pumping Subsystems 10-6<br />
10.3.2 Gas Management System (GMS) 10-7<br />
10.3.3 Control System 10-7<br />
11 THERMOELECTRIC MODULE TESTING 11-1<br />
Appendix<br />
11.1 EIGHTEEN COUPLE MODULES 11-1<br />
11.1.1 Test Data/Results 11-1<br />
11.1.2 Assembly Process 11-18<br />
11.1.3 Improved Thermoelectric Materials and Test Results 11-24<br />
11.2 MULTICOUPLE TESTING 11-26<br />
11.2.1 Background 11-26<br />
11.2.2 Multicouple Description 11-26<br />
11.2.3 Multicouple Test Results 11-28<br />
11.2.3.1 Multicouple 1026-8 (Build 3) 11-30<br />
11.2.3.2 Multicouple M043-18 (Build 5) 11-32<br />
11.2.3.3 Multicouple M042-G4 (Build 5) 11-32<br />
11.2.3.4 Multicouple N043-5 (Build 5 — No GaP in SiGe Alloys) 11-33<br />
11.2.3.5 Multicouple M043-19 (Build 5) 11-33<br />
11.2.4 Post Test Examinations 11-33<br />
A ISSUES AND SOLUTIONS FOR RE-ESTABLISHMENT OF UNICOUPLE<br />
FABRICATION A-1<br />
xi
Final Technical Report<br />
GPHS-RTGs for the Cassini Mission<br />
Lockheed Martin <strong>Document</strong> No. RR18<br />
August 1998<br />
Final Technical Progress Report<br />
List of Illustrations<br />
Figure<br />
Page<br />
3.1-1 General Purpose Heat Source - Radioisotope Thermoelectric<br />
Generator (GPHS-RTG) 3-1<br />
3.1.1-1 General Purpose Heat Source Module 3-2<br />
3.1.1-2 Iridium Shield Cup 3-6<br />
3.1.1-3 Iridium Vent Cup 3-7<br />
3.1.1-4 Graphite Impact Shell 3-7<br />
3.1.1-5 Aeroshell 3-8<br />
3.1.2-1 Silicon Germanium Unicouple 3-10<br />
3.2-1 ETG Shipping Container 3-18<br />
3.2-2 Base and Protective Cover Assembly 3-19<br />
3.2-3 Readout Console 3-21<br />
4.1.1-1 Heritage Weld Shield (Nominal Dimensions in mm) 4-2<br />
4.1.1-2 Type ll Weld Shield (Nominal Dimensions in mm) 4-2<br />
4.1.1-3 Weld Vent Notch Change (Nominal Dimensions in mm) 4-3<br />
4.1.2-1 Electric Heat Source 4-5<br />
4.1.2-2 Inboard Heat Source Support 4-11<br />
4.1.2-3 Outboard Heat Source Support 4-13<br />
4.1.2-4 Midspan Support 4-15<br />
4.1.2-5 Silicon Germanium Unicouple 4-18<br />
4.1.2-6 Instrumented Silicon Germanium Unicouple 4-19<br />
4.1.2-7 Multifoil Insulation Assembly 4-20<br />
4.1.2-8 Thermopile Electrical Circuit 4-24<br />
4.1.2-9 Thermopile Assembly 4-24<br />
4.2.1-1 Cassini PRD Installation 4-36<br />
4.2.1-2 PRD Bellows Force Characteristic Test Schematic 4-39<br />
4.2.1-3 Bellows Force Test Room Temperature Data 4-40<br />
4.2.1-4 Bellows Force Test Operating Temperature Data 4-41<br />
xii
Final Technical Report<br />
GPHS-RTGs for the Cassini Mission<br />
Lockheed Martin <strong>Document</strong> No. RR18<br />
August 1998<br />
Final Technical Progress Report<br />
List of Illustrations (Cont'd)<br />
Figure<br />
Page<br />
4.2.1-5 Comparison of Bellows Spring Force Versus Measured Lance-<br />
Diaphragm Puncture Data 4-45<br />
4.2.1-6 PRD Qualification Dynamic Test Schematic 4-47<br />
4.2.1-7 PRD Operational Demonstration Pressure Versus Time 4-48<br />
4.2.2-1 RTD Mounted on the Ring 4-51<br />
4.2.2-2 Detail of RTD Cable Connection 4-53<br />
4.2.2-3 Detail of Revised RTD Cable Connection 4-53<br />
4.2.2-4 Wire Used in RTD Cable Assemblies 4-54<br />
4.2.2-5 RTD Cable Assembly 4-55<br />
4.3.2-1 Small RTG Configurations Modeled 4-58<br />
4.3.5-1 Mass Acceleration Curve 4-62<br />
4.3.5-2 Heat Source Module Finite Element Model 4-63<br />
4.3.5-3 Finite Element Model of RTG (Options 1 and 2) 4-64<br />
4.3.5-4 Effects of Number of Modules (Options 1 and 2) 4-65<br />
4.3.5-5 Effects of Allowable Separation (Options 1 and 2) 4-66<br />
4.3.5-6 Interface Separation Profiles (Options 1 and 2) 4-67<br />
4.3.5-7 Interface Compressive Stress (Options 1 and 2) 4-68<br />
4.3.5-8 Effects of Heat Source Support Design Options 4-69<br />
4.3.5-9 Pyrolitic Preload Stud Support (Option 4) 4-70<br />
4.3.5-10 Six-Module RTG Finite Element Model (FEM) (Option 4) 4-71<br />
5.1-1 Flight Units Test Sequence and Data Acquisition 5-1<br />
5.1-2 Heat Input Versus Time to Reach Full Power 5-2<br />
5.1-3 EHS Temperature Versus Heat Input during E-7 Processing 5-6<br />
5.1-4 ETG Isolation Resistance Versus Time during Stability Tests 5-7<br />
5.1-5 E-7 Isolation Resistance during First and Second Heat-Ups 5-7<br />
5.1-6 E-7 Isolation Resistance during Stability Tests 5-8<br />
5.1-7 E-7 ETG Pressure Versus Time during Second Stability Test 5-9
Final Technical Report<br />
GPHS-RTGs for the Cassini Mission<br />
Lockheed Martin <strong>Document</strong> No. RR18<br />
August 1998<br />
Final Technical Progress Report<br />
Figure<br />
List of Illustrations (Cont'd)<br />
Page<br />
5.1-8 E-7 Processing Configuration 5-10<br />
5.2.1-1 IAAC Vacuum Chamber with Turbomolecular Pump 5-15<br />
5.2.1-2 Effect of Elbows on Net Pumping Speed of He and CO<br />
(Calculated by Pfeiffer Vacuum Technologies) 5-15<br />
5.2.1-3 Comparison of the He and CO Partial Pressures and IAAC Net<br />
Pumping Speeds for the Cassini and Galileo/Ulysses RTGs 5-16<br />
5.2.1-4 Isolation Resistance in IAAC 5-19<br />
5.2.1-5 Cassini and Galileo/Ulysses RTGs 5-20<br />
5.2.5-1 F-2 Measured Power during Vacuum Testing 5-31<br />
5.2.5-2 F-2 Measured Internal Resistance during Thermal Vacuum Testing 5-31<br />
5.2.5-3 F-2 Measured Isolation Resistance during Thermal Vacuum Testing 5-32<br />
5.2.5-4 RTG Power vs. Time Rise 5-34<br />
5.2.5-5 Pressure Rise 5-35<br />
5.2.5-6 GMV Closed Power Loss 5-35<br />
5.2.5-7 Power Loss after GMV Closed 5-36<br />
5.2.5-8 F-5 Internal Resistance during Thermal Vacuum Testing 5-37<br />
5.2.5-9 F-5 Power vs. Voltage 5-38<br />
5.2.5-10 F-6 Measured Power Output during Thermal Vacuum Testing 5-40<br />
5.2.5-11 F-6 Measured Internal Resistance during Thermal Vacuum Testing 5-40<br />
5.2.5-12 F-6 Measured Isolation Resistance during Thermal Vacuum Testing 5-41<br />
5.2.5-13 F-7 Measured Power during Thermal Vacuum Testing 5-43<br />
5.2.5-14 F-7 Measured Internal Resistance during Thermal Vacuum Testing 5-43<br />
5.2.5-15 F-7 Measured Isolation Resistance during Thermal Vacuum Testing 5-44<br />
5.2.6-1 F-2, F-6, and F-7 Total Power 5-47<br />
5.2.6-2 F-2, F-5, and F-6 Total Power 5-48<br />
5.2.6-3 Cassini Required Power and RTG Predicted Power 5-48<br />
5.3-1 Comparison of Cassini and Galileo/Ulysses Lateral Acceptance Level Random<br />
Vibration Environments 5-51<br />
xiv
Final Technical Report<br />
GPHS-RTGs for the Cassini Mission<br />
Lockheed Martin <strong>Document</strong> No. RR18<br />
August 1998<br />
Final Technical Progress Report<br />
List of Illustrations (Cont'd)<br />
Figure<br />
Page<br />
5.3-2 Comparison of Cassini and Galileo/Ulysses Longitudinal Acceptance Level<br />
Random Vibration Environments 5-52<br />
5.3-3 Comparison of Acoustic Test Data with Qualification Requirements 5-52<br />
5.3-4 Comparison of Shock Test Data with Qualification Requirements 5-53<br />
5.4-1 Galileo RTGs Power Output (F-1 + F-4) 5-55<br />
5.4-2 Galileo RTG F-1 Power 5-56<br />
5.4-3 Galileo RTG F-4 Power 5-57<br />
5.4-4 Galileo RTGs F-1 and F-4 Power 5-57<br />
5.4-5 Galileo RTD Temperatures 5-58<br />
5.4-6 Galileo RTG Power at Spacecraft Bus 5-59<br />
5.4-7 Galileo Spacecraft RTG Power Status Report (Launch 18 October 1989) 5-60<br />
5.4-8 Ulysses RTG F-3 Power 5-60<br />
5.4-9 Ulysses Extended Mission Power 5-62<br />
6.1-1 Cassini Interplanetary Trajectory, VVEJGA 6-2<br />
6.1-2 Cassini Titan IV Launch Vehicle Features 6-5<br />
6.1-3 Cassini Spacecraft Configuration 6-7<br />
6.2-1 Schematic of the Launch Approval Process 6-9<br />
6.2-2 Top-Level <strong>View</strong> of the Basic Elements in the Risk Analysis Process 6-11<br />
6.3-1 Source Terms by Mission Segment 6-22<br />
6.3-2 50 Year Health Effects without de-minimis (by Mission Segment) 6-24<br />
6.4-1 EGA Short Term Reentry Angle Conditional Probability Distributions<br />
for 800 km and 500 km Swingbys 6-30<br />
6.4-2 EGA Short Term Latitude Impact Conditional Probability Distributions<br />
for 800 km and 500 km Swingbys 6-31<br />
6.5.1-1 Structure of LASEP-T Model 6-34<br />
6.5.1-2 FSII Environment Paths for RTGs 6-43<br />
6.5.2-1 Reentry Envelope 6-49<br />
x v
Final Technical Report<br />
GPHS-RTGs for the Cassini Mission<br />
Lockheed Martin <strong>Document</strong> No. RR18<br />
August 1998<br />
Final Technical Progress Report<br />
List of Illustrations (Cont'd)<br />
Figure<br />
6.5.2-2 One Dimensional Layered REKAP Model for GPHS Module 6-51<br />
Page<br />
6.5.2-3 GPHS Module Stagnation Point Recession Contours 6-52<br />
6.5.2-4 Cassini SV Instantaneous Impact Point Distribution 6-57<br />
6.5.2-5 Module Dispersion within a Typical Demographic Cell 6-57<br />
6.5.2-6 Particle Size Distributions for Out-of-Orbit Reentry Ground Impacts<br />
- Cases 5.2/5.3 6-59<br />
6.5.3-1 Comparison of Reentry Trajectories for a GPHS Module and a Typical<br />
Ballistic Reentry Vehicle (BRV) 6-62<br />
6.5.3-2 Trajectory-Based Coupling of Flowfield/Radiation Analyses with Transient Heating<br />
Computations 6-67<br />
6.5.3-3 Selection of Thermostructural Analysis Points - Shallow (-7°) Trajectory 6-68<br />
6.5.3-4 CFD Computational Matrix and Comparison of Steep, Shallow, and<br />
Intermediate Trajectory Stagnation-Point Temperature Histories 6-74<br />
6.5.3-5 Comparison of the Heat-Flux Components at the Stagnation Point<br />
along the Steep, Shallow, and Intermediate Trajectories 6-75<br />
6.5.3-6 Comparison of the Total Heat-Flux at the Stagnation Point along<br />
the Steep, Shallow, and Intermediate Trajectories 6-75<br />
6.5.3-7 Maximum Drag Acceleration vs. Path Angle - Gravity Assist Reentry 6-78<br />
6.5.3-8 Time to Stabilize "Broadside" for GIS (Following Release from<br />
Face-On Stable Module) 20° Flight Path Angle/EGA 6-81<br />
6.5.3-9 Time to Stabilize "Broadside" for GIS (Following Release from<br />
Tumbling Module) 20° Flight Path Angle/EGA 6-82<br />
6.5.3-10 GIS Roll Rate Distribution (FOS Module) 6-83<br />
6.5.3-11 GIS Surface Temperature History for Non-Spinning, Broad-Side Stable<br />
along the Steep Trajectory 6-85<br />
6.5.3-12 GIS Recession History for Non-Spinning, Broad-Side Stable<br />
along the Steep Trajectory 6-86<br />
6.5.3-13 GIS Surface Temperature History Non-Spinning, Broad-Side Stable<br />
along the Intermediate Trajectory 6-87<br />
6.5.3-14 GIS Recession History Non-Spinning, Broad-Side Stable along the<br />
Intermediate Trajectory 6-87<br />
6.5.3-15 Critical Flight Data at Stagnation Point vs. Time - GIS Assembly<br />
Steep (-90°) Trajectory, Side-On-Stable Attitude, 139.7 kft Release 6-89<br />
xvi
Final Technical Report<br />
GPHS-RTGs for the Cassini Mission<br />
Lockheed Martin <strong>Document</strong> No. RR18<br />
August 1998<br />
Figure<br />
Final Technical Progress Report<br />
List of Illustrations (Cont'd)<br />
Page<br />
6.5.3-16 Particle Size Distribution for y = -20 0, Fuel Released at 85% GIS Ablation 6-92<br />
6.5.3-17 Particle Size Distribution for y= -90°, Fuel Released at 80% GIS Ablation 6-93<br />
6.5.3-18 VVEJGA GPHS Reentry Event Sequence Diagram 6-95<br />
6.5.3-19 Reentry Sequence Diagram for Aeroshell Failure, Non-Face-On-Stable,<br />
Steep Reentry 6-96<br />
6.5.3-20 Reentry Sequence Diagram for Aeroshell Failure, Face-On-Stable,<br />
Steep Reentry 6-97<br />
6.6-1 Overview of Consequence Analysis Process 6-102<br />
6.6-2 Exposure Pathways Considered in the Dose Calculation 6-109<br />
6.6-3 Combinations of Source Terms Considered in Phase 1 Consequence<br />
Analysis 6-113<br />
6.8-1 Total Mission 50 Year Health Effects (without de minimis) 6-139<br />
6.9-1 RTG End-On Impact Test Schematic 6-141<br />
6.9-2 RTG End-On Impact Test Stand and Test Setup 6-142<br />
6.9-3 Setup of Steel Aperture Plate and Concrete Impact Target 6-143<br />
6.9-4 Simulated RTG Test Article — End-On Impact Test 6-145<br />
6.9-5 Heat Source Stack Configuration for RTG End-on Impact Tests 6-146<br />
6.9-6 RTG Outer Shell Damage after 57 m/s Impact 6-146<br />
6.9-7 Fueled Clad SC0076 after 57 m/s Impact Test 6-148<br />
6.9-8 Simulated RTG after 77 m/s Impact Test 6-151<br />
6.9-9 Fueled Clad SC0092 (Module #1) after 77 m/s Impact Test 6-153<br />
6.9-10 Edge-On Fragment Test Setup 6-156<br />
6.9-11 Heat Source/Fragment Impact Orientation 6-157<br />
6.9-12 Simulated RTG Test Article (RTG-3) — Edge-On Fragment Impact Test 6-158<br />
6.9-13 Heat Source Configuration for Edge-On Fragment Impact Test 6-159<br />
6.9-14 Simulated RTG after Fragment Impact Test 6-160<br />
6.9-15 Fueled Clad SC0126 (A GIS) after Fragment Impact Test 6-161<br />
6.10-1 Shipping Container Baseline Configuration 6-164<br />
xvii
Final Technical Report<br />
Acronyms
Final Technical Report<br />
GPHS-RTGs for the Cassini Mission<br />
Lockheed Martin <strong>Document</strong> No. RR18<br />
August 1998<br />
Final Technical Report<br />
Acronym List<br />
3DMP Three Degree-of-Freedom Trajectory Prediction Tool<br />
3DOF Three Degree-of-Freedom<br />
6DOF Six Degree-of-Freedom<br />
ACS Active Cooling System<br />
ADS Automatic Destruct System<br />
AIC Accident Initiating Condition<br />
AMAD Activity Media Aerodynamic Diameter<br />
AOC Accident Outcome Condition<br />
ASI Italian Space Agency<br />
BC! Bare Clad Impact<br />
BC L Battelle Columbus Lab<br />
BIE Basic Initiating Event<br />
BO M Beginning of Mission<br />
BPCA Base and Protective Cover Assembly<br />
BRV Ballistic Reentry Vehicle<br />
CBCF Carbon Bonded Carbon Fiber<br />
CCAS Cape Canaveral Air Station<br />
CP D Cumulative Probability Distribution<br />
CET Component Engineering Test<br />
CFM Cubic Feet per Minute<br />
CRAF Comet Rendezvous Asteroid Flyby<br />
CSC Converter Shipping Container<br />
CSDS Command Shutdown and Destruct System<br />
CSR Converter Support Ring<br />
CVS Clad Vent Set<br />
DAS Data Acquisition System<br />
DCF Dose Conversion Factor<br />
DFSAR Draft Final Safety Analysis Report<br />
ACR-1
Final Technical Report<br />
GPHS-RTGs for the Cassini Mission<br />
Lockheed Martin <strong>Document</strong> No. RR18<br />
August 1998<br />
Final Technical Report<br />
Acronym List (Cont'd)<br />
DMM Digital Multimeter<br />
DMP Degrees of Motion Prediction<br />
DOE Department of Energy<br />
DOF Degrees-of-Freedom<br />
DR Defect Report<br />
EC N Engineering Change Notice<br />
EDST Eastern Daylight Savings Time<br />
EHS Electric Heat Source<br />
EIS Environmental Impact Statement<br />
EMQ Engineering, Manufacturing, Quality<br />
EOM End of Mission<br />
ESA Early Safety Assessment<br />
ET Engineering Test<br />
ETG Electrically Heated Thermoelectric Generator<br />
ETG-SC ETG Shipping Container<br />
FA Flight Acceptance<br />
FC Fueled Clad<br />
FE Final Environment<br />
FEM Finite Element Model<br />
FOS Face-on-Stable<br />
FRB Failure Review Board<br />
FSAR Final Safety Analysis Report<br />
FSII Full Stack Intact Impact<br />
FTS Flight Termination System<br />
FWPF Fine Weave Pierced Fabric<br />
GE General Electric<br />
GESP General Electric Space Power<br />
GFE Government Furnished Equipment<br />
ACR-2
Final Technical Report<br />
GPHS-RTGs for the Cassini Mission<br />
Lockheed Martin <strong>Document</strong> No. RR18<br />
August 1998<br />
Final Technical Report<br />
Acronym List (Cont'd)<br />
G IS Graphite Impact Shell<br />
GMV Gas Management Valve<br />
GPHS General Purpose Heat Source<br />
GPHSA General Purpose Heat Source Assembly<br />
GPV Gas Processing Valve<br />
G SC Gas Service Cart<br />
GSE Ground Support Equipment<br />
HOVI Hydrogen Oxygen Vertical Impact<br />
HSA Heat Source Assembly<br />
IAAC Inert Atmosphere Assembly Chamber<br />
IBSA Inboard Heat Source Support Assembly<br />
I CD Interface Control Drawing<br />
I HS Isotope Heat Source<br />
IIP Instantaneous Impact Point<br />
INSRP Interagency Nuclear Safety Review Panel<br />
JPL Jet Propulsion Laboratory<br />
KSC Kennedy Space Center<br />
LANL Los Alamos National Laboratory<br />
LAS Loading and Assembly Station<br />
LC Launch Complex<br />
LeRC Lewis Research Center<br />
LES Lincoln Experimental Satellites<br />
LHS Latin Hypercube Sampling<br />
LM Lockheed Martin<br />
LMMS Lockheed Martin Missiles & Space<br />
LV Launch Vehicle<br />
LVA Launch Vehicle Adapter<br />
MECO Main Engine Cut-Off<br />
ACR-3
Final Technical Report<br />
GPHS-RTGs for the Cassini Mission<br />
Lockheed Martin <strong>Document</strong> No. RR18<br />
August 1998<br />
Final Technical Report<br />
Acronym List (Cont'd)<br />
MES Main Engine Start<br />
MET Mission Elapsed Time<br />
MHW Multihundred Watt<br />
MRA Mid-Ring Assembly<br />
MRB Material Review Board<br />
MRMF Module Reduction and Monitoring Facility<br />
MSA Midspan Support Assembly<br />
NASA National Aeronautics and Space Administration<br />
NASDA National Space Development Agency of Japan<br />
NR Non-Conformance Report<br />
OBSA Outboard Heat Source Support Assembly<br />
0 R Oak Ridge<br />
OSA Office of Special Applications<br />
O S C Orbital Sciences Corporation<br />
OSTP Office of Science and Technology Policy<br />
PDF Probability Distribution Function<br />
P/FR Problem/Failure Report<br />
PHSF Payload Hazardous Servicing Facility<br />
PLF Payload Fairing<br />
POF Probability of Failure<br />
POR Probability Of Release<br />
PRA Probabilistic Risk Assessment<br />
PRD Pressure Relief Device<br />
QAP Quality Assurance Program<br />
QAPP Quality Assurance Program Plan<br />
RAS Representative Accident Scenario<br />
RGA Residual Gas Analyzer<br />
ROC Readout Console<br />
ACR-4
Final Technical Report<br />
GPHS-RTGs for the Cassini Mission<br />
Lockheed Martin <strong>Document</strong> No. RR18<br />
August 1998<br />
Final Technical Report<br />
Acronym List (Cont'd)<br />
RSA RTG Safety Assessment<br />
RTD Resistance Temperature Device<br />
RTG Radioisotope Thermoelectric Generator<br />
RTGF Radioisotope Thermoelectric Generator Facility<br />
SEIS Supplemental Environmental Impact Statement<br />
SEM/EDS Scanning Electron Microscope/Energy Dispersive Spectroscopy<br />
SER Safety Evaluation Report<br />
SMB Steady Misdirected Burn<br />
SNL Sandia National Laboratory<br />
S 01 Saturn Orbit Insertion<br />
SRESP SRMU Propellant Fallback Response Model<br />
SRM Solid Rocket Motor<br />
SRMU Solid Rocket Motor Upgrade<br />
SRP Savannah River Plant<br />
SVI I Space Vehicle Intact Impact<br />
SVT Safety Verification Test<br />
TA Type Acceptance<br />
TBVD Total Boost Vehicle Destruct<br />
TGA Thermogravimetric Analysis<br />
TMP Turbo-Molecular Pump<br />
TSP Transportation System Package<br />
USAR Updated Safety Analysis Report<br />
VCA Vent Chamber Assembly<br />
VEEGA Venus-Earth-Earth-Gravity-Assist<br />
VVEJGA Venus-Venus-Earth-Jupiter-Gravity-Assist<br />
ACR-5
Section 1<br />
Introduction
Final Technical Report<br />
GPHS-RTGs for the Cassini Mission<br />
Lockheed Martin <strong>Document</strong> No. RR18<br />
August 1998<br />
SECTION 1<br />
INTRODUCTION<br />
This document is the Final Report for the GPHS-RTGs (General Purpose Heat Source-<br />
Radioisotope Thermoelectric Generators) in support of the Cassini RTG Program. This<br />
program spans the period 11 January 1991 to 31 December 1998. As noted in the<br />
following historical summary, this program encountered a number of changes in direction,<br />
schedule, and scope over that period. The report provides a comprehensive summary of all<br />
the varied aspects of the program over its seven and a quarter years, and highlights those<br />
aspects that provide information beneficial to future radioisotope programs.<br />
In addition to summarizing the scope of the Cassini GPHS-RTG Program provided as<br />
background, this introduction includes a discussion of the scope of the final report and offers<br />
reference sources for information on those topics not covered.<br />
Much of the design heritage of the GPHS-RTG comes from the Multi-Hundred Watt (MHW)<br />
RTGs used on the Lincoln Experimental Satellites (LES) 8/9 and Voyager spacecraft. The<br />
design utilized for the Cassini program was developed, in large part, under the GPHS-RTG<br />
program which produced the Galileo and Ulysses RTGs. Reports from those programs<br />
included detailed documentation of the design, development, and testing of converter<br />
components and full converters that were identical to, or similar to, components used in the<br />
Cassini program. Where such information is available in previous reports, it is not repeated<br />
here.<br />
1.1 SCOPE OF CASSINI GPHS-RTG PROGRAM<br />
The Cassini GPHS-RTG program was initiated by the General Electric Company (GE) in<br />
1991 under Department of Energy (DOE) contract DE-ACO3-91SF18852, entitled "General<br />
Purpose Heat Source Radioisotope Thermoelectric Generator (GPHS-RTG) for the<br />
CRAF/Cassini RTG Program". As a result of business transactions during the period of this<br />
contract, in 1993 GE Aerospace became Martin Marietta Aerospace, and in 1995 Martin<br />
Marietta became part of Lockheed Martin. GE/Martin Marietta documents and equipment<br />
were transferred to Lockheed Martin.<br />
1-1
Final Technical Report<br />
GPHS-RTGs for the Cassini Mission<br />
Lockheed Martin <strong>Document</strong> No. RR18<br />
August 1998<br />
The program was sponsored by the DOE Office of Special Applications and administered by<br />
the Oakland Operations Office. Initially, this was a 74 month program consisting of the<br />
following scope:<br />
1. Serve as System Integrator working with NASA and DOE to establish system<br />
specifications and interface definitions for the CRAF (Comet Rendezvous-Asteroid<br />
Flyby) and Cassini (the Saturn Orbiter/Titan Probe) missions and to update the<br />
GPHS-RTG design to meet mission requirements.<br />
2. Establish and qualify manufacturing, testing, and inspection facilities for unicouples<br />
and ETGs (Electrically Heated Thermoelectric Generators).<br />
3. Manufacture, assemble, test, and deliver three ETGs.<br />
4. Provide technical support for the fueling of RTGs and launch/field support for<br />
launch-site activities.<br />
5. Conduct an appropriate RTG safety program and prepare safety assessments.<br />
6. Fabricate, but not assemble, a fourth ETG.<br />
7. Provide an option to assemble and to support fueling of a fourth RTG.<br />
The schedule for accomplishing this scope was based on providing two RTGs for each<br />
mission and a common spare (one unfueled ETG and one fueled RTG remained from the<br />
Galileo/Ulysses program) for launch in August 1995 (CRAF) and April 1996 (Cassini). The<br />
program was to end in October 1996, five months after the Cassini launch. It was stipulated<br />
that the RTGs for these missions would be fabricated with few, if any, changes from existing<br />
converter and heat source designs.<br />
In 1992 NASA canceled the CRAF mission and delayed the launch of Cassini. The GPHS-<br />
RTG program was subsequently redirected to provide two (2) new ETGs for conversion to<br />
RTGs and to fabricate but not to assemble a third ETG. The latter was to be assembled in<br />
part and packaged for long term storage. The tasks which resulted from the redirected<br />
program were:<br />
Task 1 Spacecraft Integration and Liaison<br />
Establish the two top level specifications for the missions: a) GPHS-RTG Systems<br />
Specification and b) Environmental Criteria and Test Requirements Specification for the<br />
1-2
Final Technical Report<br />
GPHS-RTGs for the Cassini Mission<br />
Lockheed Martin <strong>Document</strong> No. RR18<br />
August 1998<br />
GPHS-RTG. This was to be done via liaison with the user (NASA/JPL) and the DOE Office<br />
of Special Applications (OSA).<br />
Task 2 Engineering Support<br />
Establish engineering documentation for the Cassini GPHS-ETGs, GPHS-RTGs, and<br />
ground support equipment. Convert all GPHS-RTG project engineering documentation (i.e.<br />
engineering drawings, specifications, procedures, etc.) to the current contractor engineering<br />
documentation system. Incorporate design changes required to accommodate unique<br />
Cassini mission/spacecraft requirements with approval of DOE OSA.<br />
Establish acceptance criteria for the following Electrically-Heated Thermoelectric Generator<br />
(ETG) and RTG units which will be transferred from the Galileo/Ulysses Project to the<br />
Cassini RTG project: a) the spare F-5 GPHS-RTG, and b) the spare E-2 ETG and associated<br />
components.<br />
Perform structural, thermal, and thermoelectric design analyses of the GPHS-RTG in order<br />
to support definitive design bases in such areas as system response to launch dynamic<br />
loads, heat source support and preload, thermal interface definition, radiation properties,<br />
and cooling requirements during and prior to launch. Develop power predictions for<br />
specified mission profiles.<br />
Provide technical review and oversight of ETG/RTG handling, fueling, acceptance testing,<br />
qualification of the ETG to RTG conversion process, and hardware acceptance and<br />
operations at the Government Fueling Agency facility as defined in the Contractor/Fueling<br />
Agency Interface Working Agreement. The contractor shall also interface with various<br />
Government Heat Source Production facilities as defined in the Encapsulated Fuel Form<br />
Interface Working Agreement.<br />
Task 3 Safety<br />
Prepare safety assessments of the GPHS-RTGs based upon use on the Mariner Mark II<br />
spacecraft with Titan IV/Centaur launch vehicles. Prepare a Safety Test Plan, provide<br />
engineering and/or quality oversight for safety tests conducted at Government laboratories,<br />
perform response analysis, prepare the Safety Analysis Reports, and participate in the<br />
1-3
Final Technical Report<br />
GPHS-RTGs for the Cassini Mission<br />
Lockheed Martin <strong>Document</strong> No. RR18<br />
August 1998<br />
Interagency Nuclear Safety Review Panel (INSRP) reviews with DOE and NASA to obtain<br />
launch approvals.<br />
Task 4 Qualified Unicouple Production<br />
Re-establish a unicouple manufacturing facility which meets existing Government furnished<br />
specifications and procedures for manufacture of thermoelectric materials and fabrication of<br />
unicouple devices. Provide for the training and qualifying of operators, supervisors and<br />
inspectors. Qualify the production facility and procedures by the manufacture of<br />
qualification lots of unicouples and by the fabrication and test of three qualification 18<br />
couple module assemblies. Two 18 couple module assemblies are to be tested at<br />
accelerated life test conditions and one at normal operating conditions.<br />
Task 5 ETG Fabrication, Assembly, and Test<br />
Manufacture, assemble, acceptance test and deliver to the Government Fueling Agency two<br />
(2) ETGs and deliver to DOE parts and sub-assemblies for a third ETG. Adhere to national,<br />
state, and local safety, health, and environmental laws in the manufacture of ETGs.<br />
Maintain in place, to the end of the contract, the manufacturing line for unicouple fabrication<br />
after all unicouples are completed.<br />
Task 6 Ground Support Equipment (GSE)<br />
Determine and implement the necessary work required to refurbish and/or upgrade existing<br />
Government Furnished Equipment (GFE).<br />
Task 7 RTG Shipping and Launch Support<br />
Participate in the design and development effort of another contractor fabricating a new RTG<br />
transportation system. Provide launch site support for the receiving, shipping, storage,<br />
maintenance, and flight preparation of RTGs, including spacecraft integration, support<br />
activities, and testing of the RTGs.<br />
Task 8 Designs, Reviews, Mission Applications<br />
Participate in RTG application and improvement studies for the Department of Energy as<br />
authorized by DOE OSA.
Task 9 Program Management, Quality Assurance and Reliability<br />
Final Technical Report<br />
GPHS-RTGs for the Cassini Mission<br />
Lockheed Martin <strong>Document</strong> No. RR18<br />
August 1998<br />
Establish and implement project management/control, quality assurance, environmental,<br />
and reliability activities required for the contract with the focus on providing three RTGs for<br />
the Cassini mission to be launched in October 1997. The program period of performance<br />
was extended to April 1998. Task 5 was further modified to maintain the unicouple<br />
fabrication facility by providing periodic maintenance. Because a new launch vehicle<br />
(Titan IV-B) was to be used to launch the Cassini spacecraft, together with two Venus<br />
swingbys followed by an Earth swingby, the safety program was considerably expanded to<br />
include effects of an inadvertent Earth reentry during the swingby at velocities much greater<br />
than previously analyzed.<br />
1.2 SCOPE OF FINAL REPORT<br />
This report focuses on the GPHS-RTG, as provided for use on the Cassini mission. The<br />
report is organized to begin with the requirements summary, excerpted from the appropriate<br />
system and product specifications. This is followed by a description of the flight RTGs, the<br />
ETGs insofar as they differ from the RTGs, and the principal refurbishments incorporated<br />
into the GSE. The principal difference between the Cassini RTGs and the previous RTGs,<br />
namely the PRD (Pressure Relief Device) is discussed. A discussion of the work which went<br />
into the re-establishment of the unicouple production, together with improvements in the<br />
processes and their requalification, are also presented. The database of thermoelectric<br />
performance provided by 18 couple module and other unicouple testing is introduced as<br />
part of the supporting data discussion. This approach addresses the principal activities<br />
defined in the statement of work.<br />
The RTG performance is addressed as a separate topic. This section of the report provides<br />
summaries of the results of the electrical performance tests, power projections and<br />
comparisons with flight data. The latter is limited to the time from launch to 1 April 1998.<br />
This section also includes a summary of the qualification program and RTG flight<br />
performance data from the Galileo and Ulysses missions. Other topics of special interest,<br />
advanced thermoelectric material developments, multicouple tests, a solid rivet attachment<br />
study, a small RTG study, and residual hardware are treated separately.<br />
1-5
1.3 REFERENCE DOCUMENTATION<br />
Final Technical Report<br />
GPHS-RTGs for the Cassini Mission<br />
Lockheed Martin <strong>Document</strong> No. RR18<br />
August 1998<br />
All drawings and specifications referenced in this report are Lockheed Martin documents<br />
unless otherwise specified. Much of the documentation for the GPHS-RTG activities for the<br />
Cassini mission is contained in previously released reports. It is beyond the scope of this<br />
report to duplicate that information. The following is a listing of significant documents, along<br />
with a discussion of the information they provide.<br />
Design Review Report for Updated GPHS-RTG<br />
CDRL A.2, dated 31 March 1992, presents the design changes, rationale, and approach for<br />
the Cassini set of modifications e.g., the Pressure Relief Device which was modified in order<br />
to accommodate launch on the Titan IV-B to be barometrically operated similar to the design<br />
used on the MHW RTG.<br />
GPHS-RTG Interface Working Agreement for the Cassini RTG Program<br />
GESP-7231, dated 8 February 1996, depicts the responsibilities of Lockheed Martin, Mound<br />
EG&G, and DOE relative to heat source assembly and the RTG.<br />
Product Specification for the General Purpose Heat Source for Cassini<br />
Specification PS23009146, dated 14 June 1995, updates the specification for the GPHS<br />
previously developed under the Ulysses and Galileo programs to reflect the Cassini<br />
changes. The changes include an increase in the fuel load and modification of the fuel<br />
capsule weld shield.<br />
Product Specification for the GPHS-ETG for Cassini<br />
ETG specification PS23009147, dated 2 May 1995, updates the specification to the Cassini<br />
requirements. These changes were the result of changes in requirements due to launch<br />
vehicle environments, etc.<br />
Product Specification for the GPHS-RTG for Cassini<br />
Specification PS23009148, dated 31 January 1996, incorporates and updates the RTG<br />
product specification to the requirements for the Cassini mission. These changes were the<br />
result of changes in requirements due to launch vehicle environments, etc.
Final Technical Report<br />
GPHS-RTGs for the Cassini Mission<br />
Lockheed Martin <strong>Document</strong> No. RR18<br />
August 1998<br />
System Specification for the GPHS-RTG for Cassini<br />
Specification SS23009149, dated 5 March 1996, incorporates changes and updates the<br />
system requirements, consistent with the Cassini mission. These changes were the result of<br />
changes in requirements due to launch vehicle environments, etc.<br />
Environmental Criteria and Test Requirements for the GPHS-RTG<br />
Specification PS2300150, dated 6 March 1996, incorporates and updates the<br />
environmental criteria to which the Cassini RTG could be subjected and updates the<br />
acceptance test requirements.<br />
Final Reliability Assessment Report for the Cassini Mission<br />
GESP-7252, dated 14 March 1997, provides a summary assessment of the reliability of the<br />
GPHS-RTG in meeting the end of mission power requirements for the Cassini mission.<br />
RTG Design Qualification Report<br />
GESP-7242, dated 11 August 1995, summarizes the results of analyses, inspections, and<br />
tests performed to demonstrate that the General Purpose Heat Source - Radioisotope<br />
Thermoelectric Generator (GPHS-RTG) is qualified for the Cassini mission in accordance<br />
with the requirements of specification PS23009148.<br />
RTG Safety Assessment Report<br />
This report, dated 5/7/93, gives an early assessment of the safety of the RTG design relative<br />
to its performing its mission.<br />
Final Safety Analysis Report (Including Addendum)<br />
CDRL C.3, dated November 1996 through May 1997. This is the final in a series of reports<br />
which analyze RTG safety relative to fuel release throughout all phases of flight. Launch<br />
environments for the Titan IV-B are used in assessing the impact of a series of launch<br />
accident scenarios, reentry of the GPHS due to failure to attain the proper trajectory, and the<br />
effect of an inadvertent reentry during the Earth swingby.<br />
Monthly Technical Progress Reports<br />
Monthly reports were issued for the duration of the program. These reports provide<br />
technical detail on activities occurring during the reporting period as they occurred.<br />
1-7
Final Technical Report<br />
GPHS-RTGs for the Cassini Mission<br />
Lockheed Martin <strong>Document</strong> No. RR18<br />
August 1998<br />
Plans, procedures, and topical/engineering reports were issued during the program's<br />
period of performance (some in the GESP series) and are specifically applicable to the<br />
GPHS-RTG for the Cassini program. These are listed in the appropriate sections.
Section 2<br />
Requirements
Final Technical Report<br />
GPHS-RTGs for the Cassini Mission<br />
Lockheed Martin <strong>Document</strong> No. RR18<br />
August 1998<br />
SECTION 2<br />
REQUIREMENTS<br />
Requirements for the GPHS and GPHS-RTG are defined in the following Lockheed Martin<br />
specifications:<br />
PS23009146B Product Specification, General Purpose Heat Source for Cassini<br />
PS23009148E Product Specification, GPHS-RTG for Cassini<br />
In addition, the physical interface requirements for the GPHS-RTGs with the Cassini<br />
spacecraft are defined in the following JPL (Jet Propulsion Laboratory) drawing:<br />
10135938B Radioisotope Thermoelectric Generator Interface Control Drawing<br />
Following in this section is a discussion of the GPHS and GPHS-RTG requirements and<br />
physical characteristics excerpted from the above documents. The specification paragraph<br />
numbers do not coincide with the paragraph numbers of this report. The specification<br />
paragraph number is listed herein in parentheses following the paragraph title.<br />
2.1 GPHS REQUIREMENTS<br />
The following requirements for the GPHS are excerpted from PS23009146B, "Product<br />
Specification, General Purpose Heat Source for Cassini." The specification should be<br />
referenced for a full description of detailed requirements. Further, in some instances,<br />
individual requirements have remained unchanged from those of the previous program<br />
documented in report GESP-7209. Both the specification and report are useful<br />
supplements to the information contained herein. As noted above, numbers in parenthesis<br />
following paragraph titles are specification section numbers.<br />
2.1.1 Operating Life (3.2.1.1)<br />
The required period of operation for the GPHS Assembly (GPHSA) shall be 18 years,<br />
including two years storage and test in the RTG and 16 years mission operation.
2.1.2 Storage Life (3.2.1.2)<br />
Final Technical Report<br />
GPHS-RTGs for the Cassini Mission<br />
Lockheed Martin <strong>Document</strong> No. RR18<br />
August 1998<br />
The GPHSA shall perform satisfactorily after two years storage and test in the RTG. Storage<br />
and test time are defined as commencing with installation of the heat source assembly into<br />
the converter and ending at Beginning of Mission (BOM). Storage of fuel pellets or fueled<br />
modules in their respective storage containers shall be consistent with satisfying the<br />
requirements for the GPHSA as specified herein.<br />
2.1.3 Fuel (3.2.1.3)<br />
The fuel form shall be plutonium dioxide. The 238Pu content of the total plutonium isotopes<br />
(including 236PU, 238 PU, 239PU, 240pu , 241 Pu, and 242Pu) in the fuel powder shall not be less<br />
than 82.0 percent, as of the date of precipitation. The 236 Pu present in the fuel powder shall<br />
not exceed 2 micrograms/gram of the total plutonium content, as of the date of precipitation.<br />
Detailed requirements for fuel feed powder shall be as defined in LANL Specification<br />
26Y-318180.<br />
2.1.4 Thermal Power (3.2.1.4)<br />
2.1.4.1 Fuel Pellet<br />
No thermal inventory requirements are specified for the fuel pellet. However, in order to<br />
meet the thermal output requirement of the fueled clad, each fuel pellet shall be pressed to<br />
contain 151.0 +.7/-.5g of fuel. Detailed requirements for the fuel pellet shall be as defined in<br />
LANL specification 26Y-318181.<br />
2.1.4.2 Fueled Clad<br />
The thermal output of a fueled clad shall be 62.5 + 2.0/-1.5 watts thermal. Detailed<br />
requirements for the fueled clad shall be in accordance with LANL specification 26Y-<br />
318182.<br />
2.1.4.3 Module<br />
As of Cassini BOM (October 1997), the variation of thermal output from GIS to GIS within a<br />
module shall be less than 10%. Also when referenced to BOM, the total thermal output of<br />
each module shall be 236 to 240 watts, however, module thermal outputs which are less<br />
2-2
Final Technical Report<br />
GPHS-RTGs for the Cassini Mission<br />
Lockheed Martin <strong>Document</strong> No. RR18<br />
August 1998<br />
than or greater than these values are acceptable, provided the thermal output requirements<br />
of the GPHSA are satisfied.<br />
2.1.4.4 Heat Source Assembly (18 Modules)<br />
• The difference between the total thermal output of adjacent groups of three stacked<br />
modules shall not be more than 20 thermal watts.<br />
• The difference between the total thermal output of the two nine packs of modules within<br />
the RTG shall not be more than 20 thermal watts.<br />
• The total heat source thermal output per RTG at BOM shall be a minimum of 4258 watts.<br />
This requirement shall be met after accounting for all measurement uncertainties, e.g.,<br />
calorimetry uncertainty.<br />
Note: The F-5 RTG is calculated to have a heat source thermal output of 4029 watts at<br />
BOM. This information is provided for reference only.<br />
2.1.5 Mission Temperature<br />
The GPHSA shall be capable of operating in the converter in a space vacuum of 1 x 10 -10<br />
torr for a period of 16 years at an exterior surface temperature of 1100°C or less.<br />
2.1.6 Neutron Emission Rate (3.2.1.8)<br />
The specific neutron emission rate from the unshielded GPHSA shall not exceed 7.0 x 10³<br />
neutron/second/gram of plutonium-238, exclusive of any neutron multiplication obtained<br />
from the configuration of the fueled clads in the assembled heat source or attenuation within<br />
the RTG.<br />
2.1.7 Weight (3.2.2.2)<br />
The unit weight of a fueled module, exclusive of lock members, shall not exceed 3.20 lbs.<br />
The weight of the GPHSA, including lock members but excluding the midspan support plate,<br />
shall not exceed 57.70 lbs.<br />
2.1.8 Coatings (3.3.1.6)<br />
Thermal control and material protective coatings, if required, shall be stable for a period of<br />
10.75 years at mission operating conditions and two years storage environment.<br />
2-3
2.1.9 Cleanliness (3.3.7.1)<br />
Final Technical Report<br />
GPHS-RTGs for the Cassini Mission<br />
Lockheed Martin <strong>Document</strong> No. RR18<br />
August 1998<br />
All fabrication and assembly operations shall be done in a manner that will prevent the<br />
inclusion of foreign substances that would degrade the performance of individual<br />
components or assemblies. .As a minimum, all parts shall be visually clean. Additional<br />
requirements with respect to cleanliness level and/or procedures shall be defined on the<br />
individual drawings and specifications. Just prior to installation in the converter, each<br />
module shall be cleaned by vacuuming on each of its six external faces. The cleaning<br />
process shall be repeated and the module visually inspected for damage due to the vacuum<br />
process. The module shall then be vacuum cleaned a third time with a tool containing an<br />
in-line filter. The filter shall be inspected for conductive particles using a 16X stereoscope.<br />
Acceptable criteria for graphite felt particles are:<br />
Allowable Quality Linear Dimension<br />
None >30 mils<br />
1 10 to 30 mils<br />
5 5 to 10 mils<br />
no criteria
2.2.1 Operating Life (3.2.1.1)<br />
Final Technical Report<br />
GPHS-RTGs for the Cassini Mission<br />
Lockheed Martin <strong>Document</strong> No. RR18<br />
August 1998<br />
The required period of operation for the RTG shall be 18 years, including two years in test<br />
and storage, and 16 years mission operation. For the F-5 RTG only, the required period of<br />
operation shall be 28 years, including twelve years in test and storage, and 16 years<br />
mission operation.<br />
2.2.2 Storage Life (3.2.1.2)<br />
RTGs, except the F-5 unit, shall be capable of satisfactory performance after a maximum<br />
storage period of two years. F-5 shall be capable of satisfactory performance after a<br />
maximum storage period of twelve years. RTGs shall be pressurized with inert gas during<br />
storage, maintained in a short-circuited condition, and stored in a facility that maintains an<br />
inert, temperature-controlled environment.<br />
2.2.3 Electrical Requirements (3.2.1.3)<br />
2.2.3.1 Voltage (3.2.1.3.1)<br />
The RTG shall supply power as specified below when operated at 30 +0.7/-0.5 volts DC, as<br />
measured at the output power connector.<br />
2.2.3.2 Acceptance Power (3.2.1.3.2)<br />
The RTG shall produce no less than the indicated electrical power under the conditions<br />
listed in Table 2-1, as determined at the output power connector. Power shall be normalized<br />
for a fuel loading of 4410 watts for F-2, F-6 and F-7 and to 4100 watts for F-5, based on the<br />
actual GPHS thermal output at the time of acceptance testing.<br />
2.2.3.3 Launch Power (3.2.1.3.3)<br />
The RTG electrical power, with a xenon cover gas, in October 1997 and within 30 days of<br />
the xenon gas exchange, shall be a minimum of 172 watts for F-2, 155 watts for F-5, and<br />
174 watts for F-6 and F-7.<br />
Table 2-1. RTG Acceptance Power Requirements<br />
2-5
Final Technical Report<br />
GPHS-RTGs for the Cassini Mission<br />
Lockheed Martin <strong>Document</strong> No. RR18<br />
August 1998<br />
Test Conditions<br />
Voltage<br />
30 vDC<br />
Chamber Pressure<br />
Final Technical Report<br />
GPHS-RTGs for the Cassini Mission<br />
Lockheed Martin <strong>Document</strong> No. RR18<br />
August 1998<br />
2.2.3.7 Thermal Requirements (3.2.1.5)<br />
2.2.3.7.1 RTG Case Temperature<br />
The RTG case temperature shall be no greater than 260°C as measured by the average of<br />
the RTG case resistance temperature devices (RTDs) under normal conditions of ground<br />
test and pre-launch activities. The inboard mounting flange and electrical connectors shall<br />
not exceed 240°C.<br />
However, some transient temperature excursions are permitted above 260°C for<br />
assembly/test operations. The total excursions shall not exceed: (1) 350 hours to a<br />
maximum temperature of 265°C, (2) 92 hours to a maximum temperature of 270°C, (3) 11<br />
hours to a maximum temperature of 280°C, and (4) 80 minutes to a maximum temperature<br />
of 295°C.<br />
During launch and space operations, temperatures on the RTGs shall not exceed the<br />
following allowable temperature excursions, which were also defined for the Galileo<br />
mission: (1) 146 days to a maximum temperature of 280°C, and (2) 41 days to a maximum<br />
temperature of 290°C. Temperature excursions for the Cassini mission will be enveloped<br />
by these temperature excursions.<br />
2.2.3.7.2 External Cooling Connections<br />
An Active Cooling System (ACS) shall be provided on the RTG to meet the requirements<br />
listed in Table 2-2. The ACS shall meet the proof pressure, pressure drop, and leak<br />
requirements defined per drawing 47J306130, even though the ACS will not be utilized on<br />
the Cassini mission.<br />
2.2.3.8 Magnetics (3.2.1.6)<br />
With the RTG operating at rated current, the total dipolar magnetic field vector shall not<br />
exceed 78 nT at 1 m from the geometric center of the RTG, with or without compensating<br />
magnets. Compensating magnets, if required to meet this requirement, shall be provided<br />
and installed by JPL.<br />
The RTG shall be equipped with holders for compensating magnets to be used on the<br />
external portion of the RTG, identical to those used for the Ulysses mission as defined by<br />
drawing 47D306809.<br />
2-7
Final Technical Report<br />
GPHS-RTGs for the Cassini Mission<br />
Lockheed Martin <strong>Document</strong> No. RR18<br />
August 1998<br />
Coolant<br />
Flow Rate<br />
Maximum coolant pressure<br />
Allowable pressure drop<br />
Table 2-2. RTG Cooling Requirements*<br />
Water/28 ± 2% ethyl alcohol<br />
450 ± 22 lb./hr<br />
90 psia in shuttle loop<br />
250 psia during GSE start-up<br />
12 psig<br />
Coolant inlet temperature (°F) Minimum Maximum<br />
Pre-launch 35 100<br />
Ascent (First 2-5 minutes) 35 85<br />
Ascent (On orbit, doors closed) 70 120<br />
On orbit, doors open 35 110<br />
Orbit entry 35 85<br />
Active cooling heat transfer<br />
(In vacuum with average radiant sink<br />
temperature of 25°C and coolant inlet<br />
temperature of 30°C)<br />
* These requirements apply to each individual RTG.<br />
2.2.3.9 Instrumentation (3.2.1.7)<br />
Greater than or equal to 3500 watts<br />
The RTG shall be equipped with four (4) resistance temperature measurement devices<br />
(RTDs). The RTDs shall be capable of measuring over the temperature range of -9 to<br />
+300°C. The capacitance between RTD and RTG case shall be less than 400 picofarads.<br />
The detailed requirements for the RTDs are defined in specification NS0010-13-20.<br />
2.2.3.10 Multiple Heat Source Criticality (3.2.1.8)<br />
For the Cassini mission, the total number of isotope heat sources, either in their asdesigned<br />
and assembled shape and configuration, or in possible configurations resulting<br />
from credible accidents, aborts, and post abort environments, shall not be capable of a selfsustaining<br />
fission reaction in any arrangement and/or combination with reflecting materials,<br />
as verified by analysis.<br />
2.2.3.11 Pressurization (3.2.1.9)<br />
The RTG shall be capable of withstanding an internal nominal gas pressure, argon or<br />
xenon, of 25 psia (maximum of 30 psia), with an external vacuum at an outer case<br />
temperature not to exceed 260°C. The gas pressure decay rate shall be such that a<br />
minimum positive pressure of 0.5 psi exists in the RTG relative to room ambient pressure<br />
(14.7 psia) after a period of 30 days from initial pressurization of 25 ± 0.5 psia.<br />
2-8
2.2.3.12 Venting of Cover Gas (3.2.1.10)<br />
Final Technical Report<br />
GPHS-RTGs for the Cassini Mission<br />
Lockheed Martin <strong>Document</strong> No. RR18<br />
August 1998<br />
The PRD shall be designed integral with the RTG to enable venting of the RTG and it shall<br />
be activated by a decrease in the barometric pressure during launch. The design shall also<br />
incorporate provisions for ensuring that the PRD will not prematurely activate during ground<br />
handling and pre-launch operations. Adequate assurance shall be demonstrated through<br />
test and/or analysis to show that RTG venting (caused by the malfunctioning of any of the<br />
elements on the RTG/PRD side of the interface with the spacecraft) will not take place during<br />
launch prior to the PRD being exposed to a pressure within the payload fairing of less than<br />
or equal to 13.0 psia. Detail requirements of the PRD are defined in specification<br />
PS23003753.<br />
2.2.3.13 General Purpose Heat Source (3.2.1.11)<br />
The RTG shall be fueled with 18 General Purpose Heat Source modules containing Pu 238<br />
oxide as the thermal power source. Thermal inventory of the GPHS, extrapolated to BOM,<br />
shall be as a minimum, as follows:<br />
F-2 4258 watts<br />
F-5 4029 watts<br />
F-6, F-7<br />
4258 watts<br />
2.2.3.14 Insulation Resistance (3.2.1.12)<br />
The insulation resistance, as measured between the thermoelectric circuit and the outer<br />
case multifoil insulation, shall be equal to or greater than 1000 ohms under all conditions.<br />
2.2.3.15 Electrostatic Cleanliness Requirements (3.2.1.13)<br />
General<br />
The potential difference between any point on the outer surface of the RTG and ground<br />
structure shall not exceed 10 volts when subjected to an electron irradiation charging<br />
current of 5 x 10⁻¹⁰ A/cm2. Verification of compliance with this requirement can be<br />
accomplished either by test and/or by using the requirements as specified below.<br />
2-9
Final Technical Report<br />
GPHS-RTGs for the Cassini Mission<br />
Lockheed Martin <strong>Document</strong> No. RR18<br />
August 1998<br />
RTG Surface Materials<br />
The exterior (exposed to space) RTG surfaces shall be electrically connected and shall be<br />
capable of being grounded to the spacecraft structure through the case ground. The<br />
resistance to ground of RTG surface materials for both conductive and partially conductive<br />
materials is given as follows:<br />
Conductive Material Ground Resistance<br />
Conductive (metallic) surfaces will be grounded through a resistance, r, as follows.<br />
r < 2 x 10 10/A ohm<br />
where A = exposed surface area of the material (cm 2)<br />
This requirement will be used for each connector outer shell to the RTG case, and any other<br />
metallic protuberance on the RTG.<br />
Partially Conductive Material Ground Resistance<br />
Partially conductive materials which are in contact with a grounded substrate shall satisfy<br />
the following relation. This can be used for the anodized PRD attachment bolt heads.<br />
pt < 2 x 10 10 ohm-cm2<br />
where p = anodized material resistivity (ohm-cm)<br />
t = thickness of anodized coating (cm)<br />
2.2.3.16 Internal Charging<br />
All metallic elements greater than 3 cm 2 in surface area or longer than 25 cm shall have a<br />
conductive path to ground with a resistance of
2.2.3.17 Electrostatic Discharge Susceptibility<br />
Final Technical Report<br />
GPHS-RTGs for the Cassini Mission<br />
Lockheed Martin <strong>Document</strong> No. RR18<br />
August 1998<br />
The ETG shall not be damaged by a 3 mJ arc discharge (13 KV from a 35 pF capacitor or<br />
equivalent) at a distance of 25 cm (10 in.) from the RTG exterior surface. This requirement<br />
includes all associated instrumentation.<br />
2.2.3.18 Miscellaneous<br />
• Teflon on an exterior surface is not permitted.<br />
• Non-conductive surfaces which can be shown to store not more than 3 mJ of<br />
electric charge are permitted.<br />
• Conductive external surfaces < 0.5 cm 2 need not be grounded.<br />
• Dielectric parts of disconnected electrical connectors exposed to space shall be<br />
covered with a grounded metallic surface. This requirement is not applicable since<br />
both RTG connectors will have mating connectors attached.<br />
• The temperature instrumentation leads shall be covered with a conductive wrap or<br />
shield. The wrap shall be grounded to the case.<br />
• Coatings used on the RTG must not outgas in excess of limits specified in NASA<br />
SP-R-0022A while in the operating environments in space.<br />
• A molydisulfide nickel fused coating is acceptable for use on the inside of the PRD<br />
housing.<br />
2.2.3.19 Physical Characteristics (3.2.2)<br />
2.2.3.19.1 Envelope (3.2.2.1)<br />
The overall dimensions of the RTG shall be capable of meeting the envelope requirements<br />
as defined in JPL ICD 10135938.<br />
2.2.3.19.2 Mass (3.2.2.2)<br />
The flight mass of each RTG, excluding gas fill, shall not exceed 56.7 kg (125.0 lb.). All<br />
delivered units shall be within 1.0% of one another. The mass measurement error shall be<br />
less than or equal to 0.1 kg.<br />
2.2.3.19.3 Center of Mass (3.2.2.3)<br />
The RTG shall be designed to have its center of mass on the longitudinal axis of the RTG<br />
and as near its midpoint as practical. The center of mass of all the units shall be within a<br />
2-11
Final Technical Report<br />
GPHS-RTGs for the Cassini Mission<br />
Lockheed Martin <strong>Document</strong> No. RR18<br />
August 1998<br />
right circular cylinder, 0.64 cm. in diameter by 1.27 cm long with its axis along the<br />
longitudinal axis of the RTG. The actual location of the center of mass of each RTG shall be<br />
known to lie within a 1.5 mm diameter sphere. The center of mass location shall not change<br />
more than ±0.0025 cm over any 4 week period of transverse accelerations (normal to the<br />
RTG longitudinal axis) of 0.01g due to spacecraft precision maneuvers while the spacecraft<br />
is spinning at 5 RPM. Such a requirement may be met by demonstrating analytically that<br />
the cg shift, under cruise conditions, is within these limits.<br />
2.2.3.19.4 Moments and Products of Inertia (3.2.2.4)<br />
The moments and products of inertia of the RTG about its three orthogonal axes shall be<br />
calculated. The calculated moments of inertia of each RTG shall be determined to an<br />
accuracy of 0.05 kg-m 2. The calculated products of inertia of each RTG shall be known to an<br />
accuracy of 0.012 kg-m 2 in the spacecraft X-Z and Y-Z planes.<br />
2.2.3.19.5 Mounting and Lifting Provisions (3.2.2.5)<br />
The RTG mechanical design shall incorporate features for mounting to the spacecraft as<br />
shown in the JPL ICD 10135938. The design for the Cassini spacecraft shall incorporate a<br />
single mounting location on the RTG with four mounting points. Attachment bolt and<br />
alignment pin holes in the interface flanges shall be drilled from a template as defined by<br />
drawing 47D305773. Lifting features shall be incorporated to allow lifting of the RTG by<br />
ground handling equipment as identified on the JPL ICD 10135938.<br />
2.2.3.20 Connections (3.2.2.6)<br />
2.2.3.20.1 Pressurization and Venting<br />
The RTG shall be equipped with two separate vent systems: one to permit pressurization<br />
and venting of the RTG during ground testing and the other to permit venting of the RTG<br />
automatically after launch.<br />
The gas management valve, as shown in drawing 47D305293, shall be used for ground<br />
testing. This vent system shall include a manual valve that shall be used to control flow<br />
during venting and pressurization, and shall be designed to indicate clearly the open<br />
position. The RTG shall be vented after launch by a Pressure Relief Device (PRD) per<br />
drawing 23003764.<br />
2-12
2.2.3.20.2 Electrical Power Connectors<br />
Final Technical Report<br />
GPHS-RTGs for the Cassini Mission<br />
Lockheed Martin <strong>Document</strong> No. RR18<br />
August 1998<br />
The electrical output of each RTG shall be delivered at the electrical power connector. The<br />
power connector shall be a five (5) pin, hermetically sealed connector as defined by<br />
drawing 47C305095. Both positive and negative power pins in the connector shall be<br />
redundant and shall be separated by a distance adequate to prevent shorting of the RTG<br />
power output. One pin shall be used for case ground.<br />
2.2.3.20.3 Instrumentation Connector<br />
The outputs from the RTD temperature transducers shall be terminated in a separate<br />
instrumentation connector as defined by drawing 23008081. The physical location of this<br />
connector shall be in close proximity to the power connector.<br />
2.2.3.20.4 Thermoelectric Couple lnterconnectors<br />
The thermoelectric couples shall be in a series-parallel, cross-strapped configuration to<br />
provide high reliability as shown on drawing 47J305306.<br />
2.2.3.20.5 Electrical Isolation<br />
The thermoelectric power circuit shall be electrically isolated from the RTG housing and<br />
from the temperature instrumentation circuits. At time of acceptance, the dc resistance<br />
measured from the electrical power circuit to RTG case with the generator operating at<br />
nominal operating voltage and temperature, shall be no less than 1000 ohms. The dc<br />
resistance between the RTD instrumentation circuit and the case shall be at least 1 megohm<br />
at 10 volts, measured at room temperature and at 300°C.<br />
2.2.3.20.6 Case Ground<br />
The RTG outer case shall incorporate a ground conductor to carry the case ground to the<br />
spacecraft structure through a separate pin in the power connector. This shall be in addition<br />
to structural grounds provided by the case. Resistance between the connector grounding<br />
pin and RTG outer case shall be less than 20 milliohms.<br />
2.2.3.20.7 External Cooling Connections<br />
Location of the input and output connections for the ACS shall be as shown on JPL ICD<br />
10135938. These provisions were not utilized on the Cassini mission.<br />
2-13
2.2.3.20.8 Electrical Cabling (3.2.2.7)<br />
Final Technical Report<br />
GPHS-RTGs for the Cassini Mission<br />
Lockheed Martin <strong>Document</strong> No. RR18<br />
August 1998<br />
Each RTG shall be provided with two separate GSE electrical cables, one for power and<br />
one for instrumentation, for use during ground operations. Power connectors and<br />
receptacles on these cables shall comply with National Fire Code, Electrical, Vol. 5, AIA File<br />
No. 40-E-7.<br />
2.3 PHYSICAL REQUIREMENTS<br />
The physical requirements for the Cassini RTGs are primarily defined in JPL ICD<br />
10135938B. (Other physical requirements are included in the RTG Product Specification<br />
PS23009148E, previously discussed in Section 2.2.) The following physical requirements<br />
are excerpted from the ICD.<br />
2.3.1 Static Envelope Dimensions<br />
Each Cassini RTG must be enveloped by a right cylinder 18.00 inches in diameter and no<br />
more than 45.50 inches long axially.<br />
2.3.2 Mounting<br />
The inboard flange must have provision for four holes equally spaced on a 9.520 + 0.020/-<br />
0.005 inch mounting circle as shown in the ICD (drilled per Lockheed Martin drawing<br />
47D305773).<br />
2.3.3 Electrical Power Connector<br />
The electrical power receptacle shall mate with connector MS3106A18-11S.<br />
2.3.4 Instrumentation Connector<br />
The RTG instrumentation receptacle shall mate with connector MS3106A18-1S.<br />
2.3.5 Handling Attachment Points<br />
Ground handling attachment points shall be as specified in ICD 10135938B.<br />
2.3.6 PRD Safety Pin<br />
The PRD safety pin shall be removed before flight.<br />
2-14
Final Technical Report<br />
GPHS-RTGs for the Cassini Mission<br />
Lockheed Martin <strong>Document</strong> No. RR18<br />
August 1998<br />
2.4 VERIFICATION OF REQUIREMENTS<br />
Verification that the RTG design meets requirements is documented in "RTG Design<br />
Qualification Report," GESP-7242. The General Purpose Heat Source was previously<br />
qualified on the Galileo/Ulysses programs with documentation provided in GESP-7191.<br />
2-15
Section 3<br />
Cassini RTG Design Description
Final Technical Report<br />
GPHS-RTGs for the Cassini Mission<br />
Lockheed Martin <strong>Document</strong> No. RR18<br />
August 1998<br />
SECTION 3<br />
CASSINI RTG DESIGN DESCRIPTION<br />
3.1 FLIGHT UNIT DESCRIPTION<br />
This section provides a general description of the GPHS-RTG. A more detailed design<br />
description of each of the RTG subassemblies is provided in Section 4.<br />
The GPHS-RTG, shown in Figure 3.1-1, consists of three basic parts: the heat source, the<br />
thermopile, and the converter shell. The heat source produces a nominal 4400 watts of<br />
thermal energy by the radioactive decay of its Puy isotope fuel. The thermopile converts<br />
some of the thermal energy of the heat source into a nominal 300 watts of direct current<br />
electrical power by means of the thermoelectric process. The outer shell provides<br />
containment and structural support for the heat source and thermopile, rejecting surplus<br />
heat by means of its radiating fins.<br />
HEAT SOURCE COOLING TUBES<br />
SUPPORT<br />
or ..<br />
1<br />
..1_,.... 1=1.11111111111<br />
..<br />
GAS MANAGEMENT<br />
ASSEMBLY<br />
......_.• .,. .. __„.........._............._<br />
PRESSURE<br />
ALUMINUM OUTER ACS RELIEF<br />
SHELL ASSEMBLY MANIFOLD DEVICE<br />
C, '7' :A.e. .IMINI■<br />
t■-4ki-<br />
-'°4ff V - NIMINIONIIMMINIMIMIMIMINI&WJ■4101. %.<br />
r, •<br />
IF<br />
4101-.<br />
v.,,....,<br />
---,-----.4or..-.<br />
aip.m..mpattommumi.an....w,.w,mpall<br />
„I!<br />
RTG<br />
MOUNTING MULTI-FOIL<br />
FLANGE INSULATION<br />
SIGe UNICOUPLE<br />
MIDSPAN HEAT GENERAL PURPOSE<br />
SOURCE SUPPORT<br />
HEAT SOURCE<br />
Figure 3.1-1. General Purpose Heat Source - Radioisotope Thermoelectric Generator<br />
(GPHS-RTG)<br />
3-1
Final Technical Report<br />
GPHS-RTGs for the Cassini Mission<br />
Lockheed Martin <strong>Document</strong> No. RR18<br />
August 1998<br />
3.1.1 General Purpose Heat Source<br />
The General Purpose Heat Source (GPHS) is comprised of 18 modules, in two stacks of 9<br />
modules each separated by a midspan plate. A cut-away view of a single GPHS module is<br />
shown in Figure 3.1.1-1. The modules are composed of five main elements: the fuel, the<br />
fuel cladding, the graphite impact shell, the carbon insulation, and the aeroshell. Each<br />
module contains four plutonium dioxide (Pu02) fuel pellets, with a thermal inventory of<br />
AEROSHELL<br />
CAP<br />
GIS CAP<br />
FUELED<br />
CLAD<br />
FLOATING FUEL<br />
MEMBRANE PELLET<br />
GRAPHITE IMPACT<br />
SHELL (GIS)<br />
LOCK<br />
MEMBER<br />
CARBON BONDED<br />
CARBON FIBER<br />
(CBCF) SLEEVE<br />
AEROSHELL<br />
LOCK SCREW<br />
Figure 3.1.1-1. General Purpose Heat Source Module<br />
approximately 62.5 watts per pellet. Each pellet is encapsulated within a vented iridium<br />
cladding, which functions as the primary fuel containment. The encapsulated pellet is<br />
called a Fueled Clad (FC). Each GPHS module contains four FCs encapsulated within two<br />
cylindrical Fine Weave Pierced Fabric (FWPF) containers, known as Graphite Impact Shells<br />
(GISs). Thermal insulators made from Carbon Bonded Carbon Fiber (CBCF) surround each<br />
GIS. These insulators are designed to provide acceptable iridium temperatures during<br />
normal operation, during possible reentry, and at possible impact. Two GISs with thermal<br />
3-2
Final Technical Report<br />
GPHS-RTGs for the Cassini Mission<br />
Lockheed Martin <strong>Document</strong> No. RR18<br />
August 1998<br />
insulator disks and sleeves are placed in a rectangular FWPF aeroshell to form a GPHS<br />
module. The aeroshell is the primary heat source structure that provides reentry protection<br />
for the FCs. Eighteen GPHS modules provide the total thermal inventory required for the<br />
GPHS-RTG. FWPF lock members are used to facilitate stacking and to resist shear loads<br />
due to lateral loading.<br />
3.1.1.1 Radioisotope Fuel<br />
The radioisotope fuel is an isotopic mixture of plutonium in the form of the dioxide, PuO 2 .<br />
The 238 PU content is 82.2 weight percent of the total plutonium, based on the assay data for<br />
the fuel used in the F-2, F-6, and F-7 heat sources (References 3.1.1-1 to 3.1.1.-3). Specific<br />
details regarding the fuel feed powder may be found in Reference 3.1.1-4. The physical<br />
form of the fuel is a cylindrical, solid ceramic pellet, chamfered at each end. The pellets<br />
have a diameter of 2.76 ± 0.02 cm and a length of 2.76 ± 0.04 cm. The average geometric<br />
density of the fuel is 9.89 g/cm 3 and the average specific thermal power of the fuel at BOM is<br />
0.404 Wt/g, based on the assay data for the fuel used in the F-2, F-6 and F-7 heat sources<br />
(References 3.1.1-1 to 3.1.1.-3). The resultant calculated average power density based on<br />
the average density and specific power is 4.0 W/cm 3• The half life of the 238PU isotope is<br />
87.75 years.<br />
Each pellet contains approximately 151 grams of fuel and provides a thermal inventory of<br />
approximately 62.5 watts at the time of FC calorimetry. The 72 pellets within the F-2, F-6<br />
and F-7 GPHSs provide a projected thermal power of 4368, 4413, and 4404 watts,<br />
respectively, at launch. A total of 10.9 kg of PuO2 fuel per RTG (with 82.2 wt % 238Pu) is<br />
required to meet mission power requirements. A thermal power reduction of approximately<br />
0.8 percent per year will occur due to alpha decay. Table 3.1.1-1 summarizes the average<br />
fuel composition and characteristics of the flight units at BOM as provided in References<br />
3.1.1-1 through 3.1.1-3.<br />
3-3
Final Technical Report<br />
GPHS-RTGs for the Cassini Mission<br />
Lockheed Martin <strong>Document</strong> No. RR18<br />
August 1998<br />
Table 3.1.1-1. Flight GPHS Fuel Composition and Characteristics at BOM*<br />
F-2 RTG F-6 RTG F-7 RTG<br />
238<br />
Pu Weight (g) 7,693.695 7,774.060 7,756.398<br />
239 Pu Weight (g) 1,426.545 1,447.791 1,441.775<br />
240 Pu Weight (g) 199.873 212.380 202.623<br />
241 Pu Weight (g) 20.236 20.754 20.540<br />
242 Pu Weight (g) 11.836 14.134 12.534<br />
236 Pu Weight (g) 1.07 X 10 -4 1.14 X 10⁻⁴ 1.13 X 10⁻⁴<br />
Total Pu Weight (g) 9,352.185 9,469.119 9,433.869<br />
Other Actinides (g) 235.073 166.955 184.739<br />
Impurities (g) 14.456 15.538 14.263<br />
Oxygen (g) 1,275.940 1,243.133 1,263.327<br />
Total Fuel (g) 10,877.654 10,894.745 10,896.198<br />
Pu-238/Total Pu (%) 82.266 82.099 82.219<br />
Avg. Pellet Weight (g) 151.078 151.316 151.336<br />
Heat Output (Wt) 4,368.06 4,413.78 4,403.68<br />
Avg. Pellet Heat (Wt) 60.668 61.302 61.162<br />
Avg. Pellet Density (g/cc) 9.832 9.936 9.895<br />
Activity (Curies) 133,934 135,368 135,040<br />
*BOM - Beginning of Mission, Launch date of 15 October 1997<br />
3.1.1.2 Fueled Clad (FC)<br />
Each fuel pellet within a GPHS module is individually encapsulated in a welded iridium<br />
alloy (DOP-26) clad which has a minimum wall thickness of 0.055 cm. The clad consists of<br />
an iridium alloy shield cup and an iridium alloy vent cup. The DOP-26 alloy is capable of<br />
resisting oxidation in a post-impact environment while also being chemically compatible<br />
with the fuel and graphitic components during high temperature operation and postulated<br />
accident environments.<br />
The fueled clad is designed with an iridium frit vent that permits release of helium gas<br />
produced by the decay of the Pu-238 fuel without releasing fuel particulates. The FC also<br />
contains a decontamination cover which is welded over the FC vent hole to permit<br />
decontamination after encapsulation welding. A weld shield is located inside the FC to<br />
3-4
Final Technical Report<br />
GPHS-RTGs for the Cassini Mission<br />
Lockheed Martin <strong>Document</strong> No. RR18<br />
August 1998<br />
provide thermal protection to the fuel during closure welding and to prevent contamination<br />
of the weld by the fuel. The decontamination cover is removed from the FC prior to installing<br />
the FCs into the heat source assembly. The iridium FC components are shown in Figures<br />
3.1.1-2 and 3.1.1-3, and the encapsulation requirements are defined in Reference 3.1.1-5.<br />
3.1.1.3 Graphite Impact Shell (GIS)<br />
Two FCs are encased in a Graphite Impact Shell (GIS) made of FWPF, a carbon-carbon<br />
composite material. The FCs are separated by a FWPF floating membrane within the GIS.<br />
The FCs are oriented such that the frit vents face the floating membrane. The cylindrical<br />
GIS is designed to provide impact protection to the FCs; its minimum wall thickness is 0.424<br />
cm (0.167 inches). The GIS design is shown in Figure 3.1.1-4.<br />
3.1.1.4 Aeroshell<br />
Two GISs, each containing two FCs, are located inside each FWPF aeroshell. A Carbon<br />
Bonded Carbon Fiber (CBCF) insulator surrounds each GIS within the aeroshell to limit the<br />
peak temperature of the FC during inadvertent reentry and to maintain a sufficiently high<br />
temperature to ensure its ductility upon subsequent impact. The aeroshell serves as the<br />
primary structural member of the GPHS module as it is stacked inside the GPHS-RTG. It is<br />
designed to contain the two GISs under a wide range of reentry conditions and provide<br />
additional protection against impacts on hard surfaces at terminal velocity. It also provides<br />
protection for the FCs against overpressures and fragment impacts during postulated<br />
accident events. The aeroshell design is shown in Figure 3.1.1-5.
0 0.51<br />
0.38 THRU<br />
lera IA IBM0.250<br />
4.5 e<br />
3.5 IL t bt. di .0A IV<br />
1<br />
SCALE 2/1<br />
0.8 - 3.2<br />
0 29.82<br />
29.60<br />
5 .96 RAD<br />
5.68<br />
DASH<br />
NO.<br />
MATERIAL<br />
HOLE<br />
RE CI'D.<br />
P ER<br />
ASSY.<br />
-1 IRIDIUM YES 1<br />
-2 IRIDIUM NO 1<br />
31.-1_21<br />
(2.5)<br />
0.05 MAX.<br />
BREAK TYP.<br />
0.55 MIN.<br />
15.12<br />
15.04<br />
.}<br />
I -A-i<br />
(15M1)<br />
0.73<br />
0.63<br />
0.20 I<br />
0.15<br />
ENLGD VIEW<br />
SCALE NONE<br />
SHARP CORNER<br />
TO FULL RADIUS<br />
0.03 BREAK<br />
PERMITTED TYP.<br />
-IL- 0.35 or 0.60<br />
0.25 or 0.45<br />
(See Figure 4.1.1-3)<br />
-B.<br />
r(—)0.0<br />
0 29.88<br />
29.73<br />
Dimensions in mm<br />
Figure 3.1.1-2. Iridium Shield Cup
E.B. WELD<br />
VAWIr.AVAIIAVAIIIAPIKVAVArAVAIII<br />
14.10<br />
13.95<br />
ET<br />
SINTERED AND<br />
DIFFUSION BONDED<br />
IRIDIUM FRIT VENT<br />
VIEW A<br />
E.B. WELD<br />
Dimensions in mm<br />
Figure 3.1.1-3. Iridium Vent Cup<br />
7.899 cm<br />
(3.110 In.)<br />
45° CHAMFER x 0.127 cm<br />
/ (.050 in) FOUR PLACES<br />
1 1<br />
\re<br />
3.810 cm<br />
-ex (1.500 In.) DIA, TYP<br />
•<br />
:=C<br />
3.937 cm<br />
(1.550 In.) DIA, TYP<br />
Arorzozelir<br />
0.424 cm min.<br />
(0.167 In.)<br />
A<br />
Figure 3.1.1-4. Graphite Impact Shell<br />
3-7
1.913<br />
CHAMFER CORNER<br />
.015 .005 x45<br />
.000<br />
.544 SPHERICAL<br />
""qL. "-111PWAF<br />
(41) 0.095<br />
TYP 4 PLS<br />
2.090<br />
1.045<br />
MP/<br />
MN,<br />
1.050 --or 1.720 --am<br />
3.826 ± .002<br />
.080<br />
2PLS<br />
1<br />
4 1.947 DIA.<br />
1.720 DIA<br />
.250<br />
REF,<br />
3.668 I .002<br />
3.473<br />
2 PLS<br />
.015 MAX<br />
RADII TYP.<br />
1.960<br />
4 Aft<br />
r ± 0.30 I<br />
2PLS<br />
Oak<br />
II<br />
0.854<br />
1282 DIA TYP-s.<br />
1.450 --al<br />
DIA TYP.<br />
Dimensions in inches.<br />
Figure 3.1.1-5. Aeroshell<br />
3-8
3.1.1.5 Materials and Weights<br />
Final Technical Report<br />
GPHS-RTGs for the Cassini Mission<br />
Lockheed Martin <strong>Document</strong> No. RR18<br />
April 1998<br />
A summary of the heat source components, materials, and their associated weights are<br />
presented in Table 3.1.1-2. The weights shown in this table are averages for actual<br />
components.<br />
Table 3.1.1-2. GPHS Component Mass Summary<br />
Component<br />
LMMS-VF<br />
Reference<br />
Drawing<br />
Material<br />
No. Per<br />
Heat<br />
Source<br />
Unit<br />
Weight<br />
(kg)<br />
Total<br />
Weight<br />
(kg)<br />
Fueled Clad 47C305993 Pu02/Ir 72 0.207 14.893<br />
Graphite 47D305396 FWPF Graphite 36 0.091 3.266<br />
Impact Shell 47D305397<br />
Floating 47C305610 FWPF Graphite 36 0.007 0.245<br />
Membrane<br />
Insulator 47D305608 CBCF Graphite 36 0.004 0.155<br />
Aeroshell 47D305398 FWPF Graphite<br />
47D305399<br />
18 0.402 7.242<br />
47D305609<br />
Lock Members 47B305212 FWPF Graphite 32 0.001 0.044<br />
Midspan Plate 47E305117 FWPF Graphite 1 0.259 0.259<br />
GPHS 47D305112 -- -- -- 26.104<br />
Assembly<br />
Note: Unit weights are rounded to the nearest gram and cannot be used to accurately determine<br />
total weight.<br />
3.1.2 Thermopile Assembly and Outer Shell<br />
The thermopile consists of 572 thermoelectric unicouples, multifoil insulation, and an<br />
internal frame. The unicouples, shown in Figure 3.1.2-1, are individually fastened to the<br />
outer shell. The two SiGe legs of the couple and their corresponding sections of the hot<br />
shoe are doped to provide thermoelectric polarity; the N-type material is doped with<br />
phosphorous and the P-type with boron. The silicon alloy thermocouple is bonded to a cold<br />
stack assembly of tungsten, copper, molybdenum, stainless steel, and alumina. Copper
Final Technical Report<br />
GPHS-RTGs for the Cassini Mission<br />
Lockheed Martin <strong>Document</strong> No. RR18<br />
April 1998<br />
0.02 Cu CONNECTOR<br />
0,025 Cu HEAT SHUNT<br />
0.02 W COMPENSATOR<br />
0.02 Cu PEDESTAL<br />
0.02 W COW SHOE<br />
A.STR 00UARTZ<br />
YARN•VRAP<br />
0.02 AI203 INSULATOR<br />
63.5% AT%<br />
SiGe SEGMENT<br />
UICROOUARTZ<br />
INSULATION<br />
73% AT%<br />
SiGe LEGS<br />
0.010 ALUMINA<br />
INSULATOR<br />
Figure 3.1.2-1. Silicon Germanium Unicouple<br />
together in the space between the inside of the outer shell and the outside of the insulation<br />
system to form the thermopile electrical circuit. A two string, series-parallel, electric wiring<br />
circuit is used. This permits continued operation in the event of a single thermocouple open<br />
circuit or short circuit failure. Each unicouple is electrically insulated from the multifoil<br />
insulation.<br />
Thermal insulation for the thermopile assembly consists of an axial section and two end<br />
caps that are a part of the inboard and outboard heat source support assemblies (Figure<br />
3.1-1). All of the insulation is of multifoil construction, consisting of 60 alternate layers of<br />
0.0003 inch molybdenum foil and Astroquartz cloth. An additional metallic layer is provided<br />
by a thicker foil on the inside of each end cap, and by an inner molybdenum frame that<br />
supports the axial section of the insulation. In an unrestrained condition, the 60 layers of<br />
insulation stack up to approximately 0.7 inch in thickness. The insulation assembly has 572<br />
penetrations through which the thermocouples pass, and four penetrations for supports for<br />
the inner molybdenum frame. The two end caps each have four penetrations for the heat<br />
source support preload studs. The inboard insulation cap has four additional penetrations<br />
3-10
Final Technical Report<br />
GPHS-RTGs for the Cassini Mission<br />
Lockheed Martin <strong>Document</strong> No. RR18<br />
April 1998<br />
that are plugged during RTG assembly and one penetration (previously used for electric<br />
heat source instrumentation wires) that is left open as a vent.<br />
The converter shell is composed of the outer shell and the end domes, which are the major<br />
structural elements of the RTG. They are composed of aluminum, with sufficient strength to<br />
withstand launch loads, but intended to burn up in the event of a postulated reentry. The<br />
outer shell incorporates eight external fins to enhance radiative cooling in space.<br />
The converter heat source support system consists of an inboard and outboard heat source<br />
support assembly, and four midspan support assemblies. The function of the heat source<br />
support system is to support the GPHS modules with respect to the outer shell and dome<br />
assemblies.<br />
Accessories mounted on the outer shell include the Gas Management Valve (GMV),<br />
Pressure Relief Device (PRD), Active Cooling System (ACS), RTG power connector, and<br />
four Resistance Temperature Devices (RTDs).<br />
The GMV is a component of the gas management system that permits control of the internal<br />
atmosphere in the converter. During storage and ground operations of the RTG, the<br />
converter is filled with inert gas. The end domes and all penetrations are sealed with<br />
C-seals, capable of retaining the gas for periods of at least 30 days without refilling. After<br />
launch, the PRD is actuated and punctures a diaphragm in the converter shell, thereafter<br />
allowing the RTG to operate with an internal vacuum environment.<br />
The ACS on the converter permits circulation of cooling water through tubing passages<br />
near the base of each fin. This cooling lowers the temperature of the outer shell during the<br />
period of launch when the RTG is enclosed. This system was originally designed for<br />
launches on the Shuttle and was not used on the Titan IVB Cassini mission.<br />
The RTG power connector, mounted on the converter shell, provides the electrical interface<br />
with the spacecraft. The instrumentation connector provides an interface that enables<br />
measurement of the outer shell temperature by means of RTDs which are located at four<br />
radial locations near the inboard end.
3.1.3 Electrically Heated Thermoelectric Generator (ETG)<br />
Final Technical Report<br />
GPHS-RTGs for the Cassini Mission<br />
Lockheed Martin <strong>Document</strong> No. RR18<br />
April 1998<br />
All RTGs are first configured as ETGs during their initial assembly and processing. In this<br />
configuration they are heated by an Electric Heat Source (EHS). A special dome is<br />
mounted on the inboard end, and a spool piece is mounted between the inboard dome and<br />
the converter outer shell. In addition, ETGs have specific instrumentation used during<br />
processing. The special dome incorporates a valve used in processing and testing. The<br />
spool piece provides penetration for instrumentation connectors, needed for internal<br />
instrumentation, and four separate single-pin connectors provide electrical power to the<br />
EHS. During conversion of an ETG to an RTG, the EHS is replaced by GPHS heat source<br />
modules. The spool piece and internal instrumentation leads are removed, and the special<br />
dome is replaced by one of flight configuration.<br />
3.1.4 Mass Summary<br />
Table 3.1.4-1 is a summary of weights for RTGs F-2, F-5, F-6, and F-7.<br />
Table 3.1.4-1. Weight Summary (Ibs)<br />
F-2 F-5 F-6 F-7<br />
124.16 123.34 124.48 124.62<br />
A typical mass summary for a flight RTG is summarized in Table 3.1.4-2.<br />
3-12
Final Technical Report<br />
GPHS-RTGs for the Cassini Mission<br />
Lockheed Martin <strong>Document</strong> No. RR18<br />
April 1998<br />
Housing<br />
Table 3.1.4-2. Component Weight Summary<br />
Quantity<br />
Weight<br />
(lb.)<br />
Outer Shell 1 14.34<br />
Fins 8 4.22<br />
Emissive Coating x 0.33<br />
Auxiliary Cooling Tube Manifold 1 0.57<br />
Nuts 8 0.11<br />
Converter<br />
Unicouples 572 11.90<br />
Unicouple Sealing Screws 576 1.54<br />
Thermoelectric C-Seals 576 0.13<br />
Rivets 672 0.65<br />
Thermoelectric Spacers (Al 203) 572 0.64<br />
Nut Plates 286 0.84<br />
Foil Insulation - Thermopile 1 12.15<br />
Insulation Support Frame 1 1.91<br />
Power Connector 1 0.29<br />
Gas Management Assembly 1 0.36<br />
Electrical Straps x 1.65<br />
PRD 1 0.94<br />
C-Seal (Domes) 2 0.08<br />
Other Insulation x 0.20<br />
Pressure Dome 2 1.68<br />
Screws (Pressure Dome) 44 0.18<br />
Assembly - RTD 1 0.67<br />
Inner Frame Support Assembly<br />
Fitting 2 0.35<br />
Leg 4 0.08<br />
Shoe 8 0.06<br />
Nut 4 0.004<br />
Clip 4 0.003<br />
3-13
Table 3.1.4-2. Component Weight Summary (Cont'd)<br />
Heat Source Support System<br />
Outboard Support Assembly<br />
Quantity<br />
Final Technical Report<br />
GPHS-RTGs for the Cassini Mission<br />
Lockheed Martin <strong>Document</strong> No. RR18<br />
April 1998<br />
Weight<br />
(lb.)<br />
Frame 1 0.91<br />
End Cap Insulation Assembly 1 0.64<br />
Pressure Plate 1 0.68<br />
Retainer Screw 1 0.006<br />
Stud Insulator 4 0.27<br />
Barrier (Iridium) 4 0.01<br />
Barrier (Tungsten) 4 0.004<br />
Preload Stud 4 0.15<br />
Insulation, Fibrous AR 0.004<br />
Insulation, M49A1 AR 0.002<br />
Foil Disk 4 0.004<br />
Shim 4 0.004<br />
Latch 4 0.20<br />
Stud, Latch 4 0.08<br />
Screw, Latch 8 0.03<br />
Heat Source Support System<br />
Inboard Support Assembly<br />
Frame 1 1.12<br />
Pressure Plate 1 0.79<br />
End Cap Insulation Assembly 1 0.58<br />
Spring Washer 3 1.13<br />
Collar 1 0.15<br />
Guide 1 0.37<br />
Preload Stud 4 0.15<br />
Pressure Plate 1 0.49<br />
Insulation, Fibrous AR 0.004<br />
Insulation, M49A1 AR 0.002<br />
Barrier (Iridium) 4 0.01<br />
Barrier (Tungsten) 4 0.004<br />
Washer 1 0.03<br />
Foil Disk 4 0.004<br />
Washer, Inboard 1 0.03<br />
Stud Insulator 4 0.27<br />
Latch 4 0.08<br />
Screw, Latch 8 0.03<br />
3-14
Table 3.1.4-2. Component Weight Summary (Cont'd)<br />
Heat Source Support System<br />
Midspan Support Assembly<br />
Quantity<br />
Final Technical Report<br />
GPHS-RTGs for the Cassini Mission<br />
Lockheed Martin <strong>Document</strong> No. RR18<br />
April 1998<br />
Weight<br />
(lb.)<br />
Cap 4 0.24<br />
C-Seal 4 0.02<br />
Pivot 4 0.13<br />
Support 4 0.25<br />
Nut, Lock 4 0.11<br />
Nut, Spring Washer 4 0.24<br />
Spring Washer 12 0.40<br />
Seat 4 0.07<br />
Insulator 4 0.07<br />
Can Assembly 4 0.04<br />
Barrier 4 0.004<br />
Shoe 4 0.004<br />
Ring 4 0.03<br />
Locating Pin 4 0.05<br />
Insulation AR 0.02<br />
Washer 4 0.04<br />
Washer 12 0.02<br />
Converter 65.96<br />
Midspan Plate 1 0.57<br />
General Purpose Heat Source 18<br />
Fueled Capsule 72 32.832<br />
G I S 36 7.200<br />
Floating Membrane 36 0.540<br />
CBCF Set 36 0.342<br />
Aeroshell (Incl. caps, lock screws) 18 15.966<br />
Lock Members 32 0.096<br />
56.976<br />
RTG 123.51<br />
3-15
Final Technical Report<br />
GPHS-RTGs for the Cassini Mission<br />
Lockheed Martin <strong>Document</strong> No. RR18<br />
April 1998<br />
3.2 GROUND SUPPORT EQUIPMENT (GSE)<br />
The GSE required for processing and testing of the ETG for the Cassini program is<br />
described in this paragraph. Use of the GSE is illustrated in the following typical sequence<br />
of events. The ETGs are delivered to Building 800 (the processing and test facility) in the<br />
ETG shipping container (ETG-SC). After initial inspection and completion of resistance<br />
measurements, the ETG is removed from the ETG-SC using the outboard handling fixture<br />
and the ETG lifting fixture. It is then placed into the Loading and Assembly Station (LAS) for<br />
processing and test. With the ETG outboard dome removed, the LAS is evacuated to<br />
1.0 x 10 -5 torr, and a slow heat-up of the ETG is performed using the EHS until an input<br />
power of 4400 watts and a vacuum pressure of 1.0 x 10 -5 torr are maintained. Control of<br />
applied EHS power and ETG parameters are accomplished using the Readout Console<br />
(ROC). This sequence of increasing heat as a function of chamber pressure (a measure of<br />
outgassing) is a final step in the manufacturing process. After this processing cycle is<br />
completed, an ETG performance test is run while still in the LAS. Following the<br />
performance test the LAS is backfilled with argon gas using the gas management system<br />
(GMS), thus enabling the use of the LAS as a glove box.<br />
After doming operations are completed (during which the LAS GMS maintains the inert,<br />
oxygen-free environment) a pressure decay test is performed using the gas service cart<br />
(GSC). After removal from the LAS, the ETG is again placed in the ETG-SC for transport to<br />
Mound Laboratory (Miamisburg, Ohio) for conversion to a RTG and subsequent flight<br />
acceptance tests. The RTG is then put in storage and the portable test unit (PTU) is used for<br />
monitoring the RTG performance as required.<br />
The following is a list of the GSE used on the Cassini program for those tasks mentioned.<br />
This GSE was built and used first on the GPHS-RTG program. The GSE was refurbished<br />
and retested as required for the Cassini program. Each is described in more detail in the<br />
paragraphs indicated.
Final Technical Report<br />
GPHS-RTGs for the Cassini Mission<br />
Lockheed Martin <strong>Document</strong> No. RR18<br />
April 1998<br />
Paragraph<br />
GSE Item<br />
Product<br />
Specification<br />
3.2.1 ETG Shipping Container CP 47A14648<br />
Operating<br />
Procedure<br />
3.2.2 RTG Shipping Container . CP 47A14647<br />
3.2.3 Readout Console CP 47A14638 SI 249703<br />
3.2.4 Portable Test Unit CP 47A25002 GESP 7167<br />
3.2.5 Gas Service Cart CP 47A25000 SI 249229<br />
3.2.6 ETG/RTG Handling Equipment CP 47A14649<br />
Additional tools and special fixtures are utilized as required to complete preparation of the<br />
ETGs for delivery. These items are covered in other sections of this report.<br />
3.2.1 ETG Shipping Container (ETG-SC)<br />
The ETG-SC is used to provide physical protection to the ETG during handling, shipping,<br />
and storage. The ETG-SC (47E305499G1) is constructed of two welded stainless steel<br />
assemblies: a domed upper half which measures 30 inches in diameter and is<br />
approximately 44 inches high, and a lower base assembly measuring 48 inches wide by 68<br />
inches long. With the upper assembly mated to the base, and with the metal wheels<br />
lowered, the ETG-SC is 72 inches high and weighs approximately 1800 pounds (Figure<br />
3.2-1). A gas monitoring and pressurization system is built into the ETG-SC. One system is<br />
built into the base assembly with an internal Wiggins quick-disconnect interface for the ETG<br />
and an external pneumatic fitting for the GSC. This system makes use of a 30 inch Hg to 30<br />
psig gauge and two Nupro bellows valves (modified to allow safety wiring) for isolation and<br />
control of gas flow. The second system, built into the upper dome half, has a valve and<br />
gauge configuration that is the same as the base assembly. However, instead of the<br />
Wiggins interface this system opens through a port into the internal cavity formed by the<br />
upper half when secured to the base assembly. Two pressure relief valves are incorporated<br />
into the dome to prevent over-pressurization. This second system provides for servicing of<br />
the argon gas used to enclose the ETG in a protective environment. Stainless steel tubing<br />
is used throughout with the system enclosed in a box structure. The 10 inch steel wheels<br />
are manually retractable to provide a stable configuration when tied down for shipment.<br />
3-17
Final Technical Report<br />
GPHS-RTGs for the Cassini Mission<br />
Lockheed Martin <strong>Document</strong> No. RR18<br />
April 1998<br />
41/ritiq atrOt; COM ortv<br />
AY CXIMC con atm 0(<br />
;1.14GL ._ dial YJI.YL<br />
Lax PlIEN11414! 1111YOR<br />
KG etqc i DO Pt<br />
-41141<br />
Figure 3.2-1. ETG Shipping Container<br />
3.2.2 Base and Protective Cover Assembly (BPCA)<br />
The BPCA is used to provide physical protection to the GPHS-RTG during handling and<br />
storage at the launch site. The BPCA shares a common base assembly (47E305499G2)<br />
with the ETG-SC. The domed upper half is replaced with the protective cover (47E305551)<br />
for designation as the RTG BPCA (47E305060, Figure 3.2-2). The cover is of open mesh<br />
construction which allows ventilation for the RTG and protects personnel from the heated<br />
surface of the RTG. The entire RTG transfer container is of welded stainless steel<br />
construction and measures 48 inches wide by 68 inches long by 74 inches high with the<br />
metal wheels lowered and weighs approximately 1800 pounds.<br />
3-18
Final Technical Report<br />
GPHS-RTGs for the Cassini Mission<br />
Lockheed Martin <strong>Document</strong> No. RR18<br />
April 1998<br />
Figure 3.2-2. Base and Protective Cover Assembly<br />
A gas monitoring and pressurization system is built into the base assembly with an internal<br />
Wiggins quick-disconnect interface for the RTG and an external pneumatic fitting for the<br />
GSC. This system makes use of a 30 inch Hg to 30 psig gauge and two Nupro bellows<br />
valves (modified to allow safety wiring) for isolation and control of gas flow. Stainless steel<br />
tubing is used throughout with the system enclosed in a box structure. The 10 inch steel<br />
3-19
Final Technical Report<br />
GPHS-RTGs for the Cassini Mission<br />
Lockheed Martin <strong>Document</strong> No. RR18<br />
April 1998<br />
wheels are manually retractable to provide a stable configuration when tied down for<br />
shipment. During the Cassini program the protective cover assembly was modified by<br />
adding a four inch high hat section to the top of the cover. This allows proper clearance with<br />
the RTG when the JPL adapter is installed on the RTG for transfer to the launch site.<br />
3.2.3 Readout Console (ROC)<br />
The ROC provides the capability to monitor the performance of an RTG/ETG and to supply<br />
power for the EHS. It also includes the equipment to monitor, switch, and display the<br />
ETG/RTG temperatures and output voltage and current. A programmable data acquisition<br />
system provides the normal data acquisition sequence and test parameters. Programs are<br />
loaded into the data logger at the start of the test by floppy disk. An alarm system monitors<br />
critical ETG/RTG parameters and signals out-of-limit conditions. Temperatures and<br />
performance data, such as ETG/RTG voltage, current, thermopile-to-case, and foil shunt<br />
resistances, are recorded. ETG/RTG operation times are displayed on elapsed time meters.<br />
The ROC also monitors the voltage, current, and temperature of the EHS, providing out-oflimit<br />
alarms for these parameters as well. The ROC is a two bay rack (Figure 3.2-3) which<br />
requires a 208 Vac, 3 phase, 60 Hz, 50 amp power source. The Digitec Model 3000 data<br />
logger (with a Model 3300 scanner) was upgraded to an HP 75000 Data Acquisition<br />
System (DAS). In addition to the DAS upgrade, an HP Deskjet 500 printer was added to<br />
provide hard copies of normal interval data as well as alarm data. A Fluke Model 8520A<br />
digital multimeter (DMM) displays real time and/or backup manual data acquisition and a<br />
Sorensen Model DCR-150-70A power supply provides power for the EHS heat source. The<br />
ROC also contains six additional panels. The console control panel controls rack power<br />
and power status indicators, an RTG simulator panel for ROC checkout, a DMM input<br />
selector panel, the EHS monitor panel, ETG/RTG monitor panel, and a load panel. The load<br />
panel displays open circuit and shunt resistance readings as well as real time current and<br />
voltage.
14 6<br />
Final Technical Report<br />
GPHS-RTGs for the Cassini Mission<br />
Lockheed Martin <strong>Document</strong> No. RR18<br />
April 1998<br />
EMI fffik<br />
►<br />
1 11 •<br />
Vilf/MINO<br />
Figure 3.2-3. Readout Console<br />
3.2.4 Portable Test Unit (PTU)<br />
The PTU is a suitcase-sized package 24 inches long by 20.5 inches wide by 6.5 inches high<br />
and weighs approximately 40 pounds. The PTU is an AC/DC powered instrument which<br />
measures the RTG voltage, current, and shunt resistance, usually when the RTG is in the<br />
BPCA. The PTU contains a Fluke model 8600A DMM, internal self test circuits and a<br />
switching network which, in conjunction with the DMM, allows the RTG short/open circuit<br />
voltage, current, and resistance measurements to be displayed. The DC power supply<br />
(batteries) in the DMM provides for approximately six hours of continuous operation. The<br />
batteries can be charged continuously from a 120 volt AC source. Operation of the PTU in<br />
3-21
Final Technical Report<br />
GPHS-RTGs for the Cassini Mission<br />
Lockheed Martin <strong>Document</strong> No. RR18<br />
April 1998<br />
the AC mode does not affect the charging rate of the batteries, since the batteries always<br />
supply operating power. Operation of the PTU is identical in either the AC or DC mode.<br />
The PTU/RTG interface cables and the AC power cable are housed in each lid of the PTU.<br />
3.2.5 Gas Service Cart (GSC)<br />
The GSC is a portable, self contained, pneumatic system approximately 4 feet wide by 2.5<br />
feet deep by 5 feet high. The GSC is capable of storing and supplying various gases from<br />
different supply bottles secured to the cart and is used primarily to pressurize shipping<br />
containers, ETGs, and RTGs. A Welch mechanical pump is utilized for evacuation prior to<br />
backfilling operations. This pump is equipped with an oil free filter to preclude any oil<br />
backstreaming. An in-line thermocouple gauge is installed to allow vacuum pressure to be<br />
monitored and an absolute filter in the exhaust train provides radiological safety. A Wallace<br />
Tiernan 0.35 psia pressure gauge with 0.05 psia subdivisions accurately monitors pressure<br />
conditions. A micrometer valve is installed in the system for gas flow rate control during<br />
backfilling operations. This valve has an in-line 60 micron filter to prevent particulate<br />
contamination of the system or the test specimen. A gas sample port is available for taking<br />
RTG gas sampling.<br />
3.2.6 ETG/RTG Handling Fixtures<br />
Special fixtures are required for handling and lifting the ETG/RTG, for personnel safety as<br />
well as mechanical necessity. These fixtures are briefly described below.<br />
The outboard handling fixture (47D305498) is a circular aluminum ring which clamps onto<br />
the outboard end of the ETG/RTG and provides an interface for the lifting sling (47D305505<br />
G1/G2). The lifting sling is a four point aluminum fixture designed for either outboard use<br />
(G2) as described above or inboard use (G1). The inboard configuration mates with the<br />
mid-ring assembly (47D306262) which is the mounting interface with the ETG shipping<br />
containers and BPCAs. The RTG handling sling assembly (47D305515) is a two piece<br />
aluminum fixture used to rotate the ETG/RTG to provide access to the inboard end for midring<br />
removal. This fixture is more commonly referred to as the turnover fixture. The RTG<br />
BPCA lifting yoke (47C305560) is a steel I-beam fixture which mates to the lifting lugs of the<br />
BPCA protective cover. This lifting yoke is used in the removal of the protective cover or for<br />
3-22
Final Technical Report<br />
GPHS-RTGs for the Cassini Mission<br />
Lockheed Martin <strong>Document</strong> No. RR18<br />
April 1998<br />
lifting the entire BPCA (with or without the RTG) by crane. The dome clamping ring<br />
(47D306459) is a special fixture which facilitates proper seating of the C-seal during<br />
doming operations.<br />
References for Section 3<br />
3.1.1-1 Carpenter, R. T. (OSC) to B. A. Cook (DOE/NE-50), "Cassini F-2 RTG Fuel<br />
Composition," 4 December 1995.<br />
3.1.1-2 Carpenter, R. T. (OSC) to B. A. Cook (DOE/NE-50), "Cassini F-7 RTG Fuel<br />
Composition," 23 July 1996.<br />
3.1.1-3 Carpenter, R. T. (OSC) to B. A. Cook (DOE/NE-50), "Cassini F-6 RTG Fuel<br />
Composition," 16 December 1996.<br />
3.1.1-4 "GPHS 238-PuO 2 Feed Powder Specification," LANL, 26Y-318180, 30 January<br />
1996.<br />
3.1.1-5 "GPHS 238-Plutonium Dioxide Fueled-Clad Specification," LANL, 26Y-318182,<br />
30 January 1996.<br />
3-23
Section 4<br />
Detailed Design History<br />
and<br />
Special Studies
Final Technical Report<br />
GPHS-RTGs for the Cassini Mission<br />
Lockheed Martin <strong>Document</strong> No. RR18<br />
August 1998<br />
SECTION 4<br />
DETAILED DESIGN HISTORY AND SPECIAL STUDIES<br />
4.1 HERITAGE FROM GPHS-RTG PROGRAM<br />
4.1.1 GPHS<br />
The General Purpose Heat Source for the Cassini program is virtually identical in design to<br />
that for the Galileo and Ulysses missions. However, several minor modifications were made<br />
to the GPHS to facilitate manufacture, assembly, and inspection processes for the Cassini<br />
program. These included changes to the fueled clad weld shield, weld vent notch, fuel<br />
mass, and allowable impurities. The differences from the heritage design are summarized<br />
below.<br />
Weld Shield<br />
During the Cassini program the weld shield design was revised to eliminate the shield-tocup<br />
attachment welds and facilitate clad vent set fabrication. Further, the absence of the<br />
shield attachment welds simplified clad vent set inspections. Figure 4.1.1-1 (based on<br />
Lockheed Martin Energy Systems Drawing M2D920101A009) shows the heritage shield<br />
design which included weld tabs for fastening the shield to the non-vented cup. To simplify<br />
the use of the weld shield, the revised configuration (designated type II) is shown in Figure<br />
4.1.1-2 and was developed by Oak Ridge, Savannah River Plant, and Los Alamos<br />
personnel. The type II weld shield is not welded into one of the two clad cups and therefore<br />
is non-integral. Instead, it is installed separately in the non-vented cup at the time of fuel<br />
pellet loading. It is positioned inside the receiving cup by sliding it down until it reaches the<br />
wall curvature near the cup bottom. For this reason, the nominal height of the blank from<br />
which the type II shield is formed (13.97 mm) had to be greater than the heritage weld shield<br />
(8.14 mm nominal) which was welded to the cup wall at a location above the bottom<br />
curvature. (The type II shield is held in place by spring action of the shield against the<br />
inside wall of the cup.) The required shield height in each case was chosen to ensure that<br />
4-1
Final Technical Report<br />
GPHS-RTGs for the Cassini Mission<br />
Lockheed Martin <strong>Document</strong> No. RR18<br />
August 1998<br />
WELD JOINT<br />
LOCATION OPTIONAL<br />
73.28<br />
- 43.97<br />
0.13<br />
14.66<br />
0 28.12<br />
Lr--u<br />
-01 14- 2.54<br />
TYP<br />
5PLCS<br />
6.35<br />
8.14<br />
BLANK SIZE DETAIL<br />
i<br />
I 6.35<br />
4<br />
i<br />
H 28.33-11 0.89<br />
Figure 4.1.1-1. Heritage Weld Shield (Nominal Dimensions in mm)<br />
1<br />
Final Technical Report<br />
GPHS-RTGs for the Cassini Mission<br />
Lockheed Martin <strong>Document</strong> No. RR18<br />
August 1998<br />
the shield was positioned behind the clad girth closure weld center line. The added mass of<br />
the type II weld shield was quite small and was easily accommodated within the overall RTG<br />
mass requirement of 125 pounds.<br />
Weld Vent Notch<br />
To provide greater venting area for the interior of the fuel cladding during girth closure<br />
welding, the weld vent notch in one of the two mated cups was widened during the Cassini<br />
program. The change affected only the width of the notch, not the height and is shown in<br />
Figure 4.1.1-3. The notch width increased from 0.25-0.35 mm to 0.45-0.60 mm, while the<br />
notch height remained unchanged at 0.15-0.20 mm. Weld thickness and bulge<br />
measurements (comparing mated cups with two standard vent notches against cup pairs<br />
with one enlarged and one standard vent) showed that the widened notch did not cause<br />
unacceptable welds and that acceptable welds could not be made with standard size<br />
notches. For this reason, both weld vent notches were considered acceptable for use on<br />
Cassini fueled clads.<br />
HERITAGE WELD VENT NOTCH<br />
LOCATION OF WELD<br />
VENT NOTCH IN SHIELD CUP<br />
■<br />
V<br />
■<br />
f41---i i<br />
, / 1<br />
1 ■ — 0.20<br />
15.12 y 0.15<br />
15 04 ,<br />
V<br />
0.35<br />
0.25<br />
029.88<br />
29.73<br />
V<br />
MODIFIED WELD VENT NOTCH<br />
Figure 4.1.1-3. Weld Vent Notch Change (Nominal Dimensions in mm)<br />
0.15<br />
-,11.<br />
— 0.60<br />
0.45<br />
4-3
Fuel<br />
Final Technical Report<br />
GPHS-RTGs for the Cassini Mission<br />
Lockheed Martin <strong>Document</strong> No. RR18<br />
August 1998<br />
For the Cassini program, fresh fuel derived from newly exposed targets was not used.<br />
Instead, existing fuel was returned to the DOE Savannah River Plant and reprocessed. The<br />
LANL fuel powder and pellet.specifications were revised to reflect the use of reprocessed<br />
fuel with the revisions primarily affecting Pu 238 content and allowable levels of some cationic<br />
impurities. These new Cassini limits are documented in LANL specifications 26Y-318180<br />
and 26Y-318182 and are based upon the fuel actually produced by SRP during<br />
reprocessing.<br />
Finally, during the Cassini program, nominal pellet weight was increased by one gram to<br />
151 grams. This was done to slightly favor higher pellet thermal output, judged to be a<br />
prudent step using reprocessed fuel. The added mass was accommodated within the 125<br />
pound RTG mass limitation.<br />
4.1.2 Converter Assembly<br />
4.1.2.1 Electric Heat Source<br />
The Electric Heat Source (EHS) was used during processing and testing of the Flight Unit<br />
converters prior to their conversion from an ETG to an RTG. The EHS was required to<br />
duplicate the thermal and mechanical characteristics of a GPHSA, that is, an assembly of 18<br />
GPHS modules and lock members, together with a midspan plate. In addition to meeting<br />
requirements for thermal power output, operating surface temperature, external geometry,<br />
mass, and mass distribution, the EHS was required to have sufficient strength and rigidity to<br />
withstand support preloads and the mechanical environment encountered during dynamic<br />
testing.<br />
The EHS, shown in Figure 4.1.2-1, consisted of the following major components: (i) a<br />
graphite aeroshell that simulated the outside geometry of the aeroshells of stacked GPHS<br />
modules, (ii) graphite end caps that simulated the interfaces with the inboard and outboard<br />
heat source support assemblies, (iii) a graphite midspan plate that simulated the interface<br />
with the midspan supports, (iv) alumina insulators that supported the heating elements and<br />
provided electrical isolation, (v) graphite heating elements for the upper and lower sections,<br />
4-4
Final Technical Report<br />
GPHS-RTGs for the Cassini Mission<br />
Lockheed Martin <strong>Document</strong> No. RR18<br />
August 1998<br />
OUTER SERPENTINE<br />
SERPENTINE INSULATION<br />
SHELL HEATER MIDSPAN TERMINATION SLEEVE<br />
TYP PLATE<br />
'A' -411-1 EYEBOLT<br />
GSE<br />
BALLAST<br />
BOLT<br />
BALLAST<br />
HEATER POWER<br />
INSULATION LEAD<br />
SUPPORT RINGS<br />
'A'<br />
LOWER<br />
OUTBOARD<br />
+Y<br />
POWER LEADS<br />
TYP 4 PLACE<br />
UPPER<br />
INBOARD —110.-<br />
-Y<br />
Figure 4.1.2-1. Electric Heat Source
Final Technical Report<br />
GPHS-RTGs for the Cassini Mission<br />
Lockheed Martin <strong>Document</strong> No. RR18<br />
August 1998<br />
(vi) tungsten power leads that attached to the heating elements and penetrated through the<br />
inboard end cap, and (vii) a molybdenum ballast that added to the mass and heat capacity<br />
of the EHS. The EHS was capable of operating from a power source of variable voltages<br />
up to 150 volts dc, providing power up to 4500 watts.<br />
4.1.2.1.1 Heritage from GPHS Programs<br />
The design of the Electric Heat Source was based on the design that was used on the MHW<br />
and identical to that used on the GPHS-RTG program. The graphite serpentine heater<br />
element, POCO outer shell, serpentine termination connections, tungsten power leads,<br />
alumina intermediate support rings, molybdenum ballast and the POCO end caps were all<br />
similar to features of the MHW program electric heat source. The GPHS electric heat source<br />
was smaller in cross-section and twice as long with almost twice the power output as the<br />
MHW electric heat source.<br />
4.1.2.1.2 Design Features and Rationale<br />
This paragraph describes the EHS in more detail, and provides some of the rationale for<br />
design selections. Table 4.1.2-1 provides a simplified parts list for the EHS from drawing<br />
47J306060. Additional details of construction and materials can be obtained by reference<br />
to the drawings listed.<br />
The outer shell of the EHS was made from POCO graphite, grade AXF-5Q. The decision to<br />
use this material, rather than the FWPF graphite from which the GPHS aeroshell was<br />
fabricated, was made on the basis of cost and delivery. FWPF had a long lead time and<br />
was not normally made in billet sizes large enough to make the EHS shell, even in two<br />
pieces. To compensate for the higher coefficient of thermal expansion of POCO, the EHS<br />
was made appropriately shorter so that it matched the length of the Isotope Heat Source<br />
(IHS) at operating temperature. This difference also meant that when required for dynamic<br />
testing, it was necessary to apply a calculated preload such that the preload occurring at<br />
launch temperature would match the preload on an IHS. Even with POCO, the billet size<br />
available necessitated machining the outer shell in two halves, with a separate midspan<br />
plate.
Table 4.1.2-1. Parts List for Electric Heat Source<br />
(Reference LMMS Drawing 47J306060)<br />
Reference Drawing Number<br />
47D305001<br />
47D305002<br />
47D305003<br />
47C305004<br />
47E305581<br />
47D305007<br />
47D305008<br />
47B305009<br />
47E305581<br />
47C305012<br />
47C305011<br />
47C305013<br />
47C305017<br />
47B305015<br />
47B305016<br />
47B305019<br />
47E305581<br />
47C305014<br />
47C305021<br />
47B305023<br />
47B305024<br />
47B305025<br />
47B305026<br />
47B306061<br />
47C305027<br />
47D305018<br />
47B301557<br />
Part Nomenclature<br />
Upper Shell<br />
Spacer Sleeve<br />
Heater Element<br />
Support Tube<br />
Ballast, Lower Half<br />
End Cap, Upper<br />
End Cap, Lower<br />
Eye Bolt<br />
Ballast Bolt<br />
Support Ring, Center<br />
Support Ring, End<br />
Support Ring, Intermediate<br />
Sleeve, Center<br />
Angle Terminal<br />
Clamp Washer<br />
Power Lead<br />
Ballast, Upper Half<br />
Support Ring<br />
Midspan Support<br />
Bolt, Terminal<br />
Nut, Terminal<br />
Bolt, Terminal<br />
Nut, Terminal<br />
Screw, Locking<br />
Dowels<br />
Lower Shell<br />
Washers<br />
476302017 Bead<br />
47B305006<br />
47B302110<br />
Spacer, Insulator<br />
Sleeve, Insulating<br />
Final Technical Report<br />
GPHS-RTGs for the Cassini Mission<br />
Lockheed Martin <strong>Document</strong> No. RR18<br />
August 1998
Final Technical Report<br />
GPHS-RTGs for the Cassini Mission<br />
Lockheed Martin <strong>Document</strong> No. RR18<br />
August 1998<br />
The length of the heater elements was also limited by available billet sizes, so that separate<br />
elements were made for the upper and lower halves. In order to extend the heater<br />
elements as close as possible to the end caps and to provide more uniform heating near the<br />
ends, the heat element terminations were located at the midspan. Upper and lower halves<br />
were made symmetrically so that the only contributions to non-uniform heating were the I 2R<br />
losses in the power leads between the inboard end and the midspan. This non-symmetrical<br />
heating was identifiable in thermal vacuum testing of the GPHS-RTG Engineering Unit,<br />
where the temperature of the outer shell was consistently higher on the inboard half than on<br />
the outboard half. The heater elements were machined in a serpentine pattern, following<br />
the practice used for the heater element used in the EHS for the MHW-RTG program. To<br />
account for slight variations in the electrical resistivity of POCO from one heater element to<br />
another, final machining was performed after precision measurement of the resistance of<br />
each heater element. Machining was performed to reduce the cross-sectional area of each<br />
leg of the serpentine without affecting the fit of the heater element with adjacent parts.<br />
Alumina tubing was used as the primary support for the heater elements on their outside<br />
diameter. This was a design deviation from the practice used in the EHS for MHW-RTG<br />
which incorporated a flanged cylinder. The choice of standard alumina tubing facilitated<br />
procurement, but meant that without a flange the sleeve was less readily restrained in the<br />
axial direction. After this design weakness was revealed in dynamic testing, it was<br />
necessary to make selective fit of specially ground spacers in order to limit the amount of<br />
possible axial movement.<br />
Each heater element had two power leads attached to its terminals at midspan and<br />
extended through the inboard end cap. The four tungsten wires projected through holes in<br />
the multifoil insulation in the inboard heat source assembly. In the cavity of the spool piece,<br />
the ends of the EHS power leads were connected to four single-pin connectors by means of<br />
mechanically fastened cable assemblies. Through the multifoil insulation, the power leads<br />
were insulated by alumina tubing. Once inside the cavity of the spool piece, Varglas<br />
sleeving was used for electrical insulation on the power leads and interconnecting cables.<br />
4-8
Final Technical Report<br />
GPHS-RTGs for the Cassini Mission<br />
Lockheed Martin <strong>Document</strong> No. RR18<br />
August 1998<br />
In addition to the major components described above, the EHS incorporated nine<br />
instrumentation thermocouples on its outer surface. These thermocouples were used to<br />
monitor EHS temperatures during heat up and processing of the ETG. The thermocouples<br />
used tungsten-rhenium wire and the junction was covered with a foil strip of niobium. The<br />
junction was secured to the outer shell of the EHS with clips and screws machined from<br />
POCO, and the wires were insulated with alumina tubing. Two bundles of insulated<br />
instrumentation wires passed through two separate holes in the multifoil insulation of the<br />
ETG inboard heat source support assembly. Inside the cavity of the spool piece, the wires<br />
were insulated with Varglas sleeving and attached to a multipin connector in the spool<br />
piece.<br />
The molybdenum ballast in the EHS was made in three pieces to facilitate assembly. The<br />
center piece of the assembly was a dowel, slip fit into holes in the upper and lower halves,<br />
then double pinned. During handling and storage of the EHS, the ballast served as the<br />
structural core. The outboard end cap was attached to the ballast with a through<br />
molybdenum bolt, torqued and keyed. At the inboard end, the ballast projected through the<br />
inboard end cap and was secured with an eye bolt. When lifted by the eye bolt, the load<br />
path was through the ballast to the outboard end cap. Installed in the ETG, the eye bolt was<br />
removed and the load path for the preload was through the end caps and outer shell, while<br />
the ballast was restrained at one end only.<br />
4.1.2.2 Heat Source Supports<br />
4.1.2.2.1 Heritage from MHW<br />
The design concept for the heat source support system on the Cassini RTG was similar to<br />
that used on the MHW RTGs. Similar material combinations and surface treatments were<br />
used in order to take advantage of proven material compatibilities. The primary differences<br />
were due to size and number of supports used. The Cassini and GPHS-RTGs utilize heat<br />
source supports at each end of the RTG and a set of midspan supports. The MHW-RTG<br />
utilized supports at each end, but no midspan supports were necessary. In addition the<br />
MHW-RTG heat source support system used a single, larger preload stud, attached to a<br />
titanium spider frame which reacted the loads through latches attached to a beryllium outer<br />
4-9
Final Technical Report<br />
GPHS-RTGs for the Cassini Mission<br />
Lockheed Martin <strong>Document</strong> No. RR18<br />
August 1998<br />
shell. Because of the shorter length of the MHW-RTG heat source and the similarity in the<br />
thermal expansions of the materials used, the deflection range for which the preload was<br />
required to be maintained was smaller. The MHW-RTG spider frame was designed to have<br />
sufficient elasticity to accommodate deflections without the need for other springs.<br />
Similarities in the design of the heat source support system included the tapered preload<br />
stud, wrapped with Astroquartz yarn and stuffed with quartz fiber insulation. The zirconia<br />
insulator on the MHW-RTG was larger, and to avoid cracking due to high thermal stresses,<br />
was assembled in three segments. The corresponding zirconia insulators for the Cassini<br />
RTG were designed to have lower thermal stresses and were assembled in one piece. A<br />
design detail adapted from MHW-RTG was the use of tungsten and iridium washers as<br />
diffusion barriers between the zirconia and the graphite pressure plate.<br />
4.1.2.2.2 Design Features and Rationale<br />
The Cassini RTG heat source support system consists of an inboard heat source support<br />
assembly (IBSA), an outboard heat source support assembly (OBSA), and four midspan<br />
support assemblies (MSA).<br />
Inboard Heat Source Support Assembly<br />
The major components of the IBSA are identified in Figure 4.1.2-2. The following is a<br />
detailed description of these components, roughly in order of the load path from the heat<br />
source to the outer shell. Further details on the construction and materials used in the IBSA<br />
can be found by reference to the drawings listed in Table 4.1.2-2.<br />
The pressure plate in contact with the top GPHS module is fabricated from FWPF graphite<br />
and has two truncated hemispherical buttons machined on the outboard side of the plate.<br />
These buttons nest in the pockets of the top module to resist shear loads. The plate has a<br />
pair of tapered ears at each outboard corner. These ears aid in installing the IBSA onto the<br />
top module of the GPHSA and ensure engagement of the buttons into the module pockets.<br />
On the inboard face of the pressure plate are four (4) equally spaced pockets and a center<br />
10-32 UNF threaded hole. Nested within the pockets are zirconia insulators, with thin
Final Technical Report<br />
GPHS-RTGs for the Cassini Mission<br />
Lockheed Martin <strong>Document</strong> No. RR18<br />
August 1998<br />
QUARTZ FIBER INSULATION<br />
OUTER SHELL<br />
FIBROUS QUARTZ<br />
YARN WRAP<br />
PRELOAD STUD<br />
HARDENED WASHERS<br />
BARRIERS (IRIDIUM AND TUNGSTEN)<br />
HEAT SOURCE PRESSURE PLATE<br />
GPHS (REF.)<br />
TIMIS/<br />
wi At. sli<br />
ar, ww:<br />
t eiA<br />
`a="<br />
".17-1W. Nov<br />
WIND*<br />
iMULTIFOIL INSULATION<br />
INSULATOR (ZIRCONIA)<br />
Am.=<br />
INBOARD DOME<br />
FIBROUS INSULATION<br />
WASHERS<br />
SUPPORT FRAME<br />
LATCH<br />
SPRING WASHERS PRESSURE PLATE STUD INBOARD SUPPORT COLLAR<br />
Figure 4.1.2-2. Inboard Heat Source Support<br />
Table 4.1.2-2. Components of the Inboard Heat Source Support Assembly<br />
(Reference LMMS Drawing 47D305125)<br />
Reference Drawing No.<br />
47D305126<br />
47C305147<br />
Part Nomenclature<br />
Pressure Plate, Stud<br />
Spring Washer<br />
470305128 Collar<br />
47C305129<br />
Guide<br />
470305130 Nut (Adjusting Tool)<br />
47C305131<br />
Screw (Holding Tool)<br />
470305132 Stud<br />
47C305061<br />
Pressure Plate, Heat Source<br />
470305229 Insulation Pad<br />
47C305135<br />
Insulator (Zirconia)<br />
4-11
Final Technical Report<br />
GPHS-RTGs for the Cassini Mission<br />
Lockheed Martin <strong>Document</strong> No. RR18<br />
August 1998<br />
Table 4.1.2-2. Components of the Inboard Heat Source Support Assembly<br />
(Reference LMMS Drawing 47D305125) (Cont'd)<br />
Reference Drawing No.<br />
47C305136<br />
47C305137<br />
47E305109<br />
47B305133<br />
47B305382<br />
47E305064<br />
47B305391<br />
Part Nomenclature<br />
Barrier (Tungsten)<br />
Barrier (Iridium)<br />
Insulation Assembly<br />
Washer<br />
Washer, Inboard<br />
Frame<br />
Barrier, Preload Stud<br />
barriers of tungsten and iridium separating the zirconia from the FWPF graphite of the<br />
GPHS. Adjacent to and inboard of the pressure plate are 60 layers of octagonally shaped<br />
molybdenum insulation foil, separated by layers of Astroquartz cloth. Through this pack of<br />
insulation there are four holes corresponding in location to the zirconia insulators. A<br />
second pressure plate sits atop the insulation package with its four studs, penetrating the<br />
insulation and nesting on the zirconia washers, separated only by a stainless steel washer<br />
barrier. Each tapered stud, made from Inconel X-750, is wrapped on its exterior with<br />
Astroquartz yarn and stuffed in its interior with quartz fiber insulation.<br />
Extending from the inboard side of the stud pressure plate is an externally threaded sleeve.<br />
Three large spring washers approximately 4.0 inches in diameter are stacked in series<br />
between a threaded collar and a spring washer guide. The collar is then threaded onto the<br />
sleeve of the pressure plate. Mounted over the spring assembly and pressure plate is the<br />
inboard frame. This frame transfers axial and lateral loads from the pressure plate to<br />
latches bolted to the inboard rim of the converter shell. By adjustment of the collar, axial<br />
load is applied to the GPHSA and the frame transfers this load through the same latches to<br />
the outer shell. A nut adjusting tool is used to hold the spring assembly together when the<br />
frame was not latched to the shell. A center holding tool is inserted through the pressure<br />
plate and insulation package. This is then threaded into the center hole in the graphite<br />
pressure plate. These two tools are required to hold the various pieces in relative position<br />
until the assembly has been installed in the converter, then they are removed.<br />
4-12
Outboard Heat Source Support Assembly<br />
Final Technical Report<br />
GPHS-RTGs for the Cassini Mission<br />
Lockheed Martin <strong>Document</strong> No. RR18<br />
August 1998<br />
The major components of the OBSA are identified in Figure 4.1.2-3. The following is a<br />
detailed description of these components, roughly in order of the load path from the heat<br />
source to the outer shell. Further details of the construction and materials used in the OBSA<br />
can be found by reference to the drawings listed in Table 4.1.2-3.<br />
MULTIFOIL INSULATION<br />
OUTBOARD DOME<br />
FIBROUS QUARTZ YARN<br />
INSULATION WASHERS<br />
LATCH<br />
PRELOAD STUD<br />
PRELOAD SUPPORT FRAME<br />
OUTER SHELL<br />
FIBROUS QUARTZ<br />
YARN WRAP<br />
INSULATORS<br />
(ZIRCONIA)<br />
QUARTZ FIBER<br />
INSULATION<br />
BARRIERS (TUNGSTEN AND IRIDIUM)<br />
GPHS (REF.) RETAINING SCREW HEAT SOURCE PRESSURE PLATE<br />
Figure 4.1.2-3. Outboard Heat Source Support<br />
Table 4.1.2-3. Components of the Outboard Heat Source Support Assembly<br />
(Reference LMMS Drawing 47D305155)<br />
Reference Drawing No.<br />
47D305041<br />
Frame<br />
Part Nomenclature<br />
47E305109<br />
47D305105<br />
47B305042<br />
47B305135<br />
End Cap Insulation Assembly<br />
Pressure Plate, Outboard<br />
Screw, Retainer<br />
Insulator<br />
4-13
Final Technical Report<br />
GPHS-RTGs for the Cassini Mission<br />
Lockheed Martin <strong>Document</strong> No. RR18<br />
August 1998<br />
Table 4.1.2-3. Components of the Outboard Heat Source Support Assembly<br />
(Reference LMMS Drawing 47D305155) (Cont'd)<br />
Reference Drawing No.<br />
47B305137<br />
Part Nomenclature<br />
Barrier (Iridium)<br />
476305136 Barrier (Tungsten)<br />
47C305132<br />
47D305229<br />
47B305305<br />
47B305391<br />
Stud<br />
Insulation Pad<br />
Stud, Ratch<br />
Barrier, Preload Stud<br />
The OBSA is very similar to the IBSA with the following exceptions. There is no adjustment<br />
of the preload required in the OBSA, so there are no spring washers and the tapered studs<br />
are threaded directly into the frame. The frame is fastened into the latches on the outer shell<br />
through clevis fittings and all the pieces are held together until after installation into the<br />
converter with a small molybdenum retaining screw passing through the pressure plate,<br />
insulation assembly and threaded into the frame. After installation of the OBSA and just<br />
prior to installation of the electric heat source assembly, the bolt is backed off several turns<br />
to allow for thermal expansion of the assembly.<br />
Midspan Support Assembly<br />
The major components of the MSA are identified in Figure 4.1.2-4. The following is a<br />
detailed description of these components. Further details of construction and materials<br />
used in the MSA can be found by reference to the drawings listed in Table 4.1.2-4.<br />
Each midspan support assembly is composed of three parts: a pivot, an insulation plug<br />
assembly, and a spring washer assembly. The insulation plug assembly has a locating pin<br />
fabricated from FWPF graphite, which engages in a hole in the GPHSA midspan plate.<br />
Centered on the outboard surface of the FWPF flange, and separated by 0.001 inch thick<br />
tungsten and iridium barrier washers is a thick walled cylinder of zirconia which acts as the<br />
preliminary thermal insulator for the MSA. Mounted on the zirconia is a spherical seat<br />
4-14
Final Technical Report<br />
GPHS-RTGs for the Cassini Mission<br />
Lockheed Martin <strong>Document</strong> No. RR18<br />
August 1998<br />
MID SPAN CAP<br />
SUPPORT<br />
HARDENED WASHER<br />
SPRING WASHER NUT<br />
RETAINER<br />
SPRING WASHERS<br />
OUTER SHELL<br />
SEAT (PIVOT)<br />
PIVOT<br />
MULTIFOIL INSULATION<br />
INSULATOR<br />
LOCATING PIN FWPF<br />
GPHS (REF.)<br />
MIDSPAN SUPPORT PLATE<br />
Figure 4.1.2-4. Midspan Support<br />
Table 4.1.2-4. Components of the Midspan Support Assembly<br />
(Reference LMMS Drawing 47D306036)<br />
Reference<br />
Drawing No.<br />
47B306039<br />
47C305147<br />
47B305102<br />
47B305291<br />
47B305099<br />
47B305136<br />
47B305121<br />
47B306524<br />
47B305123<br />
47B305106<br />
Part<br />
Nomenclature<br />
Nut, Spring Washer<br />
Spring Washer<br />
Support<br />
Screw<br />
Pivot<br />
Barrier (Tungsten)<br />
Barrier (Iridium)<br />
Nut (Tool)<br />
Washer<br />
Spring, Centering
Table 4.1.2-4. Components of the Midspan Support Assembly<br />
(Reference LMMS Drawing 47D306036) (Cont'd)<br />
Reference<br />
Drawing No.<br />
Part<br />
Nomenclature<br />
47.C306031 Retainer Assembly<br />
47B306034<br />
47B305103<br />
47C306027<br />
47C306033<br />
47B305517<br />
Seat<br />
Insulator<br />
Can Assembly<br />
Pin, Locating<br />
Washer<br />
Final Technical Report<br />
GPHS-RTGs for the Cassini Mission<br />
Lockheed Martin <strong>Document</strong> No. RR18<br />
August 1998<br />
which matches the end of the pivot. All these pieces are stacked in an iridium can, packed<br />
with fibrous insulation, and trapped on the end of the pivot by wiring the ears of the iridium<br />
can with Inconel safety wire. The spring washer assembly consists of a spring washer<br />
guide with three spring washers stacked in series and loaded by means of an Inconel-X750<br />
nut threaded into a helicoil installed in a midspan boss in the outer shell. The nut is locked<br />
in place by a lock nut threaded into the same boss. The pivot is fitted inside the spring<br />
washer guide and contacts a matched spherical seat. These pieces are held together by an<br />
Inconel-X750 centering spring, wired with Inconel safety wire.<br />
4.1.2.3 Thermopile<br />
The thermopile is an assembly of multifoil insulation, molybdenum inner frame, two inner<br />
frame supports, 572 unicouples, and cold side electrical connecting straps. The multifoil<br />
insulation surrounds the heat source and is penetrated by the unicouples. Most of the<br />
radiated heat from the heat source is collected by the hot shoes and passed through the<br />
unicouple where it is converted into electrical power. The waste heat passing through the<br />
unicouples and bypassing the unicouples through the insulation is conducted through the<br />
outer shell to radiating fins. The multifoil lay up was modified for the two RTGs fabricated for<br />
the Cassini mission.<br />
4.1.2.3.1 Heritage from MHW<br />
The design of the Cassini RTG thermopile is based on the design of the MHW-RTG<br />
thermopile. The Cassini and GPHS-RTGs are smaller in diameter but about twice as long<br />
4-16
Final Technical Report<br />
GPHS-RTGs for the Cassini Mission<br />
Lockheed Martin <strong>Document</strong> No. RR18<br />
August 1998<br />
as MHW-RTG and have almost twice as many unicouples and generate almost twice the<br />
electrical power. The unicouples are identical, the multifoil insulation is made of the same<br />
numbers of molybdenum foils and Astroquartz cloth. Because of the length, the insulation in<br />
the Cassini and GPHS-RTGs are made in five sections while MHW-RTG insulation was in<br />
three sections. MHW-RTG required a degaussing loop around the circumference to<br />
compensate for its single electrical circuit in the thermopile. The Cassini and GPHS RTGs<br />
on the other hand, have two electrical circuits, opposing each other. The intent is to balance<br />
the magnetic fields generated by the two circuits.<br />
4.1.2.3.2 Silicon Germanium Unicouple<br />
The silicon germanium unicouple is the same as that used on the GPHS program. The<br />
unicouple, as shown in Figure 4.1.2-5, consists of an 85 weight percent silicon molybdenum<br />
heat susceptor, or hot shoe, to which the N and P couple legs were bonded. Two<br />
compositions of silicon-germanium are used in the legs, 78 atomic percent silicon for most<br />
of the length and a short 63.5 atomic percent section at the cold end. The lower content<br />
segment is used to provide improved matching for thermal expansion of the bonded parts.<br />
The two SiGe legs and their corresponding sections of the hot shoe was doped to provide<br />
thermoelectric polarity; the N-type material is doped with phosphorus and the P-type with<br />
boron. The SiGe thermoelectric elements are coated with silicon nitride (Si 3N 4 ) to reduce<br />
sublimation at operating conditions. The silicon alloy couple is bonded to a cold stack<br />
assembly of tungsten, copper, and alumina parts which separate the electrical and thermal<br />
currents. The thermal current crosses the alumina insulator and passes through the radiator<br />
attachment into the outer shell. The electric current flow between couples is shunted<br />
through separate copper straps bonded to each leg assembly. These straps are riveted<br />
together after insertion into thermopile assembly to form the thermopile electrical circuit.<br />
The cold stack is designed to flex laterally to ensure unicouple load sharing from insulation<br />
loads and thermal deformations. The unicouples are electrically insulated by several layers<br />
of Astroquartz yarn tightly wound around the couple legs and by an alumina wafer beneath<br />
the hot shoe, separating it from the foil insulation.<br />
4-17
Final Technical Report<br />
GPHS-RTGs for the Cassini Mission<br />
Lockheed Martin <strong>Document</strong> No. RR18<br />
August 1998<br />
0.025 Cu HEAT SHUNT<br />
0.02 Cu CONNECTOR<br />
Ti NUT PLATE<br />
0.02 W COMPENSATOR<br />
0.02 Cu PEDESTAL<br />
0.02 W COLD SHOE<br />
ASTROQUARTZ<br />
YARN WRAP<br />
0.02 Al 203 INSULATOR<br />
63.5% AT%<br />
SiGe SEGMENTS<br />
MICROQUARTZ INSULATION<br />
78% AT %<br />
SiGe LEGS<br />
85 WT.% SiMo<br />
P-SHOE<br />
85 WT.% SiMo<br />
N-SHOE<br />
.010 ALUMINA<br />
INSULATOR<br />
(Si3N 4 COATED)<br />
Figure 4.1.2-5. Silicon Germanium Unicouple<br />
Instrumented Silicon Germanium Unicouple<br />
The 18-couple modules use a special configuration of the unicouple that is instrumented<br />
with a thermocouple. An instrumented unicouple has a tungsten/rhenium thermocouple<br />
embedded in the hot shoe at the base of , and adjacent to, the "N" leg. The wires extend up<br />
the corners of the "N" leg, trapped between the first and second layers of yarn, as shown in<br />
Figure 4.1.2-6. Cold side thermocouples are formed by twisting the thermocouple wires,<br />
spot welding to a nickel shim and riveting the shim in place with the same rivet used to<br />
connect the unicouple straps together. From the point where the hot shoe wires exit the<br />
wrap at the cold end of the unicouple and for the entire length of the cold end wires, they<br />
was sleeved in Varglas until their connection to tungsten/rhenium connector pins. The<br />
insulated thermocouple wires are tied to the electrical connector straps for support.
Final Technical Report<br />
GPHS-RTGs for the Cassini Mission<br />
Lockheed Martin <strong>Document</strong> No. RR18<br />
August 1998<br />
U/C COLD STRAPS<br />
T/C WIRES<br />
r<br />
4<br />
.25 TYP<br />
t<br />
.025 TYP<br />
.06 R TYP<br />
WRAP REMOVED<br />
FOR CLARITY<br />
ASTROQUARTZ<br />
YARN WRAP<br />
WRAPPING TO BE TIED<br />
WITH 2 HALF HITCHES<br />
Lj<br />
SPACER<br />
HOT SHOE<br />
HOT SHOE T/C<br />
45 ° + 10 °<br />
Figure 4.1.2-6. Instrumented Silicon Germanium Unicouple<br />
4.1.2.3.3 Insulation System<br />
The multifoil insulation assembly, shown in Figure 4.1.2-7, consists of 60 layers of<br />
molybdenum foil and 60 layers of Astroquartz (Si02) cloth with two types of cloth weave<br />
alternately laid up on the molybdenum inner frame assembly. The inner frame is made up<br />
of six 0.01 inch thick octagonal frames, with 0.01 inch thick back-to-back flanged ribs at<br />
each corner. The eight sides are covered with 0.0022 inch thick foil panels. Each side<br />
panel has two rows of thirty-six, 0.75 inch diameter lightening holes, separated into five<br />
groups by the frame locations. There is also one 1.0 inch diameter midspan hole at the<br />
center of each panel. The frames, ribs and panels are assembled using 0.01 inch thick clips<br />
and 0.032 inch diameter rivets to form a 6.25 inch regular open octagon frame, 40.0 inches<br />
long. All materials are molybdenum. The molybdenum insulation foils are trimmed,<br />
approximately 8.0 inches long, punched with square holes and folded, to form a fifth of two<br />
sides of the octagon's length. The Astroquartz cloth is also trimmed and punched with
Final Technical Report<br />
GPHS-RTGs for the Cassini Mission<br />
Lockheed Martin <strong>Document</strong> No. RR18<br />
August 1998<br />
2 LAYERS FIBROUS<br />
ASTROQUARTZ CLOTH<br />
INNER MOLY FRAME<br />
2.2 MILS THK<br />
3<br />
3<br />
3 3<br />
LEVEL 1<br />
LEVEL 2<br />
LEVEL 3<br />
LEVEL 4<br />
LEVEL 5<br />
LEVEL 6<br />
LEVEL 7<br />
LEVEL 1<br />
10 LAYERS MOLY FOIL 0.3 MILS THK.<br />
10 LAYERS FIBROUS ASTROQUARTZ<br />
LEVELS 2 AND 3<br />
11 LAYERS MOLY FOIL 0.3 MILS THK.<br />
11 LAYERS FIBROUS ASTROQUARTZ<br />
LEVEL 4,5.6 AND 7<br />
7 LAYERS MOLY FOIL 0.3 MILS THK.<br />
7 LAYERS FIBROUS ASTROQUARTZ<br />
RETAINING BAND<br />
MOLY 2.2 MILS<br />
(3 PLACES)<br />
2 LAYERS FIBROUS<br />
ASTROQUARTZ<br />
OUTER LAYER<br />
MOLY 2.2 MILS THK<br />
(END SECTIONS ONLY)<br />
Longitudinal <strong>View</strong><br />
OVERLAPPING<br />
LAYERS<br />
LEVEL 7<br />
CORNER GAP<br />
TYPICAL FOR<br />
ALTERNATE<br />
LEVELS 1-6<br />
OVERLAPPING<br />
LEVELS<br />
LEVELS 1-6<br />
CORNER GAP<br />
TYPICAL FOR<br />
ALTERNATE<br />
LAYERS. LEVEL 7<br />
LEVEL 7<br />
LEVEL 6<br />
FOIL LAYER TYP<br />
LAYER TYP<br />
CORNER GAP<br />
TYPICAL FOR<br />
ALTERNATE<br />
LAYERS<br />
} LEVEL 7<br />
LEVEL 6<br />
FOIL LAYER TYP<br />
CLOTH LAYER TYP<br />
OVERLAPPING<br />
LAYERS<br />
F6 & PREVIOUS RIG'S<br />
Cross Section <strong>View</strong><br />
F7 & SUBSEQUENT RTG'S<br />
Figure 4.1.2-7. Multifoil Insulation Assembly<br />
4-20
Final Technical Report<br />
GPHS-RTGs for the Cassini Mission<br />
Lockheed Martin <strong>Document</strong> No. RR18<br />
August 1998<br />
square holes. With the aid of a lay-up fixture these parts are then laid up on the inner frame<br />
assembly starting with cloth and alternating with foil for ten layers each. Each layer of foil<br />
was rotated circumferentially, so that the fold in each successive layer covers the gap in the<br />
previous layer. This lay up procedure is continued along the length of the inner frame until<br />
there are five sections, each with ten layers of foil and cloth, butted together along the entire<br />
length of the frame. This was the first layer of insulating foil. The six other levels of<br />
insulation cloth and foil are laid up in similar fashion, with each successive level<br />
overlapping the circumferential joints between sections of the previous level.<br />
For the E-6 thermopile, each level was also shifted circumferentially by one flat (45°) from<br />
the underlying level such that the fold in each successive level covered the gap in the<br />
previous level.<br />
The cloth used in all sections of the first three levels was 0.004 inches thick close weave<br />
cloth (Astroquartz #507, M9A2). Improper fit of the foil panels over the alignment pins of the<br />
E-6 thermopile was experienced at levels 4, 5, and 6 due to tolerance stack up and a<br />
drawing error in panel dimensions. The cloth thickness and distance between the fold-line<br />
and centerline of the rows of punched holes (dimension C) were changed from that<br />
specified on the assembly drawing by MRB direction. For level 4, the first three cloth layers<br />
were changed from 0.008 inches thick open weave (Astroquartz #594, M9A3) to 0.004<br />
inches thick M9A2 and the remaining four cloth layers were 0.008 inches thick M9A3. An<br />
Engineering Change Notice (ECN RTG-0332) formally changed the cloth type for layer 1<br />
from M9A3 to M9A2. For level 5, the first two cloth layers were changed from 0.008 inches<br />
thick M9A3 to 0.004 inches thick M9A2 and the remaining five cloth layers were 0.008<br />
inches thick M9A3. In addition, the first cloth layer was installed without a 45° offset from the<br />
underlying level 4 panel sections as specified on the assembly drawing. For level 6, the<br />
cloth for all layers 1, 2, and the end sections of layer 3 were changed from 0.008 inches<br />
thick M9A3 to 0.004 inches thick M9A2. Also, cloth panels at layer 1 were not offset 45°<br />
from the underlying level 5 panel sections. For level 7, the first four cloth layers were 0.008<br />
inches thick and the last two or three cloth layers were 0.004 inches thick.<br />
4-21
Final Technical Report<br />
GPHS-RTGs for the Cassini Mission<br />
Lockheed Martin <strong>Document</strong> No. RR18<br />
August 1998<br />
Changes to the foil insulation lay up were formally made by an Engineering Change Notice<br />
(ECN RTG-0372) to reduce the "bunching" effect at the corners and tearing of the panels<br />
due to stretching the foil over the alignment pins. The manufacturing planning was updated<br />
and was used to fabricate the E-7 foil insulation assembly. The notched corner of the cloth<br />
panel was oriented to match the position of the notch in the subsequent foil panel. Each<br />
layer of cloth and foil within a level was shifted one flat (45°) with respect to the previous<br />
layer of cloth and foil such that the fold covered the gap between the previous layer. The<br />
cloth thickness was not changed from that specified on the 47J305231G1 assembly<br />
drawing.<br />
Circumferential 0.0003 inch thick molybdenum bands are placed at each section joint<br />
around the outside of levels 3, 5, and 7. Each band is spot welded at each corner to one<br />
section only. Nickel shims are sandwiched between the band and foil to weld the<br />
molybdenum bands. (The rippling or bunching of the foil and cloth layers after spot welding<br />
the retaining bands after levels 3 and 5 on the E-6 insulation assembly also confirmed a<br />
panel misfit problem discussed above).<br />
The end foil panels are notched and folded radially inward at 90°. A 0.0022 inch thick<br />
molybdenum ring is placed on top of the level 2 inwardly folded cloth and foil. The folded<br />
cloth and foils of level 3 are held in place by a similar ring spot welded to the circumferential<br />
band by 16 molybdenum clips and nickel shims. This spot welded assembly also<br />
constrains levels 1 and 2. Levels 5 and 7 had similar ring, clip, shim, and band spot welded<br />
assemblies to constrain the remaining layers of cloth and foil. The first layers of cloth and<br />
foil in levels 4 and 6 do not have flanges. Overall thickness of the total insulation assembly<br />
is approximately 0.70 inch.<br />
An analysis on the possible impact of insulation modifications on RTG performance and a<br />
summary of the E-6 foil insulation fabrication history are detailed in Cassini Memo No. 251,<br />
Reference 4.1.2-1.<br />
4-22
4.1.2.3.4 Thermopile Assembly<br />
Final Technical Report<br />
GPHS-RTGs for the Cassini Mission<br />
Lockheed Martin <strong>Document</strong> No. RR18<br />
August 1998<br />
As the next step in assembly of the thermopile, the completed octagonal insulation<br />
assembly is removed from its assembly fixture and mounted to the thermopile assembly<br />
fixture. Two layers of 503 Astroquartz cloth are laid against the hot side molybdenum<br />
insulation foil to provide added electrical insulation between the foil and the hot shoe. Each<br />
completely wrapped unicouple assembly is individually installed through 572 of the 576<br />
rectangular holes in the thermopile insulation from the inside, using the hot shoe chamfer to<br />
orientate the unicouples in an "N - P" sequence. The inboard rows adjacent to the +X and -<br />
X axes have only 17 unicouples each. The other hole in each row is taken up with the posts<br />
for the inner frame support. Two more layers of Astroquartz cloth are laid against the cold<br />
side foil, and tied in place with Astroquartz yarn.<br />
Electrical Circuit<br />
The thermopile electrical circuit as shown in Figure 4.1.2-8 was formed by straightening the<br />
unicouple copper electrode straps and riveting nineteen "N" straps to "P" straps in<br />
sequence, together with redundant cross-over straps. This forms 16 two string seriesparallel<br />
circuits. Copper jumper straps were used to join the 8 inboard strings in series;<br />
similarly, the outboard strings are joined in series. This circuit permits continued converter<br />
operation in the event a single unicouple fails in either the open or short mode. Two<br />
adjacent unicouples would have to fail open to cause complete loss of power from one of<br />
the two circuits. Four main power straps redundantly connect the inboard and outboard<br />
strings of unicouples and terminate at the inboard end of the thermopile with two positive<br />
and two negative straps. Flexible, stranded, sleeved wires connect these straps with a<br />
hermetically sealed, five pin power output connector. The fifth pin is used for a ground<br />
connection to the outer shell of the converter. The circuit is designed so that the inboard<br />
half is electrically a mirror image of the outboard half. This reduced the magnetic fields and<br />
negates the need for a degaussing loop. All connecting straps are covered with Astroquartz<br />
insulation as required to prevent subsequent shorting to the outer shell. The completed<br />
thermopile, as shown in Figure 4.1.2-9, is then ready for insertion into the outer shell.
Final Technical Report<br />
GPHS-RTGs for the Cassini Mission<br />
Lockheed Martin <strong>Document</strong> No. RR18<br />
August 1998<br />
AXIAL<br />
ROWS<br />
'<br />
+x<br />
—1:=Le=0:0:::—<br />
idAb161.61kA46146<br />
INBOARD<br />
0<br />
0<br />
1 1 --0<br />
F<br />
0<br />
-Y<br />
0<br />
1111111 -0<br />
11- -1111111111111 11<br />
+Y<br />
—reosomezo=- ®<br />
461616161616161616<br />
CIRCUMFERENTIAL ROWS OUTBOARD<br />
0<br />
--®<br />
Figure 4.1.2-8. Thermopile Electrical Circuit<br />
Figure 4.1.2-9. Thermopile Assembly<br />
4-24
Final Technical Report<br />
GPHS-RTGs for the Cassini Mission<br />
Lockheed Martin <strong>Document</strong> No. RR18<br />
August 1998<br />
Electrical Interconnect<br />
Pop rivets have been the fastener originally used to make the strap to strap electrical<br />
connections in the thermopile assembly 47J305306G1. Pop rivets were used in the MHW<br />
RTG design and were subsequently incorporated into the GPHS-RTG design.<br />
Continuous monitoring of pop rivet joints in the E-6 thermopile showed that, in general, rivet<br />
joint resistances were increasing. Approximately 10% of the total 668 pop rivet joints in E-6<br />
had changes in resistance that were higher than desired with the initial (just after<br />
installation) resistance in the 0.1 to 0.2 mil range increasing to a typical range of 0.8 to 1.5<br />
mt2 after several weeks. In some instances, high resistance pop rivet joints within the E-6<br />
thermopile also exhibited unstable behavior with measured values changing both high and<br />
low in the 0.2 to 1.0 mC2 range. The realization of a pop rivet, joint resistance problem<br />
caused a significant delay in the assembly of the E-6 thermopile and initiated parallel<br />
activities to:<br />
a) evaluate the impact of high resistance joints on RTG performance;<br />
b) remove and replace the pop rivets from the most undesirable high resistance<br />
joints;<br />
c) optimize the installation (pulling and swaging forces) parameters of the pop rivet<br />
used in the E-6 thermopile to achieve improved electrical performance;<br />
d) seek alternate rivets, both pop and solid, with improved performance; and<br />
e) determine the cause for the instability/increase of rivet joint resistance.<br />
An engineering evaluation of high resistance joints in the E-6 thermopile determined that<br />
these joints would not have a significant impact on RTG power output. If all (688) rivet joints<br />
had a resistance of 1.0 ma the RTG power loss would be 5 watts. Relating this to the E-6<br />
thermopile, with approximately 60 high resistance joints, the power loss was estimated to be<br />
only 0.5 watts, which is less than 0.2% of the total RTG power output. Furthermore, it was<br />
assessed that rivet failure resulting in an open circuit was not credible. This analysis<br />
concluded that pop rivet replacement was not required. Despite this conclusion, limited<br />
rivet replacement was performed as a conservative measure. The principal motivation for<br />
4-25
Final Technical Report<br />
GPHS-RTGs for the Cassini Mission<br />
Lockheed Martin <strong>Document</strong> No. RR18<br />
August 1998<br />
replacing rivets was the concern that rivet joint resistances would increase during RTG<br />
vibration testing. Replacement was a precautionary measure to prevent future test data<br />
interpretation problems. A total of 64 pop rivets were replaced in the E-6 thermopile.<br />
Replacement work was halted when testing work on rivet joint samples provided an<br />
understanding of the problem's cause and demonstrated that high resistance joints were<br />
returned to acceptably low resistance values after being subjected to ETG/RTG thermalvacuum<br />
(and inert) processing environments. Testing showed the increase of rivet joint<br />
resistance to be related to a connecting strap surface oxidation (chemical) process which<br />
was reversed by thermal vacuum processing. These test results eliminated the concerns of<br />
rivet joint resistance variation during vibration testing since the structural (mechanical)<br />
integrity of the high resistance rivet joints was determined to be sound.<br />
A development task was completed which demonstrated that a modified MS20615-4CU3<br />
solid copper rivet could be successfully used in place of pop rivets to connect the electrical<br />
straps within the GPHS-RTG thermopile assembly. All the tooling and processes needed to<br />
install and remove solid rivets were developed and functionally tested. Fabrication of<br />
representative samples showed that solid rivets produce joints with the desired low and<br />
stable resistance characteristics. Supporting analysis showed that the weight increase of<br />
modified solid rivets in comparison to pop rivets was insignificant. Despite the successful<br />
development and demonstration results, the implementation of solid rivets into the<br />
thermopile design for the Cassini program (units E-7 and subs) was deemed unnecessary.<br />
Concurrent improvement work completed on pop rivets has resulted in achieving<br />
acceptable electrical performance from this fastener. As a consequence, solid rivets were<br />
not needed as an option.<br />
4.1.2.4 Outer Shell<br />
The outer shell assembly consists of a flanged cylinder with 8 radial fins and four midspan<br />
bosses. Rows of holes on both sides of each fin are used to mount the unicouples and hot<br />
frame supports. Other components such as the electrical power connector, four Resistance<br />
Temperature Devices (RTDs), Gas Management System (GMS), and Pressure Relief<br />
Device (PRD) are mounted to the shell and sealed by the use of C-seals. Likewise the end<br />
4-26
Final Technical Report<br />
GPHS-RTGs for the Cassini Mission<br />
Lockheed Martin <strong>Document</strong> No. RR18<br />
August 1998<br />
flanges and midspan bosses also provide for c-sealing surfaces. The inboard flange has<br />
four barrel nuts mounted at the four main load carrying ribs. These are used to mount the<br />
GPHS-RTG to the spacecraft. For a list of components, see Table 4.1.2-5.<br />
Table 4.1.2-5. Components of the Outer Shell<br />
(Reference LMMS Drawing 47J305033)<br />
Reference Drawing<br />
Number<br />
47D305095<br />
47D305293<br />
47C305292<br />
47E305744<br />
47B305963<br />
47C305934<br />
Part<br />
Nomenclature<br />
Electrical Receptacle Assembly<br />
Gas Management Assembly<br />
Bracket, GMS<br />
RTD Installation<br />
Washer - Connector<br />
23003754 Adapter Plate<br />
47B305935<br />
47J306130<br />
47D305036<br />
47D305302<br />
47C302638<br />
Mounting Plate Assembly - PRD<br />
Vent Chamber<br />
Shell and Fin Assembly<br />
Dome Inboard<br />
Dome Outboard<br />
C-seals<br />
23003764 PRD Assembly<br />
23009127 Bracket, RTD<br />
4.1.2.4.1 Heritage from MHW<br />
Many design features of the outer shell such as the unicouple mounting, fin/ribs, electrical<br />
power connector, RTDs, PRD, GMS, end domes and C-seals are the same as, or similar to,<br />
the features on the MHW converter. The unicouple mounting is the same as the GPHS-<br />
RTG. The short radial fin/ribs on MHW are integrally machined with the shell. The fin/ribs<br />
for GPHS and Cassini extend 4.0 inches beyond the shell and consist of short stubby radial<br />
ribs integrally machined into the shell, with 3.50 inch radial fins electron beam welded to the<br />
ribs. The mounting of the electrical power connector on Cassini is identical to that for GPHS<br />
and MHW. The connector is a 5 pin for Cassini and GPHS, two positive, two negative and a<br />
ground termination, whereas MHW had only 4 pins, two positive and two negative<br />
terminations. The RTDs are similar to the ones used on GPHS. There arre four RTD<br />
sensors on GPHS and Cassini and only three on MHW. The GMS for Cassini and GPHS is<br />
4-27
Final Technical Report<br />
GPHS-RTGs for the Cassini Mission<br />
Lockheed Martin <strong>Document</strong> No. RR18<br />
August 1998<br />
the same as MHW except that the valve is mounted on standoffs on the cylindrical shell. On<br />
MHW the valve was mounted on the fin/rib. End domes with the exception of being smaller<br />
in diameter and aluminum, function the same as those of MHW. C-seals are clamped<br />
between the flanges of the domes and the flanges of the shell with the aid of screws passing<br />
through holes in the dome flanges and engaging helicoil inserts housed in the shell flange.<br />
Because the GPHS is designed to be mounted to the spacecraft by the inboard end, the<br />
dome screws in the inboard dome flange are countersunk to provide a flush mounting<br />
surface. Screws in the outboard dome flange are hex head, similar to those used in both<br />
dome flanges on the MHW-RTG. The PRD mounting is similar to the MHW-RTG. See<br />
Section 4.2.1 for details.<br />
4.1.2.4.2 Design Features And Rationale<br />
The outer shell is made from a 2219-T6 aluminum alloy forging and is approximately 8.50<br />
inches in diameter and 42.50 inches long. Because no forging existed to accommodate<br />
these dimensions, a specially forged 8 foot long billet was manufactured by Weber. The<br />
billet was then cut in two, the outside machined to 12.0 inch diameter and the inside was<br />
cored to 4.0 inch diameter. This 48.0 inch long cylinder with a 4.0 inch thick wall was then<br />
heat treated to a T6 condition and quenched in a glycol/water bath to minimize the residual<br />
thermal stresses. After heat treatment of the cylinders, a simple sawcut test was performed<br />
to verify the absence of any residual stresses. If the sawcut opened or closed, there were<br />
residual stresses that must be relieved. Upon completion of a satisfactory sawcut test, a 4.0<br />
inch long, ring-shaped prolongation was removed from one end of one forging in each lot.<br />
Specimens were taken from the ring section in an axial, tangential and radial direction and<br />
tested to verify the mechanical properties were compatible with the values listed in Table<br />
4.1.2-6.<br />
Direction<br />
Table 4.1.2-6. Mechanical Properties<br />
Tensile Strength,<br />
Minimum, PSI<br />
Yield Strength at 0.2<br />
Percent Offset,<br />
Minimum PSI<br />
Axial 54,000 36,000<br />
Tangential 55,000 37,000<br />
Radial 52,000 35,000<br />
4-28
Final Technical Report<br />
GPHS-RTGs for the Cassini Mission<br />
Lockheed Martin <strong>Document</strong> No. RR18<br />
August 1998<br />
The forgings were sent to Speedring to be numerically machined in incremental steps to<br />
obtain the thin walled, ribbed cylinder approximately 8.50 inches diameter and 42.50 inches<br />
long with inboard and outboard flanges and a midspan ring. The eight radial ribs,<br />
approximately 0.50 inches high and 0.055 inches thick, run the full length of the converter<br />
shell except when interrupted by the midspan ring and four midspan bosses equally spaced<br />
around the circumference, and located on the four main load bearing ribs at the midspan<br />
ring. Each boss is provided with an internal C-seal groove at its entrance. A large threaded<br />
helicoil insert is installed in each of the four bosses. Each rib was paralleled on both sides<br />
by a row of 36 holes. These holes are adjacent to the fins and are used to mount the<br />
unicouples. Four of these holes are used for the inner moly frame supports. There are<br />
three other through holes in the converter shell. At the inboard end are holes for the<br />
electrical power connector and the GMS. At the outboard end there is a hole for the PRD.<br />
The spacecraft mounting holes in the inboard flange consist of a 0.386 inch diameter master<br />
hole, a 0.386 inch wide radial slot 180° opposed to the master hole, and two 0.410 inch<br />
diameter holes, 180° opposed to each other and each 90° from the master hole. Silver<br />
plated barrel nuts with stainless steel retainers are nested in the main load carrying ribs, in<br />
line with, and just outboard, of the four spacecraft mounting holes. These mounting holes<br />
and barrel nuts are all outside the sealed converter cavity. There are also two sets of two<br />
approximately 3/8 inch diameter mounting holes, spaced 180° apart on the X axis in the<br />
mid-ring, which could be used for spacecraft mounting. The inboard flange also had 20<br />
#8-32 helicoil inserts interspaced with the mounting holes and a large internal C-seal<br />
groove. Twenty countersunk screws are used to clamp and seal the dome with the aid of<br />
the C-seal. The countersunk screws provide a flush surface for spacecraft mounting. The<br />
outboard dome is mounted and sealed in a similar manner, but with a bolt circle of 24 hex<br />
head screws and washers.<br />
4.1.2.4.3 Radiation Fins<br />
The fins are machined from aluminum 2219-T87 plates. These fins were approximately<br />
18.0 inches long and 3.50 inches wide. The 18.0 inch length is divided into five sections by<br />
3.0 inch long relief slots cut across the 3.50 inch width from the fin tip. At the base of each<br />
4-29
Final Technical Report<br />
GPHS-RTGs for the Cassini Mission<br />
Lockheed Martin <strong>Document</strong> No. RR18<br />
August 1998<br />
slot is a 0.25 inch diameter hole. A 0.19 inch diameter flow passage with a 0.055 inch weld<br />
prep runs continuously along the entire length of one edge, with side ports at each end.<br />
The thickness of the fin tapers across the width from 0.055 at the flow passage to 0.015 at<br />
the tip.<br />
The flow passages are gun bored through the 18.0 inch long fin. In order to accomplish this,<br />
the vendor required a precisely machined plate 0.472 x 5.000 x 22.00 long with sides flat<br />
and parallel within 0.002 inches and all sides free of scratches and gouges. After gun<br />
boring, the plate is machined to provide the thin wall flow passage and tapered fins. The<br />
converter shell has a built-in active cooling system (ACS) which consists of an inlet/outlet<br />
manifold, flow passages at the base of each fin, and 0.25 inch diameter aluminum 6061-T6<br />
tubing. Coolant fluid could be pumped through the manifold, externally mounted at the<br />
outboard end of the shell. From the manifold, the coolant splits into two serpentine flow<br />
paths through the fins in circumferentially opposite directions. The 0.25 inch diameter<br />
tubing joins the manifold to the fins and fins to each other via their side end ports. The two<br />
flow paths join at the -Y axis at the outboard end, where it is transported back to the<br />
manifold through a 0.375 inch diameter tube. Special fixtures, as listed in Table 4.1.2-7, are<br />
manufactured to protect, handle, weld, ship, and store the shell and fin/tube welded<br />
assembly, used to assemble and align the fins, tubes and manifold, ready for attachment to<br />
the shell. Tubes are welded to the fin side ports and the manifold. The tube-to-tube<br />
connections are only mated at this stage of the assembly. Each of the eight fins and tube<br />
assemblies are individually removed from this fixture and placed in the individual fin/tube<br />
support fixtures to provide access to the free tube ends for proof pressure testing with water<br />
at 800 psi. When all eight fin/tube assemblies have been successfully tested and<br />
reassembled to the weld assembly fixture, it is placed in the double walled wooden box.<br />
The shell is placed in the shell/fin assembly storage/shipment can and both items are<br />
shipped to the Ebtech Company for e-beam welding. The individual fin/tube assemblies are<br />
once again disassembled from the fixture and one-by-one reinstalled and e-beam welded.<br />
During the e-beam welding of the GPHS unit, the free edges of the fins warped because not<br />
enough heat sink material was provided.
Table 4.1.2-7. Shell and Fin Assembly Fixtures<br />
Final Technical Report<br />
GPHS-RTGs for the Cassini Mission<br />
Lockheed Martin <strong>Document</strong> No. RR18<br />
August 1998<br />
Item<br />
Individual fin/tube support fixture<br />
Fin/tube weld assembly fixture<br />
Shell and fin assembly storage and shipment can<br />
Rotational handling fixture<br />
Mounting plate and handling sling<br />
Double walled wooden base<br />
Uses<br />
Pressure test individual fin/tube assemblies.<br />
Weld tubes to fins.<br />
Align fins and tubing for attachment to shell.<br />
Shipment.<br />
Storage and shipment of shell and shell and fin<br />
assembly.<br />
Radiographic inspection of E-Beam welds.<br />
Final tube/tube welds.<br />
Final proof pressure test of ACS.<br />
Clean ACS lines.<br />
Mask for painting.<br />
Paint.<br />
Airbake cure of paint.<br />
100 hour vacuum bake-out.<br />
Etch exterior of shelVfin assembly.<br />
Shipment of fin/tube weld assembly fixture.<br />
For the first Cassini units, copper heat sinks are attached to the shell and the fins. To protect<br />
the shell/fin assembly from the weld gun, copper shields are provided at the beginning for<br />
start-up and at the end for run-off. Back-up copper shields are also used behind the<br />
material being welded, in case of blow-through. The shell/fin assembly is mounted on the<br />
rotational handling fixture and the e-beam welds were inspected radiographically for<br />
defects. After passing inspection the units were placed in the shell/fin assembly<br />
storage/shipment can and the weld fixture was packed in the double walled wooden box<br />
and returned to Lockheed Martin. The units are again mounted on the rotational handling<br />
fixture, the final tube to tube welds are made and the ACS is proof pressure tested with<br />
water at 800 psi. The ACS lines are cleaned with water, blown dry and back filled with<br />
argon. The manifold is sealed with a GSE cover and gasket. The unit is removed from the<br />
rotational handling fixture and, with the aid of the handling sling, the shell is acid etched.<br />
The unit is reinstalled on the rotational handling fixture and the flanges, sealing surface, and<br />
4-31
Final Technical Report<br />
GPHS-RTGs for the Cassini Mission<br />
Lockheed Martin <strong>Document</strong> No. RR18<br />
August 1998<br />
area for component mounting, etc. are masked for painting. The unit is painted with a<br />
silicone-base thermal control coating, PD-224, as specified in LMMS specification NS0060-<br />
05-25 and allowed to air dry at room temperature. Once again, the unit is removed from the<br />
rotational handling fixture, installed on the mounting plate, the ACS manifold cover is<br />
loosened and the unit transferred to the vacuum bakeout chamber where it is baked out in<br />
vacuum at 485°F for 100 hours. The unit is packaged in mylar or aluminized mylar film,<br />
mounted in the shell and fin assembly storage and shipment can, and is ready for<br />
component mounting.<br />
4.1.2.4.4 Emissivity Coatings<br />
The thermal control and material protective coatings used on the Cassini RTG external and<br />
internal surfaces were created to be stable for a period of 8.1 years at mission operating<br />
conditions after a storage life of 5.5 years, or 4.8 years operating life after 6 years of storage.<br />
These thermal control coatings were selected for their stability and durability. A new coating<br />
had to be developed for GPHS because the coating (Radifrax RC) used externally on the<br />
beryllium outer shell of MHW RTGs, was not compatible with the 2219-T6 aluminum<br />
material used for GPHS, because of the high temperature associated with the application of<br />
the coating. Emissivity tests were conducted on various coatings and the results are shown<br />
in Table 4.1.2-8, Part I. From these first tests, a GE silicone (B6A) gave the best emissivity<br />
measurements. However, hairline cracks were observed in the coating when aluminum<br />
plates were prepared for static charge tests. To correct the cracking problem, mica was<br />
added and this coating material became PD-113. Because of outgassing at operating<br />
temperatures and results from the electrostatic charging characterization, another 3%<br />
carbon was added to the PD-113. This coating became PD-224 and was the thermal<br />
control coating used externally on the GPHS-RTG. PD-113 and PD224 emissivity test<br />
results are shown in Table 4.1.2-8, Part II. PD-224 was also used on the internal dome<br />
surfaces. Tests conducted with the PD-224 coating showed that after initial outgassing that<br />
occurs during vacuum processing, outgassing continues, but at a greatly reduced rate with<br />
no measurable change in coating properties. The Qualification RTG, on life test at Mound
Table 4.1.2-8. Emissivity Tests<br />
Part I<br />
Final Technical Report<br />
GPHS-RTGs for the Cassini Mission<br />
Lockheed Martin <strong>Document</strong> No. RR18<br />
August 1998<br />
Coating<br />
Comments<br />
Pyromark 2500 .88 Commercial Product<br />
.87 (Silicone)<br />
(B6A) .92 1.5% Carbon<br />
GE .90<br />
Clear Silicone .80<br />
.79<br />
B6A Modified .80 Ceramic oxides instead<br />
.81 of Carbon Black<br />
Part II<br />
PD 113 .92 Mica Added<br />
.906 1.5% Carbon<br />
PD 224 .91 3% Carbon<br />
.90<br />
Laboratories from November 1984 through 1990, had accumulated approximately six years<br />
of operation with no abnormal change in the case temperature which indicates no<br />
degradation of the external coating. In addition, the coating samples used for the higher<br />
temperature excursion tests were in storage for four years and no degradation was<br />
detected. Therefore, no significant change in properties were expected in extrapolating the<br />
coating performance over the extended storage and mission duration. The thermal control<br />
coating (Radifrax RC) used on some GPHS internal components was a borosilicate-iron<br />
titanate, used externally on both SNAP-27 and MHW RTGs. The performance degradation<br />
observed on Voyager missions was such that it could be explained solely in terms of fuel<br />
decay and dopant precipitation, implying no significant degradation of emissive<br />
characteristics of the coating.<br />
4.1.2.4.5 Alternate Paint Formulation<br />
The silicone-based PD-224 paint used to achieve a high thermal emissivity on the exterior<br />
surfaces of the RTG outer shell and other parts was developed in 1980, using resins<br />
commonly available from General Electric at that time. To facilitate preparation of the paint,<br />
alternate sources of silicone resins were sought during the Cassini RTG program. Using<br />
Dow 805 and Dow 1-2530 silicone resins in place of the General Electric materials, a batch<br />
4-33
Final Technical Report<br />
GPHS-RTGs for the Cassini Mission<br />
Lockheed Martin <strong>Document</strong> No. RR18<br />
August 1998<br />
of PD-224 paint was prepared and the paint was applied to samples for the purpose of<br />
qualification testing. These tests included measurements of thickness, solar absorptance,<br />
total emittance, and adhesion, both as applied and after exposure to thermal vacuum<br />
conditions at a temperature of 300°C and for various durations up to 400 hours. These tests<br />
verified that paint prepared using alternate silicone resins meets all qualification<br />
requirements. In addition, tests were conducted to demonstrate the shelf life of the prepared<br />
paint, after storage at room temperature for periods of six months and twelve months. All the<br />
tests were successful. For use on future programs, the specifications for PD-224 paint will<br />
be modified to permit the use of alternate silicone resins procured from Dow, and to permit a<br />
shelf life of twelve months for the mixed paint before being applied.<br />
Table 4.1.2-9 summarizes the data from Engineering Tests (ETs) used to qualify alternate<br />
resins for the PD-224 paint. Preparation of the paint, except for the use of alternate silicone<br />
resins, was performed in accordance with specification NS0060-05-25, Revision G,<br />
"Material Specification, Coating, Silicone, High Temperature, PD-224." All test samples<br />
were prepared by painting in accordance with specification NS0060-05-24, Revision J,<br />
"Process Specification for the Application of a High Emissivity, High Temperature Silicone<br />
Coating."<br />
Table 4.1.2-9. Summary of Paint Qualification Engineering Tests (ETs)<br />
ET No. Date Title<br />
5229 11/21/96 Preparation of PD-224 Paint Using Alternate Silicone Resins<br />
5233 2/14/97 Absorptance and Emittance of Alternate PD-224 Paint after<br />
Vacuum Treatment at 300°C<br />
5234 2/14/97 Preparation of PD-224 Paint Samples for Qualification Testing<br />
5236 6/25/97 Six Month Shelf Life Test for PD-224 Paint (July 1997)<br />
5237 6/25/97 Twelve Month Shelf Life Test of PD-224 Paint (January 1998)<br />
Table 4.1.2-10 provides a summary of the sample test results to qualify the alternate paint<br />
formulation. In all cases, the measured solar absorptance and total emittance exceeded<br />
minimum specification requirements.<br />
4-34
Table 4.1.2-10. Summary of Qualification Test Results<br />
As<br />
Applied<br />
After Vacuum<br />
at 300°C *<br />
Final Technical Report<br />
GPHS-RTGs for the Cassini Mission<br />
Lockheed Martin <strong>Document</strong> No. RR18<br />
August 1998<br />
After Six<br />
Month Storage<br />
After Twelve<br />
Month Storage<br />
Thickness (mils) 1.6 (Passed) Not measured 2.0 (Passed) 1.0 (Passed)<br />
Surface Finish Passed Passed Passed Passed<br />
Absorptance<br />
Requirement<br />
Test Samples<br />
Emittance<br />
Requirement<br />
Test Samples<br />
0.94 min<br />
0.95, 0.95, 0.95<br />
0.88 min<br />
0.94, 0.94, 0.94<br />
0.94 min<br />
0.96, 0.96, 0.96<br />
0.88 min<br />
0.93, 0.93, 0.93<br />
0.94 min<br />
0.96, 0.96, 0.96<br />
0.88 min<br />
0.94, 0.94, 0.94<br />
0.94 min<br />
0.995<br />
0.88 min<br />
0.915, 0.914<br />
Adhesion Passed Passed Passed Passed<br />
* Samples removed after 100 hours, 200 hours, and 400 hours exposure<br />
4.2 NEW DESIGN ELEMENTS<br />
Almost all of the GPHS-RTG design configurations used on the Cassini program are of<br />
heritage design, however, there are two exceptions. New designs were incorporated for the<br />
Pressure Relief Device (PRD) and for the RTD Cable Assembly. These new designs and<br />
their related development activities are described in the following paragraphs.<br />
4.2.1 PRD<br />
The PRD is a pressure relief device to vent the internal pressure of the converter. It attaches<br />
to a mounting plate bolted to the access boss on the converter shell with the use of an<br />
adapter plate. The PRD has two primary functions:<br />
1. Maintain a seal, isolating the internal RTG from the air environment during<br />
all ground testing, handling, and launch pad operations.<br />
2. Vent the RTG to space during the ascent period of launch, and provide an<br />
orifice large enough to maintain the converter internal pressure below a<br />
desired value during space operations.<br />
The PRD assembly, as shown in Figure 4.2.1-1, consists of a housing, lance, adapter plate,<br />
and pressure activated bellows. The bellows is a heritage design from the MHW program<br />
PRD and has the same three springs as the GPHS-RTG program PRD. Similarly, the lance
Final Technical Report<br />
GPHS-RTGs for the Cassini Mission<br />
Lockheed Martin <strong>Document</strong> No. RR18<br />
August 1998<br />
BELLOWS<br />
ASSEMBLY<br />
HOUSING<br />
ASSEMBLY<br />
CENTER LINE<br />
OF SAFETY PIN<br />
CONVERTER<br />
SHELL<br />
ADAPTER<br />
PLATE<br />
EXISTING<br />
MOUNTING<br />
PLATE<br />
OUTBOARD<br />
DOME<br />
C-SEAL<br />
Figure 4.2.1-1. Cassini PRD Installation<br />
Table 4.2.1-1. Components of the PRD (Reference Drawing 23003764)<br />
Part Nomenclature Reference Drawing # Design History<br />
PRD Housing Assembly 23003743 New Design<br />
Bellows 47D303452 Heritage-MHW-RTG<br />
Lance 47B305800 Heritage-GPHS-RTG<br />
Safety Pin 47B305775 Heritage-GPHS-RTG<br />
Quick Release Safety Pin MS17986C338 Military Standard<br />
Adapter Plate 23003754 New Design<br />
Protective Cover Assembly 23003740 New Design<br />
Mounting Plate Assembly 47C305934 Heritage-GPHS-RTG<br />
Vent Chamber Assembly 47B305935 Heritage-GPHS-RTG<br />
At atmospheric pressure, the evacuated bellows is compressed against one of its internal<br />
spring guides. During launch the bellows expands, forcing the lance through the<br />
diaphragm of the vent chamber assembly. This action creates a hole which vents the gas<br />
inside the PRD to space. A nut and bolt is used to prevent an inadvertent puncture during<br />
transport and ground handling operations. A standard safety pin with a quick release<br />
mechanism is used on the PRD during activities just prior to launch.<br />
4-36
Final Technical Report<br />
GPHS-RTGs for the Cassini Mission<br />
Lockheed Martin <strong>Document</strong> No. RR18<br />
August 1998<br />
At atmospheric pressure, the evacuated bellows is compressed against one of its internal<br />
spring guides. During launch the bellows expands, forcing the lance through the<br />
diaphragm of the vent chamber assembly. This action creates a hole which vents the gas<br />
inside the PRD to space. A nut and bolt is used to prevent an inadvertent puncture during<br />
transport and ground handling operations. A standard safety pin with a quick release<br />
mechanism is used on the PRD during activities just prior to launch.<br />
4.2.1.1 PRD New Design Overview<br />
Several design improvements were made for the Cassini PRD as a result of experiences<br />
with previous RTG programs. Two view ports were added to the housing to allow<br />
verification of a gap between the safety pin and the bellows. The housing design included a<br />
tapped hole for mounting an accelerometer during dynamic testing. A hard, corrosionresistant<br />
coating is applied to the inside surface of the housing to prevent galling by the<br />
bellows during operation.<br />
The housing assembly uses captured titanium screws having solid film lubricant. The<br />
screws also have large fillet radii specified. This approach ensured that none of the PRD<br />
installation problems that occurred during the GPHS program (broken screw with Ulysses<br />
mission, extra washers with Galileo mission) would occur with Cassini.<br />
The use of an adapter plate allows the PRD to be mounted to the GPHS mounting plate<br />
(reference Drawing 47C305934). This is an important consideration since a redesign of the<br />
mounting plate would have affected F-2 and F-5 RTGs and would have required refueling of<br />
F-5. The adapter plate uses different sets of holes to attach the storage cover assembly<br />
than those that are used to attach the PRD assembly. This eliminates PRD installation<br />
problems associated with the repeated use of inserts when the protective cover is installed<br />
and removed.<br />
The quick release safety pin minimizes the radiation exposure of technicians preparing the<br />
RTG for launch. Its large handle makes visual verification of its removal prior to launch<br />
easier.
4.2.1.2 PRD Reliability Testing<br />
Final Technical Report<br />
GPHS-RTGs for the Cassini Mission<br />
Lockheed Martin <strong>Document</strong> No. RR18<br />
August 1998<br />
The reliability of the PRD in venting the RTG internal pressure was established by the use of<br />
heritage design components, taking advantage of the extensive database of testing and<br />
flight experience from the MHW and GPHS RTG programs. A reliability demonstration<br />
program was conducted for the bellows assembly during the MHW program. These tests<br />
resulted in 34 successful diaphragm punctures by the bellows and included subjecting the<br />
bellows assemblies to mission defined thermal and dynamic environments prior to, and<br />
during, operation. Further reliability demonstration tests were conducted of the force<br />
capability of the springs used in GPHS-RTG, the same springs used in the bellows<br />
assembly. These tests consisted of measuring the stroke force of a PRD assembly (without<br />
a lance) 50 times at operating temperature.<br />
Reliability analysis identified the quick release pin as a Category I Single Point Failure. No<br />
quantitative reliability goals for operations of the PRD were established. However, the<br />
likelihood of failure to remove the quick release pin is very low. Compensating provisions<br />
which prevent this event from occurring include: (1) the pin has a large handle and is<br />
visually obvious when it is in place, (2) written instructions for removal are provided in the<br />
pre-launch check list, (3) operators are trained in this procedure, and (4) supervision and<br />
QA verification are present during the operation of pin removal.<br />
For the Cassini program, several engineering tests were conducted to expand the<br />
understanding of the Cassini PRD. A bellows force characteristic test was conducted to<br />
measure the available force provided by the bellows. A corresponding lance-diaphragm<br />
test was conducted to measure the force required by the lance to penetrate the diaphragm.<br />
Finally, a series of tests were conducted to assess the capabilities of several candidate<br />
coatings for the inside surface of the PRD housing. The conclusion of these tests shows a<br />
large margin exists (at least a factor of +1.18) between the force available to puncture and<br />
the force needed to puncture the diaphragm. A description of these tests follows.<br />
Bellows Force Characteristic Test<br />
Force tests were performed on the engineering bellows, S/N 38. The purpose of the tests<br />
was to characterize the bellow's available force at different displacements and external<br />
pressures at both room temperature and operating temperature (180°C). Tests were<br />
4-38
Final Technical Report<br />
GPHS-RTGs for the Cassini Mission<br />
Lockheed Martin <strong>Document</strong> No. RR18<br />
August 1998<br />
conducted with displacements between 0.001 and 0.540 inches and with pressures<br />
between 0.1 and 13+ psia. An adapter assembly was screwed into the bellows in lieu of the<br />
lance. The bellows was enclosed in an insulated furnace from which the adapter assembly<br />
protrudes. The entire fixture, including the load cell, was placed in a vacuum chamber. A<br />
temperature controller connected to one of the heaters maintained the bellows' temperature<br />
during the elevated temperature tests. The other heater was controlled by a Variac. Figure<br />
4.2.1-2 shows a schematic of the entire test setup.<br />
vacuum chamber<br />
roughing<br />
pump valve<br />
connecting<br />
bolt<br />
furnace<br />
load cell<br />
N<br />
attachment<br />
assembly<br />
innomzelpi<br />
L<br />
pressure gauge<br />
Watlow heater<br />
Control power<br />
-I I supply<br />
T/C readouts<br />
variable<br />
auto — transformer<br />
for 2nd heater<br />
load cell wire<br />
thermocouple wire<br />
heater wire<br />
load cell<br />
instrumentation<br />
Figure 4.2.1-2. PRD Bellows Force Characteristic Test Schematic<br />
Figure 4.2.1-3 shows the force generated by the bellows for the room temperature tests.<br />
Also shown for comparison are the results of the lance-diaphragm tests. Similarly, Figure<br />
4.2.1-4 shows the force generated by the bellows for the operating temperature tests. In<br />
both figures it can be seen that sufficient force is generated by the bellows once it gets down<br />
to an external pressure of 4 psia. These plots provide an indication of the margin that is<br />
available for puncture along the entire stroke of the bellows.
Final Technical Report<br />
GPHS-RTGs for the Cassini Mission<br />
Lockheed Martin <strong>Document</strong> No. RR18<br />
August 1998<br />
70<br />
60<br />
I<br />
x---x--4(<br />
Lance/Diaphragm Puncture Data<br />
Eng Bellow's Available Force (Room Temperature)<br />
• Bellows - Free Travel Positions<br />
Lance/Vent Chamber Assy Puncture Data<br />
N N<br />
N<br />
50- N N N<br />
psia curve<br />
O<br />
a.,<br />
0<br />
7u4<br />
CO<br />
454<br />
N<br />
N<br />
. .<br />
. 'X, . .<br />
2.4 psia curve N<br />
40-,<br />
. - ,,x„<br />
N N<br />
'')C.,, '`/...<br />
N<br />
.<br />
.<br />
35 .<br />
N 12.1 psia 11.0 psia 10.4 psia 9.8 psia 9.2 psia - 8.7 psia 8.3 psia 7.7 psia<br />
4 4 4 1 1<br />
D \ ‘,-.<br />
.'t(.,<br />
30-le., 12.8 psia'''' - )c. 11.7 psia ' ...<br />
. ...<br />
N<br />
N<br />
'x.„4.9 psia curve<br />
.-. .....„.., `iG .<br />
25-1 X<br />
'` „5.9 psia curve .x..<br />
,c. . . .<br />
ma . x\\ .<br />
,.<br />
.<br />
"x, s6.8 p ia curve .<br />
...<br />
-.<br />
,..<br />
20- '")4, . ')e., .x.,<br />
4. N '-,8 7. psia c-iirv-"e .x.,,.. N<br />
. . .<br />
.<br />
')C<br />
.<br />
. "x...<br />
. . .<br />
15 4<br />
o....-----<br />
''',... s8.8 p ia curve .„ .<br />
-..<br />
_......--<br />
,.<br />
65-<br />
55-<br />
. --,-<br />
IC '‘‘<br />
"A.98 psia curve '''r•-. (
▪<br />
Final Technical Report<br />
GPHS-RTGs for the Cassini Mission<br />
Lockheed Martin <strong>Document</strong> No. RR18<br />
August 1998<br />
70<br />
65-<br />
60<br />
▪<br />
N<br />
N<br />
.<br />
x<br />
I 1 Lance/Diaphragm Puncture Data<br />
Eng Bellow's Available Force (Operating Temperature)<br />
—I- Lance/Vent Chamber Assy Puncture Data<br />
• Bellows - Free Travel Positions<br />
N<br />
N<br />
55<br />
N N<br />
x,.<br />
\<br />
X \<br />
\ \ \<br />
0<br />
X ..9 psia curve<br />
'Cl 60-. ')C,,<br />
C N<br />
.<br />
= N N<br />
0 . X<br />
fl■ NY.. \<br />
N N<br />
= 45-1<br />
''• ,.2.4 psia curve<br />
13.15 psia<br />
`x,<br />
.<br />
N<br />
8 40 -, N.<br />
4o 'XN N<br />
.51)<br />
12.1 psia 11.3 psia 10.7 psia '10.0 psia<br />
w 4 ."--;., o o<br />
\ . \ '''' \<br />
0 35, \ 1L.J psia N. N ..<br />
.<br />
8 5 psia<br />
'- ,,9.4 psia 8.9 psia -x C ,,1<br />
-..,0 4<br />
x.<br />
.<br />
.<br />
73 X,.9 .4 psia p curve<br />
'x,<br />
k...<br />
.<br />
30-1<br />
'X<br />
N `/.,<br />
N<br />
8.0 psia<br />
N .i9psia curve . N. .<br />
N<br />
Nx,<br />
251 N,, N .I.8 psia curve-x, N<br />
^. N .<br />
. )c, . x..<br />
'x, ..<br />
. \\<br />
.<br />
. 8 psia curve' ..„,„<br />
Y.. x<br />
20 -1 N<br />
N N<br />
N<br />
N.<br />
N<br />
N<br />
N NX, N )‘.<br />
X<br />
N N N N<br />
K. x- 8 8 psia curve<br />
.<br />
. 'x,<br />
-1 . . x,<br />
.<br />
15 . N<br />
. .<br />
./--->"--<br />
X .9 .8 psia curvec.<br />
\<br />
-)t, ,.. \<br />
▪ \<br />
\<br />
10- \ \ x<br />
'X k0.8 psia curie<br />
N<br />
X<br />
5_ it, ` ,11.8 psia curve, .<br />
‘x,,,.<br />
0<br />
x<br />
'ot,<br />
------------ ,.--
Final Technical Report<br />
GPHS-RTGs for the Cassini Mission<br />
Lockheed Martin <strong>Document</strong> No. RR18<br />
August 1998<br />
Lance-Diaphragm Puncture Tests<br />
Five flanged diaphragms from lot CC11337 were punctured during these tests. Four vent<br />
chamber assemblies (VCA) were punctured (including three during lot acceptance testing).<br />
Both setups used a Tinius Olsen 10000 machine. The purpose of this test was to determine<br />
the force required to puncture and penetrate fully two different diaphragm mounting<br />
configurations(welded and clamped) as well as to measure the size of the holes in order to<br />
verify VCA conductance compared with specification requirements.<br />
For all tests but one, the Tinius Olsen traveled at a constant rate of 0.02 inches/minute while<br />
the lance punctured. In the case of diaphragm S/N 2, the speed of puncture was increased<br />
to 14.4 inches/minute to demonstrate that the puncture force did not differ significantly with<br />
speed. Three different lances were used for the test. Two lances were from PO<br />
HHMC70293, one considered prime and one designated "engineering use only." The other<br />
lance was a residual lance from the GPHS-RTG program.<br />
Table 4.2.1-2 lists the peak forces reached during the tests as well as the puncture travel<br />
and area. The puncture travel is the distance the lance moved from first contact with the<br />
diaphragm until the force returns to zero after puncture is complete. All of the puncture<br />
areas were calculated by taking the area of the triangle defined by the three corners of the<br />
puncture hole for each diaphragm/VCA and subtracting 0.003 in 2 which is the approximate<br />
area of the curls that remain after puncture. The average distance between corners of the<br />
puncture holes created by the residual, engineering, and prime lances were 0.420, 0.421,<br />
and 0.437 inches, respectively.
Final Technical Report<br />
GPHS-RTGs for the Cassini Mission<br />
Lockheed Martin <strong>Document</strong> No. RR18<br />
August 1998<br />
Table 4.2.1-2. Lance-Diaphragm Puncture Test Results<br />
Peak<br />
Force<br />
Ibt<br />
Puncture<br />
Travel<br />
in<br />
Puncture<br />
Area<br />
in2<br />
Lance<br />
Used<br />
Diaphragm S/N 1 14.1 0.45 0.074 Engineering<br />
Diaphragm S/N 2 14.5 0.47 0.074 Engineering<br />
Diaphragm S/N 3 13.2 0.44 0.074 Engineering<br />
Diaphragm S/N 4 14.0 0.45 0.074 Engineering<br />
Diaphragm S/N 15 13.4 0.43 0.073 Residual<br />
VCA S/N 1 14.2 0.45 0.074 Engineering<br />
VCA S/N 4 16.7 0.41 0.080 Prime<br />
VCA S/N 5 16.3 0.41 0.080 Prime<br />
VCA S/N 11 16.9 0.41 0.081 Prime<br />
The larger puncture holes and higher forces for the three prime lance punctures correspond<br />
to the slightly larger head size of the prime lance. The test showed the significance head<br />
size has on required puncture force. The rate of travel of the lance, however, had little effect<br />
on the puncture force. The conductance of the hole created by the punctures is sufficient to<br />
allow proper venting of the RTG by reason of the following:<br />
The relative area of the diaphragm holes is the square of the ratio of the corner-tocorner<br />
distance of the puncture hole to MHWs:<br />
(0.419 inch/0.313 inches) 2 = 1.79<br />
The overall conductance is:<br />
1/F2 = 1/(2.7 x 2901) + 1/(1.79 x 3750)<br />
(penetration) (diaphragm hole)<br />
F2 = 3617 cc/sec which is 4.7 times greater than LES 8/9<br />
The differential pressure can be calculated from these results using LES 8/9 AP data:<br />
Delta P = 4.3E-5/4.7 = .915E-5 torr (which meets the PRD Product<br />
Specification criteria of
PRD Housing Coating Tests<br />
Final Technical Report<br />
GPHS-RTGs for the Cassini Mission<br />
Lockheed Martin <strong>Document</strong> No. RR18<br />
August 1998<br />
Tests were performed to aid in the selection of a coating for the inside of the PRD housing.<br />
The purpose of the coating is to prevent galling of the housing by the bellows. A wear test<br />
and a galling test were completed for the two candidate coatings, Nedox NH-1 and Nedox<br />
CR. Nedox NH-1 was selected due to its superior performance in the galling test and its<br />
ease of processing.<br />
The wear test was a modification of the procedure from ASTM Standard Test Method D<br />
2714. The machine was run at 72 rpm with the equivalent of 45 pounds of bearing force on<br />
test rings coated with the candidate coatings. The initial frictional force was recorded and<br />
when the frictional force reached 110% of the initial value the number of revolutions was<br />
recorded. Nedox CR took 4330 revolutions to reach 110% while Nedox NH-1 took 5710<br />
revolutions. This test gave an indication of how well the coating was bonded to the metal<br />
surface.<br />
The galling test simulated the worst case dynamic load of the bellows against the inner<br />
surface of the PRD housing. At a maximum of 70 g's, the bellows exerts an inertial force of<br />
40 pounds. For this test, up to 40 pounds was assumed to act through only one convolution<br />
of the bellows and to act as a constant force. Thus, the test has a simulated convolution<br />
bearing against a test plate while the Tinius Olsen machine pulls the test plate in a direction<br />
perpendicular to the simulated convolution and measures the force required to do so. One<br />
uncoated plate and three coated plates were tested.<br />
The results of the galling tests are shown in Table 4.2.1-3. The uncoated plate required<br />
significantly more force to move than the coated plates. Before the test, it was expected that<br />
the coated plates would lose their coating either before or upon reaching the 40-pound<br />
bearing load. On the contrary, two of the three coated test plates did not lose their coatings<br />
even at 40 pounds. Only the Nedox CR coating on a 63 rms plate lost its coating and then<br />
only at 40 pounds of bearing load. The overall conclusion of the test is that the coating
Final Technical Report<br />
GPHS-RTGs for the Cassini Mission<br />
Lockheed Martin <strong>Document</strong> No. RR18<br />
August 1998<br />
501<br />
45-1<br />
40-1<br />
35<br />
1<br />
SN#1 DIAPHRAGM<br />
SN#2 DIAPHRAGM-FAST<br />
SN#3 DIAPHRAGM<br />
SN#4 DIAPHRAGM<br />
SN#15 DIAPHRAGM-HEAT TREATED 3X<br />
SN#1 VENT CHAMBER-ENGINEERING<br />
SN#4 VENT CHAMBER<br />
SN#5 VENT CHAMBER<br />
SN#11 VENT CHAMBER<br />
FORCE OF 3 SPRINGS<br />
30-1<br />
FORCE OF 2 SPRINGS<br />
O a-<br />
w<br />
ct<br />
0<br />
25-<br />
20-1<br />
FORCE OF 1 SPRING<br />
BELLOWS 'C' DIMENSION, INCHES *<br />
Figure 4.2.1-5. Comparison of Bellows Spring Force Versus Measured<br />
Lance-Diaphragm Puncture Data<br />
4-45
Table 4.2.1-3. Coating Galling Test Results<br />
Final Technical Report<br />
GPHS-RTGs for the Cassini Mission<br />
Lockheed Martin <strong>Document</strong> No. RR18<br />
August 1998<br />
Bearing<br />
Load<br />
(lbf)<br />
Uncoated<br />
Al Alloy 2219<br />
Plate (125 rms)<br />
Nedox CR<br />
Coated Al Aly<br />
2219 Plate<br />
(125 rms)<br />
Nedox CR<br />
Coat Al Aly<br />
2219 Plate<br />
(63 rms)<br />
Nedox NH-1<br />
Coated Al Aly<br />
2219 Plate (63<br />
rms)<br />
Steel Bar<br />
(frictional force<br />
only)<br />
(lbf) (lbf) (lbf) (lbf) (lbf)<br />
5 4.9 2.4 2.5 1.9 .64<br />
10 7.5 3.2 3.2 3.3 .90<br />
20 16.2 7.0 6.8 7.2 1.63<br />
30 18.6 * 8.8 10.1 8.7 3.0<br />
40 23.3 * 11.1 16.7 * ** 10.2 3.8<br />
* These runs resulted in damaging the simulated convolution to the point of being unusable.<br />
** This is an average of two runs (15.6 and 17.8 lbf), both of which involved removal of coating.<br />
did provide significant resistance to galling and, that of the two candidates, Nedox NH-1<br />
was superior. This coating was, therefore, applied to the inside surface of the PRD<br />
housing.<br />
4.2.1.3 PRD Qualification Program<br />
The PRD qualification program was intended to demonstrate the suitability of the PRD<br />
design for the Cassini mission. This was done by a combination of inspections, analyses,<br />
and qualification tests. The qualification tests included a PRD assembly dynamic test<br />
followed by a PRD dynamic operational demonstration.<br />
PRD Qualification Dynamic Tests<br />
The qualification unit PRD was exposed to acceptance level dynamic testing at ambient<br />
pressure. This was followed by a force test on the qualification bellows to verify that no<br />
damage occurred during the vibration testing. Next, the PRD was exposed to qualification<br />
level vibration testing at operational temperature. Finally, the PRD was successfully<br />
demonstrated at operational temperature while exposed to the acceptance level random<br />
vibration testing in two axes.<br />
The test environments employed during the dynamic testing were derived from the<br />
responses measured at the outboard end of the Q1 RTG during qualification testing for the<br />
GPHS-RTG program. The notching to the Q1 data due to the response of the GPHS-RTG<br />
4-46
Final Technical Report<br />
GPHS-RTGs for the Cassini Mission<br />
Lockheed Martin <strong>Document</strong> No. RR18<br />
August 1998<br />
PRD design was removed from the input environments for the Cassini PRD. Notching to<br />
the environment required to limit the response of the Cassini PRD was determined during<br />
testing.<br />
Figure 4.2.1-6 shows a schematic of the test setup used for these tests. The PRD was<br />
instrumented with one accelerometer triax mounted on top of the PRD housing which<br />
measured the overall response of the PRD. Another triax of accelerometers was mounted<br />
to the base of the test fixture and was used to control the vibration environments. Figure<br />
4.2.1-7 shows the plot of the PRD dynamic operational demonstration test pressure versus<br />
time. The initial puncture of the diaphragm took place at a pressure of 11.5 psia which<br />
corresponds to an altitude of approximately 6700 feet.<br />
RESPONSE ACCELEROMETER (3X)<br />
PRD HOUSING<br />
Y<br />
PRD<br />
AXES<br />
X<br />
BELLOWS<br />
LANCE<br />
ADAPTER PLATE<br />
THERMAL<br />
INSULATION<br />
TEST FIXTURE MOUNTING PLATE<br />
DIAPHRAGM - CONTROL ACCELEROMETERS (3X)<br />
Figure 4.2.1-6. PRD Qualification Dynamic Test Schematic
Final Technical Report<br />
GPHS-RTGs for the Cassini Mission<br />
Lockheed Martin <strong>Document</strong> No. RR18<br />
August 1998<br />
F<br />
ArruN utroni MCsARi7 ., LTD. 9.8m KYOTO JAPAN CHART 251 2. 60<br />
TIMMANIIIIIIEW31111111111M111111•111=111111!MIMMEMIII<br />
EOM umwailimumMilimini WOMBS MEM MIN<br />
nommasommoillIMENIEN11•111 Sawa sammulwamomisioniammEs<br />
immasommemunimumessimina ammunammuseummusamommomanommommuissMenommi<br />
sommlennummumulThIlMina mum 11111=1111111MTIZIPAnZININKifie:_;r31•1111111111111111•111111101111•1111<br />
MNIMIIIMINIMINEIMIIMIIMMIN111111 MOE IIIIMENIZINIM/1614=11111b11AMMII1111111.1110011111MINIMIIII111111110<br />
•1111111•WINIIIIIIIIIIIIIMMEMPIWOMMIIMMIIIIIIIMMEIMMINE11111.1=1111driv<br />
11111111111•1•111MINIMOM: IIIMM11•1111112010‘..EINLIIIMINISMIMININIMMIIIMIIIIIIIMIIIIMEN<br />
MIIMIIIIMMERIMMEEMERM111111111111<br />
111111.1111•1111111•11111111111111181111111MMIIMMINIMMIIIIIIIMPOIIIIIIIMIERINIIII<br />
IIIIIMMIIIIMEIMMININIUMIIIIIMIIIIMIRMIEWIIIIIIMUM•1111111=1111111•11111111NOMMINUM110111112WEIWIMIli<br />
MIIIIIIIIIIMMIIMIIMMIIMMIUM1111111111111111111WRIMIIIIIIMMUMMINMEM11111111111=11 IMMO IIN■M11111111<br />
11111111=1111111111MIMMINMEMMICIMMIE111•11111MMIIIIIMISINIEMBIMIIIIMMEll<br />
MIZMININIIIIIIIMIMIIIMME111111111111111111111111111211111111111111MIMIIIIIMMEIMMI=11111211110111011•1111IMMIN<br />
1-4WOILIREWW11311111111111111511111111111101111111111•11111111111.11O • 1 -riremompossamaismulaws<br />
measnamMinsumminiffunintimm" isummismam A l 1 I La V r moo it ill 1. sflr■Mr9/11.11111<br />
1111111111.11111111MIN■WIIMIMIIMINIM11111111111111111111=1111■11IN II It a !41 I 1 1 111=1 6 a 'L 1M1111 L.. !III' /MN<br />
111111111111•111111.1111M1111111MMINIMIEWIMM.M.2111111=1111111•11....1.411LIVIL • .1 1 •I•i■IrlInirimagrmif -a<br />
tr<br />
• J. I MI MIMI<br />
IMMII•1111111111111•••••••1111111111=MITIIIMIIIIIIIIIIMMIMIMMINIMMIM1INI1IIIMM•11•111•111=11111111111MbillICAU<br />
11111•=11111111111:11117=M:=1111111-1.2AIMIEW1*A'AAMellIklEMEMEIIMIla<br />
•<br />
°S. 'I<br />
r.<br />
0<br />
yKdsc Litz<br />
FLOW 1/-FA/7 r 14A.MHPIK<br />
L<br />
immarxwausaminnzumewirmergazism<br />
IME<br />
0<br />
' I '<br />
•<br />
11111111in!•111111111111.1111MillIUMMIIIIIIIIIMINMEMINIIIIIMMIIMIXII■MIIII■MIIIIMM■11111110■<br />
, 2. t vi<br />
111111111.111111111111111011.111111110111111M.<br />
ME1IIIIIIIIIIIIIIIIIIIIIIIIIIII1U1IIIMIIIHM111111111•1111M IL 1111111•111111.111111111EME<br />
M1111•111111111•111111111=1111=111111MEN1111111111111111•MMIIIHEMOIM<br />
11111111111111111111111111111111•1111111MMINIMIENUMIIIIMEMMINNIIIIMIIM111•11111111111111111111111111111M<br />
11111111111WWWMIIIIIMM111111111111111111111111111111U1WEIM111111•11111MA<br />
111111111111••••1111111111111111111111•111E1111111111111111111111111M111111111.11111111MMIIMAILIIIIIIIIENIMMIMI<br />
1111111101111111111111111111111111MMUMMINIIIIII111111111MIMMINIIIIIIMMIIIIIIIIM1MENINIMIMMIIIIIIIMMINUMMIMINUI<br />
MI1111111111•111111111111•M WEE NIIIIIIIMWINIMIMINIMINNIIIIIMINIIMMEIMPOW<br />
1111011MWEMEIRIMMEMENNWFMIMMIMINNIIIIRWEIIIIIIIIIMMISMINIMENIIIIIIMMINUIMMOIMMIWAWA<br />
NEEMEMMIMEIMMEN•aliUMEN11111=1111111111MIMMEIMOILIMMNIIMIN0INEN<br />
IIIIIIIIIIMBENUMMEMIIIIMIIMMIIIIIIIIIIIIIIIMI1111111111111111111111111111MIIM1IMMIMMIM11EMEINRIEN111IO1<br />
■11•1111111111111110MOIMIMII WIIMINIMMOMMINOM<br />
MMEMEIM MEIN<br />
1101wwOwemsll■1lwwnmh.m. w11111/11—Is u----- u. .uiw/www10<br />
WINIIIMEMM11111111111111111111MMIUMMEMENIIIIIIM11•1111111E<br />
11111111112111111MMINIMIIIIIIMMIIIIIIIMMIIIIIMMENUM11111110 311M11•111=111111.1►MINIIIIMIIMUIMMI■INIIMI<br />
1111111•1111MMISMIIIMIZO11011IIw1M1IIIIIMMI11111111110 4 11111111MIIIMMI1;AN•111111111111111111111101111=M1111<br />
1111111.111111M1111111W EIMIEMMINIM MIN MIIIIMEIELIN.71111•11111M11111111111.111111MUOM<br />
IIIIIMEMIIIIMUIMIUMIMMIN MIR IMMIEZMUIEMMIIIIIMINIIIIMMEMIIM•1111Z- -nunIMIII5FSMICIP§Entliftell<br />
risomminsummonermemasmormoommasont<br />
INEMIIIIMIUMEMEMOIMIUISIMIEM ---N,IN-ms■-■••■■•strzmursTromrrimartssumuiseremossmon<br />
011111111,1111011111tt IMMIMMINIIIIIIMII<br />
w1m11w1wnuwmw11sun IIIIMIIIIIIIMEIMMONIMEMEIMMINIMMI11111111111111111111MMIZI11111111111111111<br />
11111111•UNIMIIIMMIMIMMIIIIMEMIBMIIIIMMEINIMIUM11•111.111MIIMMIMIIIMIIIINIMMIMMINIMM111.1•111<br />
111111111.11MIMMINIMIMMEIMIN Mal IHIEJIMMENIIIIMIIIIIMINIMMEMIEMIIIIIIIMININIMMIThallalla<br />
IME11111111E10BIMMINIIIMINIZIOWNIMIIMENIMMIMIMINI01MIIIIIIMI1IIIIIIIMMIBM1111111•1111MNION•11111111111111<br />
V.<br />
Figure 4.2.1-7. PRD Operational Demonstration Pressure Versus Time<br />
4-48
PRD Bellows Qualification Force Test Failure<br />
Final Technical Report<br />
GPHS-RTGs for the Cassini Mission<br />
Lockheed Martin <strong>Document</strong> No. RR18<br />
August 1998<br />
During force testing of the qualification bellows, a failure occurred. This test was similar to<br />
an acceptance force test which measures the pressure at which the bellows first moved<br />
and the force available at 0.54 inch stroke and 0.1 psia, except that the qualification test<br />
was performed at an operating temperature of 180°C. The qualification bellows, S/N 37,<br />
began to expand at 13.8 psia at operating temperature. The specification requirement is<br />
that the bellows should not expand at an ambient pressure above 13.0 psia. Prior to this<br />
test, S/N 37 had passed the acceptance force test. Following the failure, all eight prime<br />
bellows underwent qualification force testing. Only one bellows, S/N 29, passed the test<br />
with an initial expansion of 12.95 psia. All nine bellows easily met the force requirement of<br />
the test. After analyzing the data from these tests, it was concluded that trapped gas was<br />
present inside the bellows. Although all nine bellows had passed leak tests, they were<br />
returned to Metal Bellows, Inc. and rewelded with tighter controls. At the same time, the<br />
requirements were changed to require operating temperature tests to be performed on all<br />
bellows. Following rework, all nine bellows passed room temperature and operating<br />
temperature acceptance force tests.<br />
4.2.1.4 PRD Acceptance Test Program<br />
Acceptance tests were conducted on each flight PRD in order to establish acceptability for<br />
flight use. The acceptance test program consisted of the following:<br />
a) Bellows Force Test. In this test, the force exerted by the bellows assembly was<br />
measured, both at room temperature (25°C) and at operating temperature. This test<br />
demonstrated that the bellows had adequate stroke length and force to puncture the<br />
diaphragm. Tests were conducted before and after dynamic testing in order to<br />
demonstrate that no damage occurred during dynamic tests.<br />
b) Diaphragm and Lance Vent Test. This destructive test was performed on three<br />
diaphragms taken from the same lot as the flight unit diaphragms, and one lance taken<br />
from the same lot as the flight unit lances. The force required to puncture the<br />
diaphragm was measured and compared with specification requirements.<br />
c) Seal Integrity Test. This test was a proof pressure and leakage test performed on<br />
each vent chamber assembly.<br />
d) Acceptance Dynamic Test. This test subjected the PRD to dynamic environments<br />
at the Flight Acceptance (FA) levels.
Final Technical Report<br />
GPHS-RTGs for the Cassini Mission<br />
Lockheed Martin <strong>Document</strong> No. RR18<br />
August 1998<br />
e) Bellows Seal Integrity Test. This leak test was performed prior to launch in order<br />
to confirm previous leak testing. Test methods included detection of both gross<br />
leakage and fine leaks, compared with specification requirements.<br />
4.2.1.5 PRD <strong>Document</strong>ation<br />
Additional information on the PRD can be found in the following documents:<br />
1. Fry, J., "PRD Dynamic Acceptance Test," Test Requirements <strong>Document</strong> No. 1310-<br />
0803-1, 22 March 1995.<br />
2. Kauffman, R. R., "Results of F-5 PRD Acceptance Level Vibration Testing," PIR 1VC2-<br />
Cassini-0093/7063, 9 May 1995.<br />
3. Kauffman, R. R., "Cassini Pressure Relief Device Transient and Random Vibration Test<br />
Environments," PIR 1RS1-C/C-0024/6937 Rev. B, 4 August 1993.<br />
4. Klee, P., "PRD Bellows Gross Leak Test Methodology," PIR 1VC2-Cassini-108, 31<br />
December 1995.<br />
5. Kauffman, R. R., "Results of Flight Spare PRD Acceptance Level Vibration Testing," PIR<br />
1VC2-Cassini-137/7107, 12 June 1996.<br />
6. Kauffman, R. R., R. D. Cockfield, "Qualification Report for the Cassini PRD," PIR 1RS1-<br />
Cassini-051/6997, 29 October 1993.<br />
7. Berger, E., "Product Specification for the Cassini Pressure Relief Device (PRD),"<br />
Specification PS23003753 Rev. C, 11 May 1993.<br />
8. "Bellows, PRD," Drawing 47D303452 Rev. F.<br />
9. Rickenbach, J., "Standing Instruction for Proof and Leak Testing of the GPHS Vent<br />
Chamber Assembly 47B305935," SI No. 249718, 20 July 1981.<br />
10. Klee, P., "PRD Engineering Tests - Lance/Diaphragm and Bellows Interaction," PIR<br />
1RS1-C/C-44/6971, 13 September 1993.<br />
11. Klee, P., "PRD - Requirement Change for Timing of Bellows Leak Testing," PIR 1VC2-<br />
Cassini-105/7079, 2 November 1995.<br />
12. Kauffman, R. R., "PRD Stress Calculations - Rough Notes Supporting Design Review,"<br />
PIR 1AF1-Cassini-0062/7030, 24 February 1994.<br />
4.2.2 Resistance Temperature Device (RTD) Assembly<br />
The Cassini RTDs are identical to the ones used on GPHS, including the sheaths being<br />
bent at 90° to enable the mounting of the sensors on the converter shell's forward<br />
intermediate ring. There are four RTD sensors mounted on the ring equally spaced
Final Technical Report<br />
GPHS-RTGs for the Cassini Mission<br />
Lockheed Martin <strong>Document</strong> No. RR18<br />
August 1998<br />
around the circumference. (See Figure 4.2.2-1.) During flight operations, the temperature<br />
of the case of the GPHS-RTG is monitored using only three of the four existing RTDs. The<br />
three used were selected by JPL.<br />
22.5°<br />
+Y AXIS<br />
6.92<br />
INBOARD DOME -\<br />
4.82 RAD<br />
RTD LOCATION _<br />
TYP 4 PLACES<br />
+X AXIS<br />
HEADER<br />
,<br />
----___<br />
,<br />
,<br />
' RTD CONNECTOR -----___,<br />
REF<br />
2.12 t<br />
MIDRING REF— "<br />
.505<br />
RTD/MIDR<br />
KG MISC 10<br />
10123192<br />
Figure 4.2.2-1. RTD Mounted on the Ring<br />
During ground operations, the temperature of the case of the GPHS-RTG was monitored<br />
using four resistance temperature devices. A ten-pin electrical connector provides the<br />
interface with test monitoring equipment or with a cable to the spacecraft. The temperature<br />
readings provided useful diagnostic information on the health of the RTG, but were not<br />
essential to proper operation of the RTG.<br />
The first indication that there might be a design deficiency with the sensor cable assembly<br />
came in 1984 when erratic readings were recorded between connector pins A and B,<br />
serving RTD No. 1 on RTG F-5. No anomalies were observed on any of the other flight units<br />
at that time. A Failure Review Board evaluated the impact of this on pre-launch and flight<br />
4-51
Final Technical Report<br />
GPHS-RTGs for the Cassini Mission<br />
Lockheed Martin <strong>Document</strong> No. RR18<br />
August 1998<br />
operations, assessed the risks of replacing the RTD cable, and determined that no repair or<br />
replacement should be attempted. The F-5 RTG was a flight spare for the Galileo and<br />
Ulysses missions and after 1990, remained in storage at Mound laboratory, where the RTD<br />
continued to operate without anomalies at approximately 438°C (165°C). However, when<br />
flight data became available from the Galileo mission, it was observed that temperature<br />
readings dropped out (indicating an open circuit condition) during extreme temperature<br />
excursions, occurring during Venus flybys. Before proceeding with the RTGs for the Cassini<br />
mission, it was decided to pinpoint the cause of erratic behavior on RTD No. 1 on RTG F-5.<br />
Radiography, confirmed by destructive disassembly of the RTD cable assembly, showed<br />
that the fault lay in the connection between the wire conductor from the RTDs and the<br />
connector pins. Figure 4.2.2-2 shows the details of the wire connections. These<br />
connections were made by brazing the copper wires to cups that were slipped over the end<br />
of the pins and spot welded, and then potting the end of the connector with RTV 566.<br />
Testing also demonstrated that additional strands within the wire could be broken when the<br />
assembly was raised to elevated temperatures. Although this type of connection had been<br />
used successfully on many previous RTGs, the manual braze operation depended on the<br />
skill of the operator to avoid raising the copper wire to an excessive temperature.<br />
Weakening or failure of a single strand in the multistrand wire could not easily be detected<br />
by visual or radiographic inspection. Examination of the failure point was performed using<br />
SEM/EDS (Scanning Electron Microscope/Energy Dispersive Spectroscopy) as well as<br />
optical microscopy techniques. The failure mechanism was determined to be tensile failure<br />
of the wire at the brazed connection due to forces imposed by thermal expansion of the<br />
potting compound. The wire at this point was weakened by excessive heating during the<br />
brazing operation, leading to excessive grain growth and possible intergranular diffusion of<br />
Ni, Cd, and Zn. The design solution was to eliminate the brazing process by using an<br />
alternate joining process. This was accomplished by selecting a connector type with<br />
removable pins with socket ends. This allowed the pin socket to be crimped to the wire<br />
before insertion into the connector and potting of the assembly, as shown in Figure 4.2.2-3.
Final Technical Report<br />
GPHS-RTGs for the Cassini Mission<br />
Lockheed Martin <strong>Document</strong> No. RR18<br />
August 1998<br />
JPL CONN.<br />
#4 SCREW, NUT & WASHER<br />
POTTING BOOT<br />
SPOT WELD BRAZE CUP TO PIN<br />
POT WITH RTV 566<br />
AT FINAL ASSEMBLY<br />
1.62<br />
BRAZE WIRE TO CUP<br />
Figure 4.2.2-2. Detail of RTD Cable Connection<br />
JPL CONN.<br />
.078<br />
1.42<br />
#6 SCREW, WASHER & NUT<br />
CRIMP WIRE IN CRIMP CUP<br />
PROTECTIVE SLEEVE (VARGLAS)<br />
VENT HOLE (TYP 3 PLACES)<br />
ZIZAVAVAI,J211r<br />
grvusimmiamm" Tote = stk..!4„t m<br />
dwatreviehm - wsismjam•■••••<br />
7 WaerMatet•A._._•,,<br />
r<br />
POT WITH RTV 566<br />
AT FINAL ASSEMBLY<br />
(STRAIN RELIEF)<br />
Figure 4.2.2-3. Detail of Revised RTD Cable Connection<br />
The original connector design and method of attaching the wires was qualified for the MHW-<br />
RTG program and intended for operation at temperatures up to 543°K (270°C). The<br />
weakened condition of the copper wire at the brazed connection was not revealed until the<br />
Galileo mission pushed the service temperature beyond its limit, and was not understood<br />
until extensive testing and evaluation at the temperature extreme was performed.<br />
4-53
Final Technical Report<br />
GPHS-RTGs for the Cassini Mission<br />
Lockheed Martin <strong>Document</strong> No. RR18<br />
August 1998<br />
All strands used in the manufacture of the conductors were soft annealed, nickel clad,<br />
oxygen free, high conductivity copper. Each #20 AWG strand consisted of 19 strands of #32<br />
AWG wire. These #20 AWG wires were sleeved and were individually sleeved with quartz<br />
cloth insulation and twisted in pairs to form a 1.50 inch left hand lay, secured at both ends<br />
with quartz cloth ties and sleeved with an additional liner of quartz cloth (Figure 4.2.2-4).<br />
The cables were attached to the RTD headers in the same manner as those for GPHS. The<br />
cables were formed on a fixture resembling the converter. The cables were wrapped with<br />
nickel foil from the headers to the connector where the foil was terminated with grounding<br />
straps (Figure 4.2.2-5).<br />
• 48.00±1.00<br />
••■<br />
1.50 +.25<br />
-00 TYP<br />
4 SEE NOTE 4e<br />
2 SEE NOTES<br />
4a, 4b, 4c & 4d<br />
#20 AWG (19 STRANDS #32AWG)<br />
NICKLE CLAD OFHC COPPER<br />
SEE NOTE 3<br />
SEE SEPARATE CIS AND PIL<br />
Figure 4.2.2-4. Wire Used in RTD Cable Assemblies<br />
The connector mounting bracket is the same configuration as for the GPHS-RTG except<br />
the stock thickness was increased from 0.40 inches to 0.62 inches to provide additional<br />
stiffness and to prevent accidental deformation of the bracket during handling, as had<br />
occurred on several occasions.<br />
4-54
Final Technical Report<br />
GPHS-RTGs for the Cassini Mission<br />
Lockheed Martin <strong>Document</strong> No. RR18<br />
August 1998<br />
RID 01<br />
MAKE FROM<br />
2300008061 (ITEM 10)<br />
14<br />
14<br />
14<br />
RTD IS<br />
RTD 02<br />
SEE DETAIL A<br />
TYP, 4 PLACES<br />
_ -<br />
60 REF TYP.<br />
P3 AND P4 TO<br />
1211C-7-74 TOGETHER.<br />
ri<br />
FOR THIS<br />
LE PER<br />
NOTES<br />
9510<br />
SEE DETAIL A<br />
BREAKOUT POINT RI<br />
`(SEE NOTE 10) 32.75 REF<br />
EMI 11.75 t.25<br />
— Ca23)<br />
15.50 ±.50<br />
17.25 ±..25<br />
2 I I : rff, 0'..4. WAR( r4 re i.Prr r 1 MIR<br />
(ITEM 1F80<br />
.<br />
2300808061 (ITEM 10) ..<br />
0R0 ) 01M<br />
•<br />
,<br />
IIII/fr<br />
di°<br />
12.50 ±.25<br />
BREAKOUT PT. 02<br />
8.50 ±.15<br />
24.25 ±25<br />
-<br />
MAME<br />
AtI PPRO)L<br />
4.<br />
14<br />
111<br />
RTD 04<br />
rwai<br />
2100808061<br />
(trtrs 0)<br />
Figure 4.2:2-5. RTD Cable Assembly<br />
The RTD cable assembly was qualified for the Cassini mission by a program that included<br />
inspections, demonstrations, tests, and analysis. Dynamic qualification testing was<br />
performed with the RTD cable assembly mounted on a test fixture that simulated its<br />
installation on the RTG. Testing was performed at 180°C, as measured on the RTD cable<br />
support bracket, the temperature expected to occur during the critical dynamic<br />
environments of launch. Dynamic environments included both random and transient<br />
inputs at the TA (Type Acceptance) level, applied in sequence in the direction of each of<br />
the three RTG axes. RTD resistances and insulation resistances were measured both<br />
before and after dynamic testing to verify that no damage had occurred. In addition, wire<br />
terminations at the connector and headers were radiographed to verify that there were no<br />
broken wire strands or separated connections.
Final Technical Report<br />
GPHS-RTGs for the Cassini Mission<br />
Lockheed Martin <strong>Document</strong> No. RR18<br />
August 1998<br />
Thermal vacuum tests were conducted for qualification of the RTD cable assembly from<br />
ambient temperature to 305°C, holding at 305°C for a minimum of four hours. RTD<br />
resistances were monitored continuously throughout the test to verify that no momentary<br />
open failure occurred, similar to those observed on the Galileo mission. Insulation<br />
resistance was measured at both ambient temperature and at 305°C. Visual examination<br />
and radiographic inspection were again performed to verify that there were no broken<br />
wires or separated connections.<br />
Acceptance testing was performed on all flight RTD cable assemblies, both as mounted on<br />
the fixture used for qualification testing, and as mounted on the RTG during acceptance<br />
testing of the RTG. Thermal vacuum testing on the fixture included testing from ambient<br />
temperature to 300°C, with RTD resistance monitored continuously throughout the test.<br />
Insulation resistance was measured at both ambient temperature and at 300°C. Visual<br />
examination and radiographic inspection were again performed after removal from the test<br />
fixture to verify that there were no broken wires or separated connections.<br />
Dynamic acceptance testing of flight RTD cable assemblies was similar to dynamic<br />
qualification testing, except that input levels were raised only to the FA (Flight Acceptance)<br />
level, and the tests were conducted at 175°C as measured on the RTD cable support<br />
bracket. RTD resistances and insulation resistance were measured before and after<br />
dynamic testing, and the wire terminations were again radiographed to verify that there<br />
were no broken wires or separated connections.
Final Technical Report<br />
GPHS-RTGs for the Cassini Mission<br />
Lockheed Martin <strong>Document</strong> No. RR18<br />
August 1998<br />
4.3 SMALL RTG DESIGN STUDY<br />
4.3.1 Objective<br />
A Small RTG Conceptual Design Study was performed in 1996. The objective was to<br />
evaluate various designs for a small radioisotope thermoelectric generator suitable for<br />
missions with modest power requirements. The designs evaluated include those<br />
previously proposed by Orbital Sciences Corporation and those proposed by Lockheed<br />
Martin. The target for these designs was 70 watts of electrical power at the end of a ten<br />
year mission. Assumptions regarding fuel age were treated parametrically, ranging from<br />
F-5 to new fuel. A maximum load environment of 40 g's acting along any axis was<br />
assumed and is consistent with load environments assumed at the beginning of previous<br />
RTG programs.<br />
4.3.2 Design Options<br />
4.3.2.1 Baseline Description<br />
A baseline design and four options were evaluated from a mass and performance<br />
viewpoint. Scoping structural and thermal analyses were completed in support of mass<br />
and performance predictions. The baseline design is a shortened version of the GPHS-<br />
RTG as configured for the Cassini converter, sized for six GPHS modules rather than<br />
eighteen. This design incorporates 192 unicouples. No attempt was made to optimize the<br />
mass of the baseline design. The heat source support system was identical to that of an 18<br />
GPHS module converter except that the mid-span supports were eliminated. The heat<br />
source support system is capable of providing the preload required for an 18 GPHS<br />
module converter with mid-span support. The thermal insulation system consists of sixty<br />
layers of molybdenum foil with layers of quartz cloth between each foil. Aluminum is<br />
utilized for the outer shell and fins.<br />
Design options were considered for both five and six GPHS modules. Figure 4.3.2-1<br />
illustrates the various options for the five module version. In addition, for each option, the<br />
number of unicouples was varied by reducing the number of rows. For example, as shown<br />
later, the maximum power at EOM was achieved for the five module version of Option 1<br />
with 144 unicouples, as compared with 192 unicouples for the baseline.
Final Technical Report<br />
GPHS-RTGs for the Cassini Mission<br />
Lockheed Martin <strong>Document</strong> No. RR18<br />
August 1998<br />
Figure 4.3.2-1. Small RTG Configurations Modeled<br />
4.3.2.2 Option 1 Description<br />
The only change from the baseline is to replace the three preload springs in the heat<br />
source system with a single spring which was sized for the lower axial preload required for<br />
six GPHS modules. This option has the minimum development risk of all the options.<br />
4.3.2.3 Option 2 Description<br />
The heat source support system is conceptually identical to Option 1, however, the<br />
individual components of the heat source support system were lightened to be compatible<br />
with the lower required preload for the small RTG. In addition, the PRD was downsized to<br />
be compatible with the lower internal volume of the small RTG.<br />
The quartz cloth separator between the molybdenum foil in the multifoil insulation system<br />
was replaced with zirconia powder. This is a significant mass savings. The required<br />
development for this scheme constituted moderate technical risk.
Final Technical Report<br />
GPHS-RTGs for the Cassini Mission<br />
Lockheed Martin <strong>Document</strong> No. RR18<br />
August 1998<br />
4.3.2.4 Option 3 Description<br />
This option utilizes design improvements representing significant technical risk. The most<br />
significant changes include a welded end closure at one end in place of the bolted flange<br />
and C-seal arrangement, and a single stud heat source support system in place of the four<br />
stud system used in Options 1 and 2. In addition, a graded multifoil insulation system with<br />
zirconia coated foils is employed.<br />
"Graded insulation" utilizes selected variations in foil material through the thickness of the<br />
insulation package depending on temperature. Lighter weight materials were proposed<br />
on the cold side of the insulation package.<br />
A variation of Option 3, utilizing a beryllium outer shell and end domes, is representative of<br />
design changes that attain mass savings by use of alternate materials. The current study<br />
evaluates material selections that include carbon-carbon composites, aluminum beryllium<br />
composites, and aluminum lithium alloys along with beryllium for the outer shell and fins.<br />
4.3.2.5 Option 4 Description<br />
Option 4 utilizes four pyrolytic graphite heat source support studs at each end of the heat<br />
source stack. This concept offers the advantage of lower heat loss through the pyrolytic<br />
graphite stud material because the material has a low conductivity perpendicular to the<br />
layers. However, because the material is weak in shear in the laminar direction, the<br />
support studs are positioned at an angle with the converter axis in order to take most of the<br />
load in compression.<br />
Finite element analysis indicated that a significant increase in preload, and hence weight,<br />
is required for this concept since-the supports were positioned at an angle to the converter<br />
axis. When sized for the higher preloads, the basic approach became less attractive from<br />
a mass viewpoint.
4.3.3 Summary<br />
Final Technical Report<br />
GPHS-RTGs for the Cassini Mission<br />
Lockheed Martin <strong>Document</strong> No. RR18<br />
August 1998<br />
The power and mass summary are shown in Table 4.3.2-1. There are numerous<br />
combinations of fuel, number of GPHS modules, and design options available to meet the<br />
70 watt electrical, EOM power requirement. Subsequent to determining fuel availability,<br />
the selected design option will determine the number of GPHS modules required to obtain<br />
70 watts electrical EOM power.<br />
Table 4.3.2-1. Power and Mass Summary<br />
F-5 Fuel Cassini Fuel New Fuel<br />
Option 5 Modules 6 Modules 5 Modules 6 Modules 5 Modules 6 Modules<br />
EOM<br />
1 Power<br />
70<br />
58W<br />
67 81 71 * 87 *<br />
Mass<br />
43.95 lb.<br />
49.40 43.95 49.40 44.38 49.83<br />
2 61W 73 70 84** 74 ** 88 **<br />
40.05 lb. 45.50 40.05 45.50. 40.05 45.50<br />
3 63W 76 67 81 ** 71 ** 85 **<br />
30.24 lb. 35.69 30.24 35.69. 30.24 35.69<br />
4 61W 74 65 79** 69** 83 **<br />
29.54 lb. 34.99 29.54 34.99 29.54 34.99<br />
* Only one row of unicouples removed<br />
** These powers were estimated. Once the power requirement was met, cases for design changes<br />
which would drive hot junction temperature above 1000°C were not analyzed.<br />
4.3.4 Design Recommendation<br />
Option 2 is the design recommendation from the Small RTG Study. The Option 4 data<br />
illustrated in Table 4.3.2-1 are for a design for which the analysis has not been completed.<br />
A significant mass increase is anticipated when the preload is increased to provide<br />
comparable module separation gaps to the other options evaluated. Thermal analysis<br />
indicates that, from a thermal viewpoint, Option 4 has a slightly lower power output than<br />
Options 2 and 3. Hence Option 4 has no advantage over Options 2 and 3.
Final Technical Report<br />
GPHS-RTGs for the Cassini Mission<br />
Lockheed Martin <strong>Document</strong> No. RR18<br />
August 1998<br />
There is a significant mass saving between Option 1 and Option 2 for moderate<br />
development risk. Option 3 offers a significant increase in specific power over Option 2<br />
(approximately 25%), however, the development risks are significant.<br />
During the final design phase for a flight program it is anticipated that the mass delta<br />
between Option 2 and Option 3 could be reduced.<br />
4.3.5 Structural Analyses Details<br />
Structural analyses were performed to establish the sizes of critical components and areas<br />
of the RTGs. In addition, preload requirements were investigated for the three heat source<br />
support configurations as shown earlier in Figure 4.3.2-1. Two versions of Option 4 using<br />
pyrolytic graphite studs for support were investigated. One version incorporates spring<br />
washers at the inboard end only and the other incorporates spring washers at both the<br />
inboard and outboard ends. Preload requirements are important since they affect the<br />
weight of the heat source support structure and the heat losses through this structure.<br />
4.3.5.1 Loads Environment<br />
It was necessary to assume a structural load environment for this study. Figure 4.3.5-1, an<br />
expanded version of the curve provided in Reference 4.3.5-1 (Pluto Express Mission<br />
Science Investigation), provides an estimate of the dynamic loads as a function of effective<br />
component mass for some typical launch vehicles. Based on an assumed RTG weight of<br />
22 kg, Figure 4.3.5-1 yielded an acceleration of 28 g acting along any axis. Reference<br />
4.3.5-1 also provides quasi-static loads of ±18 g for the thrust axis and ±0.05 g for the<br />
lateral axis. Combining the dynamic and quasi-static loads yields 46 g for the thrust axis<br />
and 25.9 g for the lateral axis. However, the launch vehicle and the mounting orientation of<br />
the RTG were not defined. Therefore, for the purposes of this study, a maximum load<br />
environment of 40 g is assumed to act along any axis. This load environment is consistent<br />
with the load environment assumed at the beginning of previous RTG designs and was a<br />
reasonable compromise for the 46 g and 25.9 g levels derived above.
Final Technical Report<br />
GPHS-RTGs for the Cassini Mission<br />
Lockheed Martin <strong>Document</strong> No. RR18<br />
August 1998<br />
Figure 4.3.5-1. Mass Acceleration Curve<br />
The conditions at lift off were assumed to be:<br />
40 g Longitudinal<br />
40 g Lateral<br />
10 psig Cover Gas (Argon)<br />
172°C (342°F) Outer Shell (Avg.)<br />
921°C (1690°F) Heat Source (Avg.)<br />
4.3.5.2 Heat Source Module Finite Element Model<br />
The finite element model of the heat source module used throughout this study is shown in<br />
Figure 4.3.5-2. The model consists of 360 elements and 372 nodes. Only the aeroshells<br />
(without the GIS caps) are assumed to carry the structural loads. The lateral shear<br />
restraints provided by the lock members are represented by rigidly coupling adjacent<br />
module interface nodes in the lateral directions at the lock member locations. The total<br />
weight of the complete module assembly is included by adjusting the density of the<br />
aeroshell material.<br />
4-62
Final Technical Report<br />
GPHS-RTGs for the Cassini Mission<br />
Lockheed Martin <strong>Document</strong> No. RR18<br />
August 1998<br />
ELEMENTS PER MODULE<br />
NODES PER MODULE<br />
TOTAL WEIGHT OF MODULE<br />
Figure 4.3.5-2. Heat Source Module Finite Element Model<br />
4.3.5.3 Options 1 and 2<br />
Options 1 and 2 employs the GPHS RTG heat source support system design which has<br />
been successfully tested and flown on previous missions. Four Inconel X-750 preload<br />
studs support the heat source assembly at each end through zirconia insulators and FWPF<br />
graphite pressure plates. The preload studs transmit the loads to the outer case through a<br />
titanium frame at the outboard end and through titanium support structures which include a<br />
Belleville type spring washer at the inboard end. The spring washer assembly provides a<br />
means for adjusting the longitudinal preload and accommodates relative thermal<br />
expansions between the heat source and the outer case. Changes in the stiffness<br />
characteristics of the support system based on the numbers of heat source modules were<br />
not included in this parametric study.
Final Technical Report<br />
GPHS-RTGs for the Cassini Mission<br />
Lockheed Martin <strong>Document</strong> No. RR18<br />
August 1998<br />
Figure 4.3.5-3 shows the finite element model developed for Options 1 and 2 based on a<br />
heat source consisting of five heat source modules. Beam elements are used to represent<br />
the outer shell and the heat source support members with the exception of the spring<br />
washer, which is represented as a spring element having translateral and rotational<br />
stiffness characteristics. This model consists of 2159 elements and 1906 nodes. The length<br />
of the outer shell was adjusted as required to be compatible with heat sources consisting<br />
of two to seven modules.<br />
I/B FRAME (4)<br />
INTERFACE ELEMENTS<br />
BETWEEN MATING MODULES<br />
PART MAIL E D<br />
MODULE FWPF 3.5 MSI 0.3<br />
STUD INCONEL 21.2 MSI 0.3<br />
CASE AL 2219-T6 8.8 MSI 0.3<br />
FRAME Ti 6-2-4-2 14.0 MSI 0.3<br />
Number of Elements 2159<br />
Number of Nodes 1906<br />
Figure 4.3.5-3. Finite Element Model of RTG (Options 1 and 2)<br />
4-64
Final Technical Report<br />
GPHS-RTGs for the Cassini Mission<br />
Lockheed Martin <strong>Document</strong> No. RR18<br />
August 1998<br />
The longitudinal separation at the module interfaces was calculated as a function of<br />
longitudinal preload for a lateral load of 40 g. The results are shown in Figures 4.3.5-4 and<br />
4.3.5-5. For the purposes of this study it was assumed that a maximum separation of<br />
0.0005 inches is acceptable. Based on this criteria, the required preloads for<br />
5-module and 6-module configurations were found to be 733 pounds and 1080 pounds,<br />
respectively. The required preloads for separation criteria of 0.0005 inches and 0.001<br />
inches are shown in Figure 4.3.5-5.<br />
4.00<br />
E<br />
0<br />
•<br />
3.00<br />
•<br />
■<br />
A<br />
•<br />
x N = 2 0 N = 5<br />
0 N = 3 A N = 6<br />
0 N = 4 V N = 7<br />
— — — — Criterion<br />
o. 2.00<br />
a)<br />
rn<br />
1.00<br />
•<br />
•<br />
•<br />
5 Modules<br />
733 Lbs<br />
6 Modules<br />
1080 Lbs<br />
0.00 1<br />
0<br />
—<br />
----<br />
•<br />
•___<br />
.........<br />
•<br />
■<br />
.-.=.--.-<br />
500 1000 1500 2000<br />
Axial Preload (Ibs)<br />
Figure 4.3.5-4. Effects of Number of Modules (Options 1 and 2)
Final Technical Report<br />
GPHS-RTGs for the Cassini Mission<br />
Lockheed Martin <strong>Document</strong> No. RR18<br />
August 1998<br />
1600<br />
Required Preload vs Number of Modules for Two<br />
Separation Criteria 40 g's Y Axis<br />
1400<br />
A 1.0 mu Criterion<br />
1200<br />
1000<br />
80<br />
60<br />
40<br />
20<br />
1 1 1 1 1 1<br />
2 3 4 5<br />
6 7 8<br />
0<br />
I<br />
0 0.5 Mil Criterion<br />
No. Modules<br />
VF97-0632<br />
Figure 4.3.5-5. Effects of Allowable Separation (Options 1 and 2)<br />
A contour map of the maximum separation for a configuration having 6 modules with a<br />
preload of 1000 pounds is shown in Figure 4.3.5-6, where the criterion of 0.0005 inches is<br />
slightly exceeded. The maximum separation is concentrated over a small area of the<br />
interlace. It is believed that the 0.0005 inch separation criterion is conservative and should<br />
not result in any significant debris or damage to the aeroshells. However, the<br />
corresponding preloads should be considered the minimum permissible level since the<br />
separation would increase rapidly with any decrease in preload. If the number of modules<br />
is reduced below five, a reassessment of the criterion is in order because of the rapid<br />
increase in separation with reduced preload.
Final Technical Report<br />
GPHS-RTGs for the Cassini Mission<br />
Lockheed Martin <strong>Document</strong> No. RR18<br />
August 1998<br />
6 Modules 40g's Y Axis 1000 lb Preload<br />
VALUE<br />
+0.00E-00<br />
— +1.00E-04<br />
— +1.76E-04<br />
— +2.53E-04<br />
— +3.30E-04<br />
, +4.06E-04<br />
_ +4.83E-04<br />
+5.60E-04<br />
+6.36E-04<br />
Figure 4.3.5-6. Interface Separation Profiles (Options 1 and 2)<br />
Figure 4.3.5-7 shows the maximum compressive stress to be approximately 2090 psi at the<br />
module interfaces for the configuration having six modules and a preload of 1000 pounds.<br />
This is well below the compressive strength for the FWPF material of the aeroshell<br />
(>10,000 psi).<br />
4-67
Final Technical Report<br />
GPHS-RTGs for the Cassini Mission<br />
Lockheed Martin <strong>Document</strong> No. RR18<br />
August 1998<br />
6 Modules 40 g's Y Axis 1000 lb Preload<br />
VALUE<br />
+0.00E-00<br />
+2.22E-16<br />
+2.99E-02<br />
+5.99E-02<br />
+8.90E-02<br />
+1.19E-03<br />
+1.49E-03<br />
+1.79E-03<br />
+2.09E-03<br />
Figure 4.3.5-7. Interface Compressive Stress (Options 1 and 2)<br />
4.3.5.4 Option 3<br />
For Option 3, the number of preload studs is reduced from four to one for each end of the<br />
heat source supports, and the titanium support structures are eliminated by transmitting the<br />
loads directly to the end domes. This approach offers potential reductions in weight and<br />
heat loss. Spring washers are incorporated at one end to accommodate relative expansion<br />
between the heat source and the outer case.<br />
The finite element model developed for Options 1 and 2 was modified to represent the<br />
Option 3 heat source support system and analyzed for a lateral load of 40 g. The results<br />
4-68
Final Technical Report<br />
GPHS-RTGs for the Cassini Mission<br />
Lockheed Martin <strong>Document</strong> No. RR18<br />
August 1998<br />
compared to the Option 1 and 2 configurations are shown in Figure 4.3.5-8. For an RTG<br />
having 6 heat source modules, Option 3 required 1599 pounds of preload versus 1080<br />
pounds of preload for Options 1 and 2 to meet the 0.0005 inch separation criterion. Based<br />
on these results, the end domes for Option 3 were designed with adequate reinforcing ribs<br />
to support the increased preload.<br />
Separation vs Preload for Two Design Options<br />
6 Modules 40 g's Y Axis<br />
10.00<br />
8.00<br />
•<br />
1<br />
0 Option 1 and 2<br />
A Option 3<br />
- — — Criterion<br />
Ss<br />
= E<br />
c 04-,<br />
co<br />
co<br />
0.<br />
(1)<br />
co<br />
E<br />
)7<br />
a<br />
6.00<br />
4.00<br />
2.00<br />
•<br />
• 1080<br />
•<br />
0.00<br />
0 500 1000<br />
lbs<br />
1599 lbs<br />
•<br />
4•<br />
• • •<br />
A.<br />
Axial Preload (lbs)<br />
1500 2000<br />
Figure 4.3.5-8. Effects of Heat Source Support Design Options<br />
4.3.5.5 Option 4<br />
The heat source support system for Option 4 consists of four pyrolytic graphite stud<br />
assemblies at each end of the heat source which transmit the loads directly from the corner<br />
of the heat source to the outer case. Details of the pyrolytic graphite stud assemblies are<br />
shown in Figure 4.3.5-9. This support system offers potential weight savings by eliminating<br />
the need for support frames to transmit loads to the outer shell. In addition, the low thermal<br />
conductivity of the pyrolytic graphite studs offers the potential for a reduction in heat losses.<br />
4-69
Final Technical Report<br />
GPHS-RTGs for the Cassini Mission<br />
Lockheed Martin <strong>Document</strong> No. RR18<br />
August 1998<br />
SPRING WASHERS<br />
C-SEAL<br />
PYROLITIC GRAPHITE STUD<br />
CLOSURE CAP<br />
FWPF MODULE CONTACT<br />
GPHS MODULE<br />
PRESSURE SCREW<br />
HARDENED WASHER<br />
MULTIFOIL INSULATION7<br />
Figure 4.3.5-9. Pyrolitic Preload Stud Support (Option 4)<br />
Two versions of this support system were analyzed. These versions are identical with the<br />
exception that the first, Configuration A, does not include spring washers at the outboard<br />
end while the second, Configuration B, includes spring washers at both ends.<br />
The finite element model of Configuration A is shown in Figure 4.3.5-10. Based on the<br />
results of the analyses of Options 1 and 2, spring washers were selected to provide a<br />
longitudinal preload of 1000 pounds. The resulting spring constant for a stack of nine<br />
spring washers, arranged to provide a useful stroke of approximately 0.02 inches, was<br />
determined to be 8100 pounds per inch for each spring stack. The force vector line of<br />
action for each stud assembly was oriented to pass through the center of the heat source.
Final Technical Report<br />
GPHS-RTGs for the Cassini Mission<br />
Lockheed Martin <strong>Document</strong> No. RR18<br />
August 1998<br />
BELLEVILLE WASHERS (4)<br />
(SPRINGS)<br />
k = 8100 lb/in<br />
INBOARD STUDS (4)<br />
(BEAMS)<br />
2160 SHELLS<br />
16 BEAMS<br />
4 SPRINGS<br />
400 INTERFACE<br />
TOTAL = 2580 ELEMENTS<br />
OUTBOARD STUDS (4)<br />
(BEAMS)<br />
OUTER CASE<br />
(BEAMS)<br />
3<br />
)<br />
2<br />
1<br />
INTERFACE ELEMENTS<br />
BETWEEN MATING MODULES<br />
MODULE (SHELLS)<br />
Figure 4.3.5-10. Six-Module RTG Finite Element Model (FEM) (Option 4)<br />
The results of the analyses are summarized in Table 4.3.5-1. The required preload for<br />
Configuration A to meet the 0.0005 inch separation criterion is approximately 3500<br />
pounds, which exceeds the capability of the selected springs. In addition, the lateral<br />
displacement at the inboard end of the heat source is excessive. The analysis of<br />
Configuration B is discontinued at a preload of 4000 pounds where the calculated<br />
interface separation is 0.0016 inches. As in Configuration A, the lateral displacement of<br />
the ends of the heat source is excessive. From these results it is apparent that the force<br />
vectors should be oriented to provide more lateral support of the heat source.<br />
The analyses were discontinued when it was concluded that a considerable amount of<br />
additional analysis would be required to optimize these designs which had the potential for<br />
major weight increases and would require engineering test verification and development<br />
of special assembly and loading procedures.<br />
4-71
Final Technical Report<br />
GPHS-RTGs for the Cassini Mission<br />
Lockheed Martin <strong>Document</strong> No. RR18<br />
August 1998<br />
Table 4.3.5-1. Maximum Separation at Heat Source Module Interfaces<br />
Preload<br />
(lbs.)<br />
Configuration A<br />
Belleville Springs<br />
One End<br />
Separation (in.)<br />
Configuration B<br />
Belleville Springs<br />
Both Ends<br />
1000 Excessive Excessive<br />
2400 0.0043 0.0088<br />
2800 0.0018 0.0058<br />
3200 0.0008 0.0038<br />
3600 0.0004 0.0025<br />
4000 0.0002 0.0016<br />
4.3.5.6 Conclusions<br />
• A significant reduction in preload is afforded if a small separation is permitted to occur<br />
at the heat source module interfaces. For example, the required preloads for Option 1<br />
and 2 are:<br />
No separation allowed Preload = 1408 lbs.<br />
0.0005 inch separation allowed Preload = 1080 lbs.<br />
This reduced preload will result in a weight reduction estimated to be up to 0.8 pounds<br />
and a reduction in heat loss.<br />
• Separation of the heat source module interfaces is not a potential stability problem.<br />
Separation increases the length of the heat source stack, which compresses the<br />
preload springs, resulting in stabilizing increase in preload. Also, geometry dictates that<br />
the separation would be limited by the stroke of the springs when they bottom out and<br />
by the minor deflection of the remaining structure.<br />
• The limiting criterion should be based on separation at the heat source module<br />
interfaces where excessive impacting could generate graphite debris, resulting in<br />
electrical shorts or damage to the aeroshells. A conservative separation criterion of<br />
0.0005 inches has been selected. This results in very localized areas of separation<br />
and should result in no significant graphite debris.<br />
• Options 1 and 2 are state-of-the-art designs and present no new structural problems.<br />
• Option 3 is estimated to provide reductions in weight and heat loss compared to<br />
Options 1 and 2. However, creep of the end domes and the resulting loss of preload<br />
would have to be addressed. Several potential solutions are available including<br />
preconditioning to complete the primary creep prior to assembly or clamping to prevent<br />
creeping prior to lift-off.<br />
4-72
Final Technical Report<br />
GPHS-RTGs for the Cassini Mission<br />
Lockheed Martin <strong>Document</strong> No. RR18<br />
August 1998<br />
• Option 4 would require additional analyses to optimize the direction of the force vector<br />
for the pyrolytic graphite stud assemblies and the sizes of the spring washers and<br />
surrounding structure before a fair assessment of this design concept could be made.<br />
Engineering unit tests would be required to verify the structural integrity. Assembly and<br />
fueling procedures would have to be developed, possibly requiring major modifications<br />
of existing tooling.<br />
4.3.6 Thermal/Power Analysis Details<br />
Thermal and electrical power analysis results are a function of fuel loading. Fuel loadings,<br />
assuming the use of F-5 fuel, other Cassini fuel, or new fuel, are shown in Table 4.3.6-1 for<br />
loading at the time of the Cassini launch and time of the Pluto launch, and ten years after<br />
the Pluto launch.<br />
Table 4.3.6-1. Fuel Loading Summary (watts)<br />
F-5 Fuel Cassini Fuel New Fuel<br />
Fuel Loading at Time<br />
of Cassini Launch<br />
(October 1997)<br />
4029<br />
(18 Modules)<br />
4388 *<br />
(18 Modules)<br />
--<br />
Fuel Loading at Time<br />
of Pluto Mission<br />
Launch (March 2001)<br />
218<br />
(Per Module)<br />
237<br />
(Per Module)<br />
254<br />
(Per Module)<br />
Fuel Loading at Ten<br />
Years from Pluto<br />
Launch<br />
201<br />
(Per Module)<br />
219<br />
(Per Module)<br />
235<br />
(Per Module)<br />
* Average of F-2 and F-7<br />
4.3.6.1 Baseline Models<br />
The starting point for the thermal analysis was the SINDA model for a single RTG in a<br />
100°F environment developed for the Cassini program. Before going to six or five modules,<br />
an intermediate SINDA model was created which eliminated the midspan ring and bosses,<br />
inboard ring, outboard ring and associated SINDA connections. Once this model was<br />
checked out, baseline models were created for six and five modules with Cassini fuel. The<br />
6-module design was created first with a new TRASYS model, based on the layout for the<br />
6-module design. Iteration between the SINDA run and the RTG performance code<br />
resulted in a final SINDA run for the 6-module baseline. The 5-module baseline design is<br />
based on a length of 2.09 inches (one GPHS module) shorter than the 6-module design. A<br />
summary of temperatures for the GPHS-RTG, 6-module and 5-module baseline designs is<br />
shown in Table 4.3.6-2.<br />
4-73
Final Technical Report<br />
GPHS-RTGs for the Cassini Mission<br />
Lockheed Martin <strong>Document</strong> No. RR18<br />
August 1998<br />
Table 4.3.6-2. Summary of Temperatures for the GPHS-RTG, 6-Module<br />
and 5-Module Baseline Designs<br />
Temperature Averages °C<br />
Configuration<br />
Outer<br />
Shell<br />
Unicouple<br />
Hot<br />
Junction<br />
Unicouple<br />
Cold<br />
Junction<br />
AT h-c<br />
GPHS RTG (18 Modules) 254 977 280 697<br />
Six Module Design 208 896 231 665<br />
Five Module Design 203 874 226 648<br />
The purpose of creating these baseline models is:<br />
1) Establish a starting point for design improvements. and<br />
2) Show the dramatic drop in hot junction temperatures and ATh-c when the number of<br />
modules decreases with same end conductances.<br />
The resultant low hot junction temperatures of 6-module and 5-module RTGs indicate the<br />
need for design changes to increase the hot junction temperature. The design changes<br />
which produce the largest increases in hot junction temperature involve:<br />
1) Reduce the heat losses through the inboard and outboard heat support systems, and<br />
2) Reduce the number of unicouples.<br />
4.3.6.2 Six and Five Module Designs - Cassini Fuel<br />
Since all of the design changes were internal, no new TRASYS models were required.<br />
The SINDA models for 6-module and 5-module baselines were changed consistent with<br />
the proposed design changes. The resultant 0Th -c was used with the previous results to<br />
estimate electrical power increases and new Peltier cooling and heating values for the<br />
next SINDA run. The SINDA runs, after one or two iterations, were used as the basis for<br />
the initial performance code runs. The RTG Performance Program used the SINDA<br />
temperatures to calculate RTG performance. This resulted in a new power estimate and<br />
new Peltier cooling and heating terms. Several iterations between the SINDA models and<br />
the RTG performance code were necessary for convergence.<br />
The predicted electrical power and hot junction temperatures for Cassini fuel are shown in<br />
Table 4.3.6-2.<br />
4-74
Final Technical Report<br />
GPHS-RTGs for the Cassini Mission<br />
Lockheed Martin <strong>Document</strong> No. RR18<br />
August 1998<br />
Table 4.3.6-3. Electrical Power Predictions (Cassini Fuel: 237 Watts per Module at BOM)<br />
B 0 M<br />
Power<br />
(watts)<br />
Unicouple<br />
Hot Junction<br />
Temperature<br />
(°C)<br />
EOM Power (watts)<br />
After<br />
After<br />
12 Yrs<br />
10 Yrs + 2 Mos<br />
Configuration<br />
Six Modules<br />
Baseline (Scaled GPHS RTG - 85 896 70 67<br />
192 Unicouples)<br />
Design Changes<br />
4 Pyrolytic Graphite Studs 94 918 Est. 77 74<br />
176 Unicouples 93 943 76 73<br />
One Pre-Load Stud 96 926 79 76<br />
176 Unicouples + One Stud 101 968 83 80<br />
160 Unicouples 99 989 Est. 81 78<br />
Five Modules<br />
Baseline (Scaled GPHS RTG - 71 877 58 56<br />
160 Unicouples)<br />
Design Changes<br />
144 Unicouples 76 940 62 60<br />
One Pre-Load Stud 79 907 65 62<br />
144 Unicouples + One Stud 86 978 70 68<br />
128 Unicouples 82 999 Est. 67 65<br />
128 Unicouples + Smaller 86 1010 Est. 70 67<br />
Studs<br />
128 Unicouples + One Stud 88 1043 * 67 65<br />
* Could theoretically increase to 70W by operating in low voltage mode prior to Pluto arrival.<br />
Note: Electrical power predictions based on RTG performance code for BOM (60°F sink) and flight<br />
unit data/TEG degradation code for EOM (0°F sink).<br />
Convergence between the performance code and SINDA was completed for most of the<br />
cases listed. Temperatures shown with Est. were from SINDA only or were estimated by<br />
scaling. Likewise, BOM powers were also estimated when the temperatures were<br />
estimated. EOM powers were determined for periods of 10 years and 12 years plus 2<br />
months after launch. The requirement in the statement of work was 70 watts after 10 years.<br />
The longer mission time is based on the JPL estimated time for first Pluto encounter.<br />
Electrical power for EOM is based on Flight Unit Data and the TEG Degradation Code<br />
which will be discussed in greater detail later in this report.
4.3.6.3 Six and Five Module Designs - F-5 Fuel<br />
Final Technical Report<br />
GPHS-RTGs for the Cassini Mission<br />
Lockheed Martin <strong>Document</strong> No. RR18<br />
August 1998<br />
The primary issue is whether the 70 watt requirement can be met with five modules.<br />
Analysis indicates it can not. Most of the power predictions at BOM were estimated, based<br />
on the results for Cassini fuel. The F-5 cases which were actually calculated were<br />
obtained by iterating between SINDA and the RTG Performance Program. Power and<br />
temperature predictions for F-5 fuel are shown in Table 4.3.6-4. The low voltage option<br />
was considered as a way to minimize degradation losses throughout the mission.<br />
However, it was realized that most of the spacecraft power would be required for<br />
housekeeping throughout the mission, so operating at low voltage and low power was not<br />
a viable option.<br />
Table 4.3.6-4. Electrical Power Predictions (F-5 Fuel: 218 Watts per Module at BOM)<br />
BOM<br />
Power<br />
(watts)<br />
Unicouple<br />
Hot Junction<br />
Temperature<br />
(°C)<br />
EOM Power (watts)<br />
After<br />
10 Yrs<br />
After<br />
12 Yrs<br />
+ 2 Mos<br />
Configuration<br />
Six Modules<br />
Baseline (Scaled GPHS RTG - 76 62 60<br />
192 Unicouples)<br />
Design Changes<br />
176 Unicouples 81 66 64<br />
One Pre-Load Stud 84 69 66<br />
176 Unicouples + One Stud 88 72 69<br />
160 Unicouples 86 70 68<br />
160 Unicouples + Smaller 89 73 70<br />
Studs<br />
160 Unicouples + One Stud 93 76 73<br />
Five Modules<br />
Baseline (Scaled GPHS RTG - 61 825 50 48<br />
160 Unicouples)<br />
Design Changes<br />
144 Unicouples 66 54 52<br />
One Pre-Load Stud 69 56 54<br />
144 Unicouples + One Stud 75 61 59<br />
128 Unicouples 71 58 56<br />
128 Unicouples + One Stud 77 987 63 61<br />
112 Unicouples + One Stud 83 1062 * 62 60<br />
112 Unicouples + Smaller 81 63 61<br />
Studs<br />
* Could theoretically increase to 67W by operating in low voltage mode prior to Pluto arrival.<br />
Note: Electrical power predictions based on RTG performance code for BOM (60°F sink) and flight<br />
unit datafTEG degradation code for EOM (0°F sink).<br />
4-76
4.3.6.4 Six and Five Module Designs - New Fuel<br />
Final Technical Report<br />
GPHS-RTGs for the Cassini Mission<br />
Lockheed Martin <strong>Document</strong> No. RR18<br />
August 1998<br />
Only a few power predictions were calculated for the new fuel as the requirement was<br />
easily met, even with five modules. Hot junction temperatures were estimated to show that,<br />
due to the high fuel loading, only minimal design changes could be made before driving<br />
the hot junction temperature above 1000°C. Most of the power predictions for new fuel<br />
were scaled from Cassini fuel values by the relationship, electrical power equals oneeighth<br />
of fuel loading. The power prediction for new fuel are summarized in Table 4.3.6-5.<br />
Table 4.3.6-5. Electrical Power Predictions (New Fuel: 254 Watts per Module at BOM)<br />
BOM<br />
Power<br />
(watts)<br />
Unicouple<br />
Hot Junction<br />
Temperature<br />
(°C)<br />
EOM Power (watts)<br />
After<br />
10 Yrs<br />
After<br />
12 Yrs<br />
+ 2 Mos<br />
Configuration<br />
Six Modules<br />
Baseline (Scaled GPHS RTG -<br />
192 Unicouples)<br />
99 81 79<br />
Design Changes<br />
176 Unicouples 106 997 87 85<br />
One Pre-Load Stud 110 978 Est. 90 87<br />
176 Unicouples + One Stud 115 1020 Est. 89 86<br />
160 Unicouples 111 1051 Est. 84 81<br />
Five Modules<br />
Baseline (Scaled GPHS RTG -<br />
160 Unicouples)<br />
80 65 63<br />
Design Changes<br />
144 Unicouples 87 67 65<br />
One Pre-Load Stud 90 74 72<br />
144 Unicouples + Smaller 94<br />
Studs<br />
77 65<br />
144 Unicouples + One Stud 96 1030 74 73<br />
128 Unicouples 92 1060 Est. 69 69<br />
Note: Electrical power predictions based on RTG performance code for BOM (60°F sink) and flight<br />
unit data/TEG degradation code for EOM (0°F sink).<br />
4.3.6.5 Summary<br />
A summary of the minimum design modifications to meet the 70W EOM requirement is<br />
shown in Table 4.3.6-6. Determination of EOM powers for all fuels is based on past<br />
experience with BOM hot junction temperature. For hot junction temperature less than<br />
1000°C at BOM, Voyager flight data was used to obtain EOM/BOM = 0.82 for 10 years and<br />
0.79 for 12 years and 2 months.
Final Technical Report<br />
GPHS-RTGs for the Cassini Mission<br />
Lockheed Martin <strong>Document</strong> No. RR18<br />
August 1998<br />
Table 4.3.6-6. Summary of Minimum Design Modifications for Each Fuel Type to Meet 70W<br />
EOM Requirement (Aluminum Shell and Fins)<br />
F-5 Fuel Other Cassini Fuel New Fuel<br />
Six Modules Two Rows Removed Two Rows Removed One Row Removed<br />
(Option 1) Option 1 Option 1<br />
70W 81W 87W<br />
Five Modules Two Rows Removed Two Rows Removed One Row Removed<br />
Only One Stud Four Small Studs<br />
Option 3 Option 2 Option 1<br />
63W 70W 70W<br />
Three Rows<br />
Removed<br />
Option 2<br />
63W<br />
For BOM hot junction temperatures above 1000°C, the computer code, TEG, was used to<br />
calculate EOM powers. TEG calculates RTG performance with time accounting for dopant<br />
precipitation, silicon sublimation, multifoil insulation degradation and electrical insulation<br />
degradation. Analysis was first performed for several designs with BOM hot junction<br />
temperatures below 1000°C both to verify the program was giving reasonable answers<br />
and to justify the use of the same degradation factors for the lower temperature designs.<br />
The TEG program was then run for two 5-module cases, one with a BOM hot junction<br />
temperature of 1041°C and the other of 1062°C. These two runs were then used to<br />
estimate the degradation with time of other runs with hot junction temperatures exceeding<br />
1000°C.<br />
4.3.6.6 Fin Optimization Study<br />
A study was also conducted on fin size using a fin optimization program called AXFIN.<br />
AXFIN optimizes fin length/thickness to minimize weight for a given heat rejection load,<br />
shell temperature, material selection, and converter size. The program assumes no end<br />
losses and allows options for rectangular, triangular, and trapezoidal cross section fins. In<br />
the study, the end losses from the domes were subtracted from the heat rejection load and<br />
the trapezoidal fin cross section was used. A variety of fin materials was investigated,<br />
including aluminum alloy 2219, beryllium, aluminum-beryllium alloy, aluminum-lithium<br />
alloy, and carbon-carbon. Both material and shell temperature had significant effects on<br />
the optimum fin length and thickness.<br />
4-78
Final Technical Report<br />
GPHS-RTGs for the Cassini Mission<br />
Lockheed Martin <strong>Document</strong> No. RR18<br />
August 1998<br />
References for Section 4<br />
4.1.1-1 Braun, J., R. Cockfield and L. DeFillipo, "Fabrication of E-6 Foil Insulation<br />
Assembly," Cassini RTG Program Memo No. 251, 23 November 1993.<br />
4.3.1-1 "Pluto Express Mission Science Investigation," Draft Report A096-OSS-XX,<br />
NASA, Office of Space Sciences, 2 August 1996.
Section 5<br />
Performance
Final Technical Report<br />
GPHS-RTGs for the Cassini Mission<br />
Lockheed Martin <strong>Document</strong> No. RR18<br />
August 1998<br />
SECTION 5<br />
PERFORMANCE<br />
5.1 FLIGHT UNIT PERFORMANCE AS ETGs<br />
Each converter undergoes a series of tests as both an ETG and an RTG as indicated in<br />
Figure 5.1-1. ETG tests are performed under vacuum conditions and in air with an argon<br />
gas fill. Vacuum tests consist of processing and stability tests. Air testing is used to obtain a<br />
stable reference performance point with an argon gas fill and to measure the converter leak<br />
rate.<br />
(LM) LAS (LM) MOUND LAB. IAAC<br />
CONVERTER<br />
FABRICATION<br />
•ELECTRICALLY HEATED<br />
•PROCESSING SHIP<br />
—.),..<br />
•MEASURE ELECTRICAL<br />
PERFORMANCE<br />
•VACUUM DATA<br />
•ARGON DATA<br />
• LEAK RATES<br />
• FUEL CONVERTER<br />
• PROCESSING<br />
•MEASURE ELECTRICAL<br />
PERFORMANCE<br />
•VAC U UM DATA<br />
•ARGON DATA<br />
•LEAK RATES<br />
MOUND LAB.<br />
MOUND LAB.<br />
MOUND LAB.<br />
•MAGNETIC FIELD<br />
MEASUREMENTS<br />
AIR<br />
PERFORMANCE<br />
TEST<br />
VIBRATION TEST<br />
2 AXES<br />
1■111•MI<br />
4—<br />
•ARGON DATA<br />
•ARGON DATA<br />
•LEAK RATES<br />
•ARGON DATA (COOLED)<br />
•LEAK RATES<br />
amm•4111111.<br />
MOUND LAB.<br />
•MASS PROPERTIES<br />
MEASUREMENTS<br />
• NUCLEAR RADIATION<br />
MEASUREMENTS<br />
1■11111111=1411111<br />
LAS - LOADING AND ASSEMBLY STATION<br />
MOUND LAB.<br />
IAAC - INERT ATMOSPHERE ASSEMBLY CHAMBER<br />
LM - LOCKHEED MARTIN<br />
THERMAL<br />
VACUUM TEST<br />
•VACUUM DATA<br />
MOUND LAB.<br />
FINAL AIR<br />
PERFORMANCE<br />
TEST<br />
•ARGON DATA<br />
•LEAK RATES<br />
VF97-0688<br />
Figure 5.1-1. Flight Units Test Nominal Sequence and Data Acquisition<br />
5-1
Vacuum Tests<br />
Final Technical Report<br />
GPHS-RTGs for the Cassini Mission<br />
Lockheed Martin <strong>Document</strong> No. RR18<br />
August 1998<br />
Following fabrication, each unit is processed and tested with an electric heat source in the<br />
LAS (Loading And Assembly Station). The processing consists of a gradual heat-up, in<br />
vacuum, to full operating temperatures. The intent of the processing is to outgas absorbed<br />
moisture and other potentially degrading gases before achieving full operational<br />
temperature. This process typically takes about thirty days as shown in Figure 5.1-2. After<br />
achieving a heat input of 4415 watts, the ETG is subjected to a 24-hour stability test followed<br />
by a 76-hour stability test at 4402 watts input. The stability tests are performed to<br />
demonstrate that the electrical performance of the ETG (i.e., power, voltage, internal<br />
resistance, and isolation resistance) is stable and consistent with previously tested ETGs.<br />
4600<br />
4400<br />
4200<br />
4000<br />
3800<br />
3600<br />
3400 E.<br />
3200<br />
1-- 3000<br />
17,c 2800<br />
2600<br />
2400<br />
2200<br />
2000<br />
1800<br />
1600<br />
1400<br />
1200<br />
1000<br />
800<br />
600<br />
400<br />
200<br />
0<br />
o E7 465 Hours<br />
El 825 Hours<br />
v E2 725 Hours<br />
• E3 690 Hours<br />
o E4 860 Hours<br />
■ E5 620 Hours<br />
E6 600 Hours<br />
100 200 300 400 500 600 700 800 900 1000<br />
TIME, HOURS<br />
Figure 5.1-2. Heat Input Versus Time to Reach Full Power<br />
Converter E-2<br />
Converter ETG-2 was processed and tested in October 1983 during the Galileo/Ulysses<br />
program. It showed normal performance during processing and vacuum testing. At this<br />
point only the qualification unit and E-1 had been tested. Power output, internal resistance<br />
and isolation resistance were all within a small range for the three units as shown in Table<br />
5-2
Final Technical Report<br />
GPHS-RTGs for the Cassini Mission<br />
Lockheed Martin <strong>Document</strong> No. RR18<br />
August 1998<br />
5.1-1. Following vacuum performance, the next step was to place the end dome on the<br />
converter and measure the argon performance and the leak rate. During this operation the<br />
converter was exposed to air for a brief period due to an imploded glove port. To assess the<br />
effect of the air exposure, an additional vacuum test was performed. Results, also in Table<br />
5.1-1 showed that the converter lost 2.6 watts between the first and second vacuum tests.<br />
Analysis of the internal resistance and open circuit voltage changes resulted in a calculated<br />
power loss of 0.7 watts due to dopant level changes associated with the temperature cycles<br />
and 1.9 watts due to the oxygen effect. The effect of the air exposure was to form an oxide<br />
layer on some of the molybdenum foil surfaces, which increased their emissivity and<br />
resulted in a larger heat loss. Following vacuum testing, the argon tests were performed as<br />
shown in the next section.<br />
Converter E-6<br />
E-6 was the first converter built for the Cassini program and was processed in February<br />
1995. Processing and vacuum performance were normal. Its electrical performance, shown<br />
in Table 5.1-1, is seen to be in good agreement with the previously built ETGs. The average<br />
normalized power output of the GPHS qualification unit and units E-1 through E-5 was<br />
296.2 watts as shown in Table 5.1-2. Normalized power output for E-6 was 293.4 watts,<br />
which was the lowest value of any unit but within one percent of the average of the previous<br />
six units. Table 5.1-2 used the initial stability test data for E-2 rather than the second test in<br />
order to compare initial performance. E-2 measured 294.8 watts at the end of the first test<br />
and 292.2 watts at the end of the second test following the air exposure. Internal resistance<br />
of E-6 was 2.150 ohms, which was the highest value measured for any of the ETGs. Open<br />
circuit voltage, however, was not higher. This could indicate a small effect due to higher<br />
than normal rivet resistances as discussed in Section 3.1.3 of this report. The isolation<br />
resistance between the circuit and outer shell was measured at 4,200 ohms, which was<br />
higher than measured in four of the six previous converters.<br />
5-3
Final Technical Report<br />
GPHS-RTGs for the Cassini Mission<br />
Lockheed Martin <strong>Document</strong> No. RR18<br />
August 1998<br />
Qual E-1<br />
Table 5.1-1. Comparison of ETG Performance<br />
E-2<br />
E-3 E-4 E-5 E-6 E-7<br />
Start End Start End Start End End Start End Start End Start End Start End Start End<br />
Date 1/15/83 1/22/83 7/26/83 8/1/83 9/27/83 10/1/83 10/8/83 2/9/84 2/12/84 420/84 4/23/84 6/27/84 6/30/84 2/12/95 2/15/95 2/3/96 2/19/96<br />
Heat Input, watts ( 2) 4388 4393 4391 4393 4391 4390 4391 4391 4387 4390 4388 4393 4391 4405 4405 4400 4403<br />
Power Output, watts (1)<br />
(Measured)<br />
292.7 291.9 292.8 292.6 292.3 291.5 288.9 295.5 294.4 292.9 292.4 295.0 294.3 292.5 291.8 294.4 292.7<br />
Load Voltage, volts 30.04 30.02 30.01 30.04 30.02 30.08 30.02 30.04 30.06 30.07 30.04 30.04 30.02 30.06 30.01 29.99 30.00<br />
Open Circuit, volts 50.28 50.75 50.50 50.85 50.56 50.85 50.99 50.53 50.82 50.48 50.76 50.55 50.85 50.61 50.90 50.70 51.40<br />
Current, amps 9.744 9.724 9.759 9.739 9.735 9.692 9.626 9.838 9.793 9.741 9.735 9.821 9.802 9.730 9.730 9.820 9.760<br />
Internal Resistance,<br />
ohms<br />
2.076 2.132 2.100 2.137 2.110 2.143 2.179 2.083 2.120 2.095 2.129 2.089 2.125 2.112 2.150 2.108 2.189<br />
RTD Temp, °C 250.8 250.8 251.8 251.8 252.4 252.4 2542 247.8 247.6 249.8 249.9 252.3 2522 247.8 247.7 252.4 252.0<br />
EHS Avg. Temp, °C - - 1039 1040 - - - 1043 1042 1049.2 1048.4 1055 1054 1042.9 1041.9 - -<br />
Circuit Isolation to<br />
Case, ohms x 10-3<br />
2 Seconds 1.93 1.48 22 2.1 2.0 1.9 - 22 22 4.0 3.1 5.0 4.6 3.3 2.6 2.6 12<br />
_<br />
2 Minutes 3.77 2.33 42 3.9 3.6 3.1 2.7 3.4 3.4 7.0 7.8 9.5 9.7 6.0 42 3.5 1.4<br />
EHS Isolation to Shell,<br />
ohms x 10-3<br />
2 Seconds 8.16 4.19 7.5 9.3 4.6 6.0 6.0 9.6 9.0 15.0 9.0 10.7 13.0 13.0 - -<br />
2 Minutes T 4.52 4.3 6.0 6.3 3.8 4.6 4.7 64 74 6.0 9.0 13.0 11.0 8.3 8.5 - -<br />
Normalized Power (3)<br />
at 4402 watts Input,<br />
at Pins, watts<br />
296.3 294.9 296.0 295.6 295.5 294.8 2922 298.7 298.1 296.2 296.0 298.0 297.5 294.1 293.4 296.6 294.6<br />
Elapsed Time, hours 171 84 76 76 76 76 76 51<br />
(1) Thermopile power output is approximately 2 watts higher than measured.<br />
(2) Includes lead loss correction of 25 watts.<br />
(3) Using 0.12 w(e) per w(th).
Final Technical Report<br />
GPHS-RTGs for the Cassini Mission<br />
Lockheed Martin <strong>Document</strong> No. RR18<br />
August 1998<br />
Table 5.1-2. Average Power, Internal Resistance, and Open Circuit Voltage at End of LAS<br />
Vacuum Test (30 Volts) for Qualification and E-1 through E-5 ETGs<br />
Power Output ( 1 ) at RTG Pins (watts)<br />
Average<br />
Low (F-2) (2)<br />
High (F-3)<br />
Range<br />
296.2<br />
294.8<br />
298.1<br />
3.3 (1.1%)<br />
Internal Resistance (ohms) Average 2.131<br />
Low (F-3) 2.120<br />
High (F-2) (2)<br />
2.143<br />
Range 0.023 (1.1%)<br />
Open Circuit Voltage (volts) Average 50.83<br />
Low 50.76<br />
High 50.85<br />
Range 0.09 (0.2%)<br />
Normalized to 4400 watts; 25 watt total heater lead correction<br />
E-2 used first LAS test data<br />
Converter E-7<br />
E-7 was the second and last of the new converters built for the Cassini program and was<br />
processed in February 1996. It showed normal power output, internal resistance, and open<br />
circuit voltage during heat-up and during stability testing as shown in Table 5.1-1. The<br />
isolation resistance trend for E-7, however, was observed to be abnormal. This abnormal<br />
trend is discussed in detail in Reference 5-1. A summary of the report is provided here.<br />
The isolation resistance began to show a slightly steeper than normal slope after the heat<br />
input reached 4,200 watts. The EHS did not have any thermocouples, but based on E-6<br />
measurements, this would correspond to an average EHS surface temperature of 1010°C<br />
as shown in Figure 5.1-3. During the stability testing at the 4400 watt level, both the<br />
isolation resistance value and the isolation resistance trend fell outside the previous<br />
database as shown in Figure 5.1-4. Extrapolation of the data indicated that the resistance
Final Technical Report<br />
GPHS-RTGs for the Cassini Mission<br />
Lockheed Martin <strong>Document</strong> No. RR18<br />
August 1998<br />
1100<br />
1000<br />
900<br />
800<br />
I I<br />
BASED ON E-6 MEASUREMENTS<br />
CHANGE LOAD VOLTAGE<br />
FROM 17 TO 30 VOLTS<br />
FROM 7 TO 17 VOLTS<br />
700<br />
600<br />
500<br />
400<br />
300<br />
200<br />
100<br />
0<br />
400 800 1200 1600 2000 2400 2800 3200 3600 4000 4400<br />
HEAT INPUT - WATTS<br />
VF97-0689<br />
Figure 5.1-3. EHS Temperature Versus Heat Input during E-7 Processing<br />
might fall below the 1,000 ohm requirement before the end of the stability test. Efforts were<br />
taken to halt the downward isolation resistance trend. Because the water vapor partial<br />
pressure, as indicated by residual gas analyzer (RGA) measurements, was higher than<br />
observed during E-6 processing, it was decided to decrease the power input and remove<br />
water at a lower temperature. In addition, it was decided to backfill the LAS with dry argon<br />
and use the scrubber system to help remove some of the water vapor. The scrubber was<br />
operated for approximately 24 hours after which vacuum processing was restarted.<br />
Isolation resistance trends during the reprocessing are shown in Figure 5.1-5. Figure 5.1-6<br />
shows the isolation resistance during the first and second stability tests along with the<br />
qualification ETG trend.<br />
5-6
Final Technical Report<br />
GPHS-RTGs for the Cassini Mission<br />
Lockheed Martin <strong>Document</strong> No. RR18<br />
August 1998<br />
o E7<br />
• El<br />
(1) v E2<br />
2 le+004 - E3<br />
0<br />
a Cr—C<br />
0 E4<br />
ui<br />
oz ''A--•\zo---0-0-0---43—°—° • E5<br />
A<br />
a le '41t--___<br />
E6<br />
t-____<br />
1-- (5<br />
il--<br />
A QUAL<br />
A.,,,.<br />
cn<br />
- Na<br />
Eh<br />
4.--_,:"_„__<br />
0 E2 Second<br />
w<br />
• `-.400,—..—„,—.---4.—______._2-,1 ir•-•<br />
cc<br />
Test<br />
zvv____cca.vq:-..---*+-7.--oir-v`L....,_A.,_<br />
WiA,Z,,Apt•MA—A—A—ao-A--A--A—A—A—AA-46,_&,..AA ,<br />
0 A-<br />
---- °-.0<br />
.,..,,_<br />
A--■-•-•--•-••,...-._,-,_, ,<br />
0<br />
cr)<br />
0<br />
i-<br />
w<br />
le+003 I,, t I<br />
0 20 40 60 80 100 120 140 160 180 200<br />
TIME ON STABILITY TEST, HOURS<br />
Figure 5.1-4. ETG Isolation Resistance Versus Time during Stability Tests<br />
1000000<br />
700000<br />
500000<br />
300000<br />
FIRST<br />
HEAT UP<br />
• • •<br />
Rm = 1 MEG<br />
100000<br />
70000<br />
50000<br />
30000<br />
ECOND<br />
EAT UP<br />
Rm = 10K<br />
Rm = 100K<br />
OM* ȯ qtr,<br />
Rm = 10K<br />
10000<br />
7000<br />
5000<br />
1:414,4,<br />
3000<br />
1000<br />
2800 3000<br />
3200<br />
. • ,,,,,,, • „ „ ,,,,,,,,,,,,,,<br />
3400 3600 3800 4000 4200 4400<br />
HEAT INPUT, WATTS<br />
Figure 5.1-5. E-7 Isolation Resistance during First and Second Heat-Ups<br />
5-7
Final Technical Report<br />
GPHS-RTGs for the Cassini Mission<br />
Lockheed Martin <strong>Document</strong> No. RR18<br />
August 1998<br />
10000<br />
9000<br />
8000<br />
7000<br />
6000<br />
..<br />
5000<br />
11 E-7 FIRST STABILITY TEST (Feb 1-3, 1996)<br />
4000<br />
3000<br />
.44,00,1*-44...-44.444-44,4,40,<br />
46N171,_<br />
'Ma<br />
4"+.. • 444eL<br />
UNIT<br />
• .<br />
+4,<br />
2000<br />
E-7 SECOND STABILITY TEST (Feb. 17-19, 1996)<br />
1000<br />
0 20 40 60 80 100 120 140 160 180 200<br />
TIME, HOURS<br />
Figure 5.1-6. E-7 Isolation Resistance during Stability Tests<br />
The decrease in isolation resistance between the end of the first and the start of the second<br />
stability test was attributed to the deposition of conductive material during the slow reheat,<br />
over a period of 220 hours, from 2900 watts. The resistance was nearly constant through<br />
the first 26 hours of the second test, but then began to decrease and reached 1,400 ohms.<br />
The resistance decrease was accompanied by an increase in the ETG internal pressure as<br />
shown in Figure 5.1-7. (The ETG internal pressure was measured by an ion gauge which<br />
penetrated the inboard dome as shown in Figure 5.1-8.) Stability testing was terminated at<br />
this point, with MRB approval, because of the concern that higher than normal effluent<br />
gases were emanating from the EHS which could further degrade the ETG isolation<br />
resistance.<br />
Investigation Results<br />
An investigation was initiated to identify the source and cause of the lower-than-expected<br />
isolation resistance and to determine if there may be long term adverse effects on RTG<br />
performance. The investigation reviewed and identified differences between the E-7 ETG<br />
5-8
Final Technical Report<br />
GPHS-RTGs for the Cassini Mission<br />
Lockheed Martin <strong>Document</strong> No. RR18<br />
August 1998<br />
2500<br />
2400<br />
2300<br />
2200<br />
2100<br />
0 2000<br />
z<br />
1900<br />
ISOLATION RESISTANCE AND ETG PRESSURE CHANGE AS HEAT INPUT IS REDUCED 2.5<br />
2.4<br />
2.3<br />
2.2<br />
2.1<br />
2.0<br />
(75 1800<br />
z 1700<br />
0 1600<br />
0 1500<br />
'00<br />
ISOLATION RESISTANCE<br />
ETG PRESSURE<br />
0-0<br />
1.9<br />
19 0<br />
CC<br />
U)<br />
U)<br />
111<br />
a.<br />
1400<br />
1300<br />
1200<br />
1100<br />
4400 WATTS<br />
4100 WATTS<br />
1000<br />
0 10 20 30<br />
40 50<br />
TIME - HOURS<br />
Figure 5.1-7. E-7 ETG Pressure Versus Time during Second Stability Test<br />
and previous ETGs. Differences in materials, configuration, and processing parameters<br />
were evaluated. Gaseous effluents from the EHS were a suspected cause and emphasis<br />
was placed on EHS material and configuration differences. Equilibrium thermodynamic<br />
analyses were performed by Lockheed Martin (LM) and Battelle Columbus Lab (BCL) to<br />
predict the chemical reactions taking place in the EHS and converter during heat-up and<br />
stability testing which could cause a reduction in ETG isolation resistance. Verification tests<br />
were performed at BCL to confirm the hypothesized reactions. Based upon these<br />
evaluations, an assessment was made regarding long term adverse effects on RTG<br />
performance.<br />
The investigation concluded that the E-7 isolation resistance was most likely degraded by<br />
the deposit of gaseous aluminum effluent from the EHS onto the silica wrap between the<br />
unicouple and foil insulation. These deposits normally occur during ETG processing, but
Final Technical Report<br />
GPHS-RTGs for the Cassini Mission<br />
Lockheed Martin <strong>Document</strong> No. RR18<br />
August 1998<br />
—<br />
—1<br />
Outboard Dome<br />
_A-----"-- (and Midspan Caps)<br />
Removed for Processing<br />
„te..--- ETG<br />
LAS-2<br />
?<br />
To Gas<br />
Service<br />
Cart<br />
GMV<br />
,....../<br />
Solenoid Valve<br />
Gas Processing<br />
Valve<br />
Ion Tube<br />
,<br />
I<br />
i<br />
Figure 5.1-8. E-7 Processing Configuration<br />
were aggravated during E-7 processing because of several factors. The initial EHS heat-up<br />
rate was faster than for E-6 and the moisture level in the ETG was approximately twice as<br />
high as indicated by RGA scans. The E-7 EHS configuration was different in that it had<br />
more venting area because its thermocouples were not installed due to a thermocouple<br />
wire cracking problem. This resulted in the EHS operating at lower pressures than in<br />
previous ETGs. Thermogravimetric analyses (TGA) at BCL verified that the EHS<br />
alumina/graphite reaction rate was enhanced as the total pressure decreased and that<br />
sufficient aluminum was generated to account for the lower E-7 isolation resistance. These<br />
results were supported by thermodynamic analyses conducted by LM and BCL. In addition,<br />
verification tests performed at BCL indicated the E-7 EHS ceramics were three to five times<br />
more reactive than those used in the E-6 EHS.<br />
5-10
Final Technical Report<br />
GPHS-RTGs for the Cassini Mission<br />
Lockheed Martin <strong>Document</strong> No. RR18<br />
August 1998<br />
These deposits represent less than a single layer (monolayer) of aluminum distributed over<br />
the surface of the silica wrap of the unicouples and are not expected to have any adverse,<br />
long term effect on the F-7 RTG performance. Its performance is expected to be within the<br />
database of the previous RTGs. The interior of the F-7 thermopile (heater cavity) was<br />
inspected at Mound when the EHS was removed in preparation for fueling. There was no<br />
evidence of any deposits or foreign material. Final confirmation that the isolation resistance<br />
was stable and acceptable was obtained after stable performance data were observed<br />
during and after thermal vacuum testing of the F-7 as described in Section 5.2.5.<br />
5.2 FLIGHT RTG ACCEPTANCE TESTING<br />
5.2.1 IAAC Assembly and Performance Testing<br />
Argon Performance (Pre-Vacuum)<br />
After ETG acceptance testing at the Lockheed Martin Valley Forge facility the units were<br />
fueled at Mound Laboratories. The fueling operation is performed in the Inert Atmosphere<br />
Assembly Chamber (IAAC). Fueling takes place in an argon atmosphere and the first<br />
electrical performance data are obtained at this time. Table 5.2.1-1 summarizes the<br />
stabilized data which is taken with the upper end dome off.<br />
Table 5.2.1-1. IAAC Performance (Dome Off) Argon Environment<br />
F-5 RTG F-2 RTG F-7 RTG F-6 RTG<br />
Date 12/7/84 2/10/96 9/4/96 11/16/96<br />
Hour 1000 1700 0700 0700<br />
Heat Input, watts 4459.5 4435 4435 4437<br />
Power Output, watts<br />
As Measured 174.7 168.0 169.5 158.3<br />
Corrected to Pins 175.4 168.6 170.1 158.9<br />
Load Voltage, volts 30.00 30.012 29.98 30.04<br />
Open Circuit Voltage, volts 41.65 41.793 41.615 40.681<br />
Current, amps 5.823 5.597 5.653 5.270<br />
Internal Resistance, ohms 2.000 2.105 2.053 2.019<br />
Average RTD Temperature, °C 181.3 177.7 179.9 179.6<br />
Bell Jar Temperature, °C 45.3 37 35.5 33.6<br />
Isolation Resistance to Shell (2 minutes), — 60.7K 58.3K 66.5K<br />
Ohms<br />
5-11
Final Technical Report<br />
GPHS-RTGs for the Cassini Mission<br />
Lockheed Martin <strong>Document</strong> No. RR18<br />
August 1998<br />
F-5 was fueled during the Galileo program in December 1984 with a fuel thermal loading of<br />
4459.5 watts. The Cassini RTGs had a fuel loading approximately 25 watts lower. This<br />
accounts in part for the lower power. F-2 had already been through two thermal vacuum<br />
tests and had air exposure in 1983. These all contributed to a lower power. In addition,<br />
comparison of ETG and RTG thermal vacuum open circuit voltage data had indicated that<br />
the true fuel loading in the Galileo RTGs was approximately 30 watts higher than the<br />
reported value. Comparison of F-6 with other RTGs led to the conclusion that the end dome<br />
foil package was not seated as well. This led to higher convective heat losses and lower<br />
power output. The effect is less in vacuum as shown in the next section.<br />
Vacuum Performance<br />
Vacuum performance data is obtained in the water cooled bell jar located in the IAAC.<br />
Table 5.2.1-2 summarizes the measured performance. The power requirement for a 4410<br />
watt input was 291 watts for F-2, 293 watts for F-6 and F-7 and 292 watts for F-5<br />
(at 30+0.7/-0.5 volts). A second requirement was that the electrical isolation between the<br />
thermopile and outer case be 1,000 ohms minimum. Both of these requirements were met<br />
as shown in Table 5.2.1-2. Additional requirements were that bell jar pressure be 1x 10 -5<br />
torr or less and that the CO (carbon monoxide) partial pressure be 1 x 10 -7 torr or less.<br />
These requirements were not met. Although the total bell jar pressure was only slightly<br />
above the requirement, the CO partial pressure was 11 to 40 times higher.<br />
CO Level Investigation<br />
The CO investigation was reported in detail in Reference 5-2. The CO problem surfaced<br />
during processing of the F-2 RTG when it was not possible to reach a bell jar pressure<br />
below 1x10 -5 torr and a calculated CO partial pressure equal to or less than 1 x 10 -7 torr.<br />
The CO partial pressure was estimated to be 4 x 10 -6 torr. The bell jar transient pressure<br />
history had shown a trend indicative of either a pump problem, outgassing or an air leak.<br />
RGA scans showed a peak at mass 78 indicating off-gassing and an oxygen partial<br />
pressure of 2.6 x 10 -6 torr, which was a clear indication of an air leak. Subsequent trouble-
Table 5.2.1-2. IAAC Vacuum Performance (Dome Off)<br />
Final Technical Report<br />
GPHS-RTGs for the Cassini Mission<br />
Lockheed Martin <strong>Document</strong> No. RR18<br />
August 1998<br />
F-2 RTG F-5 RTG F-6 RTG F-7 RTG<br />
Date 2/18/96 12/16/84 11/21/96 9/10/96<br />
Hour 1800 1400 1000 1200<br />
Heat Input, watts 4435 4458.6 4437 4435<br />
Power Output, watts<br />
As Measured 295.9 305.5 298.2 297.9<br />
Corrected to Pins 297.8 307.6 300.2 299.9<br />
Normalized to 4410W Input * 294.8 301.8 295.8 296.9<br />
Load Voltage, volts 30.034 30.070 30.144 30.031<br />
Open Circuit Voltage, volts 51.751 51.94 51.873 52.305<br />
Current, amps 9.851 10.158 9.891 9.921<br />
Internal Resistance, ohms 2.205 2.152 2.197 2.245<br />
Average RTD Temperature, °C 262.5 262.6 261.2 261.4<br />
Insulation Resistance, k-ohms<br />
Thermopile to Case (2 minute) 2.7 6.42 4.12 2.49<br />
Chamber Pressure, torr 4 x 10⁻⁵ 2.8 x 10⁻⁶ 1.1 x 10⁻⁶ 8.2 x 10⁻⁶<br />
Average Sink Temperature, °C 68.3 68.8 57.8 61.3<br />
CO Partial Pressure, torr 4 x 10⁻⁶ 2.3 x 10⁻⁸ 3.3 x 10 -6 1.1 x 10⁻⁶<br />
* Normalized using 0.12 watts electric per thermal watt input<br />
shooting, after the RTG was removed from the IAAC, showed that the pump performance<br />
was erratic. One test with a controlled leak injected into the bell jar showed a calculated<br />
pumping speed of 5 liters/sec. At the time it was thought that the pumping speed should<br />
have been about 165 liters/sec. Numerous other trouble shooting tests failed to identify the<br />
source of the air leak, but the liquid nitrogen cold trap was highly suspect. The oil diffusion<br />
pump and cold trap were subsequently replaced with a turbomolecular pump prior to the<br />
fueling the F-7 RTG.<br />
During IAAC vacuum processing of the F-7 RTG, a total pressure of 8 x 10 -6 torr was<br />
obtained, however, the CO partial pressure requirement again was not satisfied. The<br />
calculated CO partial pressure was reported as 1.1x10 -6 torr. Prior to the November 1996<br />
fueling of the third RTG (F-6), the CO partial pressure limit was increased from 1 x 10 -7 to<br />
5 x 10 -6 torr. The calculated CO partial pressure for the F-6 RTG was 3.3 x 10 -6 torr which was<br />
5-13
Final Technical Report<br />
GPHS-RTGs for the Cassini Mission<br />
Lockheed Martin <strong>Document</strong> No. RR18<br />
August 1998<br />
below the new limit. It was apparent that a more detailed knowledge of the vacuum system<br />
was needed to understand the observed results. The following areas were considered<br />
during the investigation.<br />
Vacuum system pumping speed<br />
Effect of 90° elbow<br />
Comparison of helium partial pressures<br />
Vacuum measurement and RGA sampling methods<br />
Comparison of CO pressures in the LAS<br />
Outgassing of PD224 high emissivity paint on the outer shell<br />
CO released from the fuel<br />
The major findings were (1) that the elbows in the pumping system (Figure 5.2.1-1) control<br />
the net pumping speed (Figure 5.2.1-2) and not the size of the pump. If operating properly,<br />
both the turbomolecular or the oil diffusion pump would provide the same (within 10%)<br />
pressure for a given gas generation rate, (2) the measured partial pressures of helium for<br />
the Cassini RTGs are in good agreement with the values calculated from the known helium<br />
generation rate and the calculated net pumping speed. The helium partial pressures<br />
reported for the Galileo/Ulysses RTGs, on the other hand, were about a factor of 50 lower<br />
than predicted as shown in Figure 5.2.1-3.<br />
The reported CO partial pressures in the IAAC bell jar for both programs are also shown in<br />
Figure 5.2.1-3. There is a striking similarity in the relative differences in the magnitude of<br />
both.
Final Technical Report<br />
GPHS-RTGs for the Cassini Mission<br />
Lockheed Martin <strong>Document</strong> No. RR18<br />
August 1998<br />
BELL JAR AND 6" VACUUM LINE<br />
IAAC<br />
WALL<br />
Figure 5.2.1-1. IAAC Vacuum Chamber with Turbomolecular Pump<br />
460<br />
440 PUMP—T-PU 450H<br />
420<br />
400<br />
FLANGE SIZE-160 millimeter<br />
380<br />
PIPE DIAMETER-6 inches<br />
360<br />
He •<br />
340<br />
320 NO ELBOWS<br />
300<br />
280 He<br />
260<br />
d 240 N2—v.<br />
w OR<br />
220<br />
a_ CO<br />
200<br />
0<br />
z 180<br />
160<br />
a 140<br />
120<br />
100<br />
80<br />
60<br />
40 -<br />
20<br />
• •<br />
ONE ELBOW<br />
•<br />
NO WS<br />
N2-c7<br />
66 ONE-ELBOW<br />
He<br />
N 2 o R<br />
CO<br />
•<br />
THREE ELBOWS<br />
0 4 8 12 16 20 24 28 32 36 40 44 48 52 56 60 64 68 72 76 80<br />
PIPE LENGTH- INCHES<br />
•<br />
•<br />
Figure 5.2.1-2. Effect of Elbows on Net Pumping Speed of He and CO<br />
(Calculated by Pfeiffer Vacuum Technologies)<br />
5-15
Final Technical Report<br />
GPHS-RTGs for the Cassini Mission<br />
Lockheed Martin <strong>Document</strong> No. RR18<br />
August 1998<br />
10 -4<br />
10 -s<br />
10'<br />
CASSINI<br />
RTGS<br />
F-2<br />
_ ___ __<br />
E_-.6<br />
F- 7<br />
-<br />
F- 7 A<br />
- -2<br />
-<br />
F-6-<br />
- - —<br />
, --r<br />
,--<br />
- --<br />
--THEORETICAL -- - ' -<br />
-HeGENERATIONRATE<br />
(8.10-9 moles/sec)<br />
--- --- --<br />
10 —7<br />
10 -6<br />
GALIT.±01-±-==--t-'<br />
- RTGS----F1-4<br />
F-50<br />
ii CASSINI RTG MASS 28<br />
0 GALILEO RTG MASS 28<br />
. - ":"7 ♦ CASSINI-_RTG7HELIUM.-E--=_=:e_,-"-<br />
'1.-59- - ---• GALILEO-RTGHELIUM -: - -- I-<br />
1 - -<br />
_<br />
QUAL .-- F-1<br />
QUAL<br />
_ __.=_-_7=4 __ . --<br />
10 -9<br />
' -MASS 28<br />
_ CALCULATED<br />
PUMPING SPEED -<br />
TURBO SYSTEM<br />
HELILM<br />
CALCL LAZED<br />
PUMP NG SPEED<br />
—i--<br />
, - - ,-<br />
-----<br />
30 50 70 100 300 500 700 1000<br />
NET PUMPING SPEED-L/SEC<br />
Figure 5.2.1-3. Comparison of the He and CO Partial Pressures and IAAC Net<br />
Pumping Speeds for the Cassini and Galileo/Ulysses RTGs<br />
He and CO<br />
The CO levels in the Cassini RTGs were also a factor of 50 higher than those for the<br />
Galileo/Ulysses RTGs. In vacuum systems, uncertainties in measurement are often such<br />
that pressure deviations of a factor of 2 or 3 or sometimes a factor of 5 are not necessarily<br />
considered unusual. It is further noted that the Cassini RTG total pressures, as measured by<br />
an independent vacuum gauge, were about a factor of 3 higher than those reported for the<br />
Galileo/Ulysses RTGs (Table 5.2.1-3). This smaller difference, as compared to the factor of<br />
50 difference in He and CO partial pressures, suggests that systematic differences related to<br />
the RGA system are responsible for the apparently higher CO levels in the Cassini RTGs.<br />
A review of the RGA differences was made as well as the methods used to calculate the<br />
partial pressures from the raw data. The differences were found to be significant as<br />
discussed in detail in Reference 5-2. The new system used for Cassini was found to be<br />
much less prone to error than the old system.<br />
5-16
Date<br />
Processed<br />
Table 5.2.1-3. Total Pressure in the IAAC Vacuum Chamber<br />
Unit<br />
Total<br />
Pressure<br />
(torr)<br />
Galileo/Ulysses RTGs<br />
Final Technical Report<br />
GPHS-RTGs for the Cassini Mission<br />
Lockheed Martin <strong>Document</strong> No. RR18<br />
August 1998<br />
Vacuum<br />
Pump<br />
Calculated Mass<br />
28 Pumping<br />
Speed with<br />
3 Elbows<br />
(liters/sec)<br />
Feb 1984 Qual 3.2 x 10⁻⁶ Oil Diffusion 28.3<br />
Sep 1984 F-1 1.8 x 10⁻⁶ Oil Diffusion 28.3<br />
Dec 1984 F-5 2.8 x 10⁻⁶ Oil Diffusion 28.3<br />
Feb 1985 F-3 4.5 x 10 -6 Oil Diffusion 28.3<br />
June 1985 F-4 4.7 x 10 -6 Oil Diffusion 28.3<br />
Cassini RTGs<br />
Feb 1996 F-2 -4 x 10⁻⁵ Oil Diffusion 28.3<br />
Sep 1996 F-7 8.2 x 10⁻⁶ Turbomolecular 27<br />
Nov 1996 F-6 1.1 x 10⁻⁵ Turbomolecular 27<br />
CO measurements made in the LAS when scaled up by the ratio of pumping speeds<br />
showed that the Cassini levels were consistent. LAS CO data from the Galileo program<br />
Qual unit when scaled by the pumping speed ratio should have resulted in an IAAC bell jar<br />
pressure of 1.1 x 10 -6 torr whereas the value reported was 1 x 10 -8 torr or 100 times lower.<br />
Conclusion<br />
The higher CO partial pressure and total pressure of the Cassini RTGs measured during<br />
IAAC processing were primarily due to improved vacuum measurement and residual gas<br />
analysis methods. Secondary contributions included a reduced vacuum pumping speed,<br />
outgassing of the PD224 outer shell coating and transient release from the Pu02 fuel. (The<br />
latter two were responsible for the higher levels from F-2 and F-6 relative to F-7.) It was<br />
determined that the CO and He partial pressures reported for the Galileo/Ulysses RTGs<br />
were found to be artificially low and the actual CO partial pressures for the Cassini RTGs<br />
were not significantly different than those that actually existed for the Galileo/Ulysses RTGs.<br />
The difference was attributed to possible errors introduced by conversion of a current signal<br />
to a voltage and comparison of a pen trace to a calibration curve associated with the<br />
method used for the Galileo/Ulysses RTGs compared to the microprocessor controlled data<br />
acquisition and analysis method used for the Cassini RTGs. Active pumping on the RGA<br />
during processing of the Galileo/Ulysses RTGs could also have contributed.<br />
5-17
Final Technical Report<br />
GPHS-RTGs for the Cassini Mission<br />
Lockheed Martin <strong>Document</strong> No. RR18<br />
August 1998<br />
All the Cassini RTGs processed in the IAAC bell jar were affected by the systematic RGA<br />
problem. In addition, the F-2 RTG was processed in the IAAC bell jar equipped with a faulty<br />
oil diffusion pump and some outgassing from the touch-up PD224 outer shell paint<br />
contributed to the CO level. For the F-6 RTG, some residual CO was released from the fuel<br />
due to a shorter (Modular Reduction and Monitoring Facility) MRMF processing time.<br />
The CO partial pressures measured subsequently in the thermal vacuum chamber indicated<br />
normal generation rates for all Cassini RTGs (References 5-3, 5-4, 5-5). Analyses of both<br />
the IAAC and the thermal vacuum chamber RGA data suggest that the internal CO<br />
generation rates were not significantly different from those seen in the Galileo/Ulysses<br />
program. Consequently, the Cassini RTG power performance is expected to be comparable<br />
to that of Galileo/Ulysses RTGs.<br />
Isolation Resistance<br />
The isolation resistance between the thermoelectric circuit and outer shell is measured<br />
during IAAC operations. Figure 5.2.1-4 shows the isolation trends for the Cassini RTGs<br />
during the time of vacuum operation. The initial point is the time at which the RTG is<br />
switched from short circuit to 30 volts. The isolation trend of F-7 was of particular interest<br />
because of the low isolation resistance measured during ETG testing in the LAS.<br />
GESP-7247 (Reference 5-6) was issued predicting the expected isolation resistance<br />
behavior of F-7. A minimum resistance in the range from 670 to 850 ohms was predicted. In<br />
addition a gradual rise to between 850 to 1220 ohms after 20 hours was also predicted. The<br />
measured minimum was 1150 ohms and in 20 hours the isolation resistance had risen to<br />
1700 ohms. The normal resistance trend lends credence to the conclusion expressed in<br />
Reference 5-1 (E-7 Processing Investigation Final Report) that the problems observed in the<br />
LAS were directly related to the electric heat source and would cease when the heat source<br />
was removed and replaced by the isotope heat source.
Final Technical Report<br />
GPHS-RTGs for the Cassini Mission<br />
Lockheed Martin <strong>Document</strong> No. RR18<br />
August 1998<br />
u)<br />
8000<br />
7000<br />
I=0 IS WHEN THE VOLTAGE IS CHANGED FROM SHORT CIRCUIT TO 30 VOLTS<br />
THIS CAUSES TEMPERATURE CHANGES AT THE HOT END<br />
AND VOLTAGE SENSITIVE POLARIZATION EFFECTS WITHIN INSULATORS<br />
1 6000<br />
0<br />
uli<br />
0<br />
z 5000<br />
<<br />
I— u)<br />
(73 4000<br />
w<br />
cY<br />
Z 3000<br />
O_<br />
Final Technical Report<br />
GPHS-RTGs for the Cassini Mission<br />
Lockheed Martin <strong>Document</strong> No. RR18<br />
August 1998<br />
8000<br />
7000<br />
VJ<br />
2<br />
6000<br />
t=0 IS WHEN THE VOLTAGE IS CHANGED FROM SHORT CIRCUIT TO 30 VOLTS<br />
THIS CAUSES TEMPERATURE CHANGES AT THE HOT END<br />
AAtfl" CFKICITIVC POI AP171:1110,1FPFFCTC wITHIAIIKISIILAT(117C<br />
F-5 .00,••<br />
C.)<br />
z 5000<br />
H<br />
cf)<br />
(-7) 4000<br />
U..1<br />
tY<br />
Z 3000<br />
0<br />
IS 2000<br />
0 cn<br />
1000<br />
F-4<br />
\.<br />
........<br />
•.......<br />
.•••••*"........"<br />
••••*** F-1<br />
S. „ 0 • •<br />
.... VA. • -. •<br />
AA<br />
F-2<br />
.4<br />
. .<br />
, F-3 Q .It<br />
,<br />
• ....•<br />
a a °<br />
41,<br />
„ 0E12'1 —<br />
Liag,-)0E'a":<br />
F-6<br />
............,„,.....0.■•••■•<br />
".,01.,prinn(DOn""<br />
. F. -7,,,,„,„,,,,,,E,D0u005a :03:'<br />
0<br />
■ I<br />
I i i<br />
I<br />
0 10 20 30 40 50 60 70 80<br />
TIME-HOURS<br />
ISOLATION RESISTANCE IN IAAC<br />
Figure 5.2.1-5. Cassini and Galileo/Ulysses RTGs<br />
5.2.2 Vibration Testing<br />
All of the RTG Flight Units for the Cassini mission (F-2, F-6, and F-7) were subjected to<br />
dynamic acceptance tests in accordance with Specification 23009150. The spare RTG (F-<br />
5), having previously been acceptance tested for the Galileo and Ulysses missions, was<br />
subjected to a reduced set of acceptance tests in preparation for the Cassini mission.<br />
These tests did not include dynamic testing. (F-5 was subjected to a one-time low level<br />
dynamic test at the request of JPL which argued that it served to confirm that the response of<br />
the component engineering test (CET) dynamic model did correspond to the response of an<br />
actual RTG and that the response of F-5 had not materially changed since its acceptance<br />
test.)<br />
Each RTG was subjected to dynamic acceptance tests in the sequence summarized in<br />
Table 5.2.2.-1. Functional performance tests performed before and after dynamic testing,<br />
and measurements of internal resistance, open circuit voltage, power output, and insulation<br />
5-20
Final Technical Report<br />
GPHS-RTGs for the Cassini Mission<br />
Lockheed Martin <strong>Document</strong> No. RR18<br />
August 1998<br />
resistance performed before and after each change in axis or environment confirmed, in<br />
each case, that no damage to the RTGs resulted from these dynamic environments.<br />
Table 5.2.2-1. Vibration Test Sequence Summary<br />
Test No. Axis Environment Duration<br />
1 Y 1/2 g Sine Sweep 10-2000 Hz, 2 Oct/Min<br />
2 Y FA Random 1 Minute at 0 dB<br />
3 Y FA Transients 1 Pulse at 0 dB<br />
4 Frequencies<br />
4 Y 1/2 g Sine Sweep 10-2000 Hz, 2 Oct/Min<br />
5 Z 1/2 g Sine Sweep 10-2000 Hz, 2 Oct/Min<br />
6 Z FA Random 1 Minute at 0 dB<br />
7 Z FA Transients 1 Pulse at 0 dB<br />
4 Frequencies<br />
8 Z 1/2 g Sine Sweep 10-2000 Hz, 2 Oct/Min<br />
Random and transient environments as defined in Specification 23009150.<br />
Response to sine and random vibration is summarized in Tables 5.2.2-2, 5.2.2-3, and<br />
5.2.2-4 for RTGs F-2, F-6, and F-7, respectively. These tables show measured frequencies<br />
and transmissibilities (amplification factors) for instrumented locations on the RTGs: at<br />
midspan, and on the PRD. Overall, the responses were comparable on all three RTGs. The<br />
similarity of responses in pre-test and post-test sine sweeps is a good indication that no<br />
damage or permanent distortion occurred in any of the RTG structural members as a result<br />
of being subjected to the dynamic environment.<br />
Flight Acceptance (FA) level random vibration tests were performed in the lateral and<br />
longitudinal axes of the RTG. The tests were begun at -15 dB test level and the test levels<br />
were increased in 3 dB increments until the 0 dB test level was achieved. The random<br />
vibration tests were controlled by the average power spectral density response of the four<br />
in-axis accelerometers attached to the RTG interface mounting plate. For all tests, the<br />
applied Random spectra were within the ±3 dB test tolerance abort limits of the defined<br />
environment. No significant changes in the dynamic characteristics or electrical<br />
performance occurred during or after the random tests.<br />
5-21
Final Technical Report<br />
GPHS-RTGs for the Cassini Mission<br />
Lockheed Martin <strong>Document</strong> No. RR18<br />
August 1998<br />
Table 5.2.2-2. Random Vibration Test Result Summary for RTG F-2<br />
Pre-Test<br />
Sine Sweep<br />
(1/2 g) Random<br />
Post Test<br />
Sine Sweep<br />
(1/2 g)<br />
Location Mode Freq. q Freq. 0 Freq. 0<br />
(Hz) (Hz) (Hz)<br />
Midspan Y Axis First 48.7 3.03 40.2 2.50 48.2 3.44<br />
Second 227 1.81 226 1.29 221 1.61<br />
PRD Y Axis First 51.6 6.26 44.1 4.57 50.9 6.97<br />
Second 215 3.23 227 2.29 223 2.79<br />
Third - 469 2.73 - -<br />
PRD Z Axis First 188 2.85 - -<br />
Second 307 14.8 312 5.88 306 14.9<br />
Third 426 22.9 412 8.76 407 20.8<br />
Table 5.2.2-3. Random Vibration Test Result Summary for RTG F-6<br />
Location<br />
Mode<br />
Pre-Test<br />
Sine Sweep<br />
(1/2 g) Random<br />
Post Test<br />
Sine Sweep<br />
(1/2 g)<br />
Freq. q Freq. 0 Freq. 0<br />
(Hz) (Hz) (Hz)<br />
Midspan Y Axis First 50.8 3.20 48.0 2.40 50.6 3.47<br />
Second 210 1.60 205 1.43 205 1.50<br />
PRD Y Axis First 51.9 7.40 48.0 4.70 51.4 7.35<br />
Second 210 2.50 202 2.66 208 2.85<br />
Third - - 490 2.49 - -<br />
PRD Z Axis First 144 2.00 182 3.0 135 2.05<br />
Second 370 14.9 310 4.42 330 13.0<br />
Third 430 32.8 405 9.83 420 29.0<br />
5-22
04<br />
Final Technical Report<br />
GPHS-RTGs for the Cassini Mission<br />
Lockheed Martin <strong>Document</strong> No. RR18<br />
August 1998<br />
Table 5.2.2-4. Random Vibration Test Result Summary for RTG F-7<br />
Pre-Test<br />
Sine Sweep<br />
(1/2 g) Random<br />
Location Mode Freq. a Fr eq.<br />
Freq.<br />
(Hz) (Hz) Q (Hz)<br />
Post Test<br />
Sine Sweep<br />
(1/2 g)<br />
Midspan Y Axis First 49.0 3.00 45.8 2.36 48.8 3.27<br />
Second 223 1.44 210 1.16 208 1.13<br />
a<br />
PRD Y Axis First 52.2 6.69 48.1 4.62 52.6 7.23<br />
Second 230 2.34 208 2.21 210 1.80<br />
Third — — 461 2.252 — —<br />
PRD Z Axis First 152 2.27 204 2.81 149 2.25<br />
Second 336 21.1 378 7.05 335 13.8<br />
Third 399 29.7 406 8.77 399 30.0<br />
Flight Acceptance level Transient tests were also performed in the lateral and longitudinal<br />
axes of the RTG. All of the Transient pulses were within the ±2% tolerance limit of the<br />
required pulse frequencies. The Shock Response Spectrum (SRS) for each FA pulse met<br />
the requirement that harmonic distortion at frequencies above the fundamental frequency<br />
be at least 6 dB below the shock spectrum amplitude at the pulse fundamental frequency.<br />
The first and second lateral modes observed on RTGs F-2, F-6, and F-7 were very similar to<br />
those previously observed for other RTGs, except that the frequencies were about 10%<br />
lower than those observed during testing for the Galileo/Ulysses program. This can be<br />
attributed to the extra flexibility of the fixturing, a result of incorporating load measuring<br />
capability. (Load cells were incorporated in the fixture to enable dual-mode testing, a<br />
technique proposed by JPL, but not adopted.)<br />
Force measurements were made during dynamic testing for Engineering information only.<br />
In general, the force data are somewhat consistent with the acceleration data in that the<br />
peaks are coincident. However, neither the PRD nor the inner moly frame responses were<br />
obvious in the force data, nor is it clear that the heat source response can be readily<br />
5-23
Final Technical Report<br />
GPHS-RTGs for the Cassini Mission<br />
Lockheed Martin <strong>Document</strong> No. RR18<br />
August 1998<br />
separated from that of the rest of the RTG in the absence of any internal instrumentation.<br />
Again, the similarity of responses in pre-test and post test sine sweeps, in this case as<br />
indicated by force measurements, is a good indication that no damage or permanent<br />
distortion occurred in any of the RTG structural members as a result of being subjected to<br />
the dynamic environment.<br />
No significant changes in the parameters that define electrical performance were observed<br />
during the course of dynamic testing. Changes in internal resistance were acceptably low,<br />
no more than one milliohm, whereas an open thermoelectric couple might be expected to<br />
cause a change in internal resistance of at least eight milliohms.<br />
A minor test anomaly was observed, similarly on all three RTGs, when the 3.78 g input level<br />
slightly exceeded that maximum specified environment during the Z-axis 15.75 Hz transient.<br />
This deviation was still well below the 6.0 g nominal FA level which was used for<br />
acceptance testing of the GPHS-RTG for the Galileo and Ulysses missions.<br />
Additional information on vibration acceptance testing may be found in the following<br />
documentation:<br />
1. "F-2 Engineering Report," (B.3 Topical Report), Lockheed Martin Missiles and Space<br />
<strong>Document</strong> GESP-7249, 22 November 1996.<br />
2. "F-6 Engineering Report," (B.3 Topical Report), Lockheed Martin Missiles and Space<br />
<strong>Document</strong> GESP-7251, 7 March 1997.<br />
3. "F-7 Engineering Report," (B.3 Topical Report), Lockheed Martin Missiles and Space<br />
<strong>Document</strong> GESP-7250, 24 January 1997.<br />
5.2.3 Magnetic Testing<br />
Magnetic measurements were performed as part of acceptance testing on the three flight<br />
unit RTGs, F-2, F-6, and F-7, as well as on the flight spare F-5.<br />
Measurements were made with the RTG in two different positions: in Position 2 (-y axis up),<br />
readings were taken in the x-z plane of the RTG and in Position 5(-x axis up), readings were<br />
taken in the y-z plane. Three triaxial probes were used, all at a distance of 1.5 m from the<br />
geometric center of the RTG; Probe No. 1 above the table, Probe No. 2 at table level, and<br />
5-24
Final Technical Report<br />
GPHS-RTGs for the Cassini Mission<br />
Lockheed Martin <strong>Document</strong> No. RR18<br />
August 1998<br />
probe No. 3 below the table. In accordance with test specifications, only data from probes<br />
located at table level in the horizontal plane through the RTG center of gravity were used for<br />
comparison with acceptance criteria. (The X, Y and Z designations for the axes of each<br />
probe were fixed with respect to the test cell, and are not related to the RTG X, Y, and Z<br />
coordinate axes.) Measurements were made by rotating the RTG through 360° past the<br />
probes, recording every 10°.<br />
A total of 12 test runs were performed on each RTG, six in Position 2 and six in Position 5.<br />
To compensate for drift of the ambient field during the test, the magnetic field strength<br />
amplitude was recorded as the maximum reading, minus the minimum reading, divided by<br />
two. For each magnetometer (identified by the probe number and axis of the<br />
magnetometer), the maximum of the six runs was recorded. For comparison with<br />
acceptance criteria, this value was then normalized to rated current and to a distance of one<br />
meter. Rated current was taken as the estimate of current at the time of Saturn Orbit<br />
Insertion (S01). The results are summarized in Table 5.2.3-1.<br />
Table 5.2.3-1. Summary of Magnetic Testing<br />
F-2 F-5 F-6 F-7<br />
Date of Test 5/23/96 9/13/95 1/15/97 10/23/96<br />
Magnetometer Identification 2X 2X 2X 2X<br />
Current during Test, amps 9.15 7.147 — —<br />
Current at SOI, amps 8.3 8.63 8.2 8.2<br />
Maximum Magnetic Field Strength (nT)<br />
As Measured 23.2 16.7 — —<br />
Normalized to One Meter 78.4 56.3 — —<br />
Normalized to Rated Current 71.2 68.1 127.8 122.3<br />
Specification Requirement 78 78 78 78<br />
Note: Data listed in Table 4-10 of GESP-7250 was for F-2 and was incorrectly identified as<br />
applicable to F-7.
Final Technical Report<br />
GPHS-RTGs for the Cassini Mission<br />
Lockheed Martin <strong>Document</strong> No. RR18<br />
August 1998<br />
A review of the magnetic test measurements showed that there were fundamental<br />
differences in the characteristics of RTGs F-6 and F-7, the two units that were assembled as<br />
ETGs and RTGs on the Cassini RTG program, as compared with RTGs F-2 and F-5,<br />
previously assembled for the Galileo and Ulysses missions. The peak magnetic field was<br />
measured in Position 2, on probe 2X on all RTGs. However, on RTGs F-6 and F-7, the<br />
maximum field strength far exceeded the specification limit of 78 nT, and on F-6 that limit<br />
was also exceeded on probe 2X in Position 5.<br />
Additional runs were made of magnetic measurements, a total of 22 on both F-6 and F-7.<br />
Rather than use the maximum field strength measured for any one test run, as was the<br />
practice agreed upon for F-2 and F-5, the probe readings were averaged for all the runs<br />
with closed circuit for each RTG. Readings during all these runs did not vary significantly,<br />
not to the extent that any one test reading could be discarded. In addition, the first and last<br />
readings for each probe were compared against each other to verify that the background<br />
fields did not drift appreciably.<br />
Analysis of the magnetic measurements by JPL and ESA showed that the anomalous<br />
magnetic field of RTG F-6, as on F-7, was due to a significant permanent moment located<br />
near the inboard end. All suspect components, such as the gas management valve and the<br />
electrical connectors, were checked and found to have no significant magnetic field. A set<br />
of three spring washers, fabricated from PH17-4 corrosion resistant steel, taken from the<br />
same fabrication lot as those used in F-6 and F-7, were also checked and found to have no<br />
significant magnetic field. At first it was thought that there was some significance in the fact<br />
that RTGs F-6 and F-7 were the only units to not undergo degaussing prior to magnetic<br />
measurements. However, records showed that F-2, when tested as an ETG, showed no<br />
significant magnetic field in the as-built condition, and showed no change after degaussing.<br />
The acceptance criteria for magnetic measurements was based on the assumption that the<br />
measured field is entirely current-induced, and could be represented as a pure dipole with a<br />
field that decreases inversely with the cube of the distance from the RTG. These<br />
assumptions were obviously not valid for RTGs F-6 and F-7, and the field strengths<br />
calculated using these assumptions were not meaningful. JPL and ESA analyzed the data<br />
5-26
Final Technical Report<br />
GPHS-RTGs for the Cassini Mission<br />
Lockheed Martin <strong>Document</strong> No. RR18<br />
August 1998<br />
by first separating the permanent field from the current-induced. When the field strength<br />
was calculated by this method, it was estimated to be 80 nT at 1 meter for RTG F-6, with an<br />
uncertainty of ±4 nT. JPL therefore concluded that the field measured on RTG F-6 was<br />
acceptable, without the need for installing compensating magnets. (Specification<br />
PS23009148 allows the magnetic field requirement to be met "with or without"<br />
compensating magnetics.) Accordingly, JPL prepared a waiver to the magnetic field<br />
requirements for RTG F-6. By the same analysis, JPL showed that field strength on RTG F-7<br />
was 74 nT, thereby meeting specification requirements. Further, JPL has been able to<br />
demonstrate analytically that by clocking of the RTGs on the spacecraft, acceptable<br />
magnetic fields can be obtained at both spacecraft magnetometers.<br />
5.2.4 Mass Properties<br />
Mass properties were measured on all of the RTG flight units, F-2, F-6, and F-7, as well as<br />
the spare RTG F-5. After subtraction of the mass of the ground support equipment, fixtures,<br />
and other non-flight items that were attached to the RTG during weighing, the flight mass for<br />
each RTG was determined to be as summarized in Table 5.2.4.-1. All units were within the<br />
specification limit of 125.0 lb. In addition, the requirement that all units are within 1% was<br />
also satisfied.<br />
Table 5.2.4-1. Flight Unit Mass Comparison<br />
Flight Mass<br />
Difference from<br />
Lightest Unit<br />
Unit (Ib) (Ib) (%)<br />
F-2 124.16 0.82 0.7<br />
F-5 123.34 - -<br />
F-6 124.48 1.14 0.9<br />
F-7 124.62 1.28 1.0<br />
Center of mass was also determined for each RTG, including corrections in translating the<br />
reference coordinates from the measuring apparatus to the RTG spacecraft interface, and<br />
corrections for non-flight hardware in place at the time of measurement.
Final Technical Report<br />
GPHS-RTGs for the Cassini Mission<br />
Lockheed Martin <strong>Document</strong> No. RR18<br />
August 1998<br />
The specification requirement is that the center of mass of all units lie within a right circular<br />
cylinder, 0.64 cm (0.25 in.) in diameter by 1.27 cm (0.5 in.) long. Table 5.2.4-2 summarizes<br />
the data for all flight units. The envelope is shown to be a cylinder that is 0.14 in. diameter,<br />
0.02 in. long, satisfying the specification requirement.<br />
Table 5.2.4-2. Flight Unit Center of Mass Comparison<br />
Unit<br />
X<br />
(in)<br />
Y<br />
(in)<br />
Z<br />
(in)<br />
Difference along<br />
X Axis<br />
(in)<br />
F-2 0.045 0.058 -21.003 .013<br />
F-5 0.022 0.041 -20.997 .007<br />
F-6 0.031 0.045 -20.99 -<br />
F-7 0.023 0.038 -21.009 .019<br />
Envelope: Diameter = 2 (.0452 + .0582) 1 /2 = 0.14 in.<br />
Length = 0.02 in.<br />
5.2.5 Thermal Vacuum Tests<br />
Following dynamic tests, the RTGs were subjected to thermal vacuum tests in accordance<br />
with specification PS23009148. Specification requirement was a power output of 293 watts<br />
at the RTG pins for RTGs F-6 and F-7 (at a 4410 watt fuel load) 291 watts for F-2 (4410 watt<br />
fuel load) and 255 watts for F-5 (4100 watt fuel load). The required power is to be delivered<br />
at a voltage of 30 +0.7/-0.5 volts. Also specified was the requirement that the isolation<br />
resistance between the thermopile circuit and the outer shell be 1,000 ohms minimum. All<br />
RTGs met the requirements.<br />
A summary of flight unit thermal vacuum test data is given in Table 5.2.5-1. Four values of<br />
power output are shown. "Measured power" is the power at the voltage tap location in the<br />
cable; "Corrected to pins " was calculated using the measured current and a 20 milliohm<br />
connector contact resistance to obtain the power where the specification applied;<br />
"normalized power" was at the pins and adjusted for a 4410 watt fuel inventory; the final<br />
power is the normalized power increased by 3 watts to take into account the Gas<br />
Management Valve(GMV) vent effect. This adjustment took into account the fact that the<br />
RTGs were vented through the GMV system which is more restrictive than the flight PRD.<br />
5-28
Table 5.2.5-1. Flight Unit Thermal Vacuum Performance<br />
Final Technical Report<br />
GPHS-RTGs for the Cassini Mission<br />
Lockheed Martin <strong>Document</strong> No. RR18<br />
August 1998<br />
I F-2 F-5 F-6 I F-7<br />
Date 3/6/96 10/5/95 2/8/97 11/21/96<br />
Heat Input (watts) 4416.5 4091.1 4429.7 4427.7<br />
Power Output (watts)<br />
As Measured 297.2 254.6 295.2 296.6<br />
Corrected to Pins ( 1 ) 299.2 256.0 (3 ) 297.2 300.6<br />
Normalized (2) to 4410W Input 298.4 257.1 294.8 298.5<br />
With GVM Vent Correction (3W) 301.4 260.1 297.8 301.5<br />
Requirement 291 255 293 293<br />
Load Voltage (volts) 30+0.7/-0.5 30.018 30.033 29.95 29.979<br />
Open Circuit Voltage (volts) 52.093 50.279 51.878 52.338<br />
Current (amps) 9.801 8.479 8.857 9.960<br />
Internal Resistance (ohms) 2.229 2.387 2.225 2.245<br />
Average RTG Temperature (°C) 243.9 236.4 245.2 246.1<br />
Requirement 1.0<br />
Chamber Pressure (torr) 9.8 x 10⁻⁷ 8 x 10⁻⁷ 5.4 x 10⁻⁷ 7.4 x 10⁻⁷<br />
Average Sink Temperature (°C) 26.7 35.8 33.1 27.9<br />
Corrected = Measured +0.02 1 2<br />
Normalized using 0.12W electric per thermal watt input; F-5 normalized to 4100W<br />
Power still increasing at end of test; 258W estimated final power<br />
The residual gas pressure resulted in an increase in thermal conductance of the foil<br />
insulation system and subsequently a loss of some power. Experience in the MHW<br />
converters showed this to be about 0.6% to 1.0% of the measured power. This same<br />
percentage was applied to the Cassini RTGs resulting in a power increase of 1.8 to 3.0<br />
watts.<br />
5-29
Final Technical Report<br />
GPHS-RTGs for the Cassini Mission<br />
Lockheed Martin <strong>Document</strong> No. RR18<br />
August 1998<br />
F-2 RTG<br />
Chamber evacuation was started on 3 September 1996. It took 45 minutes to reach 0.1 torr<br />
from atmospheric pressure. Venting of the RTG internal argon/helium gas mixture through<br />
the GMV was initiated at 0633 on 4 September 1996.<br />
Stability criteria were met at 0100 on 5 September. The 30 volt stability test was completed<br />
at 0700 on 6 September. Table 5.2.5-2 summarizes the vacuum performance. Measured<br />
power output was 297.2 watts with a fuel loading of 4416.5 watts. The power trend shown<br />
in Figure 5.2.5-1 shows that stability was reached. The correction for the connector contact<br />
resistance (20 milliohms) raises the power to 299.2 watts at the RTG power pins.<br />
Normalization to a 4410 watt thermal input reduces power to 298.4 watts. A final correction<br />
of 3 watts is added to account for the more restrictive venting of the GMV relative to the flight<br />
PRD. The corrected normalized power output is therefore 301.4 watts. This exceeds the<br />
specification requirement of 291 watts by 10 watts. The RTG internal resistance trend<br />
shown in Figure 5.2.5-2 exhibits normal behavior.<br />
Table 5.2.5-2. F-2 Thermal Vacuum Test<br />
Date 9/6/96<br />
Hour 0700<br />
Heat Input, (watts) 4416.5<br />
Power Output, (watts) As Measured 297.2<br />
Corrected to RTG Pins, (watts) 299.2<br />
Normalized to 4410W (watts) 298.4<br />
With GMV Vent Correction (3w) (watts) 301.4<br />
Load Voltage, (volts) 30.018<br />
Open Circuit Voltage, (volts) . 52.093<br />
Current, (amps) 9.901<br />
Internal Resistance, (ohms) 2.229<br />
Average RTD Temperature, (°C) 243.9<br />
Insulation Resistance, (k-ohms)<br />
Thermopile to Case (2 minute) 3.73<br />
Chamber Pressure, (Torr) 9.85 x 10⁻⁷<br />
Average Sink Temperature, (°C) 26.7<br />
* Normalized using 0.12 watt electric per thermal watt input<br />
5-30
Final Technical Report<br />
GPHS-RTGs for the Cassini Mission<br />
Lockheed Martin <strong>Document</strong> No. RR18<br />
August 1998<br />
320<br />
310<br />
300<br />
290<br />
is. goo prosscocoxo%<br />
.<br />
, •<br />
• •<br />
280<br />
270<br />
260<br />
250<br />
240<br />
Y<br />
()<br />
0<br />
230<br />
220<br />
20 30 40 50 60 70 80<br />
TIME HOURS<br />
Figure 5.2.5-1. F-2 Measured Power during Vacuum Testing<br />
2.5<br />
2.4<br />
cn<br />
7I<br />
0<br />
1<br />
L.,<br />
o<br />
N<br />
(71<br />
cc<br />
_..1<br />
<<br />
z<br />
cc<br />
w<br />
,<br />
2.3<br />
2.2<br />
2.1<br />
0<br />
0<br />
0 0<br />
C)0<br />
-00 • • • ••<br />
2.0<br />
20 30 40 50 63<br />
TIME HOURS<br />
1<br />
1<br />
]<br />
1<br />
I<br />
i<br />
1<br />
-- I<br />
-I<br />
I<br />
70 80<br />
0<br />
Figure 5.2.5-2. F-2 Measured Internal Resistance during Thermal Vacuum Testing<br />
5-31
Final Technical Report<br />
GPHS-RTGs for the Cassini Mission<br />
Lockheed Martin <strong>Document</strong> No. RR18<br />
August 1998<br />
5000<br />
4800<br />
.<br />
' 0<br />
-<br />
u1<br />
M<br />
I<br />
0 1<br />
L...1<br />
(....)<br />
z<br />
.--<br />
cr)<br />
(7)<br />
cc<br />
w<br />
cc<br />
z<br />
0<br />
< _,<br />
o<br />
(r)<br />
4600<br />
4400<br />
4200<br />
4000<br />
3800<br />
3600<br />
.<br />
V<br />
0<br />
0<br />
0<br />
0<br />
0<br />
00<br />
0<br />
00 0)<br />
4,^)—<br />
I ''''-)C\.) 3 _ .1—<br />
3030 =33:033.330,3.2 ,-)<br />
.<br />
1<br />
3400<br />
3200<br />
3000<br />
20<br />
30 40 50 60 70 60<br />
TIME HOURS<br />
Figure 5.2.5-3. F-2 Measured Isolation Resistance during Thermal Vacuum Testing<br />
Carbon Monoxide Partial Pressure and Generation Rate<br />
Since carbon monoxide and nitrogen both are mass 28, there is always an ambiguity in gas<br />
samples analyzed by mass spectroscopy. Since nitrogen concentration may be an<br />
indication of air leakage it is useful to be able to distinguish between the two gases.<br />
An RGA (residual gas analyzer) was added to the thermal vacuum chamber to enable an<br />
estimation of the CO partial pressure, and controlled leak rate calibration runs were made to<br />
determine the RGA fragmentation patterns for CO and nitrogen. From the calibration runs it<br />
was determined that an upper limit on the CO partial pressure can be obtained by<br />
multiplying the mass 12 partial pressure by 28.8. At the end of the stability test and during<br />
most of the test, mass 12 was below the detection limit of 1x10 -10 torr. This indicated a CO<br />
partial pressure of less than 3 x l0 -9 torr in the vacuum chamber. The net vacuum system<br />
pumping speed was determined to be 4100 liters/second from a CO controlled leak rate<br />
test. From the vacuum system pumping speed and the upper limit estimate of the CO partial<br />
pressure, an upper limit on the CO generation rate was calculated as 0.66x10 -9<br />
moles/second. This was in good agreement with the expected generation rate range of<br />
0.35x10 -9 to 1 x 10⁻⁹ moles/second that was documented in pre-test predictions.<br />
5-32
F-5 RTG<br />
Final Technical Report<br />
GPHS-RTGs for the Cassini Mission<br />
Lockheed Martin <strong>Document</strong> No. RR18<br />
August 1998<br />
Chamber evacuation was started on 2 October 1995 at 14:45 and venting of the RTG<br />
internal argon/helium gas mixture through the GMV was initiated 17 hours later at 07:37 on<br />
3 October. The stability criteria were met and final data at 30 volts were recorded at 07:00<br />
on 5 October. Table 5.2.5-3 summarizes the vacuum performance. Power output<br />
normalized to 4,100 watts was 257.1 watts compared to the specification requirement of 255<br />
watts.<br />
Table 5.2.5-3. F-5 Thermal Vacuum Test<br />
Date 5/22/85 10/5/95<br />
Hour 0830 0700<br />
Heat Input, watts 4443.5 4091.1<br />
Power Output, watts<br />
As Measured 305.2 254.6<br />
Corrected 307.3 256.0<br />
Normalized to 4410W input 303.3<br />
Normalized to 4100W input 257.1<br />
Load Voltage, volts 30.030 30.033<br />
Open Circuit Voltage, volts 52.310 50.279<br />
Current, amps 10.164 8.479<br />
Internal Resistance, ohms 2.191 2.387<br />
Average RTD Temperature, °C 243.6 236.4<br />
Insulation Resistance, k-ohms<br />
Thermopile to Case<br />
(2 minute) 8.508 29.3<br />
Chamber Pressure, torr 8 X 10⁻⁷ 2.48 x 10⁻⁷<br />
Average Sink Temperature, °C 35.8 25.5<br />
* Normalized using 0.1 2 watt electric per thermal watt input.<br />
Power output was still rising very slowly at the end of the test, as shown in Figure 5.2.5-4,<br />
due to the gradual decrease in the helium release rate from the fuel matrix and dopant<br />
redistribution effects within the thermoelectric elements. Curve fits, as indicated by the two<br />
lines in Figure 5.2.5-4, were used to extrapolate the data to steady state conditions.<br />
Extrapolated power was determined to be in the range 257-260 watts.<br />
5-33
Final Technical Report<br />
GPHS-RTGs for the Cassini Mission<br />
Lockheed Martin <strong>Document</strong> No. RR18<br />
August 1998<br />
270<br />
II III I<br />
r i ----r r III<br />
260<br />
OCTOBER 1995<br />
- - - - - - - - - -<br />
_ - -<br />
- _<br />
a_<br />
250<br />
240<br />
•<br />
"<br />
V<br />
V<br />
REQUIREMENT (255 WATTS)<br />
- - - - CURVE FIT (25 TO 46 HOURS)-<br />
—CURVE FIT (10 TO 46 HOURS)<br />
0<br />
230<br />
Ld<br />
0<br />
a_<br />
220<br />
V<br />
V<br />
210<br />
-4,_,m1 1 dm, I ..,d,,.........,1 1 Li I I I ,<br />
200<br />
0 10 20 30 40 50 60 70 80 90 100 110 120 130 140 150<br />
TIME HOURS<br />
Figure 5.2.5-4. RTG Power vs. Time Rise<br />
The previous thermal vacuum test was conducted in May of 1985 and, in the interim, a large<br />
amount of helium was stored in the fuel. This was evident from the pressure rise test run at<br />
the end of thermal vacuum testing. In this test the GMV was closed and the RTG internal<br />
pressure and power output were recorded. Figure 5.2.5-5 shows the pressure rise for both<br />
tests. The rise was much more rapid in the 1995 test. The test, which is normally run for two<br />
hours, was terminated after 50 minutes when the pressure exceeded 300 microns. Power<br />
output trends and power loss for both tests are shown in Figures 5.2.5-6 and 5.2.5-7. The<br />
power decrease was larger in the 1995 test and indicated a larger correction for GMV<br />
venting was appropriate. In the past, when predicting BOM power, a correction of 1.8 to 3.0<br />
watts was added to the measured power output to account for the more restrictive venting<br />
characteristic of the GMV compared to a flight PRD.<br />
5-34
Final Technical Report<br />
GPHS-RTGs for the Cassini Mission<br />
Lockheed Martin <strong>Document</strong> No. RR18<br />
August 1998<br />
350 350<br />
I 1 , I , , I 1 I I I<br />
300 - OCTOBER 1995 - 300<br />
250 250<br />
(A zow 0./.<br />
/<br />
5 200 - 200<br />
MAY 1985<br />
w<br />
et<br />
D ..---<br />
Ul<br />
Ul<br />
150 -<br />
- 150<br />
a.<br />
c<br />
1–<br />
a<br />
• •<br />
100 • - 10C<br />
•<br />
• • •<br />
•<br />
50<br />
vir<br />
I - 50<br />
ft<br />
0<br />
0<br />
1 I i I I 1 1 I<br />
0<br />
10 20 30 40 50 60 70 80 90 100 110 120<br />
260<br />
TIME MINUTES<br />
Figure 5.2.5-5. Pressure Rise<br />
1 1<br />
310<br />
259<br />
309<br />
258<br />
308<br />
257<br />
307<br />
(n<br />
1–<br />
1–<br />
<<br />
I<br />
D<br />
IL<br />
D<br />
0<br />
ct<br />
1,-1<br />
0<br />
a_<br />
256<br />
C<br />
255<br />
Ifuora—c, ..___0_ ,_._<br />
LI o<br />
254<br />
253<br />
'<br />
1995 TEST<br />
• •<br />
1985 TEST<br />
•<br />
-<br />
■ri<br />
306 cnc°<br />
–<br />
.<br />
,....<br />
V)<br />
305 I.= a<br />
a<br />
304 1--1<br />
0<br />
a.<br />
303<br />
252<br />
302<br />
251<br />
301<br />
250<br />
0<br />
1 1 , 1 1 I I I 1<br />
10 20 30 40 50 60 70 80 90 100 110<br />
TIME MINUTES<br />
Figure 5.2.5-6. GMV Closed Power Loss<br />
300<br />
120<br />
5-35
Final Technical Report<br />
GPHS-RTGs for the Cassini Mission<br />
Lockheed Martin <strong>Document</strong> No. RR18<br />
August 1998<br />
4.0<br />
, , I ■ , , ■ ,<br />
3.5<br />
3.0<br />
. .<br />
2.5<br />
2.0<br />
1.5<br />
.<br />
.<br />
1995 TEST<br />
/<br />
6•<br />
/<br />
•<br />
/<br />
•<br />
1985 TEST<br />
.<br />
.<br />
1.0<br />
/.<br />
/•<br />
.<br />
,/,------<br />
61<br />
0.5<br />
..--<br />
•<br />
'<br />
.<br />
._...<br />
o.o( ap.,-••,<br />
I I I<br />
I 1 ? 1 1<br />
0 10 20 30 40 50 60 70 80 90 100 110 120<br />
TIME MINUTES<br />
Figure 5.2.5-7. Power Loss after GMV Closed<br />
Dopant redistribution effects, resulting from 10 years of low temperature storage, were<br />
evident from the internal resistance trend shown in Figure 5.2.5-8. The internal resistance<br />
showed a decrease as the dopant was going back into solution in certain regions of the<br />
thermoelements. The resistance had not quite reached the minimum when the test was<br />
terminated. The long term trend in SiGe alloys was an increase in resistance and a<br />
decrease in power output as the dopants precipitated from solution, so that a resistance<br />
upturn would have been observed if the test had been run longer. However, the test was<br />
terminated when all test objectives were met.
Final Technical Report<br />
GPHS-RTGs for the Cassini Mission<br />
Lockheed Martin <strong>Document</strong> No. RR18<br />
August 1998<br />
2.70<br />
I I I r r 1<br />
2.65<br />
)<br />
2.60<br />
2.55<br />
2.50<br />
O<br />
O<br />
0<br />
0<br />
0<br />
0<br />
0 OCTOBER 1995<br />
.<br />
2.45<br />
2.40<br />
...ft tn^r,,<br />
ti;<br />
2.35<br />
2.30<br />
0<br />
t I 1 I t 1 t 1 I<br />
10 20 30 40 50 60 70 80 90 100<br />
TIME HOURS<br />
Figure 5.2.5-8. F-5 Internal Resistance during Thermal Vacuum Testing<br />
The measured performance at 30 volts including the internal resistance and open circuit<br />
voltage were used in conjunction with the RTG performance computer program to calculate<br />
the current-voltage-power characteristic over the range from 20 to 35 volts.<br />
RTG F-5 had also been tested in May 1985 when it was part of the Galileo RTG program. A<br />
comparison of test data is given in Table 5.2.5-3. As previously discussed, the power<br />
output was still drifting up at the end of the 1995 test and 2 watts were added to account for<br />
this. Power output degraded by 49.3 watts or 16 %. Of this, approximately 42.3 watts was<br />
due to fuel decay. The remaining 7 watts or 2.3 % loss is due to dopant precipitation effects<br />
during the 10 years of storage. This is in good agreement with storage models which<br />
predicted up to 9 watts power loss for the 12 year period from 1985 to the 1997 launch.<br />
Figure 5.2.5-9 shows the voltage -power characteristic curves for both the 1985 and 1995<br />
tests. Maximum power occurred very close to 30 volts in both cases.<br />
5-37
Final Technical Report<br />
GPHS-RTGs for the Cassini Mission<br />
Lockheed Martin <strong>Document</strong> No. RR18<br />
August 1998<br />
320 320<br />
PO VER ORRI CTED TO laG PINS 5 -23-1995<br />
310 171214 - NA I 310<br />
300 300<br />
290 290<br />
z<br />
280 280<br />
270 270<br />
10-5-19)5 (2 WAI I'S DED OR TABU ITY)<br />
094 ATTh<br />
260 260<br />
250 250<br />
240 77' 240<br />
F-6 RTG<br />
230 “4- '<br />
20 21 22 23 24 25 26 27 28 29 30 31 32 33 34 35 36<br />
LOAD VOLTAGE-VOLTS<br />
Figure 5.2.5-9. F-5 Power Vs. Voltage<br />
Chamber evacuation was started at 1515 hours on 4 February 1997. Time to reach 0.1 torr<br />
was 50 minutes. Venting of the RTG internal argon/helium gas mixture through the GMV<br />
was initiated at 0650 on 5 February.<br />
Stability criteria were met at 0300 on 6 February. The 30 volt stability test was completed at<br />
1600 on 7 February, however, stability testing was extended to 0600 on 8 February and the<br />
later data are listed. Table 5.2.5-4 summarizes the vacuum performance. Measured power<br />
output was 295.0 watts with a fuel loading of 4429.7 watts. The power trend shown in<br />
Figure 5.2.5-10 showed that stability was reached. The correction for the connector contact<br />
resistance (20 milliohms) raised the power to 297.0 watts at the RTG power pins.<br />
Normalization to a 4410 watt thermal input reduced power to 294.6 watts. A final correction<br />
of 3 watts was added to account for the more restrictive venting of the GMV relative to the<br />
flight PRD. The corrected normalized power output was therefore 297.6 watts. This<br />
exceeded the specification requirement of 293 watts by 4.6 watts. The RTG internal<br />
resistance trend shown in Figure 5.2.5-11 exhibited normal behavior.<br />
5-38
Final Technical Report<br />
GPHS-RTGs for the Cassini Mission<br />
Lockheed Martin <strong>Document</strong> No. RR18<br />
August 1998<br />
Table 5.2.5-4. F-6 Thermal Vacuum Test<br />
Date 2/8/97<br />
Hour 06:00<br />
Heat Input, (watts) 4429.6<br />
Power Output, (watts)<br />
As Measured 295.2<br />
Corrected to RTG Pins 297.2<br />
Normalized to 4410W Input 294.8<br />
With GMV Vent Correction (3w) 297.8<br />
Load Voltage, (volts) 29.96<br />
Open Circuit Voltage, (volts) 51.878<br />
Current, (amps) 9.855<br />
Internal Resistance, (ohms) 2.225<br />
Average RTD Temperature, (°C) 245.2<br />
Insulation Resistance, (k-ohms)<br />
Thermopile to Case (2 minute) 6.50<br />
Chamber Pressure, (Torr) 5.4 x 10 -7<br />
Average Sink Temperature, (°C) 33.1<br />
* Normalized using 0. 1 2 watt electric per thermal watt input.<br />
Isolation resistance between the thermoelectric circuit and case was 6,370 ohms at the end<br />
of the stability test, and this exceeded the requirement of a minimum of 1,000 ohms. The<br />
observed performance was as predicted and normal isolation trends were observed as<br />
shown in Figure 5.2.5-12.<br />
5-39
Final Technical Report<br />
GPHS-RTGs for the Cassini Mission<br />
Lockheed Martin <strong>Document</strong> No. RR18<br />
August 1998<br />
320<br />
310<br />
300<br />
290<br />
280<br />
270<br />
260<br />
250<br />
240<br />
230<br />
220<br />
30<br />
40<br />
•<br />
50 60 70 80 90 100 110 120<br />
TIME, HOURS<br />
Figure 5.2.5-10. F-6 Measured Power Output during Thermal Vacuum Testing<br />
2.5<br />
2.4<br />
I— 2.3<br />
Fr)<br />
2.2<br />
Lu<br />
2.1<br />
,<br />
2.0<br />
30 40 50 60 70 80 90<br />
TIME, HOURS<br />
100<br />
110 120<br />
Figure 5.2.5-11. F-6 Measured Internal Resistance during Thermal Vacuum Testing<br />
5-40
Final Technical Report<br />
GPHS-RTGs for the Cassini Mission<br />
Lockheed Martin <strong>Document</strong> No. RR18<br />
August 1998<br />
Figure 5.2.5-12. F-6 Measured Isolation Resistance during Thermal Vacuum Testing<br />
F-7 R T G<br />
Chamber evacuation was started at 1550 on 18 November 1996. In 45 minutes 0.1 torr<br />
was reached. Venting of the RTG internal argon/helium gas mixture through the GMV was<br />
initiated at 0739 on 19 November.<br />
Stability criteria were met at 0100 on 20 November. The 30 volt stability test was completed<br />
at 0800 on 21 November. Table 5.2.5-5 summarizes the vacuum performance. Measured<br />
power output was 298.6 watts with a fuel loading of 4427.7 watts. The power trend shown<br />
in Figure 5.2.5-13 showed that stability was reached. The correction for the connector<br />
contact resistance (20 milliohms) raised the power to 300.6 watts at the RTG power pins.<br />
Normalization to a 4410 watt thermal input reduced power to 298.5 watts. A final correction<br />
of 3 watts was added to account for the more restrictive venting of the GMV relative to the<br />
flight PRD. The corrected normalized power output was, therefore, 301.5 watts. This<br />
exceeded the specification requirement of 293 watts by 8.5 watts. The RTG internal<br />
resistance trend shown in Figure 5.2.5-14 exhibited normal behavior.
Table 5.2.5-5. F-7 Thermal Vacuum Test<br />
Date 11/21/96<br />
Heat Input, (watts) 4427.7<br />
Power output, (watts)<br />
As Measured 298.6<br />
Corrected to RTG Pins 300.6<br />
Normalized to 4410W Input 298.5<br />
with GMV Vent Correction (3w) 301.5<br />
Load Voltage, (volts) 29.979<br />
Open Circuit Voltage, (volts) 52.338<br />
Current, (amps) 9.960<br />
Internal Resistance, (ohms) 2.245<br />
Average RTD Temperature, (°C) 246.1<br />
Insulation Resistance, (k-ohms)<br />
Thermopile to Case (2 minute) 3.44<br />
Chamber Pressure, (Torr)<br />
Final Technical Report<br />
GPHS-RTGs for the Cassini Mission<br />
Lockheed Martin <strong>Document</strong> No. RR18<br />
August 1998<br />
7.4 x 1 0-'<br />
Average Sink Temperature, (°C) 27.9<br />
* Normalized using 0.12 watt electric per thermal watt input.<br />
Isolation Resistance<br />
Isolation resistance between the thermoelectric circuit and case was 3,440 ohms at the end<br />
of the stability test, and this exceeded the requirement of a minimum of 1,000 ohms. During<br />
ETG processing, gaseous species released from the heat source had caused an abnormal<br />
trend in the isolation resistance. Engineering studies addressing causes and mechanisms<br />
were reported in Reference 5-1 and summarized in Section 5.1. A visual inspection of the<br />
interior of the unit was performed on 27 August 1996 after the EHS was removed and prior<br />
to fueling operations. All thermoelectric rows of unicouples were examined for discoloration<br />
and deposits. The Astroquartz cloth on the inside of the multifoil insulation between the hot<br />
shoes was white in color, as installed. The hot shoes had normal grayish color and the<br />
inner moly frame was bright and shiny as installed. There was no evidence of any deposits<br />
or foreign material. Predictions of the isolation trends during the thermal vacuum test were<br />
made in Reference 5-6. The observed performance was as predicted and normal isolation<br />
trends were observed as shown in Figure 5.2.5-15.
Final Technical Report<br />
GPHS-RTGs for the Cassini Mission<br />
Lockheed Martin <strong>Document</strong> No. RR18<br />
August 1998<br />
Figure 5.2.5-13. F-7 Measured Power during Thermal Vacuum Testing<br />
2.5<br />
2.4<br />
2.3<br />
'00c\_, -'ocoor )(70 DOOCCCOOOCCCCO000( )0CCCO000000<br />
2.2<br />
2.1<br />
2.0<br />
20 30<br />
40 50 60 70 80<br />
TIME-HOURS<br />
Figure 5.2.5-14. F-7 Measured Internal Resistance during Thermal Vacuum Testing<br />
5-43
Final Technical Report<br />
GPHS-RTGs for the Cassini Mission<br />
Lockheed Martin <strong>Document</strong> No. RR18<br />
August 1998<br />
5000<br />
4800<br />
0<br />
4600<br />
0<br />
z<br />
4400<br />
4200<br />
0<br />
0<br />
o c )00<br />
Oi 4000<br />
z<br />
0 3800<br />
0<br />
3600<br />
3400<br />
O<br />
O<br />
O<br />
o o 000<br />
O < er.)000000000°°°°°°°<br />
3200<br />
3000<br />
20 30 40 50 60 70 80<br />
TIME-HOURS<br />
Figure 5.2.5-15. F-7 Measured Isolation Resistance during Thermal Vacuum Testing<br />
Carbon Monoxide Partial Pressure and Generation Rate<br />
Following is a discussion of the carbon monoxide gas sample measurements made on RTG<br />
F-7.<br />
A gas sample taken prior to the thermal vacuum test showed 1.83 mole percent N 2/CO.<br />
Subsequent mass spectrometer analysis involving high sensitivity resolution of the mass 28<br />
peaks showed that the composition was 95% CO or 1.7 mole percent CO. Further analysis<br />
was performed to determine the relative isotopic abundance of 0 18 and 0 16 in the CO. This<br />
was done to determine if the oxygen in the CO came from the fuel. The fuel is deliberately<br />
depleted in 0 17 and 0 18 to reduce neutron radiation arising from alpha-neutron reactions.<br />
The analysis compared the mass 28 and mass 30 peaks. The 0 18/0 16 ratio was found to be<br />
0.061%, whereas the natural abundance ratio is 0.204%. This is a depletion factor of 3.3 for<br />
0 18. Calculations show that for this depletion factor, at least 70 percent of the CO in the gas<br />
tap came from the fuel. Mass 28 levels were subsequently closely monitored during the<br />
thermal vacuum test.
Final Technical Report<br />
GPHS-RTGs for the Cassini Mission<br />
Lockheed Martin <strong>Document</strong> No. RR18<br />
August 1998<br />
An RGA was added to the thermal vacuum chamber (prior to F-2 RTG thermal vacuum<br />
testing) to enable an estimation of the CO partial pressure. Controlled leak rate calibration<br />
runs were made to determine the RGA fragmentation patterns for CO and nitrogen since<br />
both are mass 28. From the CO controlled leak test a net vacuum system pumping speed of<br />
4,100 liters/second was determined. From the calibration runs it was determined that an<br />
upper limit on the CO partial pressure can be obtained by multiplying the mass 12 partial<br />
pressure by 28.8. At the end of the stability test and during most of the test, mass 12 was<br />
below the detection limit of 1.0 x 10 -10 torr. This results in a CO partial pressure of less than<br />
3 x 10 -9 torr in the vacuum chamber. From the vacuum system pumping speed and the<br />
upper limit estimate of the CO partial pressure, an upper limit on the CO generation rate was<br />
calculated as 0.66x10 -9 moles/second. This is the same result obtained from RTG F-2<br />
thermal vacuum testing and is in good agreement with the expected generation rate range<br />
of 0.35 x 10 -9 to 1 x 10⁻⁹ as given in Table 1 of Cassini Memo No. 461 (F-2 RTG Predictions<br />
in Thermal Vacuum Test).<br />
The normal CO level observed during the thermal vacuum testing indicated that the high CO<br />
level found in the pre-thermal vacuum gas tap was a residual quantity, generated, stored in,<br />
and released from the heat source and not a continuing generation process. Further<br />
evidence was obtained from a gas tap taken three weeks after the thermal vacuum test,<br />
wherein the mass 28 quantity was less than 0.02%.<br />
5.2.6 RTG Power Projections<br />
Based on the thermal vacuum test results, predictions were made for launch pad<br />
performance and BOM and EOM performance. References 5-3, 5-4, and 5-5 document the<br />
details of the factors taken into account in making the predictions. Launch pad power<br />
predictions considered fuel decay, dopant precipitation, air in-leakage (F-6 only), residual<br />
helium from the argon to xenon gas exchange and helium buildup after the gas exchange.<br />
The predictions allowed for a possible 30-day hold after the scheduled launch date.<br />
Conservative assumptions were made in calculating the pad power. BOM power also had<br />
to consider fuel decay, dopant precipitation, and air in-leakage effects from the time of<br />
thermal vacuum testing to launch. EOM predictions were made using the TEG degradation<br />
5-45
Final Technical Report<br />
GPHS-RTGs for the Cassini Mission<br />
Lockheed Martin <strong>Document</strong> No. RR18<br />
August 1998<br />
model which includes thermal insulation degradation due to sublimation as well as the<br />
normal fuel decay and dopant precipitation effects.<br />
Table 5.2.6-1 shows the conservative launch pad power predictions after a 30-day hold for<br />
the individual RTGs and for the combinations F-2, F-6, F-7 (596 watts) and F-2, F-5, F-6 (559<br />
watts).<br />
Table 5.2.6-1. Launch Pad Power<br />
Pad Power (watts)<br />
RTG Requirement Predicted<br />
F-2<br />
F-6<br />
F-7<br />
F-5<br />
F-2, F-6, F-7<br />
F-2, F-5, F-6<br />
172<br />
174<br />
174<br />
155<br />
520<br />
501<br />
203<br />
188<br />
205<br />
168<br />
596<br />
559<br />
BOM and EOM power predictions are given in Table 5.2.6-2. EOM predictions are shown<br />
for 10.8 and 16 years after launch. Nominal and minimum EOM predictions were made in<br />
the TEG model. The values in Table 5.2.6-2 are the minimum values. (For comparison, the<br />
values listed in parentheses are the corresponding power output requirements as defined in<br />
the RTG Product Specification.) BOM power was predicted to be 888 watts for the<br />
combination F-2, F-6, F-7, and 841 watts for the back-up combination F-2, F-5, F-7. Figures<br />
5.2.6-1 and 5.2.6-2 show the predicted nominal and minimum power for both RTG<br />
combinations throughout the 16 year mission.<br />
Figure 5.2.6-3 shows the predicted minimum total RTG power for the two combinations of<br />
RTGs throughout the 16 year mission and compared to the spacecraft power requirements.<br />
The predictions show that the spacecraft power requirements will be met throughout the<br />
entire mission.
Table 5.2.6-2. Measured and Projected Power Output<br />
Final Technical Report<br />
GPHS-RTGs for the Cassini Mission<br />
Lockheed Martin <strong>Document</strong> No. RR18<br />
August 1998<br />
Electrical<br />
Power Fuel Projected Power<br />
Measured at Thermal (watts)<br />
Acceptance Power at<br />
Tests BOM<br />
Unit (watts)<br />
10.8 Years<br />
(watts)<br />
16 Years<br />
BOM after BOM after BOM<br />
F-2 301.2 4378 296 (274) 231 213 (198)<br />
F-6 299.2 4407 294 (276) 230 212 (199)<br />
F-7 302.6 4397 298 (276) 233 215 (199)<br />
F-5 261 4029 251 (249) 198 183 (182)<br />
F-2, F-6, F-7 13182 888 (826) 694 640 (596)<br />
F-2, F-5, F-6 12814 841 (799) 659 608 (579)<br />
Specification values in parentheses<br />
900<br />
880<br />
860<br />
840<br />
820<br />
800<br />
§' 780<br />
(51 760<br />
w<br />
740<br />
1111 1111 1111 11.11 1111 1111 111'1 1111 11111 11111<br />
PRODUCT SPEC. 826 WATTS AT BOM<br />
0 a. 720<br />
700<br />
680<br />
Nominal<br />
660<br />
Q<br />
Minimum<br />
640<br />
620<br />
PRODUCT SPEC. 596 WATTS AT 16 YEARS<br />
118111.1■1.■111.1[1.11111111111■11,111111■11 ,<br />
600<br />
0 2 4 6 8 10 12 14 16 18<br />
TIME, YEARS<br />
)■IJA<br />
20<br />
Figure 5.2.6-1. F-2, F-6, and F-7 Total Power
•<br />
Final Technical Report<br />
GPHS-RTGs for the Cassini Mission<br />
Lockheed Martin <strong>Document</strong> No. RR18<br />
August 1998<br />
900<br />
880<br />
860<br />
840<br />
820<br />
800<br />
§' 780<br />
CC 760<br />
740<br />
0 720<br />
PRODUCT SPEC. 799 WATTS AT BOM<br />
fp<br />
O<br />
700<br />
680<br />
660<br />
640<br />
620<br />
600<br />
0<br />
Nominal<br />
PRODUCT SPEC. 579 WATTS AT 16 YEARS<br />
Minimum<br />
1 1 111 11 1 1 1111 1 1111111 1111111 11 111111<br />
2 4 6 8 10 12 14 16 18 20<br />
TIME, YEARS<br />
Figure 5.2.6-2. F-2, F-5, and F-6 Total Power<br />
900<br />
800<br />
700<br />
600<br />
. 500<br />
rY<br />
0 ct. 400 4<br />
CRUISE<br />
RTG PREDICTED POWER<br />
F-2, F-6, F-7<br />
F-2, F-5, F-6<br />
■ ■ ■ ■ ■<br />
RSS & Mag<br />
INMS,Fields &<br />
Particles<br />
REMOTE SENSING<br />
300<br />
200<br />
100<br />
z<br />
5<br />
0Is<br />
E<br />
o(CI<br />
5<br />
2 2<br />
To<br />
LL<br />
ar<br />
w<br />
a)<br />
.0<br />
a.<br />
0<br />
0 1 2 3 4 5 6 7 8 9 10 11 12 13 14 15 16 17 18 19 20<br />
11)<br />
o 0 0<br />
2. P!<br />
"rc 0) csi<br />
0<br />
ts<br />
0 N<br />
O O N (Na cu us 0 us us ui<br />
• Of O O<br />
MISSION TIME (YEARS)<br />
Figure 5.2.6-3. Cassini Required Power and RTG Predicted Power<br />
5-48
Flight Telemetry Power<br />
Final Technical Report<br />
GPHS-RTGs for the Cassini Mission<br />
Lockheed Martin <strong>Document</strong> No. RR18<br />
August 1998<br />
The actual Cassini flight configuration consisted of RTGs F-2, F-6, and F-7. Telemetry data,<br />
after correcting for cable losses, showed that measured RTG BOM power output to be 887<br />
watts compared to the predicted value of 888 watts. This is well within the telemetry<br />
accuracy of 1% or 9 watts.<br />
5-49
5.3 QUALIFICATION PROGRAM<br />
Final Technical Report<br />
GPHS-RTGs for the Cassini Mission<br />
Lockheed Martin <strong>Document</strong> No. RR18<br />
August 1998<br />
The GPHS-RTG was previously qualified for the Galileo/Ulysses missions, and was<br />
accepted for the Cassini mission without the need for testing of an additional qualification<br />
unit RTG. The differences between the Galileo/Ulysses and Cassini missions were handled<br />
two ways: (1) differences in the environments were addressed analytically, and (2)<br />
components that were newly designed to meet Cassini mission requirements (PRD) or were<br />
modified in design (RTD cable assembly) were qualified separately as components.<br />
Qualification of the GPHS-RTG for the Cassini mission, as defined by the requirements of<br />
the Product Specification for the GPHS-RTG for Cassini, PS23009148, was based on the<br />
results of analyses, inspections, and tests used to qualify the GPHS-RTG for the<br />
Galileo/Ulysses missions. These were supplemented by analyses, inspections, and<br />
component tests for those instances where the requirements or design definition were<br />
changed for the Cassini mission.<br />
Qualification of the GPHS-RTG for the Cassini mission was documented in report GESP-<br />
7242, "Design Qualification for GPHS-RTG for Cassini," issued 11 August 1995. In this<br />
report, each of the requirements for qualification defined in Specification PS23009148 was<br />
addressed and evidence of verification was provided.<br />
The dynamic environments defined by Specification 23009150 for the Cassini mission differ<br />
slightly from those defined in Specification NS0020-05-04 for the Galileo/Ulysses missions.<br />
To demonstrate that the RTG remained qualified, those differences were addressed<br />
analytically. The following paragraphs discuss differences in transient, random vibration,<br />
acoustic noise, shock, and quasi-static accelerations resulting from significant launch<br />
events.<br />
The transient vibration environment defined for the Cassini mission was slightly less severe<br />
than the Galileo/Ulysses environment to which the RTG was initially qualified. Therefore,<br />
the transient vibration environment was not an issue.<br />
5-50
Final Technical Report<br />
GPHS-RTGs for the Cassini Mission<br />
Lockheed Martin <strong>Document</strong> No. RR18<br />
August 1998<br />
Random vibration environments defined for the Cassini mission differed only slightly from<br />
those defined for the Galileo/Ulysses missions, and are compared at the acceptance test<br />
level in Figures 5.3-1 (lateral axis) and 5.3-2 (longitudinal axis). Notching to limit response<br />
of the inner molybdenum frame and of the heat source support system, as determined<br />
during qualification for the Galileo/Ulysses mission, was retained. The frequency range in<br />
which the Cassini random environments exceeded the Galileo/Ulysses environments<br />
represented the notching intended to protect the PRD. Dynamic testing of the PRD as a<br />
component and low level dynamic testing of the F-5 RTG demonstrated that notching of the<br />
random environment was not required for the barometrically operated PRD designed for the<br />
Cassini mission.<br />
During the RTG qualification program for Galileo/Ulysses, acoustic tests were performed on<br />
the Engineering Unit ETG to demonstrate the capability to withstand the acoustic<br />
environment. The acoustic environment defined for the Cassini mission is compared with<br />
test environments in Figure 5.3-3. It can be seen that the test environment was within a<br />
tolerance band of ±3 dB for frequencies below 400 Hz and then exceeded requirements<br />
above 400 Hz. It was therefore concluded that the RTG remained qualified to the<br />
requirements for dynamic capability under acoustic environments.<br />
0.100<br />
GALILEO/ULYSSES<br />
1 2 5 6 CASSINI<br />
N<br />
9 10<br />
11 .___— _12/<br />
:-..9 7 8<br />
A<br />
rn<br />
a.<br />
3 4<br />
Point Frequency PSD<br />
0.010- (Hz) (G2/Hz) Total GRMS<br />
1 80 0.04 Cassini 4.78<br />
2 170 0.04 Galileo/Ulysses 4.84 -6 dB/Octave<br />
3 205 0.016<br />
4 245 0.016<br />
+6 dB/Octave 5 280 0.04<br />
6 320 0.04<br />
7 352 0.025<br />
8 500 0.025<br />
9 72 0.032<br />
10 180 ' 0.032<br />
11 275 0.032<br />
12 450 0.032<br />
0.001 . . • , ,<br />
10<br />
100 1000<br />
Frequency (I Iz)<br />
Figure 5.3-1. Comparison of Cassini and Galileo/Ulysses Lateral Acceptance Level Random<br />
Vibration Environments<br />
5-51
Final Technical Report<br />
GPHS-RTGs for the Cassini Mission<br />
Lockheed Martin <strong>Document</strong> No. RR18<br />
August 1998<br />
0.100<br />
..<br />
rs<br />
Q<br />
rt.<br />
0.010-<br />
GALILEO/ULYSSES<br />
+6 dB/Octave<br />
Total GRMS<br />
Cassini 4.22<br />
Galileo/Ulysses 3.85<br />
0.001<br />
10<br />
12<br />
Point<br />
1<br />
2<br />
3<br />
4<br />
5<br />
6<br />
7<br />
8<br />
9<br />
10<br />
11<br />
12<br />
13<br />
14<br />
13 14<br />
I--<br />
1 8<br />
2 3<br />
Frequency<br />
(Hz)<br />
60<br />
80<br />
176<br />
192<br />
240<br />
256<br />
352<br />
368<br />
400<br />
480<br />
536<br />
51<br />
380<br />
450<br />
PSD<br />
(G2/Hz)<br />
0.0225<br />
0.016<br />
0.016<br />
0.008<br />
0.008<br />
0.01<br />
0.01<br />
0.024<br />
0.004<br />
0.004<br />
0.023<br />
0.016<br />
0.032<br />
0.032<br />
6<br />
/ 7<br />
4 5<br />
■<br />
■<br />
9 10<br />
ii<br />
CASSINI<br />
,100 1000<br />
Frequency (I Iz)<br />
-6 dB/Octave<br />
Figure 5.3-2. Comparison of Cassini and Galileo/Ulysses Longitudinal Acceptance Level<br />
Random Vibration Environments<br />
140<br />
Al<br />
135<br />
,-<br />
p<br />
130 I<br />
ca<br />
'0<br />
125<br />
-J<br />
120<br />
GPHS ETG Test Data<br />
co<br />
(148.1 dB OA)<br />
111\11<br />
115<br />
Ar4<br />
110<br />
105<br />
JPL Qualification<br />
(147.0 dB<br />
level Spec<br />
OA)<br />
100<br />
10 100 Frequency (Hz) 1000<br />
10000<br />
Figure 5.3-3. Comparison of Acoustic Test Data with Qualification Requirements
∎<br />
Final Technical Report<br />
GPHS-RTGs for the Cassini Mission<br />
Lockheed Martin <strong>Document</strong> No. RR18<br />
August 1998<br />
Shock testing was also performed on the Engineering Unit ETG as part of qualification for<br />
the Galileo/Ulysses missions. When mounted on the Galileo spacecraft, the RTGs were<br />
supported at the midspan as well as at the inboard end. Pyrotechnic actuators used to<br />
release the midspan supports were the primary source of shock loading, and shock testing<br />
consisted of three firings of these devices. Test data compared with the specified shock<br />
environment for the Cassini mission, Figure 5.3-4, showed that the response greatly<br />
exceeded requirements over most of the frequency range, and was only slightly below at<br />
frequencies above 3000 Hz. These test data were judged to be adequate demonstration of<br />
dynamic capability for shock environment, taking into account the following:<br />
a. The shock environment defined for Cassini was conservative, in that there<br />
are no pyrotechnic devices in close proximity to the RTGs.<br />
b. The shock environment was defined to be at the inboard mounting interface<br />
whereas shock tests were conducted with input at the midspan and closer to<br />
vulnerable components of the thermopile.<br />
c. Mechanical damage was most likely to be expected at lower frequency<br />
inputs.<br />
10000<br />
1000<br />
- 0 - Pyrotechnic Test, Shot No. 1<br />
- CI - Pyrotechnic Test, Shot No. 2<br />
L, - Pyrotechnic Test, Shot No. 3<br />
0<br />
0 e0 0<br />
0 0 0<br />
0<br />
0 0 0 0 A<br />
0<br />
:> A<br />
A A A<br />
IICILD A\<br />
An A s El<br />
El ill ig<br />
IA Ct li l<br />
A 6 u 0<br />
,z, 0<br />
i, ri 0<br />
0<br />
0 0 0<br />
.<br />
El<br />
A<br />
u6 [:1 El<br />
El<br />
(9<br />
0 0 e<br />
0 & A 0<br />
A<br />
E A<br />
e 1 El .., ... 0 ii • ii)<br />
I -<br />
. El g & 0 & &<br />
F,<br />
E, 0<br />
- El 0<br />
Qualification Level<br />
0 4-!) 0<br />
100<br />
10<br />
100 1000<br />
Frequency (Hz)<br />
10000<br />
Figure 5.3-4. Comparison of Shock Test Data with Qualification Requirements<br />
5-53
Final Technical Report<br />
GPHS-RTGs for the Cassini Mission<br />
Lockheed Martin <strong>Document</strong> No. RR18<br />
August 1998<br />
Dynamic environments in the 0 to 80 Hz frequency range were represented by quasi-static<br />
accelerations. These events included lift-off, maximum aerodynamic buffeting, maximum<br />
aerodynamic pressure, ignition of launch vehicle first stage, forward bearing (payload<br />
fairing) release, engine shut down of the first stage, engine shut down of the second stage,<br />
Centaur main engine shut down after first burn, and Centaur main engine shut down after<br />
second burn. Accelerations at the RTG mounting interface, occurring at each of these<br />
events, were evaluated to determine the impact on the qualification status of the RTG.<br />
Included in the evaluation was analysis that took into account the differences in component<br />
temperatures. These temperature differences were a result of uncooled launch on the Titan<br />
IV as compared with conditions during qualification testing for the Galileo/Ulysses missions,<br />
which was performed with the Active Cooling System (ACS) in operation. Positive Margins<br />
of Safety were demonstrated on all critical components within the RTG structural load path.<br />
Quasi-static acceleration loads were also analyzed to determine if adequate axial preload<br />
existed on the heat source at all of the significant launch events. The analysis concentrated<br />
on the F-5 RTG, since it was likely to have the lowest preload of all flight RTGs at the time of<br />
launch. This analysis demonstrated that F-5 (and all other flight RTGs) would have<br />
adequate preload to withstand launch dynamic environments.<br />
5.4 GALILEO AND ULYSSES FLIGHT PERFORMANCE<br />
5.4.1 Galileo<br />
The Galileo spacecraft was launched in October 1989 on a six year journey to Jupiter and<br />
its surrounding moons. The spacecraft is powered by two RTGs, designated as F-1 and F-4.<br />
In spacecraft terminology, F-1 is labeled as the -x RTG and F-4 the +x RTG.<br />
The mission requirements called for a BOM power of 568 watts and EOM power of 470<br />
watts after 71,000 hours (8.1 years). Table 5.4-1 summarizes BOM characteristics. BOM<br />
power, as reported by telemetry data, was 577.2 watts. Telemetry accuracy is 1.2 % or ±3.5<br />
watts. Predicted BOM power was in the range of 571 to 576 watts. All power values were<br />
at the RTG pins. The Galileo spacecraft measures the bus voltage and the output current<br />
from each RTG. There is a voltage drop and power loss from the RTG pins to the spacecraft
Table 5.4-1. Galileo RTG Power, BOM and EOM<br />
Requirement<br />
(watts)<br />
Predictions<br />
(watts)<br />
Final Technical Report<br />
GPHS-RTGs for the Cassini Mission<br />
Lockheed Martin <strong>Document</strong> No. RR18<br />
August 1998<br />
Measured<br />
(watts)<br />
BOM 568 571 to 578 577<br />
EOM<br />
(8.1 Years)<br />
470 475 to 489 482<br />
bus through the connecting cable. This power loss is accounted for by using a 41 milliohm<br />
resistance value supplied by JPL. Figure 5.4-1 shows the power output at the RTG pins<br />
throughout the mission as indicated by telemetry and the prediction from the Lockheed<br />
Martin degradation model. Predicted power was normalized to the BOM power as<br />
determined by telemetry in order to more clearly compare the measured and predicted<br />
power slope. Predicted and measured performance was in very good agreement. EOM<br />
power on 7 December 1997 was 482 watts. This exceeds the specification requirement of<br />
470 watts by 12 watts (2.6%). The predicted EOM power range was 475 watts to 489 watts.<br />
590<br />
580<br />
TELEMETRY DATA TO 7-14-97<br />
-C,',<br />
c.<br />
72.,<br />
560 -<br />
550<br />
540<br />
530<br />
1<br />
I,<br />
leo ,.<br />
t<br />
1.<br />
)<br />
• -•1 • t<br />
+1.2% TELEMETRY<br />
• •<br />
• re •<br />
A<br />
3..<br />
570<br />
cE<br />
w<br />
a.<br />
520<br />
510<br />
500<br />
470<br />
MODEL PARAMETERS<br />
. e<br />
'<br />
.•<br />
.<br />
-1.2% TELEMETRY •<br />
490 K = Finn HOUR Fl INCTION<br />
.<br />
- RAD FUNCTION<br />
480 - --K----- ,,,, — SN3<br />
MODEL PREDICTION<br />
TO AGE = 400 HOURS minimum<br />
iiI<br />
0 10000 20000 30000 40000 50000 60000<br />
TIME-HOURS<br />
TELEMETRY<br />
70000 80000<br />
Figure 5.4-1. Galileo RTGs Power Output (F-1 + F-4)<br />
5-55
Final Technical Report<br />
GPHS-RTGs for the Cassini Mission<br />
Lockheed Martin <strong>Document</strong> No. RR18<br />
August 1998<br />
Performance of the individual RTGs is shown in Figures 5.4-2 and 5.4-3. The performance<br />
of both are nearly identical with F-1 being slightly higher as shown in Figure 5.4-4.<br />
300<br />
TELEMETRY 3ATA TO 7-14-97<br />
290<br />
280<br />
?<br />
0,<br />
=<br />
ILI<br />
270<br />
C<br />
ff,<br />
260<br />
o<br />
a.<br />
250<br />
MODE<br />
K = 50<br />
RAD F<br />
PARAME—ERS<br />
HOUR FU VCTION<br />
NCTION<br />
TELEMETRY<br />
240<br />
KINS =<br />
TO AG<br />
N-3<br />
= 400 HOURS<br />
MODEL PREDICTION<br />
230 -1<br />
0 10000 20000 30000<br />
40000<br />
50000 60000 70000<br />
80000<br />
TIME<br />
HOURS<br />
Figure 5.4-2. Galileo RTG F-1 Power<br />
During the first 3.5 years of the mission there were changes in the power output slope.<br />
These were the result of changes in operating temperature as the distance to the Sun<br />
changed during the various planetary flybys. RTG outer shell temperatures (individual RTD<br />
readings), as reported by telemetry, are shown in Figure 5.4-5 along with the predicted<br />
average RTD temperature from the JPL TEG2 degradation model. The power output slope<br />
was steeper as the RTGs were increasing in temperature because insulation heat losses<br />
(proportional to T4) increased causing the temperature difference across the thermopile to<br />
decrease. Conversely, as the RTG temperature decreased the thermopile temperature drop<br />
increased, tending to increase power output. This effect was sufficient in magnitude to<br />
counterbalance the normal degradation mechanisms and resulted in the observed power<br />
plateaus.<br />
5-56
Final Technical Report<br />
GPHS-RTGs for the Cassini Mission<br />
Lockheed Martin <strong>Document</strong> No. RR18<br />
August 1998<br />
300<br />
T MEMETR1 DATA TO 7-14-97<br />
290<br />
280<br />
1.11<br />
270<br />
w 260<br />
■ • •<br />
0<br />
MODEL PARAMETERS<br />
K = 500 HOUR FUNCTION<br />
.<br />
250<br />
240<br />
—RAD-FU VCTION<br />
KINS = St-3<br />
TO AGE r400 HOUF S<br />
E<br />
MODEL<br />
PREDICTIO<br />
T<br />
LEMETRY<br />
230<br />
0 10000 20000 30000 40000 50000 60000 70000 80000<br />
TIME -HOURS<br />
Figure 5.4-3. Galileo RTG F-4 Power<br />
300<br />
TELEMETRY 3ATA TO 7-14-97<br />
290<br />
280<br />
a<br />
= 270<br />
:swe<br />
k 260<br />
a.<br />
250<br />
MODE PARAME—ERS<br />
K = 50. HOUR FUNCTION<br />
RAD FUNCTION<br />
KINS = N -3<br />
F-4<br />
F-1<br />
240<br />
TO AG<br />
= 400 HOURS<br />
230 -<br />
0 10000 20000 30000 40000 50000 60000 70000 80000<br />
TIME HOURS<br />
Figure 5.4-4. Galileo RTGs F-1 and F-4<br />
5-57
Final Technical Report<br />
GPHS-RTGs for the Cassini Mission<br />
Lockheed Martin <strong>Document</strong> No. RR18<br />
August 1998<br />
275<br />
275<br />
270<br />
265<br />
260<br />
6 F1 RTG RTD NO 2<br />
• F1 RTG RTD NO 4<br />
0 F4 RTG RID NO. 2<br />
270<br />
265<br />
260<br />
255<br />
255<br />
U<br />
w<br />
cc<br />
<<br />
w<br />
2<br />
250<br />
245<br />
240<br />
250<br />
245<br />
240<br />
235<br />
235<br />
230<br />
TEG MODEL - AVERAGE SHELL TEMP<br />
230<br />
225<br />
225<br />
220<br />
DCO<br />
215 215<br />
0 5000 100001500020000250003000035000400004500050000550006000065000700007500080000<br />
TIME - HOURS<br />
220<br />
Figure 5.4-5. Galileo RTD Temperatures<br />
Figures 5.4-6 and 5.4-7 , provided by JPL, shows the RTG power available at the spacecraft<br />
bus and the required power during the various phases of the primary mission, which was<br />
completed on 7 December 1997. All mission power requirements were met and the entire<br />
primary mission was successfully performed and included ten encounters; with Ganymede<br />
(four times), Callisto (three times), and Europa (three times). The Galileo mission was<br />
extended for two years to conduct a detailed study of Europa over a 14 month period<br />
followed by close flybys of lo in October 1999.<br />
5.4.2 Ulysses<br />
The Ulysses spacecraft was launched in October 1990 with a single RTG, F-3. Its trajectory<br />
led it to the planet Jupiter, where in February 1992, it received a gravitational assist that sent<br />
it out of the plane of the Earth's orbit and eventually over the poles of the sun. It passed<br />
over the South Pole in October 1994 and the North Pole in 1995. The power estimates for<br />
F-3 are shown in Figure 5.4-8. Unlike Galileo, there is no direct measurement of RTG power<br />
5-58
Final Technical Report<br />
GPHS-RTGs for the Cassini Mission<br />
Lockheed Martin <strong>Document</strong> No. RR18<br />
August 1998<br />
290<br />
F-1 RTG<br />
Measured Data<br />
Predicted Power<br />
— Maximum from Voyager<br />
- GE '90 Minimum<br />
03<br />
0<br />
a-<br />
280<br />
270<br />
260<br />
250<br />
240<br />
N<br />
.<br />
. .<br />
.<br />
— t'• -0— --,0-,<br />
-..,-<br />
---- o----<br />
-, u-- a----c___<br />
-_, o<br />
230<br />
290<br />
'91 '92 '93 '94 '95 '96 '97 '98<br />
Calendar Year<br />
F-4 RTG<br />
Note: (1) The predicted power is adjusted<br />
for the Galileo line losses.<br />
Tri<br />
cn<br />
ca<br />
ca<br />
0<br />
it<br />
280<br />
270<br />
260<br />
250<br />
240<br />
230<br />
.<br />
N<br />
• -c- •o ,, ..,_<br />
.<br />
7--<br />
6 '''----.<br />
,,, 0-•,..... .<br />
.<br />
o ,,--•••,....--<br />
,....,<br />
c • ---<br />
o---------- --<br />
o. — L.,- ----- _<br />
o<br />
--- 9 o<br />
------ o<br />
. o<br />
------ • -._ o<br />
'90 '91 '92 '93 '94 '95 '96 '97 '98<br />
Calendar Year<br />
.<br />
-<br />
-<br />
Figure 5.4-6. Galileo — RTG Power at Spacecraft Bus<br />
5-59
Final Technical Report<br />
GPHS-RTGs for the Cassini Mission<br />
Lockheed Martin <strong>Document</strong> No. RR18<br />
August 1998<br />
600<br />
o<br />
Measured Power<br />
Predicted Powe<br />
Maximu<br />
from Voyager<br />
—::- GE '90 Minimum<br />
ca<br />
550<br />
o.<br />
Note: (1) The redicted power s adjusted<br />
for he Galileo line losses.<br />
0<br />
8 500<br />
Q.<br />
co<br />
Earth #1<br />
Earth #2<br />
Asteroid<br />
Probe<br />
—6- 27,<br />
Jupiter<br />
... .<br />
0 - 450<br />
0<br />
Venus<br />
a)<br />
ReqJired Power<br />
400<br />
'90 '91 '92 '93 '94 '95 '96 '97<br />
Calendar Year<br />
Figure 5.4-7. Galileo Spacecraft — RTG Power Status Report<br />
(Launch 18 October 1989)<br />
290<br />
TELEMETRY DATA TO 1 APRIL 1997<br />
280<br />
270<br />
(4,<br />
A ,<br />
'<br />
❑ F-3 RTG UPPER POWER ESTIMATE<br />
o F-3 RTG LOWER POWER ESTIMATE<br />
— TEG MODEL PREDICTION<br />
-- JPLPBEDICIED PERFCIRMANCE<br />
Q 260<br />
ce<br />
250<br />
1044%.<br />
240<br />
230<br />
220<br />
0<br />
10000 20000 30000 40000 50900 60000 70000 80000 90000 100000<br />
TIME, HOURS<br />
Figure 5.4-8. Ulysses RTG F-3 Power<br />
5-60
Final Technical Report<br />
GPHS-RTGs for the Cassini Mission<br />
Lockheed Martin <strong>Document</strong> No. RR18<br />
August 1998<br />
output. RTG power output was estimated from an algorithm which considered (1) the main<br />
bus current, (2) an internal power dump current, (3) nominal power consumption values for<br />
ten spacecraft components if they are operating at the time, and (4) unlike the Galileo<br />
spacecraft, the Ulysses spacecraft operates at a nominal load voltage of 28 volts. Initial<br />
telemetry power was reported to be 284 watts at the bus and 289 watts at the RTG<br />
connector (45.7 milliohm resistance between RTG and bus). This exceeded the<br />
specification requirement of 277 watts at the RTG connector. (The pre-launch prediction of<br />
BOM power was in the range 282 to 287 watts at the connector. The RTG continued to meet<br />
all spacecraft power requirements throughout the 42,000 hour (4.8 year) mission which<br />
ended in August 1995. Power at EOM was reported as 248 watts. The EOM requirement<br />
was 245 watts. JPL has reported that during the periods leading up to and following<br />
perihelion in March 1995, there were several spacecraft power reconfigurations in response<br />
to the large changes in solar heating as the spacecraft-Sun distance decreased and then<br />
increased. Since the algorithm used to estimate power is configuration dependent, these<br />
reconfigurations have clearly introduced artifacts into the data set. Table 5.4-2 summarizes<br />
BOM and EOM performance.<br />
Table 5.4-2. Ulysses RTG Mission Requirements<br />
Requirement<br />
(watts)<br />
Telemetry Power<br />
(watts)<br />
BOM Power ( 1 ) 277 289<br />
EOM Power 245 248<br />
(1) Pre-launch predicted power 282 to 287 watts<br />
The Ulysses mission was also extended beyond its primary mission and is now slightly over<br />
two years into the extended mission which includes a second polar orbit. The spacecraft is<br />
heading to aphelion at the orbit of Jupiter in April 1998, a south polar pass of the Sun in<br />
September 2000 and a north polar pass beginning in September of 2001. Figure 5.4-9,<br />
provided by JPL, shows the estimated bus power from telemetry to the end of 1997. The<br />
JPL TEG model predicts that 220 watts will be available at the spacecraft bus at the end of<br />
the extended mission.<br />
5-61
Final Technical Report<br />
GPHS-RTGs for the Cassini Mission<br />
Lockheed Martin <strong>Document</strong> No. RR18<br />
August 1998<br />
290<br />
-7 1-1-.<br />
280<br />
Notes: (1) Launch Date: Oct. 6, 1950<br />
(2) JPL predicted power based on<br />
• power history of LES 8 P.TG 2<br />
_<br />
270<br />
16 260<br />
250<br />
ci<br />
11-<br />
it.<br />
• ,.4... .„_ _<br />
JUPITE 4 ENCOUN I ER<br />
t.; •-6<br />
I<br />
-r- b. ,S. ..<br />
-<br />
L,<br />
CI3 240<br />
•<br />
.. JPL Prediction<br />
230<br />
220<br />
210<br />
sLtz, POLE<br />
N<br />
MAX<br />
POT<br />
LAT<br />
1___,_ i I . ,<br />
LMMS<br />
. *• • ....-....s<br />
Prediction • - — ",.-<br />
....• • .-....<br />
• -<br />
1 SUNS ROLE<br />
MAX<br />
"- •-....<br />
-<br />
SUN N<br />
MAX<br />
■<br />
1992 1994 1996 1998 2000 2002<br />
Calander Year<br />
01 E<br />
At<br />
_<br />
-<br />
Figure 5.4-9. Ulysses Extended Mission Power<br />
References for Section 5<br />
5-1 Nakahara, J. F., C. E. Kelly, S. Loughin, and R. F. Hartman, "E-7 Processing<br />
Investigation - Final Report," Lockheed Martin Missiles & Space <strong>Document</strong> GESP<br />
7248, Cassini RTG Program, 16 August 1996.<br />
5-2 Kelly, C. E. and J. F. Nakahara, "Carbon Monoxide Levels in Cassini RTGs,"<br />
Lockheed Martin Missiles & Space <strong>Document</strong> GESP 7253, Cassini RTG Program, 16<br />
April 1997.<br />
5-3 Cockfield, R. D. and C. E. Kelly, "F-2 Engineering Report," Lockheed Martin Missiles<br />
& Space <strong>Document</strong> GESP 7249, Cassini RTG Program, 22 November 1996.<br />
5-4 Cockfield, R. D. and C. E. Kelly, "F-6 Engineering Report," Lockheed Martin Missiles<br />
& Space <strong>Document</strong> GESP 72451, Cassini RTG Program, 7 March 1997.<br />
5-5 Cockfield, R. D. and C. E. Kelly, "F-7 Engineering Report," Lockheed Martin Missiles<br />
& Space <strong>Document</strong> GESP 7250. Cassini RTG Program, 24 January 1997.<br />
5-6 "Predicted Isolation Resistance for RTG F-7," Lockheed Martin Missiles & Space<br />
<strong>Document</strong> GESP-7247, Cassini RTG Program, 31 July 1996.
Section 6<br />
Safety
Final Technical Report<br />
GPHS-RTGs for the Cassini Mission<br />
Lockheed Martin <strong>Document</strong> No. RR18<br />
August 1998<br />
SECTION 6<br />
SAFETY<br />
6.1 MISSION AND SYSTEM DESCRIPTION<br />
6.1.1 Mission Overview<br />
The Cassini mission is an international cooperative undertaking of the National Aeronautics<br />
and Space Administration (NASA), the European Space Agency, and the Italian Space<br />
Agency (ASI). The mission involves the use of the Cassini spacecraft, including the<br />
detachable Huygens Probe, to conduct a 4-year scientific exploration of the planet Saturn<br />
and its moons. Cassini is one of the two missions under NASA's Outer Solar System<br />
Exploration program that were planned in 1991, the Comet Rendezvous Asteroid Flyby<br />
(CRAF) being the other mission. The CRAF mission was subsequently canceled in 1992.<br />
The primary Cassini mission was scheduled for launch within a 41-day period beginning 6<br />
October 1997 from Launch Complex 40 (LC-40) at the Cape Canaveral Air Station (CCAS).<br />
Launch took place on the 10th day of the launch period (15 October) at 0443 EDST. Using<br />
the Titan IV/Centaur launch vehicle, the spacecraft was injected into a 6.7-year Venus-<br />
Venus-Earth-Jupiter-Gravity-Assist (VVEJGA) trajectory to Saturn, as shown in Figure 6.1-1.<br />
(The dates shown in this figure are based on a launch date of 6 October 1997.) A brief<br />
description of the mission, obtained from Reference 6.1-1, is presented below.<br />
The first Venus swingby will occur in April 1998. In December 1998, a maneuver will place<br />
the spacecraft on course for the second Venus swingby in June 1999. Due to the Earth's<br />
unique orientation relative to Venus during this time period, the spacecraft will swing by<br />
Earth in slightly under two months, where it will obtain another gravity assist in August 1999.<br />
After Earth flyby, the spacecraft will travel toward Jupiter, passing through the asteroid belt.<br />
In December 2000, the spacecraft will swing by Jupiter to obtain a fourth and final gravity<br />
assist.<br />
For several months prior to arrival at Saturn in July 2004, the spacecraft will perform science<br />
observations of the Saturnian system as it draws nearer to its destination. During the Saturn<br />
Orbit Insertion (S01) phase, the spacecraft's approach (about 1.3 Saturn radii), is the closest<br />
of the entire mission.<br />
6-1
Final Technical Report<br />
GPHS-RTGs for the Cassini Mission<br />
Lockheed Martin <strong>Document</strong> No. RR18<br />
August 1998<br />
VENUS SWINGBY #2<br />
JUN 20, 1999<br />
SATURN ARRIVAL \<br />
JUN 25, 2004<br />
VENUS SWINGBY #1<br />
APR 21, 1998<br />
MANEUVER I<br />
DEC 2, 1998 I<br />
EARTH SWINGBY<br />
AUG 16, 1999<br />
LAUNCH<br />
OCT 6, 1997<br />
/ N<br />
/ JUPITER SWINGBY<br />
DEC 30, 2000<br />
Figure 6.1-1. Cassini Interplanetary Trajectory, VVEJGA<br />
After SOI, the spacecraft will move to the most distant point in its orbit around Saturn (about<br />
180 Saturn radii). It will then return for an encounter with Titan, its largest moon, in<br />
November 2004. Approximately three weeks prior to Cassini's first flyby of Titan, the<br />
spacecraft will release the Huygens Probe, targeted for entry into Titan's atmosphere. Two<br />
days after Probe release, the Orbiter will perform a deflection maneuver to be in position to<br />
receive scientific information gathered by the Huygens Probe throughout its estimated 2.5-<br />
hour parachute descent to Titan's surface.<br />
The spacecraft will continue on its tour of the Saturnian system, including multiple Titan<br />
swingbys for gravity assist and science acquisition. The Titan swingbys and Saturn orbits<br />
will be designed to allow maximum science coverage, including the acquisition of science<br />
data from Saturn's icy satellites. The 10.7-year nominal mission will end in June 2008.<br />
6-2
Final Technical Report<br />
GPHS-RTGs for the Cassini Mission<br />
Lockheed Martin <strong>Document</strong> No. RR18<br />
August 1998<br />
The Cassini launch phase mission timeline is shown in Table 6.1-1. Solid Rocket Motor<br />
Upgrade (SRMU) ignition is used as the time zero reference point for the mission elapsed<br />
time (MET). The initiating and final events that define each of the launch mission phases<br />
are listed along with the corresponding METs. Table 6.1-2 lists the nominal sequence of<br />
significant trajectory events starting at SRMU ignition and continuing until the Cassini<br />
spacecraft is inserted into its interplanetary trajectory. Each event is given along with a MET<br />
referenced to SRMU ignition. Also shown is the corresponding inertial vehicle velocity and<br />
altitude at the start of each event. The altitude listed is the vehicle center-of-mass altitude<br />
above the Earth's surface as defined by the SAO-67 Reference Ellipsoid, taken from<br />
Smithsonian Astrophysical Observation Report 264. At the launch site (LC-40), this<br />
reference ellipsoid is 103.75 feet above mean sea level. The vehicle center-of-mass is at<br />
Vehicle Station 852, which is 91.45 feet above mean sea level. Therefore, Table 6.1-2<br />
shows a vehicle center-of-mass altitude of approximately -12 feet at SRMU ignition.<br />
6.1.2 Launch Vehicle and Space Vehicle<br />
6.1.2.1 Launch Vehicle<br />
The Titan IV launch vehicle for the Cassini mission consists of a Core Vehicle which has two<br />
liquid propellant stages, an upper stage, a Payload Fairing (PLF), and two SRMUs mounted<br />
on opposite sides of the Core Vehicle. The Centaur upper stage is mounted atop the core<br />
vehicle second stage. Physical features of the Titan IV/Centaur flight vehicle are illustrated<br />
in Figure 6.1-2.<br />
The solid rocket motors upgrades were newly developed by Alliant and were successfully<br />
demonstrated in their first launch (aboard a Titan IVB vehicle) in early 1997. Cassini is the<br />
second mission using these new motors. The SRMUs are built in three segments, identified<br />
as forward, center, and aft. These segments are cased in a graphite epoxy, filament-wound,<br />
composite material. The forward closure is also made of composite material. Each SRMU<br />
is 112.4 feet long and has a 10.87-ft outer diameter at the steel field joints. The nominal<br />
propellant weight of the SRMU is 695,428 Ibm and the total weight with inerts is 775,928<br />
Ibm.<br />
6-3
Final Technical Report<br />
GPHS-RTGs for the Cassini Mission<br />
Lockheed Martin <strong>Document</strong> No. RR18<br />
August 1998<br />
Mission<br />
Table 6.1-1. Cassini Mission Timeline<br />
Event<br />
Description<br />
Mission Elapsed Time<br />
seconds<br />
Phase Finish Start Finish<br />
0 Complete RTG Installation SRMU Ignition -48 hours 0<br />
1 SRMU Ignition SRMU Jettison 0 143<br />
2 SRMU Jettison PLF Jettison 143 206<br />
3 PLF Jettison Stage 1 Jettison 206 320<br />
4 Stage 1 Jettison Stage 2 Jettison 320 554<br />
5 Stage 2 Jettison Centaur MECO 1 554 707<br />
6 Centaur MECO 1 Centaur MES 2 707 1889<br />
7 Centaur MES 2 Earth Escape 1889 2277<br />
8 Earth Escape Centaur MECO 2 2277 2349<br />
Table 6.1-2. Nominal Cassini Flight Sequence of Events<br />
(Referenced for 6 October 1997 Launch Date)<br />
MET<br />
(sec)<br />
Inertial<br />
Velocity<br />
(fps)<br />
Altitude<br />
(ft)<br />
Event<br />
0 1,341 -12 SRMU Ignition<br />
0.4 1,341 -12 Lift-off and vertical flight<br />
11.0 1,352 817 Begin ramped pitch over<br />
21.0 1,453 3,562 Orient to zero - lift flight<br />
56.5 2,552 34,173 Max. dynamic pressure (950 Ibf/sq. ft.)<br />
131.3 7,297 190,396 Stage 1 ignition<br />
143.2 7,635 222,316 SRMU separation<br />
206.3 9,574 362,133 Jettison PLF<br />
319.0 16,577 537,345 Stage 2 ignition<br />
319.7 16,584 538,439 Stage 1/Stage 2 separation<br />
554.2 23,398 674,149 Stage 2/Centaur separation<br />
577.4 23,400 673,293 Centaur first burn ignition, MES 1<br />
706.7 25,663 646,937 Centaur shutdown of first bum, MECO 1<br />
1889.2 25,723 604,679 Centaur second burn ignition, MES 2<br />
2348.6 38,524 1,657,864 Centaur shutdown of second burn, MECO 2<br />
2948.6 33,502 10,882,678 Centaur/Spacecraft separation<br />
6-4
Final Technical Report<br />
GPHS-RTGs for the Cassini Mission<br />
Lockheed Martin <strong>Document</strong> No. RR18<br />
August 1998<br />
Legend:<br />
• Than IV Flight Vehicle<br />
1) Satellite Vehicle<br />
• Titan IV Launch Vehicle (LV)<br />
2) Payload Fairing (PLF)<br />
3) Centaur Upper Stage<br />
4) Solid Rocket Motor Upgrade<br />
(SRMUs, Stage 0)<br />
• Titan IV Core Vehicle<br />
5) Centaur Adapter Extension<br />
(CP2492)<br />
6) Forward Skirt Extension (CP2490)<br />
7) Stage 2 Forward Oxidizer Skirt<br />
(CP2460)<br />
8) Stage 1<br />
9) Stage 2<br />
10) Liquid Rocket Engines<br />
Figure 6.1-2. Cassini Titan IV Launch Vehicle Features<br />
6-5
Final Technical Report<br />
GPHS-RTGs for the Cassini Mission<br />
Lockheed Martin <strong>Document</strong> No. RR18<br />
August 1998<br />
Alternative missions using the conventional Titan IV SRM (Solid Rocket Motor) configuration<br />
were considered in the event the SRMU was not available. The mission design in this case<br />
would have been limited by the smaller mass injection capabilities of the SRMs, thus<br />
reducing the propellant mass onboard the spacecraft and consequently the amount of<br />
science return from the mission. The SRM configuration was identified in the Final<br />
Environmental Impact Statement (Reference 6.1-2), but was dropped as an alternative once<br />
schedule considerations precluded such a change without missing the launch windows.<br />
For flight safety, the Titan IV launch vehicle flight termination system (FTS) provides ground<br />
personnel with the capability to shut down the core engines during flight and to destroy the<br />
Titan IV launch vehicle in flight. The FTS will also automatically destroy the vehicle if any<br />
element should inadvertently separate. The FTS consists of the Command Shutdown and<br />
Destruct System (CSDS) and the Automatic Destruct System (ADS). Both the CSDS and<br />
the ADS have the capability to destroy the vehicle. The CSDS has the additional capability<br />
of shutting down the Titan IV Stage 1 and 2 engines without destruction. The CSDS<br />
responds to commands transmitted from the ground while the ADS is activated when certain<br />
electrical paths are interrupted as a result of inadvertent separation of stages in flight.<br />
There is a range safety requirement that an automatic FTS must be activated by vehicle<br />
breakup or premature separation of any stage interface above or below the stage<br />
containing the command system. The command system for Titan IV is located in Stage 2.<br />
Stage interfaces are Centaur/Stage 2 above the command system and Stage 0/1, Stage 1/2<br />
interfaces below. Premature separation of any of the Titan IV Stage interfaces will result in<br />
activation of the automatic FTS in stages below the sensed separation. Each stage of the<br />
Titan IV contains its own ADS. A Thermal Barrier ADS was added to the Titan IV Stage 2. It<br />
has the ability to destroy the Titan IV Core Vehicle in the event of a Centaur liquid oxygen<br />
tank rupture or a hydrogen/oxygen explosion following rupture of both tanks. Each system<br />
is armed before liftoff to provide command destruct or inadvertent separation destruct<br />
capability through the Titan IV Stage 2 powered flight. Further detailed description of the<br />
Titan IV launch vehicle and the Centaur upper stage can be found in Reference 6.1-3.<br />
6-6
Final Technical Report<br />
GPHS-RTGs for the Cassini Mission<br />
Lockheed Martin <strong>Document</strong> No. RR18<br />
August 1998<br />
6.1.2.2 Space Vehicle<br />
The Cassini space vehicle (SV) is shown on Figure 6.1-3. The information in this section<br />
has been obtained from Reference 6.1-4. The main body of the SV is comprised of a Lower<br />
Equipment Module, the Propulsion Module, an Upper Equipment Module, and the High<br />
Gain Antenna. The two equipment modules are used for external mounting of the<br />
magnetometer boom and the three GPHS-RTGs that supply power to the SV. The SV<br />
electronics bus is part of the Upper Equipment Module. The High Gain Antenna and two<br />
Low Gain Antennas are used to transmit data and receive commands.<br />
11-m MAGNETOMETER<br />
BOOM \<br />
RADAR<br />
BAY<br />
LOW GAIN ANTENNA 1<br />
/74--- 4 m HIGH GAIN<br />
ANTENNA<br />
REMOTE<br />
SENSING<br />
PALLET<br />
4..tvz<br />
air47<br />
inn:tom 1.4-4<br />
FIELDS AND<br />
PARTICLES<br />
PALLET<br />
HUYGENS<br />
PROBE<br />
PRESSURANT<br />
TANK<br />
HYDRAZINE<br />
TANK<br />
RADIOISOTOPE<br />
THERMOELECTRIC<br />
GENERATOR (3)<br />
\ THRUSTER<br />
CLUSTER (4)<br />
490-N MAIN<br />
ENGINES (2)<br />
Figure 6.1-3. Cassini Spacecraft Configuration<br />
6-7
Final Technical Report<br />
GPHS-RTGs for the Cassini Mission<br />
Lockheed Martin <strong>Document</strong> No. RR18<br />
August 1998<br />
The overall height of the SV is 7.0 m and its maximum diameter, at the High Gain Antenna,<br />
is 4 m. The SV carries 687 kg of scientific instruments, including the Huygens Probe<br />
System. After separation from its Titan IV/Centaur launch vehicle and adapter, the SV has a<br />
baseline total mass allocation (including margin) of 5,655 kg. The SV dry mass allocation is<br />
2,150 kg, including 335 kg for science payload. A mass properties summary of the<br />
integrated space vehicle is provided in Table 6.1-3 (Reference 6.1-4).<br />
Table 6.1-3. Mass Properties Summary (with Respect to SV Coordinates)<br />
Item Mass (kg) Center of Gravity (m)<br />
X Y Z<br />
SV @ Launch 5625.9 -0.02 -0.01 1.37<br />
GPHS-RTG 1 56.0 1.29 0.74 2.80<br />
GPHS-RTG 2 56.0 0.00 1.49 2.80<br />
GPHS-RTG 3 56.0 0.00 -1.49 2.80<br />
Tank + Fuel (BOM) 1204.5 0.00 0.00 0.46<br />
Fuel Tank (Dry) 72.9 0.00 0.00 0.49<br />
Tank + Oxidizer (BOM) 1941.3 0.00 0.00 2.16<br />
Oxidizer Tank (Dry) 72.9 0.00 0.00 2.27<br />
Pressurant + Tank for<br />
Bipropellant (BOM)<br />
49.6 0.00 0.99 1.48<br />
Monopropellant + Tank (BOM) 150.8 0.00 -1.09 1.60<br />
Pressurant + Tank for<br />
Monopropellant (BOM)<br />
3.5 0.64 -0.65 2.12<br />
6-8
6.2 LAUNCH SAFETY RISK ANALYSIS PROCESS<br />
6.2.1 Analysis Objectives<br />
Final Technical Report<br />
GPHS-RTGs for the Cassini Mission<br />
Lockheed Martin <strong>Document</strong> No. RR18<br />
August 1998<br />
Any U.S. space mission employing radioisotope power sources is subject to a launch<br />
approval process that includes a detailed safety analysis and review of the health risks to<br />
the public associated with the mission. The requirements for approval have evolved over<br />
more than three decades beginning with the launch of the SNAP-3 RTG in June of 1961.<br />
The risk analysis process focuses on nuclear safety and has developed, along with the<br />
launch approval process, with each new mission building upon the accomplishments of<br />
earlier risk analysis efforts. The objective here is to perform the risk analysis associated<br />
with the pre-launch, launch, Earth-orbit and Earth-swingby segments of the mission and to<br />
document this risk analysis in a Safety Analysis Report (SAR) which is provided to the<br />
Interagency Nuclear Safety Review Panel (INSRP) for critical review and as input into the<br />
Safety Evaluation Report (SER).<br />
6.2.2 Analysis Overview<br />
The launch approval process consists of a risk analysis documented in a SAR, followed by<br />
an interagency review, documented in a SER. Both reports are subject to a critical<br />
examination by appropriate agencies of the executive branch prior to a recommendation by<br />
OSTP to the Office of the President as to whether or not to approve the launch. This process<br />
is shown schematically in Figure 6.2-1.<br />
SAR = SAFETY ANALYSIS REPORT<br />
SER = SAFETY EVALUATION REPORT<br />
INSRP= INTERAGENCY NUCLEAR SAFETY REVIEW PANEL<br />
OSTP = OFFICE OF SCIENCE AND TECHNOLOGY POLICY<br />
LAUNCH<br />
VEHICLE<br />
ACCIDENT<br />
DATA<br />
*pp<br />
LMMS<br />
SPACE<br />
POWER<br />
•-•P^ SAR DOE<br />
NASA<br />
_ APPROVAL<br />
LAUNCH<br />
REQUEST<br />
I<br />
EW<br />
Eld OFFICE OF<br />
OSTP THE<br />
PRESIDENT<br />
LEVI<br />
SAFETY<br />
TEST<br />
DATA<br />
lob- INSRP ..1•••• SER<br />
Figure 6.2-1. Schematic of the Launch Approval Process<br />
6-9
Final Technical Report<br />
GPHS-RTGs for the Cassini Mission<br />
Lockheed Martin <strong>Document</strong> No. RR18<br />
August 1998<br />
The risk analysis process employed in the Cassini program builds upon the analysis<br />
performed for the Galileo and Ulysses missions, and incorporates many new refinements.<br />
Figure 6.2-2 presents an overview of the risk analysis process that was implemented in the<br />
Cassini program. The process of determining risk associated with the pre-launch, launch,<br />
and Earth swingby segments of the Cassini mission consists of four steps. The first step,<br />
that of accident definition, is embodied in the Cassini/Titan IV Centaur RTG Safety Databook<br />
and the Cassini Program Environmental Impact Statement Supporting Study, Volume 3:<br />
Earth Swingby Plan. The Databook defines those accidents which may occur during the<br />
pre-launch, launch, and earth-orbit phases of the mission. (The Databook is supplemented<br />
by several JPL technical memoranda (Reference 6.2-1) for conditions related to Earth<br />
reentries during the launch segment.) The Swingby Plan defines those accidents which<br />
may occur after escape from Earth orbit and which may initiate during the interplanetary<br />
cruise. These documents provide the fundamental definition of the accident cases, and the<br />
resulting environments that may present a threat to the plutonia fuel containment capability<br />
of the RTGs. Each also defines the probability of occurrence (i.e., of failure or POF) for the<br />
accident cases described therein.<br />
6.2.3 Analysis Methods<br />
Response modeling is based on an extensive set of test data that have been acquired to<br />
support GPHS-RTG safety analyses on this and earlier programs. The mathematical<br />
models used to simulate potential launch and reentry accidents are based on these test<br />
data on RTGs and RTG components, as well as standard engineering models, computer<br />
simulations, and fundamental physical principles. Specifically, the test data are<br />
supplemented by a series of 'hydrocode' calculations, which rely on continuum mechanics<br />
codes to calculate the time dependent deformations of the RTG components when subject<br />
to specific accident conditions. These calculations are semi-empirical in nature, and the<br />
empirical parameters have been selected so as to make the calculations agree with actual<br />
test data where such data are available.
Final Technical Report<br />
GPHS-RTGs for the Cassini Mission<br />
Lockheed Martin <strong>Document</strong> No. RR18<br />
August 1998<br />
1) Accident Definition<br />
for each<br />
• RTG Safety Databook *<br />
accident<br />
• Earth Swingby Plan *<br />
/<br />
Accident<br />
Probabilities (POFs)<br />
/<br />
Accident<br />
Environments<br />
2) Source Term Determination<br />
Determine RTG response to for each<br />
accident<br />
environment, resulting source<br />
case<br />
term and probability of release<br />
Conditional<br />
Probabilities<br />
Source Term<br />
Descriptions<br />
/<br />
/<br />
3) Consequence Evaluation<br />
for each<br />
Evaluate radiological accident<br />
consequences of source term case Consequences<br />
4) Risk Analysis<br />
Apply accident POF to<br />
cond. probability of<br />
source term and<br />
associated consequence.<br />
Risk<br />
* As supplemented by Reference 6.2-1<br />
Figure 6.2-2. Top-Level <strong>View</strong> of the Basic Elements in the Risk Analysis Process<br />
6-11
Final Technical Report<br />
GPHS-RTGs for the Cassini Mission<br />
Lockheed Martin <strong>Document</strong> No. RR18<br />
August 1998<br />
Launch accident analyses were performed, employing these test data and calculations,<br />
using a computer code entitled Launch Accident Scenario Evaluation Program for the Titan<br />
IV (LASEP-T). This code permitted evaluation of RTG response in the pre-launch and early<br />
launch phases of the Cassini mission by simulating the effects of various threatening<br />
environments that might result from the launch accidents defined in the Databook. The<br />
location and state of each RTG and RTG component was modeled from the initial insult,<br />
generally at-altitude, through the final insult upon Earth impact. The outcome of the<br />
simulation consisted of determining whether a release occurs, and if so, the salient<br />
characteristics of the release. Releases which occurred within a liquid propellant fire were<br />
subject to particle size modification, reflecting vaporization effects. The simulation was<br />
repeated thousands of times, drawing the initial conditions for each cycle from relevant<br />
probability distributions, to create a statistical description of the response to the subject<br />
accident case, including the conditional probability of release, and the range of source<br />
terms that may result. Modified versions of LASEP-T were used for simulation of pre-launch<br />
and full vehicle intact impact accidents.<br />
For launch accidents which included the potential for solid propellant fragments to strike<br />
RTG components on the ground, a separate code, FALLBACK, determined trajectory<br />
characteristics with a modified version of LASEP-T employed for predicting fuel release.<br />
Vaporization effects associated with proximity to solid propellant fires were modeled with<br />
the SRESP code.<br />
For out-of-orbit accidents which occur late in the launch segment and subject RTG<br />
components to reentry conditions, fuel containment survivability was predicted using a<br />
3-degree-of-freedom trajectory model that includes the aerothermal environment. The<br />
reentering bodies are assumed to be modules, in either a face-on-stable or randomtumbling<br />
condition. The graphitic aeroshell of the module is designed to survive reentry by<br />
ablative cooling. Ablation mass loss was modeled using a finite difference thermal<br />
conduction code entitled Reaction Kinetics and Ablation Program (REKAP). The effect of<br />
ground impact were evaluated using the same methods as were used to evaluate ground<br />
impact for the LASEP-T simulation discussed above. This resulted in a similar statistical<br />
distribution of source terms.
Final Technical Report<br />
GPHS-RTGs for the Cassini Mission<br />
Lockheed Martin <strong>Document</strong> No. RR18<br />
August 1998<br />
In an inadvertent reentry during Earth swingby, reentry velocities exceed 19 km/s, as<br />
compared to less than 8 km/s for non-skip out-of-orbit reentries. NASA-JPL performed a<br />
breakup analysis of the Cassini spacecraft to predict the initial conditions for RTG<br />
components released from the spacecraft. The flight dynamics of the modules for such<br />
reentries were predicted by Johns Hopkins University's Applied Physics Laboratory<br />
(JHU/APL). The JHU/APL model provided a 6-degree-of-freedom (3 translational and<br />
3 rotational) analysis of the trajectory. The aeroshell response was predicted using<br />
computational fluid dynamics (CFD), coupled with thermal analysis to determine transient<br />
temperature distributions and surface recession. In addition, the structural response to<br />
these transient conditions was modeled using a detailed nonlinear finite element method to<br />
determine the structural integrity of the aeroshell when subject to these thermal,<br />
aerodynamic, and inertial loads. The codes and methods employed have been adapted<br />
from those previously used to successfully predict the behavior of ballistic reentry vehicles<br />
that reach similar temperature regimes. Based on the results of these calculations, once<br />
again, a set of source terms was defined to provide a statistical description of the potential<br />
releases from this type of accident.<br />
The above discussions indicate how source terms were obtained for various types of<br />
potential accidents. The next step was to evaluate the radiological consequence of these<br />
releases. Accident source terms were input as a set of released particles distributed by<br />
size. Those releases that occur in a fireball were pre-processed using the PUFF code from<br />
Sandia National Laboratory's ERAD model to calculate plume rise and the dimensions of<br />
the fireball cloud. Latin Hypercube Sampling (LHS) with stratified sampling was applied to<br />
provide adequate statistical sampling of the database of source terms and other parameters<br />
that affect consequence, while limiting the calculation to a tractable size. The Space<br />
Accident Radiological Release and Consequence (SPARRC) family of computer codes<br />
were used to perform this evaluation. SPARRC consists of the following modules: SATRAP,<br />
for modeling site specific transport and dispersion of radioactive particles; GEOTRAP, for<br />
modeling global transport and dispersion of radioactive particles; HIAD, modeling high<br />
altitude aerosol transport and dispersion; and PARDOS, for modeling dose and health<br />
effects.
Final Technical Report<br />
GPHS-RTGs for the Cassini Mission<br />
Lockheed Martin <strong>Document</strong> No. RR18<br />
August 1998<br />
Each of the three transport models were applied to model transport and dispersion of the<br />
different fuel particle size ranges and dispersion time scales. PARDOS was used to model<br />
dose and health effects for all transport / dispersion models. By rank ordering the<br />
consequences, cumulative complementary distribution functions (CCDFs) were obtained to<br />
provide a picture of the relative likelihood of consequences of various magnitudes. These<br />
were the output of the consequence calculations and were used, along with probability<br />
calculations, to quantify risk.<br />
Risk was expressed in the safety analyses in two forms: 1) as a probability distribution of<br />
potential consequences for a given situation, and 2) as the mathematical expectation value<br />
of the consequence, given by the sum of the products of the consequences and their<br />
associated probabilities.<br />
The models used in the calculation of consequences from potential accidents for the FSAR<br />
are based upon experimental and observational data and known physical principles. The<br />
models cannot provide completely precise descriptions of the accident situations they<br />
simulate due to limitations in the amount of data available and limitations in the level of<br />
understanding of the processes which might occur in an accident. Therefore, the<br />
consequences of a potential accident could be somewhat different than those calculated by<br />
the analysis. As a result, an uncertainty analysis was performed for the establishment of<br />
bounds enclosing the accident consequence levels, to a high level of confidence.
6.3 SAFETY ANALYSIS REPORTS<br />
6.3.1 Overview of Safety Analysis Reporting Activities<br />
Final Technical Report<br />
GPHS-RTGs for the Cassini Mission<br />
Lockheed Martin <strong>Document</strong> No. RR18<br />
August 1998<br />
At the outset of the CRAF/Cassini program, effort was applied towards preparing an Early<br />
Safety Assessment (ESA), based upon a Titan RTG Safety Databook to be provided by<br />
Martin Marietta under contract to NASA. The Titan Databook was to include only those<br />
accident scenarios considered by the RTG Working Group to present potentially significant<br />
threat environments to an RTG. The RTG Working Group consisted of representatives from<br />
DOE, GE, Martin Marietta, and NASA, organized to define requirements for CRAF/Cassini<br />
Databook content.<br />
Delays in receipt of this Databook, identified as the EIS Databook, precluded delivery of the<br />
ESA prior to October 1991, the initially defined release date for the CRAF/Cassini EIS. A<br />
Draft EIS Databook was received in July 1991, with updates in September and November<br />
of 1991. A Preliminary ESA was provided to DOE in October 1991, and updated in<br />
February 1992, addressing risks associated with four postulated scenarios:<br />
SRMU Fail-to-Fire<br />
Centaur Tank Failure/Collapse<br />
Command Shutdown and Destruct<br />
Inadvertent Reentry<br />
Comments received from DOE, DOE contractors, and affiliated national laboratories were<br />
incorporated into the Preliminary ESA, resulting in the release of the Draft ESA in<br />
September 1992. The Final ESA, retitled the RTG Safety Assessment (RSA), was released<br />
by DOE in May 1993.<br />
Activities for the preparation of the next databook version, titled the Preliminary Databook,<br />
kicked off in June 1992 with a meeting of the RTG Working Group. In contrast to prior<br />
mission databooks, the Preliminary Databook was to include probabilistic risk assessments<br />
for all included accident scenarios. Creating this type of document required intensive<br />
interactions between the RTG Working Group, NASA/LeRC, and INSRP through 1993 and<br />
1994. Event sequence diagrams were created for all credible accident scenarios and<br />
reviewed by the safety community for completeness.<br />
6-15
Final Technical Report<br />
GPHS-RTGs for the Cassini Mission<br />
Lockheed Martin <strong>Document</strong> No. RR18<br />
August 1998<br />
EIS supporting analyses were performed in mid-1993 in the areas of GPHS module thermal<br />
response to EGA reentry environments and a bounding estimate consequence assessment<br />
for EGA reentry. An event sequence tree describing probabilities for an individual module<br />
to occupy various states (e.g., tumbling vs. non-tumbling, rock impact vs. water impact vs.<br />
soil impact, etc.) was provided to NASA via DOE along with the analysis results listed<br />
above.<br />
During mid-1994, NASA considered the possible use of heritage design solid rocket motors<br />
(SRMs) in lieu of the as-yet untested solid rocket motor upgrades (SRMUs). Agreement was<br />
reached at that time between DOE and NASA to proceed with the Preliminary Safety<br />
Analysis Report (PSAR) under the assumption that only the SRMU configuration would be<br />
analyzed. As mentioned above, potential use of SRMs was identified in the June 1995 EIS<br />
but removed from consideration soon thereafter.<br />
The Preliminary Cassini Titan IV/Centaur RTG Safety Databook was received from NASA in<br />
October 1994 and incorporated into the RTG PSAR (Preliminary Safety Analysis Report),<br />
which was issued in December 1994. PSAR material was briefed to the INSRP in February<br />
1995. Subsequently, a compilation of over 350 comments was received from INSRP.<br />
Due to ongoing delays in the release of each Databook update, NASA agreed in late 1994<br />
to provide accident description and environment data packages in advance of the final<br />
release of the Databook. Data packages were received in February through April 1995 for<br />
all then-defined scenarios other than SRMU fragmentation and propellant fallback. Formal<br />
issuance of the Databook, Rev. 0, occurred in September 1995. Open items not fully<br />
addressed in this release included the SRMU environments and details regarding the Flight<br />
Hardware/RTG Impact environment. Databook definition for these environments was<br />
provided in November and December 1995. Given the time required to update and validate<br />
launch accident models to reflect these added items, accident cases including SRMU and<br />
Flight Hardware/RTG Impact effects were identified for inclusion in an addendum to the<br />
FSAR, to be issued several months after the FSAR.<br />
A replan of the entire safety analysis task was completed in June 1995. The effort related to<br />
treatment of variability and uncertainty was identified as significantly greater in scope than<br />
initially anticipated. This additional work was authorized by DOE under Task 8. The<br />
6-16
Final Technical Report<br />
GPHS-RTGs for the Cassini Mission<br />
Lockheed Martin <strong>Document</strong> No. RR18<br />
August 1998<br />
approach adopted for handling variability and uncertainty within launch accident analyses<br />
was reviewed with INSRP between August and December 1995. To assist both uncertainty<br />
analysis activities and accident modeling, DOE provided funding for support from the<br />
Sandia National Laboratory (SNL) Risk Assessment Department staff. Work scope for the<br />
SNL effort included consultation regarding uncertainty analysis methods, definition of<br />
consequence uncertainty parameter distributions, development of a liquid propellant fireball<br />
model, and providing a plume rise model for transport analyses.<br />
Due to severe schedule compression from delayed delivery of the RTG Safety Databook,<br />
the planned Updated Safety Analysis Report (USAR) was replaced by a series of INSRP<br />
presentations in which preliminary risk analysis methods and results were provided.<br />
Meetings in November 1995 provided updated definition of the analysis models while<br />
meetings in January and February 1996 provided analysis results from both launch and<br />
EGA swingby postulated accidents.<br />
In early 1996, NASA initiated an effort to more fully address the accident scenario in which<br />
an intact Titan IV/Centaur veers off-course and impacts the ground before the Range Safety<br />
Office can issue a destruct command. This accident type was termed a Full Stack Intact<br />
Impact (FSII). Lockheed Martin participated in the development of accident environments<br />
during mid-1996, providing an early assessment of fuel release, health and land<br />
contamination risks. Results of this assessment were briefed to NASA in August 1996 in<br />
support of a decision to request ground system enhancements at CCAS to preclude such<br />
an accident. The complete FSII risk analysis was detailed in the FSAR Addendum.<br />
The Draft Final Safety Analysis Report (DFSAR) was issued in July 1996, approximately<br />
coincident with the release of Rev. A of the Databook. The DFSAR provided source term<br />
and consequence results for the pre-launch, early launch and late launch mission<br />
segments. Pre-launch and early launch results did not include effects due to SRMU<br />
coincident impact, Flight Hardware/RTG environments, or Full Stack Intact Impact.<br />
Inadvertent EGA reentry source term and consequence results were not provided in the<br />
DFSAR, as this work was ongoing at the time. DFSAR comments were received from<br />
INSRP, NASA, DOE, and DOE contractors and subsequently reviewed for disposition.
Final Technical Report<br />
GPHS-RTGs for the Cassini Mission<br />
Lockheed Martin <strong>Document</strong> No. RR18<br />
August 1998<br />
The Final Safety Analysis Report (FSAR) was issued in November 1996. It included the<br />
EGA source term results and the consequence results for all four mission segments, but did<br />
not include environment changes from Rev. A of the Databook. The results of the FSAR<br />
uncertainty analysis were issued in December 1996 as an attachment to Volume HI of the<br />
FSAR. An Executive Summary of the FSAR was also released that month.<br />
Databook Rev. B was provided by NASA in draft form over a period from July 1996 to<br />
January 1997. Rev. B updates included a reduction in the overpressure resulting from<br />
Centaur propellant explosion (based on joint NASA/NASDA Hydrogen Oxygen Vertical<br />
Impact (HOVI) cryogenic tank destruct tests), new FSII environments, a revision to the<br />
SRMU propellant burn rate, and a change in accident probabilities for a number of launch<br />
accident scenarios. Results of calculations incorporating Databook Rev. A and Rev. B<br />
changes were presented in the FSAR Addendum, released in April 1997. The two most<br />
significant changes in the consequences were 1) an increase in predicted early launch<br />
consequence due to a greatly increased probability of space vehicle intact impact, and 2) a<br />
reduction in the probability of late launch accidents.<br />
The FSAR Addendum Supplemental Analyses Report, released in May 1997, presented an<br />
updated uncertainty analysis, updates in the reentry consequence analysis to reflect<br />
consequence modeling changes, and an analysis of the risks associated with the<br />
secondary launch window. An updated Executive Summary was released at the end of<br />
May 1997. Concurrent with release of the Updated Executive Summary, NASA issued a<br />
revised Earth Swingby Plan which specified lower Earth impact probabilities and higher<br />
nominal swingby altitude (-800 km vs. 500 km) than previously defined. These updates<br />
could not be incorporated into the FSAR Addendum documents but were subsequently<br />
evaluated in a consequence analysis and provided to DOE.<br />
A Supplemental Environmental Impact Statement was released in June of 1997. Its release<br />
was necessitated by new information developed since the EIS was issued in June 1995,<br />
including the HOVI test results and the higher consequences predicted in the FSAR and<br />
FSAR Addendum for pre-launch and late launch accidents than previously identified.
Final Technical Report<br />
GPHS-RTGs for the Cassini Mission<br />
Lockheed Martin <strong>Document</strong> No. RR18<br />
August 1998<br />
6.3.2 Summary of Safety Analysis Results<br />
A summary of safety analysis results from the EIS, FSAR, FSAR Addendum (FSAR Add),<br />
and the Supplemental EIS (SEIS) is given in Table 6.3-1. Early launch and late launch<br />
risks calculated for the FSAR were over an order of magnitude higher than the values<br />
calculated for the EIS. However, the FSAR risk for EGA was over an order of magnitude<br />
lower than the risk calculated for the EIS. The environment changes from Rev. A and Rev. B<br />
of the Databook resulted in an increased risk for early launch and a decreased risk for late<br />
launch in the FSAR Addendum, as discussed previously.<br />
Table 6.3-1 Summary Statistics for the Cassini Safety Analyses (Mean Values)<br />
Mission<br />
Segment<br />
Analysis<br />
Probability<br />
of<br />
Failure<br />
Probability<br />
of<br />
Release<br />
Source Term<br />
(Grams)<br />
50 Year<br />
Collective<br />
Dose a<br />
(Person-rem)<br />
50 Year<br />
Health<br />
Effects a<br />
(Excess<br />
Fatalities)<br />
50 Year<br />
Risk a<br />
(Excess<br />
Fatalities)<br />
Pre-<br />
Launch<br />
EIS*<br />
FSAR 1.4 x 10⁻⁴ 1.4 x 10 -4 0.3 3.6 1.8 x 10 2.5 x 10⁴<br />
FSAR Add 6.7 x 10⁻⁵ 5.2 x 10⁻⁵ 3.8 130 6.6 x 10 -2 3.4 x 10 -6<br />
SEIS 6.7 x 10 -5 5.2 x 10 -5 3.8 13 6.6 x 10 -2 3.4 x 10⁻⁶<br />
Early<br />
Launch<br />
EIS 2.0 x 10⁻³ 1.1 x 10 -3 0.37 1.2 4.1 x 10 -4 4.6 x 10⁻⁷<br />
FSAR 5.8 x 10⁴ 6.9 x 10⁻⁴ 0.57 21 0.10 7.3 x 10⁻⁶<br />
FSAR Add 6.2 x 10⁻³ 6.6 x 10⁴ 15 140 7.1 x 10 -2 4.7 x 10⁻⁵<br />
SEIS 6.2 x 10 -3 6.7 x 10⁻⁴ 14 140 7.1 x 10 -2 4.7 x 10⁻⁵<br />
Late EIS 3.7 x 10⁻² 9.3 x 10⁻⁴ 0.12 0.23 4.0 x 10 -4 3.8 x 10⁻⁷<br />
Launch<br />
FSAR 2.9 x 10⁻² 4.1 x10 -3 0.21 90 4.5 x 10 -2 1.9 x 10⁻⁴<br />
FSAR Add 2.1 x 10⁻² 2.1 x 10⁻³ 0.20 89 4.4 x 10 .2 9.4 x 10 -5<br />
SEIS 2.1 x 10 -2 2.1 x 10 0.20 88 4.4 x 10 -2 9.2 x 10⁻⁵<br />
EGA EIS 7.6 x 10⁴ ** 1.2 x 10⁴ 6.6 x 10 6 2.3 x 10³ 1.7 x 10⁻³<br />
FSAR 8.0 x 10⁻⁷ 6.3 x 10⁷ 2.6 x 10⁴ *** 2.5 x 10 5 1.3 x 10² 8.0 x 10⁻⁵<br />
FSAR Add 8.0 x 10⁻⁷ 6.3 x 10 -7 2.6 x 10 3 2.5 x 10 5 1.4 x 10² 8.6 x 10⁻⁵<br />
SEIS 8.0 x 10⁻⁷ 6.3 x 10⁴ 2.6 x 10 3 2.6 x 10 5 1.4 x 10 2 8.8 x 10⁻⁵<br />
Pre-launch was not considered in the EIS<br />
.. Not given. Source term mass is an expectation value<br />
... Not given in the FSAR<br />
a Without de-minimis applied<br />
6-19
Final Technical Report<br />
GPHS-RTGs for the Cassini Mission<br />
Lockheed Martin <strong>Document</strong> No. RR18<br />
August 1998<br />
FSAR Addendum results are presented in greater detail in the remainder of this section.<br />
Table 6.3-2 presents mean probabilities of failure and release as well as source term<br />
statistics by accident case, for the mission segment. The fact that the mean release values<br />
in the table are higher than the 50 th percentile releases indicates that the source term<br />
distributions are asymmetric.<br />
Figure 6.3-1 provides source term complimentary cumulative distribution functions (CCDFs)<br />
for phase 0, phase 1, and phases 3-8 launch accident cases, and EGA reentry. These<br />
CCDFs give the probability of the source term exceeding any given amount. For example,<br />
there is approximately a 2 x 10 -a (1 in 5000) probability that a phase 1 launch accident will<br />
occur that will result in a plutonia release exceeding 1 gram.<br />
Mean 50 year consequence values by mission segment are given in Table 6.3-3. Collective<br />
dose and health effect values are given with and without de-minimis. A calculation with deminimis<br />
assumes that no effects result from doses below a set level, which was 0.001 rem<br />
per year for the results shown.<br />
CCDFs for 50 year health effects without de-minimis are provided in Figure 6.3-2 by mission<br />
segment. The curves show the overall probability that health effects will exceed a given<br />
value. These probabilities include the POF and the conditional probability of plutonia<br />
release given that an accident has occurred.<br />
6-20
Final Technical Report<br />
GPHS-RTGs for the Cassini Mission<br />
Lockheed Martin <strong>Document</strong> No. RR18<br />
August 1998<br />
Table 6.3-2. Source Terms by Mission Segment<br />
Mission<br />
Segment<br />
PRE<br />
LAUNCH<br />
EARLY<br />
LAUNCH<br />
LATE<br />
LAUNCH<br />
EGA<br />
SWINGBY a<br />
(Short Term)<br />
Mission<br />
Phase(s)<br />
Probability of<br />
Release<br />
*<br />
Mean<br />
Release<br />
(grams)<br />
5th<br />
(grams)<br />
Release Percentiles *, **<br />
50th<br />
(grams)<br />
95th<br />
(grams)<br />
0 5.2 x 10 5 3.8 0.026 0.43 2.1 23<br />
99th<br />
(grams)<br />
1 6.6 x 10 4 15 0.027 0.38 52 3.6 x 10 2<br />
3-8 2.1 x 10⁻³ 0.10 0.014 0.064 0.23 0.37<br />
6.3 x 10 7 2.6 x 10³ 0.050 1.2 x 10³ 9.7 x 10³ 1.2 x 10⁴<br />
TOTAL<br />
MISSION 2.8 x 10- 3 4.1 0.016 0.084 2.0 61<br />
* For trials which produced fuel releases (grams of Pu0 2)<br />
** 5th Percentile:5% of trials produced mass release smaller than this value<br />
50th Percentile: 50% of trials produced mass release smaller than this value<br />
95th Percentile: 95% of trials produced mass release smaller than this value<br />
99th Percentile: 99% of trials produced mass release smaller than this value<br />
a For 500 km swingby altitude
Final Technical Report<br />
GPHS-RTGs for the Cassini Mission<br />
Lockheed Martin <strong>Document</strong> No. RR18<br />
August 1998<br />
1 0 -2<br />
Phases 3-8 -----<br />
Phase 1<br />
Combined<br />
10"<br />
Phase 0<br />
10"<br />
EGA --••--••--------i<br />
iL<br />
10 -<br />
10 -1 °<br />
10 -4 10 -210° 102<br />
1 04<br />
Source Term (Grams)<br />
Figure 6.3-1. Source Terms by Mission Segment<br />
6-22
Final Technical Report<br />
GPHS-RTGs for the Cassini Mission<br />
Lockheed Martin <strong>Document</strong> No. RR18<br />
August 1998<br />
Table 6.3-3. Probabilities, Mean 50 Year Consequences and Risk<br />
for the Primary Launch Opportunity by Mission Segment<br />
Mission<br />
Phase(s)<br />
Mission Segment<br />
Description<br />
Probability<br />
of Release<br />
Health<br />
Effects<br />
(without<br />
de-minimis)<br />
Health<br />
Effects<br />
(with<br />
de-minimis)<br />
Risk<br />
(without<br />
de-minimis)<br />
Risk<br />
(with<br />
de-minimis)<br />
Land Area<br />
Exceeding<br />
0.2 pCi/m 2 (km 2 )<br />
0 Pre-Launch 5.2 x 10⁻⁵ 0.066 0.053 3.4 x 10⁻⁶ 2.7 x 10⁻⁶ 1.5<br />
1 Early Launch 6.6 x 10⁻⁴ 0.071 0.044 4.7 x 10⁻⁵ 2.9 x 10⁻⁵ 1.6<br />
3 through 8 Late Launch 2.1 x 10⁻³ 0.044 0.040 9.4 x 10⁻⁵ 8.4 x 10⁻⁵ 0.057<br />
EGA 6.3 x 10⁻⁷ 140 26 8.6 x 10⁻⁵ 1.6 x 10⁻⁵ 19<br />
Total Mission 2.8 x 10⁻³ 0.081 0.047 2.3 x 10⁻⁴ 1.3 x 10⁻⁴ 0.44
Final Technical Report<br />
GPHS-RTGs for the Cassini Mission<br />
Lockheed Martin <strong>Document</strong> No. RR18<br />
August 1998<br />
100<br />
_o<br />
10-<br />
Combined<br />
Phases 3-8 ---<br />
Combined<br />
Phase 0<br />
Phase 1<br />
Phase 3-8<br />
EGA<br />
2 Phase 1<br />
o 10- Phase 0<br />
........<br />
?_•-•<br />
10' EGA<br />
•1<br />
, •<br />
I . 1<br />
a) 10 -<br />
E<br />
a)<br />
10"<br />
10 -12<br />
10-10<br />
10-5 100<br />
50 Year Health Effects<br />
Figure 6.3-2. 50 Year Health Effects without de-minimis (by Mission Segment)
6.4 POSTULATED ACCIDENT SCENARIOS<br />
6.4.1 Launch Accidents<br />
Final Technical Report<br />
GPHS-RTGs for the Cassini Mission<br />
Lockheed Martin <strong>Document</strong> No. RR18<br />
August 1998<br />
Launch accident scenarios were first developed in 1991 by Martin Marietta Space Launch<br />
Systems (Reference 6.4-1) as part of NASA's effort in the preparation of the Cassini EIS.<br />
Four specific accident scenarios, along with their initiating probabilities, were identified as<br />
representative of failures in the Titan IV SRMU/Centaur launch vehicle that could potentially<br />
occur during launch of the Cassini spacecraft: Command Shutdown and Destruct, Titan IV<br />
(SRMU) fail-to-ignite, Centaur tank failure/collapse, and inadvertent reentry from Earth orbit.<br />
These scenarios were chosen based on the collective expert judgment that the resulting<br />
environments could pose potential threats to the RTGs.<br />
In support of the Cassini FSAR, the Titan IV/Centaur RTG Safety Databook was developed<br />
by NASA by further expanding and adding to these postulated accidents as the Cassini<br />
mission design evolved and significant changes were made to the spacecraft and launch<br />
vehicle hardware.<br />
Using a Probabilistic Risk Assessment (PRA) approach, the Databook analysis estimated<br />
the known probabilities of the basic component or subassembly failures of the launch<br />
vehicle, referred to as Basic Initiating Events (BIEs). One or more of these BIEs will lead to a<br />
certain launch vehicle behavior, or vehicle-level accident event, known as Accident<br />
Initiating Condition (AIC). One or more of these AICs, in turn, will propagate to an Accident<br />
Outcome Condition (AOC), representing the first potential threat environment to the RTGs.<br />
The PRA process ends with a Final Environment (FE) which represents the last significant<br />
potential threat to the RTGs from the launch vehicle.<br />
A total of 111 AOC-to-FE pathways were identified in Databook Rev. A, each representing a<br />
unique sequence of RTG insults and includes a probability distribution function denoting the<br />
relative likelihood of occurrence. These event sequences were further grouped into 15<br />
representative accident scenarios (RASs), as shown in Table 6.4-1.<br />
6-25
Final Technical Report<br />
GPHS-RTGs for the Cassini Mission<br />
Lockheed Martin <strong>Document</strong> No. RR18<br />
August 1998<br />
Table 6.4-1. Representative Launch Accident Scenarios<br />
Scenario Launch Vehicle Configuration *<br />
0 1 2 3 4 5 6<br />
1. Common Core Automatic Destruct<br />
(ADS)<br />
2. Thermal Barrier Automatic Destruct<br />
(ADS)<br />
3. Total Boost Vehicle Destruct<br />
Activation<br />
4. Command Shutdown and Destruct<br />
(CSDS)<br />
5. Ground Impact X<br />
6. Water Impact X<br />
7. Flight Hardware/RTG Impact X<br />
8. Hard Surface Impact X<br />
9. Centaur Propellant Explosion X X<br />
10. SRMU Forward Segment<br />
Explosion<br />
X<br />
X X X<br />
X X X<br />
X X X X X<br />
11. SV Propellant Explosion X X X<br />
12. On-Pad Propellant Explosion X X<br />
13. Sub-Orbital Reentry X X X<br />
14. Orbital Reentry X<br />
15. Environment Resulting from<br />
Escape<br />
* Configuration Codes:<br />
0 - Entire Launch Vehicle with no Centaur Propellants<br />
1 - Entire Launch Vehicle, fully fueled<br />
2 - Launch Vehicle minus SRMUs<br />
3 - Launch Vehicle minus SRMUs and PLF<br />
4 - Launch Vehicle minus SRMUs, PLF, and Stage 1<br />
5 - Centaur and Cassini Space Vehicle<br />
6 - Cassini Space Vehicle only<br />
X<br />
X X X X X X<br />
The scenarios in Table 6.4-1 can be classified into those that can potentially result in<br />
release of Pu0 2 fuel and those which cannot, based on the severity of the associated FEs.<br />
Because of the low ambient pressure at altitude, the in-air environments for vehicles in<br />
configurations 2 or higher (generally in mission phases 2 or higher) are insufficient to cause<br />
release during ascent. Moreover, the remnants from these late accidents will impact on<br />
water, which produces insufficient force to cause release. Consequently, only those<br />
accidents postulated to occur in Phases 0 or 1 require launch accident simulation.<br />
6-26
Final Technical Report<br />
GPHS-RTGs for the Cassini Mission<br />
Lockheed Martin <strong>Document</strong> No. RR18<br />
August 1998<br />
Of the 111 AOC-to-FE pathways described in the Databook, 26 describe Phase 0 accidents<br />
and 28 describe accidents that have at least some probability of occurrence in Phase 1.<br />
Recognizing that the analysis of 54 separate accident cases is impractical, the Databook<br />
defines a series of binned RASs that describe the environment characteristics and the<br />
sequence of RTG insults associated with each RAS.<br />
Each composite accident case combines a unique set of AOC-to-FE paths with identical<br />
time distributions, such that the probability of the composite accident case may be regarded<br />
as the sum over the probabilities of occurrence of each of the constituent paths. Each<br />
composite accident case also leads to application of the environments of a single RAS or, in<br />
the flight hardware/RTG impact cases, two closely related scenarios. Consolidation of AOCto-FE<br />
paths yielded one phase 0, thirteen phase 1, and four reentry composite accident<br />
cases, as listed in Table 6.4-2 along with their associated mean POFs.<br />
6.4.1.1 Out-of-Orbit Reentry<br />
Out-of-orbit accidents encompass situations leading to reentry of the Cassini spacecraft into<br />
the Earth's atmosphere prior to insertion into the mission's interplanetary trajectory. These<br />
out-of-orbit reentry accidents are grouped as follows:<br />
Sub-orbital: Reentry due to accidents that occur prior to the attainment of the nominal<br />
Earth parking orbit, as completed by the Centaur first burn. These accidents can lead to<br />
surface impacts in the Atlantic Ocean, southern African continent, and Madagascar.<br />
Nominal orbital: Reentry due to decay from the nominal Earth parking orbit caused by a<br />
loss of directed thrust during the Centaur first or second burn. These accidents can lead to<br />
surface impacts between the northern and southern latitudes bounded by the park orbit<br />
inclination, which may be as high as 38 degrees. The nominal park orbit has a lifetime of<br />
approximately 10 days.<br />
Off-Nominal Orbital, Elliptic Decayed: These accidents involve reentry due to decay<br />
from elliptical Earth centered orbits, caused by a misdirected Centaur second burn. These<br />
accidents can result in surface impacts identically distributed to those resulting from decay<br />
from the nominal park orbit. The lifetime of these elliptic orbits may vary from slightly more<br />
than 10 days to tens of years based on the baseline trajectory.
Final Technical Report<br />
GPHS-RTGs for the Cassini Mission<br />
Lockheed Martin <strong>Document</strong> No. RR18<br />
August 1998<br />
Table 6.4-2. Composite Launch Accident Case Descriptions<br />
Mission<br />
Segment<br />
Pre-<br />
Launch<br />
Early<br />
Launch<br />
Accident<br />
Case<br />
Number<br />
Case<br />
Description<br />
Case Mean<br />
Probability of Failure<br />
(PDF)<br />
0.0 On-Pad Explosion, Configuration 1 6.7 x 10⁻⁵<br />
1.1 Total Boost Vehicle Destruct (TBVD) 4.2 x 10⁻³<br />
1.2 Command Shutdown and Destruct (CSDS) 6.6 x 10⁻⁴<br />
1.3 TBVD with SRMU Aft Segment Impact 8.1 x 10⁻⁴<br />
1.4 SRMU Explosion 1.2 x 10⁻⁴<br />
1.5 Space Vehicle (SV) Explosion 7.6 x 10⁻¹⁴<br />
1.6 TBVD without Payload Fairing (PLF) 9.1 x 10⁻⁶<br />
1.7 CSDS without PLF 1.5 x 10⁻⁶<br />
1.8 SV Explosion without PLF 1.4 x 10⁻⁶<br />
1.9 Centaur Explosion 1.4 x 10⁻⁴<br />
1.10 Space Vehicle/RTG Impact within Payload<br />
Fairing<br />
2.3 x 10⁻⁴<br />
1.11 Payload Fairing/RTG Impact 1.9 x 10⁻⁶<br />
1.12 Payload Fairing/RTG Impact, RTG Falls Free 1.9 x 10⁻⁶<br />
1.13 Full Stack Intact Impact 1.6 x 10⁻⁶<br />
Late<br />
Launch<br />
3.1 Sub-Orbital Reentry 1.4 x 10⁻³<br />
5.1 Sub-Orbital Reentry from CSDS<br />
Configuration 5<br />
1.2 x 10⁻²<br />
5.2 Orbital Reentry, Nominal 8.0 x 10⁻³<br />
5.3 Orbital Reentry, Off-Nominal Elliptic<br />
Decayed<br />
3.0 x 10⁻⁷
Final Technical Report<br />
GPHS-RTGs for the Cassini Mission<br />
Lockheed Martin <strong>Document</strong> No. RR18<br />
August 1998<br />
Off-Nominal Orbital, Powered, Elliptic Prompt/Delayed: A misdirected Centaur<br />
burn may result in reentry from an off-nominal Earth centered park orbit. In this case, the<br />
orbit's perigee lies within the Earth's atmosphere, leading to a prompt or delayed direct<br />
reentry. These accidents can lead to surface impacts between northern and southern<br />
latitudes of approximately 55 degrees.<br />
The sub-orbital accidents are classified in the Databook as those that occur after 275<br />
seconds MET. The nominal orbital, elliptic orbital, and off-nominal orbital accidents are<br />
those that occur after the start of the Centaur first burn, Main Engine Start (MES1).<br />
When the space vehicle (SV) reenters the atmosphere due to a launch vehicle or SV failure<br />
aerodynamic heating and loads cause structural failure at relatively high altitudes and the<br />
SV rapidly breaks apart. For the orbital decay condition the spacecraft breakup is predicted<br />
by NASA-JPL to occur between 330,000 feet at the earliest to 300,000 feet at the latest,<br />
consistent with observed spacecraft breakup altitudes. When SV breakup occurs, the 54<br />
GPHS modules from the three RTGs (18 per RTG) are released and become independent<br />
bodies directly exposed to the reentry environment.<br />
6.4.2 Earth Gravity Assist (EGA) Reentry<br />
The Cassini mission relies on planetary swingbys to reduce launch energy requirements<br />
and achieve the necessary velocities and orbit shaping required to reach Saturn. The<br />
baseline trajectory incorporates a Venus-Venus-Earth-Jupiter gravity assist. A reentry<br />
occurring during Earth swingby (i.e., entering Earth's atmosphere at an entry angle sufficient<br />
for capture (defined as less than or equal to -7 degrees) is considered a short-term Earth<br />
impact. Loss of spacecraft control during the interplanetary cruise could potentially result in<br />
a long-term Earth impact decades to millennia later as the spacecraft drifts in its orbit around<br />
the Sun. Cassini safety analyses considered only the short term reentry scenario in<br />
calculating mission risk.<br />
Micrometeoroid-induced rupture of a propellant or pressurant tank is the principal<br />
contributor to short-term Earth impact probabilities causing an anomalous velocity change<br />
and may cause a loss of spacecraft control. Other failure modes include failure of the main<br />
engine valves, the thruster valves, the accelerometer, the main engine gimbal actuator, the<br />
stellar reference unit, or the inertial reference unit. A failure that causes loss of spacecraft<br />
6-29
Final Technical Report<br />
GPHS-RTGs for the Cassini Mission<br />
Lockheed Martin <strong>Document</strong> No. RR18<br />
August 1998<br />
control such as a propellant tank failure would prevent recovery of the spacecraft. Most of<br />
the failure modes would require subsequent failures or would need to occur very close to<br />
the time of the planned Earth swingby to prevent recovery.<br />
The total probability of short-term Earth impact was calculated by NASA-JPL from the<br />
constituent probabilities of individual failure modes for the VVEJGA trajectory, taking into<br />
account both the probability of failure occurrence and the probability of non-recovery from<br />
that failure. As defined in the updated EGA Swingby Plan (Reference 6.4-2), the mean<br />
probability of short-term Earth impact for a 800 km Earth swingby VVEJGA trajectory was<br />
calculated to be 6.2 x 10⁻⁷. Conditional reentry angle and latitude impact probability<br />
distributions for the preliminary 500 km and updated 800 km swingby altitudes are<br />
illustrated in Figures 6.4-1 and 6.4-2 relative to latitude band population from a 1990 U.N.<br />
Survey (Reference 6.4-3).<br />
0<br />
0.75<br />
\\*<br />
800km<br />
*\\\\k 500km<br />
a<br />
0.5<br />
MEAN REENTRY ANGLES<br />
0.25 800km Mean= 37.3 deg.<br />
500km Mean= 45.6 deg.<br />
PROBABILITY OF A SHALLOW REENTRY(GAMMA
Final Technical Report<br />
GPHS-RTGs for the Cassini Mission<br />
Lockheed Martin <strong>Document</strong> No. RR18<br />
August 1998<br />
0.225 —<br />
z<br />
0<br />
• 0.2 —<br />
0<br />
w<br />
o • 0.175 —<br />
1-1<br />
0.15<br />
0<br />
2 0.125<br />
500 km Flyby Probability<br />
800 km Flyby Probability<br />
Fraction of World Population<br />
0.1<br />
0<br />
0.075<br />
ti<br />
ca<br />
0.05 -<br />
2• 0.025<br />
0<br />
41<br />
4<br />
I<br />
1 2 3 4 5 6<br />
7<br />
c<br />
8 9 10 11 12 13 14 15 16 17 18 19 20<br />
LATITUDE BAND NUMBER<br />
Figure 6.4-2. EGA Short Term Latitude Impact Conditional Probability Distributions<br />
for 800 km and 500 km Swingbys<br />
6-31
6.5 ACCIDENT MODELING<br />
Final Technical Report<br />
GPHS-RTGs for the Cassini Mission<br />
Lockheed Martin <strong>Document</strong> No. RR18<br />
August 1998<br />
Cassini mission accident modeling and analyses consist of three separate, parallel<br />
activities, each corresponding to one segment of the mission timeline:<br />
1. On-pad and early launch accidents (mission phases 0 to 2)<br />
2. Late launch accidents due to unsuccessful Earth escape (phases 3 to 8)<br />
3. Inadvertent reentry during Earth swingby<br />
This section provides a summary description of the methodology and modeling for each<br />
portion of the mission timeline.<br />
6.5.1 On-Pad and Early Launch Accidents<br />
A computer code entitled Launch Accident Scenario Evaluation Program for the Titan IV<br />
(LASEP-T) was developed to evaluate the response of the RTGs to threatening<br />
environments resulting from accidents during the pre-launch and early launch phases of the<br />
Cassini mission.<br />
The LASEP-T code follows the same model structure as that of the LASEP code, created to<br />
perform launch safety analyses for the Galileo and Ulysses missions using the Space<br />
Shuttle. Though some of the LASEP utility programs were carried over to the LASEP-T<br />
code, the majority of the accident models were re-written due to the differences in launch<br />
vehicle environments, significant updates to the various RTG response models, and the<br />
incorporation of uncertainty analyses.<br />
The development of LASEP-T was initiated in late 1994, with code executed for mission<br />
analyses through April 1997. During this period, LASEP-T was revised several times in<br />
response to the changes and additions to the postulated accidents and environments<br />
defined in the Databook, as well as updates to the RTG response models resulting from<br />
hydrocode analyses performed by OSC and the incorporation of RTG safety test results.<br />
6.5.1.1 Model Structure<br />
RTG response to a postulated accident depends not only on the threats from the local<br />
environment, such as blast overpressure and fragment impacts, but also on the timing of<br />
these relative to the launch sequence. Because the configuration of the launch vehicle and<br />
its position relative to the ground change as a function of time of flight, the model must<br />
include time as a variable. Moreover, because of the complexity and probabilistic nature of<br />
6-32
Final Technical Report<br />
GPHS-RTGs for the Cassini Mission<br />
Lockheed Martin <strong>Document</strong> No. RR18<br />
August 1998<br />
the dependence of RTG response on dynamical variables and vehicle configuration, the<br />
evaluation is performed by a Monte Carlo simulation.<br />
LASEP-T permits evaluation of RTG response in the pre-launch and early launch phases of<br />
the mission (Phases 0 and 1) by simulating the effects of the various threatening<br />
environments defined in the Databook resulting from launch accidents. The location and<br />
state of each RTG or RTG component is simulated from the initial insult, generally at altitude,<br />
through the final insult upon Earth impact. The outcome of the simulation consists of<br />
determining whether or not a release of PuO 2 fuel occurred, and if so, the salient<br />
characteristics of the release, including mass, location, particle size distribution, and particle<br />
density.<br />
The model is executed thousands of times to characterize each composite accident case,<br />
simulating a large number of accidents occurring at different times, and developing<br />
differently. Each execution cycle, simulating one accident occurrence, is called a trial.<br />
To simplify this process, LASEP-T includes an executive program which performs the<br />
simulation repeatedly until the desired number of trials has been achieved, recording the<br />
outcomes for each trial for subsequent statistical analysis. The iterative function of the<br />
executive program is illustrated in Figure 6.5.1-1 as the "MAIN LOOP", encircling the<br />
elements of the LASEP-T model which are performed repeatedly to simulate the desired<br />
number of trials.<br />
In each simulated trial, an AIC is first selected randomly based on the probability<br />
distributions given in the Databook. This condition represents the first point of departure<br />
from the nominal mission. At AOC, which may occur instantaneously with AIC or at any time<br />
thereafter, the accident has developed to a point at which the first threat to the RTGs can<br />
occur. At this point in the time sequence, the models of at-altitude environments must be<br />
applied to determine the state of the RTGs and RTG components. The typical sequence for<br />
these environments is a blast overpressure, followed by a fragment field, followed by a<br />
fireball. After the at-altitude environment models have been applied and the state of the<br />
RTGs and RTG components have been determined, the next element of the sequence is<br />
6-33
Final Technical Report<br />
GPHS-RTGs for the Cassini Mission<br />
Lockheed Martin <strong>Document</strong> No. RR18<br />
August 1998<br />
LASEP-T EXECUTIVE MODULE<br />
DATABOOK INPUTS,<br />
PARAMETERS &<br />
PROBABILITY DISTRIBUTIONS<br />
INITIALIZATION<br />
MODULE<br />
AOC TIME &<br />
POSITION<br />
MODULE<br />
MAIN LOOP<br />
EXPLOSION ENVIRONMENT<br />
MODULE<br />
(GETM ET)<br />
I (CBLAST) I I (OPRES) I<br />
FRAGMENT ENVIRONMENT<br />
MODULE<br />
(CFRAG) I<br />
I (SFRAG) I<br />
I (UHIT11) I<br />
I (FRGIMP) I<br />
IMPACT TIME &<br />
POSITION<br />
MODULE<br />
(PMRK)<br />
■■■■)100<br />
IMPACT ENVIRONMENT<br />
I<br />
MODULE<br />
(SURFIMP)I<br />
I<br />
(SVIMPT) I<br />
RELEASE<br />
MODULE<br />
I(DST2REL)1 (FPSIZE)<br />
LANNOCCOMV,VVX4:44,0%..V.M*C.:tlty<br />
RELEASE RECORDS<br />
FIREBALL ENVIRONMENT<br />
MODULE<br />
(FIREBALL)<br />
I I I (BINSWTCH) I<br />
I (DSTVAP) I<br />
SRMU PROPELLANT FALL-<br />
BACK & FIRE EVALUATION<br />
MODULE (OFF-LINE)<br />
Figure 6.5.1-1. Structure of LASEP-T Model<br />
6-34
Final Technical Report<br />
GPHS-RTGs for the Cassini Mission<br />
Lockheed Martin <strong>Document</strong> No. RR18<br />
August 1998<br />
their flight to the ground, either attached to the space vehicle, or separated and falling<br />
independently. The ground impact environments are then applied which include the<br />
mechanical effects of impact on steel, concrete, soil, or water, possibly in combination with<br />
overpressure, fragments, and fireball effects. Finally, some accidents will require<br />
application of an environment model to determine the effects of solid propellant impact and<br />
fires, when fragments of the SRMU propellant land in proximity to RTGs and RTG<br />
components. With the exception of phase 0 and Full Stack Intact Impact (FSII) accidents,<br />
these effects are not considered as part of the general simulation within LASEP-T, because<br />
the probability of proximity is sufficiently small that this event would occur rarely, even in a<br />
large number of trials. Rather, proximity probabilities are determined by analysis and the<br />
outcomes are then evaluated by a separate, stratified Monte Carlo simulation, as delineated<br />
in Section 6.5.1.3.<br />
For phase 0 on-pad explosion and FSII accidents, tailored versions of LASEP-T code were<br />
developed to include the SRMU propellant impact and fire effect which has significantly<br />
higher probability of occurrence than in an at-altitude accident. These accident models are<br />
described in Sections 6.5.1.4 and 6.5.1.5, respectively.<br />
6.5.1.2 Model Description<br />
This section provides a brief description for each of the key model subroutines that are used<br />
in LASEP-T to simulate various insult environments and corresponding RTG and RTG<br />
component responses in a launch accident.<br />
Mission Elapsed Time (GETMET) - This subroutine is used to define a Mission<br />
Elapsed Time (MET) and the launch vehicle state vector for when the accident is postulated<br />
to occur.<br />
Centaur Blast Model (CBLAST) - This subroutine simulates the blast overpressure<br />
from a Centaur tank failure/destruct, resulting in an L0 2/LH 2 explosion.<br />
The Centaur blast overpressure estimate was updated in the Revision B of the Databook as<br />
a result of the joint NASA/NASDA HOVI (Reference 6.5.1-2). The test data indicate a mean<br />
ignition delay time that is much shorter than the 80 milliseconds previously assumed in the<br />
Databook. This resulted in lower predicted overpressures at RTG locations from a mean of<br />
120 psi static to about 30 psi.<br />
6-35
Final Technical Report<br />
GPHS-RTGs for the Cassini Mission<br />
Lockheed Martin <strong>Document</strong> No. RR18<br />
August 1998<br />
Overpressure Damage Assessment Model (OPRES) - This subroutine determines<br />
the effect of a Centaur propellant explosion. Threshold values for removal of RTG<br />
components (i.e., RTG shell, GPHS aeroshell, fuel cladding) are compared to the<br />
overpressure. If the overpressure exceeds any of these, then the components are assumed<br />
to be stripped away, releasing the internal constituents. The maximum overpressure<br />
environment specified in the Databook is marginally greater than the iridium clad plastic<br />
deformation threshold, and well below the threshold to breach a fueled clad.<br />
Fragment Environment (CFRAG and SFRAG) - A blast overpressure environment<br />
can accelerate blast fragments which may threaten the RTGs. The fragment speed is<br />
determined by the overpressure impulse, as well as the mass projected cross-sectional<br />
area, and drag coefficient of the fragments. This model yields a postulated field of<br />
fragments with the initial positions and velocities of each fragment from the Centaur and<br />
from the SRMUs.<br />
Fragment Damage Assessment (UHITIT and FRGIMP) - This subroutine determines<br />
which, if any, of the fragments hit the RTGs or RTG components. The damage sustained in<br />
fragment collision is determined by comparing the kinetic energy of the fragment and the<br />
RTG relative to their center-of-mass to a set of threshold values. The center-of-mass, kinetic<br />
energy, E, is given by<br />
E = µv2<br />
V2 2<br />
— M1 M2 • IV1 — V2I<br />
2 mi + m 2 2<br />
where p. is the reduced mass, m1m2 / (rn1+m2)<br />
,<br />
and V is the relative velocity, v 1 -v2, for a<br />
fragment of mass, m 1 , and an RTG component of mass, m 2, respectively. The threshold<br />
values are 54.8 kJ for an intact RTG, and 12.6 kJ for the individual modules.<br />
Any modules suffering fragment impact are evaluated individually for damage. Whether the<br />
aeroshell ruptures or not, distortion is calculated for the fueled clads within the module<br />
based on the center-of-mass kinetic energy of the impacting entities, the state of the RTG or<br />
module when the impact occurred, and the impact configuration. If any RTGs remain<br />
attached to the space vehicle they are presumed to fall to the Earth's surface with the space<br />
[6-1]<br />
6-36
Final Technical Report<br />
GPHS-RTGs for the Cassini Mission<br />
Lockheed Martin <strong>Document</strong> No. RR18<br />
August 1998<br />
vehicle intact. Released modules and fueled clads are assumed to fall to the Earth's<br />
surface independently.<br />
Post-Accident Trajectory Model (PMRK) - This subroutine tracks each RTG and/or<br />
RTG components to eventual impact on the Earth's surface after sustaining at-altitude<br />
insults.<br />
The impact location or intercepting structure, is compared with the KSC/CCAS site map and<br />
a table of structure data, to determine the impact surface: water, sand (soil), steel, or<br />
concrete. The record for each independent RTG or RTG component is updated with impact<br />
location, impact velocity, time of impact, and impact surface.<br />
Surface Impact Assessment (SURFIMP) - Impacting the Earth's surface, or an<br />
intervening structure at a substantial velocity will result in distortion to the fueled clads, and<br />
possibly in the release of Pu0 2. The model for this response is based on the results of BCI<br />
and SVT tests. In addition to experimental data, extensive hydrocode analyses have been<br />
performed to supplement the test data.<br />
If released modules or fueled clads impact water, then no distortion is presumed to result. If<br />
the impact surface is sand, then a nominal distortion of 5% (based on BCI data for sand<br />
impact) is presumed to result. If the impact surface is concrete or steel, then the distortion is<br />
calculated from the correlations of BCI and SVT test data.<br />
The standard deviations for maximum-likelihood fits to BCI and SVT data are used to<br />
estimate the variation in fueled clad responses to surface impact.<br />
SV Intact Impact Damage Assessment (SVIMPT) - In the event that the RTG remains<br />
attached to the SV, impact with the Earth's surface will include the additional threats of a<br />
hypergol blast and a field of SV fragments accelerated by the blast. Extensive hydrocode<br />
analyses have been used to assess the response of the RTG to this environment (Reference<br />
6.5.1-2). This subroutine simulates all defined environments and predicts RTG response<br />
during an SV impact.<br />
Two possible scenarios of sequential insults to the RTGs have been postulated, depending<br />
on the SV impact orientation.
(A) 1. Ground surface impact<br />
2. Propellant pressurant tanks overpressure and fragment impact<br />
3. Hypergol blast overpressure<br />
4. SV fragment impact<br />
(B) 1. Propellant pressurant tanks overpressure and fragment impact<br />
2. Hypergol blast overpressure<br />
3. SV fragment impact<br />
4. Secondary ground surface impact<br />
Final Technical Report<br />
GPHS-RTGs for the Cassini Mission<br />
Lockheed Martin <strong>Document</strong> No. RR18<br />
August 1998<br />
In the first sequence (LVA-leading orientation), the RTG impacts the ground first, then the<br />
propellant pressurant tanks rupture producing an overpressure and fragment environment.<br />
This is followed by the hypergol blast overpressure and impact of SV fragments. In the<br />
second sequence (high gain antenna-leading orientation), where the RTG is still above<br />
ground when the hypergol explosion occurs, the propellant pressurant tanks rupture first,<br />
with attending overpressure and fragments. Next the hypergol blast occurs producing an<br />
overpressure and accelerating SV fragments toward the RTG. Finally the RTG, or RTG<br />
components, experience a secondary ground impact.<br />
Calculation of Fuel Release (DST2REL and FPSIZE) - After assessing how much<br />
distortion of the fueled clads will be induced by each of the environments, the next step in<br />
the accident simulation is to determine how much, if any, Pu02 fuel is released, the size<br />
distribution, and the release location. This is accomplished by two subordinate modules,<br />
one which evaluates distortion to determine the amount of fuel released (DST2REL), and<br />
one which distributes the release into particle size bins (FPSIZE).<br />
The DST2REL model evaluates release due to distortion, based on the results of the BC!,<br />
SVT, and FGT tests. It is assumed that in any one insult, the probability of developing a<br />
breach in the fueled clad depends only on the severity of the insult, and not on the severity<br />
of any prior insults.<br />
From the safety test data cited above, two release types are evident: small releases, in<br />
which cracks appear and some small particles of Pu0 2 escape the iridium cladding, and<br />
large releases in which a larger amount of the Pu0 2 pushes through the clad. There is no<br />
apparent correlation between fractional release and distortion within the two release types
Final Technical Report<br />
GPHS-RTGs for the Cassini Mission<br />
Lockheed Martin <strong>Document</strong> No. RR18<br />
August 1998<br />
based on analysis of the available test data. The DST2REL model includes variations in the<br />
amount of fuel released for both small and large releases.<br />
Once a clad is breached, a release is calculated for every insult even if the current insult is<br />
inadequate to produce a breach. The model FPSIZE, employed to determine the particle<br />
size distribution is based on the database of measured particle size distributions, from<br />
samples obtained in safety tests as described in Reference 6.5.1-3.<br />
The model for particle size distribution assumes that the maximum particle size for a given<br />
release is determined by the maximum crack width, and that for any given insult, the<br />
particles released will be limited to those less than the maximum size accommodated by the<br />
maximum crack width.<br />
The mass released is then distributed into "bins" to provide a piecewise distribution. In<br />
order to preserve resolution over a large range of sizes, a logarithmic sequence has been<br />
selected for the particle size bins, as shown in Table 6.5.1-1.<br />
Table 6.5.1-1. LASEP-T Particle Size Bins<br />
Minimum<br />
Diameter<br />
(11m)<br />
Geometric<br />
Mean<br />
Diameter<br />
(11m)<br />
Maximum<br />
Diameter<br />
(11m)<br />
Bin<br />
1 215.0<br />
Liquid Propellant Fireball (FIREBALLIBINSWTCH and DSTVAP) - The FIREBALL<br />
model assesses the effect of a liquid propellant fire on released PuO2. The fireball<br />
environment is applied if the release location lies within the diameter of the fireball.<br />
Equations describing fireball parameters (such as diameter and combustion duration) as<br />
6-39
Final Technical Report<br />
GPHS-RTGs for the Cassini Mission<br />
Lockheed Martin <strong>Document</strong> No. RR18<br />
August 1998<br />
functions of propellant mass are described in the Databook, and implemented within the<br />
FIREBALL model.<br />
FIREBALL calculates PuO 2 vaporization within a propellant fire. The net effect of<br />
vaporization is to reduce the diameter of the particles as the outer surface evaporates. This<br />
has the effect of shifting particles from higher size bins to lower size bins, with an adjustment<br />
to the mass in each bin to account for material converted to the vapor phase.<br />
Homogeneous agglomeration is simulated by the DSTVAP model, including PuO 2<br />
condensation into a sub-micron size aerosol, solidifying as the fireball temperature<br />
declines, and agglomerating into larger particles.<br />
6.5.1.3 SRMU Propellant Fallback Code<br />
The average conditional probability of an SRMU propellant impacting a RTG entity resulting<br />
from an at-altitude accident was initially estimated as approximately 10 -3. To get a<br />
statistically significant contribution from this accident scenario in the simulation, SRMU<br />
effects were analyzed outside of the LASEP-T Monte Carlo code, using LASEP-T trial-bytrial<br />
data for vehicle conditions and accident timing as input. The analysis consists of three<br />
separate steps: (1) FALLBACK to calculate the probability of direct or near-miss impacts by<br />
SRMU fragments onto RTG entities; (2) SRESP (SRMU Propellant Fallback Response<br />
Model) to determine the RTG response from the mechanical impact and subsequent solid<br />
propellant fires; and (3) a series of utility programs that combine these probabilities and<br />
source terms with those from the non-SRMU environments to provide an integrated input to<br />
the risk and consequence analysis.<br />
Calculation of the conditional probability for the SRMU coincident impact is partitioned into<br />
two components. The first is the probability of coincident impact, and the second is the<br />
probability that such impact will apply to more than one module. This latter consideration<br />
stems from the fact that the impact of a large segment upon the debris field of an early<br />
phase 1 accident will potentially involve multiple modules, particularly if impact occurs in the<br />
vicinity of an intact space vehicle impact.<br />
From the first 500 LASEP-T trials of a composite accident case which resulted in RTG<br />
components impacting land, FALLBACK calculates trajectories of freed modules or SVattached<br />
modules from Space Vehicle Intact Impact (SVII) and that of the SRMU fragments.<br />
6-40
Final Technical Report<br />
GPHS-RTGs for the Cassini Mission<br />
Lockheed Martin <strong>Document</strong> No. RR18<br />
August 1998<br />
For each trial, the expectation value of the probability of coincident impact was calculated<br />
using the module and space vehicle positions and velocities at AOC as initial conditions.<br />
The expectation values were determined as functions of 16 binned SRMU fragment sizes,<br />
12 binned fragment impact velocities, explosion strengths, impact surfaces (sand or<br />
concrete), and RTG entities (freed modules or SV-attached modules).<br />
These expectation values for single module or SV are then adjusted to account for the<br />
actual spatial distribution of modules about the SV debris centroid, and for the possibility<br />
that a single SRMU fragment impacts multiple isolated modules. Both of these can be<br />
accounted for by analysis of the actual module distribution associated with the specific trial<br />
results from LASEP-T. For intact SV impact, an offset vector is added to each module to<br />
account for random displacements during the impact and subsequent hypergol blast.<br />
Estimates of fuel releases due to SRMU impact and subsequent exposure to SRMU fire<br />
were calculated from the modified versions of LASEP-T's DST2REL, FIREBALL,<br />
SBINSWITCH and SDSTVAP subroutines. Modifications were required to extend the fuel<br />
release model to the large distortions which can result from coincident impact. The fueled<br />
clad distortion model was constructed using the hydrocode calculations performed by<br />
Orbital Sciences Corporation for varying SRMU fragment sizes and velocities and impact<br />
surfaces (Reference 6.5.1-4).<br />
The response of the RTG components to the SRMU propellant fire was based on a safety<br />
test in which a bare fueled clad with urania simulant survived a 10.5 minute fire from<br />
burning UT-3001 solid propellant. These results were confirmed for the current propellant<br />
material using a computer-aided thermal analysis employing the SINDA computer code.<br />
The response of any released radioisotope fuel in the presence of an SRMU propellant fire<br />
was determined by analysis of the vaporization and agglomeration effects for the fire<br />
description given in the Databook, and is similar to the liquid propellant FIREBALL<br />
subroutine described above.<br />
6.5.1.4 Full Stack Intact Impact (FSII) Code<br />
A modified version of the LASEP-T Monte Carlo code was generated to simulate the FSII<br />
accident. In contrast to LASEP-T simulation of other phase 1 launch accidents where the<br />
initiating launch vehicle conditions are determined randomly from probability distribution<br />
functions provided in the Databook, the launch vehicle conditions in an FSII are<br />
6-41
Final Technical Report<br />
GPHS-RTGs for the Cassini Mission<br />
Lockheed Martin <strong>Document</strong> No. RR18<br />
August 1998<br />
intercorrelated and thus can not be randomly selected from distribution functions. As a<br />
result, detailed vehicle conditions from 4045 Lockheed Martin Astronautics simulations<br />
used to define the Databook environments are used to define the initial states of the launch<br />
vehicle as input to the modified LASEP-T/FSII code. Also unique to FSII code is the<br />
inclusion of SRMU fragment impact and fire models, as the probability of coincident impact<br />
is significantly higher than other phase 1 accidents. The parameters that characterize each<br />
FSII trial include:<br />
• Mission elapsed time when the vehicle c.g. (center of gravity) impacts the ground<br />
• Velocity of vehicle c.g. at impact<br />
• The total accumulated vehicle rotation from the initial launch position<br />
• The angular rate of the roll axis in the pitch plane at impact<br />
• Surface location of vehicle c.g. impact point<br />
Given the vehicle's Earth surface impact angle, the impact can be identified as either tailfirst<br />
or nose-first. For nose-first FSII, the SV/RTG assembly impacts the ground intact,<br />
producing insult environments for RTGs similar to that for the SVII scenario in other launch<br />
accident cases (i.e., surface impact, hypergol blast and SV fragments). In addition to the<br />
SVII environments, fragments resulting from the breakup of Titan IV stages 1 and 2 and the<br />
Centaur could potentially impact the RTGs in a nose-first FSII accident.<br />
For tail-first impacts, an ADS triggered destruct of the entire vehicle would be activated<br />
within milliseconds of initial vehicle contact with the Earth's surface. The blast overpressure<br />
from the Centaur auto destruct could damage the RTG housing, resulting in the free fall of<br />
GPHS modules to the ground, or separate the SV/RTG assembly from the Centaur, leading<br />
to an SVII.<br />
In all accidents, a ADS triggered SRMU destruct will lead to SRMU fragmentation and the<br />
possibility of SRMU coincident impact with modules on the ground. The effects of both<br />
liquid and solid propellant fires on any released fuel are determined, with the assumption<br />
that fuel released into a liquid propellant fire is lofted by the fireball and is not subject to the<br />
solid propellant fire environment. Figure 6.5.1-2 summarizes the two possible sequences of<br />
insult environments that the RTGs will experience in an FSII accident. The models utilized to<br />
simulate each of the accident environments provided in Figure 6.5.1-2 are the same as<br />
those used for LASEP-T and SRMU propellant fallback codes described above.<br />
6-42
Final Technical Report<br />
GPHS-RTGs for the Cassini Mission<br />
Lockheed Martin <strong>Document</strong> No. RR18<br />
August 1998<br />
Nose-First Impact<br />
— SVII Environments<br />
• Ground surface impact<br />
• SV/tank fragments<br />
• Hypergol blast<br />
— Centaur Blast<br />
— LV Fragment Impact<br />
— SRMU Fragment Impact<br />
— Liquid Propellant Fire<br />
— SRMU Fire<br />
Tail-First Impact<br />
- Centaur Blast<br />
- Module Ground Surface<br />
Impact or SVII Environments<br />
- SRMU Fragment Impact<br />
- Liquid Propellant Fire<br />
- SRMU Fire<br />
Figure 6.5.1-2. FSII Environment Paths for RTGs<br />
6.5.1.5 Phase 0 On-Pad Propellant Explosion Code<br />
After the start of LH 2 filling, an on-pad propellant explosion can be caused by a Centaur<br />
LOX/LH 2 cryogen explosion or by inadvertent activation of the core or SRMU flight<br />
termination system destruct charges after the Titan IV destruct system is armed at 1-17<br />
seconds. For a Centaur explosion prior to ADS arming, the core vehicle can remain intact.<br />
When this occurs, both the core vehicle and the SRMUs remain upright and the SV is<br />
propelled upward and eventually impacts the launch pad intact. In the event that the core<br />
vehicle explodes after the Centaur failure, the SRMUs will separate and fall outboard, away<br />
from the vehicle, and potentially impact the SV on the ground.<br />
A separate LASEP-T-based Monte Carlo code was created to simulate the various event<br />
sequences of this accident. In all cases the space vehicle is assumed to impact concrete<br />
while intact (i.e., Centaur/core vehicle blast overpressure never result in RTG components<br />
being separated from the SV). This assumption is based on independent LASEP-T<br />
simulations which indicated intact SV impacts with three RTGs attached occur in -80% of all<br />
Centaur blast-initiated trials. SRMU segments which strike the SV are assumed to impact<br />
all 54 modules as SRMU dimensions are greater than anticipated module dispersion<br />
distances. Releases caused by SRMU impact upon the SV are shielded from, and therefore<br />
unaffected by liquid propellant fireballs. Conversely, releases due to insults other than<br />
SRMU impact are assumed to be lofted by the appropriate liquid propellant fireball and are<br />
unaffected by solid propellant fire.
Final Technical Report<br />
GPHS-RTGs for the Cassini Mission<br />
Lockheed Martin <strong>Document</strong> No. RR18<br />
August 1998<br />
6.5.1.6 Summary of Source Term Results<br />
Source terms from phase 1 accidents are tabulated for those cases selected for full accident<br />
analysis, including SRMU effects (Table 6.5.1-2). Collectively these cases capture over<br />
85% of the phase 1 expected risk. No source terms are predicted for phase 2 of the early<br />
launch mission segment.<br />
Table 6.5.1-2. Source Terms for Pre-Launch and Early Launch Accident Cases<br />
*<br />
Release Percentiles *, **<br />
Case<br />
Accident Case<br />
Mean POF<br />
Probability<br />
of Release<br />
Mean<br />
Release<br />
(grams)<br />
5th<br />
(grams)<br />
50th<br />
(grams)<br />
95th<br />
(grams)<br />
99th<br />
(grams)<br />
0.0<br />
On-Pad Explosion,<br />
Configuration 1 6.7 x10 5 5.2 x 10⁻⁵ 3.8 0.026 0.43 2.1 23<br />
1.1 Total Boost Vehicle<br />
Destruct<br />
4.2 x 10 3 4.5 x 10 4 15 0.027 0.38 56 3.6 x 10²<br />
1.3<br />
1.10<br />
Total Boost Vehicle<br />
Destruct with SRMU Aft<br />
Segment Impact<br />
SV/RTG Impact within<br />
Payload Fairing<br />
8.1 x 10 -4 1.2 x 10 4 17 0.032 0.52 56 4.6 x 10²<br />
2.3 x 10 4 2.1 x 10⁻⁵ 5.8 0.045 0.44 15 1.0 x 10²<br />
1.13 Full Stack Intact Impact 1.6 x 10⁻⁶ 9.3 x 10⁻⁷ 13 0.032 0.49 32 3.2 x 10²<br />
For trials which produced fuel releases (grams of Pu0 2)<br />
** 5th Percentile: 5% of trials produced mass release smaller than this value<br />
50th Percentile: 50% of trials produced mass release smaller than this value<br />
95th Percentile: 95% of trials produced mass release smaller than this value<br />
99th Percentile: 99% of trials produced mass release smaller than this value<br />
A summary of source terms and the probabilities for accident cases in mission phases 0 and<br />
1 are provided in Section 6.3.2. Typical particle size distributions for the fuel releases<br />
representative of the pre- and early launch phases are shown in Tables 6.5.1-3 and 6.5.1-4<br />
for case 1.1 (TBVD) and case 1.13 (FSII), respectively. The fuel release types are defined<br />
as:<br />
Type 1: a ground release outside of a fire<br />
Type 2: a ground release in a core fireball<br />
Type 3: a release in an SV hypergol fireball<br />
Type 4: a ground release in a core and SV fireball<br />
Type 13: a ground release due to SRMU impact, accompanied by<br />
SRMU propellant fire<br />
6-44
Final Technical Report<br />
GPHS-RTGs for the Cassini Mission<br />
Lockheed Martin <strong>Document</strong> No. RR18<br />
August 1998<br />
9<br />
Bin<br />
1<br />
2<br />
3<br />
4<br />
5<br />
6<br />
7<br />
8<br />
10 46.4<br />
Min Dia<br />
(Am)<br />
215.0 5.9 x 10 -2 85 8.0 x 10 -2<br />
Total 0.24 95 0.17<br />
Type 2 Release<br />
Core Fireball<br />
50th<br />
Percentile<br />
99th<br />
Percentile<br />
9.6 x 10 -4<br />
4.3 x 10⁻³<br />
7.3 x 10⁻⁵<br />
6.5 x 10⁻⁴<br />
3.0 x 10⁻³<br />
8.1 x 10⁻³<br />
1.6 x 10 -2<br />
3.9 x 10⁻²<br />
8.2 x 10 -2<br />
0.17<br />
0.33<br />
0.56<br />
0.10<br />
0.88<br />
1111111111111111111111<br />
Type 3 Release<br />
SV Fireball<br />
50th<br />
Percentile<br />
3.1 x 10 -5<br />
7.0 x 10'4<br />
2.7 x 10 -4<br />
3.5 x 10 -4<br />
1.1 x i o-3<br />
2.5 x 10 -3<br />
5.4 x 10 -3<br />
1.1 x 10 -2<br />
2.4 x 10 -2<br />
5.0 x 10⁻²<br />
99th<br />
Percentile<br />
1.0 x 10⁻²<br />
11<br />
RIM<br />
4.5 x 10²<br />
490<br />
0.23<br />
7.6 x 10 -2<br />
4.4 x 10⁻²<br />
0.19<br />
0.51<br />
Type 4 Release<br />
Core + SV Fireball<br />
50th<br />
Percentile<br />
3.5 x 10⁻⁴<br />
1.5 x 10 -3<br />
1.2 x 10 -5<br />
9.3 x 10⁻⁵<br />
6.2 x 10⁻⁴<br />
2.0 x 10 -3<br />
4.7 x 10 -3<br />
x<br />
2.2 x 10⁻²<br />
3.5 x 10⁻²<br />
4.7 x 10 -2<br />
3.1 x 10⁻²<br />
0.15<br />
99th<br />
Percentile<br />
3.1 x 10⁻²<br />
0.14<br />
1.2 x 10⁻³<br />
9.7 x 10⁻³<br />
6.1 x 10⁻²<br />
0.19<br />
0.44<br />
0.94<br />
2.0<br />
8.2<br />
98<br />
110
Final Technical Report<br />
GPHS-RTGs for the Cassini Mission<br />
Lockheed Martin <strong>Document</strong> No. RR18<br />
August 1998<br />
Table 6.5.1-4. Case 1.13 (FSII) Representative Particle Size Distributions (in gms of PuO 2)<br />
Type 3 Release<br />
SV Fireball<br />
Type 4 Release<br />
Core + SV Fireball<br />
Type 13 Release<br />
SRMU Impact + Fire<br />
Bin #<br />
Min Dia<br />
(gm)<br />
Max Dia<br />
(-1111)<br />
50th<br />
Percentile<br />
99th<br />
Percentile<br />
50th<br />
Percentile<br />
99th<br />
Percentile<br />
50th<br />
Percentile<br />
99th<br />
Percentile<br />
1 215.0 0.27 73.40 0.13 56.00 0.50 1.2 x 10³
Final Technical Report<br />
GPHS-RTGs for the Cassini Mission<br />
Lockheed Martin <strong>Document</strong> No. RR18<br />
August 1998<br />
The majority of fuel releases are types 3, 4 and 13 where liquid and solid propellant fires<br />
are present. The fire affects mostly the smaller particle size bins when compared to the type<br />
1 releases. For liquid fireballs, vaporization and recondensation effects occur primarily in<br />
the first two bins, whereas for solid propellant fires, which have a much longer duration and<br />
are accompanied by a high concentration of Al203, the particle vapor recondenses over a<br />
wider range of size bins. Type 13 release is not shown for case 1.1 in Table 6.5.1-3,<br />
however, the distribution is very similar to that for case 1.13.<br />
6.5.2 Late Launch Accidents<br />
This section addresses the techniques applied and results obtained in assessing the<br />
potential for fuel release in the event of an accidental out-of-orbit reentry of the Cassini<br />
spacecraft into the Earth's atmosphere. For reentry accidents, the determination of source<br />
terms involve both the evaluation of fuel containment during reentry (to assess the potential<br />
for an in-air release) and also the evaluation of impact on the Earth's surface.<br />
Out-of-orbit accidents encompass situations leading to reentry of the Cassini spacecraft into<br />
the Earth's atmosphere prior to insertion into the mission's interplanetary trajectory. These<br />
out-of-orbit reentry accidents are grouped as sub-orbital, nominal orbital, off-nominal<br />
(elliptic decayed), and off-nominal (elliptic prompt/delayed) and are described in detail in<br />
Section 6.4.1.<br />
When the space vehicle (SV) reenters the atmosphere due to a launch vehicle or SV failure,<br />
aerodynamic heating and loads cause structural failure at relatively high altitudes and the<br />
SV rapidly breaks apart. When this occurs, the 54 GPHS modules from the three RTGs (18<br />
per RTG) are released and become independent bodies directly exposed to the reentry<br />
environment.<br />
Once the GPHS modules become independent reentry bodies their trajectory and<br />
associated aerothermal environment is predicted utilizing a three degree-of-freedom<br />
trajectory prediction tool (3DMP). This tool models the three translational equations of<br />
motion as influenced by the Earth's gravity, aerodynamic drag, and atmosphere. The<br />
simulation, as modeled here, utilizes a 1984 WGS Earth model with 8th order gravity<br />
harmonic, and a 1976 U.S. Standard atmosphere.<br />
6-47
Final Technical Report<br />
GPHS-RTGs for the Cassini Mission<br />
Lockheed Martin <strong>Document</strong> No. RR18<br />
August 1998<br />
The graphitic FWPF aeroshell of the GPHS module is designed to survive the reentry<br />
environment by transporting the heat away from the aeroshell surface through ablation.<br />
Predictions of the mass rate of ablation for out-of-orbit reentries are performed using a finite<br />
difference thermal conduction code described later. Stagnation point recession has been<br />
calculated over the entire potential reentry accident envelope.<br />
Analyses indicate that the GPHS modules will survive the reentry environment for all out-oforbit<br />
accident cases, even under worst case conditions. The maximum aeroshell recession<br />
for non-multiskip trajectories is 0.068 inches, which is 37% of the aeroshell minimum<br />
thickness. If the module reenters under conditions that lead to multiple skips (reentries) the<br />
recession may increase to as much as 0.130 inches.<br />
Because the individual modules survive out-of-orbit reentry, they will impact the Earth's<br />
surface intact. A statistical assessment of module response to surface impacts has been<br />
performed by Monte Carlo simulation. This simulation determines the impact position<br />
probability distribution on the Earth's surface, the surface characteristics (surface type and<br />
altitude), and the statistical response of the module to that impact. The impact position<br />
distribution is influenced by launch trajectory characteristics such as launch time and date,<br />
and velocity/position state condition, and reentry characteristics such as atmospheric<br />
variability and module drag condition. The surface demographics are based on a 720<br />
equal-area worldwide grid data base developed by Halliburton NUS (Reference 6.5.2-1).<br />
The impact response, in terms of fuel release and particle size distribution is determined<br />
using launch accident evaluation models based on empirical safety test results as<br />
described in Sections 6.2 and 6.5.1.<br />
6.5.2.1 Reentry Envelope<br />
The envelope of all potential spacecraft reentry conditions, as defined by velocity (V) and<br />
flight path angle ('y) at 400,000 ft is illustrated in Figure 6.5.2-1. This is referred to as the V -<br />
y envelope.<br />
6-48
Final Technical Report<br />
GPHS-RTGs for the Cassini Mission<br />
Lockheed Martin <strong>Document</strong> No. RR18<br />
August 1998<br />
-35<br />
-30<br />
-25<br />
rn<br />
-20<br />
-15<br />
CENTAUR SMB<br />
WE ENVELOPE<br />
(incl. prompt/delayed reentry and powered reentry)<br />
Ix -10<br />
SUB-ORBITAL<br />
REENTRY<br />
ORBITAL<br />
DECAY<br />
SKI POUT<br />
BOUNDARY<br />
\\\\\\,\\\\<br />
3 4 5 6 7 8 9 10 11<br />
Reentry Velocity (Km/sec)<br />
Figure 6.5.2-1. Reentry Envelope<br />
The sub-orbital conditions are represented by the solid curve from approximately V = 4.5<br />
km/s and y = -8 degrees (corresponding to the earliest potential failure in the Titan IV stage<br />
2 that would lead to reentry conditions) to approximately V = 7.9 km/s and y = 0 degrees<br />
(corresponding to an accident just prior to the termination of the Centaur first burn park orbit<br />
injection).<br />
The orbital decay reentry condition at 7.9 km/s, nearly zero flight path angle corresponds to<br />
reentry from the Earth park orbit (known above as nominal orbital reentry). This same<br />
condition is replicated for decays from elliptical orbits.<br />
The skip-out boundary separates those reentry conditions where the SV or module, upon<br />
entering the atmosphere, continues to Earth impact (above the boundary) or penetrates to a<br />
given altitude, loses insufficient energy for capture, and exits the atmosphere temporarily<br />
(below the boundary). These skip-out conditions, up to super-orbital velocities, arise due to<br />
a highly unlikely steady misdirected burn (SMB) of the Centaur upper stage. Together the<br />
sub-orbital and skip-out conditions bound the lower edge (shallowest flight path angles) of<br />
the V - y envelope.<br />
6-49
Final Technical Report<br />
GPHS-RTGs for the Cassini Mission<br />
Lockheed Martin <strong>Document</strong> No. RR18<br />
August 1998<br />
The upper boundary of the V - y envelope also arises due to a SMB of the Centaur resulting<br />
in reentry. In these cases the Centaur places the spacecraft into either highly elliptical orbits<br />
which reenter (perigee within the atmosphere) or literally drives the spacecraft out of its<br />
initial park orbit. Further, in some cases the Centaur may still be thrusting, producing a<br />
powered reentry. The SMB reentry envelope was developed by using 3DMP to model the<br />
Centaur burn with a finite duration and a randomly oriented thrust direction.<br />
The above reentry conditions are utilized as initial 3DMP trajectory modeling conditions.<br />
The spacecraft, prior to RTG breakup, is modeled with a constant ballistic coefficient of 60<br />
psf (per NASA-JPL). When the spacecraft reaches the breakup altitude predicted by NASA-<br />
JPL the GPHS module is regarded as exposed to the reentry aerothermal environment. At<br />
this point the trajectory simulation is continued with the aerodynamic and mass property<br />
characteristics of the module.<br />
6.5.2.2 Out-of-Orbit Aerothermal Model<br />
The primary model utilized for the out-of-orbit recession predictions is the Reaction Kinetics<br />
and Ablation Program (REKAP). This one-dimensional finite difference conduction and<br />
surface mass loss model is well suited for the determination of the aeroshell stagnation<br />
point recession.<br />
REKAP solves the multi-layer heat conduction problem using an applied surface heating,<br />
accounting for transient material properties as a function of pressure and temperature.<br />
Energy is re-radiated from the surface using the appropriate temperature-dependent<br />
hemispherical emittance with the backface boundary condition assumed to be adiabatic<br />
and defined with either a heat loss input or as a backface temperature history. The REKAP<br />
code predicts in-depth decomposition and surface recession with models available for<br />
many reentry material heat shields. For this study a well-calibrated graphite<br />
thermochemical model/database is used based on flight and ground test data and results.<br />
This model has been validated over the past 25 years in the design of reentry vehicle<br />
thermal protection systems for MK12/12A (MINUTEMAN), MK21 (PEACEKEEPER), MK500,<br />
MK4, RVTO, MSV, and NASA planetary exploration missions such as Pioneer Venus and<br />
Galileo.<br />
6-50
Final Technical Report<br />
GPHS-RTGs for the Cassini Mission<br />
Lockheed Martin <strong>Document</strong> No. RR18<br />
August 1998<br />
For purposes of analysis the 1D REKAP model approximates the 3-D GPHS module using<br />
one-dimensional layers of each module element's thickness and properties to the center of<br />
the Pu0 2 (Figure 6.5.2-2).<br />
4<br />
# NODES<br />
AEROSHELL 0.19" FWPF<br />
6<br />
INSULATOR 0.07" CBCF<br />
6<br />
0.1675" FWPF<br />
4<br />
GIS<br />
0.0255" CLAD<br />
4<br />
0.542" FUEL<br />
4<br />
ADIABATIC BACKFACE<br />
NOTE: MODEL REPRESENTS SECTION THROUGH ONE GIS<br />
i.e. LOCATION WHERE FWPF AEROSHELL HAS MINIMUM THICKNESS<br />
Figure 6.5.2-2. One Dimensional Layered REKAP Model for GPHS Module<br />
The nominal stagnation point recession for the broad-face of the module has been<br />
predicted assuming a face-on (normal to velocity vector) stable orientation throughout<br />
reentry. This attitude exposes the aeroshell surface to the most severe, steady heating<br />
environment. Further, it is assumed that the RTG breakup occurs rapidly at the predicted<br />
altitude, releasing the modules to the free stream environment at the highest (earliest)<br />
opportunity. These two assumptions result in the most severe recession prediction.<br />
The heating (free molecular, convective, and radiative) used for each reentry trajectory was<br />
computed in the 3DMP trajectory code using the techniques described, with recession<br />
calculated using the REKAP code.<br />
6-51
Anal Technical Report<br />
GPHS-RTGs for the Cassini Mission<br />
Lockheed Martin <strong>Document</strong> No. RR18<br />
August 1998<br />
The convective stagnation point heating rate to a sphere, without mass transfer effects, is<br />
calculated using approximations of the more rigorous formulations developed by Lees<br />
(Reference 6.5.2-2). The stagnation point heating for the aeroshell, with one face normal to<br />
the velocity vector, is estimated by applying a geometrical correction factor to the spherical<br />
stagnation point heating. Radiative heating is computed using the stagnation point radiative<br />
heating presented in Reference 6.5.2-3, by Tauber and Sutton.<br />
The specific reentry trajectories evaluated were selected to enable a recession map to be<br />
developed for the entire V-1 envelope as shown in Figure 6.5.2-1. The resulting recession<br />
predictions for the stagnation point of the broadface of the aeroshell were utilized to<br />
generate the V-y recession map shown in Figure 6.5.2-3.<br />
-35<br />
-30<br />
73.3<br />
-25<br />
CENTAUR SMB<br />
R/E ENVELOPE<br />
Lines of Constant<br />
Stagnation Point<br />
Recession<br />
(Indicated In mils)<br />
/<br />
1 0/<br />
1 5 / /<br />
--*<br />
SUB-ORBITAL<br />
REENTRY<br />
20 ,<br />
....<br />
„—<br />
..,<br />
.<br />
----<br />
./ —,-- 2 5<br />
.<br />
---<br />
,-- ---<br />
. ..--- ---<br />
---<br />
..-- -- — —<br />
3 O<br />
0_ --<br />
_<br />
-- ---- — --- —--<br />
— — —<br />
-- 4050<br />
— ...---<br />
68<br />
ORBITAL<br />
DECAY<br />
Si:TROUT<br />
OUN DA RY<br />
\\\\\\\\\\\<br />
54<br />
3 4 5 6 7 8 9 1 0 1 1<br />
c<br />
Reentry Velocity (Km/sec)<br />
Figure 6.5.2-3. GPHS Module Stagnation Point Recession Contours<br />
6-52
Final Technical Report<br />
GPHS-RTGs for the Cassini Mission<br />
Lockheed Martin <strong>Document</strong> No. RR18<br />
August 1998<br />
Sub-orbital accident reentries will result in recessions varying from 0.011 to 0.054 inches<br />
(or 6% to 29% of the minimum thickness). For accidents resulting in orbital decay reentries<br />
the expected recession is 0.054 inches.<br />
The super-orbital, near skip-out condition of 11 km/sec and -5.1 degrees yields a maximum,<br />
non-multiskip recession of 0.068 inches or approximately 37% of the aeroshell thickness.<br />
This results from the combination of high velocity and long flight duration producing<br />
maximum integrated heating. For multiple skips (reentry below the skip-out bound), the<br />
stagnation point recession may increase to as much as 0.130 inches or 71% of the<br />
aeroshell thickness.<br />
The surface temperature history for the FWPF aeroshell was computed using REKAP for the<br />
worst case, face-on stable, orientation of the GPHS module as well as the less severe<br />
random tumbling flight condition. The peak temperature experienced for a set of<br />
representative trajectories across the V-7 envelope is provided in Table 6.5.2-1.<br />
Table 6.5.2-1. Maximum Surface Temperature for GPHS Module - Out-of-Orbit Accidents<br />
Reentry<br />
Case<br />
Velocity<br />
(km/s)<br />
Flight Path<br />
Angle<br />
(deg)<br />
Maximum<br />
Stagnation Point<br />
Temperature (and<br />
Altitude at Peak<br />
Temp.)<br />
- Face-on Stable -<br />
Maximum Stagnation<br />
Point Temperature (and<br />
Altitude at Peak Temp.)<br />
- Random Tumbling -<br />
Orbital Decay 7.9 0 3150°F (210 kft) 2300°F (200 kft)<br />
Sub-orbital 6.5 -6.0 3120°F (160 kft) 2300°F (150 kft)<br />
Sub-orbital 5.0 -9.0 2400°F -<br />
Super-orbital<br />
11.0 -5.1 4350°F (230 kft) 3160°F (225 kft)<br />
(Centaur SMB)<br />
Centaur SMB 4.5 -22.0 2200°F (120 kft) -<br />
Centaur SMB 6.5 -31.0 3000°F (115 kft) -<br />
The iridium clad reaches a temperature of 2570°F for the orbital decay, face-on stable,<br />
reentry condition, well below the melt temperature of 4440°F. For all other out-of-orbit cases<br />
the clad temperature will also remain well below the clad melt temperature.<br />
6-53
6.5.2.3 Out-of-Orbit Reentry Ground Impact Analysis<br />
Final Technical Report<br />
GPHS-RTGs for the Cassini Mission<br />
Lockheed Martin <strong>Document</strong> No. RR18<br />
August 1998<br />
The Module reentry ground Impact Model (MIM) is a Monte Carlo code that simulates the<br />
response of an intact module upon impact with the Earth's surface as the result of a reentry<br />
accident. The model randomly draws a module reentry point (latitude and longitude)<br />
propagates a reentry trajectory to impact (latitude, longitude, and altitude - above mean sea<br />
level), determines the impact surface type (water, soil, rock - based on a worldwide data<br />
base), and then characterizes the potential fuel release. Damage to the individual modules<br />
upon impact is modeled by use of LASEP-T subroutines SURFIMP, DST2REL, and FPSIZE<br />
which utilize release statistics extracted from impact tests of modules and bare fueled clads.<br />
The fuel release information includes mass release and particle size distribution.<br />
The conditional probability distribution for impact location varies by accident case. Four<br />
accident cases have been selected for analysis, from potential out-of-orbit reentry accident<br />
scenarios defined in the Databook. Those scenarios leading only to water impacts have a<br />
zero conditional probability of release and therefore have not been analyzed. Cases<br />
selected for analysis are defined in Section 6.4.1 (case 3.1: sub-orbital reentry; case 5.1:<br />
sub-orbital reentry, CSDS configuration 5 accident; case 5.2: orbital reentry, nominal; and<br />
case 5.3: orbital reentry, off-nominal and elliptic decayed) . The case number prefix reflects<br />
the mission phase in which the POF (probability of failure) is a maximum.<br />
For these four accident cases, two distinct probability distributions for impact location are<br />
identified. Orbital decay reentries result in globally distributed impacts, while suborbital<br />
reentries yield impacts that are confined to the Atlantic ocean, the southern African continent<br />
and Madagascar.<br />
Accident cases 5.2 and 5.3 are orbital decay reentries, and result in impact locations which<br />
are latitudinally distributed, based on the park orbit inclination (the maximum north-south<br />
latitude can be no greater than the decay or park orbit inclination), and uniformly distributed<br />
longitudinally around the world. The latitudinal distribution is more probable at the extreme<br />
north-south latitudes and slightly less probable near the equator essentially due to the<br />
greater dwell time over these latitudes. The latitudinal band probability, P, can be<br />
represented mathematically as a spherical trigonometric function of the range of orbital<br />
argument of reentry, co, to c02, or the latitude band , 0, to 02, and orbital inclination, t:<br />
6-54
Final Technical Report<br />
GPHS-RTGs for the Cassini Mission<br />
Lockheed Martin <strong>Document</strong> No. RR18<br />
August 1998<br />
P = 2 (0) 2 -co1 )=-[Sin-1 (-S- i-111)2 . )-Sin-1 ( . 1 )1<br />
7c It L Sint<br />
Sint<br />
Table 6.5.2-2 shows the conditional probability of impacting within a given latitude band for<br />
accident cases 5.2 and 5.3. The probability of impacting any specific cell within a latitude<br />
band is 1/36th of the latitude band probability.<br />
Table 6.5.2-2. Orbital Decay Conditional Impact Probabilities<br />
Latitude<br />
Band Cell Numbers Latitude Range<br />
Latitude Band<br />
Conditional Impact<br />
Probability<br />
1 1 to 36 64.2 to 90 deg N 0<br />
2 37 to 72 53.1 to 64.2 deg N 0<br />
3 73 to 108 44.4 to 53.1 deg N 0<br />
4 109 to 144 36.9 to 44.4 deg N 2.33 x 10⁻⁴<br />
5 145 to 180 30 to 36.9 deg N 0.0806<br />
6 181 to 216 23.6 to 30 deg N 0.1400<br />
7 217 to 252 17.5 to 23.6 deg N 0.0840<br />
8 253 to 288 11.5 to 17.5 deg N 0.0701<br />
9 289 to 324 5.7 to 11.5 deg N 0.0642<br />
10 325 to 360 Equator to 5.7 deg N 0.0609<br />
11 361 to 396 Equator to 5.7 deg S 0.0609<br />
12 397 to 432 5.7 to 11.5 deg S 0.0642<br />
13 433 to 468 11.5 to 17.5 deg S 0.0701<br />
14 469 to 504 17.5 to 23.6 deg S 0.0840<br />
15 505 to 540 23.6 to 30 deg S 0.1400<br />
16 541 to 576 30 to 36.9 deg S 0.0806<br />
17 577 to 612 36.9 to 44.4 deg S 2.33 x 10⁻⁴<br />
18 613 to 648 44.4 to 53.1 deg S 0<br />
19 649 to 684 53.1 to 64.2 deg S 0<br />
20 685 to 720 64.2 to 90 deg S 0
Final Technical Report<br />
GPHS-RTGs for the Cassini Mission<br />
Lockheed Martin <strong>Document</strong> No. RR18<br />
August 1998<br />
The impact point probabilities for suborbital accident cases 3.1 and 5.1 are essentially<br />
distributed along the Titan IV flight path from approximately 200 sec into the boost phase<br />
flight to just prior to park orbit insertion. This suborbital distribution can be represented by<br />
the Instantaneous Impact Point (IIP) predictions for the reference trajectory as defined in the<br />
Databook.<br />
Based on the POF time history and range of potential park orbit inclinations for accident<br />
case 3.1, impacts will be distributed as shown in Figure 6.5.2-4 for typical variations from the<br />
reference trajectory. It can be seen that approximately 80% of the impacts will occur in the<br />
broad ocean area of the Atlantic, with a high concentration (55%) in the mid-Atlantic. This<br />
highly probable band corresponds to impacts resulting from failure of the Centaur at the first<br />
engine burn (fail-to-start conditions).<br />
As discussed above, the surface impacts for the 54 modules, within a given Monte Carlo<br />
trial, are distributed spatially (dispersion) at impact due to varying flight characteristics<br />
during reentry. This distribution results in a degree of correlation with the surface type (rock,<br />
soil, water) within a given demographic cell. If the dispersion is much smaller than the<br />
characteristic dimension of the surface type the impacts may be considered completely<br />
correlated (all assumed to impact the same surface). If, however, the dispersion is much<br />
greater than the characteristic dimension of the surface type, then the impacts are<br />
completely uncorrelated (each module will have a probability of impacting any of the<br />
various surface types within the cell).<br />
As shown in Figure 6.5.2-5, the probable module impact distribution for orbital decay<br />
reentries is depicted as a footprint of approximately 420 km in length by only 25 km in width,<br />
on the order of the typical dimensions of a worldwide grid cell. As a result, module impacts<br />
are assumed to be uncorrelated for surface impact type.<br />
6-56
Final Technical Report<br />
GPHS-RTGs for the Cassini Mission<br />
Lockheed Martin <strong>Document</strong> No. RR18<br />
August 1998<br />
30<br />
V1 ! \\<br />
- 0 Nlinutem. 93 De. Flt All<br />
---- 75 Minute, 104 0.. Flt All<br />
140 Minute., 104 Deg n4,1<br />
20<br />
10<br />
0<br />
lb<br />
1-10<br />
-20<br />
-30<br />
-40<br />
-50<br />
-100 -80 -60 -40 -20 0 20 40<br />
Longitude (deg)<br />
60 80<br />
Figure 6.5.2-4. Cassini SV Instantaneous Impact Point Distribution<br />
(Percentages Represent Relative Portion of Potential Sub-Orbital Reentries Expected to Impact within each Bounded Region)<br />
23.5<br />
Cell Number 221<br />
22.5<br />
Ballistic Flight Path<br />
420 km<br />
21.5<br />
Sample 6DMP module simula ions<br />
2<br />
rn<br />
:11 20.5<br />
3DMP (face-on stable module drag)<br />
3DMP (random tumbling module drag)<br />
19.5<br />
3DMP (end-on stable module drag)<br />
18.5<br />
3DMP: LM Three degree-of-freedom flight simulation<br />
6DMP: LM Full six degree-of-freedom flight simulation<br />
17.5<br />
40 41 42 43 44 45 46<br />
Longitude (degrees)<br />
47 48 49<br />
50<br />
Figure 6.5.2-5. Module Dispersion within a Typical Demographic Cell<br />
6-57
Final Technical Report<br />
GPHS-RTGs for the Cassini Mission<br />
Lockheed Martin <strong>Document</strong> No. RR18<br />
August 1998<br />
The evaluation of reentry accident consequence utilizes several sets of data generated by<br />
MIM: 1) a compilation, by worldwide database cells, of impact probability, 2) a set of 5000<br />
release source terms for module impacts on rock surfaces from Monte Carlo simulation,<br />
(including correlated mass release and particle size distribution) , and 3) the conditional<br />
probability of a module releasing fuel given a rock surface impact. These data were<br />
provided to the SPARRC consequence model for health and land contamination<br />
consequence predictions. Statistics for the source terms from individual and combined outof-orbit<br />
reentry accident cases are provided in Table 6.5.2-3. Representative source term<br />
particle size distributions are presented in Figure 6.5.2-6 for orbital decay reentries.<br />
Table 6.5.2-3. Reentry Source Terms by Composite Accident Case<br />
Release Percentiles*, **<br />
Accident<br />
Case<br />
Mean<br />
POF<br />
Probability of<br />
Release<br />
Given Failure<br />
Probability<br />
of Release<br />
Mean<br />
Release<br />
(grams)*<br />
5th<br />
(g rams)<br />
50th<br />
(grams)<br />
95th<br />
(grams)<br />
99th<br />
(grams)<br />
3.1 1.4 x 10 -3 0.043 6.1 x 10⁻⁵ 0.097 0.014 A 0.063 A 0.212 A 0.298 A<br />
5 . 1 1.2 x 10⁻² 0.003 3.5 x 10 -5<br />
5.2 8.0 x 10 -3 0.25 2.0 x 10 -3 0.218 0.019 ' 0.132 4 0.696 ' 1.299 '<br />
5.3 3.0 x 10⁻⁷ 0.25 7.5 x 10⁻⁸<br />
Combined 2.1 x 10⁻³ 0.214 0.019 0.128 0.688 1.29<br />
* Release in grams of Pu0 2, for trials which produced fuel releases<br />
** 5th Percentile: 5% of trials produced mass release smaller than this value<br />
50th Percentile: 50% of trials produced mass release smaller than this value<br />
95th Percentile: 95% of trials produced mass release smaller than this value<br />
99th Percentile: 99% of trials produced mass release smaller than this value<br />
A single Monte Carlo simulation was performed to reflect source terms for sub-orbital reentries (cases 3.1 and 5.1)<br />
A single Monte Carlo simulation was performed to reflect source terms for nominal orbit reentries (cases 5.2 and 5.3)<br />
The conditional probability of release given a rock surface impact was computed by 400<br />
MIM accident simulations, where each trial (and each of the 54 modules within the trial) was<br />
forced to impact a rock surface. Out of the 21600 modules that impacted rock, 12076<br />
modules breached yielding a probability of release given rock impact, Prel/rock, of 0.56. The<br />
first 5000 modules that resulted in a fuel release were also used to construct LASEP-T type<br />
release records which include the total mass released as well as the mass distributed into<br />
each of the 12 particle size bins.<br />
6-58
Final Technical Report<br />
GPHS-RTGs for the Cassini Mission<br />
Lockheed Martin <strong>Document</strong> No. RR18<br />
August 1998<br />
MIN. MAX.<br />
DIA. DIA.<br />
BIN (pm) (µn)<br />
3 4 5 6 7 8 9 10 11 12<br />
Particle Size Bin<br />
1 215.0<br />
3 4 5 6 7 8<br />
Particle Size Bin<br />
Figure 6.5.2-6. Particle Size Distributions for Out-of-Orbit Reentry<br />
Ground Impacts - Cases 5.2/5.3<br />
6-59
Final Technical Report<br />
GPHS-RTGs for the Cassini Mission<br />
Lockheed Martin <strong>Document</strong> No. RR18<br />
August 1998<br />
The cumulative probability distributions for each of the out-of-orbit accident cases were<br />
developed from 100,000 MIM trials which, for the orbital decay accident cases, 5.2 and 5.3,<br />
resulted in approximately 24600 trials yielding a fuel release. An average of 1 module<br />
breached per trial with a minimum of 1 and a maximum of 34. The average fuel release was<br />
0.218 grams.<br />
6.5.3 Earth Gravity Assist (EGA) Reentry Accidents<br />
NASA-JPL has performed an assessment of the spacecraft breakup for inadvertent reentry<br />
during the Earth gravity assist swingby portion of the VVEJGA maneuver (Reference<br />
6.5.3-1). The objective of this analysis was to predict the release conditions (altitude,<br />
velocity, and flight path angle) of the RTGs from the spacecraft. Table 6.5.3-1 summarizes<br />
the predicted release altitudes.<br />
Reentry Flight Path Angle<br />
(deg)<br />
Table 6.5.3-1. RTG Release Altitudes<br />
Release Altitude (kft)<br />
Early<br />
Release Altitude (kft)<br />
Late<br />
-90 258 241<br />
-45 264 247<br />
-15 290 270<br />
-10 306 284<br />
-7 320 295<br />
The flight dynamic behavior of the GPHS module during EGA inadvertent atmospheric<br />
reentry is predicted by JHU/APL (Reference 6.5.3-2). This behavior is simulated via a full<br />
six degree-of-freedom, 6DOF, (three translational, three rotational) trajectory program.<br />
Since the GPHS may be released from the spacecraft with a wide range of initial conditions<br />
(initial body rates and angles) 850 distinct 6DOF simulations were performed for reentry<br />
trajectories ranging from -7 to -90 degrees reentry flight path angle. The statistical outcome<br />
of the 6DOF simulations is presented in Table 6.5.3-2 which shows the occurrence<br />
frequency as a function of total angle-of-attack observed for at least 15% to 20% of the heat<br />
pulse. As shown in Table 6.5.3-2, nearly 40% of the cases are considered face-on-stable<br />
(FOS) with the remaining 60% either tumbling or non-FOS.
Final Technical Report<br />
GPHS-RTGs for the Cassini Mission<br />
Lockheed Martin <strong>Document</strong> No. RR18<br />
August 1998<br />
Table 6.5.3-2. Statistical Results from GPHS 6DOF Reentry Motion Studies<br />
- VVEJGA Trajectory<br />
aR Average<br />
afl 0-20 21-40 41-60 61-80 81-90 Tumbling All *<br />
No. of Occurrences 590 276 140 264 85 120 1475<br />
Percent 40.0 18.7 9.5 17.8 5.8 8.2 100<br />
* When an angle of attack occurred for 15% to 20% of the heat pulse, that angle was used in the analyses;<br />
this could occur as many as three times during a trajectory. Thus, the total number is greater than the 850<br />
cases studied.<br />
6.5.3.1 VVEJGA Reentry Environments<br />
Figure 6.5.3-1 shows velocity - altitude profiles for a typical ballistic reentry vehicle (BRV)<br />
and the GPHS module at several flight path angles. The substantial differences in reentry<br />
time for each trajectory are evident by the spacing of the 1-second tick marks. Differences<br />
in the flight profile are due to very high reentry velocity experienced for the VVEJGA<br />
trajectory (over 2.5 times that of the BRV) and the low ballistic coefficient (p) of the GPHS<br />
module (about two orders of magnitude less than the BRV). The low-13 and high initial<br />
velocity of the aeroshell cause severe heating at high altitudes where the freestream<br />
density and pressure are low. Table 6.5.3-3 highlights major differences between the BRV<br />
and GPHS module flight environments.<br />
6-61
Final Technical Report<br />
GPHS-RTGs for the Cassini Mission<br />
Lockheed Martin <strong>Document</strong> No. RR18<br />
August 1998<br />
COMPARISON OF FREESTREAM VELOCITY<br />
300<br />
80 _<br />
250 —<br />
PEAK HEATING —<br />
60 _ 200 —<br />
40 _<br />
N -<br />
t..1 150 —<br />
a<br />
ti<br />
-F<br />
t<br />
Y. =<br />
100<br />
20 _<br />
50<br />
t<br />
0 • CFD ANALYSIS POINTS<br />
+ 1—SECOND TIME INTERVALS<br />
.e BALLISTIC<br />
RV<br />
_<br />
I I I<br />
I<br />
20 40 60 80 100<br />
VELOCITY, V (kft/s)<br />
0 5 10 15 20 25 30<br />
VELOCITY, V (km/s)<br />
Figure 6.5.3-1. Comparison of Reentry Trajectories for a GPHS Module and a Typical<br />
Ballistic Reentry Vehicle (BRV)<br />
6-62
Aeroheating<br />
Final Technical Report<br />
GPHS-RTGs for the Cassini Mission<br />
Lockheed Martin <strong>Document</strong> No. RR18<br />
August 1998<br />
Table 6.5.3-3. Comparison of BRV and GPHS EGA Flight Environments<br />
Parameter BRV GPHS Module<br />
- Peak Lower altitude and higher pressure High altitude with low density and<br />
pressure<br />
- Duration Short duration with high heat rate to<br />
impact<br />
- Very short pulse for steep and about<br />
10 times longer for shallow<br />
- Considerable time (minutes) for soak<br />
and cooling prior to impact<br />
- Radiation Insignificant Shock-layer radiation dominates<br />
surface heating<br />
Inertial loads Approximately 100 Gs About 1,000 Gs for steep.<br />
Less than 100 Gs for shallow.<br />
Flow chemistry Equilibrium during heat pulse Nonequilibrium during heat pulse<br />
Transition from laminar<br />
to turbulent flow<br />
Approximately 40,000 feet for nosetip<br />
Will remain laminar<br />
6.5.3.2 EGA Reentry Analysis Approach<br />
Techniques have been developed to compute the aero/thermo/structural response of:<br />
• the GPHS aeroshell during reentry following release from the RTG shell<br />
• the GIS in the event that the aeroshell fails<br />
• the fuel particles in the event of GIS failure (and fueled clad melt).<br />
These techniques are described below. Results of the analyses are presented in Section<br />
6.5.3.3. Additional details on the analysis approach are presented in Appendix E of<br />
Reference 6.5.3-3.<br />
Computations were performed over a range of trajectories in order to determine reentry<br />
path angle boundaries that delineate regions of aeroshell survival / failure, GIS survival/<br />
failure, and fuel particle response. The fuel particle analysis was also extended into<br />
regions where nominal predictions showed no fuel air-release. This extended fuel particle<br />
analysis was performed in order to encompass effects of uncertainty and variability in the<br />
response predictions.<br />
The GPHS aeroshell and GIS analyses provided estimates for probabilities for release<br />
employed in consequence calculations. The fuel particle analyses determined air-release<br />
6-63
Final Technical Report<br />
GPHS-RTGs for the Cassini Mission<br />
Lockheed Martin <strong>Document</strong> No. RR18<br />
August 1998<br />
particle-size distributions with corresponding release altitudes and velocities as well as the<br />
particle-size distribution of the remaining intact fragments that impact the Earth's surface.<br />
The trajectories for the GPHS aeroshell, GIS, and fuel aerothermal analyses are generated<br />
using the three degree-of-freedom trajectory program, 3DMP. For the purpose of these<br />
GPHS module studies the early (highest) breakup altitude (as presented in Table 6.5.3-1) is<br />
utilized leading to the longest exposure of the module to the reentry aerothermal<br />
environment. The velocity at the indicated spacecraft breakup altitude is 19.45 km/s<br />
(63,800 ft/sec), Earth Centered Inertial (ECI), and is considered to be independent of the<br />
given breakup altitude. The trajectories were flown with the initial velocity directed counter<br />
to the Earth's rotation (into the relative wind since the atmosphere rotates with the planet).<br />
This heading will provide the highest air-relative velocity and therefore the most severe<br />
aerothermal environment. The initial conditions for the subsequent GIS analyses are taken<br />
from the predicted structural failure points for the GPHS. The initial conditions for fuel<br />
analyses are defined by potential GIS burnthrough altitudes.<br />
The procedure for the aero/thermo/structural analysis of EGA reentry utilized a sequence of<br />
computer codes. The three primary elements in this approach are: 1) CFD and coupled<br />
flowfield radiation techniques to compute the complex phenomena of reentry physics, 2)<br />
thermal analysis models to determine transient, in-depth temperature distributions and<br />
surface recession using CFD-supplied surface heat flux and ablation rates, and 3) detailed<br />
nonlinear finite-element structural analysis models to determine the response of the<br />
aeroshell to thermal, aerodynamic, and inertial loading. This approach is based on<br />
experience with BRVs and planetary atmosphere probes. Related analysis procedures<br />
have been very successful in predicting reentry vehicle performance, confirmed by carbon<br />
nosetips that survive to impact.<br />
The structural analysis code that is employed for EGA reentry utilized the same technique<br />
previously used for carbon BRV nosetips that reach temperatures comparable to the GPHS<br />
aeroshell. The thermal analysis codes are also well validated and have been widely used<br />
throughout industry. However, the standard three-dimensional thermal analysis code was<br />
modified for Cassini EGA reentry to incorporate recession (moving boundaries). Both the<br />
three-dimensional and one-dimensional transient thermal codes were modified to solve the<br />
6-64
Final Technical Report<br />
GPHS-RTGs for the Cassini Mission<br />
Lockheed Martin <strong>Document</strong> No. RR18<br />
August 1998<br />
surface energy balance using tables (from CFD) of surface heat flux, enthalpies, and<br />
ablation rates.<br />
The CFD and flowfield radiation codes used for EGA reentry analysis are new and, of<br />
necessity, far more sophisticated than conventional reentry techniques. Because of the low<br />
ballistic coefficient and extremely high reentry velocities, peak heating occurs at high<br />
altitudes (relative to BRV reentry trajectories) and is dominated by hot-gas nonequilibrium<br />
radiation compounded by the effects of carbon ablation products. Approximate, semiempirical,<br />
stagnation-point techniques, used for EGA analyses on previous missions,<br />
become suspect at the extremely high velocities of the Cassini EGA inadvertent reentry.<br />
The significant effects of coupled nonequilibrium chemistry, nonequilibrium radiation, and<br />
nonequilibrium carbon ablation cannot be confidently modeled using such simplified<br />
techniques. Conventional codes developed for BRVs such as Blottner's (Reference<br />
6.5.3-4) chemically reacting boundary-layer technique, and codes developed for planetary<br />
reentry, such as Nicolet's H-He atmosphere, viscous-shock layer flowfield/radiation<br />
technique (RASLE, Reference 6.5.3-5), do not address all of the phenomena important for<br />
GPHS reentry. Even with substantial modifications, existing flowfield codes fall short of<br />
adequately modeling the GPHS reentry environments. Several state-of-the-art Navier-<br />
Stokes flow solvers were assessed for applicability to Cassini EGA reentry environments.<br />
The LAURA code (Reference 6.5.3-6) developed at NASA Langley, was initially selected<br />
because it incorporated much of the required physics. Furthermore, LAURA had been<br />
successfully coupled to the LORAN nonequilibrium radiation code (Reference 6.5.3-7). For<br />
Cassini EGA reentry, both LAURA and LORAN were extended to include carbon species<br />
and reactions. LAURA also required extensive modifications to treat ablation boundary<br />
conditions. These new versions of the flow solver and radiation code were designated<br />
LAURA-C and LORAN-C to denote the extension from 11-species, 20-reaction air chemistry<br />
system to a 19-species, 44-reaction air-carbon system.<br />
The LAURA-C/LORAN-C codes were successfully applied at points along the steep<br />
(y= -90°) trajectory. However, the LAURA-C code proved to be painfully slow to converge<br />
(several hours on a Cray C-90) and its stability was challenged by chemical and ablation<br />
rates. To enable the computation of the hundreds of cases that were required for EGA<br />
analyses, a new faster and more robust flow solver was needed.<br />
6-65
Final Technical Report<br />
GPHS-RTGs for the Cassini Mission<br />
Lockheed Martin <strong>Document</strong> No. RR18<br />
August 1998<br />
A new full Navier-Stokes solver for Reacting, Ablating, Chemical Equilibrium/<br />
nonequilibrium with Radiation (RACER) was developed to overcome the problems<br />
encountered with LAURA-C. The RACER code, described in References 6.5.3-3 and<br />
6.5.3-8, employs a new hybrid, third-order, fast converging flux-vector splitting scheme. In<br />
addition, a new two-step, thermally-coupled chemical solution algorithm was devised to<br />
efficiently predict high-temperature, nonequilibrium, reacting and ionizing flows. RACER<br />
also includes nonequilibrium carbon-sublimation and heterogeneous-oxidation ablation<br />
models. With slight modifications, the LORAN-C code was linked to RACER to iteratively<br />
compute coupled flowfield / radiation solutions. At all stages of the development process<br />
RACER was validated with data, other techniques including LAURA and LAURA-C, and<br />
empirical relations and approximate theory. On benchmark test cases, RACER has proven<br />
to be 10 to 14 times faster to converge than LAURA-C. The speed of RACER makes it<br />
ideally suited to solve the required number of cases. In addition, RACER analyses can be<br />
readily performed on workstations rather than supercomputers.<br />
6.5.3.2.1 GPHS Aero/Thermo/Structural Analysis Approach<br />
The survival/failure of the GPHS aeroshell, in the event of accidental reentry during the<br />
Earth gravity-assist maneuver, is assessed using a multi-discipline approach. Aeroshell<br />
reentry response is computed along bounding trajectories; the shallowest flight-path angle<br />
just above skip-out (y = -7°) and vertical (y = -90°). In addition, an intermediate trajectory<br />
(y = -20°) was selected to better establish survival/failure boundaries. For conditions where<br />
aeroshell failure is predicted, and the graphite impact shell (GIS) assemblies are assumed<br />
to be released, the response of the GIS is analyzed as described in Section 6.5.3.2.2.<br />
This EGA analysis differs from other conventional approaches that either neglect thermal<br />
transients, by using "steady-state" ablation, or treat transients with simplified flowfield<br />
predictions and one-dimensional in-depth conduction techniques. Instead, a full Navier-<br />
Stokes code, coupled to a nonequilibrium radiation code, is used in conjunction with a<br />
three-dimensional, in-depth, transient thermal-response code. Nonlinear threedimensional<br />
thermostructural analyses are subsequently performed at critical trajectory<br />
points to determine the structural adequacy of the GPHS module under combined<br />
aerothermal loading. In this approach, both the flowfield/radiation and structural analyses<br />
are performed at discrete points on the trajectory while the thermal analysis is a continuous<br />
6-66
Final Technical Report<br />
GPHS-RTGs for the Cassini Mission<br />
Lockheed Martin <strong>Document</strong> No. RR18<br />
August 1998<br />
along the trajectory. This discrete-point application of flowfield and structural analysis<br />
codes is valid because flow-establishment times are measured in milliseconds and<br />
dynamic loads can safely be neglected (compared to static loads) for these conditions.<br />
Coupling of CFD/Radiation and Transient-Heating Techniques: As shown schematically in<br />
Figure 6.5.3-2, flowfield and transient-heating computations are advanced together down<br />
the trajectory. The flowfield computations are performed for specified front-face and sideface<br />
temperatures. These temperatures are based on the transient-heating solution at the<br />
previous trajectory point. Three temperature estimates, labeled "low", "nominal", and "high",<br />
are supplied as boundary conditions for the flowfield and radiation analyses. The flowfield<br />
and radiation codes are run sequentially. Initially the flowfield is solved without radiation.<br />
This flowfield is used to obtain an initial radiation field. The flowfield and radiation codes<br />
are then globally iterated to convergence. This solution procedure provides a matrix of<br />
(APPROACH)<br />
SELECTED TRAJECTORY POINTS FOR GLOBALLY<br />
ITERATED I CFD RADIATIONI SOLUTIONS<br />
- 3 SPECIFIED WALL-TEMPERATURE DISTRIBUTIONS<br />
PER TRAJECTORY POINT<br />
- SELECTED WALL TEMPERATURES BASED ON SINRAP<br />
HISTORY<br />
ISINRAPI TRANSIENT HEATING ANALYSIS<br />
- in AND ei CORRELATIONS REPLACED<br />
BY INTERPOLATION OF CFD/RADIATION<br />
SOLUTIONS<br />
- PERFORMS WALL ENERGY BALANCE<br />
- COMPUTES IN-DEPTH TEMPERATURE HISTORY<br />
• 3 TRAJECTORIES (SHALLOW, STEEP, AND INTERMEDIATE)<br />
• - 10 CFD/RADIATION POINTS/TRAJECTORY<br />
(EACH WITH 3 WALL TEMPERATURES)<br />
Figure 6.5.3-2. Trajectory-Based Coupling of Flowfield/Radiation Analyses with<br />
Transient Heating Computations<br />
6-67
,<br />
Final Technical Report<br />
GPHS-RTGs for the Cassini Mission<br />
Lockheed Martin <strong>Document</strong> No. RR18<br />
August 1998<br />
surface distributions of heat flux, enthalpy, and ablation rate as a function of altitude and<br />
wall temperature. These tables are then used by the SINRAP transient-heating code<br />
(Reference 6.5.3-9) to advance the solution of the module's temperature and surface<br />
recession through three trajectory points. The transient-heating code iterates at each time<br />
step on temperature at each surface and in-depth nodal point and satisfies the surfaceenergy<br />
balance.<br />
Thermostructural Analysis Technique: The finite-element code ABAQUS (Reference<br />
6.5.3-10) was chosen to perform the thermostructural assessment because of its advanced<br />
nonlinear capabilities, which includes the ability to utilize user-defined nonlinear<br />
constitutive material models. As shown in Figure 6.5.3-3, for the shallow (-7°) trajectory, the<br />
thermostructural analyses are performed at points along the trajectory where maximum<br />
8000 —<br />
125<br />
7000 — 100<br />
--------;---tCritic,a1<br />
a<br />
, ....-<br />
. , ---, Ablation<br />
C5<br />
rear , / r<br />
6000 — *.-<br />
Temperature/ o Temp<br />
, /<br />
/ Interrriediate''-1„ _<br />
u-r..<br />
r,<br />
.<br />
l<br />
w <<br />
r, POint<br />
cc _ 0 75<br />
m 5000 -1<br />
i--<br />
ci<br />
CC<br />
ILI 4000 — ---,<br />
a cn<br />
2 = 50<br />
w E<br />
I- 3000 ---- z<br />
0<br />
cn<br />
2000 — w 25<br />
U W<br />
1000 — ce<br />
0 —<br />
t / t<br />
/<br />
' /<br />
/ r Peak<br />
/ r,<br />
/<br />
/ Load<br />
/<br />
/ ,<br />
. /<br />
/ .<br />
, ./<br />
. Ị<br />
Lodd / r .<br />
/ .<br />
■<br />
:Peak -; // h<br />
/<br />
Gradient:<br />
Gradient 4 RecesSion -<br />
.... •••<br />
.. ••••• ..'..<br />
5 10 15 20 25 30 35 40<br />
TIME (secs)<br />
I<br />
I I I I I<br />
300 250 200 175 160 150<br />
ALTITUDE (kft)<br />
r<br />
-<br />
Note: Temperature and recession data from SINRAP analysis, loads from 3 DOF analysis<br />
Figure 6.5.3-3. Selection of Thermostructural Analysis Points -<br />
Shallow (-7°) Trajectory<br />
6-68
Final Technical Report<br />
GPHS-RTGs for the Cassini Mission<br />
Lockheed Martin <strong>Document</strong> No. RR18<br />
August 1998<br />
stresses could potentially occur. These trajectory points generally correspond to instances<br />
of peak thermal gradients through the thickness of the aeroshell front face, maximum<br />
stagnation-point temperature, maximum reentry pressure and deceleration, maximum<br />
recession, and some intermediate points where combined load effects may be most severe.<br />
Surface pressures on the aeroshell are obtained from the flowfield predictions. Flight<br />
dynamic three-degree-of-freedom (3DOF) trajectory computations provide deceleration<br />
loads. Thermal loads for the ABAQUS model are obtained from the transient thermal<br />
predictions. The outer contour of the aeroshell is also modified to match the predicted<br />
ablation. Aeroshell stresses and strains predicted by the nonlinear ABAQUS analysis are<br />
then evaluated against FWPF material allowables to determine the structural adequacy of<br />
the module. The structural capability is expressed in terms of a "factor of safety" which is<br />
simply the material allowable divided by the predicted stress or strain. A factor of safety<br />
less than 1.0 indicates failure.<br />
Enabling Assumptions: Each flowfield case requires global convergence of the Navier-<br />
Stokes code with the radiation code (generally three-to-five iterations). Over one-hundred<br />
cases are needed to adequately address the three trajectories examined in this study. In<br />
order to accomplish this extensive case matrix, without risk of under-predicting the<br />
aerothermal environment, it is assumed that:<br />
1. The module is oriented (aerodynamically trimmed) broad face-on-stable (FOS).<br />
2. The three-dimensional GPHS module is represented by an axisymmetric, flat-face,<br />
cylinder with a small radius corner blending the front face with the side of the<br />
cylinder.<br />
3. Radiation is computed using the tangent-slab approach.<br />
4. The wall is treated as an equilibrium-catalytic surface.<br />
The flowfield is assumed to be in thermal equilibrium (single-temperature model).<br />
These are conservative assumptions tending to overpredict heating.<br />
6.5.3.2.2 GIS Aero/Thermo/Structural Analysis Approach<br />
For this analysis, failure of an aeroshell during reentry is assumed to result in release of<br />
both GIS assemblies at altitude. Analysis has been performed for a side-on stable GIS<br />
condition. GIS assemblies which maintain an end-on stable condition (less than 3%) would<br />
6-69
Final Technical Report<br />
GPHS-RTGs for the Cassini Mission<br />
Lockheed Martin <strong>Document</strong> No. RR18<br />
August 1998<br />
be expected to experience enhanced recession due to the blind crush holes, as indicated<br />
in Reference 6.5.3-11.<br />
The GIS's cylindrical shape and side-on stable orientation permits the use of a stagnationline<br />
flowfield/radiation approach. This stagnation-line technique greatly reduces the<br />
computational demand of the alternative two-dimensional (infinite cylinder) approach. An<br />
equivalent simplification is not possible for the GPHS module because the flowfield over<br />
the flat-face geometry is strongly influenced by the shoulder radius. In addition, the heat<br />
flux at the corners of the GPHS is large and is important in the overall thermal/structural<br />
response analysis.<br />
A stagnation-line version of RACER and LORAN-C was developed for the GIS response<br />
analyses. The coupled flowfield/radiation/transient-thermal analysis scheme is similar to<br />
that used for the GPHS module. However, the three-dimensional SINRAP thermal analysis<br />
code is replaced by the one-dimensional REKAP code (Reference 6.5.3-12). REKAP<br />
solves the multi-layer transient heat conduction problem and accounts for material<br />
properties as a function of temperature as well as recession of the FWPF shell. RACER/<br />
LORAN-C solutions are supplied as temperature dependent tables of the net heat flux and<br />
corresponding ablation rate at selected points along the GIS trajectory. The GIS is<br />
modeled in REKAP using cylindrical coordinates with radial internal conduction through the<br />
FWPF shell, iridium clad, and fuel. This approach is conservative because it neglects heat<br />
conduction in the circumferential direction to cooler regions away from the stagnation point.<br />
The thermostructural analysis of the GIS is very similar to the approach utilized for the<br />
GPHS module. An ABAQUS finite element model of the GIS assembly is utilized in<br />
conjunction with the detailed nonlinear model of the FWPF material that was developed for<br />
the GPHS. Aeropressures are applied and balanced by deceleration loads. Thermal loads<br />
are applied concurrently with the reentry load conditions, and static analyses are run at<br />
selected points in the trajectory that could potentially produce the worst-case stress<br />
conditions in the FWPF shell. Stress and strain results are evaluated against temperature<br />
dependent material allowables for every element in the GIS.<br />
The nonlinear ABAQUS finite element model of the GIS, composed entirely of solid<br />
elements, include the GIS, end cap, and floating membrane (all FWPF), as well as the<br />
6-70
Final Technical Report<br />
GPHS-RTGs for the Cassini Mission<br />
Lockheed Martin <strong>Document</strong> No. RR18<br />
August 1998<br />
iridium clad and PuO2 fuel pellets. The nonlinear, temperature-dependent material model<br />
utilized for the FWPF components is identical to the one utilized for the aeroshell.<br />
Temperature-dependent, linear isotropic material properties were developed for the clad<br />
and fuel pellet based on the material property database. A critical feature of the ABAQUS<br />
model of the GIS assembly is the utilization of nonlinear contact elements at the GIS/clad<br />
and clad/fuel pellet interfaces. These elements carry load in compression only and thus are<br />
ideally suited for applications where two unattached components may come into contact<br />
when loaded. In this case, there exists a diametral gap between the fuel pellet and clad<br />
body of approximately 0.036 inches. In addition, the fueled clad rests on internal rings in<br />
the GIS which are approximately 0.016 inches larger in diameter than the outer surface of<br />
the clad.<br />
Reentry deceleration load conditions for the GIS were balanced by an applied pressure<br />
distribution on the outer surface. This pressure was assumed to have a cosine distribution,<br />
with the peak occurring at the model cut plane. Temperatures and ablations for the model<br />
were obtained from stagnation-line REKAP thermal analyses. The model shape was<br />
adjusted to match the predicted ablated shape. The entire outer surface was conservatively<br />
assumed to ablate the maximum (stagnation point) amount. In-depth temperatures were<br />
applied to all components in the model. Temperatures varied radially but were assumed to<br />
be constant in both the axial and circumferential directions. A single point on the axis of the<br />
model was constrained to eliminate any residual free-body motion.<br />
6.5.3.2.3 Fuel Response Analysis Approach<br />
The response of plutonia fuel particles for assumed release from a GIS assembly has been<br />
assessed to determine the particle size mass distribution for subsequent consequence<br />
analysis. If the fuel particles are released, they will melt, shedding microsphere droplets<br />
through the mechanism of liquid layer stripping. The resultant molten droplets will then<br />
begin vaporizing. Much of the basis of this analysis stems from previous studies by Gilbert<br />
and Eck reported in References 6.5.3-13 and 6.5.3-14, respectively.<br />
The time dependent thermal environment for the fuel particles is modeled using the 3DMP<br />
trajectory code that accounts for the time varying mass and dimensional characteristics of<br />
the melting/vaporizing fuel particles and resultant droplets. It is assumed that the fuel
Final Technical Report<br />
GPHS-RTGs for the Cassini Mission<br />
Lockheed Martin <strong>Document</strong> No. RR18<br />
August 1998<br />
initially released from the GIS is already fragmented. The selection of initial<br />
fragment/particle size distribution is discussed below.<br />
These fragments/particles are exposed to the hypersonic environment and begin to melt,<br />
shedding microsphere droplets which then begin to vaporize. The onset of droplet<br />
vaporization is delayed to account for the finite time required to raise the molten droplet<br />
from its melt temperature (4635°R) to the vaporization temperature of 8100°R. It is assumed<br />
that these microspheres are isothermal as verified by computing the Biot number, N bi .<br />
Initial Particle Size Distribution: The initial particle size distribution for air releases prior to<br />
ablation was determined by extrapolating SVT safety test data on particle size distribution<br />
versus distortion for fueled clads. The results are shown in Table 6.5.3-4. Relative<br />
contributions from small particles in the fueled clads prior to air release on the particle size<br />
distribution of the air release was felt to be negligible due to the large amount of small<br />
particles generated by ablation as indicated in the next section.<br />
Table 6.5.3-4. Particle Size Distribution Prior to Air Release<br />
Particle Diameter<br />
Mass Fraction<br />
< 841 micrometers 0.0<br />
841 to 2000 micrometers 0.133<br />
2000 to 6000 micrometers 0.531<br />
> 6000 micrometers 0.336<br />
6.5.3.3 EGA Reentry Analysis Results<br />
SINRAP in-depth heating and recession predictions, using tables of RACER (flowfield) and<br />
LORAN-C (radiation) results, followed by ABAQUS nonlinear structural analyses, show that<br />
the aeroshell survives the shallow (y = -7°) trajectory in a face-on-stable (FOS) orientation.<br />
For the steep (y = -90°) trajectory, results show that the FOS aeroshell experiences<br />
structural failure between 1.8 and 2.0 seconds. The intermediate trajectory (y = -20°) also<br />
fails structurally (at 5.85 seconds). Subsequent structural analyses place the nominal<br />
threshold flight path angle for aeroshell failure at -16°. Results from RACER/LORAN-C,<br />
SINRAP, and ABAQUS are presented below.<br />
6-72
Flowfield Results<br />
Final Technical Report<br />
GPHS-RTGs for the Cassini Mission<br />
Lockheed Martin <strong>Document</strong> No. RR18<br />
August 1998<br />
On the shallow trajectory, RACER/LORAN-C solutions were obtained at eleven trajectory<br />
points (specified altitude and velocity) each with three prescribed surface-temperature<br />
distributions. On the steep and intermediate trajectories, CFD results were obtained at six<br />
and seven trajectory points, respectively. Each altitude-velocity/temperature case requires<br />
three-to-five global iterations of the flowfield with the radiation field. In addition, grid studies<br />
are periodically performed to assure that a sufficient number of points are used to resolve<br />
the flow physics. In total, about three-hundred and fifty RACER and two-hundred and eighty<br />
LORAN-C solutions were obtained for the three trajectories.<br />
Transient-Heating Results<br />
SINRAP, modified to accept surface-energy balance terms and recession-rate predictions<br />
from tables of RACER/LORAN-C solutions, computed in-depth nodal temperatures and<br />
surface recession histories which were then employed in thermostructural analyses.<br />
The SINRAP solution for the GPHS temperature and recession histories is obtained by an<br />
iterative solution of the surface energy balance (SEB). The results, shown below, are<br />
based on a new form of the SEB developed by Bhutta et al. (References 6.5.3-15 to<br />
6.5.3-21) during the course of the Cassini safety analysis. All analyses were then repeated<br />
using the conventional SEB. The effect of the SEB formulation on the GPHS is presented<br />
at the end of this section.<br />
The three prescribed front-face wall temperatures for each CFD point along the shallow,<br />
steep and intermediate trajectories are shown in Figure 6.5.3-4, along with the converged<br />
SINRAP stagnation-point temperature history for each trajectory. On the shallow trajectory,<br />
the temperature peaks at 7260°R in about 22 seconds. At the last point on the steep<br />
trajectory, wall temperatures have surpassed 8000°R in only 2 seconds.<br />
For the shallow (-7°) entry angle, a peak iridium temperature of 3514°R (1679°C) is<br />
reached at 58 seconds. This is far below the iridium/FWPF graphite eutectic temperature of<br />
4625°R (2296°C). At impact, the iridium has cooled off to a minimum temperature of<br />
2396°R (1058°C). For the steep case at the predicted time of aeroshell failure near 1.9<br />
seconds, the iridium temperature is 2832°R (1300°C).
Final Technical Report<br />
GPHS-RTGs for the Cassini Mission<br />
Lockheed Martin <strong>Document</strong> No. RR18<br />
August 1998<br />
9000<br />
II 1 1 1 r r r l I r r, IIII .111 I I I I I I I I I I<br />
8000<br />
7000<br />
0<br />
w - 6000<br />
Ix<br />
D<br />
I-<br />
Q<br />
Ct<br />
LA 5000<br />
a_ m<br />
tA<br />
I-<br />
4000<br />
3000<br />
j-<br />
J<br />
3<br />
i<br />
TRAJECTORY<br />
SHALLOW,SINRAP/CFD<br />
INTERMEDIATE,SINRAP/CFD<br />
STEEP,SINRAP/CFD<br />
2000<br />
0<br />
...,i,.<br />
5<br />
I I I I I<br />
, II I . II,I I-IIII<br />
10 15 20 25 30 35 40<br />
TIME FROM RELEASE (SEC)<br />
Figure 6.5.3-4 CFD Computational Matrix and Comparison of Steep, Shallow, and<br />
Intermediate Trajectory Stagnation-Point Temperature Histories<br />
The total heat flux is shown in Figure 6.5.3-5. On the steep trajectory, flux levels approach<br />
34,000 BTU/ft2 sec at the stagnation point. This heating rate is more than 13 times the<br />
shallow peak-heating level. The radiation component of the steep trajectory heat flux is<br />
comparable to that encountered by the Galileo probe during its plunge into the Jovian<br />
atmosphere.<br />
The resulting surface recession for the shallow, intermediate and steep trajectories is<br />
shown in Figure 6.5.3-6. Shallow trajectory recession continues out beyond 100 sec with<br />
leveling off at 0.125 inches. The minimum aeroshell thickness is 0.185 inches, so sufficient<br />
margin remains for the shallow trajectory (ABAQUS thermostructural analyses, presented<br />
below, verify structural integrity for the shallow trajectory). On the steep trajectory,<br />
recession is progressing rapidly at the time of structural failure.<br />
6-74
Final Technical Report<br />
GPHS-RTGs for the Cassini Mission<br />
Lockheed Martin <strong>Document</strong> No. RR18<br />
August 1998<br />
40000<br />
U<br />
V<br />
35000<br />
30000<br />
TRAJECTORY<br />
SHALLOW,SINRAP/CFD<br />
INTERNEDIATE,S1NRAP/CED<br />
STEEP,S1NRAP/CED<br />
25000<br />
Li-<br />
20000<br />
L._<br />
ce<br />
V)<br />
0<br />
I-<br />
15000<br />
10000<br />
5000<br />
0<br />
0<br />
1 . 1 1 . . 1 . . 1 .<br />
5 10 15 20 25 30<br />
TIME FROM RELEASE (SEC)<br />
35 40<br />
Figure 6.5.3-5. Comparison of the Total Heat-Flux at the Stagnation Point<br />
along the Steep, Shallow, and Intermediate Trajectories<br />
0.18<br />
I 11111111111111.111111.1111 I I I<br />
0.16<br />
0.14<br />
TRAJECTORY<br />
SHALLOW,SINRAP/CED<br />
INTERMEDIATE,SINRAP/CED<br />
STEEP,SINRAP/CFD<br />
1",-; 0.12<br />
0<br />
0.10<br />
0.08 —<br />
cn - I<br />
0 - I<br />
0.06 - I<br />
- I<br />
0.04 - I<br />
0.02 —<br />
---<br />
0.00<br />
0 5 10 15 20 25 30 35 40<br />
TIME FROM RELEASE (SEC)<br />
Figure 6.5.3-6. Comparison of the Stagnation-Point Recession along the<br />
Steep, Shallow, and Intermediate Trajectories<br />
6-75
Final Technical Report<br />
GPHS-RTGs for the Cassini Mission<br />
Lockheed Martin <strong>Document</strong> No. RR18<br />
August 1998<br />
Thermostructural Results (Face-On Stable, Shallow Trajectory)<br />
The FOS orientation provides a much more severe thermostructural environment than<br />
random-tumbling. Thermostructural analyses were performed at trajectory points that<br />
correspond to instances of peak thermal gradients, maximum stagnation point temperature,<br />
maximum reentry pressure and acceleration, and maximum surface ablation, as well as an<br />
intermediate point where combined load effects could be most severe.<br />
Thermostructural results show that the aeroshell has sufficient structural capability to<br />
survive the shallow trajectory load conditions. For all but the high altitude point, minimum<br />
factors of safety were found to occur in the X direction near the center of the ablating<br />
surface due to bending induced by the aeropressure loads. (The X direction is defined as<br />
perpendicular to the flight path, in the plane of the front-face of the aeroshell, with Z<br />
direction defined as perpendicular to the aeroshell front-face.) The minimum factor of safety<br />
in stress in the X direction was found to be 1.47. However, significant structural capability<br />
still exists in the module, since the minimum factor of safety in strain (which is more<br />
significant) was found to be 3.87.<br />
Thermostructural Results (Face-On-Stable Attitude, Steep Trajectory)<br />
Four-trajectory points were analyzed along the steep trajectory, including the point of<br />
maximum stagnation-point thermal gradient through the wall thickness (t = 1.1 sec). The<br />
remaining three analysis points are at intermediate times in the trajectory up to and<br />
including the point at which structural failure of the aeroshell was predicted. It is important<br />
to note that the fourth analysis point occurs at only about half the maximum predicted aero<br />
loading for the aeroshell, and that the predicted front-face ablation is still rising rapidly.<br />
The aeroshell fails at around t = 1.9 sec, which corresponds to an altitude of approximately<br />
140 kft. Failure of the aeroshell in this context indicates the inability of the ablating surface<br />
to withstand further aero loading. Analytical predictions also indicate a 0.046 inch<br />
compression of the CBCF insulator by the bending aeroshell wall, sufficient to cause<br />
contact between the aeroshell and GIS in this region.
Final Technical Report<br />
GPHS-RTGs for the Cassini Mission<br />
Lockheed Martin <strong>Document</strong> No. RR18<br />
August 1998<br />
Thermostructural Results (Face-On-Stable Attitude, Intermediate Trajectory)<br />
Analyses show that a FOS-oriented GPHS aeroshell will survive the shallow trajectory (-7°)<br />
with ample margin but will fail for steep (-90°) trajectory. Assuming release of the GIS<br />
following GPHS aeroshell failure, aerothermostructural analyses were performed to<br />
establish if the GIS survives reentry to impact. In order to bound these GIS analyses, a<br />
lower limit on the flight-path angle that will lead to GIS release was required.<br />
Thermostructural analysis results for a y = -20° trajectory show aeroshell front face failure<br />
occurring at t = 5.85 seconds (altitude = 160 kft). The minimum factors of safety in the X and<br />
Y directions are similar and are primarily a result of bending in the aeroshell ablating<br />
surface induced by the aeropressure loads.<br />
Based on intermediate (y = -20°) trajectory analysis results, an estimate was made of the<br />
reentry path angle above which aeroshell structural failure would nominally be predicted.<br />
The 160 kft failure altitude for the intermediate trajectory corresponds to a deceleration load<br />
of approximately 195 G's. Utilizing the plot of maximum deceleration load versus reentry<br />
path angle shown in Figure 6.5.3-7, and taking into account that the intermediate trajectory<br />
results slightly overpredict temperature and recession, a value of -16° was established for<br />
the critical reentry path angle for aeroshell failure.<br />
Thermostructural Results (Tumbling Attitude)<br />
The reentry analyses were performed primarily for the face-on-stable aeroshell attitude<br />
because this is the most critical condition. Due to lower temperature and ablations for the<br />
aeroshell, the random tumbling reentry can generally be considered less severe for the<br />
determination of aeroshell survivability. Despite this mitigation of stresses and strains for<br />
the random tumbling reentry, an assessment of aeroshell survivability for these conditions<br />
is still important to the probabilistic determination of aeroshell survivability. Transient<br />
SINRAP thermal analyses of a random tumbling aeroshell were performed for both the<br />
steep (-90°) and the intermediate (-20°) flight path angles. These SINRAP analyses did not<br />
incorporate CFD analytical techniques but were instead based on equilibrium heating<br />
values and extrapolated B' curves. This type of analysis has been shown to be somewhat<br />
conservative based on the results of FOS reentry analyses with CFD incorporated.
•■•<br />
Final Technical Report<br />
GPHS-RTGs for the Cassini Mission<br />
Lockheed Martin <strong>Document</strong> No. RR18<br />
August 1998<br />
1200<br />
1000<br />
'45<br />
0<br />
rz 800<br />
Cc<br />
0 600<br />
a<br />
c7 -<br />
cc<br />
400<br />
200<br />
I<br />
, I<br />
—20 —60 —80 100<br />
REENTRY PATH ANGLE (deg)<br />
Figure 6.5.3-7. Maximum Drag Acceleration vs. Path Angle - Gravity Assist Reentry<br />
Analysis of the shallow trajectory for a random tumbling aeroshell was not necessary<br />
because the aeroshell has sufficient structural capability to survive the same reentry<br />
conditions in the more severe FOS attitude. Similarly, since the FOS aeroshell failed<br />
structurally for the steep trajectory well before the peak heating and peak load conditions<br />
were reached, it can be inferred that the random tumbling aeroshell will also fail. As a<br />
result, the focus of the random tumbling analysis was the intermediate trajectory where FOS<br />
aeroshell survivability/failure is marginal.<br />
Thermostructural analysis was completed for the intermediate trajectory (-20°) random<br />
tumbling reentry condition for the critical timepoint of t = 8.0 seconds where both maximum<br />
temperature and maximum load conditions are attained. An additional centrifugal force due<br />
to aeroshell tumbling was also applied to the model. This force was based on a nominal
Final Technical Report<br />
GPHS-RTGs for the Cassini Mission<br />
Lockheed Martin <strong>Document</strong> No. RR18<br />
August 1998<br />
tumbling rate of 500°/sec derived from motion studies and is relatively insignificant<br />
compared to the other forces on the aeroshell body.<br />
Analysis indicates that the aeroshell has adequate structural capability to survive the<br />
reentry load conditions. The minimum factors of safety for X direction stress and strain are<br />
1.093 and 1.189, respectively, indicating that the aeroshell has sufficient structural<br />
capability but cannot sustain much additional loading. In addition, some non-propagating<br />
local failures around the lock member are predicted for this load case. The Z direction<br />
minimum strain factor of safety of 3.486 indicates no critical loading in this direction, as<br />
temperature gradients are relatively minor for the random tumbling reentry.<br />
The results of this random tumbling analysis, as well as the general trend of factor of safety<br />
versus deceleration load derived from the FOS analysis for the intermediate trajectory, were<br />
used to assess the critical angle for random tumbling aeroshell failure. The random<br />
tumbling aeroshell was estimated to fail at a deceleration load of 350 G's, which<br />
corresponds to a path angle of approximately -21°. As expected, this aeroshell failure<br />
threshold occurs at a higher angle than the -16° predicted for the FOS attitude<br />
Effect of SEB on GPHS Survival/Failure Predictions<br />
The GPHS transient-thermal analyses were repeated using the conventional surface<br />
energy balance (SEB) formulation. For the steep trajectory, structural failure occurs soon<br />
after release. Over this small time interval, the predicted module temperatures and surface<br />
recession were similar for both forms of the SEB.<br />
For the shallow trajectory, the conventional SEB produces slightly higher temperatures over<br />
most of the trajectory. However, by 40 seconds (well past the peak heat pulse) the<br />
predicted temperatures from both SEBs are in good agreement while the conventional SEB<br />
yields 32% more recession than the LMMS SEB.<br />
Use of the conventional SEB does not change the GPHS survival/failure results. With<br />
either SEB, the GPHS will fail at approximately 1.9 seconds on the steep trajectory. The<br />
module will also survive on the shallow trajectory for both forms of the SEB. Although the<br />
conventional SEB yields more recession for the shallow trajectory, the module will survive<br />
because the minimum factor of safety, which occurs at peak load, is reached at 26 seconds<br />
where both SEBs predict ample margin. Beyond 26 seconds, the load rapidly decreases,<br />
6-79
Final Technical Report<br />
GPHS-RTGs for the Cassini Mission<br />
Lockheed Martin <strong>Document</strong> No. RR18<br />
August 1998<br />
so that, despite the enhanced thinning of the aero shell with the conventional SEB, the<br />
GPHS is predicted to survive.<br />
Use of the conventional SEB will change the estimate for the critical reentry angle from -16°<br />
to about -14°.<br />
6.5.3.3.3 GIS Aero/Thermo/Structural Results<br />
GIS Orientation During the Heat Pulse<br />
The orientation history of the GIS is determined by a combination of:<br />
1. Initial conditions (orientation and rates)<br />
2. Mass properties<br />
3. Static-stability characteristics.<br />
4. Dynamic-derivatives (such as the pitch-damping derivative, Cm q)<br />
A full six degree-of-freedom (6DOF) Monte Carlo simulation, with non-linear aerodynamics,<br />
has been utilized following release of the FSAR to determine the statistical distribution of<br />
GIS orientation during the heat pulse, following release from a failed GPHS module. This<br />
Monte Carlo assessment was performed for release of a GIS from either a face-on stable or<br />
random tumbling GPHS module.<br />
Initial conditions (pitch, yaw, and roll rate, and angle-of-attack and angle-of-sideslip) for the<br />
GIS are derived from the dynamic conditions of the GPHS module at the time of release.<br />
The module dynamic conditions at release have been determined by JHU/APL for those<br />
cases where the module is face-on stable (FOS). Due to the symmetry, the pitch and yaw<br />
rate distributions are assumed to be identical. APL reports the module roll rate to be no<br />
more than 4000 deg/sec with an average value of approximately 1500 deg/sec. Also, the<br />
initial angle-of-attack for the FOS module can lie within 30 degrees of fully broadside. It has<br />
been assumed that the initial rates (pitch, yaw, and roll), for a random tumbling GPHS<br />
module, will be uniformly distributed between ±5000 deg/sec in each axis. Further, the<br />
initial angle-of-attack may be uniformly distributed between ±180 degrees.<br />
GIS aerodynamic characteristics are based on the MHW-Heat Source Assembly (HSA),<br />
which is a cylinder with a length-to-diameter ratio very close to that of the GIS<br />
(approximately 2). The MHW-HSA aerodynamic data was obtained in a wind-tunnel test<br />
6-80
•<br />
-<br />
Final Technical Report<br />
GPHS-RTGs for the Cassini Mission<br />
Lockheed Martin <strong>Document</strong> No. RR18<br />
August 1998<br />
series (at Mach 10) conducted by GE (Reference 6.5.3-22). The aerodynamic<br />
characteristics indicate that the GIS can statically stabilize in two orientations, broadside<br />
(90°) and near end-on (22°). The broadside orientation is, by far, the dominant condition.<br />
However, there is a finite potential for a near end-on orientation through the heat pulse.<br />
The thermal-pulse duration for the GIS is approximately 5 seconds for the intermediate<br />
flight-path angle. This motion study determined how quickly the GIS will attain a stable<br />
orientation if it is initially given a high pitch/yaw rate from the GPHS at release.<br />
Figure 6.5.3-8 shows the time required to attain a stable broadside orientation following<br />
release from a face-on stable (FOS) GPHS module, as determined from 1000 6DOF Monte<br />
Carlo trials. As shown, 60% of the samples stabilize broadside within 0.1 seconds of<br />
release. Further 80% stabilize broadside within 1 second and 98% within 3 seconds (the<br />
maximum is 3.2 seconds). None of the samples stabilized end-on.<br />
700<br />
a)<br />
c<br />
600<br />
500<br />
Note: Newtonian derived Cmq<br />
O 400<br />
0<br />
o 300<br />
C)<br />
▪E<br />
z<br />
200<br />
100<br />
Cr) LC1 N a).<br />
0 0 0 0 CD<br />
Cr) LC) N. N:<br />
CV CV CV CV CV<br />
Time to Stabilize - sec<br />
2<br />
Figure 6.5.3-8. Time to Stabilize "Broadside" for GIS<br />
(Following Release from Face-On Stable Module) -20° Flight Path Angle/EGA
Final Technical Report<br />
GPHS-RTGs for the Cassini Mission<br />
Lockheed Martin <strong>Document</strong> No. RR18<br />
August 1998<br />
Similarly, Figure 6.5.3-9 shows the time required to attain a stable orientation following<br />
release from a random tumbling GPHS module, as determined from 1000 6DOF Monte<br />
Carlo trials. As shown, 22% of the samples stabilize broadside within 0.1 seconds of<br />
release and 50% stabilize broadside within 1 second. The maximum time to stabilize is 2.3<br />
seconds. One sample out of the 1000 trials stabilized end-on through the heat pulse.<br />
250<br />
a)<br />
c.) 200<br />
0<br />
Note: Hobbs / Feldman derived Cmq ("original")<br />
O 150<br />
0<br />
• 50<br />
0<br />
cp N co. co.<br />
CO<br />
Cq<br />
0 0 0 0 • _- T 1- 0<br />
Time to Stabilize - sec<br />
Figure 6.5.3-9. Time to Stabilize "Broadside" for GIS<br />
(Following Release from Tumbling Module) -20 0 Flight Path Angle/EGA<br />
The GIS is considered to be effectively spinning (from a thermal response perspective) if<br />
the roll rate is greater than 0.2 rev/sec (72 deg/sec). Based on the roll rate distribution at<br />
separation, as shown in Figure 6.5.3-10, 98.3% of all cases will be effectively spinning<br />
during the heat pulse for release from a FOS GPHS module. It is also expected that 97% of<br />
all cases, for release from a random tumbling module, will be spinning.
Final Technical Report<br />
GPHS-RTGs for the Cassini Mission<br />
Lockheed Martin <strong>Document</strong> No. RR18<br />
August 1998<br />
Figure 6.5.3-10. GIS Roll Rate Distribution (FOS Module)<br />
These 6DOF motion studies show that the GIS effectively stabilizes broadside, through the<br />
heat pulse, for all releases from the GPHS module, whether face-on stable or random<br />
tumbling. Further, it is expected that the GIS will be effectively spinning for 97% to 98% of<br />
all cases, for release from a random tumbling or FOS GPHS module, respectively. With<br />
spin, the resultant spin-averaged heat fluxes are substantially reduced from the<br />
nonspinning levels.<br />
GIS Aero/Thermal Analysis<br />
The stagnation-streamline versions of the nonequilibrium, chemically reacting, Navier-<br />
Stokes flowfield code (RACER), and the nonequilibrium flowfield radiation code (LORAN-<br />
C), have been applied to compute the net-heat flux and ablation-rate of the GIS cylinder for<br />
the intermediate and steep trajectories. The GIS initial conditions for this analysis are<br />
shown in Table 6.5.3-5. Based on motion studies, the GIS is assumed to be oriented<br />
broad-side stable for these analyses. The analysis also assumes a nonspinning GIS<br />
because this provides worst-case heating. In addition, the nonspinning GIS heating can be<br />
systematically reduced (spin averaged) to predict temperatures and recession for a<br />
spinning GIS.<br />
6-83
Final Technical Report<br />
GPHS-RTGs for the Cassini Mission<br />
Lockheed Martin <strong>Document</strong> No. RR18<br />
August 1998<br />
Table 6.5.3-5. GIS Release Conditions from FOS GPHS<br />
Parameter<br />
Initial Conditions<br />
Initial Aeroshell Reentry Angle -90° -20°<br />
Time of GIS Release (sec) 1.9 5.85<br />
Altitude (ft) 139,705 159,925<br />
Velocity (ft/sec) (Relative) 56,820 55,192<br />
Path Angle (deg) (Relative) -88.624 -18.854<br />
Component Nodal Temperatures (°R)<br />
GIS<br />
Iridium Clad<br />
Fuel<br />
2649<br />
2834<br />
3022-3327<br />
2752<br />
2834<br />
3022 - 3327<br />
As with the previous GPHS module computations, the flowfield and radiation calculations<br />
were coupled by iterative applications of the codes (usually four-to-five cycles of RACER<br />
and LORAN-C were sufficient).<br />
The detailed RACER/LORAN-C aerothermochemical analyses of the GIS were performed<br />
for the steep (y = -90°) and intermediate (y = -20°) trajectories. These trajectories<br />
encompass the wide range of path angles for potential GIS release from the GPHS module.<br />
Transient, in-depth heating analyses of the GIS were then performed using a version of the<br />
REKAP code (modified to obtain the net surface heat-flux and ablation-rate along the<br />
trajectory by interpolating the RACER/LORAN-C solutions). Two solutions were obtained<br />
for each trajectory. One solution is based on the conventional surface energy balance<br />
(SEB), the other uses the SEB developed by Lockheed Martin.<br />
The conventional SEB for an ablating, chemically reacting surface represents an upper<br />
bound for heating because of its treatment of the near-wall, gas-phase reactions. In the<br />
conventional SEB, it is assumed that the heat released by these homogeneous reactions is<br />
totally transferred to the surface. Alternatively, in the Lockheed Martin SEB, it is assumed<br />
that this heat is transferred to the adjacent gas-phase and is indirectly passed to the surface<br />
by an increased convective and/or radiative heat flux. Under high ablation conditions, the<br />
real scenario is expected to be closer to the Lockheed Martin model.<br />
6-84
Final Technical Report<br />
GPHS-RTGs for the Cassini Mission<br />
Lockheed Martin <strong>Document</strong> No. RR18<br />
August 1998<br />
The REKAP prediction of the surface temperature history of the GIS along the steep<br />
trajectory is shown in Figure 6.5.3-11. Upon release from the GPHS, the GIS surface<br />
temperature rises, almost immediately, from 2667°R to 8000°R. As expected, use of the<br />
conventional SEB results in higher temperatures, with a peak value of 8400°R. After the<br />
initial temperature jump, the surface of the GIS begins to cool (within 1 second from<br />
release). At 2 seconds from release the temperature has dropped below 7000°R. The<br />
corresponding recession history is shown in Figure 6.5.3-12. Use of the conventional SEB<br />
yields more recession, however, burn-through does not occur.<br />
9000<br />
_ 1 1 1 1 1 1 1 1 1 1 1 1 1 1 1 1 1 1 1 1 1 1 1 1 1 1 1 1<br />
8000<br />
7000<br />
0<br />
0<br />
6000<br />
a_<br />
5000<br />
4000<br />
LEGEND<br />
LMMS SEB<br />
3000 - - - - CONVENTIONAL SEB<br />
2000 l i I I i I i I 1 III II i I I I II II II 111111111 1111<br />
1 9 2.1 2.3 2.5 2.7 2.9 3.1 3,3 3,5 3,7 3.9 4 0<br />
T1ME (SEC)<br />
Figure 6.5.3-11. GIS Surface Temperature History. Non-Spinning, Broad-Side Stable<br />
along the Steep Trajectory<br />
6-85
Final Technical Report<br />
GPHS-RTGs for the Cassini Mission<br />
Lockheed Martin <strong>Document</strong> No. RR18<br />
August 1998<br />
- FWPF THICKNESS<br />
Figure 6.5.3-12. GIS Recession History. Non-Spinning, Broad-Side Stable<br />
along the Steep Trajectory<br />
The predicted temperature history of the GIS along the intermediate trajectory is shown in<br />
Figure 6.5.3-13. On this trajectory, the surface temperature stays below 8000°R, but<br />
remains above 7000°R for almost 5 seconds. The net heat-flux levels are less than those<br />
encountered on the steep trajectory, but because of the longer duration of the heat pulse,<br />
recession is about 25% greater (as shown in Figure 6.5.3-14). With the conventional SEB,<br />
marginal burn-through will likely occur. However, as shown by the motion studies, the<br />
broad-side stable GIS will be spinning (about its long axis) for over 98% of all releases.<br />
This spinning motion will greatly reduce recession heat pulse so that burn-through will not<br />
occur for either SEB.<br />
6-86
Final Technical Report<br />
GPHS-RTGs for the Cassini Mission<br />
Lockheed Martin <strong>Document</strong> No. RR18<br />
August 1998<br />
9 UUU<br />
—<br />
I"/-ttn 1111111111111111111111111111111111111111111111111<br />
—<br />
8000 — —<br />
— _<br />
7000 — _<br />
2 —<br />
_ _<br />
0<br />
_<br />
_<br />
La.1<br />
0<br />
_<br />
_<br />
6000 _<br />
w<br />
—<br />
Ix<br />
_<br />
-<br />
t-- - -<br />
< _<br />
CC<br />
-<br />
b..1<br />
IL<br />
5000 _<br />
—<br />
M _ -<br />
Ls-1<br />
I- - _<br />
4000 —<br />
LEGEND<br />
LAMS SEB<br />
- __<br />
3000 - - - - CONVENTIONAL SEB —<br />
2000 IIIMIIII tiltitiltiliiiIIIIIIIIIiillitill til tillit i -<br />
5 8 6.2 6,6 7.0 7.4 7.8 8.2 8.6 9.0 9,4 9.8 10.2 10.6 11.0<br />
TIME (SEC)<br />
Figure 6.5.3-13. GIS Surface Temperature History. Non-Spinning, Broad-Side Stable along<br />
the Intermediate Trajectory<br />
- FWPF THICKNESS<br />
-<br />
-<br />
-<br />
Figure 6.5.3-14. GIS Recession History. Non-Spinning, Broad-Side Stable along the<br />
Intermediate Trajectory<br />
6-87
Final Technical Report<br />
GPHS-RTGs for the Cassini Mission<br />
Lockheed Martin <strong>Document</strong> No. RR18<br />
August 1998<br />
GIS Thermostructural Analysis (Non-Spinning)<br />
Three points on the steep trajectory were selected for detailed analysis. These points<br />
represented critical times in the trajectory, specifically the maximum thermal gradient<br />
condition (t = 2.01 secs), the combined maximum temperature and deceleration load<br />
condition (t = 2.67 secs), and a critical ablation condition (t = 4.00 secs).<br />
Load conditions at the various trajectory points are summarized in Table 6.5.3-6. The peak<br />
GIS temperatures and decelerations are comparable to those predicted for the aeroshell for<br />
the steep trajectory. As shown in Figure 6.5.3-15, the GIS decelerates rapidly following<br />
release, attaining maximum temperature and load conditions within the first second after<br />
being exposed to the flow. Thermal gradients are extremely high because of the sudden<br />
exposure to the reentry environments. Ablation rises rapidly before leveling off around<br />
t = 4.0 seconds as the loads and temperatures drop rapidly.<br />
Table 6.5.3-6. Summary of Load Cases for GIS Assembly, Steep (-90°) Trajectory,<br />
139.7 kft Release<br />
ISINPRISMO<br />
.........<br />
•<br />
Altitude (kft) 134.1 104.0<br />
70.5<br />
Flight Condition<br />
Maximum<br />
Gradient<br />
Maximum<br />
Temperature & Load<br />
Critical<br />
Recession<br />
Stagnation Pt. Data<br />
Temperature (°F)<br />
7642<br />
8050<br />
6109<br />
Gradient (°F)<br />
5146<br />
2196<br />
—104<br />
Ablation (in)<br />
0.0063<br />
0.0902<br />
0.1351<br />
•<br />
6-88
Final Technical Report<br />
GPHS-RTGs for the Cassini Mission<br />
Lockheed Martin <strong>Document</strong> No. RR18<br />
August 1998<br />
8000 —<br />
200 —1200<br />
7000'- 1000<br />
150<br />
ir. 6000 — (-7- , i t<br />
. _ 800 —<br />
2<br />
- \ - _ _<br />
12 . I<br />
E<br />
5000 — Z t \<br />
I<br />
Q.. 0 3 \<br />
CC if)<br />
ui cn 0 — I\<br />
4000 — w .4<br />
c.)<br />
0- I V<br />
Load<br />
Lu —I<br />
cc<br />
3000 —<br />
400 —<br />
I • \<br />
2000 — 50<br />
200<br />
1000 — - Gradient<br />
0 — 0 — 00.0<br />
- Temperature 1<br />
I \<br />
I<br />
Recession<br />
Point 1 = Maximum Thermal Gradient<br />
Point 2 = Combined Maximum Temperature<br />
and Decleration<br />
Point 3 = Critical Ablation<br />
X<br />
I I<br />
2.0 4.0<br />
TIME (secs)<br />
6.0 8.0 10.0<br />
I I<br />
135 90 70 60 50<br />
ALTITUDE (kft)<br />
Figure 6.5.3-15. Critical Flight Data at Stagnation Point vs. Time - GIS Assembly<br />
Steep (-90°) Trajectory, Side-On-Stable Attitude, 139.7 kft Release<br />
Stresses in the X direction are higher than those in the Y direction because of the<br />
asymmetrical loading of the inside of the GIS by the fueled clad as it shifts forward during<br />
reentry. The minimum predicted stress and strain factors of safety in the X direction of 1.42<br />
and 2.40 occur at t = 2.67 seconds and indicate sufficient structural capability to withstand<br />
reentry load conditions.<br />
Stresses and strains in the Z direction of the GIS are caused principally by the extreme<br />
thermal gradients resulting from the rapid reentry heating of the body, which causes much<br />
higher thermally-induced expansion on the outer surface of the GIS than on the inside. The<br />
factor of safety in stress reaches a minimum of approximately 1.0 at t = 2.67 seconds, which<br />
would seem to indicate potential GIS failure based on stress evaluation criteria. However,<br />
the Z factor of safety in strain at this time is 2.46, which demonstrates that the GIS does<br />
indeed retain structural capability. The critical area of the GIS is the outer surface near the<br />
cap, which is at a temperature approaching 8000°F. The material at this temperature is<br />
exhibiting perfectly-plastic behavior, in which the stress has reached its maximum value but<br />
6-89
Final Technical Report<br />
GPHS-RTGs for the Cassini Mission<br />
Lockheed Martin <strong>Document</strong> No. RR18<br />
August 1998<br />
strain capability still remains. However, this is a highly localized stress and only the outer<br />
surface of the GIS cannot sustain additional loading, while the majority of the shell has<br />
significant structural capability remaining.<br />
Thermostructural analysis of the GIS was also conducted for the intermediate (-20 degree)<br />
reentry condition. A total of four points along this trajectory were analyzed in detail,<br />
representing critical times in the trajectory for the maximum gradient condition (t = 6.05<br />
secs), the maximum temperature condition (t = 7.85 secs), the peak deceleration load<br />
condition (t = 8.45 secs), and a critical ablation condition (t = 10.95 secs).<br />
Load conditions at the various trajectory points are summarized in Table 6.5.3-7. The peak<br />
GIS temperatures and decelerations are much lower than the maximum values obtained for<br />
the GIS from the steep trajectory analysis. Also, due to the longer-duration reentry heating<br />
environment, thermal penetration into the GIS is increased such that the gradients are much<br />
lower than those for the steep trajectory at the comparable times of peak deceleration<br />
loading. This implies that the entire GIS is at an elevated temperature during the critical<br />
loading phase of the intermediate trajectory.<br />
Table 6.5.3-7. Summary of Load Cases for GIS Assembly,<br />
Intermediate (-20 0) Trajectory, 159.9 kft Release<br />
Altitude (kft)<br />
Flight Condition<br />
410:<br />
.. , .<br />
;:*. o: .<br />
.1*<br />
, .<br />
• 1:•74.4.0„.<br />
156.4 128.5 121.1 101.2<br />
Maximum<br />
Gradient<br />
Maximum Maximum<br />
Temperature Load<br />
Critical<br />
Recession<br />
Stagnation Pt. Data<br />
Temperature (°F)<br />
7130<br />
7422" 7298<br />
6204<br />
Gradient (°F)<br />
4522<br />
330 64<br />
—22<br />
Ablation (in)<br />
0.0044<br />
0.0793 0.1023<br />
0.1378<br />
The minimum X, Y, and Z factors of safety in stress and strain indicate adequate structural<br />
capability in the GIS to withstand the reentry loading environment.<br />
6-90
6.5.3.3.4 Fuel<br />
Particle Size and Mass Distribution Results<br />
Final Technical Report<br />
GPHS-RTGs for the Cassini Mission<br />
Lockheed Martin <strong>Document</strong> No. RR18<br />
August 1998<br />
The post-reentry mass and particle size distribution has been determined over a range of<br />
potential fuel release conditions from the GIS. These release conditions, in general,<br />
correspond to assumed GIS wall recessions from 75% to 85% for -20 degree and -90<br />
degree EGA reentry flight path angles. Table 6.5.3-8 provides a summary of these<br />
conditions.<br />
Table 6.5.3-8. Release Conditions Evaluated<br />
Reentry Flight<br />
Path Angle<br />
(deg)<br />
Percent GIS<br />
Wall<br />
Recession<br />
Altitude<br />
(ft)<br />
Velocity<br />
(ft/s)<br />
Inertial Flight<br />
Path Angle<br />
(deg)<br />
-20 75 110456 25628 -18.645<br />
-20 80 104655 19939 -18.665<br />
-20 85 101160 12331 -18.791<br />
-90 75 82807 23668 -90<br />
-90 80 72883 13430 -90<br />
-90 85 57044 2181 -90<br />
The two cases most likely representing potential fuel release conditions are the 85%<br />
recession at -20 degree flight path angle and the 80% recession at -90 degree flight path<br />
angle. Releases at lower altitudes for these two cases result in a thermal environment so<br />
benign as to not melt or vaporize the fuel fragments, while GIS recessions at higher<br />
altitudes are probably insufficient to yield a release of fuel.<br />
For the above cases nearly half of the fuel will remain intact and continue to a surface<br />
impact. The remaining half will melt and stabilize into microspheres 2 to 50 p.m in diameter.<br />
These microspheres will further lose 30% to 60% of their mass to vaporization.<br />
The melting/vaporization process, for a given reentry, occurs within a very narrow band of<br />
altitude, between 23 and 25 km for a steep (-90°) reentry and 30 to 32 km for an<br />
intermediate (-20°) reentry. The melt is completed within one to two seconds while the<br />
vaporization occurs within 100 to 200 msec.<br />
6-91
Final Technical Report<br />
GPHS-RTGs for the Cassini Mission<br />
Lockheed Martin <strong>Document</strong> No. RR18<br />
August 1998<br />
Figures 6.5.3-16 and 6.5.3-17 show the mass/particle size distributions per GIS for the<br />
above two cases binned into the same 12 bins defined for the LASEP-T launch accident<br />
models. The quantities within each mass bin represent in ascending order the cumulative<br />
total mass originating from the 841 to 2000 gm and 2000 to 6000 pm initial particle size<br />
groups. The quantity above each bar represents the total bin mass. Total mass within the<br />
"intact" bin represents the residual particle mass which did not experience melting. All of the<br />
particles in this bin exceeded 500 gm in diameter and are considered to be in the 12th bin<br />
for consequence analysis.<br />
The mass release distribution illustrated above is assumed to be representative of releases,<br />
accounting for uncertainty, from both an end-on stable and a broadside stable, nonspinning<br />
GIS orientation.<br />
BIN<br />
MIN.<br />
DIA.<br />
(gm)<br />
MAX.<br />
DIA.<br />
(µm)<br />
1 215.0<br />
69.3<br />
153.6<br />
70.3<br />
144.9<br />
0.4<br />
PARTICLE SIZE BIN NUMBER<br />
Figure 6.5.3-16. Particle Size Distribution for y = -20°, Fuel Released at 85% GIS Ablation
Final Technical Report<br />
GPHS-RTGs for the Cassini Mission<br />
Lockheed Martin <strong>Document</strong> No. RR18<br />
August 1998<br />
BIN<br />
MIN.<br />
DIA.<br />
(Fun)<br />
MAX.<br />
DIA.<br />
(11n1)<br />
1 215.0<br />
PARTICLE SIZE BIN NUMBER<br />
Figure 6.5.3-17. Particle Size Distribution for y = -90°, Fuel Released at 80% GIS Ablation<br />
6.5.3.4 EGA Variability Treatment<br />
Reentry from Earth Gravity Assist is more complex than out-of-orbit reentry, as a result of the<br />
higher reentry velocity from EGA. The GPHS module and its components, the GIS and the<br />
fueled clad, may or may not survive reentry, depending upon the initial conditions of the<br />
reentry such as reentry angle, module orientation, module spin rate, etc. Furthermore, the<br />
sequence of events cannot be described in a deterministic fashion since the motion of the<br />
module or GIS can be chaotic.<br />
Therefore, reentry from EGA is modeled using an event tree which explicitly describes the<br />
various possible sequences of events which may occur.<br />
Variability assessments identify variations in atmospheric conditions (primarily density) to<br />
be the principal source of variability in the reentry response calculations. As the impact of<br />
atmospheric density variations on response results was found to be insignificant, variability<br />
in aeroshell, GIS and fuel response did not alter the nominal branch point probabilities<br />
defined in the event tree.<br />
6-93
Final Technical Report<br />
GPHS-RTGs for the Cassini Mission<br />
Lockheed Martin <strong>Document</strong> No. RR18<br />
August 1998<br />
There are a small number of outcomes of the EGA event tree which involve fuel release.<br />
One of the event tree outcomes, GPHS module impact on rock, is modeled using MIM,<br />
which includes variability. Fixed source terms are used for the other outcomes. Some of<br />
the final branchings depend upon the type of surface impacted by the GPHS module or<br />
module component. Therefore the consequence calculation samples impact sites, using<br />
the same grid as used by the out-of-orbit reentry calculation.<br />
Thus, reentry from Earth Gravity Assist is modeled as having a small number of discrete<br />
source terms and one variable source term.<br />
The event tree is shown in Figure 6.5.3-18 through 6.5.3-20. Figure 6.5.3-18 is the top level<br />
event tree. Figures 6.5.3-19 and 6.5.3-20 are continuations. Conditional probabilities are<br />
shown in the ovals representing intermediate events and in the diamonds representing<br />
outcomes. The probabilities shown were used for FSAR analyses. Revised probabilities<br />
from post-FSAR GIS analyses described earlier in this section are not included. The<br />
possible sequences of events covered by the tree are the following:<br />
1. The aeroshell of the GPHS module fails or does not fail.<br />
2. If the aeroshell fails, the GIS is released or is not released.<br />
3. If the aeroshell fails, the GIS fails or does not fail. (This can occur if the GIS is<br />
released or if the GIS is not released.)<br />
4. If the GIS does not fail, the fueled clad melts or does not melt.<br />
The complexity of the event tree reflects the fact that probabilities of the events typically<br />
depend upon the sequence of prior events. For example, the probability of aeroshell failure<br />
depends upon the reentry angle (steep or shallow) and upon the orientation of the module<br />
(face-on-stable or non-face-on-stable).<br />
The first branch point (vertex) in the event tree is steep reentry versus shallow reentry. The<br />
conditional probabilities are given as P1 and P2 since the probability distributions for angle<br />
of reentry are dependent upon the latitude of reentry. Conditional probabilities for aeroshell<br />
failure for steep reentry with the module in the non-face-on-stable orientation are also<br />
dependent upon latitude and are given as P3 and P4. The conditional probability for<br />
aeroshell failure is 0.0 for shallow reentry, for any orientation, as discussed in Section 5.3.<br />
6-94
Aeroshell<br />
Failure<br />
GPHS<br />
Non FOS<br />
0.0<br />
(No Release)<br />
0.44<br />
Aeroshell<br />
No Failure<br />
1.0<br />
Release<br />
0.56<br />
GPHS<br />
FOS<br />
Aeroshell<br />
Failure<br />
0.0<br />
Soil/Water<br />
Impact<br />
P. +P<br />
No Release)<br />
(No Release)<br />
0.44<br />
Aeroshell<br />
No Failure<br />
Release<br />
0.56<br />
Spacecraft<br />
Reentry<br />
Soil/Water<br />
Impact<br />
No Release)<br />
GPHS<br />
Modules<br />
Released<br />
GPHS<br />
Non FOS<br />
Aeroshell<br />
Failure<br />
P. +P<br />
No Release<br />
0.44<br />
Release<br />
Steep<br />
Soll/Water<br />
Impact<br />
No Release)<br />
• FOS = Face-On-Stable<br />
• P3 and P4 are equal to the probabilities<br />
of reentry at angles greater than or less<br />
than, respectively, the -21° threshold<br />
angle for non-FOS aeroshell failure<br />
• Pi, P2, P3, P4 calculated from<br />
GPHS<br />
FOS<br />
0.4<br />
Aeroshell<br />
Failure<br />
Release<br />
0.56<br />
No Release<br />
0.44<br />
NASA-J131. PDFs for each latitude band<br />
Pr, Pw & Ps provided by sampling worldwide<br />
database for each of 720 global cells<br />
Soil/Water<br />
Impact<br />
P +P<br />
No Release<br />
Figure 6.5.3-18. VVEJGA GPHS Reentry Event Sequence Diagram
GIS<br />
Failure<br />
Release<br />
1.0<br />
No Release<br />
0.44<br />
GIS<br />
Release<br />
0.5<br />
Rock Impact<br />
Pr<br />
Release<br />
0.56<br />
No Release<br />
GIS OK<br />
Land<br />
Impact<br />
Release<br />
1.0<br />
Aeroshell<br />
Failure,<br />
Non-FOS,<br />
Steep<br />
Clad Melt<br />
Ps +Pr<br />
Water<br />
Impact<br />
Soil<br />
Release<br />
0.75<br />
No Release<br />
0.25<br />
GIS<br />
Failure<br />
Release<br />
No Release<br />
0.44<br />
Rock Impact<br />
Release<br />
0.56<br />
No GIS<br />
Release<br />
0.5<br />
No Release<br />
GIS OK<br />
1.0<br />
Land<br />
Impact<br />
Release<br />
1.0<br />
Clad Melt<br />
0.1<br />
Ps +Pr<br />
Water<br />
Impact<br />
P<br />
r<br />
( No Release)<br />
Release<br />
0.75<br />
(No Release)<br />
0.25<br />
Figure 6.5.3-19. Reentry Sequence Diagram for Aeroshell Failure, Non-Face-On-Stable, Steep Reentry
GIS<br />
Failure<br />
Release<br />
1.0<br />
Release<br />
0.56<br />
No Release<br />
0.44<br />
GIS<br />
Release<br />
Clad OK<br />
No Release<br />
GIS OK<br />
Release<br />
0.95<br />
Land<br />
Impact<br />
Aeroshell<br />
Failure,<br />
FOS,<br />
Steep<br />
Clad Melt<br />
Ps +Pr<br />
Water<br />
Impact<br />
Soil<br />
Release<br />
0.75<br />
P<br />
(No Release)<br />
0.25<br />
GIS<br />
Failure<br />
Release<br />
1.0<br />
No Release<br />
0.44<br />
Rock Impact<br />
P<br />
Release<br />
0.56<br />
.10 GIS<br />
Release<br />
0.25<br />
....C<br />
Clad OK<br />
Soil/Water<br />
Impact<br />
Ps +Pw<br />
No Release<br />
GIS OK<br />
0.95<br />
Land<br />
Impact<br />
Rock<br />
Release<br />
1.0<br />
Clad Melt<br />
0.2<br />
Ps +Pr<br />
Water<br />
Impact<br />
P<br />
No Release<br />
Release<br />
0.75<br />
No Release)<br />
0.25<br />
Figure 6.5.3-20. Reentry Sequence Diagram for Aeroshell Failure, Face-On-Stable, Steep Reentry
Final Technical Report<br />
GPHS-RTGs for the Cassini Mission<br />
Lockheed Martin <strong>Document</strong> No. RR18<br />
August 1998<br />
If the aeroshell does not fail, the GPHS module impacts the Earth's surface. Fuel is only<br />
released in the event of rock impact (conditional probability = 0.56). The event tree for<br />
aeroshell failure is continued in Figures 6.5.3-19 and 6.5.3-20. These sub-trees have<br />
vertices for GIS release versus non-release, GIS failure versus non-failure, and clad melt<br />
versus clad OK, in the event of GIS non-failure. If the GIS fails, some of the fuel is released<br />
in the atmosphere and the remainder on the ground. If the GIS does not fail and the clad<br />
does not melt, fuel is only released if the GIS strikes rock (conditional probability = 0.56). If<br />
the GIS does not fail, but the clad melts, fuel is released for impacts on rock (conditional<br />
probability = 1.0) and for impacts on soil (conditional probability = 0.75).<br />
6.5.3.5 EGA Source Terms<br />
The following EGA event tree outcomes lead to fuel release:<br />
1. Aeroshell No Failure - GPHS Module Impacts Rock<br />
2. Aeroshell Failure - GIS OK - Clad OK - GIS Impacts Rock<br />
3. Aeroshell Failure - GIS OK - Clad Melts - GIS Impacts Rock<br />
4. Aeroshell Failure - GIS OK - Clad Melts - GIS Impacts Soil<br />
5. Aeroshell Failure - GIS Failure<br />
Source terms for these outcomes were developed as following:<br />
1. Source terms for GPHS modules striking rock are calculated using the Module Impact<br />
Model (MIM) developed for out-of-orbit reentry.<br />
2. The source term for outcome #2, GIS OK - Clad OK - Rock impact is the measured<br />
particle size distribution for released fuel from BCI test #5. In this test a fueled clad<br />
struck a steel target at a velocity of 53 meters/second, releasing 0.0073 grams of fuel.<br />
This test result was chosen since the particle size distribution of the released fuel had<br />
been measured and the velocity was reasonably close to the GIS terminal velocity of 61<br />
meters/second.<br />
3. The source term for outcome #3, GIS OK - Clad Melts - GIS Impacts Rock is the<br />
contained particle size distribution for BCI test # 31. In this test a fueled clad struck a<br />
concrete target at 61 meters/second, but did not breach. It is assumed that the rock<br />
impact results in a total release of the contained fuel since the clad melted during<br />
reentry.<br />
4. A total release of fuel is also assumed for outcome #4, since the clad has melted during<br />
reentry. However, the soil impact is not expected to result in any fragmentation of the<br />
fuel. Therefore the particle size distribution should be that of a clad which has not been<br />
damaged. This data is not available for fueled clads but is available for a clad<br />
containing urania simulant, which was used here.<br />
6-98
Final Technical Report<br />
GPHS-RTGs for the Cassini Mission<br />
Lockheed Martin <strong>Document</strong> No. RR18<br />
August 1998<br />
5. In the case of GIS failure, some fuel is released in the atmosphere and the remaining<br />
fuel impacts the Earth's surface. Calculation of the amount and size distribution of the<br />
air releases is discussed in Section 6.5.3.3. The particle size distribution of the ground<br />
release from the remaining fuel was calculated by multiplying the amount of remaining<br />
fuel by the mass fractions for the appropriate source terms. The source terms used<br />
were BCI 31 for rock impact and M-13 for soil impacts. The extrapolation approach was<br />
not used for the source term for impact on soil since it cannot give reliable results for<br />
small particles, which dominate consequence in that situation.<br />
Table 6.5.3-9 summarizes the source terms for each EGA outcome which produces a<br />
release and Table 6.5.3-10 gives the actual particle size distributions within the 12 bins as<br />
defined for LASEP-T. Mass distribution within the largest bin (#12), for particles >215 gm, is<br />
further specified relative to the maximum inhalable particle size of 484 gm. This particle<br />
size corresponds to a 1500 AMAD which is is the largest particle size considered to be<br />
inhalable by the SPARRC dose model.<br />
Table 6.5.3-9. Summary of Source Terms for Reentry from Earth Gravity Assist<br />
Angle Aeroshell GIS Clad Location POR*<br />
Source<br />
Term<br />
Steep Failure Failure Air 1.0 steep<br />
air release<br />
Shallow Failure Failure Air 1.0 shallow<br />
air<br />
release<br />
Steep Failure Failure Rock 1.0 BCI 31<br />
contained<br />
Shallow Failure Failure Rock 1.0 BCI 31<br />
contained<br />
Release***<br />
(grams)<br />
66.55<br />
74.2<br />
84.45<br />
Steep Failure Failure Soil 1.0 M-13 84.45<br />
Shallow Failure Failure Soil 1.0 M-13 76.8<br />
Any Failure OK Melt Rock 1.0 BCI 31<br />
contained<br />
Any Failure OK Melt Soil 0.75 M-13 151<br />
Any Failure OK OK Rock 0.56 BC! 5<br />
released<br />
Any OK Rock 0.56<br />
(**)<br />
Conditional probability of release per GIS unless otherwise indicated<br />
*" Conditional probability of release per aeroshell<br />
*** Release per fueled clad<br />
MIM<br />
76.8<br />
151<br />
0.0073<br />
variable<br />
Section 6.7 includes results for the number of modules predicted for each end-state from<br />
FSAR and post-FSAR EGA analyses.<br />
6-99
Final Technical Report<br />
GPHS-RTGs for the Cassini Mission<br />
Lockheed Martin <strong>Document</strong> No. RR18<br />
August 1998<br />
Table 6.5.3-10. Particle Size Distributions for Source Terms for Reentry from Earth Gravity Assist Given as Grams Per Bin<br />
Bin<br />
#<br />
Max<br />
Diam<br />
(gm)<br />
GIS OK,<br />
Clad OK,<br />
Rock Impact<br />
GIS OK,<br />
Clad Melt,<br />
Rock Impact<br />
GIS OK,<br />
Clad Melt,<br />
Soil Impact<br />
GIS Fail,<br />
Steep Reentry,<br />
Air Release<br />
GIS Fail,<br />
Shallow<br />
Reentry,<br />
Air Release<br />
GIS Fail,<br />
Steep Reentry,<br />
Rock Impact<br />
GIS Fail,<br />
Shallow<br />
Reentry ,<br />
Rock Impact<br />
GIS Fail,<br />
Steep Reentry,<br />
Soil Impact<br />
GIS Fail,<br />
Shallow<br />
Reentry,<br />
Soil Impact<br />
1 0.10 3.9 x 10'5 1.655 x 10⁻² 4.38 x 10'3 25.8 19.15 9.2559 x 10 8.4175 x 10⁻³ 2.4496 x 10r3 2.2277 x 10'3<br />
2 0.215 7.57 x 10⁻⁵ 2.513 x 10'2 9.42 x 10 0.0 0.0 1.4055 x 10⁻² 1.2781 x 10' 2 5.2683 x 10 4.7911 x 10⁻³<br />
3 0.464 1.5 x 10⁴ 4.085 x 10⁻² 2.032 x 10⁻³ 0.0 0.0 2.2846 x 10⁻² 2.0777 x 10 -2 1.1364 x 10⁻³ 1.0335 x 10⁻³<br />
4 1.0 1.25 x 10⁴ 8.297 x 10'2 9.68 x 10⁻³ 0.0 0.0 4.6403 x 10'2 4.2199 x 10 -2 5.4138 x 10 4.9233 x 10⁻³<br />
5 2.15 4.01 x 10⁴ 1.301 x 10' 1 1.7294 x 10' 1 0.0 0.0 7.2761 x 10' 2 6.6170 x 10'2 9.6720 x 10'2 8.7959 x 10⁻²<br />
6 4.64 5.72 x 10'4 2.398 x 10 -1 2.0377 x 10' 1 23.0 0.0 1.3411 x 10' 1 1.2197 x 10' 1 x 10' 1 1.0364 x 10' 1<br />
7 10.0 1.238 x 10 8.386 x 10 -1 2.9051 x 10' 1 14.75 13.05 4.6901 x 10⁻¹ 4.2652 x 10⁻¹ 1.6274 x 10 -1 1.4776 x 10' 1<br />
8 21.5 1.955 x 10⁻³ 4.065 2.9926 x 10' 1 3.0 34.65 2.2734 2.0675 1.6737 x 10" 1 1.5221 x 10⁻¹<br />
9 46.4 2.745 x 10⁻³ 13.199 5.9057 x 10' 1 0.0 7.15 7.3818 6.7131 3.3029 x 10' 1 3.0037 x 10' 1<br />
10 100 0.0 7.100 6.9846 x 10' 1 0.0 0.2 3.9708 3.6111 3.9063 x 10' 1 3.5524 x 101<br />
11 215 0.0 9.070 7.1624 x 10⁻¹ 0.0 0.0 5.0726 4.6131 4.0057 x 10' 1 3.6429 x 10⁻¹<br />
12A 484 0.0 18.900 5.3311 x 10' 1 0.0 0.0 10.57 9.6127 2.9815 x 10' 1 2.7115 x 10 -1<br />
12B >10000 0.0 97.276 147.45 0.0 0.0 54.404 49.476 82.46 74.995<br />
Total 0.0073 151 151 66.55 74.2 84.45 76.8 84.45 76.8<br />
Notes: • All releases are tabulated per fueled clad<br />
• A GIS failure results in a full release from each fueled clad, comprised of the sum of an "air release" distribution (encompassing mass lost due to<br />
vaporization and liquefied plutonia shed during reentry) and a ground release distribution (representing the post-impact particle size<br />
distribution for large particles which strike the Earth's surface). Ground release distributions are defined for impacts on either soil or a hard<br />
surface (rock).
Final Technical Report<br />
GPHS-RTGs for the Cassini Mission<br />
Lockheed Martin <strong>Document</strong> No. RR18<br />
August 1998<br />
6.6 TRANSPORT/BIOLOGICAL EFFECTS MODELING<br />
Postulated Cassini accident scenarios could happen on the launch pad, during ascent or<br />
during Earth swingby. The source terms released from these hypothetical accidents can<br />
possess a wide range of particle sizes, from sub-micron to several thousands of microns.<br />
Overall, given an accident with a fuel release, the consequence analysis relies on two<br />
models: 1) a transport model to evaluate the ground and air concentrations resulting from<br />
the atmospheric dispersion of the released source terms and, 2) a radiological<br />
consequence model to predict the extent of contamination and health effects in the exposed<br />
population. Because virtually all mission phases are involved, the transport modeling must<br />
consider release altitudes ranging from near ground level to the higher altitudes of the<br />
stratosphere. The transport time of small particles could span from days to years as the<br />
release height increases, and thus specific models are needed for defined ranges of<br />
transport time. As an alpha-emitter, the fragmentation of the plutonia fuel poses a major<br />
concern in health effects through inhalation. Therefore the dosimetry and health effects<br />
calculation should be a particle-size dependent model. This section provides a description<br />
of the models and analysis processes adopted for the analysis of various accident<br />
scenarios.<br />
6.6.1 Model Description<br />
The process of determining the integrated nuclear risk for the Cassini mission employed<br />
three main transport/biological models. Figure 6.6-1 provides an overview of the analysis<br />
process with its feature models for a typical accident scenario. The SPARRC (Space<br />
Accident Radiological Release and Consequence) family of models, developed by LMMS,<br />
consists of SATRAP (Site-Specific Analysis of Transport and Dispersion of Radioactive<br />
Particles), GEOTRAP (Global Transport and Dispersion of Radioactive Particles), and HIAD<br />
(High Altitude Aerosol Dispersion) for the atmospheric transport and health effects<br />
prediction. In each of the three SPARRC codes, a common dose calculation method was<br />
implemented, namely PARDOS (Particulate Dose), to evaluate the radiological doses from<br />
various pathways and health effects. Two other codes were used in the analysis process<br />
both developed by Sandia National Laboratories: PUFF which evaluates the plume rise<br />
height for initialization of release dimensions, and LHS (Latin Hypercube Sampling) which<br />
provides sampled parameter values for each accident simulation.<br />
6-101
Final Technical Report<br />
GPHS-RTGs for the Cassini Mission<br />
Lockheed Martin <strong>Document</strong> No. RR18<br />
August 1998<br />
/<br />
ACCIDENT<br />
RELEASE<br />
SOURCE TERMS<br />
DISPERSION<br />
METEOROLOGY<br />
CONDITIONS<br />
/ DISTRIBUTIONS<br />
OF<br />
ANALYSIS<br />
PARAMETERS<br />
/ OTHER TRANSPORT<br />
AND HEALTH EFFECTS<br />
ANALYSIS<br />
PARAMETERS<br />
t<br />
SATRAP<br />
LOCAL SCALE<br />
DISPERSION<br />
ANALYSIS<br />
/<br />
SET<br />
1r<br />
LHS<br />
LATIN HYPERCUBE<br />
SAMPLING<br />
OF SAMPLED<br />
PARAMETERS<br />
(OBSERVATIONS)<br />
GEOTRAP<br />
GLOBAL SCALE<br />
DISPERSION<br />
ANALYSIS OF<br />
LARGE<br />
PARTICLES<br />
i<br />
REPEAT FOR<br />
ALL ACCIDENT<br />
SCENARIOS<br />
REPEAT FOR ALL<br />
LHS OBSERVATIONS<br />
i<br />
HIAD<br />
GLOBAL SCALE<br />
DISPERSION<br />
ANALYSIS OF<br />
SMALL<br />
PARTICLES<br />
SPARRC CODES<br />
V<br />
PARDOS<br />
EVALUATE DOSE &<br />
HEALTH EFFECTS<br />
PARDOS<br />
EVALUATE DOSE &<br />
HEALTH EFFECTS<br />
PARDOS<br />
EVALUATE DOSE &<br />
HEALTH EFFECTS<br />
PROBABILISTIC RISK INTEGRATION<br />
/ INTEGRATED/<br />
RISK<br />
RESULTS<br />
/<br />
ACCIDENT<br />
RELEASE<br />
PROBABILITIES<br />
Figure 6.6-1. Overview of Consequence Analysis Process<br />
6-102
Final Technical Report<br />
GPHS-RTGs for the Cassini Mission<br />
Lockheed Martin <strong>Document</strong> No. RR18<br />
August 1998<br />
In view of the transport time problem, the SPARRC models were each designed specifically<br />
for a range of particle sizes and dispersion time scales. Although this top level similarity can<br />
be found in the method used by HNUS for the Galileo and Ulysses analyses, the constituent<br />
models have significant differences in both transport and dose calculation modeling<br />
techniques. The range of applicability for the three transport codes is summarized in Table<br />
6.6-1.<br />
Example<br />
of<br />
Scenarios<br />
Explosion<br />
on launch<br />
Pad<br />
Random<br />
Worldwide<br />
Surface<br />
Impact<br />
Reentry<br />
during<br />
Swingby<br />
Reentry<br />
during<br />
Swingby<br />
Table 6.6-1. Dispersion Scales and Applicable Codes<br />
d<br />
Particle<br />
Size<br />
Range<br />
pfn<br />
. 0 05<br />
5000 in<br />
d 1 0.05gm<br />
__ 5000 lin<br />
d > 10 gm<br />
d < 10 gm<br />
Rel.<br />
Height<br />
0 to 5<br />
km<br />
0.5 m<br />
to<br />
3 m<br />
15<br />
to 60<br />
km<br />
15<br />
to 60<br />
km<br />
Dispersion<br />
Scale<br />
Local<br />
Local<br />
+: Depending on altitude of release and particle size.<br />
Transport<br />
Time<br />
Minutes<br />
to hours<br />
Minutes<br />
to hours<br />
Applicable<br />
Code<br />
SATRAP<br />
SATRAP<br />
Global 1 - 2 Weeks+ GEOTRAP<br />
Global Weeks to Years+ HIAD<br />
SATRAP is used for local scale dispersion, mainly for releases inside the planetary<br />
boundary layer, such as accidents at the KSC launch site. GEOTRAP is used for the global<br />
scale dispersion of large particles, with diameter above 10 gm, released at high altitudes,<br />
between 5 and 60 km, which could induce travel time up to 2 weeks. HIAD is used for the<br />
global scale dispersion of small particles, with diameter less than 10 gm, which could have<br />
weeks to years of transport time because of high release altitudes (up to 60 km) and<br />
negligible settling velocity. The commonality in dose modeling and format outputs from<br />
PARDOS facilitates the integration of consequence results for release accidents that<br />
necessitate more than one analysis model.
6.6.1.1 SATRAP Model<br />
Final Technical Report<br />
GPHS-RTGs for the Cassini Mission<br />
Lockheed Martin <strong>Document</strong> No. RR18<br />
August 1998<br />
The area of analysis considered for local scale dispersion analysis, around the launch pad,<br />
is quite complex in terms of meteorological characteristics, geographic features, and<br />
population density distribution. Due to the land-ocean interaction, the curved coast line and<br />
the presence of inland waterways, wind patterns at the KSC/CCAS launch site could vary<br />
strongly in space and time. Combined with the polydisperse source term problem, a<br />
Lagrangian-trajectory model coupled with a time varying 3-D wind field database was<br />
created to describe the many possible launch accident release conditions.<br />
SATRAP was designed to independently track individual source term clouds, defined<br />
mainly by particle size and release dimensions, in time steps through a four-dimensional<br />
(x,y,z,t) wind field. The transport and diffusion calculations were based on the time and<br />
space varying meteorological data processed for a 200 km x 200 km Cartesian domain with<br />
a 5 km grid scale. The grid data include wind components, stability class, mixing height,<br />
and roughness length of the ground surface. In the Galileo and Ulysses analyses, the<br />
transport model did not qualify as a Lagrangian model because only one vertical profile of<br />
meteorological parameters was processed for the origin and along with other dispersion<br />
parameters uniformly applied to the whole 100 km radius range. The main characteristics of<br />
SATRAP as well as various adopted sub-models are summarized in Table 6.6-2.<br />
Table 6.6-2. Principal Characteristics of SATRAP<br />
Category Description/Model Used Notes<br />
Diffusion Model Type<br />
Lagrangian Puff Multiple<br />
source clouds<br />
Use time and space varying<br />
wind field<br />
Stability Scheme<br />
Pasquill Stability Categories Use stability classes A to G<br />
Dispersion Coefficient Calculation Split-sigma method Horizontal and vertical diffusion<br />
treated separately<br />
Source Cloud Definition<br />
Particle size, Initial<br />
dimensions and locations<br />
Tracked independently<br />
Deposition Velocity Sehmel-Hogdson As a function of particle size,<br />
roughness length<br />
Concentration Integration<br />
Numerical<br />
Deposition Grid System Nested Cartesian Six levels, starting at 62.5m<br />
Receptor Database<br />
40,000 cells, each at 1 km x Domain of analysis is 200 km x<br />
1 km<br />
200 km<br />
Dose and Health Effects Calculation ICRP-30, ICRP-60, BEIR IV Detailed outputs for organ<br />
and BEIR V<br />
doses & dose levels<br />
Ingestion Dose Calculation Common food production Using site-specific analysis for<br />
model<br />
inputs<br />
6-104
Final Technical Report<br />
GPHS-RTGs for the Cassini Mission<br />
Lockheed Martin <strong>Document</strong> No. RR18<br />
August 1998<br />
To adequately evaluate ground concentrations of the multiple particle-size source terms at<br />
the impact point, a nested Cartesian grid with up to six levels was used in the deposition<br />
calculation. The receptor database which contains information such as population density<br />
and land usage, is assumed to have a different grid resolution because of different<br />
characteristic lengths. This modeling approach avoids both the smearing effect from the<br />
limitation of concentration grid points and the assumption that accident releases always<br />
occur at one fixed origin. In this application, the KSC/CCAS receptor database consists of<br />
40,000 Cartesian cells, 1 km x 1 km each. Considering that ground impact releases could<br />
have very small initial dimensions, the smallest grid scale was set at 62.5 m. During cloud<br />
transport, the calculation of air and ground concentrations at grid points is initiated,<br />
whenever the cloud intersects the ground.<br />
To cover the dispersion meteorology variability, a 5-year database for October and<br />
November, was generated for the Cassini primary launch opportunity. Both surface<br />
meteorological data and upper air rawinsondes data were used. Surface data measured at<br />
20 different wind stations surrounding the launch site were collected and processed. The<br />
15-minute average wind vectors were interpolated to the 5 km grid points and stored in<br />
separate files for 150 weather-days.<br />
For reentry scenarios involving random ground impact during the orbit acquisition phase or<br />
Earth swingby phase, SATRAP is used with a simplified uniform wind field and receptor<br />
database. In this mode, only limited data can be obtained for the wind speed, stability<br />
categories and population distribution around the impact point, and therefore constant<br />
values are used as inputs. The main data required for this type of analysis include:<br />
- Average wind speed for transport and dispersion<br />
- Average Pasquill stability class<br />
Typical surface roughness length for deposition calculation<br />
Average population density.<br />
- Source cloud definition in terms of particle size and initial dimensions.<br />
In the simplified mode, the code treats the plume as a straight line diffusion at constant wind<br />
speed and provides output results in a format identical to the site-specific analysis. A<br />
uniform population density is assumed around the impact point.<br />
6-105
6.6.1.2 GEOTRAP Model<br />
Final Technical Report<br />
GPHS-RTGs for the Cassini Mission<br />
Lockheed Martin <strong>Document</strong> No. RR18<br />
August 1998<br />
When released at high altitudes, approximately between 5 and 60 km, particulate source<br />
clouds will travel several thousand kilometers before starting to deposit on the ground. A<br />
source cloud with particles less than 10 microns will spread throughout the globe and may<br />
take several years to completely deposit to the ground. In contrast, larger particles fall to the<br />
surface in a short time and form well defined footprints. A review of past mission analyses<br />
revealed that accident scenarios similar to the latter case were analyzed with greatly<br />
simplified assumptions: 1) one typical particle distribution, 2) all resulting deposition areas,<br />
provided in tabular forms, are confined within the same latitude band (no effects of global<br />
wind field) and, 3) land characteristics and population density are assumed uniform<br />
throughout the latitude band involved. In reality, large separation distances, both in<br />
longitude and latitude, of various surface deposition areas are induced by the gravitational<br />
sorting of released particles and the 3-D global wind field. The fall velocity of particles<br />
changes with altitude and atmospheric properties. A Lagrangian-trajectory method coupled<br />
with a global receptor database is necessary to solve such a problem. Considering those<br />
factors, GEOTRAP is designed to track individual Gaussian puffs in a 3-D global wind field<br />
and determines the final deposition locations where specific surface characteristics can be<br />
used for the consequence prediction. GEOTRAP is applicable to large particles with<br />
physical diameters from ten to several hundred microns. The transport time is limited to two<br />
weeks because the cloud diffusion scale reaches proportions where the Lagrangian<br />
tracking method becomes invalid. Source clouds with small particles and longer transport<br />
times are analyzed with the HIAD model.<br />
Table 6.6-3 provides a summary of the main characteristics of GEOTRAP. For the wind field<br />
database, monthly average global wind fields from NASA's GRAM95 model were<br />
processed. The cloud trajectory was computed using the altitude-dependent particle fall<br />
velocity and the three component wind field. Atmospheric data such as air density and<br />
viscosity, which are used in the fall velocity calculation, were taken from the 1976 U.S.<br />
Standard Atmosphere (Reference 6.6-1). A fourth-order Runge-Kutta numerical integration,<br />
capable of handling space and time-varying parameters, successively calculates positions<br />
of cloud centers until reaching ground level.
Table 6.6-3. Principal Characteristics of GEOTRAP<br />
Category Description/Model used Notes<br />
Diffusion Model Type<br />
Lagrangian Puff Multiple<br />
source clouds<br />
Final Technical Report<br />
GPHS-RTGs for the Cassini Mission<br />
Lockheed Martin <strong>Document</strong> No. RR18<br />
August 1998<br />
Windfield Model GRAM95 Monthly average wind field<br />
Receptor Database<br />
Atmospheric Properties<br />
Dispersion Coefficient<br />
Calculation<br />
Source Cloud Definition<br />
Concentration Integration<br />
Dose and Health Effects<br />
Calculation<br />
720 equal-area grid cells<br />
U.S. Standard<br />
Atmosphere(1976)<br />
Based on statistical data for<br />
long range transport<br />
Particle size, Initial<br />
dimensions and locations<br />
Numerical<br />
ICRP-30, ICRP-60, BEIR IV<br />
and BEIR V<br />
Use for evaluation of particle<br />
fall velocity<br />
Tracked independently<br />
Detailed outputs for organ<br />
doses & dose levels<br />
At the ground, deposition areas consist of overlapping footprints from dispersed clouds of<br />
various sizes. Instead of using the whole Earth surface as receptor reference grid, only a<br />
limited number of areas are examined for ground deposition calculation. From the cloud<br />
center location and dimensions, GEOTRAP determines the boundaries of deposition and<br />
appropriate grid scales with the smallest cloud size in each deposition area. The<br />
concentrations from deposition are computed at these grid points by taking account of all<br />
contributing clouds.<br />
A receptor database for 720 equal-area cells covering the earth's surface was used for land<br />
characteristics and population density data. Note that in previous mission analyses the<br />
database applies to 20 latitude bands because it was assumed that all deposition areas<br />
have surface characteristics similar to those of the receptor latitude band. For GEOTRAP,<br />
the concentration grid resolution in deposition areas is determined uniquely from the<br />
overlapping cloud sizes and is independent of the demographic database. This separation<br />
of grids allows a better description of the ground concentration distribution for multiple<br />
particle source terms.<br />
6.6.1.3 HIAD Model<br />
HIAD is designed for the global scale dispersion of small particles. With plutonia fuel<br />
density about 10 g/cm 3, multiple year atmospheric residence time could apply for particles<br />
6-107
Final Technical Report<br />
GPHS-RTGs for the Cassini Mission<br />
Lockheed Martin <strong>Document</strong> No. RR18<br />
August 1998<br />
with diameters less than 10 microns for releases between 45 and 60 km in altitude. A<br />
typical release condition for HIAD application is an inadvertent EGA reentry in which areothermal<br />
forces ablate RTG modules and components, resulting in the release of fine fuel<br />
particles in the stratosphere. Due to their long residence time in the upper atmosphere, the<br />
source clouds become globally diffused, and tend to deposit in the form of latitudinal bands.<br />
Table 6.6-4 provides a summary of the main characteristics of HIAD.<br />
Table 6.6-4 Principal Characteristics of HIAD<br />
Category Description/Model used Notes<br />
Diffusion Model Type<br />
Average Residence Time for<br />
Mesosphere<br />
Average Residence Time for<br />
Stratosphere<br />
Average Residence Time for<br />
Troposphere<br />
Exponential Transfer<br />
Compartments<br />
4 years<br />
14 months<br />
1 week<br />
Horizontal and vertical<br />
diffusion treated separately<br />
Source Cloud Definition Total mass of fuel release Average particle size used<br />
for dose calculation<br />
Concentration Integration<br />
Receptor Database<br />
Dose and Health Effects<br />
Calculation<br />
Analytical<br />
20 equal-area latitude bands<br />
ICRP-30, ICRP-60, BEIR IV<br />
and BEIR V<br />
Detailed outputs for organ<br />
doses & dose levels<br />
In the Galileo and Ulysses FSARs, HNUS used a set of distributions for the latitudinal<br />
dispersion as a function of injection latitude, based on data of fallout studies (Reference<br />
6.6-2). The same latitudinal distributions were adopted for the Cassini risk analysis.<br />
However, previous FSAR analyses did not account for variations in residence time during<br />
vertical transport nor factor in fuel decay during long residence time. In HIAD, the<br />
atmosphere was characterized, up to about 80 km, with three distinctive layers: the<br />
troposphere, the stratosphere, and the mesosphere. Each atmospheric layer is modeled as<br />
an exponential transfer compartment with an average residence half-time to describe the<br />
vertical transport. HIAD calculates the relative deposition fraction in each latitude band<br />
based on the initial injection latitude. The final deposition is assumed uniform for each<br />
latitude band and seasonal effects are neglected. Decay factor is considered in the<br />
concentration calculation.<br />
6-108
6.6.1.4 PARDOS Model<br />
Final Technical Report<br />
GPHS-RTGs for the Cassini Mission<br />
Lockheed Martin <strong>Document</strong> No. RR18<br />
August 1998<br />
The same model for dose and health effects calculation was implemented in each transport<br />
SPARRC code. The particle-dependent Dose Conversion Factor (DCF) calculation is<br />
based on ICRP-30 (Reference 6.6-3). The tissue weighting factors and health effects are<br />
from ICRP-60 (Reference 6.6-4). Radiation doses are calculated for seven organs: lung,<br />
liver, bone surface, red bone marrow, thyroid, gonads, and skin. Two exposure periods<br />
were calculated, the first year and 50 years from release time. As shown in Figure 6.6-2, the<br />
doses from the following pathways are computed:<br />
• cloudshine or external irradiation from cloud immersion<br />
• groundshine or external irradiation from ground deposition<br />
• direct inhalation from the passing cloud<br />
• ingestion<br />
• resuspension inhalation<br />
Air<br />
Food Crops<br />
Soil<br />
Source<br />
cloud<br />
pasture / feed H.<br />
Animal products<br />
Man<br />
I<br />
Sediment<br />
Water<br />
I<br />
Seafood<br />
Figure 6.6-2. Exposure Pathways Considered in the Dose Calculation<br />
6-109
Final Technical Report<br />
GPHS-RTGs for the Cassini Mission<br />
Lockheed Martin <strong>Document</strong> No. RR18<br />
August 1998<br />
Early in the project, attempts were made to implement a new lung model from ICRP-66<br />
(Reference 6.6-5). The initial structure of PARDOS was designed to accommodate features<br />
such as age-dependent dose calculation. However, the late availability of bio-kinetic factors<br />
as well as recommended DCF values prevented the implementation of the new model. Per<br />
ICRP-30, the DCF values are highly dependent on particle size, and thus provisions were<br />
made to design PARDOS to be flexible to any particle size definition. In particular for<br />
plutonium bearing fuel, PARDOS derives the applicable DCF value based on particle size,<br />
density, solubility class, and gut absorption factor. The deposition fraction in three lung<br />
compartments is calculated during this process and the exposure doses are sorted by<br />
particle bins for the health effects calculation.<br />
Two types of ingestion dose are considered in PARDOS: 1) the dose of contaminated<br />
foodstuffs produced inside the plume footprint, affecting people at the same location, 2) the<br />
dose from commercially distributed foods available in a large region, different from the<br />
contaminated production area. In this application, the distinction between these two<br />
ingestion doses is based on the size of the geographic cells used in the particular code. In<br />
the case of GEOTRAP, the receptor cells are quite large (about 843 km on each side)<br />
therefore the first type of ingestion dose is calculated with generic food consumption rates.<br />
In the case of SATRAP, the whole geographic area for which calculations are made (100<br />
km) is comparable to or smaller than the area from which food is obtained. In this case, the<br />
ingestion dose to individuals at the specific geographic locations was obtained as the sum<br />
of ingestion doses from garden grown produce and an estimated average ingestion dose<br />
from commercially distributed foods. A KSC/CCAS site-specific screening analysis<br />
determined foodstuffs such as seafood and produce to be dominant contributors to the<br />
common ingestion dose. This extensive reliance on site-specific data is a significant<br />
advancement from the previous mission analyses<br />
The health effects of each accident scenario is expressed in terms of the statistical<br />
expectation value for the numbers of latent cancers induced in the exposed population. The<br />
estimated cancers are an attributed excess above those naturally occurring in the<br />
population. In the Cassini risk analysis, the health effects are evaluated with the ICRP-60<br />
risk estimator, equal to 5 x 10 -4 per person-rem. The BEIR IV and BEIR V health effects<br />
(References 6.6-6 and 6.6-7 ) were also evaluated but used only for comparison. It was felt<br />
6-110
Final Technical Report<br />
GPHS-RTGs for the Cassini Mission<br />
Lockheed Martin <strong>Document</strong> No. RR18<br />
August 1998<br />
that a distinction of risk estimators from ICRP and BEIR would provide a better health effects<br />
prediction than a scaled value from the two sources as used in previous mission analyses.<br />
In addition to the non-threshold health effects results as described previously, health effects<br />
with a de-minimis criteria, set at 1 mrem per year, were also evaluated.<br />
6.6.2 Pre-Launch/Early Launch Accidents<br />
Postulated accidents occurring at the KSC launch site involve the definition of three key<br />
variables: 1) the released source term, 2) the meteorological conditions or weather-day for a<br />
daily-based archive, and 3) the accident time within the launch window. The last two<br />
variables play a significant role in determining the atmospheric dispersion conditions of the<br />
released source terms. SATRAP is the primary transport model used in pre-launch and<br />
early launch accident analysis. The PUFF model from SNL was used to evaluate plume<br />
rise height and fireball dimensions, based on the local meteorological conditions and the<br />
available fuel energy. All airborne source clouds leaving the SATRAP analysis domain<br />
(200 km x 200 km) are transferred to GEOTRAP for long range transport analysis. As such<br />
all fuel is accounted for in the consequence analysis.<br />
The following assumptions were adopted for the analysis of pre-launch/early launch<br />
accidents:<br />
• The SRMU fuel fire plume is always present<br />
• Liquid fuel fireballs lifting to altitudes higher than the SRMU fire plume are unaffected<br />
• All fuel releases within the SRMU fire plume are well mixed and modeled as a<br />
uniform column with SRMU plume dimensions<br />
• SRMU fire diameter applies to a dense burning zone whose radius is estimated from<br />
the mission elapsed time<br />
• Fractions of the source terms to be tracked in the wind field are determined by the<br />
mixing height and contributing fire plume configurations.<br />
The rise of liquid fireballs to high altitudes is expected to occur in a very short time, much<br />
faster than the solid fuel fire, and therefore are unaffected by the turbulent regime of the<br />
SRMU plume at lower altitudes.<br />
6-111
Final Technical Report<br />
GPHS-RTGs for the Cassini Mission<br />
Lockheed Martin <strong>Document</strong> No. RR18<br />
August 1998<br />
Due to the varying extent to which releases from SRMU solid propellant impacts were<br />
integrated into the codes used for launch accident modeling, three different analysis<br />
processes were used to derive the consequence results for various accident cases, :<br />
1) Non-SRMU induced release and SRMU Coincident Impact<br />
Release evaluated in the same accident simulation:<br />
• case 0.0 (On-pad Propellant Explosion, Configuration 1)<br />
• case 1.13 (Full Stack Intact Impact).<br />
2) SRMU Coincident Impact Release evaluated separately:<br />
• case 1.1 (Total Boost Vehicle Destruct or TBVD),<br />
• case 1.3 (TBVD with SRMU Aft Segment Impact)<br />
• case 1.10 (Space Vehicle/RTG Impact within Payload Fairing).<br />
3) Non-SRMU induced release only:<br />
• for accident cases associated with low probabilities<br />
(case 1.2, 1.4, 1.6, 1.8, and 1.9).<br />
If the SRMU induced source term was evaluated with the Non-SRMU induced source term<br />
from the same LASEP-T simulation, the release source term is sampled along with other<br />
parameters such as weather-day and time of launch, then the consequence analysis is<br />
performed with the SPARRC code. In this analysis, the LASEP-T release records are not<br />
equally probable and their probability distribution function (PDF) is used in the sampling<br />
process. In particular for case 0.0, which could occur up to 55 minutes before midnight, the<br />
meteorological data required a concatenation of two successive 24-hour data files and an<br />
adjustment to the time boundary input of SATRAP.<br />
If the SRMU induced source term was evaluated separately, two passes of analysis are<br />
required. Figure 6.6-3 shows the end states of release source terms considered in this<br />
analysis process. The first pass involves only the Non-SRMU induced source term, with<br />
equally probable release records. The second pass accounts for the SRMU induced source<br />
term and possible combinations with Non-SRMU induced releases. During the analysis<br />
process, this combination is performed if a sampled variable is less or equal to the mean<br />
conditional probability of SRMU induced release. The final consequence results are<br />
obtained by combining the results from the two passes of analysis.<br />
6-112
Final Technical Report<br />
GPHS-RTGs for the Cassini Mission<br />
Lockheed Martin <strong>Document</strong> No. RR18<br />
August 1998<br />
ACCIDENT<br />
OCCURRENCE<br />
NON-SRMU<br />
INDUCED RE-<br />
LEASE<br />
SRMU<br />
INDUCED RE-<br />
LEASE<br />
END<br />
STATES<br />
LAUNCH<br />
NO<br />
1. NO ACCIDENT<br />
(1- POF)<br />
ACCIDENT BUT<br />
(1-PCI) 2. NO RELEASE<br />
(1-POR)<br />
SRMU INDUCED<br />
YES (PCI) 3: RELEASE ONLY<br />
(POF)<br />
(POR)<br />
(1-PCI)<br />
4:<br />
(PCI) 5:<br />
NON-SRMU INDUCED<br />
RELEASE ONLY<br />
SRMU-INDUCED PLUS<br />
NON-SRMU-INDUCED<br />
RELEASE<br />
Figure 6.6-3. Combinations of Source Terms Considered in Phase 1 Consequence Analysis<br />
For accident cases of low probability, the SRMU induced releases were not evaluated, and<br />
a different sampling process was implemented because all LASEP-T release records (from<br />
Non-SRMU induced environments) are equally probable.<br />
The effects of variability from the source term and other transport conditions were evaluated<br />
with the stratified sampling method of the Latin Hypercube Sampling (LHS) code. To<br />
assure that LHS could sample all significant value ranges while maintaining a tractable<br />
number of analyses, three clusters of source term and 10 clusters of dispersion meteorology<br />
conditions were defined for the analysis process. For the variability-only analysis, accident<br />
cases in phase 0 (pre-launch) and phase 1 (early launch) were evaluated with either 30 or<br />
60 LHS observations to obtain the distribution of consequence results. Each LHS<br />
observation consists of 30 SPARRC analyses. The high volume of analysis cases was<br />
made possible with the use of multiple workstations on a local network and a shell program<br />
designed to process the flow of data, executable codes and results. Consisting of high level<br />
Unix commands and C language programs, this shell program represents the link between<br />
LASEP-T outputs, LHS random sampling, and the SPARRC family of codes. Table 6.6-5<br />
summarizes the number of SPARRC/LHS analyses performed for the variability-only<br />
analysis of launch accident cases.
Case<br />
Table 6.6-5. Summary of SPARRC/LHS Analyses<br />
Separation of<br />
SRMU-Induced<br />
Source term<br />
Number of LHS<br />
Observations<br />
Final Technical Report<br />
GPHS-RTGs for the Cassini Mission<br />
Lockheed Martin <strong>Document</strong> No. RR18<br />
August 1998<br />
Number of<br />
SPARRC<br />
Analyses<br />
0.0 No 30 900<br />
1.1 Yes 60 1800<br />
1.3 Yes 60 1800<br />
1.10 Yes 60 1800<br />
1.13 No 30 900<br />
1.2,1.4,1.6,1.8 & 1.9 N/A 30 each 900 each<br />
_<br />
Total 11,700<br />
The selection of weather-day clusters was guided by the results of a sensitivity study<br />
performed in May 1996. In this study, an average source term was calculated for each<br />
release type over all launch accident cases. Then, a consequence analysis was performed<br />
for each average source term with the complete meteorology database, i.e., 150 weatherdays,<br />
at assumed accident times of 3 a.m. and 7 a.m. The results were ranked and grouped<br />
in eight clusters. Later, two additional clusters were added grouping weather days with the<br />
highest and the lowest predicted consequences to assure adequate sampling of the<br />
extreme consequence values. From this study, the 3 a.m. results were used in a<br />
consequence scaling model to analyze accidents with low probabilities for the FSAR in<br />
June 1996. The scaling model employed the mass-normalized consequence for each<br />
weather-day and provided a scaled result for every release record and weather-day<br />
combination. The scaling factor depends upon the dominant contributing pathway of the<br />
normalized results. Those results that are dominated by the ingestion pathway would be<br />
scaled directly with total mass released. For direct inhalation and inhalation due to<br />
resuspension dominated results, the dose importance weighted mass scaling factor would<br />
be used. Although the scaling method ignores variability due to position of release and time<br />
of launch, it includes all the variability due to release mass, release particle distribution and<br />
weather-day.<br />
The modeling approach for FSAR analyses, did not incorporate the effects of solid fuel fire<br />
plume on the transport process. Three new elements considered for launch phase<br />
accidents following FSAR analyses included the effects of the revised Centaur<br />
overpressure, the presence of SRMU fire plume, and SRMU coincident impact source<br />
terms. These changes were subsequently implemented in the consequence analysis<br />
6-114
Final Technical Report<br />
GPHS-RTGs for the Cassini Mission<br />
Lockheed Martin <strong>Document</strong> No. RR18<br />
August 1998<br />
process and a new set of consequence results were provided for the FSAR Addendum<br />
issued in April 1997.<br />
The key modeling detail for the updates, not present during the FSAR, was the diffusion of<br />
source terms in the presence of a large areal burning zone of solid fuel fragments. It was<br />
necessary to model this particular effect because virtually all accident cases in the launch<br />
phase are associated with an SRMU fire plume. Video footage and meteorological<br />
conditions from the Titan IV - 34D accident at Vandenberg AFB (April 1986) and a more<br />
recent Delta accident at CCAS (January 1997), were obtained to derive typical inputs for<br />
SRMU plume rise simulation. A calibration factor for the appropriate energy level input to<br />
PUFF was derived based on plume rise heights calculated for both accidents. The semiempirical<br />
Briggs's model was also reviewed and provided reasonable results. However,<br />
the PUFF code reflects better local meteorology conditions defined for each weather-day<br />
and was implemented for automation in the analysis process. Regarding the diameter of<br />
the burning zone, results from SRMU footprint simulations were examined along with video<br />
footage and pictures taken from the Delta accident to determine an effective diameter<br />
identified as a "dense burning zone." This zone is where individual plumes join together<br />
with a strong buoyancy, forming a well-mixed column for any potential source term released<br />
inside its volume. A nominal factor of 0.5 times the SRMU fragment footprint diameter was<br />
adopted for the dense burning zone.<br />
The population groups and pathways considered in the FSAR addendum launch site dose<br />
analysis is summarized in Table 6.6-6.<br />
Contingency Planning Support<br />
In support of contingency planning activities prior to launch, typical fire configuration plume<br />
and corresponding fractions of released source terms in various plume components, were<br />
transmitted to the emergency planning team. These configurations, which include the<br />
average stabilized plume heights and fireball diameters, were used as inputs to the ARAC<br />
code of Lawrence Livermore National Laboratories for analysis of hypothetical launch<br />
accidents. Two test cases were performed for comparison with ARAC. The input source<br />
term and dispersion conditions were defined by HNUS. A 99th percentile value of source<br />
term from both RTGs and LWRHUs was selected for the analysis. The wind field was<br />
assumed to be uniform throughout the analysis domain and the effects of mixing height was<br />
6-115
Final Technical Report<br />
GPHS-RTGs for the Cassini Mission<br />
Lockheed Martin <strong>Document</strong> No. RR18<br />
August 1998<br />
not considered. Overall, the results from SATRAP compared favorably with those from<br />
ARAC.<br />
Table 6.6-6. Population Groups and Pathways Considered for<br />
Launch Site Consequence Analysis<br />
Population Group<br />
Pathway<br />
1 2 3 4 5 6<br />
Workers - 3rd Shift - Outdoors X X X X<br />
Workers - 3rd Shift - Indoors X X X<br />
Residents - Outdoors X X X X X<br />
Residents - Indoors X X X X<br />
Spectators X X X<br />
1:Direct inhalation during cloud passage<br />
2: Reduced direct inhalation during cloud passage<br />
3: Inhalation from resuspension<br />
4: Cloudshine<br />
5: Groundshine<br />
6: Ingestion<br />
6.6.3 Late Launch Accidents<br />
In analyzing late launch consequences, ground releases are considered uncorrelated, that<br />
is the surface type impacted by one module is independent of the surface types impacted by<br />
any other modules. Given this assumption, the reentry analysis process for the late launch<br />
phase involves two levels of calculation: 1) determine the impacted cells and corresponding<br />
number of breached modules, and evaluate the consequences, normalized to 1 person/km 2 ,<br />
and 2) scale the consequence results to the number of breached modules and exposed<br />
population density classes. The number of breached modules is predicted by sampling a<br />
binomial distribution sampling based on the exposed rock fraction within the cell and the<br />
failure probability for the module. Multinomial distribution sampling provided a matrix of the<br />
number of modules breached and population density classes for each impacted cell.<br />
A worldwide receptor database of 720 equal-area cells with 15 population density classes,<br />
ranging from 0 to 25,000 person/km 2, was used for the analysis. Based primarily on the<br />
launch trajectory and orbit inclination, the MIM analysis (Section 6.5.2) provided ground<br />
impact probabilities per cell for sub-orbital reentries and per latitude band for orbital<br />
reentries. The list of impacted cells were restricted to those containing both exposed rock<br />
surface and population for consequence analysis.<br />
6-116
Final Technical Report<br />
GPHS-RTGs for the Cassini Mission<br />
Lockheed Martin <strong>Document</strong> No. RR18<br />
August 1998<br />
The variables sampled by the first level analysis, using a SPARRC/LHS process, include<br />
the impacted cell, source term from a single GPHS module, the number of releasing<br />
modules and the weather category. For the first level analysis, 900 LHS observations were<br />
performed for each reentry accident case. In the second level analysis, the multinomial<br />
distribution sampling was limited to 100 trials because, in some cases, there are a very<br />
large number of possible combinations of breached modules and population density<br />
classes, but at very low probabilities.<br />
For transport analysis, the dispersion conditions in impacted cells consist of 14 meteorology<br />
categories and 7 Pasquill stability classes with average wind speeds. The bounce height of<br />
GPHS modules after rock surface impact was assumed to be 0.5 m above ground and all<br />
source terms are released at this height in a Gaussian cloud with a = 1 meter in<br />
3-dimensions. A simplified version of SATRAP modeled the transport as straight line<br />
Gaussian diffusion. Transport was evaluated for 100 km, however test cases showed that<br />
over 99% of the consequence resulted from dispersion in the first 60 km. A uniform<br />
distribution of population density was assumed for the area of impact.<br />
Several refinements were implemented during the development of the late launch analysis<br />
process. For the DFSAR analysis, no credit was taken for the rocky soil types considered to<br />
be thinly covered with soil and a whole cell-dependent rock fraction was used in<br />
determining the number of breached modules. Also, all failed modules were assumed to<br />
release fuel into the same population density class. Later for the FSAR analysis, an<br />
exposed rock fraction based on a worldwide soil type database and ranging from 70% to<br />
80% was used for the calculation of conditional probability of release. Multinomial<br />
distribution sampling was added to predict the combination of population density classes<br />
with breached modules, to provide a more correct evaluation of the probabilities associated<br />
with modules impacting various population density classes.<br />
Compared to prior mission analyses, two significantly different features were used in the<br />
Cassini late launch analysis: 1) the conditional failure probability upon rock impact is<br />
evaluated per module instead of per fuel clad, and 2) the distribution of potential cells<br />
impacted were systematically sampled instead of relying on an average impact condition<br />
(defined as average values of rock fraction and population density).<br />
6-117
6.6.4 EGA Reentry<br />
Final Technical Report<br />
GPHS-RTGs for the Cassini Mission<br />
Lockheed Martin <strong>Document</strong> No. RR18<br />
August 1998<br />
Inadvertent reentry scenarios during the Cassini earth swingby maneuver could generate<br />
several types of fuel release. Fuel release might occur both at high altitudes and at the<br />
Earth's surface due to various failure modes for the 54 GPHS modules. The consequence<br />
analysis process for inadvertent EGA reentry is treated with two levels:<br />
1) The first level of the process determines the partition of 54 modules into four possible<br />
end states based on failure modes and location of release, and calculates the<br />
normalized consequence result for each type of release.<br />
2) The second level of the process predicts the set of combinations of breached modules<br />
(or GISs) and applicable population density classes for the impacted cell. Specific cell<br />
characteristics such as exposed rock fraction and joint probability of population density<br />
class - soil type surface, are input into the determination of conditional release<br />
probability. For each combination mentioned previously, the consequence value was<br />
calculated based on the number of predicted breached modules, the applicable<br />
population density and the normalized consequence result.<br />
Based on the EGA event tree (Section 6.5.3), each module which releases fuel can be<br />
categorized into one of the end states as described in Table 6.6-7.<br />
Table 6.6-7. Definition of Module Fuel Release End States for<br />
EGA Consequence Analysis<br />
End State Aeroshell GIS Clad<br />
A OK --- --- Rock<br />
B Failure 0 K 0 K Rock<br />
C Failure 0 K Melt Rock - Soil<br />
Location of Potential<br />
Release<br />
D Failure Failure - - - Initial: Air<br />
Secondary: Rock - Soil<br />
For end states A and B, fuel release can occur for module (or GIS) impacts upon rock. For<br />
end state C, fuel release from a degraded GIS could occur from either rock or soil impact.<br />
For end state D, both aeroshell and GIS have failed during reentry and fuel release is<br />
released at high altitudes. In this particular case, the remaining fuel inventory that proceeds<br />
to the Earth's surface is considered to fragment upon impact on rock or soil.
Final Technical Report<br />
GPHS-RTGs for the Cassini Mission<br />
Lockheed Martin <strong>Document</strong> No. RR18<br />
August 1998<br />
The key assumptions for each EGA reentry simulation include:<br />
• All modules are subjected to the same reentry angle<br />
• With a separation distance estimated at less than 80 km, air and ground releases<br />
occur in the same equal-area cell of the 720 cell worldwide cell grid.<br />
• Surface types (soil or rock) within the impacted cell are not necessarily<br />
continuous and thus the impact of modules on these surfaces are uncorrelated.<br />
• GISs within the same module have correlated impact surface types and failure<br />
modes. In other words, due to identical reentry conditions, both GISs from a<br />
given module would either survive or fail, and their separation distance is<br />
assumed smaller than the characteristic length of any surface type.<br />
• For all surface types, fuel is released 0.5 m above ground.<br />
• Deposition of fuel from in-air release (end state D) to water bodies has a<br />
negligible contribution to the total consequence, except for shallow ocean and<br />
inland water for which a mean seafood ingestion dose is calculated and scaled<br />
to the number of breached modules.<br />
In the first level of the EGA analysis, the following parameters are sampled by LHS to<br />
evaluate the normalized consequence results:<br />
- Latitude band of reentry<br />
- Angle of reentry<br />
- Equal-area cell of impact (or longitude of impact)<br />
- Altitude of release (for in-air release only)<br />
- Weather group, rock and soil fraction applicable to the impacted cell<br />
- Mass and particle size distribution of source terms<br />
- Distribution of 54 modules into four end states<br />
For the first level of analysis, cells with potential consequence from ground impacts (i.e.,<br />
with either population, soil or exposed rock surface) are clustered and sampled separately<br />
from the remaining cells. Variability of source terms was only defined for the rock impact of<br />
GPHS modules (end state A). An average source term was defined for all remaining<br />
release types. A random draw, using the multinomial distribution based on the probability of<br />
end states, determines the distribution of 54 modules into each of the four end states. With<br />
all the above parameters defined, the input files for the SPARRC codes were created and<br />
6-119
Final Technical Report<br />
GPHS-RTGs for the Cassini Mission<br />
Lockheed Martin <strong>Document</strong> No. RR18<br />
August 1998<br />
the consequence analysis performed for a population density of one person/km 2. The<br />
consequence results calculated include health effects (with and without de-minimis),<br />
collective dose, maximum individual dose for each population density class, and land<br />
contamination areas.<br />
The second level of the EGA analysis predicts the number of modules breached within<br />
applicable population density classes, combines the consequences from contributing<br />
releases, and provides the final set of consequence results. Based on the surface<br />
characteristics and population data of each impacted cell, the number of modules or GISs<br />
releasing fuel upon rock or soil impact is predicted. Since the concern is mainly for areas<br />
associated with people, a joint probability of having both population and rock/soil surface is<br />
used in determining the conditional probability of release. For each combination of<br />
population density class / rock (or combination of population density class/soil) a different<br />
probability of release is calculated. Having those probabilities applicable to the cell,<br />
multinomial distribution sampling is used to determine the partition of the breached modules<br />
or GISs among population density classes.<br />
An impacted cell could have soil, rock and shallow ocean surfaces, therefore in accident<br />
simulations where the 54 reentry modules are subjected to all four end states, a<br />
combination of up to eight release types is possible. The release types include:<br />
1) Intact module releasing on rock impact<br />
2) Intact GIS releasing on rock impact<br />
3) Intact GIS - melted clad releasing on soil impact<br />
4) Intact GIS - melted clad releasing on rock impact<br />
5) Small particle ( 215 gm) from in-air GIS failure, fragmenting upon soil impact<br />
7) Large particle (> 215 pm) from in-air GIS failure, fragmenting upon rock impact<br />
8) Large particle (> 215 gm) from in-air GIS failure, landing in shallow ocean or<br />
inland water.<br />
In the above list, release type 5 would experience global dispersion and release type 8<br />
could occur anywhere in the impacted equal-area cell. The exposure doses to these two<br />
fuel release types are calculated with the average population density of the impacted<br />
6-120
Final Technical Report<br />
GPHS-RTGs for the Cassini Mission<br />
Lockheed Martin <strong>Document</strong> No. RR18<br />
August 1998<br />
latitude bands and equal-area cells respectively. The remaining release types have a<br />
limited range of dispersion (from 5 to 60 km) and thus areas with different population density<br />
classes are considered.<br />
For the whole accident scenario, the distribution of population exposed to 18 dose levels<br />
was calculated. The dose distribution results were presented in the form of statistic values<br />
(mean and percentiles values) and CCDF curves.<br />
6-121
Final Technical Report<br />
GPHS-RTGs for the Cassini Mission<br />
Lockheed Martin <strong>Document</strong> No. RR18<br />
August 1998<br />
6.7 CONSEQUENCE AND RISK PREDICTIONS<br />
6.7.1 Mission Consequence and Risk Predictions<br />
A summary of the mean value for collective dose, health effects, and dry land contaminated<br />
above 0.2 pCi/m2 is provided in Table 6.7.1-1 by accident case for cases which contributed<br />
significantly to risk within each mission segment. (Updates reflecting the 800 km Earth<br />
Swingby Plan and updated GIS reentry orientation analysis (Reference 6.7-1) are<br />
incorporated into the EGA consequence results discussed in this section. Predicted<br />
consequences for the 800 km swingby are compared to 500 km swingby consequence<br />
predictions from the FSAR Addendum: Supplemental Analyses in Table 6.7.1-2. The<br />
percentile values of land contamination above selected levels are provided in Table<br />
6.7.1-3. For all combined postulated accident scenarios, from pre-launch to Earth swingby,<br />
the expected health consequence for the Cassini mission is calculated to be 0.07<br />
incremental latent cancers. For the total mission, the probability of one or more latent<br />
cancer fatalities is slightly higher than 1 in 100,000. A breakdown of the results in terms of<br />
contribution from various phases shows the following characteristics:<br />
• Accidents occurring near the launch site (i.e., in phases 0 and 1), would be expected to<br />
produce the lowest expected health consequences of any mission segment. The<br />
combined results from simulated accident cases of phase 0 and phase 1 account for<br />
29% of the total mission risk. A total of 0.066 and 0.071 incremental cancer fatalities are<br />
predicted for the mean 50 year health effects without de-minimis resulting from exposure<br />
to fuel release in phase 0 and phase 1, respectively. From the segment consequence<br />
CCDF in Section 6.3.2 the probability of inducing one or more health effects due to<br />
exposure to accidental fuel release is about 1 in 4 million and 1 in 100,000 for phases 0<br />
and 1, respectively. The probability of release in these phases is about 5 in 10,000. For<br />
the dominant accident case 1.1 (Total Boost Vehicle Destruct), which could occur in the<br />
first 20 sec MET, the majority of fuel releases are predicted to come from a Space<br />
Vehicle (SV) fireball engulfed in the SRMU fire plume. As a result, the fuel is well-mixed<br />
in a large plume column and lofted to high altitudes. This energetic areal release affects<br />
mostly off-site population. Table 6.7.1-4 provides the mean health effects by population<br />
group for pre-launch/early launch accident cases. Ground concentrations above 0.2<br />
1.1Ci/m 2 are contributed by large particles and are expected to be restricted to the KSC<br />
launch site. All analysis cases have a mean value of maximum potential individual dose<br />
less than 0.046 rem. In over 70% of the simulated analysis cases, inhalation of<br />
resuspended material was the dominant contributing pathway.
Final Technical Report<br />
GPHS-RTGs for the Cassini Mission<br />
Lockheed Martin <strong>Document</strong> No. RR18<br />
August 1998<br />
Table 6.7.1-1. Mean 50 Year Radiological Consequence Values by Accident Case<br />
Accident<br />
Case<br />
Accident<br />
Description<br />
0.0 On-Pad Explosion,<br />
Configuration 1<br />
1.1 Total Boost Vehicle<br />
Destruct (TBVD)<br />
1.3 TBVD with SRMU<br />
Aft Segment Impact<br />
1.10 SV/RTG Impact<br />
within PLF<br />
1.13 Full Stack Intact<br />
Impact<br />
Collective<br />
Dose<br />
(Person-rem)<br />
(without<br />
de-minimis)<br />
Collective<br />
Dose<br />
(Person-rem)<br />
(with<br />
de-minimisb)<br />
Health<br />
Effectsa<br />
(without<br />
de-minimis)<br />
Health<br />
Effectsa<br />
(with<br />
de-minimisb)<br />
Maximum<br />
Individual<br />
Dose (rem)<br />
Land Area<br />
with >0.2<br />
tCi/m2<br />
(km2)<br />
130 96 0.066 0.053 0.013 1.5<br />
160 110 0.081 0.05 0.015 1.8<br />
130 88 0.067 0.045 0.046 1.3<br />
80 51 0.04 0.021 0.020 1.1<br />
240 180 0.12 0.098 0.028 2.2<br />
3.1 Sub-Orbital Reentry 8.4 7.5 4.2 x 10⁻³ 3.8 x 10⁻³ 0.37 0.028<br />
5.1 CSDS (Config. 5)<br />
Sub-Orbital Reentry ,<br />
8.4 7.5 4.2 x 10⁻³ 3.8 x 10⁻³ 0.37 0.027<br />
5.2 Orbital Reentry<br />
(Nominal)<br />
92 82 0.046 0.041 1.1 0.058<br />
EGA EGA Reentry*<br />
(Short Term) 1.7 x 10⁵ 1.1 x 10⁵ 90 60 1780 21<br />
a. Health Effects are incremental latent cancer fatalities.<br />
b. The de-minimis dose level is 1.0 x 10 5 Sv (1.0 x 10³ rem) per year.<br />
' For 800 km swingby altitude
Final Technical Report<br />
GPHS-RTGs for the Cassini Mission<br />
Lockheed Martin <strong>Document</strong> No. RR18<br />
August 1998<br />
Table 6.7.1-2. Radiological Consequence Values for 800 km and 500 km EGA Swingby<br />
Accident<br />
Case<br />
Accident<br />
Description<br />
Probability<br />
of Failure<br />
(POF)<br />
Conditional<br />
Probability<br />
of Fuel<br />
Release<br />
Health<br />
Effectsa<br />
(without<br />
de-minimis)<br />
Health<br />
Effectsa<br />
(with<br />
de-minimis)<br />
Maximum<br />
Individual<br />
Dose<br />
(rem)<br />
Land Area<br />
with >0.2<br />
p.Ci/m2<br />
(km2)<br />
EGA<br />
(500 km)<br />
EGA<br />
(800 km &<br />
Revised GIS<br />
End-State<br />
Probabilities)<br />
EGA<br />
Reentry<br />
(Short Term)<br />
EGA<br />
Reentry<br />
(Short Term)<br />
8.0 x 10⁻⁷ 0.79 140 26 650 19<br />
6.2 x 1 0-7 0.51 90 60 1780 21<br />
a Health Effects are incremental latent cancer fatalities.<br />
• For reentry accident scenarios occurring during late launch phases 3 to 8, the mean<br />
health consequence without de-minimis is 0.044. These reentry accidents are the<br />
dominant contributors to the combined risk curve below one health effect, for<br />
probabilities above 1 x 10⁻⁵. The probability of more than one health effect due to reentry<br />
accidents is about 1 in 100,000. The high probability of fuel release, estimated at 2 in<br />
1000, is attributed to the high relative probability of a loss of direct thrust of the Centaur<br />
or attitude control malfunction. Accident case 5.2 (nominal orbital reentry accident) is the<br />
dominant risk contributor to this mission phase.<br />
• With a release probability estimated at less than 4 in 10 million, the highest mean health<br />
consequence without de-minimis is from Earth swingby scenarios. The probability of<br />
consequence for more than one health effect due to inadvertent reentry accidents is<br />
about 3 in 10 million. A total of 90 incremental cancer fatalities are calculated for an<br />
EGA reentry accident. Using a de-minimis dose level of 1 mrem/yr, the mean health<br />
effects consequence is reduced to 60 health effects. The de-minimis criterion affects<br />
mainly reentry accidents with low exposure doses from releases at high altitudes, doses<br />
which contribute 32% of the total mean health effects. An average value of 0.54 failed<br />
modules is predicted for the in-air high altitude releases. The releases on soil from a<br />
"GIS OK Clad Melt" condition accounts for 54% of the expected health effects and<br />
represent the highest consequence outcomes. An average of 6.9 failed modules is<br />
predicted for GIS OK Clad Melt releases on soil. Table 6.7.1-5 summarizes the<br />
evaluated number of persons exposed to various dose levels for the EGA reentry<br />
accidents.<br />
6-124
Final Technical Report<br />
GPHS-RTGs for the Cassini Mission<br />
Lockheed Martin <strong>Document</strong> No. RR18<br />
August 1998<br />
Table 6.7.1-3. Land Area Contaminated above 0.2, 0.6, 1.2, and 2.4 RCi/m 2<br />
for Dominant Accident Cases in Each Mission Segment<br />
Contam.<br />
Level<br />
Case 0.0<br />
Mean<br />
(km2)<br />
Expected<br />
Value<br />
(km2)<br />
5th<br />
Percentile<br />
(km2)<br />
50th<br />
Percentile<br />
(km2)<br />
95th<br />
Percentile<br />
(km2)<br />
99th<br />
Percentile<br />
(km2)<br />
>0.2 1.5 7.6 x 10 -5 5.1 x 10⁻³ 0.66 5.5 8.6<br />
>0.6 0.5 2.6 x 10⁻⁵ 2.2 x 10⁻⁴ 0.17 2.0 2.8<br />
>1.2 0.2 1.3 x 10⁻⁵ 0.0 0.030 1.1 1.6<br />
>2.4 0.097 5.0 x 10⁻⁶ 0.0 6.5 x 10⁻³ 0.5 0.9<br />
Case 1.1<br />
>0.2 1.8 8.1 x 10⁻⁴ 4.4 x 10⁻⁴ 0.59 6.8 23<br />
>0.6 0.71 3.2 x 10⁻⁴ 0.0 0.11 2.7 10<br />
>1.2 0.4 1.8 x 10⁻⁴ 0.0 0.032 1.6 7.3<br />
>2.4 0.22 1.0x 10⁻⁴ 0.0 0.01 0.99 _ 5.1<br />
Case 1.3<br />
>0.2 1.3 1.6 x 10⁻⁴ 1.3 x 10 -3 0.32 5.7 15<br />
>0.6 0.51 6.1 x 10⁻⁵ 0.0 0.056 2.1 7.5<br />
>1.2 0.28 3.3 x 10⁻⁵ 0.0 0.014 1.2 4.7<br />
>2.4 0.15 1.8 x 10⁻⁵ 0.0 3.3 x 10⁻³ 0.6 3.1<br />
Case 5.2<br />
EGA *<br />
>0.2 0.058 1.2 x 10⁻⁴ 0.0 0.031 0.25 0.35<br />
>0.6 0.013 2.6 x 10⁻⁵ 0.0 0.0 0.062 0.12<br />
>1.2 3.2 x 10⁻³ 6.5 x 10⁻⁶ 0.0 0.0 0.016 0.094<br />
>2.4 8.0 x 10⁻⁴ 1.6 x 10⁻⁶ 0.0 0.0 0.0 0.047<br />
>0.2 21 6.7 x 10⁻⁶ 0.0 8.7 85 124<br />
>0.6 12.5 4.0 x 10⁻⁶ 0.0 5.0 53 63<br />
>1.2 9.2 2.9 x 10⁻⁶ 0.0 3.7 39 45<br />
>2.4 7.0 2.2 x 10⁻⁶ 0.0 2.4 30 35<br />
* For 800 km swingby
Accident<br />
Case<br />
Final Technical Report<br />
GPHS-RTGs for the Cassini Mission<br />
Lockheed Martin <strong>Document</strong> No. RR18<br />
August 1998<br />
Table 6.7.1-4. Mean 50 Year Health Effects Values by Population Group for<br />
Pre-Launch/Early Launch Accident Cases<br />
On-Site<br />
Worker<br />
Health Effects<br />
(without<br />
de-minimis)<br />
On-Site<br />
Worker<br />
Health Effects<br />
(with<br />
de-minimis*)<br />
Off-Site<br />
Resident<br />
Health<br />
Effects<br />
(without<br />
de-minimis)<br />
Off-Site<br />
Resident<br />
Health<br />
Effects<br />
(with<br />
de-minimis*)<br />
Off-Grid<br />
Population<br />
Health<br />
Effects<br />
(without<br />
de-minimis)<br />
Off-Grid<br />
Population<br />
Health<br />
Effects<br />
(with<br />
de-minimis*)<br />
0.0 5.9x10⁻⁴ 4.2x10⁻⁴ 0.058 0.046 7.5x10⁻³ 6.6x10⁻³<br />
1.1 2.5x10⁻³ 1.8x10⁻³ 0.072 0.045 6.0x10⁻³ 2.8x10⁻³<br />
1.2 2.3x10⁻⁴ 6.0x10⁻⁶ 5.6x10⁻³ 9.6x10⁻⁴ 4.1x10⁻⁴ 6.3x10⁻⁶<br />
1.3 2.6x10⁻³ 2.0x10⁻³ 0.059 0.04 5.5x10⁻³ 3.2x10⁻³<br />
1.4 3.0x10⁻³ 2.1x10⁻³ 0.058 0.034 4.4x10⁻³ 1.4x10⁻³<br />
1.6 2.2x10⁻³ 1.6x10⁻³ 0.046 0.025 3.1x10⁻³ 9.2x10⁻⁴<br />
1.8 1.8x10⁻³ 1.3x10⁻³ 0.061 0.038 3.7x10⁻³ 1.2x10⁻³<br />
1.9 2.8x10⁻³ 2.0x10⁻³ 0.048 0.024 3.5x10⁻³ 9.7x10⁴<br />
1.10 1.3x10⁻³ 7.6x10⁻⁴ 0.036 0.019 2.7x10⁻³ 1.3x10⁻³<br />
1.13 1.3x10⁻³ 9.0x10⁻⁴ 0.1 0.085 0.015 0.012<br />
* The de-minimis level is 1 x 10 -5 Sv (1 x 10"3 rem) per year<br />
Table 6.7.1-5. EGA Analysis - Number of Persons Exceeding Doses above Levels<br />
(800 km Swingby)<br />
Dose Level<br />
(rem)<br />
Mean Number of<br />
Persons Exceeding<br />
Dose Level<br />
Expectation Number of<br />
Persons Exceeding<br />
Dose Level<br />
0.001 1.43 x 10⁵ 4.51 x 10 -2<br />
0.05 3.29 x 10⁴ 1.04 x 10 -2<br />
0.1 2.56 x 10⁴ 8.09 x 10⁻³<br />
0.4 1.39 x 10⁴ 4.40 x 10⁻³<br />
1 7.24 x 10³ 2.29 x 10⁻³<br />
5 1.85 x 10³ 5.85 x 10 -4<br />
10 974.3 3.08 x 10⁻⁴<br />
100 144 4.56 x 10⁻⁵<br />
400 39.1 1.24 x 10 -5<br />
500 24.1 7.61 x 10⁻⁶<br />
1000 10.8 3.43 x 10 -6<br />
5000 1.6 5.1 x 10⁻⁷
Final Technical Report<br />
GPHS-RTGs for the Cassini Mission<br />
Lockheed Martin <strong>Document</strong> No. RR18<br />
August 1998<br />
Overall, the consequences predicted for the Cassini mission are low when compared with<br />
other risks. Using a typical natural (background) radiation of 0.3 rem/year and a health<br />
effects estimator of 5 x 10 -4 latent cancer fatalities/rem, the risk to an individual of developing<br />
fatal cancer from a 50 year exposure is estimated at 1 in 133. This estimated lifetime risk<br />
from background radiation is over 8 orders of magnitude higher than the Cassini mission<br />
average individual risk, estimated at 1 in 50 billion of incurring cancer due to exposure from<br />
an accidental RTG fuel release.<br />
6.7.2 Discussion of Mission Consequence and Risk Predictions<br />
Contributions to total mission risk for the pre-launch, early launch, late launch, and EGA<br />
swingby mission segments are 2%, 27%, 55%, and 16%, respectively. The characteristics<br />
of release and dominant pathways for each mission segment are discussed in this section.<br />
6.7.2.1 Pre-Launch Accidents<br />
A typical accident scenario during the pre-launch phase involves the inadvertent activation<br />
of the destruct system or the Centaur cryogen explosion resulting in the on-pad explosion of<br />
the Titan IV core propellant. Environment definitions from the Databook indicated the<br />
starting time of potential accidents to be no earlier than T-94 minutes. Since the October<br />
launch window spanned between 12:39 a.m. to 7:00 a.m., the starting time of accidents in<br />
phase 0 was sampled randomly between 55 min before midnight to 7:00 a.m. Analysis of<br />
accident environments and probabilities have led to a single LASEP-T simulation for prelaunch<br />
phase, namely case 0.0.<br />
Pre-launch accidents include either a type 3 (SV) or type 4 (Core + SV) liquid fuel fireball. A<br />
total of 64% of the simulated accident cases have a type 4 fireball which could loft released<br />
fuel to altitudes between 1000 and 2000 m. As a result, the majority of source terms in the<br />
fireball cloud and stem will deposit in large off-site areas. Deposition to densely populated<br />
areas would have a higher consequence result through the resuspension pathway. If the<br />
deposition occurs in the Atlantic Ocean or in off-site areas to the southwest, very low health<br />
consequences would be expected, dominated by the ingestion pathway.<br />
In general, the low ground concentration due to the large cloud dimension of fireballs would<br />
result in mean individual doses of less than 1 rem. As such, the direct inhalation pathway<br />
with its short exposure interval only contributes a modest part to the health effects. The<br />
6-127
Final Technical Report<br />
GPHS-RTGs for the Cassini Mission<br />
Lockheed Martin <strong>Document</strong> No. RR18<br />
August 1998<br />
contribution from resuspension, mainly in urban (high resuspension rate) areas is the<br />
dominant pathway in 77% of the variability-only analyses.<br />
For the source term that remains airborne after 100 km of transport from the launch pad, the<br />
mean health effects predicted without de-minimis applicable to off-grid population is<br />
7.5 x 10⁻³. The population in the vicinity of KSC/CCAS site and the off-grid population<br />
account for 89% and 11 % of the risk evaluated for case 0.0. Due to high altitudes to which<br />
source terms would be lofted, the number of health effects for on-site workers is about 2<br />
orders of magnitude lower than the health effects for off-site residents.<br />
6.7.2.2 Early Launch Accidents<br />
Accidents in the early-launch segment could occur randomly between 12:39 AM and 7:00<br />
AM. Dominant accident cases are represented by case 1.1 (Total Boost Vehicle Destruct)<br />
and cases 1.3 (Total Boost Destruct with SRMU Aft Segment Impact). From the variabilityonly<br />
results, their contribution to the phase 1 risk is 76% and 17% respectively. Typical<br />
releases in case 1.1 involve an SV impact source term dispersed within the SRMU fire<br />
plume which stabilizes at altitudes between 400 m and 1200 m.<br />
As reported in Table 6.7.1-4, the population at risk in phase 1 is mainly off-site residents<br />
with mean health effects about a factor of 10 to 100 higher than the mean health effects of<br />
off-grid population and on-site workers. This is due to the elevation of releases associated<br />
by either the SRMU fire plume and or a liquid propellant fireball, both of which disperse the<br />
source term to large off-site areas but at very low concentrations. Land contamination<br />
exceeding 0.2 mei/m 2 is primarily caused by large particles above 16 gm and would be<br />
expected to be restricted to the KSC launch site, composed of on-site facilities or<br />
unpopulated areas with marshes and dense vegetation.<br />
Similar to pre-launch accidents, the resuspension pathway dominates the health effects<br />
results. This is attributed to the large areal releases through SRMU fire plume, primarily<br />
affecting urban off-site areas. In the variability-only analysis, 90% of simulated case 1.1<br />
accidents include type 3 - SRMU fire plume releases. Source terms from a type 3 release<br />
would most likely be engulfed by the large SRMU fire plume. Therefore, the majority of the<br />
source term for case 1.1 is typically dispersed as a uniform column filling the mixing height.<br />
Table 6.7.2-1 summarizes the percentage of analyses in which each of the four primary<br />
pathways was most dominant.<br />
6-128
Final Technical Report<br />
GPHS-RTGs for the Cassini Mission<br />
Lockheed Martin <strong>Document</strong> No. RR18<br />
August 1998<br />
Table 6.7.2-1. Dominant Exposure Pathways in Selected Phase 1 Accident Cases<br />
Case Inhalation -<br />
Cloud Passage<br />
Inhalation -<br />
Resuspension<br />
Produce<br />
Ingestion<br />
Seafood<br />
Ingestion<br />
1.1 2% 87% 5% 5%<br />
1.3 4% 81% 9 c/0 6 c/0<br />
1.10 10% 75% 7% 8 'Yo<br />
1.13 3% 70% 15% 12%<br />
6.7.2.3 Late Launch Accidents<br />
Reentry accidents during the late launch phase involve the fuel release upon impacts of<br />
RTG modules on a hard rock surface. The dominant contributors to the late launch phase<br />
risk is accident case 5.2 or nominal orbital decay reentry. Based on the evaluated bounce<br />
height of RTG modules on a rock surface, the source term is modeled as a a = 1 meter<br />
Gaussian cloud released at 0.5 m above ground.<br />
While the major contributor to health effects of early launch accidents is resuspension, direct<br />
inhalation during cloud passage is dominant for late launch accidents. The typical<br />
contribution to health effects from direct inhalation and resuspension pathways for the late<br />
launch accidents are 60% and 40%, respectively. Reentry accidents during late launch<br />
have maximum individual doses equal to or less than 20 rem. A total of 55% of the surface<br />
impacts occur within population density classes 4, 5, and 6 (i.e., 6.5, 17.5, and 37.5<br />
persons/km 2). For the accident case 5.2, the average population density of impacted areas<br />
is at 98 pers/km 2, and an average of 2.46 modules release fuel upon rock impact.<br />
Because of the relatively low release height in these accidents, ground depletion of the<br />
clouds has a significant influence on consequence predictions. As a result, most of the<br />
exposed population are located in the first 60 km of transport, with maximum exposure<br />
doses occurring between 1 and 3 km.<br />
6.7.2.4 EGA Reentry Accidents<br />
Up to eight release types could contribute to the health consequence result from an EGA<br />
reentry accident. Air releases at high altitudes (GIS failed - air release) and soil impact<br />
releases from GISs with melted clads (GIS OK - Clad melt on soil) dominate the EGA<br />
6-129
Final Technical Report<br />
GPHS-RTGs for the Cassini Mission<br />
Lockheed Martin <strong>Document</strong> No. RR18<br />
August 1998<br />
consequence, contributing 32% and 54% respectively to the mean health effects. Table<br />
6.7.2-2 provides the mean value of breached modules sampled for each release type. As<br />
shown, 49% of releases leading to health consequence are associated with air releases at<br />
high altitudes with a mean value of 0.54 failed modules. The GIS OK - Clad melt release<br />
type has a higher mean value of 6.88 failed modules but is present in 60% of the releases.<br />
Similar to out-of orbit reentry accidents, surface impacts in areas with population density<br />
classes 4, 5 and 6 are dominant, accounting for a total of 45% of all surface impacts.<br />
Releases in population density class 8 (175 persons/km 2) and above represent about 8% of<br />
all surface impact releases.<br />
Each EGA reentry accident is a combination of various fuel release types with different<br />
characteristics. While fuel releases at high altitudes could have a worldwide exposed<br />
population, fuel releases at ground impacts affect only specific receptor cells. Fuel releases<br />
at high altitudes, due to the long atmospheric residence times that result in a low ground<br />
deposition rate over several years, contribute mainly to health consequence through the<br />
direct inhalation pathway. The fuel releases at ground impacts due to the relatively low<br />
altitude of the source term, could contaminate some surface areas with high ground<br />
concentrations, and thus, the resuspension pathway could be dominant in those cases.<br />
Adding to the complexity of this type of release, the number of breached modules<br />
determining the total source term, is dependent on the exposed rock fraction or soil fraction<br />
which can vary significantly with the 720 equal-area receptor cells.<br />
Overall, the direct inhalation pathway is the dominant contributor to health consequence for<br />
EGA reentry accidents. For simulated accidents that have in-air release occurring in the<br />
stratosphere, the air concentration at ground level is dependent on the residence time<br />
within both the stratosphere and the troposphere. However, since the tropospheric<br />
residence time describes how fast the air concentration of fuel particles is depleted to the<br />
ground, it has a significant impact on the inhalation exposure pathway. The stratospheric<br />
residence time has virtually no influence on the health effects results because it only<br />
controls the transfer rate of material between the stratosphere and the troposphere, and the<br />
residence time considered for this atmospheric layer is shorter than both the decay factor for<br />
the plutonia fuel and the 50 year exposure period considered. For simulated accidents with<br />
ground impact releases, the relatively low height of release induces a rapid depletion of the<br />
source term cloud. Therefore, maximum exposure due to inhalation during cloud passage<br />
is expected to occur in the first few kilometers.<br />
6-130
Table 6.7.2-2. Comparison of Consequence Contributions by GIS/Module End State<br />
between the 500 km and 800 km EGA Analyses<br />
Final Technical Report<br />
GPHS-RTGs for the Cassini Mission<br />
Lockheed Martin <strong>Document</strong> No. RR18<br />
August 1998<br />
Released Type<br />
Contribution<br />
to<br />
Mean Health<br />
Effects*<br />
500 km EGA<br />
FSAR Suppl<br />
Contribution<br />
to<br />
Mean Health<br />
Effects*<br />
800 km EGA<br />
Post Suppl<br />
Percentage<br />
Contribution<br />
to<br />
Mean Health<br />
Effects*<br />
500 km EGA<br />
FSAR Suppl<br />
Percentage<br />
Contribution<br />
to<br />
Mean Health<br />
Effects*<br />
800 km EGA<br />
Post Suppl<br />
Occurrence<br />
Probability<br />
Given<br />
Consequence*<br />
500 km EGA<br />
FSAR Suppl<br />
Occurrence<br />
Probability<br />
Given<br />
Consequence*<br />
800 km EGA<br />
Post Suppl<br />
Mean<br />
Number of<br />
Failed<br />
Modules<br />
500 km EGA<br />
FSAR Suppl<br />
Mean<br />
Number of<br />
Failed<br />
Modules<br />
800 km EGA<br />
Post Suppl<br />
Intact Module on<br />
Rock<br />
4.98e-04 6.34e-04 0.00 0.00 0.0442 0.862 0.10 0.16<br />
GIS OK - Clad<br />
OK on Rock<br />
1.85e-02 1.04e-02 0.01 0.01 0.1656 0.1566 0.35 0.24<br />
GIS OK - Clad<br />
Melt on Soil<br />
19.4 49 14.17 53.96 0.4044 0.6004 3.17 6.88<br />
GIS OK -Clad<br />
Melt on Rock<br />
3.8 12.3 2.78 13.55 0.1820 0.3306 0.34 0.86<br />
GIS Failed on<br />
Soil<br />
2.91 0.61 2.13 0.67 0.2131 0.0667 0.31 0.07<br />
GIS Failed on<br />
Rock<br />
8.23e-02 6.8e-03 0.06 0.01 0.0253 0.0043 0.03 0.00<br />
GIS Failed - Air<br />
Release<br />
110.6 28.8 80.79 31.72 0.8882 0.4882 1.68 0.54<br />
All Types 136.9 90.8<br />
* 50 Year without de-minimis<br />
FSAR Suppl = From FSAR Addendum: Supplemental Analysis, issued May 1997<br />
Post Suppl = From Reference 6.7-1, issued October 1997
Final Technical Report<br />
GPHS-RTGs for the Cassini Mission<br />
Lockheed Martin <strong>Document</strong> No. RR18<br />
August 1998<br />
6.8 CONSEQUENCE UNCERTAINTY ANALYSIS<br />
The Cassini safety analysis included an integral evaluation of the uncertainty in the<br />
consequence results. This evaluation was complex in nature because the accident<br />
consequences were presented as probability distributions representing the variability in<br />
potential accident probability and severity. Evaluation of the uncertainty of a probability<br />
distribution is considerably more complex than the standard uncertainty analysis, which<br />
estimates the uncertainty in a number. This section discusses the reasons for performing an<br />
uncertainty analysis, the procedure that was followed to perform the analysis and the results<br />
of the analysis.<br />
6.8.1 Analysis Methodology<br />
The Cassini safety analysis consisted of a number of physical models of processes which<br />
are expected to occur in potential mission accidents which could result in the release of<br />
radioactive material. Many of these models described complex situations and were based<br />
upon a relatively modest amount of experimental and observational data. In such situations<br />
the usefulness of the results of an analysis are increased by a knowledge of the uncertainty<br />
in those results. This can arise from uncertainty in the inputs to the models (parameter<br />
uncertainty) or from uncertainty in the models themselves (model uncertainty). Results of<br />
uncertainty analyses are generally reported in terms of confidence levels or confidence<br />
intervals. For example there is a 95% "probability" that the actual consequence will be less<br />
severe than the 95% confidence level distribution. There is a 90% "probability" that the<br />
actual consequence distribution will lie in the 90% consequence interval between the 5%<br />
and 95% confidence levels.<br />
The consequence analyses reported in the two FSARs for the Galileo and Cassini missions,<br />
as performed by HNUS, did not include quantitative evaluation of uncertainty. The Galileo<br />
SER, prepared by INSRP, had a qualitative uncertainty analysis whereas the Ulysses SER<br />
included a quantitative uncertainty analysis. The Ulysses FSAR mission health effects<br />
distribution was below the 5% confidence level health effects distribution as determined by<br />
INSRP and presented in the Ulysses SER. Without an uncertainty analysis for the FSAR<br />
result, it was not possible to determine if the disagreement in the results reflected a<br />
fundamental disagreement in the modeling or reflected uncertainty in the two models.<br />
6-132
Final Technical Report<br />
GPHS-RTGs for the Cassini Mission<br />
Lockheed Martin <strong>Document</strong> No. RR18<br />
August 1998<br />
Therefore, it was generally agreed that the Cassini safety analysis should include an<br />
evaluation of uncertainty. The decision was made to restrict the uncertainty analysis to<br />
parameter uncertainty. Inclusion of model uncertainty is appropriate when the experimental<br />
data available does not allow one to distinguish between several existing models which<br />
give greatly differing results. This did not appear to be the situation for most of the models in<br />
the Cassini safety analysis.<br />
Once the decision to perform an uncertainty analysis was made, it became necessary to<br />
choose the procedure for carrying out the uncertainty analysis. The method was developed<br />
in parallel with the development of the method for analyzing the consequence variability,<br />
which was being performed in-house for the first time. Previously HNUS had analyzed<br />
consequence variability using a two step process. The first step was a calculation of the<br />
consequence arising from the average source terms for each of the various accident<br />
phases. The second step was a Monte Carlo simulation of the variability which used the<br />
distributions of important source term and consequence model variables and the<br />
sensitivities of the consequence to the values of those variables.<br />
The approach chosen for variability involved performing multiple consequence calculations<br />
using sampled source terms and sampled meteorological conditions. This approach was<br />
felt to be more accurate than the previously used method, as the actual variables and their<br />
effects are used, rather than models of the variable distributions and models of the<br />
sensitivity of the consequence to the variable values. Latin Hypercube Sampling (LHS)<br />
was chosen to increase the accuracy of the resulting consequence distributions for a given<br />
number of consequence calculations, since the complexity of the calculation limited the<br />
number of consequence calculations which could be performed for an accident case in a<br />
reasonable time to -1000.<br />
The standard method for performing an uncertainty analysis requires rerunning the<br />
variability analysis many times, with different sampled values of the uncertain parameters<br />
used for each run. Consequence distributions at various confidence levels are then<br />
determined from the family of consequence distributions which results. This approach was<br />
not practical due to the computationally intensive nature of the consequence variability<br />
calculation.
Final Technical Report<br />
GPHS-RTGs for the Cassini Mission<br />
Lockheed Martin <strong>Document</strong> No. RR18<br />
August 1998<br />
The first approach considered for the uncertainty analysis was similar to the H N US<br />
approach to variability, namely a sensitivity study followed by a simulation. This approach<br />
was rejected in favor of a more general method based on deconvolution, a mathematical<br />
procedure used in signal and image processing to separate signals from distortion.<br />
Deconvolution is the inverse of convolution which combines two functions to produce a<br />
third. For example the probability density of the sum of two random variables is the<br />
convolution of the probability densities of the two variables. Deconvolution can be used to<br />
find the probability density of one of the variables if the density of the sum and the density of<br />
the other variable are both known.<br />
The uncertainty analysis required two sets of consequence calculations: a variability-only<br />
calculation in which parameters are held at their most probable values and a variabilityplus-uncertainty<br />
calculation in which variables and parameters were sampled<br />
simultaneously. Deconvolution was then used to separate the uncertainty distribution from<br />
the variability-plus-uncertainty distribution. The calculation was performed on the logarithm<br />
of the consequence, which resulted in an uncertainty multiplier distribution, since the<br />
logarithm of a product is the sum of the logarithms of the individual components.<br />
Furthermore, the logarithm of the uncertainty multiplier distribution was assumed to be<br />
normally distributed. The variability-only consequence distribution, the uncertainty<br />
multiplier, and the accident probability distributions were combined in the final step by a<br />
Monte Carlo simulation to determine the consequence distributions at various confidence<br />
levels.<br />
The overall procedure for analysis of variability and uncertainty consisted of the following<br />
steps:<br />
1. Classify quantities in the source term and consequence models as variables or<br />
parameters. Quantities representing physical properties such as temperatures,<br />
pressures, velocities, etc. were regarded as variables. Model derived quantities such<br />
as thresholds, yield strengths, moments of variable distributions, etc. were classified as<br />
parameters.<br />
2. Determine distributions for the variables and parameters. Distributions of variables<br />
representing the accident environments came from the Databook. Meteorological<br />
variability was captured by using actual past meteorological data. Parameter<br />
distributions were determined by several different procedures. Standard statistical<br />
formulae were used to determine the uncertainty in parameter values resulting from<br />
limited experimental data for a number of the source term models. Engineering<br />
judgment was used in situations where the experimental data was insufficient to use<br />
quantitative methods. Sandia National Laboratories provided assistance in<br />
6-134
Final Technical Report<br />
GPHS-RTGs for the Cassini Mission<br />
Lockheed Martin <strong>Document</strong> No. RR18<br />
August 1998<br />
determining parameter distributions for a number of consequence model parameters<br />
derived from observational data.<br />
3. Structure the source term and consequence models so that the two types of<br />
calculations, the variability-only and the variability-plus-uncertainty calculations, could<br />
be performed. Parameters were held to their nominal values for the variability-only<br />
runs, but were sampled from their distributions for the variability-plus-uncertainty runs.<br />
The nominal parameter values were, in general, the values with the highest probability.<br />
Therefore these values were the median values in the frequent situation in which the<br />
parameter distribution was normal or lognormal. (The use of median values as<br />
nominal parameter values is desirable as it results in the variability-only calculation<br />
giving a "best-estimate" distribution.) In some cases the distributions were neither<br />
normal nor lognormal or the distribution was modified between the variability-only run<br />
and the variability-plus-uncertainty run. In those cases the nominal parameter values<br />
were often somewhat different from the median value of the parameter distribution.<br />
However there was no systematic bias on the nominal value, so that the result of the<br />
variability-only run was not systematically biased away from the "best-estimate". It<br />
should also be noted that the sampling procedures for variables and parameters were<br />
somewhat different in the variability-plus uncertainty runs. Source term variables were<br />
sampled for each use, excluding material properties, which were sampled once per<br />
trial. Source term parameters were sampled once per trial. Consequence variables<br />
and parameters were sampled once per LHS trial.<br />
4. Perform the variability-only and the variability-plus-uncertainty runs for the various<br />
accident cases. The implementation of these runs differed for the various mission<br />
phases, as described elsewhere.<br />
5. Perform deconvolution on the results of the variability-only and variability-plusuncertainty<br />
runs for important accident cases. This procedure was carried out for two<br />
consequences: 50 year health effects without de minimis and 50 year collective dose<br />
without de minimis. The results of the deconvolution process were the mean and<br />
standard deviation of the logarithm (base 10) of the uncertainty multiplier distribution.<br />
Deconvolution was also performed on the source term mass distribution, in order to<br />
estimate what portion of the uncertainty was due to the source term model.<br />
6. Perform the Monte Carlo simulation of uncertainty for individual accident cases,<br />
combined mission phases and the entire mission to obtain consequence distributions<br />
and distribution statistics at various confidence levels.<br />
7. Perform a sensitivity analysis using the consequence parameter values and<br />
consequences from the variability-plus-uncertainty distribution to determine which<br />
parameters were the main contributors to the overall uncertainty. A linear regression of<br />
the logarithm of "normalized" health effects versus the logarithms of the parameters<br />
was used. These were combined with the standard deviations of the logarithms of the<br />
parameters to estimate the contribution of the important parameters to the overall<br />
uncertainty. The term "normalized" health effects refers to health effects divided by<br />
source term mass. This normalization reduced variability, resulting in more accurate<br />
regression coefficients. For EGA the parameter regression was performed for in-air<br />
releases, which represented approximately 80% of the total consequence of potential<br />
reentries from EGA. This precluded using the source term deconvolution in the<br />
parameter analysis since deconvolution was carried out on the entire source term, not<br />
the in-air release source term component.<br />
6-135
6.8.2 Uncertainty Analysis Results<br />
Final Technical Report<br />
GPHS-RTGs for the Cassini Mission<br />
Lockheed Martin <strong>Document</strong> No. RR18<br />
August 1998<br />
Deconvolution was carried out for accident cases 0.0 (pre-launch), 1.1 and 1.3 (early<br />
launch), 3.1, 5.1, and 5.2 (late launch) and EGA. The mean and the standard deviation a<br />
of the log (base 10) of the uncertainty multiplier distribution are given in Table 6.8-1. The<br />
units of g and a are "orders of magnitude" since they are the mean and standard deviation<br />
of the log (base 10) of the uncertainty multiplier distribution.<br />
Table 6.8-1. Deconvolution Results<br />
Source Term Health Effects Collective Dose<br />
Accident<br />
Case g a il, a 11 a<br />
0.0 0.21 0.67 0.35 1.06 0.45 1.10<br />
1.1 -0.32 0.37 0.11 0.64 0.16 0.73<br />
1.3 0.55 0.96 0.37 0.59 0.47 0.81<br />
3.1 0.14 0.19 0.00 1.20 0.11 1.18<br />
5.1 0.13 0.19 0.00 1.20 0.11 1.18<br />
5.2 0.13 0.26 -0.07 1.33 0.05 1.35<br />
EGA 0.31 0.15 0.33 0.90 0.44 0.85<br />
The results of the parameter sensitivity studies are shown in Tables 6.8-2 through 6.8-5 for<br />
accident cases 0.0, 1.1, 5.3, and EGA. The tables include a comparison of the total variance<br />
calculated from the important parameters and the total variance as determined from<br />
deconvolution. The lack of close agreement between these quantities shows that the<br />
contributions to variance for each of the parameters must be regarded as a rough estimate.<br />
Table 6.8-2. Case 0.0 (Pre-Launch): Parameter Regression Analysis<br />
Source Term Mass<br />
(from deconvolution)<br />
Source of Uncertainty<br />
Regression<br />
Coefficient<br />
Standard<br />
Deviation of<br />
Log<br />
(Parameter)<br />
Contribution<br />
to<br />
Variance<br />
- - 0.45<br />
Inhalation Dose Conversion Factor Multiplier 0.76 ± 0.04 0.66 0.25<br />
Urban Resuspension Factor 0.22 ± 0.02 1.37 0.09<br />
Total of Above 0.79<br />
Deconvolution Result (Health Effects)<br />
1.12 _<br />
6-136
Source Term Mass<br />
(from deconvolution)<br />
Final Technical Report<br />
GPHS-RTGs for the Cassini Mission<br />
Lockheed Martin <strong>Document</strong> No. RR18<br />
August 1998<br />
Table 6.8-3. Case 1.1 (Early Launch): Parameter Regression Analysis<br />
Source of Uncertainty<br />
Inhalation Dose Conversion<br />
Factor Multiplier<br />
Regression<br />
Coefficient<br />
Standard<br />
Deviation of<br />
Log<br />
(Parameter)<br />
Contribution<br />
to<br />
Variance<br />
- - 0.14<br />
0.74 ± 0.04 0.66 0.25<br />
Urban Resuspension Factor 0.35 ± 0.02 1.37 0.23<br />
Total of above 0.62<br />
Deconvolution Result (Health Effects) 0.41<br />
Table 6.8-4. Case 5.3 (Late Launch): Parameter Regression Analysis<br />
Parameter<br />
Regression<br />
Coefficient<br />
Standard<br />
Deviation of Log<br />
(Parameter)<br />
Contribution<br />
to<br />
Variance<br />
Deposition Velocity Multiplier -0.77 ± 0.03 0.92 0.50<br />
Inhalation Dose Conversion<br />
Factor Multiplier<br />
Source Term Mass<br />
(from deconvolution)<br />
1.00 ± 0.04 0.66 0.43<br />
- - 0.07<br />
Urban Resuspension Factor 0.18 ± 0.02 1.37 0.06<br />
Health Effects Estimator Multiplier 1.00 ± 0.10 0.24 0.06<br />
Inhalation Sheltering Factor 0.36 ± 0.04 0.49 0.03<br />
Breathing Rate 1.01 ± 0.17 0.15 0.02<br />
Total of Above 1.17<br />
Deconvolution Result (Health Effects) 1.77<br />
Table 6.8-5. EGA In-Air Release Parameter Regression Analysis<br />
Parameter<br />
Regression<br />
Coefficient<br />
Standard<br />
Deviation of Log<br />
(Parameter)<br />
Contribution<br />
to<br />
Variance<br />
Inhalation Dose Conversion Factor Multiplier 0.97 ± 0.02 0.67 0.43<br />
Troposphere Residence Time 0.90 ± 0.02 0.51 0.22<br />
Health Effects Estimator Multiplier 0.98 ± 0.05 0.24 0.06<br />
Breathing Rate 0.96 ± 0.08 0.15 0.02<br />
Total of Above 0.73<br />
6-137
Final Technical Report<br />
GPHS-RTGs for the Cassini Mission<br />
Lockheed Martin <strong>Document</strong> No. RR18<br />
August 1998<br />
Several results are noteworthy. The inhalation dose conversion factor multiplier is an<br />
important contributor to uncertainty for all four accident cases analyzed. This parameter is a<br />
direct multiplier for health effects resulting from inhalation (the primary pathway) and has a<br />
standard deviation of about two-thirds of an order of magnitude. Source term uncertainty is<br />
most important for pre-launch and early launch, reflecting the complexity of modeling these<br />
accident cases. The contribution to uncertainty in pre-launch and early launch from the<br />
urban resuspension factor reflects the fact that long-term resuspension is the dominant<br />
health effects pathway in those mission segments. The important role of the deposition<br />
velocity multiplier for late launch results from the facts that direct inhalation is the primary<br />
pathway for this mission segment and that the release is very close to the ground.<br />
Increased deposition depletes the release before it reaches more population, as indicated<br />
by the negative regression coefficient. Troposphere residence time is a significant<br />
uncertainty contributor for EGA in-air releases since it determines how long the particles are<br />
available for inhalation.<br />
Figure 6.8-1 shows the CCDFs (complementary cumulative distribution functions) for 50<br />
year health effects (without de minimis) for variability-only and the 5%, 50%, and 95%<br />
confidence levels for the mission. The near coincidence of the variability-only CCDF and<br />
the 50% confidence level CCDF shows that the variability-only result lies in the middle of<br />
the uncertainty range and is a "best-estimate". Table 6.8-6 provides expectation values of<br />
health effects for the three confidence levels, variability-only and variability-and-uncertainty<br />
for the mission phases and the combined mission. The variability-and-uncertainty<br />
expectation value is a mean over both variability and uncertainty.<br />
6-138
Final Technical Report<br />
GPHS-RTGs for the Cassini Mission<br />
Lockheed Martin <strong>Document</strong> No. RR18<br />
August 1998<br />
1 0°<br />
10"<br />
5% Confidence Level<br />
50% Confidence Level<br />
95% Confidence Level<br />
Variability-Only<br />
10"<br />
10 "<br />
10 -<br />
10 -1°<br />
10 -6 10-4 10-2 1 0 ° 102 104<br />
Health Effects<br />
1 06<br />
Figure 6.8-1. Total Mission 50 Year Health Effects (without de minimis)<br />
Table 6.8-6. 50 Year Health Effects without de minimis Expectation Values<br />
Mission<br />
Phases<br />
Mission<br />
Segment<br />
Variability-<br />
Only<br />
Variability<br />
and<br />
Uncertainty<br />
5%<br />
Confidence<br />
Level<br />
50%<br />
Confidence<br />
Level<br />
95%<br />
Confidence<br />
Level<br />
0 Pre-Launch 3.4 x 10⁻⁸ 2.7 x 10⁻⁵ 7.6 x 10⁻⁸ 6.0 x 10⁻⁸ 4.2 x 10⁻⁴<br />
1 Early Launch 4.7 x 10⁻⁵ 9.4 x 10⁻⁵ 5.0 x 10⁻⁶ 6.2 x 10⁻⁵ 7.9 x 10⁻⁴<br />
3-8 Late Launch 9.4 x 10⁻⁵ 4.7 x 10⁻⁴ 4.0 x 10⁻⁷ 7.3 x 10⁻⁵ 1.3 x 10⁻²<br />
EGA Reentry<br />
(Short Term)*<br />
8.6 x 10⁻⁵ 4.8 x 10⁻⁴ 1.5 x 10⁻⁸ 8.7 x 10⁻⁵ 4.3 x 10⁻³<br />
Total Mission:* 2.3 x 10⁻⁴ 1.8 x 10⁻³ 8.3 x 10⁻⁸ 2.2 x 10⁻⁴ 1.9x10⁻²<br />
* Based on 500 km Earth Swingby<br />
6-139
6.9 CASSINI SAFETY TEST PROGRAM<br />
Final Technical Report<br />
GPHS-RTGs for the Cassini Mission<br />
Lockheed Martin <strong>Document</strong> No. RR18<br />
August 1998<br />
A review of the safety analyses performed for the Galileo and Ulysses RTG missions<br />
concluded that there were several events for which new or modified RTG response models<br />
would improve risk assessment evaluation. Additional safety testing was identified to<br />
support modeling development activities, specifically: a) RTG terminal velocity impact; and<br />
b) edge-on collisions of plate fragments with an RTG. A description of each test and the test<br />
results are summarized herein from Reference 6.9-1.<br />
6.9.1 RTG End-On Impact Test<br />
6.9.1.1 Background<br />
Analysis of RTG trajectories following near-pad release from an in-flight vehicle indicate that<br />
concrete targets can be impacted at speeds approaching terminal velocity. An RTG would<br />
be expected to undergo random tumbling and thus have a probability (though a low one) of<br />
impacting at an approximately end-on attitude. In this event, the maximum impact speed is<br />
the terminal velocity of the RTG in tumbling flight which is approximately 56 m/s.<br />
The purpose of the RTG impact tests was to produce test data on fueled clad distortion<br />
versus GPHS module stack position in the RTG and the variability in distortion at each<br />
position. A secondary objective was to obtain data on fractional fuel-simulant release in the<br />
event of a breach in the fueled clad.<br />
6.9.1.2 Test Description<br />
Testing was conducted at the Sandia National Laboratory (SNL) Rocket Sled Test Track<br />
(Area III) and was coordinated by Los Alamos National Laboratory (LANL). The test<br />
schematic is shown in Figure 6.9-1. A stack of nine simulated GPHS modules was heated<br />
in a furnace with an argon atmosphere. The furnace was mounted on a test stand and<br />
positioned over a simulated RTG which was mounted to a rocket sled.<br />
The heat source stack was heated to approximately 1210°C and lowered from the furnace<br />
into the simulated RTG. The simulated RTG was rotated 90°, after the heat source was<br />
latched in place, to orient it for impact at the outboard end, as shown in Figure 6.9-2. After<br />
allowing the heat source to cool to approximately 1090°C (the estimated impact<br />
temperature) the sled rocket was fired, propelling the simulated RTG into a concrete target.<br />
6-140
Final Technical Report<br />
GPHS-RTGs for the Cassini Mission<br />
Lockheed Martin <strong>Document</strong> No. RR18<br />
August 1998<br />
HEAT SOURCE<br />
LOWERING<br />
MECHANISM<br />
HEAT SOURCE<br />
STACK<br />
APERTURE PLATE<br />
CRUSHABLE<br />
MATERIAL<br />
CONCRETE<br />
TARGET<br />
DIRECTION<br />
OF TRACE_<br />
Figure 6.9-1. RTG End-On Impact Test Schematic<br />
6-141
Figure 6.9-2. RTG End-On Impact Test Stand and Test Setup<br />
Final Technical Report<br />
GPHS-RTGs for the Cassini Mission<br />
Lockheed Martin <strong>Document</strong> No. RR18<br />
August 1998
Final Technical Report<br />
GPHS-RTGs for the Cassini Mission<br />
Lockheed Martin <strong>Document</strong> No. RR18<br />
August 1998<br />
The sled was designed to compress as it impacted a steel aperture plate, located<br />
approximately four feet in front of the concrete target (reference Figure 6.9-3). The aperture<br />
plate was designed to stop the sled while allowing the simulated RTG to pass through its<br />
opening and impact the concrete target.<br />
The concrete target used for the test was obtained from the Cape Canaveral Air Station and<br />
was typical of the concrete used for installations in the vicinity of the launch pads. The<br />
concrete target dimensions were 36 inches x 48 inches x 18 inches thick.<br />
Two impact tests were conducted. The first test (RTG-1) was conducted at a velocity of 57.6<br />
m/s and the second test (RTG-2) was conducted at a higher velocity (77.1 m/s) in order to<br />
establish a threshold for obtaining a breach in the fuel clad.<br />
Figure 6.9-3. Setup of Steel Aperture Plate and Concrete Impact Target<br />
6.9.1.3 Test Hardware<br />
The simulated RTG test article consisted of approximately one half of a full length RTG<br />
converter shell. The outboard end of the converter, which was impacted against the<br />
6-143
Final Technical Report<br />
GPHS-RTGs for the Cassini Mission<br />
Lockheed Martin <strong>Document</strong> No. RR18<br />
August 1998<br />
concrete target, was prototypical of the RTG design. It included an Al 2219 pressure dome<br />
and outboard heat source support system which was comprised of the outboard multifoil<br />
insulation end cap, titanium preload frame (spider), FWPF pressure plate, etc. Four spring<br />
loaded latches, located on the inboard end of the converter housing, secured the heat<br />
source stack in the converter. A blanket insulation (Cerafelt) was used inside the converter<br />
to maintain heat source temperature and a purge line was provided to maintain an inert<br />
cover gas to minimize oxidation. Two trunnions were provided to permit 90° rotation of the<br />
simulated RTG on the rocket test sled, after heat source loading, to orient it for impact. The<br />
simulated RTG test article is shown in Figure 6.9-4.<br />
The heat source stack is shown in Figure 6.9-5. The heat source stack consisted of eight<br />
modules with FWPF aeroshells containing urania fueled clads or molybdenum mass<br />
simulants and a ninth module having a POCOTM AXF-5Q graphite aeroshell. The module<br />
stack positions were numbered 1 through 9 with the number 1 module located at the<br />
outboard end of the converter (first module at impact end). The modules were stacked<br />
using FWPF lock members and the modules were held in place with FWPF tie rods as<br />
shown in Figure 6.9-5.<br />
6.9.1.4 Test Results<br />
RTG-1 Test (Impact Velocity: 57.6 m/s)<br />
The RTG-1 test was conducted in April 1995 at an impact velocity of 57.6 m/s representing<br />
the terminal velocity of an RTG in tumbling flight. Iridium fuel clad temperature, at time of<br />
impact, was 1071 ± 5°C.<br />
The simulated RTG rebounded after impacting the concrete target with a modest twisting of<br />
the inboard (trailing) end of the housing. Deformation to the RTG outer shell, shown in<br />
Figure 6.9-6, was primarily at the outboard end, above the circumferential stiffening ring<br />
which is located 2.95 inches from the outboard flange. The outboard pressure dome<br />
remained intact but was compacted such that the imprint of the titanium support frame (part<br />
of the outboard heat source support system) was apparent. The deformation of the titanium<br />
support frame from the impact is believed to have contributed to the deformation of the GISs<br />
in modules #1 and #2. There was considerable breakup of the heat source stack inside the<br />
converter. A piece of the stack tie rod and lifting lug, along with one intact module (#9),<br />
were ejected from the back (inboard end) of the converter housing.<br />
6-144
-,• •••:.<br />
Final Technical Report<br />
GPHS-RTGs for the Cassini Mission<br />
Lockheed Martin <strong>Document</strong> No. RR18<br />
August 1998<br />
, CONVERTER<br />
OUTER SHELL<br />
- '• TRUNNION •<br />
•<br />
Side <strong>View</strong><br />
1111 OUTBOARD<br />
HEAT SOURCE<br />
SUPPORT<br />
•<br />
HEAT SOURCE<br />
LATCHING<br />
MECHANISM<br />
Top <strong>View</strong><br />
Figure 6.9-4. Simulated RTG Test Article — End-On Impact Test<br />
6-145
Final Technical Report<br />
GPHS-RTGs for the Cassini Mission<br />
Lockheed Martin <strong>Document</strong> No. RR18<br />
August 1998<br />
LATCHING PLATE<br />
LIFTING LUG<br />
7.42 IN DIA<br />
INSULATION<br />
20.84 IN<br />
GPHS MODULE #9<br />
LOCK MEMBERS<br />
TIE ROD<br />
—Eh r.12=2=t•—= _<br />
-10FAMI1=1=<br />
11111111111111111111111.11116<br />
1131111111111111<br />
OUTBOARD H.S. END<br />
PLATE<br />
GPHS MODULE #1<br />
3.83 IN<br />
Figure 6.9-5. Heat Source Stack Configuration for RTG End-on Impact Tests<br />
Figure 6.9-6. RTG Outer Shell Damage after 57 m/s Impact<br />
6-146
Final Technical Report<br />
GPHS-RTGs for the Cassini Mission<br />
Lockheed Martin <strong>Document</strong> No. RR18<br />
August 1998<br />
The module #1 and #2 aeroshells and GISs were shattered into several pieces. Fueled<br />
clad deformations are listed in Table 6.9-1. The largest deformations were experienced by<br />
the fueled clads in module #1, as expected. No visible cracks or breaches were observed<br />
in any of the fueled clads. Fueled clad SC0076 was located in the blind (non-threaded) end<br />
of the A GIS in module #1. It exhibited the greatest deformation, as indicated by distortion<br />
calculations, of all the fueled clads impacted in this test (Figure 6.9-7). Despite its relatively<br />
large deformation, neither SC0076 nor any other fueled clad had breached.<br />
Table 6.9-1. Clad Distortion after 57 m/s Impact Test (RTG-1)<br />
Distortion, % ( 1 )<br />
Vent Cup, Diametral<br />
Shield Cup, Diametral<br />
Module Fueled Clad ID Axial Max. Min. Max. Min.<br />
1 SC0077 8.30 12.60 -15.08 10.71 -4.28<br />
1 SC0076 19.48 20.57 -17.14 15.94 -11.31<br />
1 SC0079 5.84 9.34 -2.06 6.26 -3.77<br />
1 SC0078 5.93 11.65 -8.65 10.37 -5.14<br />
2 S00081 2.12 6.34 -6.51 4.03 -1.03<br />
2 S00080 8.72 13.28 -7.80 8.40 -5.91<br />
2 SC0083 4.91 4.88 -3.94 4.88 -3.34<br />
2 SC0082 2.88 6.94 -7.88 4.71 -1.20<br />
3 SC0085 2.29 1.63 -4.37 1.29 -0.51<br />
3 SC0084 1.78 3.34 -3.94 2.49 -1.80<br />
3 SC0088 1.35 1.37 -4.11 0.94 -1.80<br />
3 SC0087 1.02 0.86 -2.40 0.94 -1.63<br />
4 SC0065 1.61 0.51 -1.97 0.77 -1.80<br />
4 SC0064 2.03 1.46 -4.97 1.29 -3.86<br />
4 SC0067 1.02 0.77 -3.00 1.97 -2.40<br />
4 SC0066 2.29 2.14 -3.08 1.89 -3.60<br />
5 SC0069 0.00 -0.26 -0.17 0.26 0.17<br />
5 SC0068 -0.08 -0.34 0.00 0.26 0.26<br />
5 S00071 -0.85 -0.34 -0.26 0.34 0.17<br />
5 S00070 -0.08 -0.34 -0.17 0.34 0.17<br />
1 ) Distortion calculations based on nominal dimensions (length =1.181 in. and cup diameter = 1.167 in.).
Final Technical Report<br />
GPHS-RTGs for the Cassini Mission<br />
Lockheed Martin <strong>Document</strong> No. RR18<br />
August 1998<br />
a) Impact Face b) Profile<br />
C) Trailing Face- d) Opposite Profile<br />
Figure 6.9-7. Fueled Clad SC0076 after 57 m/s Impact Test
Final Technical Report<br />
GPHS-RTGs for the Cassini Mission<br />
Lockheed Martin <strong>Document</strong> No. RR18<br />
August 1998<br />
e) Vent End<br />
f) Blind End<br />
6.9-7. Fueled Clad SC0076 after 57 m/s Impact Test (Cont'd)
Final Technical Report<br />
GPHS-RTGs for the Cassini Mission<br />
Lockheed Martin <strong>Document</strong> No. RR18<br />
August 1998<br />
RTG-2 Test (Impact Velocity: 77 m/s)<br />
The RTG-2 test was conducted in May 1995 at an impact velocity of 77.1 m/s, exceeding the<br />
terminal velocity of an RTG in tumbling flight by more than one-third. Iridium fuel clad<br />
temperature, at time of impact, was 1090 ± 5°C.<br />
Deformation of the RTG outer shell was significant, as shown in Figure 6.9-8. The RTG<br />
outer shell was compacted, as a result of the impact, by approximately 6 inches. The<br />
pressure dome sheared off and was found lying beside the RTG. Several of the pressure<br />
dome attachment bolts were imbedded in the concrete target. Four fueled clads were<br />
ejected from the outboard end of the RTG. They were from modules #1, #2, and #4. Four<br />
modules (#6, #7, #8, and #9) were ejected from the back (inboard end) of the RTG. Module<br />
#6 was cracked in half and contained one intact GIS. The other GIS was cracked and its<br />
fueled clads released. The other three modules were intact. A summary of the fueled clad<br />
deformations is shown in Table 6.9-2.<br />
Three of the four fueled clads ejected from the outboard (leading) end of the RTG were<br />
breached (fueled clads SC0092, SC0096 and SC0107). A large section of iridium was<br />
missing from the vent cup of fueled clad SC0092, located in the open (threaded) end of the<br />
C GIS in module #1 (Figure 6.9-9). The impact face of the fueled clad was centered at<br />
approximately 0 degrees at the weld start. The area of this breach was measured to be 485<br />
mm 2. Approximately 12 g of fuel simulant was released.<br />
Breached fueled clad SC0096 was located in the open end of the C GIS in module #2. A<br />
transverse breaching crack was located in the vent cup in the impact face (0° from weld<br />
start). This crack measured approximately 10.81 mm long and had a width of approximately<br />
1.48 mm. The widest area of the crack appears to have been pushed open by fragmentation<br />
of the simulant fuel pellet beneath the clad wall. The crack appears to have been caused by<br />
impact with a relatively sharp edge of an external component upon impact, most likely the<br />
titanium "spider" located at the outboard end of the RTG. Approximately 0.2 g of fuel<br />
simulant was released from this fueled clad.
Final Technical Report<br />
GPHS-RTGs for the Cassini Mission<br />
Lockheed Martin <strong>Document</strong> No. RR18<br />
August 1998<br />
Figure 6.9-8. Simulated RTG after 77 m/s Impact Test<br />
6-151
Final Technical Report<br />
GPHS-RTGs for the Cassini Mission<br />
Lockheed Martin <strong>Document</strong> No. RR18<br />
August 1998<br />
Table 6.9-2. Fueled Clad Distortion after 77 m/s Impact Test (RTG-2)<br />
Distortion, % ( 1 )<br />
Vent Cup, Diametral<br />
Shield Cup, Diametral<br />
Module Fueled Clad ID Axial Max. Min. Max. Min.<br />
1 S00090 4.10 7.28 -7.03 6.77 -3.34<br />
1 SC0089 10.65 12.51 -14.48 10.11 -8.83<br />
1 SC0092 14.98 NM (2) NM (2) 10.03 -4.28<br />
1 SC0091 5.87 10.45 -12.00 5.48 -5.31<br />
2 SC0094 2.47 4.71 -5.91 2.57 -2.31<br />
2 SC0093 1.95 3.43 -2.48 2.48 -2.31<br />
2 SC0096 21.48 10.37 -17.40 9.43 -11.48<br />
2 SC0095 5.18 7.71 -11.31 6.68 -7.03<br />
3 SC0103 2.04 2.83 -4.63 2.48 -1.37<br />
3 SC0097 2.47 3.94 -4.20 4.03 -2.31<br />
3 SC0105 3.90 3.00 -7.63 3.26 -5.06<br />
3 SC0104 4.24 4.28 -6.43 4.54 -7.71<br />
4 SC0108 1.78 0.94 -1.71 2.06 -3.00<br />
4 SC0106 1.45 1.97 -4.46 1.54 -1.80<br />
4 SC0107 4.16 -3.86 6.34 4.80 -6.51<br />
4 SC0086 1.36 3.17 -4.46 3.08 -2.66<br />
5 SC0069 0.76 1.28 -2.23 1.28 -2.06<br />
5 SC0068 3.54 3.08 -4.54 4.28 -7.46<br />
5 S00071 3.15 4.46 -7.54 3.94 -5.83<br />
5 S00070 3.99 4.03 -3.68 2.66 -2.74<br />
6 SC0101 0.85 0.51 -0.60 0.26 -0.17<br />
6 SC0100 0.51 0.09 -1.28 -0.09 -0.69<br />
6 SC0109 0.43 2.14 -3.68 1.03 -2.66<br />
6 SC0102 2.38 1.20 -5.74 1.80 -3.60<br />
(1) Distortion calculations based on nominal dimensions (length =1.181 in. and cup diameter = 1.167 in.).<br />
(2) Not measurable, parts of the cup missing.<br />
Fueled clad SC107 experienced a weld failure. This intergranular failure occurred between<br />
columnar grains located in the weld centerline. This failure appeared to be the result of fuel<br />
simulant fragment push through and resulted in a release of approximately 0.026 g of fuel<br />
simulant.<br />
6-152
Final Technical Report<br />
GPHS-RTGs for the Cassini Mission<br />
Lockheed Martin <strong>Document</strong> No. RR18<br />
August 1998<br />
a) impact Face b) Profile<br />
I 11<br />
tI frITTITT<br />
1 2 3 4 5 6 7 8 9<br />
C) Trailing Face d) Opposite Profile<br />
Figure 6.9-9. Fueled Clad SC0092 (Module #1) after 77 m/s Impact Test
Final Technical Report<br />
GPHS-RTGs for the Cassini Mission<br />
Lockheed Martin <strong>Document</strong> No. RR18<br />
August 1998<br />
t.] - TIT<br />
1 2 3 4 5 6 7 8 9<br />
e) Vent End<br />
0 Blind End<br />
Figure 6.9-9. Fueled Clad SC0092 (Module #1) after 77 m/s Impact Test (Cont'd)<br />
6-154
Final Technical Report<br />
GPHS-RTGs for the Cassini Mission<br />
Lockheed Martin <strong>Document</strong> No. RR18<br />
August 1998<br />
6.9.2 Edge-On Fragment Test<br />
6.9.2.1 Background<br />
Analyses performed to estimate accident environments for the Cassini mission EIS<br />
suggested that plate fragments formed from breakup of the spacecraft propulsion module<br />
subsystem (PMS) or the Centaur propellant tank/structure during a propellant explosion<br />
may constitute a potential threat to the RTGs. The fragment test was designed to provide<br />
data on the penetrability of the RTG by plate fragments at edge-on incidence.<br />
6.9.2.2 Test Description<br />
Testing was conducted at the Sandia National Laboratory (SNL) Rocket Sled Test Track<br />
(Area III) and was coordinated by Los Alamos National Laboratory (LANL). The test setup is<br />
shown in Figure 6.9-10. A stack of three simulated GPHS modules was heated in a furnace<br />
with an argon atmosphere which was positioned over a simulated section of an RTG. The<br />
simulated RTG section was held in place by four rods hanging from a platform which<br />
supported the heating furnace and which allowed the rocket sled to pass underneath during<br />
the test. A motorized mechanism transferred the heat source stack into the simulated RTG.<br />
A 140 second delay allowed the heat source stack temperature to decrease from 1225°C to<br />
approximately 1090°C at the time of impact. A continuous flow of argon gas was<br />
maintained as a protective atmosphere in the furnace and in the simulated RTG.<br />
An Al 7075-T6 simulated fragment plate was mounted in the support arms of the utility sled<br />
and the rocket sled was propelled by 15 High Velocity Aerial Rockets (HVARs). The test<br />
was designed to have the fragment hit the converter housing edge-on at a location directly<br />
in line with the long axis of the GIS in the center GPHS module (Figure 6.9-11).<br />
6-155
Final Technical Report<br />
GPHS-RTGs for the Cassini Mission<br />
Lockheed Martin <strong>Document</strong> No. RR18<br />
August 1998<br />
HEAT SOURCE<br />
LOWERING<br />
MECHANISM<br />
TEST<br />
STAND<br />
HEAT SOURCE<br />
STACK<br />
FURNACE<br />
FURNACE<br />
DOOR<br />
SIMULATED RTG<br />
SUPPORT<br />
STRUCTURE<br />
SIMULATED RTG<br />
TEST ARTICLE<br />
TEST<br />
FRAGMENT<br />
ROCKET<br />
SLED<br />
IF 1<br />
Figure 6.9-10. Edge-On Fragment Test Setup<br />
6-156
Final Technical Report<br />
GPHS-RTGs for the Cassini Mission<br />
Lockheed Martin <strong>Document</strong> No. RR18<br />
August 1998<br />
3 MODULE<br />
HEAT SOURCE<br />
STACK ASSEMBLY,<br />
SIMULATED RTG<br />
NOT SHOWN<br />
SIMULATED<br />
HEAT SOURCE<br />
MODULE ASSEMBLIES<br />
HEAT SOURCE<br />
MODULE ASSEMBLY<br />
WITH GIS/FUEL CLADS<br />
TARGET AREA<br />
(CENTER LINE OF GIS)<br />
DIRECTION<br />
OF TRAVEL<br />
" C GIS<br />
"A" GIS<br />
TEST FRAGMENT<br />
Figure 6.9-11. Heat Source/Fragment Impact Orientation<br />
6.9.2.3 Test Hardware<br />
The simulated RTG test article, shown in Figure 6.9-12, was prototypical of the RTG design<br />
at the point of impact with the aluminum fragment. It consisted of a section of the Al 2219<br />
outer shell, sized to contain three GPHS modules. It contained multifoil insulation around<br />
the inner diameter, with silicon-germanium unicouples installed in the vicinity of the impact.<br />
A graphite heat source support plate was located in the base of the RTG to ensure proper<br />
heat source alignment. A purge line was provided at the base of the simulated RTG to<br />
provide an inert cover gas (argon) after heat source loading to minimize oxidation.<br />
6-157
Final Technical Report<br />
GPHS-RTGs for the Cassini Mission<br />
Lockheed Martin <strong>Document</strong> No. RR18<br />
August 1998<br />
CERAFELT<br />
NSULATION<br />
CONVERTER<br />
HOUSING<br />
HEAT SOURCE<br />
SUPPORT PLATE<br />
Figure 6.9-12. Simulated RTG Test Article (RTG-3) — Edge-On Fragment Impact Test<br />
6-158
Final Technical Report<br />
GPHS-RTGs for the Cassini Mission<br />
Lockheed Martin <strong>Document</strong> No. RR18<br />
August 1998<br />
The design of the heat source stack is shown in Figure 6.9-13. The heat source test<br />
hardware was fabricated by Los Alamos National Laboratory (LANL). The heat source<br />
stack consisted of a GPHS module with flight quality graphite components and four flight<br />
quality iridium clads containing urania fuel simulant. A simulated module (POCOTM graphite<br />
aeroshell with molybdenum mass simulants) was located above and below the GPHS<br />
module to provide the correct mass simulation. The three modules were stacked using<br />
FWPF lock members and the modules held in place with POCOTM tie rods, as shown in<br />
Figure 6.9-13. A POCOTM end plate, located at the base of the stack, was used to locate the<br />
heat source in the RTG.<br />
LIFTING LUG<br />
8.66 IN<br />
INSULATION<br />
TIE ROD<br />
MOLY MASS<br />
SIMULANT<br />
LOCK MEMBER<br />
H.S. SUPPORT PLATE<br />
4.98 IN DIA<br />
SIMULATED MODULE<br />
GPHS MODULE<br />
SIMULATED MODULE<br />
Figure 6.9-13. Heat Source Configuration for Edge-On Fragment Impact Test<br />
6.9.2.4 Test Results<br />
The edge-on fragment test was conducted in March 1996. The measured impact velocity<br />
was 306 ± 1.5 m/s as measured from the image motion camera. The heat source impact<br />
temperature was estimated to be 1090°C ± 10°C based on previous engineering cool-down<br />
tests.<br />
6-159
Final Technical Report<br />
GPHS-RTGs for the Cassini Mission<br />
Lockheed Martin <strong>Document</strong> No. RR18<br />
August 1998<br />
High-speed photography of the impact indicated that the fragment leading edge impacted<br />
the converter approximately 0.63 cm above its midpoint. The fragment penetrated the<br />
converter shell to the depth of the aeroshells. The converter was cut and torn over<br />
approximately 80% of its circumference (Figure 6.9-14). The width of the gap was<br />
approximately 2 cm. The cut was clean at its upper edge but the lower edge was folded<br />
over, toward the inside of the shell. Radiological surveys of the converter outer surface and<br />
the impact vicinity, conducted immediately following the impact, indicated that no urania<br />
was released outside of the converter.<br />
Figure 6.9-14. Simulated RTG after Fragment Impact Test
Final Technical Report<br />
GPHS-RTGs for the Cassini Mission<br />
Lockheed Martin <strong>Document</strong> No. RR18<br />
August 1998<br />
The post test dimensional inspection data for the four fueled clads are shown in Table 6.9-3.<br />
Table 6.9-3. Fueled Clad Distortion after Edge -On Fragment Test<br />
Distortion %<br />
Fueled Clad<br />
Vent Cup, Diametral<br />
Shield Cup, Diametral<br />
ID Axial Max. Min. Max. Min.<br />
SC0125 0.5539 0.5044 -1.1432 0.7734 -1.1769<br />
SC0126 3.8102 0.7066 -1.2113 1.3786 -1.1769<br />
SC0127 0.5682 -0.5027 -0.9383 -0.1345 -0.2017<br />
SC0128 0.7019 -0.2690 -1.0424 -0.3693 -0.8392<br />
Fueled clad SC0126, which was located at the open end of the A GIS, had a small<br />
transverse breach (1.84 mm long, 0.40 mm wide) that was apparently caused by impact with<br />
the plate fragment (Figure 6.9-15). This breach was located approximately between 200 to<br />
220 degrees on the shield cup radius. The estimated amount of simulant fuel released was<br />
0.0890 g, based on the weight of the fuel retained in the fueled clad.<br />
SC0126<br />
SC0126 (90<br />
.<br />
)<br />
a) Trailing Face b) Opposite Profile<br />
Figure 6.9-15. Fueled Clad SC0126 (A GIS) after Fragment Impact Test<br />
6-161
Final Technical Report<br />
GPHS-RTGs for the Cassini Mission<br />
Lockheed Martin <strong>Document</strong> No. RR18<br />
August 1998<br />
SC0126 (180°) SC0126 270 ° )<br />
c) Impact Face d) Profile<br />
e) Blind End f) Vent End<br />
Figure 6.9-15. Fueled Clad SC0126 (A GIS) after Fragment Impact Test (Cont'd)<br />
6-162
6.10 RTG TRANSPORTATION SYSTEM ANALYSIS<br />
Final Technical Report<br />
GPHS-RTGs for the Cassini Mission<br />
Lockheed Martin <strong>Document</strong> No. RR18<br />
August 1998<br />
To support the development of the RTG Transportation Systems (designated<br />
USA/9904/B(U) F-85), an assessment was made of damage that might be sustained in a 30<br />
foot drop of an RTG while in the transportation system's containment vessels and impact<br />
limiter. The assessment was made in preparation for the safety analysis required for system<br />
certification. The study had as its objective determination of the smallest heat producing<br />
component resulting from the possible break-up of the RTG. The possible size range of<br />
heat producing components begins with the RTG itself (if no break-up occurs), the next<br />
smaller size would be the aeroshell module (containing four fueled clads), followed by the<br />
GIS (containing two fueled clads), and individual fuel clad and ultimately the fuel itself. The<br />
assessment concluded in some instances the RTG case could be ruptured, thus potentially<br />
releasing heat source modules. However, no further break-down would occur and the fuel<br />
itself would not be released to the interior of the inner containment vessel.<br />
6.10.1 Assessment Study<br />
The assembled containment vessels, impact limiter, and RTG (termed the package and<br />
payload) are shown in Figure 6.10-1. The package is composed of two steel containment<br />
vessels, each with its own base plate. Both vessels are sealed and within them the RTG is<br />
supported by the rack assembly as shown in Figure 6.10-1. RTG attachment is made using<br />
four bolts engaging the four barrel nuts in the generator case at the inboard flange. The<br />
rack assembly in turn is attached to the nested base plate subassembly.<br />
The packaging design contractor, PacTec, determined (based on a series of half-scale drop<br />
tests) that the RTG experiences a maximum acceleration of 300 g's when the package is<br />
dropped 30 feet. Using this acceleration load, a tabulation of RTG weights, and allowable<br />
material limits, Lockheed Martin analyzed the resulting structural margins. There were<br />
some impact orientations identified in which the heat source assembly would not be<br />
released and would not fail. Conversely, there could still be others where both might occur.<br />
Figure 6.10-2 illustrates what is considered to be the worst case accident response since it<br />
represents the circumstance causing the most damage to the generator. The event<br />
sequence proceeds in views (a) through (d) and ends with heat source modules
Final Technical Report<br />
GPHS-RTGs for the Cassini Mission<br />
Lockheed Martin <strong>Document</strong> No. RR18<br />
August 1996<br />
I<br />
el Mil<br />
li<br />
II iii<br />
III ii<br />
II 1ii<br />
1 I ■ii ill<br />
1<br />
II II l<br />
111<br />
MI IM<br />
MI Ill<br />
1<br />
i/... .il<br />
III _ 11■<br />
INIMIMINI /<br />
I' IMINIKR•<br />
j17iI ,M..<br />
_::: 11 ' i 1 A<br />
All 116.<br />
riri .„.... 111 MI mei<br />
■ !,-. ii NIL N'h S2I I p VA ,<br />
Altarldramirramdraorrwairmarragokicfardi<br />
NO<br />
Mg<br />
GPHS RIG PAYLOAD<br />
CONTAINMENT ASSEMBLY<br />
(INNER & OUTER VESSELS<br />
PLUS BASE PLATES)<br />
GPHS RIG SUPPORT<br />
RACK ASSEMBLY<br />
- IMPACT LIMITER<br />
Figure 6.10-1. Shipping Container Baseline Configuration<br />
contained within the containment vessel but released from the generator case. The post<br />
accident position, view (d) shows the package again in an upright position and represents<br />
the worst case for the container seals located at the base of the vessels. To protect the<br />
seals from overtemperature conditions if heat source components were to be released from<br />
the generator case, a baffle is used to physically separate the seals from the source of heat.<br />
Another situation where the modules could be released from the generator case is for an<br />
inverted package impact orientation with the generator longitudinal axis nearly vertical,<br />
closely aligned with the fall line. In this orientation, heat source modules could be released<br />
from the generator case through the end dome. As indicated above, in this instance the<br />
baffle would also keep the modules from the container seals if the container came to rest in<br />
an upright position. In both the vertical orientation and the orientation shown in Figure<br />
6.10-2 (a), all the heat source modules would remain inside the double containment vessels<br />
even though they may be released from the generator case. The impact damage to the<br />
6-164
Final Technical Report<br />
GPHS-RTGs for the Cassini Mission<br />
Lockheed Martin <strong>Document</strong> No. RR18<br />
August 1998<br />
Heat Source Support<br />
and Pressure Dome Fail<br />
Exposing GPHS Modules<br />
Entire Package Rebounds<br />
and Tumbles<br />
RTG Components Impact<br />
Shipping Container<br />
Shipping Container<br />
Comes to Rest Upright<br />
Baffle Keeps<br />
GPHS Modules<br />
Away From Shipping<br />
Container Seals<br />
Figure 6.10-2. Worst Case Accident Scenario
Final Technical Report<br />
GPHS-RTGs for the Cassini Mission<br />
Lockheed Martin <strong>Document</strong> No. RR18<br />
August 1998<br />
modules upon contact with the inside of the containment vessels was analyzed by Fairchild<br />
(now OSC) and found to be very small. The Fairchild study concludes that the modules will<br />
remain intact in a 30-foot drop and therefore neither the GISs nor fueled clads will be<br />
released from the modules.<br />
6.10.2 Conclusion<br />
No fuel would be released under the 300 g load attributed to a 30-foot drop. Since little<br />
module damage would be experienced, the fueled clads would remain within the modules<br />
and the smallest heat producing entity will be the modules, not the GISs nor the fueled<br />
clads. The complete assessment is documented in Reference 6.10-1.<br />
Section 6 References<br />
6.1-1 "Cassini Titan IV/Centaur RTG Safety Databook, Rev. B," Section 2.0, Martin<br />
Marietta Technologies, Inc., a Lockheed Martin Company, Report NAS3-00031,<br />
March 1997.<br />
6.1-2 "Final Environmental Impact Statement for the Cassini Mission," NASA, June<br />
1995.<br />
6.1-3 "Cassini Titan IV/Centaur RTG Safety Databook, Rev. B," Sections 3.0 and 4.0,<br />
Martin Marietta Technologies, Inc., a Lockheed Martin Company, Report NAS3-<br />
00031, March 1997.<br />
6.1-4 "Cassini Titan IV/Centaur RTG Safety Databook, Rev. B," Section 5.0, Martin<br />
Marietta Technologies, Inc., a Lockheed Martin Company, Report NAS3-00031,<br />
March 1997.<br />
6.2-1 JPL Interoffice Memorandum 312/04.6-759, A. McRonald to L. Reinhart, "RTG<br />
Module Release Conditions for Inadvertent Earth Reentry of the Cassini<br />
Spacecraft during the VVEJGA Earth Flyby," revised 27 May 1994; and JPL<br />
Interoffice Memorandum 312/4.6-748, A McRonald, et al., to L. Reinhart<br />
"Powered Reentry of the Centaur Vehicle Attached to the Cassini Spacecraft,<br />
Determination of Release Conditions for RTG Modules," 6 April 1994.<br />
6.4-1 "Titan IV CRAF/Cassini EIS Databook," MCR-91-2580, Rev: Basic, Martin<br />
Marietta Space Launch Systems, Denver, CO, December 1991.<br />
6.4-2 "Cassini Earth Swingby Plan Supplement," JPL 699-70-3-Sup, Jet Propulsion<br />
Laboratory, 19 May 1997.<br />
6.4-3 "World Demographic Update through 1990 for Space Nuclear System Safety<br />
Analyses," Rev. 1.0, Halliburton NUS.<br />
6.5.1-1 NASA/NASDA Joint Hydrogen/Oxygen Vertical Impact (HOVI) Test Program,<br />
NASA-WSTF, <strong>Document</strong> No. TR-800-001, 29 November 1996.
Final Technical Report<br />
GPHS-RTGs for the Cassini Mission<br />
Lockheed Martin <strong>Document</strong> No. RR18<br />
August 1998<br />
6.5.1-2 Mukunda M., "Hydrocode Analyses for the Response of the RTG to Accident<br />
Environments," FSC-ESD-217-96-550, Orbital Sciences Corporation, October<br />
1996.<br />
6.5.1-3 Pavone, D., LACP-86-92, Los Alamos National Laboratory, 1986.<br />
6.5.1-4 Mukunda, M., "Response of RTG/GPHS to Solid Propellant Fallback<br />
Environments," Orbital Sciences Corporation, Letter to L. DeFillipo, 21 April<br />
1997.<br />
6.5.2-1 NUS Corporation, Overall Safety Manual, Volume 2, prepared for USAEC under<br />
Contract SNSO-7, June 1975.<br />
6.5.2-2 Arya, S.P.S. "Parameterizing the Height of the Stable Atmospheric Boundary<br />
Layer," Journal of Applied Meteorology, 20, pp. 1192-1202, 1981.<br />
6.5.2-3 Benkley, C. W. and Schulman, L. L.. "Estimating Hourly Mixing Depths from<br />
Historical Meteorological Data," Journal of Applied Meteorology, 18, pp. 772-<br />
280, 1979.<br />
6.5.3-1 JPL Interoffice Memorandum 312/04.6-759, A. McRonald to L. Reinhart, "RTG<br />
Module Release Conditions for Inadvertent Earth Reentry of the Cassini<br />
Spacecraft during the WEJGA Earth Flyby," revised 27 May 1994 and, JPL<br />
Interoffice Memorandum 312/4.6-748, A. McRonald, et al. to L. Reinhart,<br />
"Powered Reentry of the Centaur Vehicle Attached to the Cassini Spacecraft,<br />
Determination of Release Conditions for RTG Modules," 6 April 1994.<br />
6.5.3-2 Lucero, E. F., JHU/APL Memo AM-96-D019, "Summary Results of Predicted<br />
GPHS Reentry Motion Resulting from a CassiniNVEJGA Inadvertent Reentry," 20<br />
August 1996.<br />
6.5.3-3 Cassini GPHS-RTG Final Safety Analysis Report, Accident Model Appendices,<br />
Volume II, Book 2, Lockheed Martin Missiles & Space, (CDRL C.3), November<br />
1996.<br />
6.5.3-4 Blottner, F. G., "Chemically Reacting Boundary Layer with Ablation Products and<br />
Nose Bluntness Effects," General Electric Space Sciences Laboratory, TIS<br />
R67SD14, April 1967.<br />
6.5.3-5 Nicolet, W. E. and Balakrishnan, A., "RASLE User's Manual," Accurex<br />
Corporation/Aerospace Systems Division, UM-79-10/AS, Mountain <strong>View</strong>, CA,<br />
July 1979.<br />
6.5.3-6 Gnoffo, P. A., Gupta, R. N., and Shin, J. L., "Conservation Equations and Physical<br />
Models for Hypersonic Air Flow in Thermal and Chemical Nonequilibrium,"<br />
NASA Technical Paper 2867, February 1989.<br />
6.5.3-7 Hartung, L. C., "Predicting Radiative Heat Transfer in Thermochemical<br />
Nonequilibrium Flow Fields, Theory and User's Manual for the LORAN Code,"<br />
NASA Technical Memorandum 4564, September 1994.<br />
6-167
6.5.3-8<br />
Final Technical Report<br />
GPHS-RTGs for the Cassini Mission<br />
Lockheed Martin <strong>Document</strong> No. RR18<br />
August 1998<br />
Bhutta, B. A., Daywitt, J. E., Rahaim, J. J., and Brant, D. N., "A New Technique for<br />
the Computation of Severe Reentry Environments," AIM Paper 96-1861, June<br />
1996.<br />
6.5.3-9 Klee, P., "Background and Use of SINRAP Code, Rev. C," Lockheed Martin PIR<br />
U-Cassini-018, 29 May 1996.<br />
6.5.3-10 "ABAQUS / Standard User's Manual, Version 5.4," Hibbitt, Karlsson & Sorensen,<br />
Inc., 1994.<br />
6.5.3-11 Lutz, S. A. and Chan, C. C., "Ablation Response Testing of Aerospace Power<br />
Supplies," AIAA Paper 93-0381, January 1993.<br />
6.5.3-12 Gordon, P., "Analysis of One-Dimensional Heat Conduction Computer Program,"<br />
General Electric Company, SSL-MSD, TIS No. RR663D10, March 1966.<br />
6.5.3-13 Gilbert, L., et al., "Theoretical Studies of the Reentry of Plutonium Fuel," 1967.<br />
6.5.3-14 Eck, M. B., "Draft Final Report on Earth Flyby Reentry," Foils Engineering NASA-<br />
JPL Contract 959658, October 1993.<br />
6.5.3-15 Bhutta, B. A., Daywitt, J.E., and Brant, D. N., "Interpretation of Enthalpies in the<br />
Energy Balance of an Ablating Graphite Surface," AeroTechnologies, Inc., Report<br />
AT-TN-96-02, May 30, 1996.<br />
6.5.3-16 Bhutta, B. A., Daywitt, J.E., and Brant, D. N., "Comments on 'Comparison of<br />
Alternative Mass and Energy Balance Methods at an Ablating Carbon Surface',"<br />
AeroTechnologies, Inc., Report AT-TN-96-05, July 31, 1996.<br />
6.5.3-17 Bhutta, B. A., Daywitt, J.E., and Brant, D. N., "Energy Balance at an Ablating<br />
Carbon Surface with Discontinuously Changing Species Mass Fraction,"<br />
AeroTechnologies, Inc., Report AT-TN-96-06, Sept. 6, 1996.<br />
6.5.3-18 Bhutta, B. A., Daywitt, J. E., and Brant, D. N., "Energy Balance at an Ablating<br />
Carbon Surface with Discontinuously Changing Species Mass Fraction:<br />
Supplement I," AeroTechnologies, Inc., Report AT-TN-96-07, Sept. 17,1996.<br />
6.5.3-19 Bhutta, B. A., Daywitt, J. E., and Brant, D. N., untitled AeroTecnologies, Inc.<br />
Memo, Sept. 24,1996.<br />
6.5.3-20 Bhutta, B. A., Daywitt, J. E., and Brant, D. N., "Supplement to Technical Note AT-<br />
TN-96-05," AeroTechnologies, Inc., Report AT-TN-96-05S, Dec. 13, 1996.<br />
6.5.3-21 Bhutta, B. A., "Energy Equation Applied to the Infinitesimal Homogeneous<br />
Reaction Zone at the Ablating Wall," AeroTechnologies, Inc., Report AT-TN-97-<br />
02, Jan. 21, 1997.<br />
6.5.3-22 Hobbs, R. B., "MHW-HSA Aerodynamics Performance Test Report", AEOM 9151-<br />
001, General Electric Co., August 1973.<br />
6.6-1 U.S. Standard Atmosphere, 1976, NASA, NASA-TM-X-74336.<br />
6.6-2 HNUS, Overall Safety Manual, Volume 2, Prepared for USAEC under Contract<br />
SNSO-7, June 1975.<br />
6-168
Final Technical Report<br />
GPHS-RTGs for the Cassini Mission<br />
Lockheed Martin <strong>Document</strong> No. RR18<br />
August 1998<br />
6.6-3 Limits for Intakes of Radionuclides by Workers, International Commission on<br />
Radiological Protection, Publication 30. Pergamon Press, 1979.<br />
6.6-4 1990 Recommendations of the International Commission on Radiological<br />
Protection, International Commission on Radiological Protection, Publication 60.<br />
Pergamon Press, 1991.<br />
6.6-5 Human Respiratory Tract Model for Radiological Protection, International<br />
Commission on Radiological Protection, Publication 66. Pergamon Press, 1994.<br />
6.6-6 Health Risks of Radon and Other Internally Deposited Alpha - Emitters. National<br />
Academy of Sciences - Committee on the Biological Effects of Ionizing<br />
Radiations. National Academy Press, Washington, DC, 1988.<br />
6.6-7 Health Effects of Exposures to Low Levels of Ionizing Radiation. National<br />
Academy of Sciences - Committee on the Biological Effects of Ionizing<br />
Radiations. National Academy Press, Washington, DC, 1990.<br />
6.7-1 Deane, N., "800 km EGA Flyby Analysis Using Final Updated GIS Failure and<br />
Clad Melt Probabilities," Cassini Memo No. 547A, 23 October 1997.<br />
6.9-1 Cassini GPHS-RTG Final Safety Analysis Report, Volume II, Book 2, Appendix H,<br />
Lockheed Martin Missiles & Space, CDRL C.3, November 1996.<br />
6.10-1 Kauffman, R. R., "Effect of Shipping Container Thirty Foot Drop Event on RTG<br />
Structural Integrity," Cassini Program PIR U-1RS1-C/C-0019, 21 April 1992.<br />
6-169
Section 7<br />
ETG Manufacture and Test
Final Technical Report<br />
GPHS-RTGs for the Cassini Mission<br />
Lockheed Martin <strong>Document</strong> No. RR18<br />
August 1998<br />
SECTION 7<br />
ETG MANUFACTURE, TEST, AND QUALITY ASSURANCE<br />
7.1 Reestablishment of Unicouple Fabrication and Process Improvements<br />
This is a summary of the re-establishment of unicouple fabrication processes and key<br />
process improvements for Cassini unicouple and parts fabrication. For more detailed<br />
information on the issues refer to the Cassini Semi-Annual Technical Reports (Reference<br />
7-1).<br />
The steps taken to reestablish fabrication of unicouples at a level comparable to that on the<br />
Galileo/Ulysses program were as follows:<br />
• Identified required materials and equipment<br />
• Procured new materials and equipment where necessary<br />
• Qualified new materials<br />
• Installed and debugged new equipment<br />
• Overhauled and checked out old equipment as required<br />
• Upgraded Quality Control system<br />
• Developed and carried out qualification plans with DOE concurrence<br />
• Trained and certified manufacturing and inspection personnel as required<br />
• Demonstrated process readiness with fabrication of Training lot hardware<br />
• Demonstrated production readiness with fabrication of Qualification lot hardware<br />
Problems encountered and their respective solutions during this phase of the program are<br />
listed in Appendix A.<br />
Operator and inspector training/certification, process readiness and production readiness<br />
for unicouple production were completed by May 1993.<br />
The final step in technology verification was demonstrated by 18 couple module<br />
performance testing, which is discussed in Section 11 of this report.<br />
7-1
Final Technical Report<br />
GPHS-RTGs for the Cassini Mission<br />
Lockheed Martin <strong>Document</strong> No. RR18<br />
August 1998<br />
7.1.1 Equipment Upgrades<br />
Significant upgrades and new equipment used in the fabrication of unicouples are listed<br />
below.<br />
• Refurbished Hot Presses #2 and #3.<br />
• Installed new temperature controllers in six heritage Brew bonding furnaces.<br />
• Installed and qualified six new automated Brew bonding furnaces. These were initially<br />
used for second bond assemblies and later used for first bond assemblies as well. Later<br />
the heritage Brew furnaces were phased-out.<br />
• Installed two new CVD silicon nitride coating furnaces and qualified both during the<br />
program.<br />
• Installed a new wafering machine and slicing machine and rebuilt three grinding<br />
machines in the Parts Preparation area.<br />
• Added new microscopes in the manufacturing, inspection, and metallography lab areas.<br />
• Installed a new gritblaster.<br />
New equipment was procured for processing Converter hardware and/or EHS hardware<br />
including an air furnace (L&M) and vacuum furnace for bake-out operations.
Final Technical Report<br />
GPHS-RTGs for the Cassini Mission<br />
Lockheed Martin <strong>Document</strong> No. RR18<br />
August 1998<br />
7.2 Unicouple Production<br />
Cassini unicouple production was segregated into five builds: Qualification Lot, E-6, E-7, E-<br />
8, and Contingency. The Qualification build began in September 1991 after extensive<br />
operator training and certification, and was completed in June 1993. The E-6 build began<br />
in November 1991. The Contingency build was completed in April 1995.<br />
The overall quantities and yields for the major unicouple assemblies and processes are<br />
shown Table 7-1. The numbers represent the combined totals for Qualification, E-6, E-7,<br />
E-8, and Contingency hardware.<br />
Table 7-1. Cassini Unicouple Production Yields<br />
Assembly/Process Total Starts Total Accepted Yield<br />
Vacuum Casting 292 286 97.9 %<br />
Powder Blending 137 131 95.6 %<br />
Hot Pressing 645 620 96.1 %<br />
N/P Bonding 158 140 88.6 %<br />
Pellet 15826 11878 75.1 %<br />
Segment 16826 14269 84.8 %<br />
Hot Shoe 6480 5438 83.9 %<br />
First Bond 4832 4514 93.4 %<br />
Coated First Bond 4208 3904 92.8 %<br />
Second Bond 3649 3220 88.2 %<br />
Nickel Plating 32419 31972 98.6 cY0<br />
Couple Preassembly 3132 2729 87.1 %<br />
Radiator 3957 3568 90.2 %<br />
Machined Radiator 3490 3133 89.8 %<br />
Cold Stack 3083 2745 89.0 %<br />
Coated Spacer 3680 3247 88.2 %<br />
Unicouple 2669 2346 87.9 %<br />
Wrapped Unicouple 2334 2289 98.1 %<br />
7-3
Final Technical Report<br />
GPHS-RTGs for the Cassini Mission<br />
Lockheed Martin <strong>Document</strong> No. RR18<br />
August 1998<br />
Following is a summary of the major manufacturing issues and events that occurred during<br />
unicouple production:<br />
• Demonstration of acceptable SiMo N/P bond strength proved difficult. Low strength<br />
values were recorded during Qualification hot shoe and first bond testing. Acceptable<br />
strengths were attained with added attention to compact flatness and parallelism, by<br />
increasing hot pressing temperatures, and by boiling the polished compacts in water<br />
prior to bonding.<br />
• During thermoelectric machining operator certification, staining of parts became a<br />
problem. The cause was discovered to be fixtures with sharp edges and coolant drying<br />
on parts. The sharp edges were removed from the fixtures and the procedures were<br />
modified to prevent coolant from drying on the parts.<br />
• During process readiness and the qualification build for nickel plating it became<br />
necessary to use accepted residual plated hardware for subsequent processes due to<br />
delays in obtaining newly purchased unplated parts. This allowed completion of<br />
process readiness for unicouple production prior to process readiness completion for<br />
nickel plating.<br />
• During second bond process readiness, it became necessary to more closely match the<br />
N and P segment densities due to unacceptable bonds using density mismatches of<br />
approximately 0.030 g/cm 3 . This closer density matching proved to be successful.<br />
• Successful replacement of the coolant used for thermoelectric machining was<br />
completed. The White and Bagley 1500 coolant was no longer manufactured, and was<br />
replaced by TrimClear.<br />
• Various improvements were made during the program that yielded greater efficiencies,<br />
such as elimination of daily first bond burn-in runs, introduction of hydrogen peroxide<br />
cleaning of thermoelectric parts, and fabrication of additional thermoelectric parts from<br />
parts of compacts that previously would have been scrapped.<br />
• Oxidation on cold stack assemblies was discovered in April 1993. The graphite fixtures<br />
used during the brazing process were baked out. After this process change was<br />
initiated, no oxidation was observed.<br />
• Although the program had many difficult issues to resolve, many individual process<br />
yields for operator certification, the qualification build, and the production builds were<br />
significantly higher than had been anticipated.
Final Technical Report<br />
GPHS-RTGs for the Cassini Mission<br />
Lockheed Martin <strong>Document</strong> No. RR18<br />
August 1998<br />
7.3 Converter Production<br />
Converter production consisted of two major tasks which were performed in parallel. The<br />
converter housing and heat source support assemblies were fabricated in parallel with the<br />
molybdenum foil insulation assembly. As the foil insulation lay-up was completed, the<br />
unicouple insertion and riveting was initiated. Machining of the converter housing and heat<br />
source support members was completed in time for thermopile insertion into the converter<br />
housing.<br />
After completion of the thermopile insertion into the converter housing, the outboard heat<br />
source support frame was assembled and the EHS was prepared for insertion into the ETG.<br />
After EHS insertion, the inboard heat source assemblies were installed, and the EHS preloaded.<br />
The gas processing dome was installed, the ETG pressurized, and pressure decay<br />
tests were performed. The ETG was then readied for shipment for ETG processing.<br />
During assembly of the E-6 thermopile, it was determined that the riveted unicouple<br />
electrical connector strap joints were demonstrating higher than normal resistance<br />
readings. After extensive evaluation and testing (including a new rivet design), it was<br />
determined that the cause of the resistance anomaly was an oxide film. After vacuum<br />
processing of representative samples, the resistance across the riveted jointed returned to<br />
normal. After completing all testing and evaluations, the E-6 thermopile assembly<br />
continued without further delay.<br />
After completing the E-7 assembly, the processing was begun. Initial testing determined<br />
that the power output of the ETG was below normal. Further investigation revealed that half<br />
the unicouples were installed backwards. The orientation and selection of each unicouple<br />
is controlled by the unicouple map generated for each ETG. This map was later found to be<br />
in error due to a software problem.
Final Technical Report<br />
GPHS-RTGs for the Cassini Mission<br />
Lockheed Martin <strong>Document</strong> No. RR18<br />
August 1998<br />
A new map was generated for E-7 and disassembly of E-7 was begun. Two hundred and<br />
eighty-six unicouples were removed from the thermopile and replaced with new, properly<br />
oriented unicouples. The total rework time amounted to a delay of five months to the<br />
delivery schedule for E-7, but did not impact the Mound fueling schedule.<br />
In accordance with DOE contract direction, the E-8 converter was not assembled but<br />
component subassemblies were completed and placed in kits. A spare E-8 converter<br />
housing was completed and is in bonded stock. An E-8 foil insulation assembly was<br />
fabricated, assembled, and is stored on a rigid fixture protected by an inert cover gas to<br />
prevent degradation of the moly foils. In addition, a spare GMS, PRD, EHS, domes (inboard<br />
and outboard), and heat source support frames and latches for inboard and outboard ends<br />
were completed and are in stock.<br />
7-6
Final Technical Report<br />
GPHS-RTGs for the Cassini Mission<br />
Lockheed Martin <strong>Document</strong> No. RR18<br />
August 1998<br />
7.4 ETG PROCESSING<br />
Under the contract, two ETGs were processed. Both ETGs were prepared and processed<br />
per SI 249714. The processing prepared the units for operation as an ETG and for eventual<br />
conversion to an RTG and subsequent acceptance testing.<br />
7.4.1 Test Sequence<br />
Each ETG was assembled per Manufacturing planning and Quality Assurance surveillance<br />
in the Clean Room, Building B, installed into a Converter Shipping Container (CSC) and<br />
transported to Building 800. The ETG was removed from the CSC, installed into Loading<br />
and Assembly Station 2 (LAS-2) and a vacuum/thermal process cycle conducted. The<br />
outboard dome with a C-seal and the mid span caps fitted with 0-rings were then installed<br />
and pressure decay tests conducted. The ETG was then removed from the LAS, weighed,<br />
ACS tests and resistance tests performed, installed into a CSC, and shipped to the Mound<br />
Facility (Miamisburg, Ohio), where RTG fueling and acceptance testing were performed.<br />
The test sequence is shown in Figure 7-1.<br />
Assemble<br />
ETG<br />
Install ETG in<br />
LAS-2<br />
Vacuum/Thermal<br />
Process ETG with<br />
Scheduled EHS<br />
Heat Up<br />
24 Hours<br />
at<br />
4415 W<br />
76 Hours at 4402W Cool Down,<br />
and<br />
Install Dome<br />
4 Hours at 4258W -1111P and Midspan<br />
Caps<br />
Pressurize to<br />
25 psia<br />
with<br />
Ar and Leak Test<br />
-0111■<br />
Remove<br />
from<br />
LAS-2<br />
ACS Proof<br />
and<br />
Leakage Test<br />
Weight<br />
Determination<br />
Install<br />
into<br />
Shipping<br />
Container<br />
Ship<br />
to<br />
Mound Facility<br />
Figure 7-1. Cassini RTG Program ETG System Test Flow<br />
7-7
Final Technical Report<br />
GPHS-RTGs for the Cassini Mission<br />
Lockheed Martin <strong>Document</strong> No. RR18<br />
August 1998<br />
7.4.2 E-6 ETG Processing and Acceptance Testing<br />
The E-6 unit was removed from the converter shipping container (CSC), checked for proper<br />
electrical parameters and internal pressure, and placed in the Loading and Assembly<br />
Station (LAS) during the period 5-9 January, 1995. During the installation into the LAS all<br />
the cabling and gas lines were mated and verified. The Segment Readiness Review was<br />
held and approval to commence processing was granted.<br />
The E-6 pump down was initiated on 19 January. The 24-hour soak period (ETG pressure<br />
Final Technical Report<br />
GPHS-RTGs for the Cassini Mission<br />
Lockheed Martin <strong>Document</strong> No. RR18<br />
August 1998<br />
torr, normal power increases were made until February 4th when the ETG output was 35<br />
volts. After adjusting the load voltage to 30 volts and achieving an ETG pressure of<br />
Final Technical Report<br />
GPHS-RTGs for the Cassini Mission<br />
Lockheed Martin <strong>Document</strong> No. RR18<br />
August 1998<br />
2. The ETG was then cooled to room temperature and the LAS was backfilled with<br />
argon gas. This permitted disconnecting the internal LAS cable and shorting<br />
module from the ETG power circuit. This confirmed that the problem was most<br />
likely within the ETG.<br />
3. After reviewing the thermopile assembly procedures and specifically, the<br />
unicouple insertion map, it was seen that 144 unicouples were inserted with<br />
incorrect polarity. An error in the plotting software which generated the map was<br />
the cause of the problem.<br />
Three options for correcting the problem were considered and evaluated. The options<br />
were:<br />
1. Rework the E-7 thermopile by repositioning the reversed polarity unicouples.<br />
2. Rework the E-7 thermopile by replacing the reversed polarity unicouples with E-8<br />
unicouples.<br />
3. Remove the E-7 thermopile and replace it with the E-8 thermopile, which was yet<br />
to be completed.<br />
These three options and their trade-offs were reviewed with DOE on 7 August in order to<br />
finalize the recovery plan. DOE provided direction to proceed with Option 2 and a Rework<br />
Plan (Reference CON #1300) and Corrective Action Plan (Reference CON #1306) were<br />
issued.<br />
On 7 August, the ETG was prepared for removal from the LAS by installing the outboard<br />
dome and midspan caps. The ETG was pressurized with argon gas and a pressure decay<br />
test was performed to verify sealing integrity. The ETG was removed from the LAS,<br />
electrical measurements were made, and the ETG was installed into the Converter<br />
Shipping Container (CSC). The ETG/CSC was moved to Building B on 10 August in<br />
preparation for disassembly and rework.<br />
Following the unicouple rework, the ETG was placed in the CSC and delivered to Building<br />
800.<br />
The E-7 unit was removed from the CSC, checked for proper electrical parameters and<br />
internal pressure, and placed in the LAS between 9 and 11 January 1996. During the<br />
installation into the LAS all the cabling and gas lines were mated and verified. The<br />
7-10
Final Technical Report<br />
GPHS-RTGs for the Cassini Mission<br />
Lockheed Martin <strong>Document</strong> No. RR18<br />
August 1998<br />
Segment Readiness Review was then held and approval to commence processing was<br />
granted.<br />
The E-7 pump down was initiated on 11 January. The 24-hour soak period (ETG pressure<br />
Final Technical Report<br />
GPHS-RTGs for the Cassini Mission<br />
Lockheed Martin <strong>Document</strong> No. RR18<br />
August 1998<br />
This test was terminated after 30 hours due to the further degradation of the circuit to ground<br />
resistance. The performance test data are discussed, in detail, in Section 5.1.<br />
At JPL's request, a special capacitance test was performed on E-7. This test was performed<br />
on 19 and 20 February per SI 252256. Capacitance measurements were made with power<br />
inputs of 4100, 3800, 3500, and 3200 watts. The testing was done in the short circuit mode<br />
at all power levels and also in the open circuit mode at 3500 watts.<br />
For more detailed information see the E-7 ETG Processing Report (Reference 7-3).
Final Technical Report<br />
GPHS-RTGs for the Cassini Mission<br />
Lockheed Martin <strong>Document</strong> No. RR18<br />
August 1998<br />
7.5 QUALITY ASSURANCE PROGRAM<br />
A Quality Assurance Program (QAP) was designed for the Cassini program and<br />
implemented to guide all program activities to provide deliverables which were<br />
demonstrated to meet all contractual requirements. The program was guided by the Quality<br />
Assurance Program Plan (QAPP) (Reference 7-4). The plan showed how the contractual<br />
requirements defined in DOE Order 5700.6C would be met with appropriate Lockheed<br />
Martin procedures. In some cases, procedures were tailored to meet specific DOE<br />
requirements. The QAP addressed the control and acceptance of hardware, the procedures<br />
for handling defective hardware and the procedures for acceptance and delivery of<br />
hardware.<br />
During the Cassini program, yields during unicouple production were generally at or above<br />
goals which were established for each process based on production efforts during previous<br />
programs. Yield goals ranged from 80% to 97.6% and actual yields, with few exceptions,<br />
were at those levels or above. Unicouple process performance was tracked for each<br />
process and problems were addressed when process control limits were exceeded and<br />
before specification limits were exceeded, when possible. Using this approach, the<br />
acceptance rate for each process was maximized.<br />
Because of the limited quantities of parts and subassemblies for each process in the<br />
production of converter hardware, yields were not tracked. However, for all hardware,<br />
where defects were noted, the process was technically addressed to determine cause and<br />
corrective action, if required. During the Cassini program many process concerns were<br />
addressed using this system, and many process improvements resulted.<br />
When hardware was determined to be defective, it was documented on a Defect Report<br />
(DR). At this level the hardware could be reworked to meet the drawing, if possible, and the<br />
process was also investigated to determined if there was a persistent problem. When<br />
hardware was not successfully addressed at this level, it was documented on a Non-<br />
Conformance Report (NR) and referred to a Materials Review Board (MRB). At the MRB<br />
level, final disposition of the hardware was made. The MRB consisted of representatives of<br />
QA, Engineering, Program Office, and DOE. Throughout the program, the quantity of<br />
7-13
Final Technical Report<br />
GPHS-RTGs for the Cassini Mission<br />
Lockheed Martin <strong>Document</strong> No. RR18<br />
August 1998<br />
defective hardware was low enough that, even though MRB dispositions were required,<br />
production was not seriously impacted. NRs were classified as Class I or Class II,<br />
depending on the impact of the defect at that level. An NR was classified as Class I when<br />
the defect had an impact on a requirement between Lockheed Martin and an external<br />
interface. All other NRs were classified as Class II and were resolved internally by the local<br />
MRB board.<br />
During the Cassini program only one Class I NR was issued. NR 78426 was issued<br />
because the pressure drop in the active cooling system of the E-7 shell and fin assembly<br />
exceeded specification levels. The hardware was accepted by the internal MRB board and<br />
also by the customer. A justification was provided by Lockheed Martin Engineering which<br />
included the fact that the cooling system was not required for the Cassini mission.<br />
When a major problem exists, the MRB can initiate a Failure Review Board (FRB) to<br />
investigate the problem and recommend a solution. During the Cassini program, one such<br />
problem was referred to an FRB by the MRB. NR 79240 was issued to address low isolation<br />
resistance in the Qualification RTD cable. The problem was determined to be moisture<br />
which was trapped during the manufacturing process at the vendor, Rosemount. Corrective<br />
action was determined and all RTD assemblies were screened to determine acceptability.<br />
Four RTD assemblies were sent back for rework and the remainder were accepted. A final<br />
report of the FRB was issued (Reference 7-5).<br />
References for Section 7<br />
7-1 Cassini Semi-Annual Technical Reports<br />
7-2 E-6 ETG Processing and Test Report, 19 May 1995.<br />
7-3 E-7 ETG Processing and Test Report, 19 March 1996.<br />
7-4 Quality Assurance Program Plan, GESP-7215, CDRL A.3, 31 January 1995.<br />
7-5 Final Report of RTD FRB, CDRL B.3, 14 August 1995.
Section 8<br />
GPHS Fabrication Support
SECTION 8<br />
Final Technical Report<br />
GPHS-RTGs for the Cassini Mission<br />
Lockheed Martin <strong>Document</strong> No. RR18<br />
August 1998<br />
GENERAL PURPOSE HEAT SOURCE FABRICATION SUPPORT<br />
Components for the General Purpose Heat Source (GPHS) were produced primarily by four<br />
DOE facilities as shown in Figure 8-1. The components were integrated at Mound into the<br />
GPHS assembly for installation in the converter provided by Lockheed Martin. Figure<br />
3.1.1-1 shows the components of a GPHS module. A detailed discussion of the modules<br />
and GPHS assembly is provided in Reference 8-1. For the Cassini program, the fuel<br />
powder was processed by the DOE Savannah River Plant (SRP). The iridium alloy<br />
encapsulation hardware, termed the Clad Vent Set (CVS), was fabricated at DOE's facility<br />
in Oak Ridge (OR), Tennessee as was the Carbon Bonded Carbon Fiber (CBCF) insulator<br />
SRP<br />
Fuel<br />
Powder<br />
LANL<br />
OR<br />
CVS<br />
CBCF<br />
Fuel<br />
Pressing<br />
Encapsulation<br />
Mound<br />
GPHS<br />
Assembly<br />
MRMF<br />
Conditioning<br />
Mound<br />
FWPF/POCO<br />
Hardware<br />
L To<br />
Generator<br />
Assembly<br />
Figure 8-1. General Purpose Heat Source Hardware Suppliers<br />
8-1
Final Technical Report<br />
GPHS-RTGs for the Cassini Mission<br />
Lockheed Martin <strong>Document</strong> No. RR18<br />
August 1998<br />
sleeve and caps. The CVS hardware was delivered to Los Alamos National Laboratory<br />
(LANL) for encapsulation of the fuel pellets which had been pressed by LANL. The fueled<br />
clads were shipped from LANL to Mound for assembly into the aeroshell modules. In<br />
addition, Mound procured Fine Weave Pierced Fabric (FWPF) billets and subcontracted for<br />
their machining into aeroshell module components. The aeroshell module graphitic<br />
hardware, including the CBCF from Oak Ridge and fueled clads from LANL were<br />
assembled into completed modules at Mound. After module assembly they were processed<br />
in the Module Reduction and Monitoring Facility (MRMF) at Mound to reduce the<br />
accumulation of carbon oxides during ground storage prior to flight vacuum operation.<br />
The interfacing of the organizations shown in Figure 8-1 with DOE and Lockheed Martin<br />
was governed by two Interface Working Agreements approved by DOE (References 8-2 and<br />
8-3). For the Cassini program with the GPHS design previously established (Reference<br />
8-1) and only minor modifications implemented for Cassini (Section 4.1) Lockheed Martin<br />
activity consisted primarily of production support. Lockheed Martin personnel participated<br />
in production readiness reviews at DOE facilities producing GPHS components, made onsite<br />
visits to support problem resolution, approved GPHS related engineering change<br />
notices, as well as procedural changes and dispositioned non-conforming hardware. The<br />
latter activity was facilitated by voting membership in the Mound Material Review Board<br />
which was responsible for evaluating discrepant GPHS hardware. Table 8-1 identifies the<br />
number of Problem/Failure Reports (P/FRs) documenting discrepant Cassini GPHS<br />
hardware.<br />
Table 8-1. Dispositioned GPHS P/FRs<br />
Hardware Location No. P/FRs<br />
CVS Oak Ridge 105<br />
Fuel<br />
(Powder, Pelletization<br />
Encapsulation)<br />
Los Alamos 340<br />
Heat Source Assembly Mound 77
Final Technical Report<br />
GPHS-RTGs for the Cassini Mission<br />
Lockheed Martin <strong>Document</strong> No. RR18<br />
August 1998<br />
The Oak Ridge P/FRs dealt primarily with fabrication and processing problems related to the<br />
iridium alloy encapsulation hardware while the Los Alamos P/FRs, for the most part, were<br />
related to fuel impurities. Mound P/FRs involved fabrication of the graphitics, module<br />
assembly problems and/or heat source assembly concerns. In each of the P/FRs the<br />
discrepancies were reviewed and dispositioned by the MRB.<br />
The GPHS modules designated for the three Cassini flight RTGs (F-2, F-6, and F-7) are<br />
identified in Tables 8-2, 8-3, and 8-4, respectively, along with relevant information. The<br />
position of each module in its stack is shown in the first column at the left of the table. Stack<br />
position number 1 is the inboard end of the generator nearest the spacecraft and position<br />
number 18 is at the outboard end. The first nine pack of modules is loaded into the<br />
generator at its outboard end (positions 10 through 18) while the second nine pack<br />
(positions 1 through 9) is loaded in last and is positioned at the inboard end of the<br />
generator. The module thermal wattage shown in the third column of each table is based<br />
on actual calorimetric measurements decayed out to the opening of the primary launch<br />
opportunity, 6 October 1997. (The actual launch occurred on 15 October 1997.) Individual<br />
module weight values are listed in column four. The last column in the three tables lists the<br />
four fueled clads used in each module. (For brevity, the normal FC prefix has been<br />
deleted.) The first two numbers are the fueled clads located in module cavity A, the last two<br />
are those located in cavity C. For each of the three flight generators, the module weight<br />
values and thermal inventories are consistent with specification requirements. In the case<br />
of the thermal wattages, the module-to-module variations are excellent with max-to-min<br />
ratios of less than one percent for each of the three generators. After reviewing the module<br />
stacking sequence recommended by Mound, Lockheed Martin approved the proposed<br />
module stacks.<br />
After module assembly, Mound personnel installed the modules in MRMF cans (a can may<br />
hold two modules) and connected the cans to the MRMF manifolding. Operation of the<br />
MRMF is such that it allows periodic removal of the generated CO and CO 2 which are<br />
replaced by backfilled argon. Operation of the facility continues until at least three<br />
consecutive gas analyses (taken at no less than weekly intervals) indicate that CO partial<br />
pressure is equal to or less than 500 Pa. Prior to decanning the modules to begin fueling
Final Technical Report<br />
GPHS-RTGs for the Cassini Mission<br />
Lockheed Martin <strong>Document</strong> No. RR18<br />
August 1998<br />
operation for each of the generators, Lockheed Martin reviewed the gas analysis data<br />
provided by Mound.<br />
Table 8-2. F-2 As-Assembled GPHS Module Data<br />
Stack<br />
Position<br />
Module<br />
No.<br />
Wattage<br />
(10/6/97)<br />
Weight<br />
(lbs)<br />
Module Cavity A<br />
Fueled Clads<br />
Module Cavity C<br />
1 8018 243.82 3.18 076, 120 089, 062<br />
2 8023 243.79 3.19 073, 087 118, 095<br />
3 8009 243.77 3.17 121, 119 140, 141<br />
4 8001 243.75 3.17 123, 124 115, 117<br />
5 8010 243.76 3.20 088, 083 145, 144<br />
6 8021 243.73 3.19 104, 092 105, 093<br />
7 8012 242.75 3.20 036, 056 156, 027<br />
8 8024 242.76 3.18 030, 046 107, 106<br />
9 8022 242.97 3.18 021, 023 096, 097<br />
10 8002 241.91 3.16 094, 102 020, 025<br />
11 8020 242.94 3.19 034, 040 111, 112<br />
12 8025 242.95 3.18 098, 100 063, 091<br />
13 8015 243.79 3.18 039, 054 077, 078<br />
14 8019 243.43 3.19 048, 049 037, 041<br />
15 8008 243.44 3.17 043, 068 109, 110<br />
16 8016 243.45 3.18 072, 074 044, 045<br />
17 8013 243.46 3.18 052, 064 101, 108<br />
18 8011 243.47 3.20 079, 084 113, 114
Final Technical Report<br />
GPHS-RTGs for the Cassini Mission<br />
Lockheed Martin <strong>Document</strong> No. RR18<br />
August 1998<br />
Table 8-3. F-6 As-Assembled GPHS Module Data<br />
Stack<br />
Position<br />
Module<br />
No.<br />
Wattage<br />
(10/6/97)<br />
Weight<br />
(Ibs)<br />
Module Cavity A<br />
Fueled Clads<br />
Module Cavity C<br />
1 8068 245.59 3.19 266, 295 305, 306<br />
2 8067 245.43 3.19 281, 276 284, 315<br />
3 8029 245.34 3.19 300, 302 303, 304<br />
4 8040 245.31 3.19 299, 294 297, 298<br />
5 8053 245.14 3.18 278, 279 293, 326<br />
6 8060 245.12 3.19 283, 287 314, 317<br />
7 8061 245.06 3.18 309, 310 277, 280<br />
8 8045 244.03 3.19 321, 292 319, 320<br />
9 8046 243.98 3.19 288, 316 311, 318<br />
10 8041 244.22 3.19 246, 250 270, 268<br />
11 8072 244.35 3.17 271, 272 244, 249<br />
12 8070 244.45 3.18 190, 231 274, 275<br />
13 8056 244.54 3.18 251, 252 267, 258<br />
14 8047 244.60 3.18 226, 232 240, 241<br />
15 8042 244.81 3.19 200, 269 264, 265<br />
16 8059 244.86 3.18 237, 238 235, 245<br />
17 8043 244.90 3.19 247, 248 257, 263<br />
18 8063 244.91 3.17 222, 223 233, 239<br />
8-5
Final Technical Report<br />
GPHS-RTGs for the Cassini Mission<br />
Lockheed Martin <strong>Document</strong> No. RR18<br />
August 1998<br />
Table 8-4. F-7 As-Assembled GPHS Module Data<br />
Stack<br />
Position<br />
Module<br />
No.<br />
Wattage<br />
(10/6/97)<br />
Weight<br />
(Ibs)<br />
Module Cavity A<br />
Fueled Clads<br />
Module Cavity C<br />
1 8055 245.05 3.19 202, 225 209, 210<br />
2 8034 244.97 3.19 220, 221 192, 205<br />
3 8054 244.85 3.19 215, 224 207, 211<br />
4 8051 244.60 3.18 216, 198 218, 219<br />
5 8017 244.51 3.18 154, 155 133, 150<br />
6 8014 244.55 3.18 051, 151 162, 160<br />
7 8035 244.14 3.19 199, 206 228, 229<br />
8 8026 243.76 3.18 217, 212 242, 243<br />
9 8037 243.39 3.18 188, 197 167, 169<br />
10 8036 244.07 3.19 163, 164 213, 214<br />
11 8064 244.12 3.18 157, 158 194, 195<br />
12 8069 244.12 3.20 081, 172 171, 173<br />
13 8033 244.14 3.18 174, 182 152, 153<br />
14 8044 244.15 3.20 170, 203 176, 179<br />
15 8027 244.17 3.19 181, 191 122, 143<br />
16 8050 244.21 3.19 134, 137 177, 178<br />
17 8048 244.21 3.19 132, 138 183, 189<br />
18 8028 244.22 3.19 146, 148 186, 196<br />
Section 8 References<br />
8-1 Final Report for the GPHS-RTG Program, GESP-7209, February 1991.<br />
8-2 Interface Working Agreement for Encapsulated Plutonium-238 Fuel Form Production,<br />
Rev. 2, June 1992.<br />
8.3 GPHS-RTG Interface Working Agreement for the Cassini RTG Program, GESP-7231,<br />
February 1996.<br />
8-6
Section 9<br />
Launch Site Operations
Final Technical Report<br />
GPHS-RTGs for the Cassini Mission<br />
Lockheed Martin <strong>Document</strong> No. RR18<br />
August 1998<br />
SECTION 9<br />
LAUNCH SITE OPERATIONS<br />
The Readiness Review for shipment of the F-2 and F-5 RTGs was convened by Mound<br />
on 17 April 1997 and the review for shipment of F-6 and F-7 was held at Mound on 1 May<br />
1997. A LMMS representative attended and remained at Mound for RTG transportation<br />
system package assembly operations for both F-2 and F-5 as well as for F-6 and F-7.<br />
Vent plug sealing difficulties were experienced with one of the primary vessel port plugs.<br />
Mound personnel (after discussions with cognizant personnel at Hanford) reworked the<br />
vent plug threads and were successful in establishing a tight seal for all the packages.<br />
Subsequently, two convoys were used to transport all four RTGs to the Kennedy Space<br />
Center (KSC).<br />
The first convoy delivered the F-2 and F-5 RTGs to the RTG facility at KSC on 22 April.<br />
The unloading of F-2 from the System 120 Package and installation into the BPCA base<br />
went smoothly and without problems. Difficulty was experienced when the spare F-5<br />
RTG was removed from the transportation system package (TSP) base assembly. One of<br />
four locking pins that secure the RTG and its mid-ring assembly (MRA) to the converter<br />
support ring (CSR) was found to be incompletely retracted. Consequently, this remaining<br />
pin hindered the removal of the RTG and caused the TSP base assembly to be partially<br />
lifted with the RTG. Upon seeing one side of the base assembly approximately one halfinch<br />
off the floor, the crane operator stopped the lift, the TSP base separated from the<br />
remaining pin, and the elevated side of the base slipped back to the floor, leaving the<br />
RTG free. Subsequently, the transfer of F-5 was completed to the base and protective<br />
cover assembly (BPCA) base for storage. A small burr on one of the four MRA lugs<br />
(apparently caused by the less than fully retracted locking pin) restricted the movement of<br />
one of the MRA lugs in mating with the CSR. Eventually, the lug seated fully and the RTG<br />
was secured to the BPCA base with its CSR locking pins. Following the transfer to the<br />
BPCA base, the internal pressure of the RTG was monitored and found to be in<br />
agreement with the pre-ship value recorded by Mound. Subsequent electrical checks of<br />
F-5 also showed satisfactory values. As a result of the incident, handling procedures<br />
9-1
Final Technical Report<br />
GPHS-RTGs for the Cassini Mission<br />
Lockheed Martin <strong>Document</strong> No. RR18<br />
August 1998<br />
were revised to include the use of a hydra-set and load cell to limit the force used to lift an<br />
RTG to a value consistent with its weight and the weight of its attached ground support<br />
equipment.<br />
The F-6 and F-7 RTGs were delivered to KSC two weeks later on 6 May. These<br />
unloading operations went very smoothly and without difficulties. After delivery of all four<br />
RTGs to KSC, electrical measurements were performed and found to be satisfactory for<br />
each RTG. The JPL adapter rings with the power and RTD cables attached were<br />
installed on the F-6 and F-7 RTGs on 20 and 21 May. Prior to F-2 installation, electrical<br />
measurements of the cabling revealed that the outer cable covering was electrically<br />
conductive and compromised the electrical isolation of the RTG from the spacecraft at the<br />
adapter-to-RTG interface. JPL revised their cable design by including overwrapping with<br />
Sheldahl to restore electrical isolation. The F-2 adapter cabling was modified, installed<br />
on the F-2 RTG and found to be satisfactory. The F-6 and F-7 adapter/cabling<br />
assemblies were removed, modified, reinstalled and also found to be satisfactory.<br />
Periodic electrical measurements of the RTGs were continued following the removal of<br />
the adapter rings and modification of the power and resistance temperature device<br />
cables, as noted above. Pressure measurements were also completed using the gas<br />
service carts. The measured electrical data were consistent with prior data. Both F-2<br />
and F-5 had slight pressure increases while F-6 and F-7 had slight pressure decreases.<br />
All measurements were well within specified limits.<br />
Argon gas exchanges were performed to remove helium produced by the decay of the<br />
Pu 238 isotope heat source. The operation was performed to restore power output for the<br />
trial fit-up of the RTGs to the spacecraft. The exchanges were performed on a 24-hour<br />
per day basis with operations taking place on two RTGs simultaneously. F-5 and F-6<br />
underwent nine gas exchange cycles prior to achieving maximum power; F-2 and F-7<br />
underwent ten gas exchange cycles. The initial and final RTG power values are as<br />
shown in Table 9-1.
Table 9-1. Initial and Final RTG Output Power<br />
Final Technical Report<br />
GPHS-RTGs for the Cassini Mission<br />
Lockheed Martin <strong>Document</strong> No. RR18<br />
August 1998<br />
RTG<br />
Initial Power<br />
(Watts)<br />
Final Power<br />
(Watts)<br />
F-2 121.2 156.5<br />
F-5 80.8 124.0<br />
F-6 136.3 150.1<br />
F-7 134.2 157.4<br />
The PRDs were installed on the F-2, F-6, and F-7 RTGs on 25 June. All operations were<br />
performed per CAS 131-LM, Part 1. The safety bolt and nut were replaced with the quick<br />
release safety pin prior to PRD installation. Proper clearance between bellows and<br />
safety pin and between lance and diaphragm were verified using a videoscope. The gas<br />
flex hoses were also removed from the RTGs. The above activities were accomplished in<br />
preparation for the RTGs-to-spacecraft fit check.<br />
Reviews of draft operational procedures continued with comments being forwarded to<br />
JPL for consideration. In addition, three LMMS individuals were trained for crane<br />
operations at PHSF to perform operations for protective cover removal and installation<br />
with the BPCA base in the PHSF air lock.<br />
Next the RTGs were transferred to the PHSF and mated with the spacecraft. In<br />
preparation for the fit check, a Readiness Review was held on 15 July and a dress<br />
rehearsal was performed on 17 July. These operations included removal of an RTG<br />
simulator from the BPCA, transferring the RTG, and installing it onto the spacecraft at all<br />
three locations. These activities provided good training experience in handling the flight<br />
RTGs prior to their final installation on the spacecraft at the launch pad.<br />
The fit check began 18 July when the RTGs were transferred to the PHSF and<br />
subsequently mated to the Cassini spacecraft. Upon arrival at the PHSF, the protective<br />
covers were removed and the RTGs were installed onto the spacecraft. All activities<br />
moved quickly and without difficulty. The PHSF facility crane circuit breaker activated<br />
and shut down operations for about one-half hour during removal of the BPCA protective<br />
cover for F-6. In addition, the JPL power connector's protective plastic cover touched the<br />
9-3
Final Technical Report<br />
GPHS-RTGs for the Cassini Mission<br />
Lockheed Martin <strong>Document</strong> No. RR18<br />
August 1998<br />
RTG and left a small amount of material on the outer shell of F-6. After review in Valley<br />
Forge, the largest deposit of melted material was removed. A small amount of paint was<br />
removed at the edge of the land near one of the unicouple sealing screws. Some of the<br />
smaller deposits were not removed. A JPL Quality Engineer witnessed the removal<br />
operation and concurred with this disposition.<br />
RTG/spacecraft electrical connections began at 1400 hours on 18 July. Spacecraft<br />
operations continued under RTG power until 0800 hours on 19 July. The electrical<br />
performance data are shown in Table 9-2.<br />
Table 9-2. Comparison of RTG Power Following Argon Gas Flush<br />
and during Spacecraft Mating<br />
RTG Power - Watts<br />
F-2 F-6 F-7<br />
After Gas Flush 156.6 150.1 157.4<br />
Spacecraft Power * 149.9 141.5 150.5<br />
*Span from Gas Rush - Days 28 30 28<br />
Operations to remove the RTGs from the spacecraft began about 0830 hours on 19 July<br />
and by 1330 hours the RTGs were back in the RTGF. The RTG transportation system<br />
trailers were loaded without difficulty and the air conditioning system kept the inside<br />
trailer temperature below 84°F.<br />
After the RTGs were returned to the RTGF, new flex hoses were installed on F-2, F-6, and<br />
F-7. The flex hose on F-5 was replaced with the new hose at this same time. Electrical<br />
and pressure measurements were again performed on the RTGs. F-2, F-5 and F-6 had<br />
slight pressure increases during approximately one month of storage time. F-7 had a<br />
0.20 psia pressure decrease during the same storage period. All changes were within<br />
acceptable levels. The electrical performance data, as measured by the PTUs, were<br />
consistent with previous data prior to the spacecraft fit check.<br />
Two Problem/Failure Reports (P/FRs) were generated by DOE Mound during RTG<br />
transport to the PHSF. One related to the set-down of the BPCA base while being<br />
lowered by the pallet truck. The other was related to the tightening of the tie-down straps<br />
9-4
Final Technical Report<br />
GPHS-RTGs for the Cassini Mission<br />
Lockheed Martin <strong>Document</strong> No. RR18<br />
August 1998<br />
in the trailer. In both instances the load to the RTGs was minor. Inspection of the passive<br />
shock indicators showed they were not tripped and the P/FRs were dispositioned<br />
accordingly.<br />
During their storage in the RTGF, the RTG electrical performance and pressure were<br />
monitored. All electrical data were consistent with previous measurements. Pressure<br />
checks showed that the pressure in all four RTGs continued to be satisfactory.<br />
Temperature measurements using the RTDs mounted on the RTGs were also monitored<br />
during storage. In the case of F-7 temperature variations of a few degrees were noted.<br />
An investigation led to the conclusion that these variations were related to the proximity<br />
of F-7 to one of the building's air conditioning vents. The temperature variations were not<br />
serious and no changes to the ventilation system were made.<br />
As a contingency step, a test was performed to determine the heat-up rate of the<br />
outboard handling fixture when placed on the heater plates. Heating of the outboard<br />
handling fixtures was required if the RTGs need to be removed from the spacecraft at<br />
LC-40. Three heater plates were to be used and a heat-up time-temperature profile was<br />
established.<br />
The final procedure for LC-40 and KSC operations was completed and submitted for<br />
approval in August. This procedure, CAS 131-LM Part 5, covered the activities for getting<br />
the spare RTG prepared for shipment to Mound and the preparation of the Ground<br />
Support Equipment (GSE) for return to Valley Forge. Photographs of F-6 were taken<br />
documenting the removal of the deposits from the electrical connector cover.<br />
The Cassini spacecraft was moved from the PHSF to LC-40 on 27 August. The<br />
spacecraft was satisfactorily mated to the Centaur early on the following day. The<br />
Cassini spacecraft was removed from LC-40 on 7 September and returned to the PHSF,<br />
because of a concern that the Huygens Probe may have been contaminated by<br />
insulation particles due to high nitrogen purge flow. The probe was removed from the<br />
spacecraft and was cleaned, reassembled, and reattached to the spacecraft in<br />
preparation for moving to the launch pad. As a result of performing these operations, the<br />
Cassini launch was rescheduled from 6 October to 13 October.<br />
9-5
Final Technical Report<br />
GPHS-RTGs for the Cassini Mission<br />
Lockheed Martin <strong>Document</strong> No. RR18<br />
August 1998<br />
The CAS 131-LM, Part 4 procedure for LC-40 RTG installation was red-lined for the<br />
dress rehearsal. The procedure called for the BPCA to be lifted with the RTG simulator to<br />
Level 6, the simulator removed, and lifted to Level 14 for spacecraft integration.<br />
The LC-40 procedures were modified for lightning precautions. Once the RTG removal<br />
operation from the trailer had begun, the RTG lift would continue to level 6 under a Phase<br />
2 warning (lightning sighted within 5 miles). If the unloading operation had not been<br />
initiated, the RTG would have remained in the trailer until the Phase 2 warning had been<br />
terminated. The responsible engineer was given the authority to return the RTG to the<br />
trailer at any time, if warranted. The RTG lift from level 6 to level 14 could not begin under<br />
a Phase 2 warning.<br />
All hardware and procedures were in-place to perform the dress rehearsal on 27<br />
September. LMMS personnel attended meetings with JPL, KSC, and CCAS personnel to<br />
establish roles and responsibilities for the dress rehearsal. Manloading for the RTGF,<br />
LC-40 Deck (ground level), LC-40 Level 6, and LC-40 Level 14 were established in<br />
conjunction with JPL for both the dress rehearsal and RTG installation.<br />
The GSE was taken to LC-40 on 26 September and placed on the appropriate level. The<br />
dress rehearsal started with the BPCA being lifted from the pad deck to Level 6. The<br />
BPCA cover was removed and the RTG simulator was transferred to the JPL lifting sling.<br />
The simulator was lifted to Level 14 and mated to the spacecraft. This was the first RTG<br />
simulator installation with the payload fairing in-place. After the simulator was mounted<br />
to all three spacecraft locations, a backout operation was performed that took the RTG<br />
simulator back to Level 6, installed in the BPCA and lowered to the pad deck. This cycle<br />
lasted approximately six hours. All operations went very well and provided an excellent<br />
familiarization opportunity for the CCAS personnel. A lessons-learned review was held<br />
with all personnel.<br />
The xenon gas exchange started on 29 September. This was a 24-hour per day activity<br />
and lasted six days. The RTGs were on open circuit for these gas exchange cycles to<br />
raise the hot side temperatures to aid in removal of the residual helium and argon gases.<br />
9-6
Final Technical Report<br />
GPHS-RTGs for the Cassini Mission<br />
Lockheed Martin <strong>Document</strong> No. RR18<br />
August 1998<br />
The xenon gas exchange cycles were completed for F-2, F-6, and F-7. F-6 required 10<br />
gas cycles to obtain maximum power. F-2 and F-7 required 9 gas cycles. During the gas<br />
exchange cycles the RTG open circuit voltage was monitored. When the voltage changed<br />
less than 0.1 volt between gas cycles, the cycles were terminated. Following the<br />
completion of the gas cycles, the RTGs were placed under a 30 volt load and a four hour<br />
stability test was performed. The initial open circuit voltage with argon/helium and the<br />
final open circuit voltage with xenon gas and final RTG power are shown in Table 9-3.<br />
Table 9-3. RTG Power Following Xenon Gas Exchange<br />
Argon/Helium Xenon RTG Power<br />
RTG-F-2 44.10 Volts 53.24 Volts 221.34 Watts<br />
RTG-F-6 43.39 Volts 52.00 Volts 211.48 Watts<br />
RTG-F-7 44.27 Volts 53.01 Volts 219.23 Watts<br />
RTG-F-5 40.98 Volts 49.92 Volts N/A<br />
On F-5 (spare RTG) the xenon gas cycles were suspended after two gas cycles due to<br />
lack of xenon gas. The following week two hundred liters of xenon gas became available<br />
to complete the 10 gas cycles. No RTG performance test was performed on F-5 due to<br />
other activities for the flight RTGs.<br />
On 6 October the RTGs were prepared for flight by removing the gas flex hose and other<br />
non-flight hardware and the protective covers installed onto the BPCA bases. The three<br />
flight RTGs were transferred to the launch pad on 10 October. The RTG loading began at<br />
0400 hours and the move to LC-40 began at 0500 hours. The unloading and lift to level<br />
6 began at approximately 0615 hours and was completed around 0830 hours. The lifts<br />
from level 6 to level 14 were completed at 1100 hours. RTG power to the spacecraft was<br />
started at 1300 hours. All operations were accomplished satisfactorily.<br />
The Cassini spacecraft was launched on 15 October at 0443 hours from Cape Canaveral<br />
Air Station. All systems performed nominally. The RTG power was 890 watts after<br />
achieving stability, just two watts different than the 888 watts pre-launch predictions.<br />
9-7
Final Technical Report<br />
GPHS-RTGs for the Cassini Mission<br />
Lockheed Martin <strong>Document</strong> No. RR18<br />
August 1998<br />
F-2 was 299.7 watts, F-6 was 293.1 watts, and F-7 was 297.4 watts corrected for<br />
spacecraft cable loss.<br />
On 20 October Lockheed Martin returned to the launch pad to remove BPCAs and other<br />
GSE from level 6 and return it to the RTGF. Also on 20 October Lockheed Martin<br />
personnel initiated the exchange of the xenon gas on F-5 to argon gas. Nine gas cycles<br />
were completed on F-5 by 24 October. A PTU performance test was performed on this<br />
RTG to provide a reference for receipt at DOE Mound.<br />
The PTU test data are shown in Table 9-4.<br />
Table 9-4. F-5 RTG Performance Prior to Shipment to DOE Mound<br />
Voltage<br />
Current<br />
RTD Average<br />
Resistance (Internal)<br />
Open Circuit Voltage<br />
Resistance to Case<br />
RTG Pressure<br />
1.234 volts<br />
14.92 amps<br />
158.6°C<br />
2.195 ohms<br />
33.99 volts<br />
868k ohms<br />
23.2 psia<br />
The RTG Shipping Package was prepared for receiving the RTG on 27 October. F-5 was<br />
installed into the package on 28 October and loaded onto the Transportation System<br />
Trailer. The convoy left KSC the following morning and arrived at DOE Mound Plant on<br />
30 October. The Package was unloaded and F-5 removed. Pressure and electrical<br />
checks were made and found to be consistent with pre-ship data.<br />
The ground support equipment and personal belongings were loaded on trucks on 29<br />
and 30 October for return to Valley Forge, ending the KSC/CCAS launch support<br />
activities.<br />
A summary of the RTG electrical data and pressure history at KSC and a few data points<br />
taken at Mound are shown in Tables 9-5 through 9-8.
Final Technical Report<br />
GPHS-RTGs for the Cassini Mission<br />
Lockheed Martin <strong>Document</strong> No. RR18<br />
August 1998<br />
Table 9-5. RTG F-2 Data<br />
RTG<br />
pressure<br />
PSIA<br />
RTG<br />
shorted<br />
voltage<br />
VDC<br />
RTG<br />
shorted<br />
current<br />
Amps<br />
RTG<br />
Open Cir<br />
voltage<br />
VDC<br />
Case<br />
Open Cir<br />
voltage<br />
VDC<br />
Case<br />
Close Cir<br />
voltage<br />
VDC<br />
RTD<br />
# 1<br />
temp<br />
Deg. C<br />
RTD<br />
# 2<br />
temp<br />
Deg. C<br />
RTD<br />
# 3<br />
temp<br />
Deg. C<br />
RTD<br />
# 4<br />
temp<br />
Deg. C<br />
RTD<br />
Avg<br />
temp<br />
Deg. C<br />
RTG<br />
power<br />
Watts<br />
RTG<br />
internal<br />
res<br />
Ohms<br />
RTG<br />
load<br />
res<br />
Ohms<br />
Case<br />
res<br />
2 min.<br />
KOhms<br />
Date<br />
MOUND<br />
4/2/97 1.281 15.10 35.21 0.343 0.017 161.7 162.7 164.4 161.1 162.5 19.3 2.247 0.085 191.2<br />
4/2/97 1.269 15.29 35.88 0.666 0.046 164.4 165.3 166.2 163.8 164.9 19.4 2.264 0.083 134.8<br />
4/14/97 24.60 1.271 14.91 34.99 0.348 0.019 166.2 167.1 165.3 166.5 166.3 19.0 2.262 0.085 177.8<br />
4/14/97 23.65 1.271 14.91 34.99 0.348 0.019 166.2 167.1 165.3 166.5 166.3 19.0 2.262 0.085 177.8<br />
KSC<br />
4/24/97 23.60 1.261 14.92 34.83 0.307 0.017 165.7 165.8 165.9 165.8 165.8 18.8 2.250 0.085 170.0<br />
4/24/97 24.50<br />
5/13/97 24.67<br />
5/23/97 note 1. 1.137 16.04 38.59 0.406 0.037 NA 169.7 167.7 166.6 168.0 18.24 2.335 0.071 99.7<br />
6/2/97 note 2. 1.066 14.72 34.59 0.377 0.018 NA 163.7 160.8 162.4 162.3 15.69 2.277 0.072 199.4<br />
6/3/97 24.79<br />
RTG IN NORMAL LOAD MODE ARGON GAS<br />
6/20/97 24.90 30.06 5.21 42.14 20.35 5.60 NA 159.3 157.1 158.2 158.2 156.61 2.319 5.770 263.4<br />
7/25/97 25.03<br />
7/25/97 24.50 1.131 15.50 36.16 0.304 0.019 NA 163.9 162.9 163.5 163.4 17.53 2.260 0.073 150.0<br />
8/19/97 1.117 15.26 36.00 0.3005 0.01949 NA 161.5 161.6 161.9 161.7 17.05 2.286 0.073 144.2<br />
8/20/97 24.80<br />
RTG IN NORMAL LOAD<br />
XENON GAS<br />
10/1/97 23.7 30.05 7.37 46.43 20.26 8.48 NA 157.7 155.3 155.4 156.1 221.34 2.224 4.081 139.1<br />
Notes:<br />
1 Data taken after extended period in OPEN mode, during adapter installation. Conditions were unstable.<br />
2 Stable data taken after JPL adapter was installed.
Final Technical Report<br />
GPHS-RTGs for the Cassini Mission<br />
Lockheed Martin <strong>Document</strong> No. RR18<br />
August 1998<br />
Table 9-6. RTG F-5 Data<br />
RTG<br />
pressure<br />
PSIA<br />
RTG<br />
shorted<br />
voltage<br />
VDC<br />
RTG<br />
shorted<br />
current<br />
Amps<br />
RTG<br />
Open Cir<br />
voltage<br />
VDC<br />
Case<br />
Open Cir<br />
voltage<br />
VDC<br />
Case<br />
Close Cir<br />
voltage<br />
VDC<br />
RTD<br />
# 1<br />
temp<br />
Deg. C<br />
RTD<br />
# 2<br />
temp<br />
Deg. C<br />
RTD<br />
# 3<br />
temp<br />
Deg. C<br />
RTD<br />
# 4<br />
temp<br />
Deg. C<br />
RTD<br />
Avg<br />
temp<br />
Deg. C<br />
RTG<br />
power<br />
Watts<br />
RTG<br />
internal<br />
res<br />
Ohms<br />
RTG<br />
load<br />
res<br />
Ohms<br />
Case<br />
res<br />
2 min.<br />
KOhms<br />
Date<br />
MOUND<br />
3/25/97 24.85 1.118 12.55 30.52 0.168 0.00054 158.1 156.7 156.7 156.5 157.0 14.0 2.343 0.089 3101.1<br />
4/8/97 24.75 1.071 12.50 30.33 0.161 0.00058 158.1 157.6 158.5 159.2 158.4 13.4 2.341 0.086 2765.9<br />
4/14/97 24.75 1.112 12.49 30.31 0.155 0.00053 156.3 155.0 154.9 154.8 155.3 13.9 2.338 0.089 2914.5<br />
4/14/97 23.60 1.112 12.49 30.31 0.155 0.00053 156.3 155.0 154.9 154.8 155.3 13.9 2.338 0.089 2914.5<br />
KSC<br />
4/24/97 23.55 1.115 12.47 30.24 0.218 0.00052 158.0 158.5 157.8 157.6 158.0 13.90 2.336 0.089 4182.3<br />
4/29/97 23.55<br />
4/29/97 24.50<br />
5/13/97 24.61<br />
6/2/97 1.086 12.48 30.16 0.189 0.00053 157 158.4 156 156.7 157.0 13.55 2.330 0.087 3556.0<br />
6/3/97 24.81<br />
RTG in NORMAL OAD MODE ARGON GAS<br />
6/18/97 25.1 30.061 4.121 40.08 21.922 1.877 155.6 155.9 154.1 154.5 155.0 123.88 2.432 7.295 1067.9<br />
7/25/97 24.52<br />
7/25/97 24.00 1.214 13.91 34.10 0.257 0.00218 154.5 155.9 155.0 153.9 154.9 16.89 2.364 0.087 1168.9<br />
8/19/97 1.212 13.77 33.79 0.251 0.00207 155 155.6 154.1 153.4 154.4 16.69 2.366 0.088 1202.6<br />
8/20/97 24.50<br />
10/24/97 23.2 1.234 14.92 33.99 0.2475 0.00282 157.1 158.5 159.1 158.1 158.6 18.41 2.195 0.083 867.7<br />
Notes:<br />
1 Data taken after extended period in OPEN mode, during adapter installation. Conditions were unstable.<br />
2 Stable data taken after JPL adapter was installed.
Final Technical Report<br />
GPHS-RTGs for the Cassini Mission<br />
Lockheed Martin <strong>Document</strong> No. RR18<br />
August 1998<br />
Table 9-7. RTG F-6 Data<br />
RTG<br />
pressure<br />
PSIA<br />
RTG<br />
shorted<br />
voltage<br />
VDC<br />
RTG<br />
shorted<br />
current<br />
Amps<br />
RTG<br />
Open Cir<br />
voltage<br />
VDC<br />
Case<br />
Open Cir<br />
voltage<br />
VDC<br />
Case<br />
Close Cir<br />
voltage<br />
VDC<br />
RTD<br />
# 1<br />
temp<br />
Deg. C<br />
RTD<br />
# 2<br />
temp<br />
Deg. C<br />
RTD<br />
# 3<br />
temp<br />
Deg. C<br />
RTD<br />
# 4<br />
temp<br />
Deg. C<br />
RTD<br />
Avg<br />
temp<br />
Deg. C<br />
RTG<br />
power<br />
Watts<br />
RTG<br />
internal<br />
res<br />
Ohms<br />
RTG<br />
load<br />
res<br />
Ohms<br />
Case<br />
res<br />
2 min.<br />
KOhms<br />
Date<br />
MOUND<br />
4/16/97 24.50 1.287 15.72 35.63 0.328 0.011 167.7 170.0 169.2 168.4 168.8 20.23 2.185 0.082 288.2<br />
4/16/97 25.20 1.287 15.72 35.63 0.328 0.011 167.7 170.0 169.2 168.4 168.8 20.23 2.185 0.082 288.2<br />
4/28/97 22.10 1.297 15.71 35.67 0.343 0.011 161.5 158.5 160.3 161.3 160.4 20.38 2.188 0.083 301.8<br />
4/28/97 23.60 1.297 15.71 35.67 0.343 0.011 161.5 158.5 165.3 161.3 160.4 20.38 2.188 0.083 301.8<br />
KSC<br />
5/7/97 1.317 15.53 35.38 0.361 0.012 169.7 169.1 168.7 170.5 169.5 20.45 2.193 0.085 290.8<br />
5/12/97 23.55<br />
5/12/97 24.46<br />
5/21/97 note 1. 1.112 16.77 39.44 0.470 0.035 NA 175.7 175.7 176.2 175.9 18.65 2.286 0.066 124.3<br />
5/29/97 note 1. 1.12 17.35 40.33 0.493 0.043 NA 178.8 177.7 178.3 178.3 19.43 2.260 0.065 104.7<br />
6/2/97 note 2. 1.049 15.53 35.00 0.412 0.014 NA 168.3 167 168.7 168.0 16.29 2.186 0.068 284.3<br />
6/4/97 24.32<br />
6/4/97 24.97<br />
RTG IN NORMAL LOAD MODE ARGON GAS<br />
6/18/97 25.04 30.00 5.00 41.24 27.85 12.44 NA 162.7 162.5 162.6 162.6 150.03 2.248 5.999 123.9<br />
7/25/97 25.12 1.036 15.48 35.5 0.5302 0.0244 NA 165.9 165.9 165.9 165.9 16.04 2.226 0.067 207.3<br />
8/1/97 NA 167.0 166.0 167.0 166.7<br />
8/4/97 NA 167.0 167.0 168.0 167.3<br />
8/11/97 NA 166.0 166.0 167.0 166.3<br />
8/19/97 1.023 15.26 35.5 0.5417 0.02431 NA 163.1 163.5 165 163.9 15.61 2.259 0.067 212.8<br />
8/20/97 25.25<br />
8/20/97 24.94<br />
RTG IN NORMAL LOAD MODE<br />
XENON GAS<br />
10/3/97 24.7 30.01 7.05 45.64 27.07 15.47 NA 161.8 161.5 161.9 161.7 211.48 2.218 4.259 750.4<br />
Notes:<br />
1 Data taken after extended period in OPEN mode, during adapter installation. Conditions were unstable.<br />
2 Stable data taken after JPL adapter was installed.
Final Technical Report<br />
GPHS-RTGs for the Cassini Mission<br />
Lockheed Martin <strong>Document</strong> No. RR18<br />
August 1998<br />
Table 9-8. RTG F-7 Data<br />
RTG<br />
pressure<br />
PSIA<br />
RTG<br />
shorted<br />
voltage<br />
VDC<br />
RTG<br />
shorted<br />
current<br />
Amps<br />
RTG<br />
Open Cir<br />
voltage<br />
VDC<br />
Case<br />
Open Cir<br />
voltage<br />
VDC<br />
Case<br />
Close Cir<br />
voltage<br />
VDC<br />
RTD<br />
# 1<br />
temp<br />
Deg. C<br />
RTD<br />
# 2<br />
temp<br />
Deg. C<br />
RTD<br />
# 3<br />
temp<br />
Deg. C<br />
RTD<br />
# 4<br />
temp<br />
Deg. C<br />
RTD<br />
Avg<br />
temp<br />
Deg. C<br />
RTG<br />
power<br />
Watts<br />
RTG<br />
internal<br />
res<br />
Ohms<br />
RTG<br />
load<br />
res<br />
Ohms<br />
Case<br />
res<br />
2 min.<br />
KOhms<br />
Date<br />
MOUND<br />
3/18/97 25.20 1.434 15.60 35.93 0.468 0.014 164.6 166.7 161.7 163.7 164.2 22.37 2.211 0.092 324.3<br />
4/1/97 24.80 1.384 15.54 35.89 0.475 0.014 163.7 169.4 164.4 162.8 165.1 21.51 2.220 0.089 329.3<br />
4/15/97 24.50 1.397 15.42 35.76 0.449 0.014 165.5 170.3 168.8 165.5 167.5 21.54 2.228 0.091 310.7<br />
4/29/97 24.90 1.346 15.35 35.68 0.440 0.013 166.4 166.7 165.3 165.5 166.0 20.66 2.237 0.088 328.5<br />
4/29/97 23.60 1.346 15.35 35.68 0.440 0.013 166.4 166.7 165.3 165.5 166.0 20.66 2.237 0.088 328.5<br />
KSC<br />
5/7/97 1.380 15.32 35.47 0.407 0.012 167.3 167.7 167.9 167.2 167.5 21.14 2.225 0.090 329.2<br />
5/12/97 23.57<br />
5/12/97 24.45<br />
5/20/97 note 1. 1.259 16.83 39.88 0.599 0.042 NA 171.9 171.8 173.2 172.3 21.19 2.295 0.075 132.6<br />
5/30/97 note 1. 1.251 17.12 40.53 0.584 0.048 NA 173.3 174.4 173.8 173.8 21.42 2.294 0.073 111.7<br />
6/2/97 note 2. 1.122 15.29 34.96 0.473 0.012 NA 164.7 165.7 164.5 165.0 17.16 2.213 0.073 384.2<br />
6/4/97 24.40<br />
6/4/97 24.99<br />
RTG IN NORMAL LOAD MODE ARGON GAS<br />
6/20/97 24.80 30.03 5.24 41.97 27.64 11.05 NA 161.7 160.4 159 160.3 157.36 2.279 5.731 150.1<br />
7/25/97 24.80<br />
7/25/97 25.00 1.151 15.7 36.14 0.522 0.0223 NA 157.0 159.2 154.0 156.7 18.07 2.229 0.073 224.1<br />
7/25/97 NA 157.0 161.0 157.0 158.3<br />
8/1/97 NA 163.0 163.0 161.0 162.3<br />
8/4/97 NA 163.0 163.5 161.0 162.5<br />
8/11/97 NA 163.0 163.0 161.0 162.3<br />
8/19/97 1.220 15.33 36.08 0.5138 0.02127 NA 159.3 161.9 161.2 160.8 18.70 2.274 0.080 231.6<br />
8/20/97 25.16<br />
8/20/97 25.02<br />
RTG IN NORMAL LOAD MODE XENON GAS<br />
10/1/97 24.2 30.01 7.31 46.26 26.09 11.74 NA 158.4 158.3 156.8 157.8 219.23 2.225 4.106 122.2<br />
Notes:<br />
1 Data taken after extended period in OPEN mode, during adapter installation. Conditions were unstable.<br />
2 Stable data taken after JPL adapter was installed.
Section 10<br />
Material and Equipment Status
SECTION 10<br />
MATERIALS AND EQUIPMENT STATUS<br />
10.1 RESIDUAL CASSINI UNICOUPLE HARDWARE<br />
Final Technical Report<br />
GPHS-RTGs for the Cassini Mission<br />
Lockheed Martin <strong>Document</strong> No. RR18<br />
August 1998<br />
Table 10-1 lists the hardware related to unicouple production, which is residual from the<br />
Cassini Program. This hardware has been packaged for long term storage per document<br />
GESP-7244, Requirements for Long Term Packaging of Unicouple and Converter<br />
Hardware. These items are available for future unicouple production, or any other suitable<br />
application.<br />
Table 10-1. Cassini Residual Unicouple Hardware<br />
Item<br />
Drawing Number<br />
Stock<br />
Qty U/M<br />
Boron Powder M31A1 300 GM<br />
Braze Shim 47A303830P1 5303 EA<br />
Braze Shim 47A303831P1 7988 EA<br />
Braze Shim 47A303832P1 16500 EA<br />
Braze Shim 47A303833P1 2473 EA<br />
Braze Shim 47A303834P1 8700 EA<br />
Cold Shoe, Tumbled 47A303803P1 426 EA<br />
Cold Shoe, Tumbled 47A303803P1-901 2660 EA<br />
Cold Stack 47A303957G1 52 EA<br />
Compact Less Sample, 78% n-SiGe 47A303807P1-900 2 EA<br />
Compact Less Sample, 78% p-SiGe 47A303808P1-900 1 EA<br />
Compact, 63.5% n-SiGe 47A303821P1 2 EA<br />
Compact, 63.5% p-SiGe 47A303822P1 2 EA<br />
Compact, 78% n-SiGe 47A303819P1 2 EA<br />
Compact, 78% p-SiGe 47A303820P1 5 EA<br />
Compact, 85% n-SiMo 47A303823P1 18 EA<br />
Compact, 85% p-SiMo 47A303824P1 15 EA<br />
Compact, Polished n-SiMo 47A303817P1 2 EA<br />
Compact, Polished p-SiMo 47A303818P1 2 EA<br />
Connector, Plated 47A303841 P2 37 EA<br />
Connector, Tumbled 47A303841 P2-901 935 EA<br />
Connector, Unplated 47A303841 P2-900 3913 EA<br />
Couple Preassembly 47A303929G1 49 EA<br />
First Bond 47A303959G1 164 EA<br />
First Bond, Si 3N4 Coated 47A303962G1 121 EA<br />
Foil, Titanium M14B1 4 FT<br />
Germanium M30A1 5043 GM<br />
Germanium, Crushed RM1B1-901 1783 GM<br />
Heat Shunt, Etched 47A303847P2-900 73 EA<br />
10-1
Final Technical Report<br />
GPHS-RTGs for the Cassini Mission<br />
Lockheed Martin <strong>Document</strong> No. RR18<br />
August 1998<br />
Table 10-1. Cassini Residual Unicouple Hardware (Cont'd)<br />
Item<br />
Drawing Number<br />
Stock<br />
Qty U/M<br />
Heat Shunt, Less Etch and Plate 47A303847P2-901 15 EA<br />
Heat Shunt, Less Plate 47A303847P2-900 73 EA<br />
Heat Shunt, Machined 47A303847P2-901 15 EA<br />
Heat Shunt, Plated 47A303847P2 45 EA<br />
Hot Shoe 47A303858P1 206 EA<br />
Hot Shoe Spacer, As Purchased 47A303922P1-900 926 EA<br />
Hot Shoe Spacer, Fired 47A303922P1 162 EA<br />
Hot Shoe Spacer, Si 3N4 Coated 47A303923P1 146 EA<br />
Hot Shoe, H 202 Cleaned 47A303959G1-900 31 EA<br />
Insulation, Fired M49A1 1.6 SF<br />
Insulation, Unfired M49A1-900 47 SF<br />
Insulator 47A303845P1 1832 EA<br />
Insulator, Machined 47A303844P1 198 EA<br />
Insulator, Plated 47A303846P1 21 EA<br />
Mo Compensator, Plated 47A303805P1 45 EA<br />
Mo Compensator, Unplated 47A303805P1-900 932 EA<br />
Molybdenum Powder M8D1 16344 GM<br />
N/P Bonded Compact 47A303956G1 3 EA<br />
Pedestal, Plated 47A303801 P1 150 EA<br />
Pedestal, Tumbled, Unplated 47A303801P1-902 662 EA<br />
Pellet, n- 47A303807P1 664 EA<br />
Pellet, p- 47A303808P1 418 EA<br />
Pellet, p-, Cleaned Random Length 47A303808P1-901 31 EA<br />
Phosphorus M32A1 375 GM<br />
Powder Blend, 63.5% n-SiGe 47A303821P1-901 22 MC<br />
Powder Blend, 63.5% p-SiGe 47A303822P1-901 8 MC<br />
Powder Blend, 78% n-SiGe 47A303819P1-901 15 MC<br />
Powder Blend, 78% p-SiGe 47A303820P1-901 13 MC<br />
Powder Blend, 85% n-SiMo 47A303823P1-901 12 MC<br />
Powder Blend, 85% p-SiMo 47A303824P1-901 1 MC<br />
Pressure Pad, Annealed 47A303806P1-901 1211 EA<br />
Pressure Pad, Plated 47A303806P1 73 EA<br />
Pressure Pad, Tumbled 47A303806P1-901 1211 EA<br />
Pressure Pad, Untumbled, w/ Burrs 47A303806P1-905 1020 EA<br />
Radiator 47A303955G1 16 EA<br />
Radiator, Machined 47A303852P1 38 EA<br />
Second Bond 47A303927G1 80 EA<br />
Segment, n- 47A303809P1 1225 EA<br />
Segment, p- 47A303810P1 3816 EA<br />
Shim, Titanium 47A303837P6-900 19 EA
Final Technical Report<br />
GPHS-RTGs for the Cassini Mission<br />
Lockheed Martin <strong>Document</strong> No. RR18<br />
August 1998<br />
Table 10-1. Cassini Residual Unicouple Hardware (Cont'd)<br />
Item<br />
Drawing Number<br />
Stock<br />
Qty U/M<br />
Silicon M29A1 135 KG<br />
Silicon, Crushed RM1B1-900 1850 GM<br />
Unicouple 47A303931G1 12 EA<br />
Unicouple, Wrapped 47A303948G1 1023 EA<br />
Vacuum Casting, 63.5% n-SiGe 47A303821 P1-900 1 EA<br />
Vacuum Casting, 78% p-SiGe 47A303820 P1-900 1 EA<br />
W Compensator, Plated 47A303802P1 183 EA<br />
W Compensator, Tumbled 47A303802P1-901 1268 EA<br />
Yarn, Fired Quartz M9D1 3 SP<br />
Notes:<br />
• The quantities listed include qualification and flight hardware, but not Engineering hardware.<br />
• The quantities listed are from Cassini stockroom plant code V8D only.<br />
10.2 DOE THERMOELECTRIC MANUFACTURING EQUIPMENT<br />
This paragraph discusses the thermoelectric production equipment which was maintained<br />
in an operational mode following completion of the Cassini unicouple build. Per DOE<br />
direction, the thermoelectric production equipment was operated on a monthly basis from<br />
December 1995 through September 1997. The equipment operated were six small Brew<br />
bonding furnaces, two compact hot presses, two vacuum casting furnaces, two CVD Si 3N 4<br />
coating furnaces, four Brown and Sharp grinders, one STC wafering machine, and the ITI<br />
slicer. All the vacuum equipment was operated and checked for the time required to reach<br />
operating conditions. Equipment that did not achieve acceptable vacuum levels were<br />
repaired, as required. Machine tool equipment was cleaned and drained of coolant. These<br />
were then operated monthly to cycle the equipment.<br />
As Space Power exited Building B, most of the thermoelectric equipment was put into<br />
storage for future possible use. Two Brew bonding furnaces, three vacuum test stations,<br />
and three laminar flow benches were transferred to AMPS to support the ARPS work.<br />
10.3 DOE LOADING AND ASSEMBLY STATION<br />
The Loading and Assembly Station (LAS) is a unique facility used to process ETGs. Major<br />
upgrades were made to this facility during the Cassini program and are discussed in the<br />
following paragraphs. The necessity to perform the processing in such a facility is<br />
10-3
Final Technical Report<br />
GPHS-RTGs for the Cassini Mission<br />
Lockheed Martin <strong>Document</strong> No. RR18<br />
August 1998<br />
established by the ETGs susceptibility to degradation in an oxygen atmosphere (air) while<br />
at elevated temperatures. The LAS, as shown in Figure 10-1, consists of an airtight main<br />
chamber which houses the ETG, tools, and fixtures, and provides a controlled inert<br />
environment in which work is performed through rubber/viton gloves, and an internal<br />
loadlock chamber through which large tools and fixtures can be passed while maintaining<br />
the integrity of the inert gas environment in the main chamber.<br />
The LAS is a vertical water-jacketed cylindrical chamber with an inside height of 80 inches<br />
and a diameter of 54 inches. Both the main chamber and the loadlock chamber can be<br />
simultaneously or individually evacuated and backfilled. The LAS can be utilized as a<br />
vacuum facility or as a glove box. The Assembly Station has its own Turbo-Molecular Pump<br />
(TMP) and a Cryogenic Pump for high vacuum applications. There are four work stations<br />
located around the LAS; at 0°, 90°, 195°, and 270°. Each of the four work stations is<br />
equipped with a 17 inch viewport and a pair of penetration gloves with the 90° station<br />
having an upper and lower pair. In addition, 6 inch viewports are located between the lower<br />
pair of gloves at the 90° station and just above the loadlock at the 0° station.<br />
The glove ports are configured such that the gloves may be removed or replaced without<br />
affecting the chamber environment. Special closures and pumpout capability from two<br />
Welch mechanical pumps are provided. A Portable Tool-lock is available that can be<br />
attached to any glove port. It also utilizes the special evacuation and backfill capabilities of<br />
the glove ports and serves as a pass-through for small tools.<br />
The internal loadlock chamber at the 0° work station has an internal capacity 20 inches<br />
wide by 12 inches high for passing larger items into the main chamber during in-process<br />
operations without affecting the environment's purity levels. A removable internal loadlock<br />
cover provides access to the main chamber.<br />
Hydraulic lifts are provided at the loadlock station. They are equipped with a 5 inch bore<br />
hydraulic ram to remotely raise equipment within the loadlock for transfer to the main<br />
chamber. They have a maximum elevation of 19 inches and a three-position direction<br />
control for up/down/stop. The system is operated by an electrically powered hydraulic<br />
10-4
Figure 10-1. Loading and Assembly Station<br />
Final Technical Report<br />
GPHS-RTGs for the Cassini Mission<br />
Lockheed Martin <strong>Document</strong> No. RR18<br />
August 1998
Final Technical Report<br />
GPHS-RTGs for the Cassini Mission<br />
Lockheed Martin <strong>Document</strong> No. RR18<br />
August 1998<br />
pump. Also, a manually operated reciprocating pump provides a backup capability. The<br />
LAS has a second hydraulic ram at the 195° converter work station and a separate threeposition<br />
controller, independent of the loadlock controller, which is activated when selected<br />
by a selector valve on the hydraulic pump. The capability to manually rotate the ETG 360°<br />
is also provided.<br />
Internal lighting of the chamber is achieved with three 300 watt incandescent lamps with<br />
individual rheostat control of their intensity. These lamps are recessed in the top dome of<br />
the chamber and are located at approximately 15°, 120°, and 240° orientations.<br />
The internal environment requirements of the ETGs are such that all operations must be<br />
performed in a vacuum or argon environment. Evacuation operations are accomplished<br />
utilizing a combination of mechanical roughing, TMP, and a closed cycle helium cryogenic<br />
system, which are described below. While in an argon environment, the GMS (described<br />
below) maintains a slight positive pressure (approximately +1 inch water) to ensure<br />
minimum backstreaming of air. Gas purification is accomplished and maintained by<br />
circulation through a scrubbing system that removes oxygen, nitrogen, and water vapor.<br />
The LAS is equipped with a pressure relief valve (set at 2 psi) to prevent over-pressurization<br />
due to mechanical malfunction.<br />
10.3.1 The Pumping Subsystems<br />
Evacuation and vacuum operations are performed by three (3) pumping subsystems which<br />
are described as follows.<br />
Roughing Pump: The Stokes Model 1730 mechanical roughing pump is a two stage<br />
system consisting of a 150 CFM piston pump that operates from atmospheric pressure to 30<br />
torr at which point an internal pressure switch automatically turns on the 516 CFM blower<br />
which has the pumping capacity to bring the LAS to approximately 10 microns. A 6 inch<br />
liquid nitrogen coldtrap with automatic level control completes the system.<br />
Turbo-Molecular Pumping System: The system consists of a 1500 USec TMP (TMH<br />
1600) backed by a 13 CFM (DUO-016B) two stage rotary vane pump. Both pumps operate<br />
simultaneously from atmospheric pressure, but not independently. This pumping system<br />
was purchased for the Cassini Program.
Final Technical Report<br />
GPHS-RTGs for the Cassini Mission<br />
Lockheed Martin <strong>Document</strong> No. RR18<br />
August 1998<br />
Cryogenic Pump: A Cryogenics Technology Model 1020-10-16 cryo pump is a<br />
cryogenic array within a shroud bolted to a 16 inch gate valve. The array is cooled by a<br />
refrigeration unit on the external end plate. The refrigerator is fed compressed helium from<br />
the compressor which rests on the floor in close proximity to the LAS. The cryo pump<br />
operates by condensing and freezing the gases at the temperature of the helium refrigerant.<br />
This temperature is approximately 15K (-430°F) to 26K (-413°F) which is sufficient to<br />
remove all gases except helium, neon, and hydrogen. These gases, noncondensable by<br />
the cryo pump, are removed by the TMP. A helium compressor was purchased for the<br />
Cassini Program.<br />
Isolation to all pumps is provided by air operated gate valves manufactured by NRC and are<br />
sized to accommodate the individual pump requirements.<br />
10.3.2 Gas Management System (GMS)<br />
This system was purchased for the Cassini Program. The GMS consists of a Vacuum<br />
Atmospheric gas purification system for argon gas. Because of the critical effect of gas<br />
purity and condition on the eventual ETG/RTG performance, impurity levels are continually<br />
monitored during processing operations. Visual and audible alarms are automatically<br />
activated prior to reaching any level of impurity that would adversely affect that performance.<br />
The GMS performs the following functions:<br />
1. Scrubs the argon gas by removing oxygen, water vapor, and nitrogen.<br />
2. Monitors impurity levels and activates alarms when preset levels are exceeded.<br />
3. Controls chamber pressure to maintain a pressure of -5 to +5 inch water column within<br />
± one inch.<br />
4. Recirculates the gas within the LAS at 40 CFM.<br />
10.3.3 The Control System<br />
The control system for the LAS and its associated equipment described above are housed<br />
in two (2) racks. The following lists the controls, alarms, and instrumentation contained in<br />
these control racks.<br />
1. Vacuum gages for all pumping and LAS systems<br />
2. Vacuum valve controls<br />
3. Vacuum pump controls<br />
10-7
Final Technical Report<br />
GPHS-RTGs for the Cassini Mission<br />
Lockheed Martin <strong>Document</strong> No. RR18<br />
August 1998<br />
4. Vacuum interlock controls<br />
5. Loss of vacuum alarms<br />
6. Liquid nitrogen coldtrap controls<br />
7. Cooling water operating indicators<br />
8. Cooling water alarms<br />
9. LAS illumination controls<br />
10. Gas purification alarms<br />
A typical ETG processing flow is shown in Figure 10-2.<br />
Following completion of the Cassini Program, the LAS was removed from Building 800 and<br />
relocated to Building 100 of the Valley Forge complex. It is planned to reestablish the LAS<br />
to working order for processing units in support of the ARPS program.
Final Technical Report<br />
GPHS-RTGs for the Cassini Mission<br />
Lockheed Martin <strong>Document</strong> No. RR18<br />
August 1998<br />
• REMOVE ETG FROM<br />
CONVERTER SHIPPING<br />
CONTAINER<br />
VF97-0779<br />
• PLACE ETG ON SLIDETRAY CART<br />
• POSITION SLIDETRAY CART AT 195° STATION<br />
• SLIDE ETG INTO LAS AT CONVERTER STATION<br />
• MAKE ELECTRICAL AND PNEUMATIC CONNECTIONS<br />
• SECURE DOOR<br />
• EVACUATE CHAMBER<br />
• APPLY POWER FROM ROC TO PERFORM<br />
PROCESSING<br />
• BACKFILL LAS AND REDOME ETG<br />
• RUN PERFORMANCE TEST<br />
• PERFORM PRESSURE DECAY TEST<br />
• REMOVE FROM LAS AND RETURN ETG<br />
TO SHIPPING CONTAINER<br />
Figure 10-2. Typical ETG Processing Flow
Section 11<br />
Thermoelectric Module Testing
SECTION 11<br />
THERMOELECTRIC MODULE TESTING<br />
Final Technical Report<br />
GPHS-RTGs for the Cassini Mission<br />
Lockheed Martin <strong>Document</strong> No. RR16<br />
August 1998<br />
11.1 EIGHTEEN COUPLE MODULES<br />
11.1.1 Test Data/Results<br />
Three modules were built and tested under the Cassini program. The modules were<br />
identical in design to those tested in the GPHS RTG program. Module instrumentation is<br />
shown in Figure 11.1-1. Couples 4, 5, 6 and 13, 14, 15 have hot shoe and cold strap<br />
thermocouples. (In this section, unicouples are referred to as "couples.") The latter are also<br />
used as voltage taps so that the electrical performance of these individual couples can be<br />
monitored during testing. Thermocouples are located at the end of each row to allow for<br />
monitoring of individual row (three couples) electrical performance.<br />
'STRAP TO<br />
FEED THRU N2<br />
(VOLT TAP IN CONN<br />
J1-25)<br />
-E<br />
J1M1-25<br />
O T/C #7<br />
T/C N11 /0 T/<br />
—0 T/C I/13<br />
'STRAP TO FEED<br />
THRU 41 (VOLTAGE<br />
TAP IN CONN J2-50)<br />
LEm1-50<br />
- -0 T/C N17<br />
CPL 1<br />
CPL 6<br />
0<br />
T/C 422 0<br />
T/C N3 0<br />
OUTER N<br />
P<br />
SHELL<br />
/0 T/C N10<br />
IN CPL 2<br />
ECPL 3<br />
P 0<br />
T/C #24 0 P 0 ---° 17C 42<br />
OUTER N -<br />
SHELL -<br />
T/C #26<br />
OUTER<br />
SHELL<br />
[1 - 0<br />
—<br />
a<br />
CPL 7<br />
CPL 5 CPL 8<br />
T/C #9<br />
-<br />
CPL 4<br />
P<br />
0 -<br />
T/C N1<br />
N<br />
rip<br />
CPL 9<br />
0 T/C 412<br />
T/C N8 0 T/C #28<br />
+ E —J<br />
J1 M 1-50,49,48<br />
LINK CIRCUIT THRU<br />
'STRAP TO FEED THRU W11 PENETRATION CABLE<br />
N<br />
r<br />
TPL 11<br />
CPL 14<br />
P N<br />
T/C N25 0-- -<br />
-<br />
o<br />
0 - -O T/C N5<br />
OUTER P<br />
SHELL -<br />
E: 6]<br />
CPL 12 -N<br />
T/C #23 0---p<br />
OUTER<br />
SHELL<br />
CPL 10<br />
]CPL 15<br />
N -<br />
T/C 427 0-- 0 0 T/C N6<br />
OUTER P - 14 -<br />
SHELL -<br />
L _ E<br />
J2M1.25, 26. 27<br />
1 CPL 13<br />
T/C 44<br />
T/C #14<br />
T/C #15<br />
NNO T/C N16<br />
'STRAP TO FEED THRU (#12<br />
O<br />
a<br />
N<br />
CPL 18<br />
CPL 17<br />
CPL 16<br />
Figure 11.1-1. Eighteen Couple Module Instrumentation<br />
The purpose of the module tests is twofold. First, an assessment of the thermoelectric<br />
performance is made at the normal hot shoe temperature of 1035°C comparing power<br />
output, internal resistance, and open circuit voltage with previously tested GPHS program
Final Technical Report<br />
GPHS-RTGs for the Cassini Mission<br />
Lockheed Martin <strong>Document</strong> No. RR16<br />
August 1998<br />
18 couple modules. Second, the effectiveness of the Si 3N 4 coating is evaluated from the<br />
trend of isolation resistance (foil to thermoelectric circuit) at an accelerated temperature of<br />
1135°C for two of the modules and at normal temperature for the third module. A sharp<br />
decrease in the isolation resistance (indication of Si 3N4 failure) is not expected until after<br />
2000 hours at 1135°C, equating to 40,000 hours at normal operating temperatures<br />
(1035°C).<br />
Table 11.1-1 summarizes the source of the couples, the test temperatures and total test<br />
hours.<br />
Module<br />
Table 11.1-1. Test Temperatures and Life Test Hours<br />
Unicouple Source<br />
Test Temperature<br />
Hot Shoe<br />
Status as of<br />
28 September 1997<br />
18-10 Early Qualification Lot 1135°C 10,400 Hours<br />
Performance Normal<br />
Test Terminated<br />
October 1994<br />
18-11 Full Qualification Lot 1135°C 30,709 Hours<br />
Performance Normal<br />
Test Terminated<br />
September 1997<br />
18-12 Early Flight Production Lot 1035°C 26,817 Hours<br />
Performance Normal<br />
Module 18-10<br />
Test Terminated<br />
September 1997<br />
This module contained couples from the early qualification lot. Table 11.1-2 lists the serial<br />
number and location of each couple. Also shown is the room temperature resistance at<br />
each stage of assembly and the Si 3N 4 coating weight gain during the coating process.<br />
Module 18-10 was brought up to operating temperature over a three week period in July<br />
1993. It reached 1035°C on 29 July 1993. The heat-up rate was scheduled to closely<br />
match that of the GPHS program module 18-7 (operated at 1035°C). This was done to<br />
ensure a meaningful comparison of initial power output and internal resistance with<br />
previous GPHS 18 couple modules. Matching the heat-up rate produces similar dopant<br />
precipitation effects in the SiGe components of each unicouple, which affects power
Table 11.1-2. Module 18-10 Couple Room Temperature Resistance (Milliohm) and Coating Weight<br />
Final Technical Report<br />
GPHS-RTGs for the Cassini Mission<br />
Lockheed Martin <strong>Document</strong> No. RR16<br />
August 1998<br />
Loc. Serial No. 2nd Bond Pre-assembly Unicouple Wrapped Avg of 4 Preplug Inserted Riveted Coating Run Wt. Gain, mg<br />
1. H0148 22.90 22.60 22.80 22.80 22.78 22.70 22.80 2280 7 7.57<br />
2. H0149 22.90 22.70 22.80 22.80 22.80 22.70 22.80 22.80 7 7.56<br />
3. H0150 22.80 22.50 22.60 22.70 22.65 22.60 22.65 2260 7 7.49<br />
4. H0250 2320 22.80 23.00 23.10 23.03 2320 23.05 23.05 13 7.14<br />
5. H0256 23.10 22.70 22.90 23.00 22.93 23.10 22.95 22.95 13 7.18<br />
6. H0172 22.80 2280 22.80 2320 22.90 23.50 23.35 2320 10 7.86<br />
7. H0044 23.00 22.30 2240 22.40 22.53 22.30 22.40 22.35 5 7.43<br />
8. H0145 22.50 2220 2240 22.30 22.35 22.30 22.35 2230 7 7.57<br />
9. H0113 22.50 22.30 22.50 22.50 22.40 22.40 22.45 22.40 9 7.78<br />
10. H0103 22.60 22.40 22.60 22.60 22.55 22.50 22.55 22.50 9 7.71<br />
11. H0184 22.80 22.40 22.40 2275 22.59 23.00 22.85 22.70 10 7.95<br />
12. H0146 22.70 2240 22.60 22.60 22.58 22.50 22.60 22.58 7 7.67<br />
13. H0125 22.30 22.00 2230 2220 2220 22.40 2225 2220 9 7.93<br />
14. H0290 23.10 22.20 22.60 22.60 22.62 22.90 22.65 22.70 14 8.18<br />
15. H0201 22.50 22.10 22.30 22.30 22.30 22.50 22.30 22.35 8 7.72<br />
_., 16. H0176 22.60 22.10 2260 22.50 22.45 22.60 22.50 2250 10 7.89<br />
." 6 17. H0129 22.50 22.20 22.50 22.50 22.43 22.40 22.45 22.45 9 8.02<br />
18. H0215 22.60 22.00 2240 22.50 22.38 22.30 22.40 2240 14 8.02<br />
Resistance in milliohms<br />
Statistics<br />
2nd Bond Pre-assembly Unicoupte Wrapped Avg of 4 Preplug Inserted Riveted Wt. Gain, mg<br />
Mean 22.74 22.37 22.58 22.63 22.58 22.66 22.63 22.60 7.70<br />
Std. Dev. 025 0.26 0.21 028 023 0.35 029 0.27 0.29<br />
Std. Err. 0.06 0.06 0.05 0.06 0.05 0.08 0.07 0.06 0.07<br />
95% Conf. 0.13 0.13 0.10 0.14 0.11 0.17 0.14 0.14 0.14<br />
99% Conf. 0.17 0.18 0.14 0.19 0.16 024 020 0.19 0.19<br />
Size 18.00 18.00 18.00 18.00 18.00 18.00 18.00 18.00 18.00<br />
Sum 409.40 402.70 406.50 407.35 406.44 407.90 407.35 406.83 138.67<br />
Max. 2320 22.80 23.00 23.20 23.03 23.50 23.35 2320 8.18<br />
Min. 22.30 22.00 22.30 2220 2220 22.30 2225 2220 7.14<br />
Missing 0.00 0.00 0.00 0.00 0.00 0.00 0.00 0.00 0.00
Final Technical Report<br />
GPHS-RTGs for the Cassini Mission<br />
Lockheed Martin <strong>Document</strong> No. RR16<br />
August 1998<br />
Table 11.1-3. Comparison of Initial Performance of Modules 18-10 and 18-7<br />
Module 18-7 Module 18-10<br />
Heat Input, Watts 162 162.6<br />
Hot Shoe, °C Average 1035.6 1033.4<br />
Hot Shoe Range, °C 12 7.5<br />
Cold Strap, °C Average (8 T/Cs) 293.9 285.4<br />
Cold Strap Range, °C (8 T/Cs) 9.7 9.0<br />
Cold Strap Average, °C (12 T/Cs) 290.0 280.8<br />
Cold Strap Range, °C (12 T/Cs) 21.3 19.8<br />
Load Voltage, Volts 3.504 3.501<br />
Link Voltage, Volts 0.164 0.163<br />
Current, Amps 2.520 2.596<br />
Open Circuit Voltage, Volts 6.353 6.355<br />
Normalized Open Circuits, Volts (8T/Cs) 6.293 6.239<br />
Normalized Open Circuits, Volts (12 T/Cs) 6.258 6.199<br />
Average Couple Seebeck Coefficient, Volts/K (12) 499 X 10 -6 495 X 10-6<br />
Internal Resistance, Ohms 1.065 1.041<br />
Internal Resistance Per Couple, Ohms (Avg.) 0.0592 0.0578<br />
Power Measured, Watts (Load + Link) 9.246 9.485<br />
Power Normalized, Watts (8 T/Cs) 9.072 9.142<br />
Power Normalized, Watts (12 T/Cs) 8.970 9.027<br />
Isolation<br />
Circuit to Foil, Volts -1.55 -1.86<br />
Circuit to Foil, Ohms 9.2K 18K<br />
degradation rates. A comparison of the initial performance of modules 18-10 and 18-7 is<br />
given in Table 11.1-3. Comparison of the initial normalized power output and internal<br />
resistance with the average initial values of the GPHS 18 couple modules is given in Table<br />
11.1-4. Module 18-10 performance was in excellent agreement with both 18-7 and with the<br />
average GPHS 18 couple module performance. A tabulation of the six individual row<br />
internal resistances is also shown in Table 11.1-4. All row internal resistances fell within a
Final Technical Report<br />
GPHS-RTGs for the Cassini Mission<br />
Lockheed Martin <strong>Document</strong> No. RR16<br />
August 1998<br />
Table 11.1-4. Comparison of the Initial Normalized Power Output and Internal Resistance<br />
with the Average Initial Values of the GPHS Modules<br />
1. Test Chronology<br />
• Processing Started:<br />
• Reached 1035°C:<br />
• 2,000 Hour Milestone Reached:<br />
2. 1035°C Operation<br />
18-10<br />
(t = 0)<br />
Load Voltage 3.65V<br />
9 July 1993<br />
29 July 1993<br />
26 October 1993<br />
18-10<br />
(t = 22 Hours)<br />
3.65V<br />
GPHS 18 Couple Modules<br />
(t =24 Hours)<br />
3.65V<br />
Normalized Power 9.03 W<br />
(1035°C/300°C)<br />
Internal Resistance 57.8 m C2<br />
Individual Rows (18- 10) (t = 0)<br />
Resistance - ohms<br />
1. 0.174<br />
2. 0.175<br />
3. 0.173<br />
4. 0.174<br />
5. 0.173<br />
6. 0.173<br />
Isolation Resistance<br />
Module Circuit to Foil<br />
9.06 W<br />
58.4 m<br />
Open Circuit Voltage - volts<br />
1.064<br />
1.059<br />
1.060<br />
1.063<br />
1.057<br />
1.062<br />
9.06 W (Average)<br />
Range 8.84 to 9.29 W<br />
a 0.18 W<br />
58.9 m n (Average)<br />
Range 57.2 to 61.0 m f2<br />
18 k f2 Average 12 K fl<br />
Range 8 K to 56 K<br />
2% band and open circuit voltages fell within a 0.5% band. In Table 11.1-3, two values of<br />
normalized power are shown: a normalization using all 12 cold strap thermocouples and<br />
one using the 8 cold straps closest to the hot shoe instrumentation (see Figure 11.1-1). The<br />
8 thermocouple normalization gives a more accurate average power per couple. The 12<br />
thermocouple normalization has been calculated because much of the previously published<br />
18 couple module data was reported on this basis. The normalization is to a 700°C AT<br />
(1000°C/300°C) from hot to cold junction. A 1035°C hot shoe corresponds to 1000°C hot<br />
junction. An isolation current-voltage characteristic test between the thermoelectric circuit<br />
and foil was performed. Results are plotted in Figure 11.1-2. The I-V characteristic shows<br />
the usual non-ohmic signature of the quartz yarn leg wrap. The module was held at 1035°C<br />
for approximately 100 hours and then taken up to the life test temperature of 1135°C.<br />
11-5
Final Technical Report<br />
GPHS-RTGs for the Cassini Mission<br />
Lockheed Martin <strong>Document</strong> No. RR16<br />
August 1998<br />
Figure 11.1-2. Circuit to Foil Isolation Characteristic at 1035°C (Module 18-10)<br />
The module was run at the accelerated test condition for 10,400 hours. A constant heat<br />
input was maintained throughout the test. All performance parameters were normal during<br />
the life testing and the module was shut down in October 1994 to make the vacuum<br />
chamber available for testing of another module. Initial and final test data are summarized in<br />
Figure 11-1-3 and Table 11.1-5 shows the internal resistance ratio trend for the module<br />
compared to module 18-8 which was tested during the GPHS program. The ratio is the<br />
resistance at any time divided by the initial value. Figure 11.1-4 shows the power factor<br />
ratio in comparison to module 18-8. The power factor is the open circuit voltage squared<br />
divided by the internal resistance. Agreement between the GPHS and Cassini modules<br />
was excellent and provided a high degree of confidence that the GPHS unicouple<br />
manufacturing processes were successfully replicated. The performance trends of the six<br />
individual rows and the six individual couples were monitored throughout the test. Table<br />
11.1-6 gives the initial and final internal resistance values and shows that the changes<br />
were very uniform and fell within a narrow band.<br />
11-6
Final Technical Report<br />
GPHS-RTGs for the Cassini Mission<br />
Lockheed Martin <strong>Document</strong> No. RR16<br />
August 1998<br />
1.22<br />
1.20<br />
1.18<br />
0<br />
re<br />
cc<br />
1.16<br />
1.14<br />
o 1.12<br />
cc<br />
0<br />
1 .10<br />
1.08<br />
A 18-8<br />
O 18-10<br />
✓ 18-11<br />
c7) 1.06<br />
1.04<br />
1.02<br />
1.00<br />
1000 2000 3000 4000 5000 6000 7000 8000 9000 10000 11000<br />
TIME — HOURS<br />
Figure 11.1-3. 18 Couple Module Internal Resistance Ratio Vs. Time (1135°C Operation)<br />
0<br />
a_<br />
• 0.98<br />
a_<br />
0<br />
• 0.97<br />
cc<br />
cc<br />
0 - 0.96<br />
c.)<br />
u_<br />
0<br />
a.<br />
0.95<br />
1000 2000 3000 4000 5000 6000 7000 8000 9000 10000 11000<br />
TIME — HOURS<br />
Figure 11.1-4. 18 Couple Module Power Factor Ratio Vs. Time (1135°C Operation)<br />
1 1 -7
Final Technical Report<br />
GPHS-RTGs for the Cassini Mission<br />
Lockheed Martin <strong>Document</strong> No. RR16<br />
August 1998<br />
Table 11.1-5. Comparison of Initial and 10,400 Hour Performance of Module 18-10 at 1135°C<br />
Initial<br />
8/4193<br />
t = 14,400 Hours<br />
10/19/94<br />
Heat Input, Watts 191 191.2<br />
Hot Shoe, °C Average 1136.2 1118.9<br />
Hot Shoe Range, °C 3.9 7.7<br />
Cold Strap, °C Average (8 T/Cs) 309.5 306.5<br />
Cold Strap Range, °C (8 T/Cs) 10.8 14.0<br />
Cold Strap Average, °C (12 T/Cs) 304.6 301.1<br />
Cold Strap Range, °C (12 T/Cs) 22.3 22.6<br />
Load Voltage, Volts 3.501 3.506<br />
Link Voltage, Volts 0.189 0.172<br />
Current, Amps 3.168 2.884<br />
Open Circuit Voltage, Volts 7.151 7.477<br />
Normalized Open Circuits, Volts (8T/Cs) 6.324 6.732<br />
Normalized Open Circuits, Volts (12 T/Cs) 6.284 6.686<br />
Average Couple Seebeck Coefficient, Volts/K (12) 499 X 10-6 530.6 X 10⁻⁶<br />
Internal Resistance, Ohms 1.093 1.317<br />
Internal Resistance Per Couple, Ohms (Avg.) 0.0607 0.0732<br />
Power Measured, Watts (Load + Link) 11.691 10.61<br />
Power Normalized, Watts (8 T/Cs) 9.143 8.60<br />
Power Normalized, Watts (12 T/Cs) 9.028 8.48<br />
Power Factor<br />
40.987 X 10⁻⁵ 38.48 X 10⁻⁵<br />
Isolation<br />
Circuit to Foil, Volts -1.676 -1.071<br />
Circuit to Foil, Ohms 5.22K 1.14K<br />
11-8
Table 11.1-6. Module 18-10 Internal Resistance Changes<br />
Final Technical Report<br />
GPHS-RTGs for the Cassini Mission<br />
Lockheed Martin <strong>Document</strong> No. RR16<br />
August 1998<br />
Position Serial # 2nd Bond<br />
Milliohm<br />
Press sy<br />
Milliohm<br />
ARi<br />
Milliohm<br />
T = 0<br />
Milliohm<br />
T=1,500<br />
Hours<br />
ARi<br />
Milliohm<br />
Percent<br />
Increase<br />
T=10391<br />
Hours<br />
IRi<br />
Milliohm<br />
Percent<br />
Increase<br />
1 H0148 22.90 22.60 -0.30<br />
2 H0149 22.90 22.70 -0.20<br />
3 H0150 22.80 22.50 -0.30<br />
183.00 198.70 15.70 8.60 220.4 37.4 20.4<br />
4 H0250 23.20 22.80 -0.40 61.60 66.80 5.20 8.40 73.9 12.3 20.0<br />
5 H0256 23.10 22.70 -0.40 61.60 67.00 5.40 8.80 74.0 12.4 20.1<br />
6 H0172 22.80 22.80 0.00 61.20 66.90 5.70 9.30 73.9 12.7 20.8<br />
184.00 200.00 16.00 8.70 221.1 37.1 20.2<br />
7 H0044 23.00 22.30 -0.70<br />
8 H0145 22.50 22.20 -0.30<br />
9 H0113 22.50 22.30 -0.20<br />
181.00 197.60 16.60 9.20 218.6 37.6 20.8<br />
10 H0103 22.60 22.40 -0.20<br />
11 H0184 22.80 22.40 -0.40<br />
12 H0146 22.70 22.40 -0.30<br />
183.00 198.60 15.60 8.50 219.6 36.6 20.0<br />
13 H0125 22.30 22.00 -0.30 60.00 65.80 5.80 9.70 72.9 12.9 21.5<br />
14 H0290 23.10 22.20 -0.90 61.20 66.80 5.60 9.20 73.9 12.7 20.8<br />
15 H0201 22.50 22.10 -0.40 60.90 66.70 5.80 9.50 73.8 12.9 21.2<br />
182.00 198.70 16.70 9.20 219.9 37.9 20.8<br />
16 H0176 22.60 22.10 -0.50<br />
17 H0129 22.50 22.20 -0.30<br />
18 H0215 22.60 22.00 -0.60<br />
182.00 198.60 16.60 9.10 219.7 37.7 20.7<br />
The isolation resistance trend between the thermoelectric circuit and the foil is shown in<br />
Figure 11.1-5 with modules from the MHW and GPHS programs. At the accelerated<br />
temperature of 1135°C, the same amount of sublimation occurs in about 1,650 hours as<br />
would occur in a 16 year Cassini mission. This takes into account the decrease in hot<br />
junction temperature during the mission. Consequently, during the module life test about<br />
six times as much sublimation has occurred as will occur during the Cassini mission. The<br />
module isolation resistance trend fell within the GPHS data base and, therefore, confirmed<br />
the adequacy of the silicon nitride coating on the early qualification couples.<br />
Module 18-11<br />
Assembly of module 18-11 was completed in December 1993. This module contained<br />
unicouples selected from the qualification lot of unicouples, built prior to the E-6 converter<br />
production lot. Table 11.1-7 lists, for each couple, the location, serial number, room<br />
temperature resistances during assembly and the Si 3N 4 coating weight gain.<br />
11-9
Final Technical Report<br />
GPHS-RTGs for the Cassini Mission<br />
Lockheed Martin <strong>Document</strong> No. RR16<br />
August 1998<br />
Figure 11.1-5. Isolation Resistance - Module Circuit to Foil<br />
(18-11, 18-10, GPHS 18-8 and MHW Modules) - 1135°C Operation<br />
The module was brought up to temperature in the same manner as previously described for<br />
18-10. Data were taken at 1035°C for comparison with GPHS module 18-7 and module<br />
18-10 as shown in Table 11.1-8. The performance parameters for all three modules fell<br />
within a very narrow band. The module was tested at 1035°C for 140 hours and then taken<br />
up to the 1135°C accelerated test condition for life testing. Life testing with constant heat<br />
input was carried out for 30,709 hours until the module was shut down in September 1997.<br />
Internal resistance and power factor trends are shown in Figures 11.1-6 and 11.1-7,<br />
respectively. Performance was in good agreement with GPHS module 18-8 and module<br />
18-10. Initial and final performance is given in Table 11.1-9.
Final Technical Report<br />
GPHS-RTGs for the Cassini Mission<br />
Lockheed Martin <strong>Document</strong> No. RR16<br />
August 1998<br />
Table 11.1-7. Internal Resistance and Si 3N4 Coating Weight of Couples<br />
Selected for Module 18-11<br />
2nd Bond Preassembly Unicouple Wrapped Avg. of 4 Weight Gain Coat Run<br />
Position Serial # Milliohm Milliohm Milliohm Milliohm Milliohm Milligrams No.<br />
1 H2006 22.50 22.10 22.30 22.60 22.38 7.17 104<br />
2 H0507 22.40 21.90 22.40 22.30 22.25 7.24 21<br />
3 H0512 22.70 22.20 22.70 22.60 22.55 7.28 21<br />
4 H0439 23.20 22.70 22.40 22.20 22.38 7.65 31<br />
5 H0587 22.50 22.40 22.70 22.70 22.58 7.41 24<br />
6 H0657 22.70 22.50 22.60 22.80 22.65 7.49 32<br />
7 H0585 22.90 22.70 22.60 22.70 22.68 7.48 24<br />
8 H0459 22.50 22.10 22.50 22.70 22.45 7.53 27<br />
9 H0562 22.70 22.30 22.60 23.00 22.65 7.57 23<br />
10 H0248 22.70 22.30 22.80 22.70 22.63 7.78 15<br />
11 H0163 22.90 22.40 23.00 22.90 22.80 7.96 8<br />
12 H0282 22.70 22.40 22.70 22.40 22.55 8.07 14<br />
13 H0328 22.90 22.30 22.90 22.80 22.73 7.48 18<br />
14 H0326 22.60 22.00 22.60 22.70 22.48 7.57 18<br />
15 H0232 22.60 22.00 22.60 22.30 22.38 7.82 17<br />
16 H0590 22.60 22.40 22.60 22.70 22.58 7.73 24<br />
17 H0393 22.60 22.10 22.40 22.70 22.45 7.71 102<br />
18 H0496 22.50 22.30 22.50 22.70 22.55 7.67 22<br />
Statistics<br />
Mean 22.68 22.28 22.61 22.64 22.54 7.59<br />
Std. Dev. 0.20 0.23 0.18 0.21 0.14 0.24<br />
Std. Err. 0.05 0.05 0.04 0.05 0.03 0.06<br />
95% Conf. 0.10 0.11 0.09 0.11 0.07 0.12<br />
99% Conf. 0.13 0.15 0.12 0.14 0.10 0.16<br />
Sum 408.20 401.10 406.90 407.50 405.68 136.61<br />
Max. 23.20 22.70 23.00 23.00 22.80 8.07<br />
Min. 22.40 21.90 22.30 22.20 22.25 7.17
Final Technical Report<br />
GPHS-RTGs for the Cassini Mission<br />
Lockheed Martin <strong>Document</strong> No. RR16<br />
August 1998<br />
Table 11.1-8. Comparison of Initial Performance at 1035°C of Modules 18-7, 18-10, and 18-11<br />
Module 18-7 Module 18-10 Module 18-11<br />
Heat Input, Watts 162 162.6 163.4<br />
Hot Shoe, °C Average 1035.6 1033.4 1034.6<br />
Hot Shoe Range, °C 12 7.5 5.7<br />
Cold Strap, °C Average (8 T/Cs) 293.9 285.4 291.5<br />
Cold Strap Range, °C (8 T/Cs) 9.7 9.0 1.6<br />
Cold Strap Average, °C (12 T/Cs) 290.0 280.8 286.9<br />
Cold Strap Range, °C (12 T/Cs) 21.3 19.8 19.1<br />
Load Voltage, Volts 3.504 3.501 2.504<br />
Link Voltage, Volts 0.164 0.163 0.096<br />
Current, Amps 2.520 2.596 2.586<br />
Open Circuit Voltage, Volts 6.353 6.355 6.381<br />
Normalized Open Circuits, Volts (8T/Cs) 6.293 6.239 6.308<br />
Normalized Open Circuits, Volts (12 T/Cs) 6.258 6.199 6.297<br />
Average Couple Seebeck Coefficient, 499 X 10-6 495 X 10-6 497 X 10-6<br />
Volts/K (12)<br />
Internal Resistance, Ohms 1.065 1.041 1.075<br />
Internal Resistance Per Couple, Ohms 0.0592 0.0578 0.0597<br />
(Avg.)<br />
Power Measured, Watts (Load + Link) 9.246 9.485 9.311<br />
Power Normalized, Watts (8 T/Cs) 9.072 9.142 9.099<br />
Power Normalized, Watts (12 T/Cs) 8.970 9.027 8.981<br />
Power Factor<br />
41.67 X 10⁻⁶ 41.88 X 10⁻⁶ 41.42 X 10⁻⁵<br />
Isolation<br />
Circuit to Foil, Volts -1.55 -1.86 -1.66<br />
Circuit to Foil, Ohms 9.2K 18K 24.5K<br />
11-12
•<br />
Final Technical Report<br />
GPHS-RTGs for the Cassini Mission<br />
Lockheed Martin <strong>Document</strong> No. RR16<br />
August 1998<br />
1.40<br />
1.36<br />
1.32<br />
1.28<br />
1.24<br />
1.20<br />
1.16<br />
1.12<br />
1.08<br />
A GPHS MODULE 18-8<br />
O GPHS MODULE 18-10<br />
✓ GPHS MODULE 18-11<br />
1.02<br />
1.00<br />
0<br />
u_<br />
a. 0.98<br />
0_ 0.96<br />
0<br />
I=<br />
0.94<br />
IX 0.92<br />
0<br />
I-<br />
0 0.90<br />
u_<br />
Ct 0.88<br />
1.04<br />
1.00<br />
0 5000 10000 15000 20000 25000 30000 35000<br />
TIME, HOURS<br />
Figure 11.1-6. Internal Resistance Ratio Vs. Time<br />
(Modules 18-10, 18-11, GPHS Module 18-8) - 1135°C Operation<br />
O 0.86<br />
0.84<br />
GPHS MODULE 18-8<br />
CASSINI MODULE 18-10<br />
---6-- CASSINI MODULE 18-11<br />
0.82<br />
0 5000 10000 15000 20000 25000<br />
TIME, HOURS<br />
30000 35000<br />
Figure 11.1-7. Power Factor Ratio Vs. Time<br />
(18-10, 18-11, GPHS Module 18-8) - 1135°C Operation<br />
11-13
Final Technical Report<br />
GPHS-RTGs for the Cassini Mission<br />
Lockheed Martin <strong>Document</strong> No. RR16<br />
August 1998<br />
Table 11.1-9. Comparison of Initial and 30,709 Hour Performance of<br />
Module 18-11 at 1135°C<br />
Initial<br />
2/2/94<br />
t = 52 Hours<br />
VL = 3.5V<br />
2/ 4/94<br />
t = 30,709<br />
Hours<br />
9/1 0/97<br />
Heat Input, Watts 190 192.9 193.2<br />
Hot Shoe, °C Average 1137.8 1137.5 1106.0<br />
Hot Shoe Range, °C 5.4 5.2 10.7<br />
Cold Strap, °C Average (8 T/Cs) 311.9 314.3 303.6<br />
Cold Strap Range, °C (8 T/Cs) 2.6 2.5 2.1<br />
Cold Strap Average, °C (12 T/Cs) 306.5 308.9 298.7<br />
Cold Strap Range, °C (12 T/Cs) 20.1 20.3 18.0<br />
Load Voltage, Volts 3.895 3.499 3.49<br />
Link Voltage, Volts 0.108 0.121 0.092<br />
Current, Amps 2.842 3.174 2.619<br />
Open Circuit Voltage, Volts 7.140 7.160 7.599<br />
Normalized Open Circuits, Volts (8T/Cs) 6.319 6.359 6.941<br />
Normalized Open Circuits, Volts (12 T/Cs) 6.276 6.316 6.888<br />
Avg. Couple Seebeck Coefficient, Volts/K (12) 498 X 10-6 501 X 10 -6 546.7 X 10⁻⁶<br />
Internal Resistance, Ohms 1.104 1.115 1.533<br />
Internal Resistance Per Couple, Ohms (Avg.) 0.0613 0.0620 0.0852<br />
Power Measured, Watts (Load + Link) 11.375 11.492 9.39<br />
Power Normalized, Watts (8 T/Cs) 8.909 9.065 7.81<br />
Power Normalized, Watts (12 T/Cs) 8.789 8.942 7.71<br />
Power Factor<br />
40.452 X 10 -5 40.557 X 10⁻⁵ 35.1 X 10⁻⁵<br />
Isolation<br />
Circuit to Foil, Volts -1.68 -1.36 -1.71<br />
Circuit to Foil, Ohms 6.29K 5.95K 0.318K
Final Technical Report<br />
GPHS-RTGs for the Cassini Mission<br />
Lockheed Martin <strong>Document</strong> No. RR16<br />
August 1998<br />
Module 18-11 accumulated the longest test time at accelerated temperatures of any SiGe<br />
module ever tested. Significant sublimation at the hot junction became evident from an<br />
increase in the slope of the internal resistance and power factor. The slope change which<br />
developed in the last few thousand hours was expected as a normal consequence of a<br />
reduced cross sectional area at the hot junction region. A 100°C increase in temperature<br />
provides an acceleration factor of approximately 20. Consequently, the 30,000 hour<br />
accelerated test is equivalent to approximately 600,000 hours (68 years) at a nominal<br />
1035°C design temperature. Table 11.1-10 shows the internal resistance changes of the<br />
rows and individual couples. It is seen that the range has widened considerably, with<br />
couple number 15 showing the largest increase.<br />
Table 11.1 -10. Module 18-11 Internal Resistance Changes<br />
Position Serial # 2ncl Bond<br />
Milliohm<br />
Preassy<br />
Milliohm<br />
ARi<br />
Milliohm<br />
T = 0<br />
Milliohm<br />
T=1,509<br />
Hours<br />
iRi<br />
Milliohm<br />
Percent<br />
Increase<br />
T=30,709<br />
Hours<br />
A R i<br />
Milliohm<br />
Percent<br />
Increase<br />
1 H2006 22.50 22.10 -0.40<br />
2 H0507 22.40 21.90 -0.50<br />
3 H0512 22.7 22.20 -0.50<br />
182.30 199.70 17.40 9.54 252.60 70.30 38.56<br />
4 H0439 23.20 22.70 -0.50 62.30 67.90 5.60 8.99 86.40 24.10 38.68<br />
5 H0587 22.50 22.40 -0.10 61.00 66.50 5.50 9.02 82.20 21.20 34.75<br />
6 H0657 22.70 22.50 -0.20 61.40 67.30 5.90 9.61 83.60 22.20 36.16<br />
184.10 201.10 17.00 9.23 251.40 67.30 36.56<br />
7 H0585 22.90 22.50 -0.40<br />
8 H0459 22.50 22.10 -0.40<br />
9 H0562 22.70 22.30 -0.40<br />
10 H0248 22.70 22.30 -0.40<br />
11 H0163 22.90 22.40 -0.50<br />
12 H0282 22.70 22.40 -0.30<br />
185.70 203.20 17.50 9.42 265.50 79.80 42.97<br />
184.90 201.70 16.80 9.09 253.70 68.80 37.21<br />
13 H0428 23.10 22.70 -0.40 62.10 67.90 5.80 9.34 85.00 22.90 36.88<br />
14 H0326 22.60 22.00 -0.60 62.20 68.30 6.10 9.81 87.30 25.10 40.35<br />
15 H0232 22.60 22.00 -0.60 60.90 66.60 5.70 9.36 89.70 28.80 47.29<br />
184.70 202.30 17.60 9.53 261.30 76.60 41.47<br />
16 H0590 22.60 22.40 -0.20<br />
17 H0393 22.60 22.10 -0.50<br />
18 H0496 22.50 22.30 -0.20<br />
184.20 201.40 17.20 9.34 250.10 66.80 36.27<br />
The isolation resistance trend between the thermoelectric circuit and the foil is shown in<br />
Figure 11.1-8 along with modules from the MHW and GPHS programs. The isolation<br />
resistance plateaued at about 1000 ohms between 6,000 and 7,000 hours. It then started a<br />
slow decrease to 324 ohms at the end of testing. A similar plateau and gradual decline were<br />
observed in MHW module SN-1. At the accelerated temperature of 1135°C the same
Final Technical Report<br />
GPHS-RTGs for the Cassini Mission<br />
Lockheed Martin <strong>Document</strong> No. RR16<br />
August 1998<br />
Figure 11.1-8. Isolation Resistance - Module Circuit to Foil<br />
(18-10, 18-11, GPHS Module 18-8) - 1135°C Operation<br />
amount of sublimation occurs in about 1,650 hours of testing as would occur in a 16-year<br />
Cassini mission, taking into account the drop in hot junction temperature throughout the<br />
mission.<br />
Consequently, approximately 18.6 times as much sublimation had occurred during the test<br />
duration of module 18-11 as will occur during the Cassini mission. The module<br />
performance, therefore, confirmed the adequacy of the silicon nitride coating on the<br />
qualification unicouples.<br />
Module 18-12<br />
Assembly of module 18-12 was completed in May 1994 . The unicouples were selected<br />
from the flight production lots (from the balance of E-6 production units not used in the E-6<br />
thermopile and the early E-7 production lot). Six couples were from the E-6 lot and 12 from<br />
the E-7 lot.<br />
Table 11.1-11 lists for each couple the location, serial number, room temperature<br />
resistances during assembly and the Si 3N 4 coating weight gain.<br />
11-16
Final Technical Report<br />
GPHS-RTGs for the Cassini Mission<br />
Lockheed Martin <strong>Document</strong> No. RR16<br />
August 1998<br />
Table 11.1-11. Module 18-12, Couple Room Temperature Resistance (Milliohm) and Coating Weight<br />
Loc. Serial No. 2nd Bond Pre•assembly Unicouple Wrapped Avg of 4 Preplug Inserted Riveted Coating Run Wt. Gain, mg<br />
1. 00H2594 23.80 2290 23.40 23.30 23.35 23.40 23.36 23.35 135 7.46<br />
2. 00H2634 22.70 22.60 22.80 22.90 22.75 22.90 22.82 22.83 139 7.50<br />
3. 00H2606 23.50 22.40 22.90 22.80 22.90 22.84 22.82 22.81 137 7.50<br />
4. 00H2168 2220 21.70 22.20 22.00 22.03 22.36 22.41 22.41 111 8.07<br />
5. 00H2151 22.40 21.90 22.00 22.30 22.15 22.37 22.35 22.34 112 7.72<br />
6. 00H2256 2220 21.70 22.40 22.30 22.15 2225 2226 22.26 114 8.36<br />
7. 00H2597 24.40 23.20 23.90 23.80 23.83 23.80 23.79 23.78 135 7.71<br />
8. 00H2680 22.60 23.00 23.10 2320 22.98 2320 23.11 23.11 141 8.01<br />
9. 00H2658 22.70 23.00 22.90 23.00 22.90 23.03 23.03 23.04 140 7.72<br />
10. 00H1506 23.50 23.20 23.00 23.70 23.35 23.63 23.59 23.59 81 7.58<br />
11. 00H1392 23.80 23.00 23.30 23.80 23.48 23.65 23.60 23.60 74 7.77<br />
12. 00H1606 23.60 22.60 22.90 23.40 23.13 23.12 23.09 23.08 85 829<br />
13. 00H1344 23.60 23.50 23.90 23.60 23.65 23.73 23.76 23.76 71 828<br />
14. 00H1618 23.30 24.00 23.10 23.10 23.38 23.08 23.13 23.13 85 7.86<br />
15. 00H1262 23.70 23.30 23.90 23.80 23.68 24.03 24.05 24.06 67 7.81<br />
16. 00H1580 23.00 23.70 22.60 23.00 23.08 22.73 22.76 22.76 86 7.77<br />
17. 00H2127 22.80 22.10 23.40 22.80 22.78 22.78 22.77 22.77 63 7.97<br />
18. 00H2113 22.90 2220 23.50 22.80 22.85 22.86 22.82 22.80 111 826<br />
Resistance in milliohms<br />
Statistics<br />
2nd Bond Pre-assembly Unicouple Wrapped Avg of 4 Preplug Inserted Riveted Wt. Gain, mg<br />
Mean 23.1500 22.7778 23.0667 23.0889 23.0233 23.0978 23.0844 23.0822 7.8689<br />
Std. Dev. 0.6261 0.6752 0.5562 0.5444 0.5284 0.5229 0.5189 0.5203 0.2897<br />
Std. Err. 0.1476 0.1592 0.1311 0.1283 0.1245 0.1232 0.1223 0.1226 0.0683<br />
95% Conf. 0.3114 0.3358 0.2766 02707 02628 02600 02581 0.2588 0.1441<br />
99% Conf. 0.4278 0.4613 0.3800 0.3719 0.3610 0.3572 0.3545 0.3555 0.1979<br />
Size 18.0000 18.0000 18.0000 18.0000 18.0000 18.0000 18.0000 18.0000 18.0000<br />
Total 416.7000 410.0000 415.2000 415.6000 414.4200 415.7600 415.5200 415.4800 141.6400<br />
Min. 22.2000 21.7000 22.0000 22.0000 22.0300 22.2500 222600 222600 7.4600<br />
Max. 24.4000 24.000 23.9000 23.8000 23.8300 24.0300 24.0500 24.0600 8.3600<br />
Min. Pos. 22.2000 21.7000 22.0000 22.0000 22.0300 222500 22.2600 222600 7.4600
Final Technical Report<br />
GPHS-RTGs for the Cassini Mission<br />
Lockheed Martin <strong>Document</strong> No. RR16<br />
August 1998<br />
The module was brought up to temperature in the same manner as previously described for<br />
18-10. Data were taken at 1035°C for comparison with GPHS module 18-7 and Cassini<br />
modules 18-10 and 18-11 as shown in Table 11.1-12. The performance parameters for all<br />
four modules fell within a very narrow band. The module was life tested at a constant heat<br />
input with an initial average hot shoe temperature of 1035°C. Life testing continued for<br />
26,817 hours until it was shut down in September 1997. Internal resistance and power<br />
factor trends are shown in Figures 11.1-9 and 11.1-10, respectively. Performance was in<br />
good agreement with GPHS module 18-8 and module 18-10. Initial and final performance<br />
are given in Table 11.1-13. The resistance changes of individual rows and couples are<br />
shown in Table 11.1-14. Figure 11.1-11 shows the resistance trends of the six individually<br />
instrumented couples. All resistances fell within a narrow band indicating excellent<br />
manufacturing reproducibility and uniform aging effects.<br />
The isolation resistance trend between the thermoelectric circuit and the foil is shown in<br />
Figure 11.1-12 along with modules from the MHW and GPHS programs. The isolation<br />
resistance was still increasing at the end of the life test. This trend indicates the<br />
effectiveness of the Si3 N4 coating.<br />
11.1.2 Assembly Process<br />
A summary follows of issues/problems which arose during fabrication and assembly of 18<br />
couple modules 18-10, 18-11, and 18-12.<br />
The first problem occurred early in the fabrication of molybdenum foil and Astroquartz<br />
panels. Panels for all four modules were being made simultaneously. The size and<br />
location of the six square holes were out of tolerance per drawing requirements. Existing<br />
tooling was worn out and not efficient, having to punch one hole at a time, moving from one<br />
location to another. Manufacturing Engineering opted to utilize converter tooling to punch<br />
three holes at a time, only having to move the panels one time for the other three holes.<br />
This required the following: 1) two punches were removed from the punch and die set for<br />
clearance, and 2) a set of stops were fabricated for the correct offset needed. This was<br />
directly related to where each respective panel fit in different levels of the foil insulation<br />
assembly. Panel fabrication went extremely fast with a full complement of approved panels.
Table 11.1-12. Comparison of Initial Performance at 1035°C of<br />
Modules 18-7, 18-10, 18-11, and 18-12<br />
Final Technical Report<br />
GPHS-RTGs for the Cassini Mission<br />
Lockheed Martin <strong>Document</strong> No. RR16<br />
August 1998<br />
Module<br />
18-7<br />
Module<br />
18-10<br />
Module<br />
18-11<br />
Module<br />
18-12<br />
Heat Input, Watts 162 162.6 163.4 169.15<br />
Hot Shoe, °C Average 1035.6 1033.4 1034.6 1035.9<br />
Hot Shoe Range, °C 12 7.5 5.7 5.7<br />
Cold Strap, °C Average (8 T/Cs) 293.9 285.4 291.5 287.1<br />
Cold Strap Range, °C (8 T/Cs) 9.7 9.0 1.6 5.0<br />
Cold Strap Average, °C (12 T/Cs) 290.0 280.8 286.9 282.7<br />
Cold Strap Range, °C (12 T/Cs) 21.3 19.8 19.1 19.8<br />
Load Voltage, Volts 3.504 3.501 2.504 3.578<br />
Link Voltage, Volts 0.164 0.163 0.096 0.155<br />
Current, Amps 2.520 2.596 2.586 2.548<br />
Open Circuit Voltage, Volts 6.353 6.355 6.381 6.431<br />
Normalized Open Circuits, Volts (8T/Cs) 6.293 6.239 6.308 6.307<br />
Normalized Open Circuits, Volts (12 T/Cs) 6.258 6.199 6.297 6.268<br />
Average Couple Seebeck Coefficient, 499 X 10-6 495 X 10-6 497 X 10-6 497 X 10-6<br />
Volts/K (12)<br />
Internal Resistance, Ohms 1.065 1.041 1.075 1.053<br />
Internal Resistance Per Couple, Ohms 0.0592 0.0578 0.0597 0.0588<br />
(Avg.)<br />
Power Measured, Watts (Load + Link) 9.246 9.485 9.311 9.510<br />
Power Normalized, Watts (8 T/Cs) 9.072 9.142 9.099 9.146<br />
Power Normalized, Watts (12 T/Cs) 8.970 9.027 8.981 8.011<br />
Power Factor 41.67 X 10⁻⁵ 41.88 X 10⁻⁵ 41.42 X 10⁻⁵ 42.06 X 10⁻⁵<br />
Isolation<br />
Circuit to Foil, Volts -1.55 -1.86 -1.66 -1.71<br />
Circuit to Foil, Ohms 9.2K 18K 24.5K 21.3K
Final Technical Report<br />
GPHS-RTGs for the Cassini Mission<br />
Lockheed Martin <strong>Document</strong> No. RR16<br />
August 1998<br />
1.33<br />
1.30<br />
1.27<br />
1.24<br />
1.21<br />
1.18<br />
1.15<br />
1.12<br />
1.09<br />
1.06<br />
1.03<br />
GPHS MODULE 18-7<br />
0 CASSINI MODULE 18-12<br />
1.00<br />
0 3000 6000 9000 12000 15000 18000 21000 24000 27000<br />
TIME, HOURS<br />
Figure 11.1-9. Internal Resistance Ratio Vs. Time<br />
(Modules 18-12 and 18-7) - 1035°C Operation<br />
1.01<br />
1.00<br />
0.99<br />
0.98<br />
A GPHS MODULE 18-7<br />
0 CASSINI MODULE 18-12<br />
0.97<br />
0.96<br />
0.95<br />
0.94<br />
0.93<br />
0.92<br />
0.91<br />
0.90<br />
0.89<br />
0 3000 6000 9000 12000 15000 18000 21000 24000 27000<br />
TIME, HOURS<br />
Figure 11.1-10. Power Factor Ratio Vs. Time at Temperature<br />
(Modules 18-7 and 18-12) - 1035°C Operation<br />
11-20
Final Technical Report<br />
GPHS-RTGs for the Cassini Mission<br />
Lockheed Martin <strong>Document</strong> No. RR16<br />
August 1998<br />
Table 11.1-13. Comparison of Initial and 26,817 Hour Performance of<br />
Module 18-12 at 1135°C<br />
Initial<br />
6/16/94<br />
t = 26,817<br />
Hours<br />
9/11/97<br />
Heat Input, Watts 169.15 169.1<br />
Hot Shoe, °C Average 1035.9 1022<br />
Hot Shoe Range, °C 5.7 4.0<br />
Cold Strap, °C Average (8 T/Cs) 287.1 278.4<br />
Cold Strap Range, °C (8 T/Cs) 5.0 4.7<br />
Cold Strap Average, °C (12 T/Cs) 282.7 274.1<br />
Cold Strap Range, °C (12 T/Cs) 19.8 19.1<br />
Load Voltage, Volts 3.578 3.498<br />
Link Voltage, Volts 0.155 0.152<br />
Current, Amps 2.548 2.412<br />
Open Circuit Voltage, Volts 6.431 6.931<br />
Normalized Open Circuits, Volts (8T/Cs) 6.307 6.842<br />
Normalized Open Circuits, Volts (12 T/Cs) 6.268 6.801<br />
Average Couple Seebeck Coefficient, 497 X 10-6 539.8 X 10⁻⁶<br />
Volts/K (12)<br />
Internal Resistance, Ohms 1.053 1.360<br />
Internal Resistance Per Couple, Ohms 0.0588 0.0755<br />
(Avg.)<br />
Power Measured, Watts (Load + Link) 9.510 8.81<br />
Power Normalized, Watts (8 T/Cs) 9.146 8.58<br />
Power Normalized, Watts (12 T/Cs) 9.011 8.46<br />
Power Factor 42.06 X 10⁻⁵ 38.57 X 10 -5<br />
Isolation<br />
Circuit to Foil, Volts -1.71 -0.87<br />
Circuit to Foil, Ohms 21.3K 188.2K<br />
11-21
Final Technical Report<br />
GPHS-RTGs for the Cassini Mission<br />
Lockheed Martin <strong>Document</strong> No. RR16<br />
August 1998<br />
Table 11.1-14. Module 18-12 Internal Resistance Changes<br />
Position Serial # 2nd Bond<br />
Milliohm<br />
Preassy<br />
Milliohm<br />
ARi<br />
Milliohm<br />
T = 0<br />
Milliohm<br />
T=1,505<br />
Hours<br />
AR i<br />
Milliohm<br />
Percent<br />
Increase<br />
T=26,817<br />
Hours<br />
ARi<br />
Milliohm<br />
Percent<br />
Increase<br />
1 H2594 23.80 22.90 -0.90<br />
2 H2634 22.70 22.60 -0.10<br />
3 H2606 23.50 22.40 -1.10<br />
176.80 192.10 15.30 8.65 224.60 47.80 27.04<br />
4 H2168 22.20 21.70 -0.50 57.50 63.30 5.80 10.09 74.90 17.40 30.26<br />
5 H2151 22.40 21.90 -0.50 57.40 62.90 5.50 9.58 74.00 16.60 28.92<br />
6 H2256 22.20 21.70 -0.50 57.00 63.10 6.10 10.70 74.90 17.90 31.40<br />
171.20 188.60 17.40 10.16 222.90 51.70 30.20<br />
7 H2597 24.40 23.20 -1.20<br />
8 H2680 22.60 23.00 0.40<br />
9 H2658 22.70 23.00 0.30<br />
10 H1506 23.50 23.20 -0.30<br />
11 H1392 23.80 23.00 -0.80<br />
12 H1606 23.60 22.60 -1.00<br />
178.00 193.60 15.60 8.76 226.10 48.10 27.02<br />
176.20 193.40 17.20 9.76 227.00 50.80 28.83<br />
13 H1344 23.60 23.50 -0.10 59.20 64.80 5.60 9.46 75.90 16.70 28.21<br />
14 H1618 23.30 24.00 0.70 58.60 64.50 5.90 10.07 76.00 17.40 29.69<br />
15 H1262 23.70 23.30 -0.40 59.40 65.00 5.60 9.43 76.20 16.80 28.28<br />
176.60 193.70 17.10 9.68 227.50 50.90 28.82<br />
16 H1580 23.00 23.70 0.70<br />
17 H2127 22.80 22.10 -0.70<br />
18 H2113 22.90 22.20 -0.70<br />
174.50 191.30 16.80 9.63 224.90 50.40 28.88<br />
couple<br />
number<br />
11-4-94 shutdow<br />
TIME - HOURS<br />
Figure 11.1-11. Individual Unicouple Internal Resistance Trends (Module 18-12)<br />
11-22
Final Technical Report<br />
GPHS-RTGs for the Cassini Mission<br />
Lockheed Martin <strong>Document</strong> No. RR16<br />
August 1998<br />
MHW SN-3<br />
MHW SN-6<br />
GPHS 18-4<br />
GPHS 18-7<br />
18-12 CASSINI<br />
Figure 11.1-12. Isolation Resistance - Module Circuit to Foil<br />
(18-12, GPHS and MHW Modules) - 1035°C Operation<br />
Module 18-10— During assembly of this module, it was determined that four unicouples<br />
had to be replaced. Damage to these unicouples was suspected, identified from increased<br />
unicouple resistances. After researching the rivet removal process and tooling, a decision<br />
was made to alter both. Upon approving the process change, addition of tooling, and<br />
training personnel, the unicouples were successfully removed. Evaluation of the damaged<br />
unicouples showed fractures in the N-segment in three of the four assemblies.<br />
Investigations were conducted to determine the cause of failures. Two significant tooling<br />
modifications were made. First, a rivet gun alignment tool was added to control both rivet<br />
orientation and loading of the electrical connectors during riveting. Second, a manual tool<br />
for swaging the pop rivets was replaced by a pneumatic tool. Both of these tools had been<br />
used in the GPHS program but not identified in the 18 couple module manufacturing<br />
planning instructions. Both tools were added to the planning master.<br />
Module 18-11—Prior to riveting operations on this module, pneumatic rivet guns were<br />
purchased and qualified. These guns eliminated the torquing motion experienced with the<br />
11-23
Final Technical Report<br />
GPHS-RTGs for the Cassini Mission<br />
Lockheed Martin <strong>Document</strong> No. RR16<br />
August 1998<br />
electric rivet gun cycle. One hot side thermocouple, attached to the hot shoe of a unicouple,<br />
was found to be open during assembly of 18-10. At Material Review Board (MRB) direction,<br />
the opened thermocouple was not replaced as the remaining five provided adequate<br />
measurement redundancy. During potting of the module's instrumentation leads into a<br />
50-pin connector, one of three voltage sensing leads was damaged. A jumper was installed<br />
in the vacuum test station to provide the necessary connections for the test rack.<br />
Module 18- /2—Prior to assembly of this module, a series of drawing and assembly<br />
process changes were made to correct errors encountered during fabrication of modules<br />
18-10 and 18-11. No significant problems occurred during this assembly.<br />
11.1.3 Improved Thermoelectric Materials and Test Results<br />
The objective of this task was to fabricate an improved performance unicouple and to<br />
evaluate its performance in an 18 couple test module. The 18 couple module is a proven<br />
test device to determine unicouple performance relative to the database for standard coarse<br />
grain SiGe prepared for the Galileo/Ulysses and Cassini RTG programs with tests typically<br />
spanning over 10,000 hours. Details of the improved materials selection, unicouple<br />
fabrication, predicted and actual 18 couple module performance, and results of post test<br />
analyses are provided in the Cassini topical report entitled "Evaluation of an Improved<br />
Performance Unicouple" (Reference 11.1.3-1).<br />
Improved N-type and P-type 78 atomic % SiGe thermoelectric materials were prepared at<br />
Ames Laboratory and Lockheed Martin, respectively. The N-type material was prepared by<br />
mechanical alloying Si, Ge, GaP and the P dopant followed by hot isostatic pressing. This<br />
method produced materials with a more controlled composition and microstructure. The N-<br />
type composition was Si0.784Ge0.196Ga0.005P0.015' The P-type material was prepared by<br />
vacuum casting Si, Ge and the B dopant and double hot pressing. Double hot pressing<br />
refers to crushing a hot pressed SiGe puck and then re-pressing to produce finer grain size<br />
and more uniform composition than standard Cassini materials. The P-type composition<br />
was Si 0.796Ge0.199 E30.005 .<br />
The new materials and the standard coarse grain Cassini SiGe materials were<br />
characterized by room temperature Hall effect and high temperature thermoelectric<br />
properties including the Seebeck coefficient, electrical resistivity and thermal conductivity.<br />
11-24
Final Technical Report<br />
GPHS-RTGs for the Cassini Mission<br />
Lockheed Martin <strong>Document</strong> No. RR16<br />
August 1998<br />
The figure-of-merit improvement for the N-type material was 10% and 20% for the P-type<br />
material. The improvements in the figure-of-merit over standard SiGe were primarily due to<br />
a reduction in the thermal conductivity associated with a smaller grain size.<br />
Standard Cassini processes were used to fabricate the improved unicouples except that a<br />
two stage process was developed for bonding the improved SiGe materials to the SiMo hot<br />
shoe due to the disparity in melting temperature of the improved materials. The optimum<br />
bonding temperatures were 1321°C for the improved P-type material and 1248°C for the<br />
improved N-type material. Blisters or solidified regions of previously melted material were<br />
preferentially located near the hot end of the GaP-containing N-type leg. Prior to silicon<br />
nitride coating, these blisters were mechanically removed. Many small blisters ruptured<br />
through the silicon nitride coating during the next bonding process in which the 63.5 atomic<br />
"Yo SiGe segments were bonded to the 78% SiGe legs. Accelerated weight loss<br />
experiments at 1150°C indicated that the sublimation rate was 2 to 3 times higher than for<br />
typical Cassini unicouples, however, within Cassini specification requirements. Two<br />
unicouples successfully passed a rivet test to verify that the bond between the segment and<br />
cold shoe would be strong enough to withstand loads introduced during 18 couple module<br />
assembly operations.<br />
An 18 couple module, designated 18-Z, was assembled and put on ingradient life test for<br />
2000 hours at cold side and hot side temperatures of 300°C and 1035°C, respectively, to<br />
evaluate unicouple performance. The required electric heater power input was predicted to<br />
be lower for module 18-Z compared with standard Cassini unicouples for the same<br />
reference hot side and cold side radiator temperatures. In actual performance, the electric<br />
heater power input was higher than predicted, there was no improvement in module<br />
efficiency over standard Cassini unicouples and the internal resistance and open circuit<br />
voltage increased more rapidly compared to a standard Cassini 18 couple module<br />
operating at the same hot side temperature.<br />
The higher than predicted heater power input suggested that the reduction in thermal<br />
conductivity in the as-pressed, improved materials was not retained after unicouple<br />
fabrication. Grain growth in the P-type material and both localized melting and grain growth<br />
in the N-type material were confirmed by metallographic and SEM evaluation. These<br />
11-25
Final Technical Report<br />
GPHS-RTGs for the Cassini Mission<br />
Lockheed Martin <strong>Document</strong> No. RR16<br />
August 1998<br />
microstructure changes were responsible for the increase in thermal conductivity and, in<br />
turn, the lack of performance improvement over standard Cassini materials.<br />
The mechanism for the accelerated resistance and open circuit voltage increases was<br />
attributed to a loss or redistribution of dopants which increased the electrical resistivity and<br />
Seebeck coefficient. Loss of phosphorus in the N-type material through the cracks in the<br />
silicon nitride coating was confirmed. It was also suspected that the boron precipitated out<br />
of solution in the P-type material since the dopant level exceeded the solid solubility limit at<br />
the hot side test temperature.<br />
From the results of the 18 couple module test, it was evident that a lower temperature<br />
manufacturing method, such as sputter brazing and bonding at temperatures below<br />
1200°C, for the attachment of the N-type material to the SiMo hot shoe (as was employed<br />
for MOD-RTG multicouple assembly) would be required to eliminate incipient melting. In<br />
addition, long duration dopant precipitation studies and development of an applicable<br />
dopant precipitation model would also be necessary to more fully assess the performance<br />
of an 18 couple module composed of improved materials.<br />
11.2 MULTICOUPLE TESTING<br />
11.2.1 Background<br />
Multicouples were fabricated on the MOD-RTG Program (Contract DE-AC01-83NE-32112)<br />
and life testing of these multicouples was continued on the Cassini RTG Program as part of<br />
Task 8, Subtask B. Direction was received from DOE in September 1994 (Reference<br />
11.2-1) to terminate the multicouple life tests in a controlled manner. The direction specified<br />
that each multicouple be removed from its test station and visually examined at 40X<br />
magnification. The performance of the five multicouples placed on life test as well as the<br />
observations from the post test visual examination are presented below.<br />
11.2.2 Multicouple Description<br />
The multicouple design is illustrated in Figure 11.2-1 for reference. Four of the multicouples<br />
were of the Build 5 configuration and one was from the Build 3 configuration. A detailed<br />
description of each of the configurations can be found in Reference 11.2-2. The Build 5<br />
configuration was fabricated with improvements to the hot end glass bond which would<br />
11-26
Final Technical Report<br />
GPHS-RTGs for the Cassini Mission<br />
Lockheed Martin <strong>Document</strong> No. RR16<br />
August 1998<br />
.0165 DIA.<br />
HOLE<br />
.032<br />
U.S. DIME<br />
(SIZE REFERENCE)<br />
.002 GLASS<br />
BOND<br />
THERMOELECTRICS<br />
(.326 IN. SQ.)<br />
.0289<br />
LEG<br />
\t.<br />
ELECTRICAL LEADS<br />
GRAPHITE<br />
HEAT<br />
COLLECTOR<br />
.70 IN. DIA.<br />
Ge<br />
BOND<br />
MOUNTING<br />
STUD<br />
TUNGSTEN<br />
.400<br />
.002 GLASS<br />
.331<br />
.001 TUNGSTEN<br />
.060 GRAPHITE<br />
CUSHION<br />
Figure 11.2-1. MOD-RTG Multicouple Design<br />
permit testing at accelerated temperature. These improvements included the use of a<br />
silicon nitride/silicon dioxide coating applied to the hot end glass bond as well as the<br />
addition of a glass filet to the same bond to reduce thermal stresses. The Build 3<br />
multicouple was an earlier configuration, built in 1987, which did not have the design and<br />
process improvements incorporated into the Build 5 configuration.<br />
Four of the tested multicouples were fabricated with SiGe/GaP N-legs and SiGe P-legs and<br />
one was fabricated without GaP (i.e., with SiGe N-legs and SiGe P-legs). The five tested<br />
multicouples were identified as follows:<br />
• Build 3 M/C 1026-8<br />
• Build 5 M/C M042-G4<br />
• Build 5 M/C M043-18<br />
• Build 5 M/C N043-5 (No GaP)<br />
• Build 5 M/C M043-19<br />
11-27
11.2.3 Multicouple Test Results<br />
Final Technical Report<br />
GPHS-RTGs for the Cassini Mission<br />
Lockheed Martin <strong>Document</strong> No. RR16<br />
August 1998<br />
Test stations were designed and fabricated at Lockheed Martin to measure multicouple<br />
ingradient performance. Two vacuum chambers were modified to each contain a cruciform<br />
containing four heater stations (See Figure 11.2-2). Each heater box contained a graphite<br />
heater and radiation plate and was insulated with multifoil insulation. Each multicouple was<br />
mounted to an aluminum alloy fin to simulate outer shell mounting. The fin area was sized<br />
and coated with high emissivity coating to achieve the required cold junction temperature of<br />
the multicouple. Heater power was supplied by GPHS-RTG Power Supply Consoles. A<br />
modified GPHS-RTG Readout Console (ROC) was used to monitor multicouple<br />
performance and provide automatic test shutdown in the event of an overtemperature or<br />
loss of vacuum event.<br />
All multicouples except M043-19 were operated at normal RTG operating temperatures<br />
(1000°C hot junction; 300°C cold junction) with a -6 volt bias applied between the negative<br />
multicouple terminal and ground. Multicouple M043-19 was operated at reduced, normal<br />
and accelerated hot side temperatures as shown in Table 11.2-1. Accelerated testing of<br />
multicouple M043-19 was terminated because of unwanted reactions in the heater station<br />
which were not associated with the multicouple. It was found that reactions were occurring<br />
between the alumina insulation and graphite heater components. These reactions<br />
produced aluminum carbide which deposited on the molybdenum insulation as well as the<br />
multicouple assembly. The same reaction occurred in 8 couple test modules which were<br />
tested at Fairchild Industries (now Orbital Sciences Corporation) as discussed in more<br />
detail in Reference 11.2-2.<br />
Table 11.2-1. Multicouple M043-19 Test History<br />
Hot Junction<br />
Operating Temp<br />
(°C)<br />
Time at<br />
Operating Temp<br />
(Hours).<br />
1000 1838<br />
1050 3753<br />
950 11,267<br />
Total 16,858<br />
11-28
Final Technical Report<br />
GPHS-RTGs for the Cassini Mission<br />
Lockheed Martin <strong>Document</strong> No. RR16<br />
August 1998<br />
HEATER STATION #1<br />
HEATER STATION #4<br />
TYPICAL<br />
REMOVABLE<br />
FIN ASSEMBLY<br />
HEATER STATION #2<br />
♦ HEATER STATION #3<br />
FIN<br />
47D306670<br />
MULTICOUP LE<br />
TIC 3<br />
VD 2 TIC I<br />
`••■■■•■■■•:::;-•trea......1■1111.<br />
4A--=-Lazz'ree 4/<br />
1"1.141'<br />
•<br />
OTRONICS INSULATION<br />
REPLACED WITH<br />
MULTIFOIL INSULATION<br />
FOR THESE TESTS<br />
GRAPHITE HEATER<br />
ASSEMBLY<br />
... •<br />
A •<br />
ar.<br />
Figure 11.2-2. Lockheed Martin Multicouple Heater Boxes (Two <strong>View</strong>s)<br />
11-29
Final Technical Report<br />
GPHS-RTGs for the Cassini Mission<br />
Lockheed Martin <strong>Document</strong> No. RR16<br />
August 1998<br />
The life test hours accumulated by each multicouple are shown in Table 11.2-2.<br />
Table 11.2-2. Multicouple Life Test Summary<br />
Multicouple<br />
Test<br />
Completion<br />
Accumulated<br />
Test Hours<br />
Build 3 - M/C 1026-8 8/14/94 25,012<br />
Build 5 - M/C M042-G4 8/14/94 9,070<br />
Build 5 - M/C M043-18 9/9/94 7,878<br />
Build 5 - M/C N043-5 (No GaP) 8/31/94 16,406<br />
Build 5 - M/C M043-19 8/31/94 16,858<br />
Table 11.2-3 summarizes the performance ratios for each multicouple at the end of testing.<br />
Table 11.2-3. P/Po, R/Ro, E/E0 Ratios at End of Testing<br />
Multicouple Test Hours P/Po R/Ro E/Eo<br />
AR<br />
.6, E%<br />
1026-8 25,012 0.785 1.490 1.080 6.1<br />
M043-18 7,878 0.894 1.321 1.087 3.7<br />
M042-G4 9,070 0.900 1.267 1.068 3.9<br />
N043-5 16,406 0.756 1.454 1.048 9.5<br />
M043-19 16,858 0.7705 1.473 1.065 7.28<br />
11.2.3.1 Multicouple 1026-8 (Build 3)<br />
This multicouple operated for 25,012 hours at normal RTG operating temperatures. This was<br />
the longest operating time achieved for any multicouple. Normalized power degradation<br />
(Figure 11.2-3) during this time was 22%, which is approximately twice that of the unicouples<br />
as measured in GPHS 18 couple modules 18-4 and 18-7. The greater power degradation is<br />
due to both a higher rate of internal resistance increase (Figure 11.2-4) and a lower rate of<br />
increase in open circuit voltage (Figure 11.2-5). The higher rate of internal resistance<br />
increase is attributed to accelerated dopant precipitation in the fine grain materials. This is<br />
discussed in more detail in Reference 11.2-3. The lower rate of increase in open circuit<br />
voltage is attributed primarily to an increase in temperature drop across the insulating<br />
glasses. The ratio of the percentage change in internal resistance to the percentage change<br />
in open circuit voltage due to dopant precipitation effects is in the range of 2.0 to 3.0 for<br />
unicouples with course grain material. Table 11.2-3 shows that this ratio is much higher for<br />
the multicouples.<br />
11-30
Final Technical Report<br />
GPHS-RTGs for the Cassini Mission<br />
Lockheed Martin <strong>Document</strong> No. RR16<br />
August 1998<br />
0<br />
p.=<br />
3000 6000 9000 12000 15000 18000 21000 24000 27000<br />
TIME AT TEMPERATURE. HRS<br />
Figure 11.2-3. ET1026-8, 18-4, 18-7 — Normalized Maximum Power/<br />
Initial Value Versus Time at Temperature<br />
1.50<br />
1.45<br />
1.40<br />
v 18-4<br />
0 18-7<br />
o ET1026-8<br />
1.35<br />
1.30<br />
0<br />
cc<br />
1.25<br />
1.20<br />
1.15<br />
1.10<br />
1.05<br />
1.00<br />
0 3000 6000 9000 12000 15000 18000 21000 24000 27000<br />
TIME AT TEMPERATURE. HRS<br />
Figure 11.2-4. ET1026-8, 18-4, 18-7 — Normalized Internal Resistance/<br />
Initial Value Versus Time at Temperature<br />
11-31
Final Technical Report<br />
GPHS-RTGs for the Cassini Mission<br />
Lockheed Martin <strong>Document</strong> No. RR16<br />
August 1998<br />
1.10<br />
1.09<br />
1.08<br />
1.07<br />
1.06<br />
1.05<br />
1 .04<br />
1.03<br />
1.02<br />
1.01<br />
1 .00<br />
0 5000 10000 15000 20000 25000<br />
TIME AT TEMPERATURE. HRS<br />
Figure 11.2-5. ET1026-8, 18-4, 18-7 — Normalized Open Circuit Voltage/<br />
Initial Value Versus Time at Temperature<br />
11.2.3.2 Multicouple M043-18 (Build 5)<br />
This multicouple accumulated 7,878 hours of operation at normal RTG operating<br />
temperatures. Overall, its power degradation was not quite double that of unicouples. Its<br />
higher degradation appeared more due to internal resistance increase than open circuit<br />
voltage rate increase.<br />
11.2.3.3 Multicouple M042-G4 (Build 5)<br />
This multicouple was tested for a total of 9,070 hours at normal RTG operating temperatures<br />
which included 2,000 hours in the Fairchild (now Orbital Sciences Corporation) Build 5 test<br />
module. Its overall degradation was 10% compared to 7% for unicouples. However, there<br />
was a steep change in the degradation rate of about 1.5% between the Fairchild and<br />
Lockheed Martin tests. If this is taken into account, the degradation was about 20% greater<br />
than unicouples. Both internal resistance and open circuit voltage increased faster than<br />
unicouples indicating that accelerated dopant precipitation was the dominant degradation<br />
mechanism.
Final Technical Report<br />
GPHS-RTGs for the Cassini Mission<br />
Lockheed Martin <strong>Document</strong> No. RR16<br />
August 1998<br />
11.2.3.4 Multicouple N043-5 (Build 5 — No GaP in SiGe Alloys)<br />
This multicouple accumulated 16,406 hours of operation at normal RTG operating<br />
temperatures. Its power degradation was approximately twice that of unicouples. Both<br />
internal resistance and open circuit behavior contributed to the higher rate of degradation.<br />
Its degradation characteristics were similar to the other multicouples, indicating that the GaP<br />
was not the cause of the more rapid degradation.<br />
11.2.3.5 Multicouple M043-19 (Build 5)<br />
This multicouple was tested for a total of 16,858 hours. Most of the testing was at the<br />
reduced heat collector temperature of 1015°C (950°C hot junction). The multicouple began<br />
testing at the accelerated temperature of 1115°C (1050° hot junction), but it became<br />
necessary to reduce the temperature because Residual Gas Analyzer (RGA) data showed<br />
that the partial pressure of carbon monoxide was increasing in the test chamber. This was<br />
an indication that aluminum carbide formation reactions were taking place. Its degradation<br />
was about 2.5 times that of unicouples. Both internal resistance and open circuit anomalous<br />
behavior contributed to the higher degradation rate.<br />
11.2.4 Post Test Examinations<br />
Table 11.2-4 lists the multicouples, test conditions and a summary of the post-test visual<br />
observations. In brief, three of the multicouples appeared to be very clean and free of<br />
unusual deposits (Multicouples ET1026-8, M042-G4, and N042-5). Two of the multicouples,<br />
however, had a heavy powdery, yellow-white coating on most of the heat collector and the<br />
exposed surface of the moly foil package (Multicouples M043-18 and M043-19). These two<br />
multicouples also had heavy blue-gray and yellow-brown crusty deposits on the quartz yarn<br />
wrapping on the thermopiles. A more detailed description of the post test examination<br />
findings may be found in Reference 11.2-4.<br />
11-33
Final Technical Report<br />
GPHS-RTGs for the Cassini Mission<br />
Lockheed Martin <strong>Document</strong> No. RR16<br />
August 1998<br />
Table 11.2-4. Multicouple Test Conditions and Post-Test Visual Appearance<br />
Multicouple<br />
Build<br />
Accum.<br />
Test<br />
Hours<br />
Vacuum<br />
Station<br />
Heater<br />
Station<br />
Test<br />
Temperature<br />
Heat Collector<br />
Appearance<br />
Quartz Yarn<br />
Appearance<br />
Perimeter<br />
Glass<br />
Appearance<br />
M/C 1026-8 3 25,012 3 2 Normal Normal:<br />
No Deposits<br />
Normal:<br />
Slight<br />
Discoloration<br />
Normal:<br />
Off-White with<br />
random areas of<br />
Yellow-Brown near<br />
mid-section.<br />
M042-G4 5 9,070 3 4 Normal Normal Normal Normal<br />
N042-5<br />
(No GaP)<br />
5 16,406 5 3 Normal Normal Normal Normal<br />
M043-18 5 7,878 3 1 Normal Yellow-White<br />
Powder Coating<br />
Hot-to-Cold:<br />
Yellow-White,<br />
Blue-Gray,<br />
Yellow-Brown,<br />
Off-White<br />
Normal<br />
M043-19 5 16,858 5 2 Normal = 1,838 Hrs.<br />
+50° = 3,753 Hrs.<br />
-50° = 11,267 Hrs.<br />
Yellow-White<br />
Powder Coating<br />
Hot-to-Cold:<br />
Yellow-White,<br />
Blue-Gray,<br />
Yellow-Brown,<br />
Off-White<br />
Normal
Final Technical Report<br />
GPHS-RTGs for the Cassini Mission<br />
Lockheed Martin <strong>Document</strong> No. RR16<br />
August 1998<br />
References for Section 11<br />
11.1.3-1 DeFillipo, L. E., B. Franklin, C. E. Kelly, P. M. Klee and J. F. Nakahara, "Evaluation<br />
of an Improved Performance Unicouple," Cassini RTG Program Topical Report, 17<br />
June 1996.<br />
11.2-1 Letter from DOE (Ser-RTG-052), Promani to Waks, LMMS, 7 September 1994.<br />
11.2-2 GESP-7230, MOD-RTG Final Technical Report, 31 December 1992.<br />
11.2-3 Kelly, C. E., R. F. Hartman, P. M. Klee, S. Loughin, Technical Paper, "MOD-RTG<br />
Program Multicouple Life Testing," 28th IECEC, August 1993.<br />
11.2-4 Franklin, B. R., R. F. Hartman, C. E. Kelly, P. M. Klee, Cassini RTG Program<br />
Topical Report, "Multicouple Life Test Results," 31 January 1995.
Appendix A<br />
Issues and Solutions for<br />
Re-Establishment of<br />
Unicouple Fabrication
Final Technical Report<br />
GPHS-RTGs for the Cassini Mission<br />
Lockheed Martin <strong>Document</strong> No. RR18<br />
August 1998<br />
APPENDIX A<br />
ISSUES AND SOLUTIONS FOR<br />
RE-ESTABLISHMENT OF UNICOUPLE FABRICATION<br />
This appendix lists the problems encountered during the re-establishment and flight<br />
production of unicouple fabrication during the Cassini program. The problems and their<br />
respective solutions for the major operations and processes involved are summarized.<br />
Vacuum Casting<br />
At the beginning of the Cassini program, it was recommended that chilled water cooled<br />
pancake style castings be made instead of the finger type castings fabricated during the<br />
Galileo/Ulysses program. The advantages were more uniform and reproducible casting<br />
characteristics. Also, the set-up and break down of the molds were simpler for the pancake<br />
style casting. A qualification plan was developed and implemented. The room temperature<br />
densities and Seebeck coefficients were similar to the Galileo/Ulysses statistical and<br />
process control data, however, the alternate process did not produce thermoelectric<br />
materials with the proper microstructure. All the vacuum castings subsequently prepared for<br />
the Cassini program were the finger style. There were no significant process problems<br />
during production.<br />
Powder Blending<br />
The only change implemented was the method in which molybdenum powder was added to<br />
the doped silicon powder. During the Galileo/Ulysses program the -325 mesh Mo powder<br />
was mixed directly with the Si powder. For the Cassini program the Mo powder was presieved<br />
through a 325 mesh screen before mixing with Si, resulting in a reduced amount of<br />
Mo agglomeration and a more uniform SiMo material. There were no significant process<br />
problems during production.<br />
Hot Pressing<br />
At the beginning of the Cassini program, it was intended to hot press thicker SiGe compacts<br />
to increase the number of machined parts per compact. Initially, powders prepared from the<br />
pancake style castings were used and were later repeated using powders prepared from<br />
A-1
Final Technical Report<br />
GPHS-RTGs for the Cassini Mission<br />
Lockheed Martin <strong>Document</strong> No. RR18<br />
August 1998<br />
finger style castings. The porosity and homogeneity could not be duplicated in the thicker<br />
compacts and it was decided to revert back to 0.5 inch thick SiGe compacts. It was later<br />
determined that a higher hot press temperature and load were required to prepare thicker<br />
SiGe compacts with the proper porosity and microstructure. All SiGe and SiMo compacts<br />
prepared for the Cassini program were 0.5 inch thick. There were no significant process<br />
problems during production.<br />
N-P Bond/Hot Shoes<br />
Problem Low N-P bond joint strength.<br />
Solution Added a SiMo compact cleaning step (in boiling water) after<br />
polishing, duplicating the Galileo/Ulysses process.<br />
Problem Decreased hot shoe strength and increased resistance.<br />
Cause Bonding temperature needed to be optimized and flatness verified.<br />
Solution Completed temperature profile study in each hot press to achieve a<br />
1285°C bond temperature.<br />
Determined optimum set points for both hot presses (hot press<br />
#2: 1306°C, hot press #3: 1315°C). Also verified lapping table<br />
operation to achieve flatness requirement.<br />
Thermoelectric Parts Preparation (Machining)<br />
During the Galileo/Ulysses program the thermoelectric elements and hot shoes were sliced<br />
oversized and ground (pellets and segments) or lapped (hot shoes) to size. The new<br />
precision machining equipment procured for the Cassini program wafered and sliced parts<br />
to size, minimizing the amount of grinding. A verification plan was developed and<br />
implemented to verify that the modified machining techniques did not adversely affect the<br />
ability of subsequent silicon nitride coatings to inhibit material vaporization at unicouple<br />
operating temperatures. Tests included dimensional inspection, first bond fabrication and<br />
silicon nitride coating, followed by second bond, couple preassembly and unicouple<br />
thermal cycling. Hot shoes were evaluated for strength, electrical resistance and bond<br />
porosity. After thermal cycling, the coated first bond was subjected to a 40 hour<br />
thermogravimetric analysis (TGA) test. The Cassini verification data matched previous<br />
Galileo/Ulysses data.<br />
A-2
Final Technical Report<br />
GPHS-RTGs for the Cassini Mission<br />
Lockheed Martin <strong>Document</strong> No. RR18<br />
August 1998<br />
A second set of tests were also performed to determine the adherence of silicon nitride<br />
coatings on wafered and ground surfaces which may have a different surface texture. SiGe<br />
pellets and hot shoes were silicon nitride coated and heated in vacuum between 1150 and<br />
1160°C for up to 750 hours. Sublimation performance of the Cassini silicon nitride coatings<br />
were found to be equivalent to Galileo/Ulysses coatings and were equivalent for wafered<br />
and ground surfaces. The verification test results, summarized in Cassini PIR 028, indicated<br />
that the new Cassini machining methods were acceptable.<br />
Other Problems and Their Respective Solutions Are Summarized Below:<br />
Problem Staining on pellets and segments.<br />
Cause Fixture marks and coolant (deionized water) residue.<br />
Solution Removed sharp edges from fixtures and replaced coolant with<br />
that used on the Galileo/Ulysses program.<br />
Problem Hot shoe staining<br />
Cause Water spots and epoxy residue.<br />
Solution Prevented coolant from drying on parts and removed epoxy<br />
mechanically rather than chemically.<br />
Problem Variation of gray color on P-wafers and P-pellets (lacy pattern).<br />
Solution Completed series of studies, including process review, SEM,<br />
Auger, SIMS, first bonding, coating, TGA and methods of rework.<br />
Found that the subtle pattern was a harmless artifact of<br />
ultrasonic cleaning. No difference in chemistry, and the pattern<br />
was eliminated during first bonding. ECN issued to accept<br />
nonuniformity of gray color and added visual standard for<br />
inspection Reference.<br />
Reference Cassini Memo #135 and ECN RTG-0215<br />
Problem Recurring excessive chipping and staining of pellets.<br />
Solution Increased supervision in machining area to provide in-process<br />
checks.
Final Technical Report<br />
GPHS-RTGs for the Cassini Mission<br />
Lockheed Martin <strong>Document</strong> No. RR18<br />
August 1998<br />
Problem Machining coolant (White and Bagley) not available,<br />
discontinued.<br />
Solution Tested two alternatives and switched to TrimClear coolant.<br />
Testing included chemical analysis, machining trials, SIMS<br />
surface analysis, Seebeck coefficient, coating, and TGA.<br />
Reference Cassini Memos #133, #144, #157, and ECN RTG-0223<br />
Problem Stains on pellets and segments.<br />
Solution Replaced five swabbing steps with hydrogen peroxide cleaning.<br />
This provided significantly cleaner parts with less handling.<br />
Reference ECN RTG-0286, and Cassini Memo #195<br />
Issue Increase quantity of pellets and segments machined from a<br />
compact.<br />
Solution Optimized machining to increase parts machined by -35%.<br />
First Bond Assembly<br />
Problem Low acceptance yield due to stains on hot shoe.<br />
Cause Carbonization of (non-visible) organic residues on hot shoe<br />
during first bond cycle.<br />
Solution Added hydrogen peroxide cleaning step to hot shoes prior to<br />
first bond assembly.<br />
Issue Opportunity to increase throughput by reducing furnace "burn-in"<br />
runs.<br />
Solution Conducted tests to require burn-in runs only if furnace was idle<br />
for more than 24 hours. Successful test results.<br />
Silicon Nitride Coating<br />
Problem "White spots" on coated first bond assemblies<br />
Cause Chemically resistant residue on parts from Teflon tweezers tip.<br />
Excessive blister removal from first bond assemblies.<br />
Solution Replaced Teflon tweezers with Delrin. Reduced the amount of<br />
blister removal.<br />
A-4
Final Technical Report<br />
GPHS-RTGs for the Cassini Mission<br />
Lockheed Martin <strong>Document</strong> No. RR18<br />
August 1998<br />
Problem Bluish color on P-side of hot shoe coating after TGA testing.<br />
Cause A possible cause was the interaction between the Si-rich Si 3N 4<br />
layer and SiO2. Another explanation was that the Si-rich areas<br />
agglomerated or changed during thermal processing to produce<br />
a blue reflection.<br />
Solution Since the blue discoloration was not an indication of the quality<br />
of the Si 3N4 coating, no process changes were instituted.<br />
Reference Cassini Memo #306<br />
Second Bond Assembly<br />
Problem Voids at P-segment to pellet bond. Yield decreased to -60%.<br />
Cause • Different lots of tungsten bonding clips not performing well.<br />
• P-segments have a higher melting point than N-segments.<br />
• Can improve on fixture design to eliminate use of clips.<br />
Solution • Procured and evaluated new lots of clips.<br />
• Evaluated properties of available segment lots to obtain better<br />
match.<br />
Found that best P-segment material was hot pressed at<br />
1305°C.<br />
Produced more P-segment/compacts hot pressed at -1305°C.<br />
These P-segments provided improved bond joints: yield<br />
-95%.<br />
• Designed and tested new fixture type, without clips, "Second<br />
Bond Static Load Fixture". Good results were obtained.<br />
Revised specification to allow use of this alternate fixture ECN<br />
RTG-0336). Also added option to use heavier weights with<br />
fixture (ECN # RTG-0432). Fixture was used for -15% of<br />
remaining second bond assemblies.
Final Technical Report<br />
GPHS-RTGs for the Cassini Mission<br />
Lockheed Martin <strong>Document</strong> No. RR18<br />
August 1998<br />
Tungsten Cold Shoe<br />
Problem Microcracks, chips and out-of-parallel condition in new EDM cut<br />
parts from vendor (Schwarzkopf and lapping vendor, Assabet).<br />
Cause Lapping conditions needed to be studied, controlled and<br />
optimized.<br />
Solution Engineering, Manufacturing, Quality (EMQ) worked closely with<br />
both vendors to remedy problems. Modifications were made to<br />
lapping methods. Lapping load was too heavy. Supplier<br />
Instructions added to drawing 47A303803P1-900. Drawing<br />
47A303803 modified to add allowable radius (ECN RTG-0459).<br />
Reference Martin Marietta, Cassini Trip Reports:<br />
9/9/94 (Hofmeister, Dadd), 10/31/94 (Franklin, Dadd),<br />
11/21/94 (Dadd, Schreiber), 12/9/94 (Franklin, Dower, Dadd)<br />
12/21/94 (Franklin, Dadd)<br />
Radiator Attachment Assembly<br />
Problem<br />
Solution<br />
Numerous poor workmanship issues with machining vendor<br />
(Sheffield).<br />
Ultimately, discontinued machining at vendor. Established<br />
capability for in-house machining with good results.<br />
Cold Stack Assembly<br />
Problem Oxidation (discoloration) during brazing cycle.<br />
Cause Outgassing from graphite brazing fixtures.<br />
Solution Vacuum-fired graphite fixtures and stored fixtures in nitrogen<br />
dry-box when not in use.<br />
Problem Braze voids at radiator to electrical insulator bond.<br />
Cause Radiator surface not flat.<br />
Solution Modified machining methods and eliminated hand sanding.
Final Technical Report<br />
GPHS-RTGs for the Cassini Mission<br />
Lockheed Martin <strong>Document</strong> No. RR18<br />
August 1998<br />
Couple Pre-Assembly<br />
Problem Braze defects.<br />
Solution Lowered allowable minimum brazing temperature and clarified<br />
steel wool scrubbing technique. ECN issued.<br />
Reference ECN RTG-0450<br />
Problem Water stains and poor braze flow.<br />
Solution Modified cleaning step to eliminate water spots and modified<br />
gritblasting method to protect brazing surface.<br />
Reference ECN RTG-0409<br />
Unicouple Assembly<br />
Problem Stains appeared on unicouple during braze cycle.<br />
Cause Residue (non-visible) on unicouple from Teflon tweezers.<br />
Solution Replace Teflon tweezers with Delrin tweezers.<br />
Problem Foreign material in braze joint.<br />
Cause Carbonized residue from acrylic binder (M50A1).<br />
Solution Added solvent swabbing/nitrogen blow-off step to specification.<br />
Problem Voids in braze joint.<br />
Solution • Replaced binding fixture screw with better fitting screw.<br />
• Replaced defective nut plate fixture parts.<br />
• Added cold stack parallelism data sheet to in-process traveler.<br />
Reference Cassini Memos #312, #317, #337<br />
Problem Stains appearing on hot shoe spacers during braze cycle<br />
(low yields).<br />
Cause Residue (non-visible) on spacers prior to brazing.<br />
Solution Added cleaning and screening step to spacers prior to braze<br />
cycle. Also added better handling, cleaning, and storage<br />
methods.<br />
Handled fired parts with ceramic tipped tweezers only.<br />
Reference ECN RTG-0413 and Cassini Memos #290, #290A<br />
A-7
Final Technical Report<br />
GPHS-RTGs for the Cassini Mission<br />
Lockheed Martin <strong>Document</strong> No. RR18<br />
August 1998<br />
Hot Shoe Spacer<br />
Problem<br />
Cause<br />
Solution<br />
Reference<br />
Cracking of hot shoe spacer after unicouple assembly.<br />
Vendor (AlSiMag) used a new laser machining process to form<br />
the spacers causing high stresses and cracking.<br />
Replaced laser machining with die forming in the green state, as<br />
was used on GPHS.<br />
Monthly Technical Progress Reports dated March 1993 and<br />
September 1993<br />
Wrapped Unicouple Assembly<br />
Problem<br />
Solution<br />
Specification was not consistent with past process.<br />
Clarified specification.<br />
Nickel Plating<br />
Problem<br />
Solution<br />
Problem<br />
Cause<br />
Solution<br />
Delays in procurement of parts to nickel plate.<br />
Direct interaction with vendors by Manufacturing, Engineering,<br />
Quality and Purchasing to expedite delivery.<br />
Blisters on plated heat shunts.<br />
Surface defects formed on the parts during rolling at vendor.<br />
Etched parts in a nitric acid/hydrofluoric acid solution to remove<br />
surface defects prior to plating.<br />
Molybdenum<br />
Compensators<br />
Problem<br />
Cause<br />
Gouges on plated molybdenum compensators.<br />
Unplated parts have gouges on the surface, damaged during<br />
vendor machining. No tumbling process was used to remove<br />
flaws.<br />
Solution Additional inspector training to screen out gouged parts.
Final Technical Report<br />
GPHS-RTGs for the Cassini Mission<br />
Lockheed Martin <strong>Document</strong> No. RR18<br />
August 1998<br />
Tungsten Compensators<br />
Problem Stained after tumbling, prior to plating.<br />
Solution • Added step to electro-clean parts in Oakite following tumbling.<br />
• Added process control definitions to tumbling method.<br />
Copper Pedestals<br />
Problem Excessive burrs after tumbling. Additional tumbling removed<br />
burrs but caused excessive embedded particles.<br />
Cause Burrs formed during part fabrication by vendor.<br />
Solution • Improved forming method (blanking) using new tooling at<br />
vendor.<br />
• Added process control definitions to tumbling method.<br />
Heat Shunts<br />
Problem<br />
Solution<br />
Problem<br />
Solution<br />
Unacceptable dimensional variations.<br />
Worked with vendor (Carr) to improve dimensional control.<br />
Interior plating thickness did not meet minimum requirement<br />
(0.05 mil).<br />
Evaluated GPHS plated parts to compare with current parts.<br />
Current parts found to be comparable. Clarified Met lab<br />
measurement methods. Revised minimum thickness<br />
requirement.<br />
Electrical Connectors<br />
Problem Burrs in the hole of electrical connectors following tumbling.<br />
Additional tumbling removed burrs but caused excessive<br />
embedded particles.<br />
Cause Burrs formed during part fabrication by vendor.<br />
Solution • Deburred delivered parts by hand.<br />
• Improved forming method (blanking) to reduce burrs at vendor.<br />
A-9
Final Technical Report<br />
GPHS-RTGs for the Cassini Mission<br />
Lockheed Martin <strong>Document</strong> No. RR18<br />
August 1998<br />
Electrical Insulators<br />
Problem<br />
Solution<br />
Low strength of new lot of insulators from vendor (Wesgo).<br />
• Reduced metallized layer thickness.<br />
• Heat treated metallized parts (study showed that GPHS also<br />
applied a heat treatment to metallized parts).<br />
• Redefined visual standards to allow small pinholes in<br />
metallized layer (0.5 to 1.0 mil) as was found to be consistent<br />
with GPHS parts.<br />
• Optimized mesh size for application of metallized layer.<br />
Problem Vendor machined insulators have foreign material and cracks.<br />
Solution • Worked with vendor (Sheffield) to improve deburring<br />
procedure and made several modifications to edge grinding<br />
procedures.<br />
• Established alternate machining vendor (Insaco) to machine<br />
parts. Trial lot of parts received for evaluation. No orders<br />
made beyond this.<br />
M50A 1 Acrylic Binder<br />
Problem New batch of binder had very high viscosity. Specification<br />
lacked detail.<br />
Cause Wrong chemical was ordered and used in new batch.<br />
Solution Determined correct name of chemical. Revised material<br />
specification to clarify chemical name and revised process<br />
specification with more detail.<br />
Reference ECN RTG-0296 and NR 78366<br />
A-10
Final Technical Report<br />
GPHS-RTGs for the Cassini Mission<br />
Lockheed Martin <strong>Document</strong> No. RR18<br />
August 1998<br />
New Ultrasonic Cleaners<br />
Issue Need to evaluate new, higher frequency, ultrasonic cleaners.<br />
Solution Compared new cleaners to old cleaners by the "aluminum foil<br />
erosion test." Also evaluated noise level. Found new cleaners<br />
to be equivalent to old cleaners. Built noise suppression<br />
enclosures following EHS recommendations.<br />
Reference • "The Ultrasonic Cleaning Process", Microcontamination<br />
(periodical), Vol. 2, No. 5, 1984.<br />
• ET #5157 and CRAF/Cassini Equivalent Item Approval Form<br />
signed 2/9/95<br />
• "Employee Noise Exposure Monitoring Report" EHS Record<br />
#A950203-1.<br />
Rework Methods<br />
Issue Could streamline MRB/rework cycle if commonly used rework<br />
methods were captured in one new specification to be used as a<br />
Reference.<br />
Solution Studied common rework methods, created and issued a new<br />
specification.<br />
Reference ECN RTG-0470 and Specification 23021621<br />
Long Term Packaging<br />
Issue<br />
Solution<br />
Reference<br />
Need to determine methods and materials to protect and inhibit<br />
corrosion of residual Cassini hardware during long term storage.<br />
Evaluated protective packaging materials for storage and<br />
corrosion protection. Recommendations, test results and<br />
specification written.<br />
Cassini Memos #333, #346, #355, and Specification GESP<br />
7244.
Final Technical Report<br />
GPHS-RTGs for the Cassini Mission<br />
Lockheed Martin <strong>Document</strong> No. RR18<br />
August 1998<br />
E-7 Rework<br />
Issue Need to rework 144 unicouples removed from E-7 ETG.<br />
Solution Several engineering tests were run to optimize rework<br />
processes.<br />
The rework method: unwrap, solvent clean, hydrogen anneal at<br />
715°C for 10-15 minutes to restore ductility to copper<br />
connectors, resize heat shunt (if required), hot shoe spacer<br />
chem etch-clean (if required), and rewrap. The rework<br />
acceptance yield was 87.5%.<br />
Reference Cassini Memo #440.<br />
Quartz Yarn Firing<br />
Issue Brittle quartz yarn after firing in air furnace per specification<br />
methods.<br />
Solution Investigated materials, process and equipment.<br />
Found that furnace control thermocouple was not in optimum<br />
location; resulting in overtemperature situation, crystallization<br />
and brittleness of yarn.<br />
Ran tests with thermocouple in optimum position with good<br />
results.<br />
Modified specifications to define and clarify furnace set-up,<br />
temperature profile process, and inspection method (knot test).<br />
Reference ECNs RTG-0566 and RTG-0557.<br />
Training Videos<br />
Issue Could expedite start-up of next unicouple build with fabrication<br />
videos.<br />
Solution<br />
Completed video production of 18 tapes, which document<br />
unicouple fabrication processes, to be used as training aids.<br />
Also produced 10 tapes which document converter assembly<br />
processes.<br />
A-12