DOGAMI Fact Sheet: New FEMA Flood Maps for Coos County, Oregon
DOGAMI Fact Sheet: New FEMA Flood Maps for Coos County, Oregon
DOGAMI Fact Sheet: New FEMA Flood Maps for Coos County, Oregon

Create successful ePaper yourself
Turn your PDF publications into a flip-book with our unique Google optimized e-Paper software.
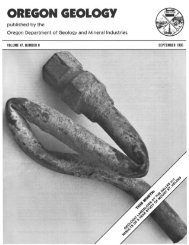
<strong>DOGAMI</strong> 06/06/11<br />
<strong>DOGAMI</strong> <strong>Fact</strong> <strong>Sheet</strong>: <strong>New</strong> <strong>FEMA</strong> <strong>Flood</strong> <strong>Maps</strong> <strong>for</strong> <strong>Coos</strong> <strong>County</strong>, <strong>Oregon</strong><br />
<strong>Oregon</strong> Department of Geology and Mineral Industries<br />
800 NE <strong>Oregon</strong> Street #28, Suite 965, Portland, OR 97232-2162<br />
offi ce (971) 673-1555 fax (971) 673-1562<br />
http://www.<strong>Oregon</strong>Geology.org<br />
Don Lewis, <strong>DOGAMI</strong>-<strong>FEMA</strong> Cooperating<br />
Technical Partner Manager<br />
Don.Lewis@dogami.state.or.us<br />
offi ce (971) 673-1541<br />
O R E G O N<br />
D E PA R T M E N T<br />
O F<br />
G E O L O G Y<br />
1937<br />
A N D<br />
M I N E R A L<br />
I N D U S T R I E S<br />
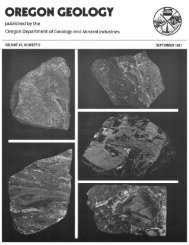
Moving flood zone boundaries to<br />
where they should be by using<br />
new topographic data gives<br />
everyone—communities, <strong>Coos</strong><br />
government agencies, and <strong>County</strong>,<br />
homeowners—the ability <strong>Oregon</strong><br />
to plan and to protect<br />
property from flood<br />
damage. This fact sheet<br />
explains how <strong>DOGAMI</strong> improved<br />
flood mapping <strong>for</strong> <strong>Coos</strong> <strong>County</strong>.<br />
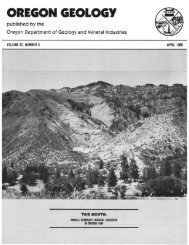
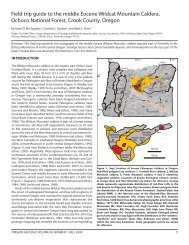
Redelineating the <strong>FEMA</strong> 100-year fl ood zone<br />
Removed from 100-year flood zone on the basis of highly<br />
accurate lidar-based mapping by <strong>DOGAMI</strong><br />
Added to 100-year flood zone on the basis of highly<br />
accurate lidar-based mapping by <strong>DOGAMI</strong><br />
No change from previous <strong>FEMA</strong> fl ood zone map<br />
<strong>Flood</strong> zones <strong>for</strong> Millington, <strong>Coos</strong> <strong>County</strong>, <strong>Oregon</strong> <br />
have changed dramatically on the basis of new mapping.<br />
<strong>DOGAMI</strong> has remapped flood zones <strong>for</strong> all of <strong>Coos</strong> <strong>County</strong>.<br />
250 m<br />
SCALE<br />
0 1000 ft<br />
What is the project? The Federal Emergency Management Agency (<strong>FEMA</strong>)<br />
contracted with the <strong>Oregon</strong> Department of Geology and Mineral Industries<br />
(<strong>DOGAMI</strong>) under <strong>FEMA</strong>’s Map Modernization Program to make new, highly<br />
accurate elevation maps using lidar (light detection and ranging), flood insurance rate<br />
map (FIRM) redelineation, storm wave flood mapping, and integration of multiple<br />
natural hazard data layers <strong>for</strong> <strong>Coos</strong> <strong>County</strong>. <strong>New</strong>, highly accurate digital flood insurance<br />
rate maps (DFIRMs) are one result.<br />
LEARN MORE <br />
<strong>FEMA</strong><br />
and the National a <strong>Flood</strong> Insurance Program (NFIP)<br />
<strong>FEMA</strong> is responsible <strong>for</strong> coordinating the Federal response to floods, earthquakes,<br />
hurricanes, and other natural or man-made disasters and providing disaster<br />
assistance to States, communities, and individuals. The Federal Insurance and<br />
Mitigation Administration within <strong>FEMA</strong> is responsible <strong>for</strong> administering the<br />
National <strong>Flood</strong> Insurance Program (NFIP) and administering programs that<br />
provide assistance <strong>for</strong> mitigating future damages from natural hazards.<br />
The primary purposes of NFIP are to:<br />
• Better indemnify individuals <strong>for</strong> flood losses through insurance;<br />
• Reduce future flood damages through State and community floodplain<br />
management regulations; and<br />
• Reduce Federal expenditures <strong>for</strong> disaster assistance and flood control.<br />
<strong>Flood</strong>ed properties have cost the taxpayer-supported insurance fund<br />
$11 billion in claims since 1978. Source: Paul Overberg and Thomas Frank, USA TODAY<br />
Properties<br />
with 2 or more<br />
claims since<br />
1978<br />
1 to 50<br />
51 to 100<br />
101 to 500<br />
501 to 1,000<br />
1,000 and above<br />
The National <strong>Flood</strong> Insurance Program (NFIP)<br />
is managed by the Federal Emergency<br />
Management Agency (<strong>FEMA</strong>), a component of the<br />
U.S. Department of Homeland Security (DHS).<br />
4+<br />
3<br />
2<br />
1<br />
Number of fl ood disaster<br />
declarations in <strong>Oregon</strong><br />
1965-2003<br />
Source: <strong>FEMA</strong> Region X
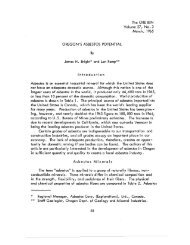
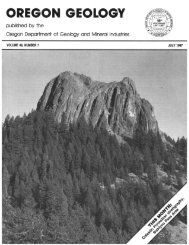
What is lidar?<br />
Examples showing problems with older flood maps and <strong>DOGAMI</strong>’s solutions<br />
Light detection and ranging (lidar) technology<br />
is revolutionizing the way we see<br />
the earth. The lidar data used to create<br />
the new <strong>FEMA</strong> flood maps by <strong>DOGAMI</strong><br />
were collected from a light aircraft carrying<br />
a highly accurate laser scanner. The<br />
scan<br />
anner makes over<br />
100,000 measurements<br />
each second to build<br />
up<br />
a three-dimensional<br />
“point cloud” model of<br />
the surface of the earth<br />
and the vegetation and<br />
structures on it. A<br />
computer<br />
sor<br />
ts the<br />
points, separating those<br />
that measure the ground from those<br />
that measure other objects such as trees<br />
or buildings. Images derived from these<br />
sets<br />
of points<br />
are<br />
then merged<br />
with other<br />
<strong>for</strong>ms of digital data to create the maps.<br />
Bandon<br />
Public<br />
Library<br />
image source: USGS<br />
1<br />
NEW <strong>DOGAMI</strong> maps are digitally<br />
produced and use far more<br />
accurate lidar imagery as a base.<br />
The map data can be accessed<br />
online as well as on paper.<br />
2<br />
OLD <strong>Flood</strong> Insurance Rate<br />
<strong>Maps</strong> (FIRMs) based on aerial<br />
photography lead to inaccurate<br />
elevations. These older-style<br />
maps can also be hard to read.<br />
<strong>DOGAMI</strong> WEB TOOL<br />
SCREEN SHOT<br />
Full-feature lidar surface includes<br />
everything the laser pulses hit.<br />
Bare-earth lidar surface has<br />
trees, buildings, etc. removed.<br />
How are lidar-based flood insurance<br />
rate maps (FIRMs) better?<br />
North Bend<br />
DFIRM<br />
Panel 186<br />
OLD Less accurate base map<br />
topography leads to inaccurate<br />
locations <strong>for</strong> flood elevations<br />
(blue line). Poor base map<br />
resolution means locations of<br />
structures are uncertain.<br />
<strong>DOGAMI</strong> WEB TOOL<br />
SCREEN SHOT<br />
<strong>DOGAMI</strong> WEB TOOL<br />
SCREEN SHOT<br />
NEW High-resolution lidar elevation data provide accurate<br />
locations <strong>for</strong> modeled flood area (blue area in left image) as<br />
well as <strong>for</strong> structures. The areas no longer in the predicted<br />
flood area are shown in green (right image). The revised flood<br />
data on the new maps can be accessed in the traditional FIRM<br />
<strong>for</strong>mat or online.<br />
Most current <strong>FEMA</strong> FIRM flood zones<br />
are based on topographic data from the<br />
U.S. Geological Survey National Elevation<br />
Dataset. These topographic maps were<br />
constructed from 1950s-1960s era aerial<br />
photography. Cartographers could not<br />
see through trees, especially in <strong>for</strong>ested<br />
drainages, to draw precise contours;<br />
contour intervals were set at 40 feet.<br />
Lidar-based elevations, however, are<br />
accurate to within a few inches. The more<br />
accurate the map elevations, the more<br />
accurate flood zone modeling can be.<br />
Comparisons of older <strong>FEMA</strong> FIRM zones<br />
and new <strong>DOGAMI</strong> lidar-derived maps<br />
commonly show significant misalignment<br />
of flood zones to actual topography. With<br />
the new elevation data, flood zones can be<br />
located much more accurately.<br />
3<br />
North Coquille<br />
River Panel 775<br />
OLD Less accurate base map<br />
topography causes flooded<br />
area (blue outline) to “run<br />
over hills”; here, the flood area<br />
includes the hilly area in the<br />
middle of the image.<br />
<strong>DOGAMI</strong> WEB TOOL<br />
SCREEN SHOT<br />
Ground adjacent to buildings<br />
is 22 feet above A zone<br />
fl ood elevation<br />
<strong>DOGAMI</strong> WEB TOOL<br />
SCREEN SHOT<br />
NEW Lidar-based elevation data and new A zone models<br />
provide accurate locations <strong>for</strong> flood elevations. Blue area (left<br />
image) is in the revised flood area. Green area (right image)<br />
is no longer in the flood area. Buildings are precisely located.<br />
<strong>DOGAMI</strong> <strong>Fact</strong> <strong>Sheet</strong>: <strong>New</strong> <strong>FEMA</strong> <strong>Flood</strong> <strong>Maps</strong> <strong>for</strong> <strong>Coos</strong> <strong>County</strong>, <strong>Oregon</strong> 06/06/2011
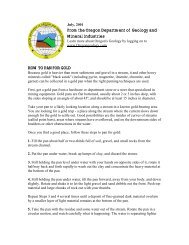
What determines flood insurance rates?<br />
National Average NFIP Premiums <strong>for</strong> Residential Buildings and Contents<br />
Annual Insurance Premium<br />
$6,000<br />
$5,000<br />
$4,000<br />
$3,000<br />
$2,000<br />
$1,000<br />
$0<br />
Mandatory Coastal High Risk<br />
Mandatory River High Risk<br />
Discretionary Preferred Risk (without basement)<br />
Are property & building within<br />
a coastal VE or V zone?<br />
Yes = “coastal high risk”<br />
Are property & building within<br />
a river AE or A zone?<br />
Yes = “high risk”<br />
Are property & building outside<br />
VE, V, AE, or A zones?<br />
Yes = “preferred risk”<br />
$20,000<br />
$30,000<br />
$35,000<br />
$50,000<br />
$75,000<br />
$1,760<br />
$1,100<br />
$100,000<br />
Value of Building<br />
$5,903<br />
$2,734<br />
$274 $365<br />
$125,000<br />
$150,000<br />
$200,000<br />
Rates effective January 1, 2011<br />
Source: http://www.fl oodsmart.gov/fl oodsmart/pages/residential_coverage/policy_rates.jsp.<br />
$250,000<br />
To help establish flood insurance rates and applicability, <strong>FEMA</strong> defines<br />
several different flood hazard areas. <strong>Flood</strong> hazard areas identified<br />
on <strong>FEMA</strong> <strong>Flood</strong> Insurance Rate <strong>Maps</strong> (FIRMs) are identified<br />
as Special <strong>Flood</strong> Hazard Areas (SFHA). A SFHA is defined as the<br />
area that will be inundated by a flood event having a 1% chance of<br />
being equaled or exceeded in any given year. The 1% annual chance<br />
flood is also referred to as the base flood or 100-year flood.<br />
High-risk flood zone designations:<br />
A zone: Areas in the 100-year floodplain, but where a detailed<br />
flood study has not been prepared.<br />
AE zone: Areas in the 100-year flood plain where a detailed flood<br />
V zone:<br />
study has been per<strong>for</strong>med.<br />
Coastal areas subject to a 100-year flood, with additional<br />
hazard from storm waves. These areas are determined<br />
by approximate analysis, not by detailed calculations.<br />
VE zone: Coastal areas subject to a 100-year flood, where a detailed<br />
study was per<strong>for</strong>med to determine base flood elevation.<br />
When is <strong>Flood</strong> Insurance Required? — see page 4.<br />
Summary of Changes to<br />
<strong>Flood</strong> Zones by Acreage<br />
in <strong>Coos</strong> <strong>County</strong><br />
Calculated jurisdiction acreage includes the<br />
City Limit and Urban Growth Boundary (UGB)<br />
Summary of Changes<br />
to Structures within <strong>Flood</strong><br />
Zones by Jurisdiction<br />
Buildings Subtracted Buildings Added<br />
Within city urban growth<br />
boundaries (UGBs),<br />
new maps by <strong>DOGAMI</strong><br />
reduced the area in<br />
Special <strong>Flood</strong> Hazard<br />
Zones by 7.1%.<br />
Within city UGBs,<br />
new maps by <strong>DOGAMI</strong><br />
reduced the number of<br />
buildings in Special <strong>Flood</strong><br />
Hazard Zones by 19.7%.<br />
Net Change to Number of Structures<br />
In or Out of <strong>FEMA</strong> <strong>Flood</strong> Zone<br />
50<br />
0<br />
50<br />
100<br />
150<br />
200<br />
Bandon<br />
<strong>Coos</strong> Bay<br />
Coquille<br />
Lakeside<br />
Myrtle Point<br />
North Bend<br />
— (16) (11) (63) (2) (193) +1<br />
Powers<br />
Jurisdiction<br />
Acres and <strong>FEMA</strong> Special <strong>Flood</strong> Hazard Areas (SFHA) by Jurisdiction<br />
Total Number<br />
of Acres<br />
Pre-<strong>DOGAMI</strong> Total<br />
Acres inside SFHA<br />
Acres removed<br />
from SFHA<br />
<strong>DOGAMI</strong> Modifi cations<br />
Acres added<br />
to SFHA<br />
Acres remaining<br />
in SFHA<br />
Post-<strong>DOGAMI</strong> Total<br />
Acres inside SFHA<br />
Post-<strong>DOGAMI</strong> Total<br />
Acres outside SFHA<br />
Bandon 1,872 1,175 49 50 1,127 1,177 695<br />
<strong>Coos</strong> Bay 10,189 4,534 296 75 4,238 4,313 5,876<br />
Coquille 1,738 355 43 16 311 327 1,411<br />
Lakeside 1,337 486 46 40 441 481 855<br />
Myrtle Point 1,021 240 13 25 226 252 770<br />
North Bend 3,514 1,676 328 2 1,348 1,350 2,164<br />
Powers 419 81 46 8 34 42 376<br />
All Cities 20,089 8,547 822 217 7,725 7,942 12,147<br />
<strong>Coos</strong> <strong>County</strong> Unincorp. 1,137,401 65,410 7,618 8,069 57,792 65,861 1,071,540<br />
ALL COOS COUNTY 1,157,490 73,956 8,439 8,286 65,517 73,803 1,083,687<br />
Percentages by Jurisdiction<br />
Jurisdiction<br />
Total Number<br />
of Acres<br />
Pre-<strong>DOGAMI</strong> Total<br />
Acres inside SFHA<br />
Acres removed<br />
from SFHA<br />
Acres added<br />
to SFHA<br />
Acres remaining<br />
in SFHA<br />
Post-<strong>DOGAMI</strong> Total<br />
Acres inside SFHA<br />
Post-<strong>DOGAMI</strong> Total<br />
Acres outside SFHA<br />
Bandon 100.00% 62.8% 2.6% 2.7% 60.2% 62.9% 37.1%<br />
<strong>Coos</strong> Bay 100.00% 44.5% 2.9% 0.7% 41.6% 42.3% 57.7%<br />
Coquille 100.00% 20.4% 2.5% 0.9% 17.9% 18.8% 81.2%<br />
Lakeside 100.00% 36.4% 3.4% 3.0% 33.0% 36.0% 64.0%<br />
Myrtle Point 100.00% 23.5% 1.3% 2.5% 22.2% 24.6% 75.4%<br />
North Bend 100.00% 47.7% 9.3% 0.1% 38.4% 38.4% 61.6%<br />
Powers 100.00% 19.2% 11.1% 2.0% 8.1% 10.1% 89.9%<br />
All Cities 100.00% 42.5% 4.1% 1.1% 38.5% 39.5% 60.5%<br />
<strong>Coos</strong> <strong>County</strong> Unincorp. 100.00% 5.8% 0.7% 0.7% 5.1% 5.8% 94.2%<br />
ALL COOS COUNTY 100.00% 6.4% 0.7% 0.7% 5.7% 6.4% 93.6%<br />
Jurisdiction<br />
Total Number<br />
of Structures<br />
Structures and SFHA by Jurisdiction<br />
Pre-<strong>DOGAMI</strong> Total<br />
Structures inside<br />
SFHA<br />
Structures<br />
removed from<br />
SFHA<br />
Structures<br />
added to<br />
SFHA<br />
Structures<br />
remaining in<br />
SFHA<br />
Post-<strong>DOGAMI</strong> Total<br />
Structures inside<br />
SFHA<br />
Post-<strong>DOGAMI</strong> Total<br />
Structures outside<br />
SFHA<br />
Bandon 2,119 151 30 30 121 151 1,968<br />
<strong>Coos</strong> Bay 6,933 603 146 130 457 587 6,346<br />
Coquille 1,848 37 15 4 22 26 1,822<br />
Lakeside 1,146 283 87 24 196 220 926<br />
Myrtle Point 1,246 103 14 12 89 101 1,145<br />
North Bend 4,129 267 197 4 70 74 4,055<br />
Powers 508 1 1 2 - 2 506<br />
All Cities 17,929 1,445 490 206 955 1,161 16,768<br />
<strong>Coos</strong> <strong>County</strong> Unincorp. NA NA NA NA NA NA NA<br />
ALL COOS COUNTY NA NA NA NA NA NA NA<br />
Percentages by Jurisdiction<br />
Jurisdiction<br />
Total Number<br />
of Structures<br />
Pre-<strong>DOGAMI</strong> Total<br />
Structures inside<br />
SFHA<br />
Structures<br />
removed from<br />
SFHA<br />
Structures<br />
added to<br />
SFHA<br />
Structures<br />
remaining in<br />
SFHA<br />
Post-<strong>DOGAMI</strong> Total<br />
Structures inside<br />
SFHA<br />
Post-<strong>DOGAMI</strong> Total<br />
Structures outside<br />
SFHA<br />
Bandon 100% 7.1% 1.4% 1.4% 5.7% 7.1% 92.9%<br />
<strong>Coos</strong> Bay 100% 8.7% 2.1% 1.9% 6.6% 8.5% 91.5%<br />
Coquille 100% 2.0% 0.8% 0.2% 1.2% 1.4% 98.6%<br />
Lakeside 100% 24.7% 7.6% 2.1% 17.1% 19.2% 80.8%<br />
Myrtle Point 100% 8.3% 1.1% 1.0% 7.1% 8.1% 91.9%<br />
North Bend 100% 6.5% 4.8% 0.1% 1.7% 1.8% 98.2%<br />
Powers 100% 0.2% 0.2% 0.4% 0.0% 0.4% 99.6%<br />
All Cities 100% 8.1% 2.7% 1.1% 5.3% 6.5% 93.5%<br />
<strong>Coos</strong> <strong>County</strong> Unincorp. NA NA NA NA NA NA NA<br />
ALL COOS COUNTY NA NA NA NA NA NA NA<br />
<strong>DOGAMI</strong> <strong>Fact</strong> <strong>Sheet</strong>: <strong>New</strong> <strong>FEMA</strong> <strong>Flood</strong> <strong>Maps</strong> <strong>for</strong> <strong>Coos</strong> <strong>County</strong>, <strong>Oregon</strong> 06/06/2011
Frequently Asked Questions<br />
Who needs <strong>FEMA</strong> flood maps (FIRMs)?<br />
• Private citizens and insurance and brokers<br />
– use FIRMs to locate properties and buildings to determine<br />
the amount of flood risk and whether flood insurance is required.<br />
• Community officials<br />
– use FIRMs to administer floodplain management regulations<br />
and to mitigate flood damage.<br />
• Lending institutions and federal agencies<br />
– use FIRMs to locate properties and buildings in relation<br />
to mapped flood hazards, and to determine whether flood<br />
insurance is required when making loans or providing grants<br />
following a disaster <strong>for</strong> the purchase or construction of a<br />
building.<br />
How do I know the new <strong>DOGAMI</strong> maps and flood zones<br />
are accurate?<br />
<strong>FEMA</strong> has extensively reviewed the process, the modeling,<br />
and the final maps. The <strong>Oregon</strong> Department of Land Conservation<br />
and Development (DLCD) is providing guidance through<br />
planning and implementation.<br />
In addition, as part of the <strong>Flood</strong> Insurance Study, <strong>DOGAMI</strong><br />
reviewed all Letters of Map Changes (LOMC), which are applications<br />
made by property owners at their expense to prove to<br />
<strong>FEMA</strong> that their home is not in the Special <strong>Flood</strong> Hazard Area<br />
(SFHA) and there<strong>for</strong>e is exempt from mandatory flood insurance.<br />
Results <strong>for</strong> all SFHAs showed that of 126 LOMC evaluated,<br />
112 were confirmed by new mapping alone. Results <strong>for</strong><br />
Approximate A Zones showed that of 64 LOMCs evaluated, 58<br />
were confirmed by new mapping alone.<br />
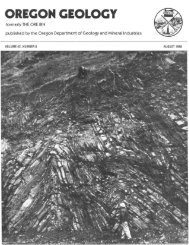
What other areas in the<br />
state is <strong>DOGAMI</strong> currently<br />
remapping?<br />
<strong>DOGAMI</strong> is working <strong>for</strong><br />
<strong>FEMA</strong> to remap Lincoln,<br />
Tillamook, and Clatsop<br />
counties and the Lower<br />
Columbia–Sandy<br />
watershed.<br />
Lower Columbia-Sandy<br />
(HUC-8) Watershed<br />
(HUC-8) Watershed<br />
<strong>County</strong> Boundary<br />
<strong>DOGAMI</strong>-<strong>FEMA</strong> <strong>County</strong><br />
<strong>DOGAMI</strong>-<strong>FEMA</strong> <strong>County</strong><br />
Work Complete<br />
City Limits<br />
<strong>Coos</strong><br />
<strong>County</strong><br />
Curry<br />
<strong>County</strong><br />
Lincoln<br />
<strong>County</strong><br />
Clatsop<br />
<strong>County</strong><br />
Tillamook<br />
<strong>County</strong><br />
Polk<br />
<strong>County</strong><br />
Josephine<br />
<strong>County</strong><br />
Ya m hill<br />
<strong>County</strong><br />
Benton<br />
<strong>County</strong><br />
Columbia<br />
<strong>County</strong><br />
Washington<br />
<strong>County</strong><br />
Marion<br />
<strong>County</strong><br />
Lane<br />
<strong>County</strong><br />
Douglas<br />
<strong>County</strong><br />
Jackson<br />
<strong>County</strong><br />
Multnomah<br />
<strong>County</strong><br />
Linn<br />
<strong>County</strong><br />
Clackamas<br />
<strong>County</strong><br />
Deschutes<br />
<strong>County</strong><br />
Klamath<br />
<strong>County</strong><br />
Hood<br />
River<br />
<strong>County</strong><br />
Wasco<br />
<strong>County</strong><br />
Jefferson<br />
<strong>County</strong><br />
Lake<br />
<strong>County</strong><br />
Dan Coe, <strong>DOGAMI</strong><br />
Who should I contact if I have questions about the new<br />
flood zones?<br />
Steve Lucker, <strong>Flood</strong>plain/Natural Hazards Mapping Specialist<br />
<strong>Oregon</strong> Department of Land Conservation and Development<br />
635 Capitol St NE Suite 150, Salem, OR 97301-2540<br />
Office: (503) 373-0050 ext. 269 fax (503) 378-6033<br />
stephen.lucker@state.or.us | www.oregon.gov/LCD/<br />
89%<br />
confi rmation rate<br />
All Special <strong>Flood</strong> Hazard Areas<br />
91%<br />
confi rmation rate<br />
Approximate A Zones<br />
Christine Shirley, NFIP Coordinator, Planning Services Division,<br />
<strong>Oregon</strong> Department of Land Conservation and Development<br />
635 Capitol Street NE, Suite 150, Salem, OR 97301-2540<br />
Office: (503) 373-0050 ext. 250 fax: (503) 378-6033<br />
christine.shirley@state.or.us | www.oregon.gov/LCD/<br />
Comparing the surveyed elevation of the structure/property to<br />
the modeled flood surface (not previously available <strong>for</strong> A zones)<br />
confirmed two additional LOMC, raising the confirmation percentage<br />
to 94%. There<strong>for</strong>e, <strong>Coos</strong> <strong>County</strong> residents can be confident<br />
that the new DFIRM mapping and zone delineation are<br />
highly accurate.<br />
Where can I get the new <strong>Coos</strong> <strong>County</strong> DFIRM maps?<br />
The maps are available <strong>for</strong> inspection at local municipal and<br />
county offices. You can also view an interactive map online at<br />
http://www.oregongeology.org.<br />
When is flood insurance required?<br />
Homes and buildings in high-risk flood areas with mortgages<br />
from federally regulated or insured lenders are required to<br />
have flood insurance. These areas have a 1% or greater chance of<br />
flooding in any given year, which is equivalent to a 26% chance<br />
of flooding during a 30-year mortgage.<br />
Resources<br />
The National <strong>Flood</strong> Insurance Rate Program (NFIP)<br />
http://www.fema.gov/business/nfip/<br />
<strong>FEMA</strong> Map Service Center<br />
http://msc.fema.gov/webapp/wcs/stores/servlet/FemaWelcome<br />
View?storeId=10001&catalogId=10001&langId=-1<br />
<strong>Oregon</strong> Department of Land Conservation and Development<br />
http://www.lcd.state.or.us/<br />
<strong>DOGAMI</strong>’s <strong>Coos</strong> <strong>County</strong> <strong>Flood</strong> and<br />
Natural Hazards Web Tool<br />
http://www.oregongeology.org/sub/<br />
fema-cooscountyhazards<br />
O R E G O N<br />
D E PA R T M E N T<br />
O F<br />
G E O L O G Y<br />
<strong>DOGAMI</strong> <strong>Fact</strong> <strong>Sheet</strong>: <strong>New</strong> <strong>FEMA</strong> <strong>Flood</strong> <strong>Maps</strong> <strong>for</strong> <strong>Coos</strong> <strong>County</strong>, <strong>Oregon</strong> 06/06/2011<br />
1937<br />
A N D<br />
M I N E R A L<br />
I N D U S T R I E S