Download the PDF
Download the PDF
Download the PDF

You also want an ePaper? Increase the reach of your titles
YUMPU automatically turns print PDFs into web optimized ePapers that Google loves.
Trusit Dave PhD, BSc, MCOptom, FAAO<br />
Instruments insight<br />
Wavefront aberrometry<br />
Part 1: Current <strong>the</strong>ories and concepts<br />
T<br />
he<br />
visual system is a complex structure, not simply in<br />
terms of its ability to focus light but in terms of its ability to<br />
detect (capture) and interpret <strong>the</strong> image.<br />
Even in a normal eye with zero subjective<br />
refraction, a point object does not form a<br />
point image. This is due to optical<br />
aberrations such as spherical aberration,<br />
coma and o<strong>the</strong>r so-called high order<br />
optical aberrations. Clinically, <strong>the</strong>se can<br />
induce patient symptoms of glare and even<br />
diplopia. The principal site of <strong>the</strong>se<br />
aberrations is <strong>the</strong> cornea; one would<br />
naturally expect this as <strong>the</strong> cornea has <strong>the</strong><br />
highest refractive power and <strong>the</strong>refore any<br />
error in its shape would induce a variety of<br />
aberrations. However, <strong>the</strong> lens and tear<br />
film also contribute to <strong>the</strong> optical<br />
image-forming properties of an eye.<br />
As well as <strong>the</strong> effects of optical<br />
aberrations, ano<strong>the</strong>r factor, diffraction,<br />
induces image blur. Diffraction is <strong>the</strong><br />
deviation of a light path which is<br />
essentially not due to refraction or<br />
reflection. It occurs at a pupil stop and as<br />
<strong>the</strong> eye has a pupil, diffraction will always<br />
exert some effect on image quality.<br />
However, it is well documented that when<br />
<strong>the</strong> pupil size is greater than 4.5mm,<br />
diffraction has little or no effect on <strong>the</strong><br />
retinal image quality, as any image blur<br />
induced by diffraction is within <strong>the</strong><br />
resolving power of <strong>the</strong> retinal cones<br />
(Nyquist’s sampling limit). For <strong>the</strong> human<br />
eye, it has been shown to be around 0.5<br />
minutes of arc or approximately 6/3 1 .<br />
Contrary to diffraction, where image<br />
quality deteriorates with smaller pupils,<br />
high order optical aberrations increase<br />
with pupil size.<br />
Advances in refractive surgery have led<br />
to <strong>the</strong> need for measuring more subtle<br />
errors of optical image degradation.<br />
However, clinicians have long-since<br />
understood <strong>the</strong> need to measure <strong>the</strong>se<br />
optical characteristics in cases where acuity<br />
has not been sufficiently improved using<br />
basic sphero-cylindrical refractive<br />
corrections, such as in keratoconus.<br />
Numerous advances in our ability to<br />
measure corneal topography have provided<br />
a better understanding of surface shape.<br />
However, practitioners require a direct<br />
method of evaluating <strong>the</strong> optical<br />
characteristics of an eye. Quantitative and<br />
qualitative descriptors of <strong>the</strong> optics of an<br />
eye have not been available until <strong>the</strong><br />
development of devices known as<br />
aberrometers.<br />
Many optometrists will have been<br />
involved in refractive surgery<br />
co-management, or examined patients<br />
having undergone a refractive surgical<br />
procedure. More importantly, many<br />
patients are aware of refractive surgical<br />
techniques which potentially result in<br />
‘super vision’ or customised vision<br />
correction. This wavefront-guided<br />
procedure represents an exciting time for<br />
vision correction, with many academic<br />
experts and leading surgeons now<br />
discussing optical properties of eyes in<br />
terms of wavefront aberrations and using<br />
terms like ‘Zernike polynomials’ and ‘RMS<br />
wavefront error’. This two-part article aims<br />
to provide <strong>the</strong> clinician with an<br />
understanding of <strong>the</strong>se terms, and how <strong>the</strong><br />
technology can be used in optometric<br />
practice.<br />
High and low<br />
order aberrations<br />
Routine optometric practice involves<br />
performing a full subjective refraction.<br />
Here <strong>the</strong> sphere, cylinder and axis of<br />
astigmatism are measured. Although we<br />
may feel that this is <strong>the</strong> total refractive<br />
error, we are only correcting two<br />
components of a whole host of refractive<br />
components of <strong>the</strong> optics of an eye.<br />
However, <strong>the</strong>se two components (sphere<br />
and cylinder) constitute by far <strong>the</strong> majority<br />
of <strong>the</strong> optical aberration of an eye.<br />
Never<strong>the</strong>less, we will all have encountered<br />
<strong>the</strong> situation where a patient complains of<br />
poorer vision at night when subjective<br />
refraction is near zero. We often refer to<br />
this as night myopia.<br />
Although night myopia will be one<br />
cause of <strong>the</strong> symptoms – where <strong>the</strong> shift in<br />
wavelength at night induces myopia –<br />
o<strong>the</strong>r monochromatic aberrations, such as<br />
spherical aberration, also play a part as<br />
<strong>the</strong>y increase with pupil size. In <strong>the</strong><br />
majority of normal patients, <strong>the</strong>se high<br />
order aberrations play a minor role,<br />
however, in cases of refractive surgery,<br />
keratoconus and orthokeratology, <strong>the</strong>y can<br />
induce a number of visual disturbances<br />
which can be explained by measurement<br />
of <strong>the</strong> optical aberrations. Therefore, it is<br />
useful to think of subjective refraction as a<br />
procedure used to reduce image blur<br />
optimally using spheres and cylinders<br />
when <strong>the</strong> image is blurred due to<br />
additional factors such as scatter,<br />
diffraction and o<strong>the</strong>r more subtle higher<br />
order aberrations. Fur<strong>the</strong>rmore, subjective<br />
refraction takes into account neural<br />
processing factors which have developed<br />
because of <strong>the</strong> world we live in.<br />
This article will not address <strong>the</strong> effects<br />
of chromatic aberration, where <strong>the</strong><br />
magnitude of refraction varies with<br />
wavelength of light. Discussion will be<br />
limited to monochromatic aberrations<br />
where <strong>the</strong> optical aberrations are<br />
referenced to one wavelength (550nm).<br />
It is important to understand, however,<br />
that optical aberrations will affect all<br />
wavelengths.<br />
Measuring wavefront<br />
aberration<br />
A number of commercial devices are<br />
available to measure ocular aberration.<br />
Most are based on <strong>the</strong> Shack-Hartmann<br />
principle. Before covering <strong>the</strong> basics of this<br />
technique, <strong>the</strong> concept of wavefronts will<br />
be discussed.<br />
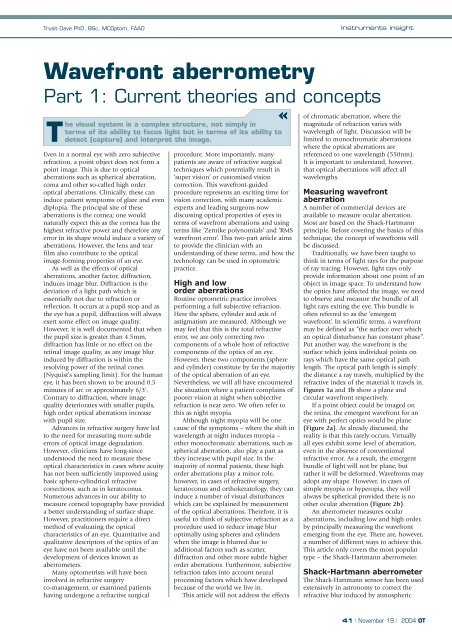
Traditionally, we have been taught to<br />
think in terms of light rays for <strong>the</strong> purpose<br />
of ray tracing. However, light rays only<br />
provide information about one point of an<br />
object in image space. To understand how<br />
<strong>the</strong> optics have affected <strong>the</strong> image, we need<br />
to observe and measure <strong>the</strong> bundle of all<br />
light rays exiting <strong>the</strong> eye. This bundle is<br />
often referred to as <strong>the</strong> ‘emergent<br />
wavefront’. In scientific terms, a wavefront<br />
may be defined as “<strong>the</strong> surface over which<br />
an optical disturbance has constant phase”.<br />
Put ano<strong>the</strong>r way, <strong>the</strong> wavefront is <strong>the</strong><br />
surface which joins individual points on<br />
rays which have <strong>the</strong> same optical path<br />
length. The optical path length is simply<br />
<strong>the</strong> distance a ray travels, multiplied by <strong>the</strong><br />
refractive index of <strong>the</strong> material it travels in.<br />
Figures 1a and 1b show a plane and<br />
circular wavefront respectively.<br />
If a point object could be imaged on<br />
<strong>the</strong> retina, <strong>the</strong> emergent wavefront for an<br />
eye with perfect optics would be plane<br />
(Figure 2a). As already discussed, <strong>the</strong><br />
reality is that this rarely occurs. Virtually<br />
all eyes exhibit some level of aberration,<br />
even in <strong>the</strong> absence of conventional<br />
refractive error. As a result, <strong>the</strong> emergent<br />
bundle of light will not be plane, but<br />
ra<strong>the</strong>r it will be deformed. Wavefronts may<br />
adopt any shape. However, in cases of<br />
simple myopia or hyperopia, <strong>the</strong>y will<br />
always be spherical provided <strong>the</strong>re is no<br />
o<strong>the</strong>r ocular aberration (Figure 2b).<br />
An aberrometer measures ocular<br />
aberrations, including low and high order,<br />
by principally measuring <strong>the</strong> wavefront<br />
emerging from <strong>the</strong> eye. There are, however,<br />
a number of different ways to achieve this.<br />
This article only covers <strong>the</strong> most popular<br />
type – <strong>the</strong> Shack-Hartmann aberrometer.<br />
Shack-Hartmann aberrometer<br />
The Shack-Hartmann sensor has been used<br />
extensively in astronomy to correct <strong>the</strong><br />
refractive blur induced by atmospheric<br />
41 | November 19 | 2004 OT
Instruments Insight<br />
Trusit Dave PhD, BSc, MCOptom, FAAO<br />
Figure 1a<br />
Parallel light rays travelling <strong>the</strong> same distance over time. The wavefront<br />
summarising <strong>the</strong> bundle of rays is plane<br />
Figure 1b<br />
Light rays travelling in different directions. The same distance is<br />
travelled over time (same phase), and <strong>the</strong> wavefront summarising<br />
<strong>the</strong> bundle is spherical<br />
Figure 2a<br />
The emergent wavefront of an eye with perfect optics, i.e. no refractive<br />
error and no high order aberrations<br />
Figure 2b<br />
The wavefront in an eye with simple myopia and no o<strong>the</strong>r aberrations.<br />
Here <strong>the</strong> emergent wavefront is perfectly spherical in shape<br />
turbulence. Astronomers developed an<br />
aberrometer to detect <strong>the</strong> aberrations<br />
induced by changes in atmospheric<br />
conditions and <strong>the</strong>n corrected <strong>the</strong>se using<br />
a deformable mirror – an optical<br />
engineering process known as adaptive<br />
optics 2 . This science is now being applied<br />
to <strong>the</strong> eye by virtue of an ocular<br />
aberrometer. The object of <strong>the</strong><br />
Shack-Hartmann aberrometer is to sample<br />
various points on <strong>the</strong> emerging wave<br />
and in doing so, derive <strong>the</strong> shape of <strong>the</strong><br />
Figure 3<br />
A diagrammatic representation of a<br />
Shack-Hartmann plate<br />
wavefront.<br />
Essentially, a Shack-Hartmann plate is a<br />
series of micro lenses arranged in a linear<br />
fashion (Figure 3). These lenslets are<br />
typically 0.25mm in diameter. Each lenslet<br />
focuses a view of <strong>the</strong> point source through<br />
various points of <strong>the</strong> entrance pupil<br />
(Figure 4). In this way, <strong>the</strong> aberrometer<br />
determines <strong>the</strong> shape of <strong>the</strong> wavefront<br />
exiting <strong>the</strong> eye. Although infrared light is<br />
used, <strong>the</strong> aberrations are measured with<br />
respect to peak spectral sensitivity of <strong>the</strong><br />
eye (550nm) by using a correction<br />
algorithm to account for <strong>the</strong> shift in focus<br />
from <strong>the</strong> measurement wavelength to <strong>the</strong><br />
reference wavelength 3 .<br />
Figure 5 shows <strong>the</strong> basic process<br />
involved in capturing <strong>the</strong> wavefront. For a<br />
perfect eye with no aberration, <strong>the</strong><br />
position of <strong>the</strong> spot on <strong>the</strong> CCD sensor<br />
will be at <strong>the</strong> optical axis of each lenslet.<br />
However, <strong>the</strong> reality is that in a normal<br />
eye, <strong>the</strong>re will be some level of aberration<br />
and, as such, <strong>the</strong> image of <strong>the</strong> spot will be<br />
Figure 4<br />
The principle of <strong>the</strong> Shack-Hartmann aberrometer<br />
42 | November 19 | 2004 OT
Instruments insight<br />
displaced from <strong>the</strong> optical axis. A question<br />
commonly asked is: “How is it that <strong>the</strong><br />
infrared laser forming a spot on <strong>the</strong> retina<br />
is not affected by <strong>the</strong> ocular aberrations?”<br />
The answer is that as <strong>the</strong> spot is very small<br />
and enters through <strong>the</strong> centre of <strong>the</strong><br />
entrance pupil to <strong>the</strong> fovea, <strong>the</strong> influence<br />
of <strong>the</strong> ocular aberrations is negligible.<br />
Thus, <strong>the</strong> CCD camera is used to<br />
capture <strong>the</strong> displacement of <strong>the</strong> spot from<br />
<strong>the</strong> optical axis of each lenslet.<br />
Displacements may occur in <strong>the</strong> horizontal<br />
and vertical meridian; Figure 6 shows <strong>the</strong><br />
displacement in <strong>the</strong> y meridian. The slope<br />
of <strong>the</strong> wavefront is easily calculated as <strong>the</strong><br />
displacement/<strong>the</strong> focal length of <strong>the</strong><br />
lenslet. After examining <strong>the</strong> slope at each<br />
micro lenslet in <strong>the</strong> x and y meridia, <strong>the</strong><br />
entire wavefront can be plotted in 3D.<br />
One of <strong>the</strong> objectives in measuring <strong>the</strong><br />
wavefront is to calculate <strong>the</strong> wavefront<br />
error (Figure 7). This describes <strong>the</strong> optical<br />
path difference between <strong>the</strong> measured<br />
wavefront and <strong>the</strong> reference wavefront<br />
(in microns) at <strong>the</strong> entrance pupil. The<br />
wavefront error is derived ma<strong>the</strong>matically<br />
from <strong>the</strong> reconstructed wavefront.<br />
However, <strong>the</strong>se computations result in<br />
many values of wavefront error. They are<br />
<strong>the</strong>refore plotted as a 2D or 3D wavefront<br />
error map for qualitative analysis (Figure<br />
7). These maps are analogous to colour<br />
coded corneal topography maps, where<br />
colours denote varying corneal dioptric<br />
power. In wavefront error maps, each<br />
colour represents a specific degree of<br />
wavefront error in microns. It is important<br />
to note <strong>the</strong> range and interval of <strong>the</strong> scale.<br />
Generally, in order to see as much detail as<br />
possible, choose <strong>the</strong> narrowest scale which<br />
permits <strong>the</strong> maximum number of colour<br />
changes within <strong>the</strong> map. However, when<br />
comparing pre and post treatments, make<br />
sure <strong>the</strong> same scale and step sizes are used<br />
to enable a like-for-like comparison. There<br />
is currently no absolute scale which has<br />
constant range and step size, as in corneal<br />
topography maps.<br />
Zernike polynomials<br />
The wavefront error map only provides<br />
qualitative information about <strong>the</strong><br />
wavefront. The shape of <strong>the</strong> wavefront<br />
takes on many forms and it is difficult for<br />
<strong>the</strong> clinician to evaluate <strong>the</strong> effects of <strong>the</strong><br />
shape on vision. In order to analyse <strong>the</strong><br />
wavefront quantitatively, it needs to be<br />
broken down into terms which are<br />
clinically meaningful. Conventional<br />
refraction breaks <strong>the</strong> wavefront down into<br />
only basic terms – sphere, cylinder and<br />
cylinder axis. A more sophisticated analysis<br />
is required to understand <strong>the</strong> subtle<br />
aberrations. Zernike polynomials are<br />
equations which are used to fit <strong>the</strong><br />
wavefront data in three dimensions. These<br />
polynomials have unique qualities, <strong>the</strong><br />
principal one being that <strong>the</strong>y decompose<br />
<strong>the</strong> shape of <strong>the</strong> wavefront into terms<br />
which describe optical aberrations such as<br />
spherical aberration, coma etc. Figure 8<br />
Figure 5<br />
The process involved in capturing <strong>the</strong> wavefront from <strong>the</strong> entrance pupil. Each lenslet captures a<br />
very small portion of <strong>the</strong> wavefront. The displacement of <strong>the</strong> spot is compared to that of a<br />
perfect wavefront. For a calibrated sensor, a perfect (or plane) wavefront would image <strong>the</strong> laser<br />
spot at <strong>the</strong> optical axis of <strong>the</strong> lenslet<br />
shows <strong>the</strong> Zernike modes commonly used<br />
to describe <strong>the</strong> measured wavefront.<br />
The individual modes, or terms, in <strong>the</strong><br />
polynomial have two variables, ρ (rho)<br />
and θ (<strong>the</strong>ta). ρ is <strong>the</strong> normalised distance<br />
from <strong>the</strong> pupil centre. Normalising ρ<br />
means it has a maximum value at <strong>the</strong> edge<br />
of <strong>the</strong> pupil of one. Therefore, for a 6mm<br />
pupil, a point 3mm from <strong>the</strong> centre would<br />
have a ρ value of 0.5. θ is <strong>the</strong> angular<br />
subtense of <strong>the</strong> imaginary line joining <strong>the</strong><br />
pupil centre and <strong>the</strong> point of interest to<br />
<strong>the</strong> horizontal (Figure 9).<br />
The key point here is that aberrations<br />
are dependent on pupil size. Therefore, all<br />
aberrometry measures must be related to<br />
<strong>the</strong> patient’s pupil diameter. Wavefront<br />
measures must be referenced to a pupil<br />
size.<br />
Each term is sequentially added to<br />
describe <strong>the</strong> entire wavefront. Thus, <strong>the</strong><br />
wavefront may be described as:<br />
W(ρ,θ)=C 1<br />
-1<br />
Z 1<br />
-1<br />
+C 11<br />
Z 11<br />
+C 2<br />
-2<br />
Z 2<br />
-2<br />
+C 20<br />
Z 20<br />
+C 22<br />
Z 2<br />
2<br />
+C 3<br />
-3<br />
Z 3<br />
-3<br />
+C 3<br />
-1<br />
Z 3<br />
-1<br />
+C 31<br />
Z 31<br />
+C 33<br />
Z 33<br />
+C 4<br />
-2<br />
Z 4<br />
-2<br />
etc<br />
Zernike terms are defined using a double<br />
index notation as proposed by <strong>the</strong> Optical<br />
Figure 6<br />
Calculation of <strong>the</strong> slope of <strong>the</strong> wavefront from <strong>the</strong><br />
displacement of <strong>the</strong> image at each individual lenslet<br />
43 | November 19 | 2004 OT
Instruments Insight<br />
Trusit Dave PhD, BSc, MCOptom, FAAO<br />
Figure 7<br />
The wavefront error map shows <strong>the</strong> difference between <strong>the</strong><br />
aberrated and reference (plane) wavefront. Once this information is<br />
processed for all points over <strong>the</strong> pupil, a 2D wavefront error map<br />
can be displayed (right) Figure 8<br />
Society of America 4 . This nomenclature<br />
groups each term according to <strong>the</strong> radial<br />
order (n) and angular frequency (m), thus<br />
each term is written in <strong>the</strong> form Z m n. The<br />
radial order (n) groups Zernike modes in<br />
terms ρ (rho), whereas <strong>the</strong> angular<br />
frequency (m) groups <strong>the</strong> modes in terms<br />
of θ (<strong>the</strong>ta). The coefficient, C, in each<br />
term varies according to <strong>the</strong> number of<br />
modes in <strong>the</strong> Zernike polynomial. C<br />
defines <strong>the</strong> level of a particular mode of<br />
aberration in microns and can have a<br />
positive or negative value.<br />
A list of <strong>the</strong> Zernike terms and <strong>the</strong>ir<br />
optical equivalent up to <strong>the</strong> fourth order is<br />
shown in Table 1. There are, in fact, an<br />
infinite number of Zernike terms which<br />
can be used to fit an individual wavefront.<br />
In practice, however, Zernike terms up to<br />
<strong>the</strong> 4th radial order are measured.<br />
It is worth understanding <strong>the</strong> actual<br />
terms in <strong>the</strong> equation. Let us take <strong>the</strong><br />
example of secondary astigmatism or Z 2 4.<br />
−1<br />
Z1 = 4ρ<br />
sin( θ )<br />
1<br />
Z1 = 4ρ<br />
cos( θ )<br />
−<br />
Z<br />
2 6 2<br />
2<br />
= ρ sin(2θ<br />
)<br />
0<br />
2<br />
Z2 = 3(2ρ<br />
−1)<br />
Z<br />
2 = 6ρ<br />
2 cos(2 θ )<br />
2<br />
Individual modes of Zernike polynomials up to fourth order. ‘n’<br />
represents <strong>the</strong> radial order and ‘m’ <strong>the</strong> angular frequency<br />
Table 1<br />
The double index notation of Zernike term, <strong>the</strong> equation of each mode in <strong>the</strong> Zernike polynomial<br />
and <strong>the</strong> appearance of each mode in a colour-coded wavefront error map<br />
Zernike term WFE Map Optical equivalent<br />
Vertical prism<br />
Horizontal prism<br />
Astigmatism<br />
Defocus<br />
Astigmatism<br />
The Zernike equation is<br />
Z 2 4 = √10(4ρ 4 −3ρ 2 )cos(2θ)<br />
What does<br />
this mean?<br />
As you can see, <strong>the</strong>re are only two<br />
variables in all <strong>the</strong> modes in Table 1.<br />
Broadly speaking, you can categorise each<br />
equation into three areas.<br />
Figure 9<br />
Wavefront error map defining ρ and θ<br />
−<br />
Z<br />
3 8 3<br />
3<br />
= ρ sin(3θ<br />
)<br />
−1<br />
3<br />
Z3 = 8(3ρ<br />
− 2ρ)sin(<br />
θ )<br />
1<br />
3<br />
Z3 = 8(3ρ − 2ρ)<br />
cos( θ )<br />
Z<br />
3 = 8ρ<br />
3 cos(3 θ )<br />
3<br />
−<br />
Z<br />
4 10 4<br />
4<br />
= ρ sin(4θ<br />
)<br />
−2<br />
4 2<br />
Z4 = 10(4ρ<br />
−3ρ<br />
) sin(2θ<br />
)<br />
0<br />
4 2<br />
Z4 = 5(6ρ<br />
− 6ρ<br />
+ 1)<br />
2<br />
4 2<br />
Z4 = 10(4ρ<br />
− 3ρ<br />
)cos(2θ<br />
)<br />
Z<br />
4 = 10ρ<br />
4 cos(4 θ )<br />
4<br />
Trefoil<br />
Coma<br />
Coma<br />
Trefoil<br />
Tetrafoil<br />
Secondary astigmatism<br />
Spherical aberration<br />
Secondary astigmatism<br />
Tetrafoil<br />
44 | November 19 | 2004 OT
Instruments insight<br />
Z 2 4 = √10(4ρ 4 −3ρ 2) cos(2θ)<br />
Normalisation<br />
term<br />
Radial<br />
term<br />
Angular<br />
term<br />
Normalisation of each mode means that<br />
observation of <strong>the</strong> coefficients<br />
immediately gives an indication of <strong>the</strong><br />
level of influence each type of aberration<br />
has on <strong>the</strong> total aberration 5 . The radial<br />
term, in this case of <strong>the</strong> fourth order,<br />
describes <strong>the</strong> variation of <strong>the</strong> wavefront<br />
error with distance from pupil centre. The<br />
largest power ρ is raised to is <strong>the</strong> radial<br />
order, i.e. to <strong>the</strong> power 4. The angular<br />
frequency describes <strong>the</strong> number of repeat<br />
cycles which are made over 360 degrees.<br />
For example, in secondary astigmatism,<br />
<strong>the</strong>re are two repeat cycles over <strong>the</strong><br />
circular pupil, thus <strong>the</strong> radial order is 2.<br />
Also, notice that where <strong>the</strong> radial order is<br />
assigned a negative value, <strong>the</strong> equation<br />
uses <strong>the</strong> sine of θ to describe <strong>the</strong> angular<br />
variation.<br />
The first order term, prism, is not<br />
relevant to <strong>the</strong> wavefront as <strong>the</strong>y represent<br />
tilt and are corrected using a prism. The<br />
second order terms represent low order<br />
aberrations, namely defocus and<br />
astigmatism. Defocus represents <strong>the</strong><br />
spherical component of <strong>the</strong> wavefront.<br />
The astigmatic terms conversely describe<br />
<strong>the</strong> cylinder. Using <strong>the</strong>se three terms, any<br />
sphero-cylindrical lens can be described.<br />
Wavefront maps with defocus and<br />
astigmatism only can be perfectly<br />
corrected using spectacles and contact<br />
lenses. Caution, however, needs to be<br />
exercised when interpreting <strong>the</strong>se terms as<br />
in practice, patient wavefront error maps<br />
have high order terms. As a result, defocus<br />
and astigmatism terms do not represent<br />
<strong>the</strong> sphere and cylinder terms found in<br />
subjective refraction. An estimate of<br />
subjective refraction can be made if only<br />
<strong>the</strong>se three terms are fit to <strong>the</strong> wavefront<br />
data. Second order terms are referred to as<br />
low order aberrations.<br />
Every mode after second order is a high<br />
order aberration. These terms cannot be<br />
measured in conventional refraction or<br />
autorefraction. The only method of<br />
quantifying <strong>the</strong>se terms is by using an<br />
aberrometer. The third order terms<br />
describe coma and trefoil astigmatism.<br />
These terms cannot be corrected using<br />
spectacles, soft or RGP contact lenses.<br />
Attempts have been made to correct<br />
spherical aberration in contact lenses<br />
using aspheric designs. However, this<br />
correction only corrects for lens specific<br />
spherical aberration and not <strong>the</strong> combined<br />
effect of eye and lens. Therefore, <strong>the</strong><br />
optical benefits of such a design may<br />
improve image quality for some patients<br />
but equally <strong>the</strong>re may be some<br />
deterioration in image quality in o<strong>the</strong>r<br />
patients 6 .<br />
Root mean square error<br />
In order to summarise <strong>the</strong> wavefront error,<br />
scientists have tried to develop metrics to<br />
try and best describe <strong>the</strong> wavefront error as<br />
a numeric index. At <strong>the</strong> present time, <strong>the</strong><br />
most widely used metric is <strong>the</strong> root mean<br />
square (RMS) error. All aberrometers<br />
display a RMS error of high and low order<br />
aberrations. This term describes <strong>the</strong><br />
weighted mean of <strong>the</strong> individual Zernike<br />
modes. In o<strong>the</strong>r words, <strong>the</strong> RMS value<br />
describes <strong>the</strong> overall aberration and gives a<br />
‘feel’ of how bad an individual’s<br />
aberrations are. The RMS error is simply:<br />
RMS=√(C2 -2 ) 2 +(C 0 2) 2 +(C 2 2) 2 +(C -3 3) 2 +(C -1 3) 2 ...etc<br />
There are number of disadvantages in<br />
using <strong>the</strong> RMS value. The most significant<br />
is that increases in RMS value do not<br />
necessarily result in decreases in image<br />
quality 5 . For example, if a subject has some<br />
defocus and spherical aberration, <strong>the</strong>n it is<br />
possible that <strong>the</strong> spherical aberration will<br />
help reduce some of <strong>the</strong> image blur<br />
induced on <strong>the</strong> retina. However, because<br />
of <strong>the</strong> way RMS is calculated, <strong>the</strong><br />
cancelling effects of one aberration over<br />
ano<strong>the</strong>r are not considered 7 . As research<br />
continues, better predictors of visual<br />
function will develop 5,8 .<br />
Studies have evaluated normative<br />
values of ocular aberration. Porter et al 9<br />
found a random variation in <strong>the</strong> wavefront<br />
aberration of 109 normal subjects with an<br />
artificial pupil diameter of 5.7mm. Chalita<br />
et al 10 performed aberrometry in 60 eyes<br />
and found mean values of 0.35±0.29<br />
microns for coma; 0.36±0.31 for spherical<br />
aberration; and 0.31±0.14 microns for<br />
o<strong>the</strong>r high order terms for a pupil<br />
diameter of 7mm. It has also been<br />
documented that 91% of <strong>the</strong> RMS<br />
wavefront error can be accounted for by<br />
<strong>the</strong> second order and 99% if Zernike<br />
terms from <strong>the</strong> first four orders are used to<br />
fit <strong>the</strong> wavefront for a pupil diameter of<br />
5mm 11 . Wang and Koch 12 measured ocular<br />
aberrations in subjects screened for<br />
refractive surgery. High order aberrations<br />
were found to have a mean RMS of<br />
0.305±0.095 in 532 eyes across a 6mm<br />
pupil. Spherical aberration was found to<br />
be 0.128±0.074 and coma 0.170±0.089<br />
microns.<br />
Any instrument involved in clinical<br />
measurement must be both accurate and<br />
repeatable. Cheng et al 13 measured <strong>the</strong><br />
accuracy and repeatability of <strong>the</strong> COAS<br />
(Wavefront Sciences) Shack-Hartmann<br />
aberrometer on model eyes. They found<br />
<strong>the</strong> instrument to be both accurate and<br />
repeatable on model eyes. In ano<strong>the</strong>r<br />
study, Cheng et al 14 evaluated <strong>the</strong> variation<br />
of monochromatic aberrometry<br />
measurements over a range of timescales<br />
(five measures in one second without<br />
realignment, five measures in one hour<br />
with realignment at <strong>the</strong> same time over<br />
five days and on five days at monthly<br />
intervals). The authors concluded that<br />
variations in aberrometry maps between<br />
days and months was due to biological<br />
changes to <strong>the</strong> eye, and that this<br />
fluctuation would prevent practitioners<br />
from achieving perfect optical correction,<br />
i.e. an aberration-free eye. Wavefront maps<br />
are also known to vary with<br />
accommodation 15 , tear film quality 16 and<br />
media opacities 17 .<br />
Part 2 of this article, to be<br />
published on December 3, will look<br />
at applications of wavefront<br />
aberrometry in clinical practice.<br />
About <strong>the</strong> author<br />
Dr Trusit Dave is Director of Optimed<br />
(Ophthalmic Medical Instruments),<br />
Clinical Consultant for Topcon GB and a<br />
partner in private practice in Coventry.<br />
References<br />
For a full set of references, email<br />
nicky@optometry.co.uk.<br />
Continuing Education and Training<br />
Systemic Pathology<br />
Orderline: 01252-810939 Fax: 01252-816176<br />
NEW<br />
This book on ‘Systemic Pathology’ is designed to give practitioners and optometric students a<br />
better understanding of <strong>the</strong> principles and practice of clinical medicine and surgery, and in<br />
particular, of <strong>the</strong> fur<strong>the</strong>r management of patients referred by optometrists.<br />
£39.50<br />
45 | November 19 | 2004 OT