the ideal Profile method - OP&P Product Research
the ideal Profile method - OP&P Product Research
the ideal Profile method - OP&P Product Research

You also want an ePaper? Increase the reach of your titles
YUMPU automatically turns print PDFs into web optimized ePapers that Google loves.
OP&P <strong>Product</strong> <strong>Research</strong><br />
Burgemeester Reigerstraat 89<br />
3581 KP Utrecht, The Ne<strong>the</strong>rlands<br />
+31-30 2516772<br />
www.opp.nl<br />
pieter@opp.nl
Consumer Guided <strong>Product</strong><br />
Development<br />
The Ideal <strong>Profile</strong> Methodology<br />
SPISE 2007 SYMPOSIUM<br />
HoChiMinh-City<br />
July 26-27<br />
July 2007<br />
OP&P <strong>Product</strong> <strong>Research</strong><br />
Pieter Punter
introduction<br />
• <strong>the</strong> Food Industry constantly strives for product development and<br />
product optimization (NPD in short) in order<br />
• to stay ahead of <strong>the</strong> competition<br />
• to prevent boredom and keep consumers satisfied<br />
• to deliver food products to <strong>the</strong> market place that are<br />
optimally aligned with consumer preferences<br />
• <strong>the</strong>re are many different procedures, differing in complexity, costs and<br />
time; <strong>the</strong>y range from:<br />
• complex, integrated procedures like QFD to<br />
• we do it ourselves (since we know best what is best)<br />
7002<br />
3
product innovation: <strong>the</strong> basics<br />
In reality product is:<br />
not a success success<br />
Management<br />
thinks:<br />
product is<br />
not a<br />
success<br />
success<br />
Refrain from what<br />
you shouldn't do<br />
Type-1 error:<br />
erroneous investment<br />
Type-2 error:<br />
missed opportunity<br />
Do what you should<br />
not refrain from<br />
• refrain from what you shouldn't do, and do what you<br />
shouldn't refrain from (don’t miss opportunities!)<br />
source: Ellen van Kleef and Hans van Trijp, 2004<br />
7002<br />
4
<strong>the</strong> underlying assumption in NPD<br />
• all <strong>method</strong>ologies applied for product optimization share a common,<br />
underlying assumption:<br />
• <strong>the</strong>re is an <strong>ideal</strong> product which maximizes liking<br />
• <strong>the</strong> closer <strong>the</strong> match between <strong>the</strong> actual product and this<br />
<strong>ideal</strong>, <strong>the</strong> higher <strong>the</strong> liking<br />
<strong>the</strong> quest is for this <strong>ideal</strong> product (of course, <strong>the</strong>re can be<br />
different <strong>ideal</strong>s for different subsets of consumers)<br />
for instance, <strong>the</strong> <strong>ideal</strong><br />
bicycle for bumpy<br />
roads<br />
7002<br />
5
<strong>the</strong> model<br />
• consumer disliking is a weighted linear combination of <strong>the</strong> attribute<br />
level deviations from <strong>the</strong> <strong>ideal</strong> product<br />
• where:<br />
Aj is <strong>the</strong> averaged consumer liking judgment for product j<br />
bi is <strong>the</strong> relative importance of deviations on attribute i for consumer’s overall<br />
liking<br />
Xij is <strong>the</strong> consumer perception of product j on attribute i<br />
Ii is <strong>the</strong> <strong>ideal</strong> level of attribute i that would generate maximum liking<br />
• <strong>the</strong>re are different approaches to estimate <strong>the</strong> deviations from <strong>ideal</strong><br />
reference: Engel, Blackwell & Miniard, 1995<br />
7002<br />
6
<strong>the</strong> conventional, sensory approach<br />
• a sensory panel rates a number of products on sensory attributes and<br />
defines <strong>the</strong> perceptual product space<br />
1,50<br />
dimensie 2 (21%)<br />
1,00<br />
0,50<br />
0,00<br />
-0,50<br />
-1,00<br />
-1,50<br />
product 17<br />
product 8<br />
pepper<br />
oregano<br />
garlic onion thyme<br />
product 2<br />
basil amtveg<br />
product 14<br />
sweet<br />
herby product 10<br />
oilyapp product 18anisfe product 11<br />
pepperi pepper hot<br />
product 5 thicken tomskins product 16<br />
stale<br />
product 3<br />
tompanc<br />
thickness<br />
grainy<br />
product 7<br />
product 13<br />
product 6 cheese glossy<br />
product 4<br />
pureed<br />
frenchon brown color<br />
separate<br />
coatmouth<br />
sour<br />
tomato redcolor<br />
coatpasta<br />
haydry smooth<br />
tomsoap<br />
metalic<br />
product 9<br />
product 12<br />
-2,00<br />
product 15<br />
product 1<br />
-2,50<br />
-2,50 -2,00 -1,50 -1,00 -0,50 0,00 0,50 1,00 1,50 2,00<br />
dimensie 1 (36%)<br />
• target consumers rate <strong>the</strong><br />
same products on liking<br />
• this result is projected in <strong>the</strong><br />
product space<br />
• from <strong>the</strong>se two data sets, <strong>the</strong><br />
coordinates of <strong>the</strong> best liked<br />
or <strong>ideal</strong> products are obtained<br />
by statistical <strong>method</strong>s (for instance Prefmap)<br />
7002<br />
7
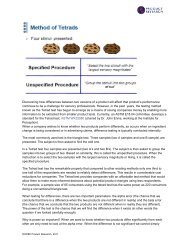
<strong>the</strong> JAR approach from applied consumer<br />
research<br />
• market researchers also use <strong>method</strong>s to derive <strong>the</strong> <strong>ideal</strong> product attribute<br />
levels<br />
• <strong>the</strong>y go directly to <strong>the</strong> consumer and use consumer input derived from <strong>the</strong><br />
Just About Right (JAR) <strong>method</strong>ology<br />
• with <strong>the</strong> JAR <strong>method</strong>ology:<br />
• consumers rate <strong>the</strong> products on several intensity attributes and<br />
indicate for each attribute whe<strong>the</strong>r it is too weak, too strong or “just about<br />
right”<br />
• this is a combined judgment (estimate <strong>the</strong> intensity, check it against<br />
your <strong>ideal</strong> and decide how far away from is it from that <strong>ideal</strong>), <strong>the</strong><br />
outcome is <strong>the</strong> deviation from <strong>ideal</strong><br />
• <strong>the</strong>y also rate <strong>the</strong>ir liking of <strong>the</strong> products<br />
7002<br />
8
comparison of JAR and conventional<br />
JAR<br />
• consumers give a direct assessment<br />
of <strong>the</strong> attribute deviations from<br />
<strong>ideal</strong> and of <strong>the</strong>ir appreciation<br />
• <strong>the</strong> assessment of deviations from<br />
<strong>the</strong> <strong>ideal</strong> introduces a hedonic/-<br />
evaluative tone (bitterness is too<br />
weak or just about right)<br />
• although <strong>the</strong> <strong>method</strong>ology is<br />
simple and straightforward, it only<br />
indicates <strong>the</strong> direction of <strong>the</strong> change<br />
but does not tell how much change<br />
is needed<br />
• <strong>the</strong>re is only an implicit <strong>ideal</strong><br />
Conventional<br />
• a sensory panel gives absolute<br />
analytical judgements of <strong>the</strong>ir perceptions,<br />
this results in a perceptual map<br />
• <strong>the</strong>se assessments are purely<br />
analytical without hedonic/evaluative<br />
influences<br />
• next, consumers rate <strong>the</strong> same<br />
products on overall liking and <strong>the</strong> liking<br />
ratings are linked to <strong>the</strong> perceptual<br />
map<br />
• <strong>the</strong> <strong>method</strong>ology is time consuming:<br />
<strong>the</strong> product space is constructed from<br />
a (trained) sensory panel and liking<br />
must be obtained from a representative<br />
consumer panel<br />
• <strong>ideal</strong>s are calculated through<br />
regression analysis<br />
7002<br />
9
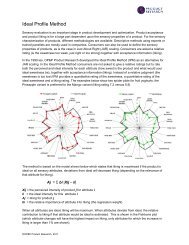
<strong>the</strong> third way: a combined approach<br />
• <strong>the</strong> combined approach (<strong>the</strong> Ideal <strong>Profile</strong> Method) lets consumers<br />
rate <strong>the</strong> perceived attribute intensities and <strong>the</strong> <strong>ideal</strong> intensities<br />
separately<br />
• this results in a (consumer defined) sensory and <strong>ideal</strong> profile and in<br />
consumer acceptance data for <strong>the</strong> same products<br />
7002<br />
10
<strong>the</strong> Ideal <strong>Profile</strong> Method: principles<br />
• consumers profile <strong>the</strong> products on 20-30 sensory attributes and 6-10<br />
acceptance aspects<br />
• for each attribute, <strong>the</strong>y rate <strong>the</strong> perceived intensity and <strong>the</strong> preferred or <strong>ideal</strong><br />
intensity (this is done for each product)<br />
• this results in a perceived and <strong>ideal</strong> profile for each product<br />
• <strong>the</strong> underlying sensory dimensions are extracted from <strong>the</strong> intensity ratings by<br />
means of PCA with varimax rotation on <strong>the</strong> total data (products and subjects)<br />
• this results in a smaller number of combined attributes or<br />
dimensions<br />
• regression of overall liking on <strong>the</strong> factor scores shows <strong>the</strong> regression weights<br />
(relative importance of <strong>the</strong> different dimensions for liking), <strong>the</strong>se are used to<br />
calculate <strong>the</strong> effects of optimization<br />
7002<br />
11
comparing <strong>the</strong> three approaches<br />
• <strong>the</strong> Conventional, JAR and Ideal <strong>Profile</strong> <strong>method</strong> differ in <strong>the</strong> way <strong>the</strong><br />
different measures are obtained<br />
measure<br />
conventional<br />
JAR<br />
Ideal <strong>Profile</strong><br />
Aj<br />
overall liking<br />
measured<br />
measured<br />
measured<br />
bi<br />
attribute importance<br />
calculated<br />
calculated<br />
calculated<br />
Xij<br />
attribute perception<br />
measured<br />
n.a.<br />
measured<br />
Ii<br />
attribute <strong>ideal</strong> point<br />
calculated<br />
n.a.<br />
measured<br />
|X-I| attribute deviation<br />
calculated 1<br />
measured<br />
calculated 2<br />
• <strong>the</strong> results show a substantial equivalence and a high degree of<br />
convergent validity<br />
reference:<br />
The quest for <strong>the</strong> <strong>ideal</strong> product: comparing different <strong>method</strong>s and approaches;<br />
van Trijp, Punter, Mickartz and Kruithof, FQP, 2007, 18, 729-741<br />
7002<br />
12
a practical example: yoghourt<br />
• five different yoghourts have been<br />
evaluated:<br />
• <strong>the</strong> current formulation<br />
• two new varieties<br />
• a private label variety<br />
• a competitor<br />
• a total of 85 consumers participated (65% females; between 20-60 years old,<br />
all users of plain yoghourt)<br />
• <strong>the</strong>y rated each yoghourt on 32 aspects, both for perceived and <strong>ideal</strong><br />
intensity; on six acceptance aspects and on overall liking<br />
• <strong>the</strong> products have been presented in a sequential monadic test, presentation<br />
order was balanced, <strong>the</strong>y received 100 ml of each variety<br />
7002<br />
13
step 1: spiders<br />
• <strong>the</strong> first step is to make spider plots of <strong>the</strong> average intensity ratings for<br />
each product and of <strong>the</strong> <strong>ideal</strong> ratings<br />
• since <strong>the</strong> <strong>ideal</strong>s do not differ significantly from each o<strong>the</strong>r over<br />
products, <strong>the</strong> average <strong>ideal</strong> is taken<br />
• this will point out on which attributes <strong>the</strong> products differ from <strong>ideal</strong>, but<br />
it does not tell us how important this deviation is<br />
7002<br />
14
<strong>the</strong> sensory and <strong>ideal</strong> profiles for current and<br />
new<br />
• <strong>the</strong> <strong>ideal</strong><br />
(black line) is<br />
averaged over<br />
all 5 products<br />
• Liking rating<br />
Current:: 5,7<br />
New-V1: 6,6<br />
New-V2: 6,4<br />
Current5155 New-V1-5155 New-V2-5155 Ideal5155<br />
fresh aftertaste<br />
length aftert<br />
intensity aftert<br />
sour aftertaste<br />
astringent aftert<br />
bitter aftertaste<br />
odour intensity sour odour<br />
sweet odour<br />
40<br />
fresh odour<br />
natural odour<br />
yoghurt odour<br />
taste intensity<br />
smooth mouthfeel<br />
sweet taste<br />
slimy mouthf<br />
sour taste<br />
fattiness<br />
full taste<br />
watery taste<br />
creamy taste<br />
firmness<br />
thick mouthf<br />
off taste<br />
stale taste<br />
astringent taste<br />
bitter taste<br />
mild taste<br />
fresh taste<br />
natural taste<br />
yoghurt taste<br />
artificial taste<br />
7002<br />
15
<strong>the</strong> sensory and <strong>ideal</strong> profiles for current and<br />
o<strong>the</strong>rs<br />
• Liking rating<br />
Current:: 5,7<br />
PL: 5,0<br />
Comp: 6,1<br />
7002<br />
16
drivers of liking<br />
• next, <strong>the</strong> importance of <strong>the</strong> deviations for liking has to be estimated<br />
• step 1: <strong>the</strong> underlying perceptual dimensions are computed<br />
(PCA with varimax rotation on <strong>the</strong> sensory attributes)<br />
• step 2: regression of overall liking on <strong>the</strong> factor scores to<br />
estimate <strong>the</strong> regression weights (β)<br />
7002<br />
17
<strong>the</strong> underlying perceptual dimensions and β’s<br />
• <strong>the</strong> PCA extracted seven factors from <strong>the</strong> 32 intensity attributes (67% VAF):<br />
F1 Bitter/astringent<br />
F2 Fresh/creamy<br />
F3 Odour aspects<br />
F4 Thickness<br />
F5 Aftertaste<br />
F6 Slimy/fat<br />
F7 Sweet/not-sour<br />
• regression analysis of <strong>the</strong> liking ratings on <strong>the</strong> factor scores revealed <strong>the</strong><br />
following drivers of liking (r=0,73; blue=positive and red=negative driver):<br />
fresh/creamy<br />
sweet/not-sour<br />
thickness<br />
slimy<br />
aftertaste<br />
bitter/astringent<br />
-0,60 -0,40 -0,20 0,00 0,20 0,40 0,60<br />
7002<br />
18
computation of <strong>the</strong> contributions per attribute<br />
• <strong>the</strong> regression weights (β) tell us how much each factor or PCA<br />
contributes to liking<br />
• <strong>the</strong> next step is to compute <strong>the</strong> contribution for <strong>the</strong> individual attributes<br />
7002<br />
19
deviation from <strong>ideal</strong> and <strong>the</strong> contribution to<br />
overall liking by attribute<br />
• for each attribute within a factor, <strong>the</strong> contribution to overall liking is computed<br />
using <strong>the</strong> formula:<br />
j<br />
# factors<br />
∑<br />
k=<br />
1<br />
effect _ attribute = factorloading * beta<br />
in which k is <strong>the</strong> number of factors and j <strong>the</strong> number of attributes<br />
• for each product and attribute, <strong>the</strong> deviation from <strong>ideal</strong> is computed (delta).<br />
• multiplication of delta with <strong>the</strong> “effect_attribute j<br />
” gives <strong>the</strong> amount of change in<br />
overall liking for that product if that attribute would be <strong>ideal</strong>.<br />
• next, <strong>the</strong> relative change is computed (<strong>the</strong> effect on overall liking when <strong>the</strong><br />
attribute gets an <strong>ideal</strong> rating)<br />
• <strong>the</strong> resulting data are plotted for <strong>the</strong> most important attributes (per attribute<br />
<strong>the</strong> absolute difference from <strong>ideal</strong> and <strong>the</strong> relative increment of overall liking if<br />
that attribute is rated <strong>ideal</strong>)<br />
jk<br />
k<br />
7002<br />
20
suggestions for improvement - Current one<br />
• decrease:<br />
• sour and bitter (after)taste<br />
• astringent (after)taste<br />
• this effects:<br />
• off taste, stale and artificial taste<br />
• increase:<br />
• sweetness and creaminess<br />
• freshness and yoghurt character<br />
• this effects:<br />
• natural, mild and full taste<br />
<strong>the</strong> relative effect<br />
on liking (left axis,<br />
yellow bars) when<br />
<strong>the</strong> specific<br />
attributes reach<br />
<strong>ideal</strong> levels (right<br />
axis, marked lines)<br />
20%<br />
10%<br />
0%<br />
-10%<br />
sour taste<br />
Current (liking 5,7)<br />
sweet odour<br />
full taste<br />
yoghurt taste<br />
artificial taste<br />
stale taste<br />
difference from <strong>ideal</strong> (red=too much, green=too little)<br />
fresh taste<br />
fresh aftertaste<br />
off taste<br />
creamy taste<br />
sweet taste<br />
astringent aftert<br />
bitter taste<br />
astringent taste<br />
mild taste<br />
natural taste<br />
bitter aftertaste<br />
30<br />
20<br />
10<br />
0<br />
-10<br />
-20<br />
-20%<br />
-30<br />
7002<br />
21
30<br />
best liked New-V1 and least liked Private label<br />
20<br />
10<br />
0<br />
22<br />
• New-V1 is rated 6,6<br />
and Private label 5,0<br />
• <strong>the</strong> Private label<br />
lacks thickness, mildness,<br />
natural taste<br />
and freshness<br />
• it is too watery,<br />
astringent and bitter<br />
20%<br />
10%<br />
0%<br />
-10%<br />
New-V1 (liking 6,6) difference from <strong>ideal</strong> (red=too much, green=too little)<br />
off taste<br />
artificial<br />
taste<br />
yoghurt<br />
taste<br />
full taste<br />
astringent<br />
aftert<br />
sweet<br />
taste<br />
stale taste<br />
bitter taste<br />
creamy<br />
taste<br />
fresh<br />
aftertaste<br />
fresh taste<br />
bitter<br />
aftertaste<br />
mild taste<br />
natural<br />
taste<br />
astringent<br />
taste<br />
-20%<br />
7002<br />
-10<br />
-20<br />
-30<br />
30<br />
20<br />
10<br />
0<br />
20%<br />
Private label (5,0) difference from <strong>ideal</strong> (red=too much, green=too little)<br />
10%<br />
0%<br />
stale taste<br />
watery taste<br />
off taste<br />
sweet taste<br />
artificial<br />
taste<br />
yoghurt<br />
taste<br />
fresh taste<br />
astringent<br />
aftert<br />
astringent<br />
taste<br />
fresh<br />
aftertaste<br />
bitter taste<br />
bitter<br />
aftertaste<br />
thick<br />
appearance<br />
firmness<br />
thick mouthf<br />
mild taste<br />
natural taste<br />
full taste<br />
creamy<br />
taste<br />
-10%<br />
-20%<br />
-10<br />
-20<br />
-30
summary and conclusions<br />
• <strong>the</strong> different <strong>method</strong>ologies for product development or improvement have in<br />
common that <strong>the</strong>y want to increase consumer liking by making <strong>the</strong> difference<br />
between perceived and <strong>ideal</strong> attribute intensities smaller<br />
• <strong>the</strong>y differ in <strong>the</strong> way <strong>the</strong>y want to achieve this, and range from very time<br />
consuming and complex to relatively quick and simple<br />
• <strong>the</strong> Ideal <strong>Profile</strong> Method is presented as an alternative for <strong>the</strong> conventional<br />
and <strong>the</strong> JAR <strong>method</strong>. Instead of using estimated or implicit <strong>ideal</strong>s, <strong>the</strong> IPM asks<br />
consumers explicitly to rate <strong>the</strong>ir <strong>ideal</strong> intensity<br />
• <strong>the</strong> result of <strong>the</strong> analysis is a plot which shows for each attribute <strong>the</strong> deviation<br />
from <strong>ideal</strong> and its <strong>the</strong> potential relative contribution to liking<br />
• this information can guide product developers in product optimization, but<br />
keep in mind to:<br />
….. refrain from what you shouldn't do, and do what you<br />
shouldn't refrain from (and don’t miss opportunities!)<br />
7002<br />
23
Questions?<br />
• are <strong>the</strong>re any questions?<br />
7002<br />
24