Panel monitoring using Senstools 3.3
Panel monitoring using Senstools 3.3
Panel monitoring using Senstools 3.3

Create successful ePaper yourself
Turn your PDF publications into a flip-book with our unique Google optimized e-Paper software.
<strong>Panel</strong> <strong>monitoring</strong><br />
<strong>using</strong> <strong>Senstools</strong> v<strong>3.3</strong><br />
August 2005
Introduction<br />
‣ QDA panels<br />
‣ function, setup and maintenance<br />
‣ quality criteria<br />
‣ which requirements<br />
‣ how to monitor<br />
‣ <strong>monitoring</strong> panelist performance <strong>using</strong> <strong>Senstools</strong>
QDA or descriptive panels<br />
‣ trained assessors (6 to12)<br />
‣ product characterization by a fixed vocabulary<br />
‣ individual assessments, specified presentation<br />
design, controlled environment<br />
‣ often repeated measures (each product is rated two<br />
or three times by all assessors)
Structuur QDA data<br />
Structure of descriptive data<br />
(N ´ M) datamatrix X k<br />
data from 1 assessor<br />
(often replicates)<br />
N products<br />
K assessors<br />
M attributes<br />
3-mode data structure conventional<br />
profiling:<br />
N products are rated by K assessors<br />
on M attributes for p presentations<br />
(replicates)
The dataset<br />
‣ 10 assessors (‘sets’), 10 products (‘objects), 2<br />
presentations<br />
‣ 11 attributes: flower, rose, evergreen, wood, burnt,<br />
alcohol, pungent, medicinal, sulphur, grape, bitter<br />
‣ in total 2200 datapoints<br />
dataset with courtesy from<br />
Compusense, data from expert<br />
wine panel, original attribute<br />
names have been recoded,<br />
only part of the data is used
Data example<br />
Replica Assessor Product flower rose evergreen wood burnt alcohol pungent medicinal sulpher<br />
1 1 4 22 12 24 1 2 71 61 8 1<br />
2 1 4 25 7 7 1 1 50 16 8 1<br />
1 1 5 2 1 1 1 1 91 62 10 2<br />
2 1 5 1 1 2 10 1 47 20 10 1<br />
1 1 7 21 0 1 1 1 74 50 10 1<br />
2 1 7 1 6 8 0 2 62 38 7 0<br />
1 1 8 24 1 36 1 1 50 25 6 1<br />
2 1 8 1 1 2 9 1 61 43 7 14<br />
1 1 10 49 17 8 1 1 74 62 6 9<br />
2 1 10 21 2 11 2 1 74 62 8 1<br />
1 1 11 1 1 8 1 1 61 42 1 0<br />
2 1 11 18 1 7 1 1 51 20 6 1<br />
1 1 13 50 25 10 1 2 74 60 13 4<br />
2 1 13 43 15 7 2 0 99 86 2 1<br />
1 1 17 39 20 8 1 8 89 74 7 1<br />
2 1 17 47 19 6 1 1 72 31 7 1<br />
1 1 18 0 1 1 9 15 52 25 9 26<br />
2 1 18 21 1 7 9 13 71 33 8 31<br />
1 1 20 51 18 8 1 4 87 86 10 2<br />
2 1 20 15 1 6 1 0 57 11 7 1<br />
1 4 4 18 0 11 0 0 47 80 0 22<br />
2 4 4 12 25 4 0 0 47 82 0 8<br />
1 4 5 16 0 0 0 0 43 78 0 17<br />
2 4 5 18 0 0 0 5 77 81 0 0<br />
1 4 7 15 0 7 0 0 57 64 0 0<br />
2 4 7 9 0 0 0 4 65 78 34 0<br />
1 4 8 8 0 8 0 2 78 83 0 0<br />
2 4 8 10 0 14 0 0 75 80 14 0<br />
1 4 10 12 28 0 0 0 69 77 0 5<br />
2 4 10 28 25 6 0 0 78 89 0 0<br />
1 4 11 13 15 17 0 0 73 82 0 0<br />
2 4 11 17 24 7 0 0 57 56 0 0<br />
1 4 13 21 28 0 0 2 43 81 6 12<br />
2 4 13 27 31 4 0 0 57 86 0 20
<strong>Panel</strong> performance measures<br />
‣ Reliability and repeatability of assessors: do they give the same<br />
ratings to the same products – this requires repeated measures !<br />
‣ Validity: do the assessor rate the products in a similar way<br />
(correlations between each individual assessor and the others:<br />
do they agree?)<br />
‣ Discrimination: does the individual assessor and the panel as a<br />
whole rate different products as different?
Reliability<br />
‣ in order to establish whether an individual can discriminate<br />
between products (i.e. give the same ratings to identical<br />
products and different ratings to different products) we need a<br />
measure of variability<br />
‣ when products are rated more than once, we can compute the<br />
variance of ratings of the same product (within-product<br />
variance of MS within ) and for ratings of different products<br />
(between-product variance of MS between )<br />
‣ an assessor is considered to be discriminating when the<br />
within product variance is smaller than the between product<br />
variance<br />
‣ this is the ‘assessor statistic’ or the ratio<br />
MS between products /MS within<br />
‣ without replicates there is no MS within
Assessor statistics in <strong>Senstools</strong><br />
Assessor statistics sulphur:<br />
ratio between/within variance for each<br />
assessor (Mssq object/Mssq error)<br />
>1=more variance for different products<br />
than for same products<br />
1=same variance for different or same<br />
products<br />
Repeated measures<br />
Visualization assessor statistics in <strong>Senstools</strong><br />
view by attribute (for each assessor)
Repeated measures<br />
Visualization assessor statistics in <strong>Senstools</strong><br />
view by subject (for each attribute)<br />
11 attributes
Repeated measures<br />
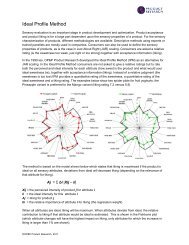
Validity<br />
‣ for each subject: all subjects must show comparable rating<br />
behavior (they have been trained for that): the ratings of the<br />
subjects should at least correlate positively<br />
‣ furthermore, the ‘between-subject’ variance should be small<br />
(MS panelist / MS error < 1)<br />
‣ for the panel as a whole: panelist should not disagree too much, in<br />
other words there should be little or no interaction between subject<br />
and product
Repeated measures<br />
Correlations between individual and panel<br />
for each subject, the object<br />
ratings for each attribute<br />
are standardized and the<br />
correlation coefficients are<br />
computed between the<br />
subject and the rest of the<br />
panel<br />
in this example, there are 11<br />
attributes and 10 products<br />
resulting in 110 z-scores for<br />
each subject<br />
Agreement Between Assessors<br />
(Correlations)<br />
number of<br />
subjects<br />
4<br />
3<br />
2<br />
1<br />
-1.0-0.9-0.8-0.7-0.6-0.5-0.4-0.3-0.2-0.10.0 0.1 0.2 0.3 0.4 0.5 0.6 0.7 0.8 0.9 1.0 1.1<br />
negatieve correlations<br />
positieve correlations<br />
distribution of correlations of subject X with<br />
the panel without subject X (total of 10<br />
coefficients when there are 10 subjects)
Repeated measures<br />
Between subject variance<br />
‣ the ‘between-subject’ variance should be small, they should all<br />
give similar ratings for a given attribute to a product:<br />
(MS panelist / MS error small)<br />
‣ for each object and attribute, the variability between assessors is<br />
computed (the object statistics in <strong>Senstools</strong>) and graphically<br />
represented: see example for attribute bitter<br />
100<br />
no disagreement<br />
for object 5<br />
bitter<br />
much disagreement<br />
for object 11<br />
10<br />
1<br />
object 4 object 5 object 7 object 8 object 10 object 11 object 13 object 17 object 18 object 20<br />
.1
Repeated measures<br />
variance between subjects<br />
‣ example of the individual ratings on attribute bitter for object 5<br />
(F-ratio 1.1) and object 11 (F-ratio 14.9)<br />
100<br />
90<br />
80<br />
70<br />
60<br />
50<br />
40<br />
30<br />
20<br />
10<br />
0<br />
Judge 100<br />
Judge 81<br />
Judge 64<br />
Judge 49<br />
Judge 36<br />
Judge 25<br />
Judge 16<br />
Judge 9<br />
Judge 4<br />
Judge 1
Visualization Repeated variance measures between subjects<br />
view by attribute (for each object)
Visualization Repeated variance measures between subjects<br />
view by object (for each attribute)
Repeated measures<br />
Interaction effects<br />
‣ for the panel as a whole: panelist should not disagree too much, in<br />
other words there should be little or no interaction between subject<br />
and product<br />
‣ <strong>Senstools</strong> shows the F ratio’s of the assessor and object variance<br />
for the MS-error and MS-interaction term
Repeated measures<br />
Interaction effects F-ratio objects<br />
RM ANOVA Object Interaction F Ratios by Attribute<br />
F-ratio<br />
100<br />
significant interactions between<br />
assessors and products<br />
F obj<br />
10<br />
significant difference<br />
between objects<br />
1<br />
no significant<br />
difference between<br />
objects<br />
F int obj<br />
0.1<br />
flowers evergreen burnt pungent sulphur bitter<br />
rose wood alcohol medicinal grape
Repeated measures<br />
Interaction effects F-ratio assessors<br />
RM ANOVA Set Interaction F Ratios by Attribute<br />
F-ratio<br />
100<br />
significant interactions between<br />
assessors and products<br />
F ass<br />
10<br />
significant difference<br />
between assessors<br />
1<br />
no significant difference<br />
between assessors<br />
F int ass<br />
0.1<br />
flowers evergreen burnt pungent sulphur bitter<br />
rose wood alcohol medicinal grape
Repeated measures<br />
Interaction effects burnt, sulphur & wood<br />
Attribute ratings<br />
for burnt, sulpher<br />
and wood by<br />
subject<br />
Subj 1 Subj 2 Subj 3 Subj 4 Subj 5 Subj 6 Subj 7 Subj 8 Subj 9 Subj 10<br />
100<br />
80<br />
burnt, no significant interaction<br />
60<br />
40<br />
20<br />
0<br />
object 4 object 5 object 7 object 8 object 10 object 11 object 13 object 17 object 18 object 20<br />
100<br />
80<br />
sulpher, significant interaction<br />
60<br />
40<br />
20<br />
0<br />
object 4 object 5 object 7 object 8 object 10 object 11 object 13 object 17 object 18 object 20<br />
100<br />
80<br />
wood, significant interaction<br />
60<br />
40<br />
20<br />
0<br />
object 4 object 5 object 7 object 8 object 10 object 11 object 13 object 17 object 18 object 20
Repeated measures<br />
Table of means<br />
obj 4<br />
obj 5<br />
obj 7<br />
obj 8<br />
obj 10<br />
obj 11<br />
obj 13<br />
obj 17<br />
obj 18<br />
obj 20<br />
flowers<br />
17<br />
15<br />
19<br />
18<br />
26<br />
16<br />
28<br />
22<br />
13<br />
24<br />
rose<br />
13<br />
13<br />
18<br />
13<br />
18<br />
15<br />
23<br />
16<br />
10<br />
17<br />
evergreen<br />
17<br />
11<br />
10<br />
16<br />
12<br />
13<br />
13<br />
15<br />
10<br />
15<br />
wood<br />
8<br />
3<br />
6<br />
4<br />
4<br />
3<br />
4<br />
3<br />
12<br />
2<br />
burnt<br />
9<br />
3<br />
4<br />
7<br />
3<br />
3<br />
5<br />
3<br />
9<br />
4<br />
alcohol<br />
51<br />
54<br />
53<br />
55<br />
62<br />
51<br />
61<br />
62<br />
54<br />
56<br />
pungent<br />
55<br />
55<br />
54<br />
59<br />
65<br />
53<br />
67<br />
62<br />
59<br />
60<br />
medicinal<br />
4<br />
3<br />
9<br />
5<br />
5<br />
2<br />
6<br />
4<br />
6<br />
4<br />
sulphur<br />
20<br />
3<br />
5<br />
4<br />
3<br />
2<br />
7<br />
2<br />
25<br />
6<br />
grape<br />
37<br />
39<br />
41<br />
39<br />
41<br />
41<br />
39<br />
39<br />
30<br />
41<br />
red: significant at 1%<br />
blue: significant at 5%
Repeated measures<br />
To summarize<br />
‣ without individual reliability no valid panel and no valid measuring<br />
instrument<br />
‣ full diagnosis requires repeated measures<br />
‣ performance of assessors can be diagnosed very accurately<br />
provided the right data and right analysis tools<br />
Questions about panel<strong>monitoring</strong> or <strong>Senstools</strong> v<strong>3.3</strong>?<br />
Contact Pieter Punter at pieter@opp.nl<br />
see also: Example-GPA Using <strong>Senstools</strong> v<strong>3.3</strong>