LATEX and WinEdt for MA4053
LATEX and WinEdt for MA4053
LATEX and WinEdt for MA4053

Create successful ePaper yourself
Turn your PDF publications into a flip-book with our unique Google optimized e-Paper software.
in the bibliography will be. Using 99 <strong>for</strong> st<strong>and</strong>ard numbered labels normally<br />
suffices (unless you’ve been reading very widely. . . ), but something like [MMM]<br />
would be better <strong>for</strong> three letter labelling.<br />
6 Further possibilities<br />
This document barely scratches the surface of what is possible within L A TEX,<br />
but should cover most of what you need <strong>for</strong> your project write-up. Most<br />
obviously I have left out all discussion about changing the layout, type size,<br />
font etc. as this would take you further from the goal of producing a report<br />
in a short space of time that conveys your researches of the last few months.<br />
References [1, 3, 4] can be consulted <strong>for</strong> more in<strong>for</strong>mation if you are interested<br />
(at a later date. . . )<br />
Many of the further extensions are achieved by loading additional package.<br />
We are already using some packages produced by the American Mathematical<br />
Society, <strong>and</strong> many more are available already on the computers in<br />
the lab. It is possible to find the relevant documentation there, or, possibly<br />
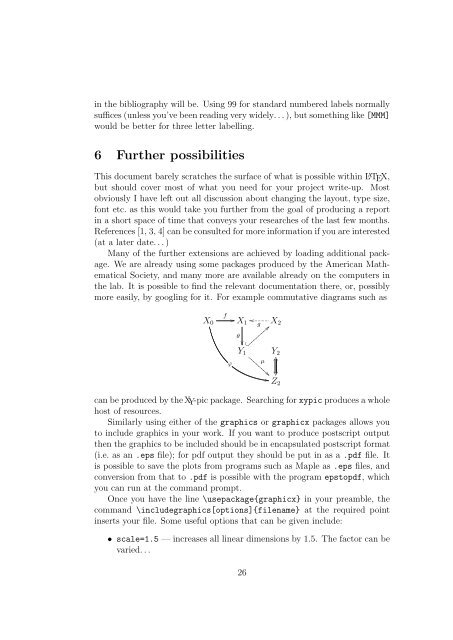
more easily, by googling <strong>for</strong> it. For example commutative diagrams such as<br />
X 0<br />
f<br />
ϕ<br />
X 1 g<br />
X 2<br />
θ<br />
<br />
Y 1 Y 2<br />
µ<br />
<br />
Z 2<br />
can be produced by the XY-pic package. Searching <strong>for</strong> xypic produces a whole<br />
host of resources.<br />
Similarly using either of the graphics or graphicx packages allows you<br />
to include graphics in your work. If you want to produce postscript output<br />
then the graphics to be included should be in encapsulated postscript <strong>for</strong>mat<br />
(i.e. as an .eps file); <strong>for</strong> pdf output they should be put in as a .pdf file. It<br />
is possible to save the plots from programs such as Maple as .eps files, <strong>and</strong><br />
conversion from that to .pdf is possible with the program epstopdf, which<br />
you can run at the comm<strong>and</strong> prompt.<br />
Once you have the line \usepackage{graphicx} in your preamble, the<br />
comm<strong>and</strong> \includegraphics[options]{filename} at the required point<br />
inserts your file. Some useful options that can be given include:<br />
• scale=1.5 — increases all linear dimensions by 1.5. The factor can be<br />
varied. . .<br />
26