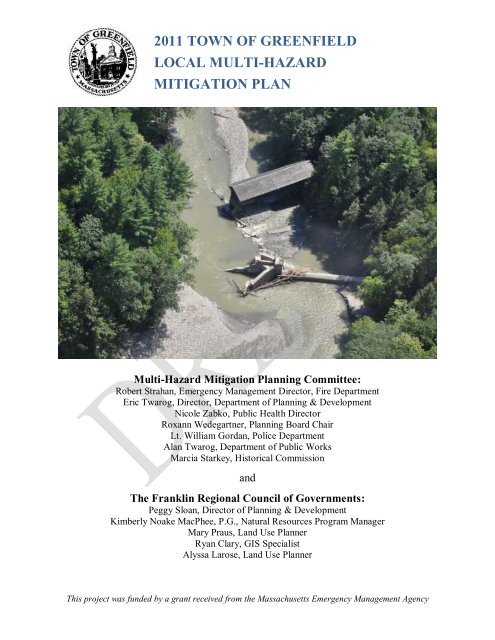
2011 town of greenfield local multi-hazard mitigation plan
2011 town of greenfield local multi-hazard mitigation plan
2011 town of greenfield local multi-hazard mitigation plan

You also want an ePaper? Increase the reach of your titles
YUMPU automatically turns print PDFs into web optimized ePapers that Google loves.
<strong>2011</strong> TOWN OF GREENFIELD<br />
LOCAL MULTI-HAZARD<br />
MITIGATION PLAN<br />
Multi-Hazard Mitigation Planning Committee:<br />
Robert Strahan, Emergency Management Director, Fire Department<br />
Eric Twarog, Director, Department <strong>of</strong> Planning & Development<br />
Nicole Zabko, Public Health Director<br />
Roxann Wedegartner, Planning Board Chair<br />
Lt. William Gordan, Police Department<br />
Alan Twarog, Department <strong>of</strong> Public Works<br />
Marcia Starkey, Historical Commission<br />
and<br />
The Franklin Regional Council <strong>of</strong> Governments:<br />
Peggy Sloan, Director <strong>of</strong> Planning & Development<br />
Kimberly Noake MacPhee, P.G., Natural Resources Program Manager<br />
Mary Praus, Land Use Planner<br />
Ryan Clary, GIS Specialist<br />
Alyssa Larose, Land Use Planner<br />
This project was funded by a grant received from the Massachusetts Emergency Management Agency
Cover: Eunice Williams Covered Bridge knocked from its footings during Hurricane Irene
Table <strong>of</strong> Contents<br />
1- INTRODUCTION .......................................................................................................................................... 5<br />
Hazard Mitigation ...............................................................................................................5<br />
Plan Updates and Changes ...................................................................................................7<br />
2 – LOCAL PROFILE ........................................................................................................................................ 8<br />
Community Setting..............................................................................................................8<br />
Infrastructure .......................................................................................................................9<br />
Natural Resources ............................................................................................................. 10<br />
Cultural and historic Resources ......................................................................................... 12<br />
3 - RISK ASSESSMENT ................................................................................................................................... 15<br />
Multi-Hazard Identification and Pr<strong>of</strong>ile ............................................................................. 15<br />
Risk Assessment Methodology .......................................................................................... 50<br />
Vulnerability Assessment .................................................................................................. 55<br />
Development Trends Analysis ........................................................................................... 83<br />
4 – MITIGATION STRATEGIES ...................................................................................................................... 87<br />
Current Mitigation Strategies ............................................................................................. 87<br />
Future Mitigation Strategies ............................................................................................ 118<br />
<strong>2011</strong> Action Plan ............................................................................................................. 119<br />
National Flood Insurance Program Compliance ............................................................... 130<br />
5 – PLAN ADOPTION AND MAINTENANCE ................................................................................................ 134<br />
Plan Adoption ................................................................................................................. 134<br />
Monitoring, Evaluating, and Updating the Plan ............................................................... 134<br />
6 – APPENDICES.......................................................................................................................................... 137<br />
Appendix A: Zoning Bylaws and Subdivision Regulations .............................................. 137<br />
Appendix B: Massachusetts Cultural Resource Information System ................................ 147<br />
Appendix C: In the News ................................................................................................ 159<br />
Appendix D: Town Correspondence, Public Outreach, Sign Ins, Agendas ....................... 172<br />
Appendix E: Plan Approval and Adoption ....................................................................... 181
1- INTRODUCTION<br />
Hazard Mitigation<br />
The Federal Emergency Management Agency (FEMA) and the Massachusetts Emergency<br />
Management Agency (MEMA) define Hazard Mitigation as any sustained action taken to reduce<br />
or eliminate long-term risk to people and property from natural <strong>hazard</strong>s such as flooding, storms,<br />
high winds, hurricanes, wildfires, earthquakes, and other disasters. Mitigation efforts undertaken<br />
by communities will help to minimize damages to buildings and infrastructure, such as water<br />
supplies, sewers, and utility transmission lines, as well as natural, cultural and historic resources.<br />
Planning efforts, like the one undertaken by the Town <strong>of</strong> Greenfield and the Franklin Regional<br />
Council <strong>of</strong> Governments, make <strong>mitigation</strong> a proactive process. Pre-disaster <strong>plan</strong>ning emphasizes<br />
actions that can be taken before a natural disaster occurs. Future property damage and loss <strong>of</strong><br />
life can be reduced or prevented by a <strong>mitigation</strong> program that addresses the unique geography,<br />
demography, economy, and land use <strong>of</strong> a community within the context <strong>of</strong> each <strong>of</strong> the specific<br />
potential natural <strong>hazard</strong>s that may threaten a community.<br />
Preparing a Local Multi-Hazard Mitigation Plan before a disaster occurs can save the community<br />
money and will facilitate post-disaster funding. Costly repairs or replacement <strong>of</strong> buildings and<br />
infrastructure, as well as the high cost <strong>of</strong> providing emergency services and rescue/recovery<br />
operations, can be avoided or significantly lessened if a community implements the <strong>mitigation</strong><br />
measures detailed in the Plan. Many disaster assistance agencies and programs, including<br />
FEMA, require that a community have adopted a pre-disaster <strong>mitigation</strong> <strong>plan</strong> as a condition for<br />
both <strong>mitigation</strong> funding and for disaster relief funding. For example, the Hazard Mitigation<br />
Grant Program (HMGP), the Flood Mitigation Assistance Program (FMA) and the Community<br />
Rating System (CRS), are programs with this requirement.<br />
Planning Process<br />
The <strong>hazard</strong> <strong>mitigation</strong> <strong>plan</strong>ning process for the Town <strong>of</strong> Greenfield included the following tasks:<br />
Review <strong>of</strong> the Greenfield 2005 Local Multi-Hazard Mitigation Plan, assessment <strong>of</strong><br />
relevancy <strong>of</strong> existing materials, status <strong>of</strong> action items and addition <strong>of</strong> new materials based<br />
upon MEMA recommendations and Committee input.<br />
Identification <strong>of</strong> the <strong>hazard</strong>s that may impact the community, and past occurrences <strong>of</strong><br />
<strong>hazard</strong>s at the <strong>local</strong> or regional level.<br />
Performance <strong>of</strong> a Vulnerability/Risk Assessment to identify the infrastructure (i.e.,<br />
critical facilities, public buildings, roads, homes, businesses, etc.) at the highest risk for<br />
being damaged by the identified <strong>hazard</strong>s, particularly flooding.<br />
Identification and assessment <strong>of</strong> the policies, programs, and regulations a community is<br />
currently implementing to protect against future disaster damages. Examples <strong>of</strong> such<br />
strategies include:<br />
Town <strong>of</strong> Greenfield Multi-Hazard Mitigation Plan <strong>2011</strong> • Final Draft 10/25/11 • Page 5
o Preventing or limiting development in <strong>hazard</strong> areas like floodplains, wetlands,<br />
drinking water recharge areas, and conservation land;<br />
o Implementing recommendations in <strong>plan</strong>ning documents including Stormwater<br />
Management Plans, Master (Comprehensive) Plans, Open Space and Recreation<br />
Plans, Emergency/Evacuation Plans that address the impacts <strong>of</strong> <strong>hazard</strong>s; and<br />
o Requiring or encouraging the use <strong>of</strong> specific structural requirements for new<br />
buildings such as buried utilities, flood-pro<strong>of</strong>ed structures, and lightening<br />
grounding systems.<br />
Identification <strong>of</strong> deficiencies in the current strategies and establish goals for updating,<br />
revising or adopting new strategies.<br />
Identification <strong>of</strong> specific projects that will mitigate the risk to public safety and damages<br />
to infrastructure from <strong>hazard</strong>s.<br />
Adoption and implementation <strong>of</strong> the Final Multi-Hazard Mitigation Plan.<br />
Additionally, the Town <strong>of</strong> Greenfield and FRCOG:<br />
Provided an opportunity for the public to comment on the <strong>plan</strong> during the drafting and prior<br />
to the approval <strong>of</strong> the <strong>plan</strong>. Publicity was done with a press release in the Greenfield<br />
Recorder as well as through flyers posted in <strong>town</strong> throughout the <strong>plan</strong>ning process. A copy <strong>of</strong><br />
the draft <strong>plan</strong> was available to the public at the Greenfield Planning Department. Two Public<br />
Meetings were held – one each on August 18, 2010 and August 30, <strong>2011</strong>.<br />
Provided an opportunity for neighboring communities, <strong>local</strong> and regional agencies involved<br />
in <strong>hazard</strong> <strong>mitigation</strong> activities and agencies that have the authority to regulate development,<br />
and businesses, academia and other private and nonpr<strong>of</strong>it organization to be involved in the<br />
<strong>plan</strong>ning process. Some stakeholders include the Towns <strong>of</strong> Deerfield, Bernardston, Gill and<br />
Montague as well as the Greenfield School System, Baystate Franklin Medical Center,<br />
Stonely Burnham School, Greenfield Community College, and FirstLight Power.<br />
Reviewed and incorporated, if appropriate, existing <strong>plan</strong>s, studies, reports and technical<br />
information. Plans reviewed and incorporated include the 2009 Greenfield Reconnaissance<br />
Report, 2002 Greenfield Down<strong>town</strong> Master Plan, the 2006 Greenfield Open Space and<br />
Recreation Plan, 2002 Mohawk Trail West Action Plan, Bank Row Urban Renewal Plan <strong>of</strong><br />
2005 and data sources cited in footnotes throughout this Plan.<br />
Documented the <strong>plan</strong>ning process, including how it was prepared, and how the public was<br />
involved.<br />
This work was carried out by the staff <strong>of</strong> the FRCOG Planning Department with the assistance <strong>of</strong><br />
the Greenfield Multi-Hazard Mitigation Planning Committee, which includes representatives <strong>of</strong><br />
the Fire Department, Health Department, Department <strong>of</strong> Planning and Development, Police<br />
Department, Planning Board, Department <strong>of</strong> Public Works, and Historical Commission.<br />
Town <strong>of</strong> Greenfield Multi-Hazard Mitigation Plan <strong>2011</strong> • Final Draft 10/25/11 • Page 6
Plan Updates and Changes<br />
As indicated in the Planning Process section, changes and updates were made to this Plan based<br />
upon MEMA recommendations and committee input. The following sections <strong>of</strong> the <strong>2011</strong> <strong>plan</strong><br />
were added to and/or substantially updated:<br />
Section 2: Local Pr<strong>of</strong>ile<br />
Cultural and Historic Resources section added .................................................... 11-12<br />
Section 3: Risk Assessment<br />
o Multi-Hazard Identification and Pr<strong>of</strong>ile<br />
Location and Extent for Each Hazard added ............................................ 13-39<br />
Microbursts and Wind Storms are separate categories, per the committee‘s<br />
request<br />
Beaver Dams (Sub-Category <strong>of</strong> Dam Failure) added ............................... 28-30<br />
Landslides added ..................................................................................... 31-33<br />
Ice Jams added ........................................................................................ 33-35<br />
Manmade Hazards added......................................................................... 35-39<br />
Risk Assessment Methodology<br />
All Hazards Risk Assessment Methodology expanded ............................. 41-43<br />
TABLE 3-21: All Hazards Vulnerability Assessment Table added ............... 44<br />
Vulnerability Assessment<br />
Environmental Justice text and map added .............................................. 45-47<br />
Assessment by Hazard – detailed section for each <strong>hazard</strong> added .............. 46-71<br />
Exposure<br />
Damages<br />
Loss estimates<br />
Population impacts<br />
Data deficiencies<br />
Zoning Map added ....................................................................................... 75<br />
Critical Facilities and Infrastructure Map added ........................................... 76<br />
Section 4: Mitigation Strategy<br />
Current Mitigation Strategies were added for new <strong>hazard</strong>s<br />
Landslides .................................................................................................. 106<br />
Ice Jams ..................................................................................................... 107<br />
Manmade Hazards ...................................................................................... 108<br />
Future Mitigation Strategies modified based on Vulnerability Assessment Table<br />
<strong>2011</strong> Action Plan - Prioritization <strong>of</strong> Goals and Action Items ................ 110-111<br />
Prioritized Action Plan in new table format ......................................... 112-121<br />
NFIP Community Rating System (CRS) and addition NFIP added ...... 122-124<br />
Section 5: Plan Implementation<br />
Potential Funding Sources Table added ................................................................... 126<br />
Town <strong>of</strong> Greenfield Multi-Hazard Mitigation Plan <strong>2011</strong> • Final Draft 10/25/11 • Page 7
2 – LOCAL PROFILE 1<br />
Community Setting<br />
The Town <strong>of</strong> Greenfield is located in the middle <strong>of</strong> Franklin County and is bisected by two major<br />
transportation routes in the county; Interstate 91 which travels north/south and State Route 2<br />
which travels east/west. Greenfield is the largest community in the county with a recorded<br />
population <strong>of</strong> 17,537 people (2009 Census) or approximately 25% <strong>of</strong> the total population for<br />
Franklin County. Greenfield‘s down<strong>town</strong> area is densely developed and people from Franklin<br />
County and beyond travel to the Town to take advantage <strong>of</strong> the employment opportunities,<br />
cultural and recreational <strong>of</strong>ferings, retail shops, and restaurants.<br />
Greenfield lies between the Rocky Mountain Ridge to the east and the hills <strong>of</strong> Shelburne to the West.<br />
Photo courtesy <strong>of</strong> Creative Commons.<br />
In the late 17 th Century, the Town <strong>of</strong> Greenfield was known as the Green River District <strong>of</strong> the<br />
Town <strong>of</strong> Deerfield, an agricultural community populated by settlers looking for land to farm.<br />
However, due to the location <strong>of</strong> this new settlement at the confluence <strong>of</strong> three major rivers – the<br />
Connecticut, Deerfield and Green Rivers – the community rapidly evolved into a trading hub.<br />
1 The majority <strong>of</strong> the information for this section was obtained from the Town <strong>of</strong> Greenfield‘s Open Space and Recreation Plan<br />
2000 and from various websites including: www.<strong>town</strong><strong>of</strong><strong>greenfield</strong>.org and www.mass.info/<strong>greenfield</strong>.ma/description, and the<br />
2008 U.S. Census Population Estimates Program.<br />
Town <strong>of</strong> Greenfield Multi-Hazard Mitigation Plan <strong>2011</strong> • Final Draft 10/25/11 • Page 8
In 1753, the Town <strong>of</strong> Greenfield was <strong>of</strong>ficially incorporated. In 1811, Greenfield was named the<br />
<strong>of</strong>ficial County Seat in the newly established Franklin County. With its abundant water<br />
resources, Greenfield attracted industrial development that could be powered by water-generated<br />
electricity. Many mills and factories were built in Greenfield during the Industrial Revolution in<br />
clusters along the many large rivers running through <strong>town</strong>. The growth <strong>of</strong> the rest <strong>of</strong> the <strong>town</strong><br />
was characterized by a compact down<strong>town</strong> area with two- and three-storied brick and wood<br />
buildings surrounded by densely developed residential neighborhoods.<br />
Today, the <strong>town</strong>‘s densest development is concentrated in the southeastern part <strong>of</strong> <strong>town</strong> which is<br />
bounded by Interstate 91 and Route 2. Outside this major transportation corridor, the <strong>town</strong> is<br />
characterized by larger residential lots and agricultural uses in the rural areas. According to 2005<br />
land use data provided by MassGIS, the total land area <strong>of</strong> the Town <strong>of</strong> Greenfield is<br />
approximately 15,624 acres with approximately 29.2% or 4,103 <strong>of</strong> those acres developed land.<br />
The remaining 9,934 acres <strong>of</strong> land are classified as undeveloped with Forest as the largest<br />
category with 6,721 acres (47.9%). Cro<strong>plan</strong>d and pastureland represent the second and third<br />
largest amount <strong>of</strong> undeveloped land in the <strong>town</strong> with a total <strong>of</strong> 1,936 acres. Crop and pasture<br />
land can be particularly vulnerable to development pressures because they tend to be flat and<br />
cleared with few environmental constraints.<br />
Infrastructure<br />
Since its incorporation as a <strong>town</strong> in 1753, Greenfield has been a major east/west and north/south<br />
transportation crossroads, first for river traffic on the Connecticut, then as a major stagecoach<br />
stop, and later for the transport <strong>of</strong> passengers and goods via railroad. Today, with the<br />
intersection <strong>of</strong> Interstate 91 and Route 2 located in the middle <strong>of</strong> <strong>town</strong>, Greenfield continues to<br />
be a transportation crossroads and is <strong>of</strong>ten referred to as the ―Gateway to the Berkshires.‖<br />
Roads and Highways<br />
Greenfield has a total <strong>of</strong> approximately 124 miles <strong>of</strong> roadway within its borders, including the<br />
major transportation arteries Interstate 91 and Route 2. Interstate 91 connects Greenfield and<br />
Franklin County with Vermont and New Hampshire to the north and to the south, the larger<br />
communities <strong>of</strong> Northampton, Holyoke and Springfield, Massachusetts and the states <strong>of</strong><br />
Connecticut and New York. Route 2 is the major east-west route in northern Massachusetts.<br />
This road links Greenfield and Franklin County with Boston and other metropolitan areas to the<br />
east and the Berkshires and New York State to the west.<br />
Rail<br />
Since the 1840‘s, railroads have moved people and freight through Greenfield. The Boston and<br />
Maine Railroad has two important lines that converge in <strong>town</strong>, one that runs from Boston to New<br />
York State and the other that runs from Springfield, Massachusetts in to Vermont. Currently, rail<br />
service in Greenfield is only for the transportation <strong>of</strong> freight. 2<br />
2 In addition to bus service. Greenfield will have a new Franklin Regional Transit Center (<strong>2011</strong>), which could become a major<br />
hub for improved passenger and freight rail proposed for the Connecticut to Vermont and Boston, Massachusetts to Albany, New<br />
York rail lines.<br />
Town <strong>of</strong> Greenfield Multi-Hazard Mitigation Plan <strong>2011</strong> • Final Draft 10/25/11 • Page 9
Public Transportation<br />
The Franklin Regional Transit Authority (FRTA) has ten fixed bus routes that all originate at<br />
Court Square in front <strong>of</strong> the Greenfield Town Hall. Buses run regularly throughout the day and<br />
provide a vital service to many area residents, particularly elderly residents. The Franklin<br />
Regional Transit Center is currently under construction and is slated for completion in December<br />
<strong>of</strong> <strong>2011</strong>. This Leed certified, net-zero energy building will serve as the hub <strong>of</strong> public<br />
transportation in and around Greenfield.<br />
Public Drinking Water Supply<br />
Approximately 95% <strong>of</strong> the <strong>town</strong>‘s residents receive their drinking water from the municipal<br />
water supply system. The <strong>town</strong> currently relies on both groundwater pumped from wells and<br />
surface waters for its drinking water supply. The three Millbrook wells, which are located in the<br />
northeastern section <strong>of</strong> <strong>town</strong> near the Bernardston border, provide groundwater. Known as the<br />
Leary Wells site, the <strong>town</strong> has identified a potential well site located in an area between Leyden<br />
and Green River Roads. The Leyden Glen Reservoir in Leyden is a 45 million gallon<br />
impoundment that supplies approximately 26% <strong>of</strong> Greenfield‘s water supply. The Green River<br />
also provides drinking water for the <strong>town</strong> during periods <strong>of</strong> peak demand in the summer. Water<br />
is withdrawn from the river behind the dam <strong>of</strong>f <strong>of</strong> Eunice Williams Drive.<br />
Sewer Service<br />
Located in the flood plain <strong>of</strong> the Green River, Greenfield‘s municipal sewer system services the<br />
<strong>town</strong>‘s central, urbanized area and approximately 75% <strong>of</strong> the residential dwelling units in <strong>town</strong>.<br />
One main interceptor and four trunk sewers feed the Wastewater Treatment Plant located on the<br />
Green River at the very southern end <strong>of</strong> <strong>town</strong>. This facility has been expanded and upgraded to<br />
comply with a 1987 DEP Administrative Order. The <strong>plan</strong>t discharges its effluent into the<br />
Deerfield River. This facility underwent a $9.2 million dollar upgrade – including flood<br />
pro<strong>of</strong>ing – in 2000 and discharges to the Deerfield River. See pages 18-23 for information on the<br />
impact <strong>of</strong> Tropical Storm Irene to the Town‘s drinking water supply and Wastewater Treatment<br />
Plant.<br />
Natural Resources<br />
Greenfield is located in the Connecticut River Valley lowland physiographic region, which is<br />
characterized by gently rolling hills and large expanses <strong>of</strong> flat land bordered by steep, forested<br />
hills and ridges. Rocky Mountain, on the <strong>town</strong>‘s eastern border, rises to an elevation <strong>of</strong> 490 feet<br />
and separates the center <strong>of</strong> <strong>town</strong> from the Connecticut River. To the northeast, the topography is<br />
characterized by small, rounded hills with elevations that range from 500 to 550 feet and the<br />
steep slopes and flat, narrow valley <strong>of</strong> the Fall River. The remaining land in the <strong>town</strong> is open<br />
and relatively flat with the exception <strong>of</strong> the area adjacent to the Green and Deerfield Rivers in<br />
the southwestern part <strong>of</strong> <strong>town</strong>.<br />
Hydrology<br />
Rivers and streams are prevalent in Greenfield. Also, there are a few small ponds within the<br />
<strong>town</strong>‘s borders, mostly in the northeastern section <strong>of</strong> <strong>town</strong>.<br />
Town <strong>of</strong> Greenfield Multi-Hazard Mitigation Plan <strong>2011</strong> • Final Draft 10/25/11 • Page 10
Though more densely populated than other <strong>town</strong>s in Franklin County, Greenfield has a wealth <strong>of</strong><br />
natural resources. Four rivers flow through <strong>town</strong>, namely the Fall, Green, Deerfield, and<br />
Connecticut Rivers. The Connecticut River separates Greenfield from the Town <strong>of</strong> Montague to<br />
the east while the Fall River marks the northeastern limits <strong>of</strong> the Town <strong>of</strong> Greenfield and forms<br />
the border with the neighboring <strong>town</strong> <strong>of</strong> Gill. To the south, the Deerfield River separates<br />
Greenfield from the Town <strong>of</strong> Deerfield. The Green River, which flows in a southerly direction<br />
through the middle <strong>of</strong> the <strong>town</strong>, provides both drinking water and recreational opportunities for<br />
residents.<br />
Connecticut River Watershed<br />
The Connecticut River watershed consists <strong>of</strong> approximately 11,260 square miles and includes<br />
portions <strong>of</strong> Massachusetts, New Hampshire, Vermont and Connecticut. The Connecticut River<br />
flows for 410 miles, beginning at the Canadian border and emptying into the Long Island Sound.<br />
Approximately 80% <strong>of</strong> the watershed is forested, 12% is agricultural, 3% is developed and 5% is<br />
water. The Connecticut River Watershed Council is located on Bank Row in Greenfield and<br />
advocates for the health and vitality <strong>of</strong> the Connecticut River Watershed and its sub-watersheds.<br />
Deerfield River Watershed<br />
The Deerfield River watershed is a sub-watershed <strong>of</strong> the Connecticut River watershed and<br />
consists <strong>of</strong> approximately 665 square miles in the Southern Green Mountains in Vermont and the<br />
Northern Berkshires in Massachusetts. The Deerfield River flows approximately seventy miles<br />
from Stratton Mountain in Vermont to the Berkshire Mountains where it flows into the<br />
Connecticut River. Approximately 78% <strong>of</strong> the basin is forested and about 3% is urbanized.<br />
Green River Watershed 3<br />
The Green River is the second largest tributary to the Deerfield River; therefore its watershed is a<br />
sub-basin <strong>of</strong> the Deerfield River watershed. The Green River watershed is comprised <strong>of</strong><br />
approximately 88.9 square miles; the river begins in Marlboro, Vermont and ends as it flows into<br />
the Deerfield River in the Town <strong>of</strong> Greenfield. About 8.5 miles <strong>of</strong> the River are in Greenfield<br />
(http://www.deerfieldriver.org/GreenRiver/index.htm).<br />
The Green River travels the entire length <strong>of</strong> Greenfield, starting in the northwest, continuing<br />
between Leyden and Plain Roads until it reaches Greenfield Meadows, an area known for its rich<br />
agricultural soils. Traveling south, the river enters into the Municipal Swimming Area where a<br />
dam allows a small storage capacity. The River then flows under Route 2A, and parallels Routes<br />
5 and 10, Deerfield Street, before it discharges into the Deerfield River.<br />
The Green River has four dams in Greenfield. From North to South the dams are located at the<br />
Eunice Williams Bridge, Green River Municipal Swimming Area, Mill Street, and Meridian<br />
Street. The Green River serves <strong>multi</strong>ple purposes for the <strong>town</strong>. North <strong>of</strong> Greenfield in the Town<br />
<strong>of</strong> Leyden, the Green River provides part <strong>of</strong> Greenfield‘s municipal water supply at the Leyden<br />
Glen Reservoir, and again further downstream just before the dam at the Eunice Williams<br />
Bridge. The river is used more heavily in the summer months to assist with peak water demands.<br />
3 Text from the 2006 Greenfield Open Space and Recreation Plan, Town <strong>of</strong> Greenfield Planning Department.<br />
Town <strong>of</strong> Greenfield Multi-Hazard Mitigation Plan <strong>2011</strong> • Final Draft 10/25/11 • Page 11
The Town‘s pattern <strong>of</strong> seasonal use emphasizes the importance to maintain the high water<br />
quality <strong>of</strong> the Green River for the <strong>town</strong>‘s municipal water needs.<br />
The Army Corps <strong>of</strong> Engineers has proposed removing the two lower dams, the Mill Street and<br />
Meridian Street dams. There is currently discussion around how removal <strong>of</strong> the dams may affect<br />
the ecosystems that have adapted to the current habitats and what types <strong>of</strong> <strong>mitigation</strong> can be put<br />
into place to minimize impacts to those organisms while still facilitating the dam removals.<br />
Fall River<br />
The Fall River forms the remainder <strong>of</strong> Greenfield‘s eastern boundary to the north. This river,<br />
with its valley bottom and steep adjacent land, has high potential for conservation and recreation<br />
use.<br />
Forest<br />
Greenfield is fortunate to have forested open space/conservation lands located throughout the<br />
Town. Approximately 48 percent <strong>of</strong> Greenfield is forested. The public forest lands are used for<br />
walking, snowshoeing, and nature study along with being an important habitat for wildlife.<br />
While forest quality is generally good, it does require ongoing management efforts.<br />
Cultural and historic Resources<br />
The importance <strong>of</strong> integrating cultural resource and historic property considerations into <strong>hazard</strong><br />
<strong>mitigation</strong> <strong>plan</strong>ning is demonstrated by disasters that have occurred in recent years, such as the<br />
Northridge earthquake in California, Hurricane Katrina in New Orleans, or floods in the<br />
Midwest. Closer to home, the June 1, <strong>2011</strong> tornado, which ripped through Springfield, Monson<br />
and other <strong>town</strong>s in Hamden and Worcester Counties, caused injuries, loss <strong>of</strong> life and widespread<br />
damages to historic properties. See pages 20-21 for details and photos <strong>of</strong> this storm‘s aftermath.<br />
The effects <strong>of</strong> a disaster can be extensive—from human casualty to property and crop damage to<br />
the disruption <strong>of</strong> governmental, social, and economic activity. Often not measured, however, are<br />
the possibly devastating impacts <strong>of</strong> disasters on historic properties and cultural resources.<br />
Historic structures, artwork, monuments, family heirlooms, and historic documents are <strong>of</strong>ten<br />
irreplaceable, and may be lost forever in a disaster if not considered in the <strong>mitigation</strong> <strong>plan</strong>ning<br />
process. The loss <strong>of</strong> these resources is all the more painful and ironic considering how <strong>of</strong>ten<br />
residents rely on their presence after a disaster, to reinforce connections with neighbors and the<br />
larger community, and to seek comfort in the aftermath <strong>of</strong> a disaster. 4<br />
Even more recently, Tropical Storm Irene devastated many Franklin County Towns and nearby<br />
Southern Vermont. An inventory <strong>of</strong> cultural and historic resources impacted by Irene was not<br />
available at the time <strong>of</strong> writing. More details on Tropical Storm Irene can be found on pages 28-<br />
29.<br />
4 Integrating Historic Property and Cultural Resource Considerations Into Hazard Mitigation Planning, State and Local<br />
Mitigation Planning How-To Guide, FEMA 386-6 / May 2005.<br />
Town <strong>of</strong> Greenfield Multi-Hazard Mitigation Plan <strong>2011</strong> • Final Draft 10/25/11 • Page 12
Historic properties and cultural resources can be important economic assets, <strong>of</strong>ten increasing<br />
property values and attracting businesses and tourists to a community. While preservation <strong>of</strong><br />
historic and cultural assets can require funding, it can also stimulate economic development and<br />
revitalization. Hazard <strong>mitigation</strong> <strong>plan</strong>ning can help forecast and <strong>plan</strong> for the protection <strong>of</strong> historic<br />
properties and cultural resources.<br />
Cultural and historic resources help define the character <strong>of</strong> a community and reflect its past.<br />
These resources may be vulnerable to natural <strong>hazard</strong>s due to their location in a potential <strong>hazard</strong><br />
area, such as a river corridor, or because <strong>of</strong> old or unstable structures. For instance, as described<br />
on pages 41-43, the Green River Cemetery, a cultural and historic resource has been impacted by<br />
recurring instances <strong>of</strong> erosion and by a significant mudslide in <strong>2011</strong>.<br />
In 2009, Massachusetts Department <strong>of</strong> Conservation and Recreation (DCR) and the Franklin<br />
Regional Council <strong>of</strong> Governments (FRCOG) assisted the Town <strong>of</strong> Greenfield in a Heritage<br />
Landscape Inventory Program. The purpose <strong>of</strong> the final Greenfield Reconnaissance Report was<br />
to help communities identify a wide range <strong>of</strong> landscape resources - including cultural and<br />
historic resources - particularly those that are significant and unprotected, and to provide<br />
communities with strategies for preserving heritage landscapes. As a result <strong>of</strong> this <strong>plan</strong>, several<br />
Priority Landscape areas were identified and mapped, as shown on the next page. They include:<br />
Town Common area<br />
Franklin County<br />
Fairgrounds<br />
Mohawk Trail<br />
Rocky Mountain area<br />
The Meadows<br />
Within these areas, specific cultural and historic sites, buildings and other resources have been<br />
identified. As Greenfield continues to refine its priorities in protecting its community from<br />
natural and manmade <strong>hazard</strong>s, the Heritage Landscape Inventory is an excellent resource.<br />
Additionally, the Massachusetts Cultural Resource Information System (MACRIS) 5 lists a total<br />
<strong>of</strong> 462 areas, buildings, burial grounds, objects, and structures <strong>of</strong> cultural and/or historic<br />
significance in Greenfield. Some <strong>of</strong> these include Greenfield‘s Main Street Historic District,<br />
Green River Cemetery, Greenfield Tap and Die Plant #1, Beacon Field, and Guiding Star Guild,<br />
to name just a few. A complete list is located in the Appendix <strong>of</strong> this document. Designation on<br />
this list does not provide any protective measures for the historic resources but designated sites<br />
may qualify for federal and state funding if damaged during a natural or manmade <strong>hazard</strong>. The<br />
Greenfield Historical Commission noted that many <strong>of</strong> the buildings on the list are located on or<br />
in the floodplain or in areas subject to occasional flooding and that much <strong>of</strong> Greenfield has a<br />
high water table, subjected building to – at the minimum – flooding <strong>of</strong> cellars.<br />
Another resource for identifying cultural resources is the Greenfield Comprehensive Emergency<br />
Management Plan, which resides with the director <strong>of</strong> Emergency Management in the Town.<br />
5 http://mhc-macris.net/Results.aspx<br />
Town <strong>of</strong> Greenfield Multi-Hazard Mitigation Plan <strong>2011</strong> • Final Draft 10/25/11 • Page 13
Town <strong>of</strong> Greenfield Multi-Hazard Mitigation Plan <strong>2011</strong> • Final Draft 10/25/11 • Page 14
3 - RISK ASSESSMENT<br />
Multi-Hazard Identification and Pr<strong>of</strong>ile<br />
Historical research, conversations with <strong>local</strong> <strong>of</strong>ficials and emergency management personnel,<br />
available <strong>hazard</strong> mapping and other weather-related databases were used to identify the <strong>hazard</strong>s<br />
which are most likely to have an impact on the Town <strong>of</strong> Greenfield.<br />
Floods<br />
General Description<br />
The average annual precipitation for Greenfield and surrounding areas in northwestern<br />
Massachusetts is 44 inches. 6 There are three major types <strong>of</strong> storms that bring precipitation to<br />
Greenfield. Continental storms that originate from the west continually move across the region.<br />
These storms are typically low pressure systems that may be slow-moving frontal systems or<br />
more intense, fast-moving storms. The second major storm type are coastal storms; there are two<br />
kinds that bring major precipitation and wind – nor‘easters and hurricanes. Nor‘easters bring<br />
heavy rain, high winds, ice storms or blizzards into New England from the coast <strong>of</strong> Maine and<br />
Canada. In late summer or early fall, hurricanes may reach Massachusetts from the tropics and<br />
result in significant amounts <strong>of</strong> rainfall and wind. The third type <strong>of</strong> storm is the result <strong>of</strong> <strong>local</strong><br />
convective action. Thunderstorms that form on warm, humid summer days can cause <strong>local</strong>ly<br />
significant rainfall.<br />
Floods are classified as either flash floods, which are the product <strong>of</strong> heavy, <strong>local</strong>ized<br />
precipitation in a short time period over a given location or general floods, which are caused by<br />
precipitation over a longer time period in a particular river basin. Since the <strong>town</strong> is located at the<br />
confluence <strong>of</strong> three major rivers, Greenfield has also experienced what is known <strong>local</strong>ly as<br />
backwater flooding due to ice jams on the Connecticut and Deerfield Rivers. There are several<br />
<strong>local</strong> factors that determine the severity <strong>of</strong> a flooding event, including: stream and river basin<br />
topography, precipitation and weather patterns, recent soil moisture conditions, amount <strong>of</strong><br />
impervious surface area, and the degree <strong>of</strong> vegetative clearing. Floods occur more frequently<br />
and are the most costly natural <strong>hazard</strong> in the United States.<br />
Flash flooding events typically occur within minutes or hours after a period <strong>of</strong> heavy<br />
precipitation, after a dam or levee failure, or from a sudden release <strong>of</strong> water from an ice jam.<br />
Most <strong>of</strong>ten, flash flooding is the result <strong>of</strong> a slow-moving thunderstorm or the heavy rains from a<br />
hurricane. In rural areas, flash flooding <strong>of</strong>ten occurs when small streams spill over their banks.<br />
However, in urbanized areas, flash flooding is <strong>of</strong>ten the result <strong>of</strong> clogged storm drains (leaves<br />
and other debris) and the higher amount <strong>of</strong> impervious surface area.<br />
In contrast, general flooding events may last for several days. Excessive precipitation within a<br />
watershed <strong>of</strong> a stream or river can result in flooding particularly when development in the<br />
6 Massachusetts Department <strong>of</strong> Conservation and Recreation 2009 precipitation data,<br />
http://www.mass.gov/dcr/watersupply/rainfall/index.htm.<br />
Town <strong>of</strong> Greenfield Multi-Hazard Mitigation Plan <strong>2011</strong> • Final Draft 10/25/11 • Page 15
floodplain has obstructed the natural flow <strong>of</strong> the water and/or decreased the natural ability <strong>of</strong> the<br />
groundcover to absorb and retain surface water run<strong>of</strong>f (e.g., loss <strong>of</strong> wetlands and higher amounts<br />
<strong>of</strong> impervious surface area in urban areas).<br />
A floodplain is the relatively flat, lowland area adjacent to a river, lake or stream. Floodplains<br />
serve an important function, acting like large ―sponges‖ to absorb and slowly release floodwaters<br />
back to surface waters and groundwater. Over time, sediments that are deposited in floodplains<br />
develop into fertile, productive farmland like that found in the Connecticut River Valley. In the<br />
past, floodplain areas were also <strong>of</strong>ten seen as prime locations for development. Industries were<br />
located on the banks <strong>of</strong> rivers for access to hydropower. Residential and commercial<br />
development occurred in floodplains because <strong>of</strong> their scenic qualities and proximity to the water.<br />
Although periodic flooding <strong>of</strong> a floodplain area is a natural occurrence, past and current<br />
development and alteration <strong>of</strong> these areas ensures that flooding will continue to be a costly and<br />
frequent <strong>hazard</strong>.<br />
Location and Extent<br />
Franklin County has several major rivers and numerous tributaries which are susceptible to flood<br />
events. The major rivers in the region include the Connecticut, the Deerfield, and the Millers.<br />
Some <strong>of</strong> the tributaries to these rivers which are prone to flooding include the Green River and<br />
the Sawmill River. Flooding poses a significant threat to life and public health and can cause<br />
severe property damage.<br />
One river prone to flooding in Greenfield, the Green River, rushes past low-lying structures on River Street.<br />
Town <strong>of</strong> Greenfield Multi-Hazard Mitigation Plan <strong>2011</strong> • Final Draft 10/25/11 • Page 16
Table 3-1 shows occurrences <strong>of</strong> flooding in Franklin County since 1993 and Table 3-2 shows<br />
occurrences <strong>of</strong> flooding specific to Greenfield, both taken from NOAA data.<br />
Table 3-1: Flood Events in Franklin County Since 1993<br />
Annual Property<br />
Year<br />
# <strong>of</strong> Flood Events<br />
Damage<br />
Annual Crop Damage<br />
2010 1 $150,000 $0<br />
2009 0 $0 $0<br />
2008 3 $38,000 $0<br />
2007 1 $250,000 $0<br />
2006 0 $0 $0<br />
2005 5 $11,435,000 $0<br />
2004 2 $10,000 $0<br />
2003 1 $10,000 $0<br />
2002 0 $0 $0<br />
2001 1 $0 $0<br />
2000 1 $0 $0<br />
1999 0 $0 $0<br />
1998 4 $75,000 $0<br />
1997 0 $0 $0<br />
1996 11 $1,800,000 $0<br />
1995 3 $0 $0<br />
1994 2 $0 $0<br />
1993 5 $0 $0<br />
18 $764,889 $0<br />
# <strong>of</strong> Years<br />
Source: http://www4.ncdc.noaa.gov<br />
Average Annual Property<br />
Damage<br />
Average Annual Crop<br />
Damage<br />
Table 3-2: Flood Events in Greenfield Since 1993<br />
Date Time Type<br />
Property Crop<br />
Damage Damage<br />
Excerpts from storm details for FC only<br />
2/13/2008 15:40<br />
PM<br />
Flood $5,000 $0 Several streets in Greenfield were flooded. A low<br />
pressure system developed <strong>of</strong>f the Mid-Atlantic coast<br />
and moved up the east coast southeast <strong>of</strong> Nantucket<br />
producing snow, rain, and ice across Southern New<br />
England. Widespread two to four inch rainfall<br />
amounts resulted in small stream and poor drainage<br />
flooding as well as some minor river flooding. In<br />
addition, there was some minor wind damage from<br />
8/7/2008 17:00<br />
PM<br />
7/18/2005 2:18<br />
PM<br />
strong northeast winds, especially along the coast.<br />
Flood $8,000 $0 Several thunderstorms with heavy rain moved<br />
through Greenfield resulting in flooding. Ten<br />
basements were flooded and there was some sewage<br />
backup on Silver Street. There was heavy rain<br />
associated with some <strong>of</strong> the storms.<br />
Flash Flood $5,000 $0 Slow moving (almost stationary) thunderstorms<br />
produced a significant flash flood event in north<br />
central Franklin County, Massachusetts. Two<br />
maximum rainfall totals <strong>of</strong> 9 inches were reported<br />
from Bernardston, where the worst flooding had been<br />
Town <strong>of</strong> Greenfield Multi-Hazard Mitigation Plan <strong>2011</strong> • Final Draft 10/25/11 • Page 17
Date Time Type<br />
9/18/2004 10:15<br />
AM<br />
9/28/2003 2:00<br />
PM<br />
6/13/1996 4:00<br />
PM<br />
Property<br />
Damage<br />
Crop<br />
Damage<br />
Excerpts from storm details for FC only<br />
reported. In this <strong>town</strong>, the police station experienced<br />
flooding; and approximately 50 homes either<br />
experienced property damage or basement flooding.<br />
In addition, 30 roads were either washed out, closed<br />
or partially closed, or had culverts blown out due to<br />
flooding.<br />
Flash Flood $10,000 $0 Deerfield and Green Rivers Heavy rainfall associated<br />
with the remains <strong>of</strong> Ivan caused flash flooding in<br />
Franklin and Hampshire Counties in western<br />
Massachusetts. Storm totals <strong>of</strong> 3 to 5 inches were<br />
widely observed and caused rapid rises on the<br />
Deerfield and Green Rivers in Franklin County. The<br />
two rivers caused minor flooding <strong>of</strong> their respective<br />
low lying areas. In Hampshire County, a trained<br />
spotter reported several small brooks out <strong>of</strong> their<br />
banks which flooded low lying areas and caused<br />
minor damage. No injuries were reported.<br />
Flash Flood $10,000 $0 Torrential rainfall caused flash flooding in the<br />
Connecticut River Valley. Nearly 4 inches <strong>of</strong> rain fell<br />
in a few hours, causing significant urban flooding<br />
from Agawam to Northampton. Several roads were<br />
closed in Westfield, Agawam, Chicopee, West<br />
Springfield, Easthampton, and Northampton where<br />
flood waters rose up to the doors <strong>of</strong> vehicles. In<br />
Greenfield, the Green River rose out <strong>of</strong> its banks and<br />
forced the closure <strong>of</strong> Nash's Mill Road between<br />
Colrain and Leyden Roads.<br />
Urban/Small $0 $0<br />
Stream<br />
Flood<br />
Source: http://www4.ncdc.noaa.gov/cgi-win/wwcgi.dll?wwevent~ShowEvent~260419<br />
Tropical Storm Irene<br />
The most recent – and dramatic – example <strong>of</strong> flooding occurred in the area during and after<br />
Tropical Storm Irene which struck Franklin County on August 28, <strong>2011</strong>. Irene hit Western<br />
Massachusetts in a far more dramatic way than was anticipated. Given that the vast majority <strong>of</strong><br />
damage caused by Irene was as a result <strong>of</strong> flooding, Irene is included in this section <strong>of</strong> the Plan.<br />
According to the National Weather Service, up to 9.92 inches <strong>of</strong> rain fell during the storm,<br />
though amounts varied significantly across Franklin County. Rivers, streams and brooks<br />
throughout the County and parts <strong>of</strong> neighboring Hampshire County and Southern Vermont<br />
surpassed flood levels and rising water gathered debris that clogged culverts. Roads and bridges<br />
were washed out and homes and businesses were flooded and, in some cases, washed away<br />
altogether. About 140 Air National Guard members established a base <strong>of</strong> operations at nearby<br />
Mohawk Trail Regional High School in Buckland and were deployed to repair the damage left in<br />
Irene‘s wake. Damage to roads in Hawley was so severe that for several days travel was only<br />
possible by helicopter.<br />
Town <strong>of</strong> Greenfield Multi-Hazard Mitigation Plan <strong>2011</strong> • Final Draft 10/25/11 • Page 18
Tropical Storm Irene caused flooding to the Green River Swimming and Recreation Area<br />
Two regional shelters were opened including one at Greenfield Middle School. At least 42,000<br />
homes and businesses were initially without power. Governor Duval Patrick declared a state <strong>of</strong><br />
emergency and President Barack Obama issued disaster decrees for Berkshire and Franklin<br />
Counties and FEMA opened disaster recovery assistance <strong>of</strong>fices in two Franklin County <strong>town</strong>s.<br />
Despite the magnitude <strong>of</strong> damage, no deaths were reported as a result <strong>of</strong> Irene.<br />
During flooding from Irene, the Green River‘s rushing waters cut new channels in the nearby land<br />
Town <strong>of</strong> Greenfield Multi-Hazard Mitigation Plan <strong>2011</strong> • Final Draft 10/25/11 • Page 19
Teams assessed damage to the Berkshire Gas Facility (left) and the Meridian Dam on the Green River (right)<br />
Damage to Greenfield was widespread and some <strong>of</strong> the many instances are described as follows:<br />
Flooding caused damage to farm fields such as lost topsoil and contamination through<br />
washed up silt and trash.<br />
Flooding from the Green River impacted the Colrain Street Bridge area.<br />
Damage due to flooding was caused to the Green River Dam.<br />
River banks eroded downstream <strong>of</strong> the Green River Pump Station.<br />
A concrete retaining wall by the Leyden Glen dam on the Green River above the Eunice<br />
Williams Covered Bridge was knocked over and swept aside by flood waters. Water<br />
released from behind the wall washed away about 100 feet <strong>of</strong> the Leyden Road side <strong>of</strong><br />
Eunice Williams Drive.<br />
Eunice Williams Covered Bridge knocked from one <strong>of</strong> its footings and was damaged.<br />
The drinking water supply pipe drawing from the Green River near Eunice Williams<br />
Covered Bridge was broken. Town is currently using alternate sources for drinking water.<br />
Drinking water quality was not impacted. Repairs to the water supply system are<br />
estimated at $5 to $6 as <strong>of</strong> early September <strong>2011</strong>.<br />
Sewage treatment <strong>plan</strong>t at the south end <strong>of</strong> Deerfield Street near the confluence <strong>of</strong> the<br />
Green and Deerfield rivers was flooded. Motors powering the pumps in the outlying<br />
pump station were destroyed. Costs for repairing the sewage <strong>plan</strong>t were estimated at $1<br />
million and are estimated to take 18 to 24 months.<br />
Flooding to Colrain Street included businesses such as Davenport Trucking, whose<br />
<strong>of</strong>fices were mud and silt filled. Computers and electrical wiring had to be replaced. It<br />
was estimated it would take about two months to recover from the damage. Total costs <strong>of</strong><br />
damages were not available.<br />
Riverside and Greenfield Gardens apartments were evacuated and some were deemed<br />
uninhabitable due to flooding<br />
Interstate 91 southbound was closed in Deerfield, forcing traffic detours through<br />
Greenfield via Routes 5 and 10. Greenfield Police Department staffed detours for weeks<br />
with the highway reopening on September 5, <strong>2011</strong>. Costs for overtime were not available<br />
at the time <strong>of</strong> writing.<br />
Damage occurred on Glen Road, an access route to the Town‘s water supply reservoir.<br />
Town <strong>of</strong> Greenfield Multi-Hazard Mitigation Plan <strong>2011</strong> • Final Draft 10/25/11 • Page 20
The Green River Swimming and Recreation Area on Nash‘s Mill Road was closed for the<br />
season due to flooding and damages to buildings and structures including broken fences<br />
and a washed out bike path. The picnic areas, pavilions and lawns were covered with silt<br />
and sludge.<br />
Deerfield Street was flooded with sludge with houses and businesses impacted.<br />
A water impoundment wall on the Green River Dam was breached and is being repaired<br />
After Irene, floodwaters begin to recede near the Wastewater Treatment Plant and golf course.<br />
On September 22, <strong>2011</strong>, the Franklin Regional Council <strong>of</strong> Governments released early estimates<br />
on storm damages and costs due to the impacts from Irene. FEMA‘s preliminary damage<br />
assessment totals $27, 713,911 for municipal public damage. This number does not include state<br />
infrastructure damage.<br />
Floodwaters from Irene were forceful enough to move large vehicles and structures.<br />
Town <strong>of</strong> Greenfield Multi-Hazard Mitigation Plan <strong>2011</strong> • Final Draft 10/25/11 • Page 21
Greenfield Department <strong>of</strong> Public Works provided cost estimates for public works and<br />
infrastructure-related projects that resulted from Tropical Storm Irene damage. As shown in<br />
Table 3-2A, estimated costs as <strong>of</strong> October 4, <strong>2011</strong> are $12,495,354, with costs potentially rising<br />
even higher. In addition to DPW costs, other costs to the Town include those for Police and Fire<br />
as well as others such as the Board <strong>of</strong> Health and the building inspector. According to the DPW,<br />
two Action Items stemming from Irene include fortifying the Wastewater Treatment Plant to<br />
withstand 144 foot flooding (currently at 140 feet) and repairing Glen Road and its drainage,<br />
essential for access to the Town‘s water supply reservoir.<br />
Greenfield‘s Wastewater Treatment Plant was flood-pro<strong>of</strong>ed to 140 feet but Irene‘s flooding topped 142 ½ feet.<br />
Table 3-2A: Greenfield DPW Irene Cost Estimates/Progress as <strong>of</strong> 10/4/11<br />
Project:<br />
Fund<br />
source<br />
Status<br />
Green River Dam $6,500,000 estimate WF<br />
Erosion downstream <strong>of</strong><br />
Green River Pump Station $80,000 estimate WF<br />
Tighe & Bond retained<br />
8/29; repair to start<br />
with c<strong>of</strong>ferdam<br />
installation 10/11 In progress<br />
Mitchell Construction<br />
apparent low bidder,<br />
waiting for quotes for<br />
rock work to start 10/11<br />
8 in sewer crossing under<br />
Green River @2A bridge<br />
breeched $1,300,000 estimate SF<br />
Bypass pumping at 2A<br />
bridge to stop raw sewage<br />
to river $35,000<br />
Maple Brook (akA Solon<br />
St) Inceptor repair $176,354<br />
Quote<br />
(8 mo) SF<br />
final<br />
invoice<br />
SF<br />
AECOM (nee Metcalf<br />
& Eddy) retained 8/30 ;<br />
surveying not complete<br />
due to hi water In progress<br />
Baker Pumps<br />
(equipment and setup)<br />
Set up & running<br />
9/12/11 In operation<br />
Davenport<br />
Construction retained<br />
8/30; work complete<br />
9/30/11 Done<br />
Water Pollution Control<br />
Plant $750,000 estimate SF<br />
CRS, Aaron Assoc,<br />
AECOM and Elm Elec<br />
retained 8/29<br />
In progress<br />
Town <strong>of</strong> Greenfield Multi-Hazard Mitigation Plan <strong>2011</strong> • Final Draft 10/25/11 • Page 22
Project:<br />
Fund<br />
source<br />
Status<br />
Misc road, bike path<br />
erosion (including Mead<br />
St& Leyden Glen Rd) $3,500 estimate GF Town doing work 75% done<br />
Removal covered bridge<br />
from river $78,000<br />
quoted<br />
price<br />
GF<br />
RFQ issued 9/15/11;<br />
Work awarded to<br />
Northern Construction<br />
10/4/11 In progress<br />
Replacement <strong>of</strong> bridge &<br />
road at Eunice Williams<br />
Drive $3,000,000 estimate GF<br />
RFQ for engineering<br />
services to be let Nov<br />
<strong>2011</strong> In progress<br />
Remove debris from Petty<br />
Plain Foot bridge/repair <strong>of</strong><br />
bridge $5,000 estimate GF<br />
Davenport retained<br />
8/29; waiting for<br />
quotes on bridge repair<br />
25% complete<br />
Swimming Pool on Green<br />
River-Grounds, fence bldg<br />
&bldg contents $65,000 estimate GF Elm Elec retained 8/29 In progress<br />
North and southeasterly<br />
retaining walls at<br />
Swimming pool $500,000 estimate GF<br />
Clean up <strong>of</strong> Green River<br />
Park, reseeding $2,500 estimate GF<br />
Bid will be let in winter<br />
for work in spring<br />
(water too high now)<br />
Work will be done by<br />
<strong>town</strong> crews<br />
In progress<br />
In progress<br />
Total $12,495,354<br />
Prior to Tropical Storm Irene, other recent examples <strong>of</strong> significant flooding in Greenfield<br />
occurred between October 8th and October 15th <strong>of</strong> 2005. During this time, the Connecticut River<br />
Valley received between 12-22 inches <strong>of</strong> rain from Tropical Storm Tammy and a subtropical<br />
depression. Greenfield experienced 100 year flood events in many areas throughout <strong>town</strong>. The<br />
majority <strong>of</strong> the flooding occurred along the Green River from Nash‘s Mill Road south to the<br />
mouth <strong>of</strong> the Deerfield River. Greenfield‘s Green River Recreational Swimming Area was<br />
severely affected with flood waters damaging the bath house and the public beach.<br />
Areas <strong>of</strong> chronic <strong>local</strong>ized flooding include:<br />
Green River Cemetery, where water has periodically pooled and then caused mudslides<br />
down hill.<br />
Factory Hollow Road along the Fall River has chronic flooding.<br />
Nash‘s Mill Road floods annually.<br />
The Meadow‘s Golf Course floods annually.<br />
Hastings, Heywood and Riddell Streets neighborhoods flood during heavy rain events<br />
when the Maple Brook Culvert backs up.<br />
Green River Park floods every few years.<br />
Green and Cooke Streets and Greenway Lane – this neighborhood floods during heavy<br />
rain events.<br />
Town <strong>of</strong> Greenfield Multi-Hazard Mitigation Plan <strong>2011</strong> • Final Draft 10/25/11 • Page 23
Greenfield mobile homes flooded in 2005. Courtesy <strong>of</strong> MassLive.<br />
Severe Winter Storms<br />
General Description<br />
Severe winter storms can pose a significant risk to property and human life because the rain,<br />
freezing rain, ice, snow, cold temperatures and wind associated with these storms can disrupt<br />
utility service, phone service and make roadways extremely <strong>hazard</strong>ous. Severe winter storms<br />
can be deceptive killers. The types <strong>of</strong> deaths that can occur as a result <strong>of</strong> a severe winter storm<br />
include: traffic accidents on icy or snow-covered roads, heart attacks while shoveling snow, and<br />
hypothermia from prolonged exposure to cold temperatures. Infrastructure and other property<br />
are also at risk from severe winter storms and the associated flooding that can occur following<br />
heavy snow melt. Power and telephone lines, trees, and telecommunications structures can be<br />
damaged by ice, wind, snow, and falling trees and tree limbs. Icy road conditions or roads<br />
blocked by fallen trees may make it difficult to respond promptly to medical emergencies or<br />
fires. Prolonged, extremely cold temperatures can also cause inadequately insulated potable<br />
water lines and fire sprinkler pipes to rupture and disrupt the delivery <strong>of</strong> drinking water and<br />
cause extensive property damage.<br />
Franklin County regularly experiences severe winter storm events between the months <strong>of</strong><br />
December and April. According to the National Climatic Data Center (NCDC), there have been<br />
a total <strong>of</strong> 111 snow and ice events reported in Franklin County between February 1, 1993 and<br />
February 26, 2010, including heavy snow, snow, ice storms, snow squalls, freezing rain and<br />
winter storms. 7 The NCDC web site has more detailed information about each <strong>of</strong> the listed<br />
storms. Seven out <strong>of</strong> the 111 snow and ice events that impacted Franklin County (as well as<br />
7 http://www4.ncdc.noaa.gov/cgi-win/wwcgi.dll?wwevent~storms<br />
Town <strong>of</strong> Greenfield Multi-Hazard Mitigation Plan <strong>2011</strong> • Final Draft 10/25/11 • Page 24
other areas <strong>of</strong> Massachusetts) resulted in Presidential Disaster Declarations or Emergency<br />
Declarations, which then made the state, residents and businesses eligible for federal disaster<br />
relief funds. Table 3-3 lists the seven recent severe winter disasters that have led to Presidential<br />
Disaster or Emergency Declarations in Massachusetts.<br />
Table 3-3: Major Disaster and Emergency Declarations 1993 - 2009<br />
Disaster Date <strong>of</strong> Declared Areas Disaster Federal<br />
Name Event<br />
#/Type <strong>of</strong> Share<br />
Assistance Disbursed<br />
Blizzards, March 1993 All 14 Counties<br />
High Winds<br />
and Record<br />
Snowfall<br />
Blizzard<br />
January<br />
1996<br />
All 14 Counties<br />
FEMA-3103-<br />
EM (PA)<br />
FEMA-1090-<br />
EM (PA)<br />
Snowstorm March 2001 Counties <strong>of</strong> FEMA-3165-<br />
Berkshire, Essex, EM (PA)<br />
Franklin,<br />
Hampshire,<br />
Middlesex,<br />
Norfolk, and<br />
Worcester. The<br />
cost share is 75%<br />
federal and 25%<br />
<strong>local</strong>.<br />
Snowstorm<br />
Snowstorm<br />
Snowstorm<br />
Severe<br />
Winter<br />
Storm<br />
Severe<br />
Storms<br />
and<br />
February<br />
2003<br />
December<br />
2003<br />
January<br />
2005<br />
December<br />
2008<br />
December<br />
2008<br />
All 14 Counties. FEMA-3175-<br />
The cost share is EM (PA)<br />
75% federal and<br />
25% <strong>local</strong>.<br />
Counties <strong>of</strong> FEMA-3191-<br />
Barnstable, EM (PA)<br />
Berkshire, Bristol,<br />
Essex, Franklin,<br />
Hampden,<br />
Hampshire,<br />
Middlesex,<br />
Norfolk, Plymouth,<br />
Suffolk, and<br />
Worcester<br />
All 14 Counties<br />
Berkshire, Bristol,<br />
Essex, Franklin,<br />
Hampden,<br />
Hampshire,<br />
Middlesex,<br />
Suffolk, and<br />
Worcester<br />
*(Figure as <strong>of</strong><br />
9/8/2009)<br />
FEMA-3201-<br />
EM (PA)<br />
FEMA-3296-<br />
EM-MA<br />
All 14 Counties (6 FEMA-1813-<br />
month lock-in DR-MA(PA)<br />
Non-Federal<br />
Share Disbursed<br />
Total<br />
Disbursement<br />
$1,284,873 $183,649 $1,468,522<br />
$16,177,860 $16,177,860<br />
$21,065,441 $21,065,441<br />
$28,868,815 $28,868,815<br />
$35,683,865 $35,683,865<br />
$49,945,087 $49,945,087<br />
$66,509,713<br />
Greenfield not<br />
affected<br />
Greenfield<br />
affected<br />
not Greenfield<br />
affected<br />
not<br />
Town <strong>of</strong> Greenfield Multi-Hazard Mitigation Plan <strong>2011</strong> • Final Draft 10/25/11 • Page 25
Disaster<br />
Name<br />
Date<br />
Event<br />
<strong>of</strong> Declared Areas<br />
Disaster<br />
#/Type<br />
Assistance<br />
<strong>of</strong><br />
Federal<br />
Share<br />
Disbursed<br />
Non-Federal<br />
Share Disbursed<br />
Total<br />
Disbursement<br />
Flooding $7,200,000)<br />
Notes: Public Assistance (PA) Project grants. Supplemental disaster assistance to states, <strong>local</strong> governments, certain private<br />
non-pr<strong>of</strong>it organizations resulting from declared major disasters or emergencies.<br />
Location and Extent<br />
Although ice storms occur much less frequently than snow storms (4 out <strong>of</strong> 111 in the NCDC<br />
database), the effects can be devastating. On December 11, 2008, Franklin County residents<br />
awoke to a landscape coated with ice. Half an inch <strong>of</strong> ice accumulated on exposed surfaces<br />
across Franklin County. This major ice storm affected interior Massachusetts and southern New<br />
Hampshire as well as much <strong>of</strong> northern New England. The ice buildup on exposed surfaces<br />
combined with breezy conditions resulted in numerous downed trees, branches, and power lines,<br />
which resulted in widespread power outages. More than 300,000 customers were reportedly<br />
without power in Massachusetts and an additional 300,000 were without power in the state <strong>of</strong><br />
New Hampshire.<br />
The ice storm <strong>of</strong> 2008 caused power outages in neighboring <strong>town</strong>s due to downed trees and power lines, as<br />
shown in this photo taken in Ashfield. Photo courtesy <strong>of</strong> WMECO.<br />
Because <strong>of</strong> the breadth <strong>of</strong> this December 2008 storm (from Pennsylvania to Maine), extra crews<br />
to reinstate power were harder to come by. Power crews from states as far away as South<br />
Carolina, as well as <strong>local</strong> National Guard teams, were called in to help with power restoration<br />
and clean up. While most people had their power restored within a week, others were still<br />
Town <strong>of</strong> Greenfield Multi-Hazard Mitigation Plan <strong>2011</strong> • Final Draft 10/25/11 • Page 26
without power at Christmas (nearly 2 weeks later). During this period, temperatures were mostly<br />
below normal and at least one major snowstorm affected the same area. At the time <strong>of</strong> the<br />
December 19th snowstorm, which dumped 7 – 12 inches <strong>of</strong> snow in eastern Franklin County and<br />
9 – 14 inches <strong>of</strong> snow in western part <strong>of</strong> the county, over 100,000 customers were still without<br />
power in the two states combined. Two days later, on December 21 st ,<br />
5 – 7 inches <strong>of</strong> new snow blanketed eastern Franklin County.<br />
Greenfield was fortunate; the storm did not cause power outages in <strong>town</strong>. There was some<br />
property damage from the winds that required clean up and disposal <strong>of</strong> debris. However,<br />
because Greenfield did not lose power it became a refuge. Many residents from around Franklin<br />
County relied on the hospitality <strong>of</strong> Greenfield‘s hotels, motels and inns and restaurants, cafes,<br />
and c<strong>of</strong>fee shops to weather the storm and power outages. More data and information related to<br />
Severe Winter Storms is located in the Vulnerability Assessment section <strong>of</strong> this <strong>plan</strong>.<br />
Hurricanes<br />
General Description<br />
Hurricanes are violent rainstorms associated with tropical storms with strong winds that can<br />
reach speeds <strong>of</strong> up to 200 miles per hour. Hurricanes generally occur between June and<br />
November and can result in flooding and wind damage to structures and above-ground utilities.<br />
August, September, and the first half <strong>of</strong> October are when most hurricanes occur in New<br />
England.<br />
Location and Extent<br />
While there have been no reports <strong>of</strong> hurricane events in Greenfield, a substantial hurricane could<br />
have could have a large area <strong>of</strong> occurrence and could have a critical impact with <strong>multi</strong>ple injuries<br />
possible and a potential a significant percentage <strong>of</strong> property in affected area damaged or<br />
destroyed. In Massachusetts, major hurricanes occurred in 1904, 1938, 1954, 1955, 1960 1976,<br />
1985, and 1991. In most cases, hurricanes are not a significant threat to interior New England.<br />
Table 3-4 shows the occurrences <strong>of</strong> hurricanes and tropical storms in Franklin County in the last<br />
20 years.<br />
Table 3-4: Damage from Hurricanes and Tropical Storms in Franklin County.<br />
Property<br />
Begin Date End Date Injuries Fatalities Damage Crop Damage Remarks<br />
10/4/1990 10/4/1990 0 0 $3,571 $0 High Winds<br />
10/18/1990 10/19/1990 0.07 0 $3,571 $0 High Winds<br />
8/19/1991 8/19/1991 0.22 0 $ 5,555,556 $ 555,556 Wind<br />
12/23/1994 12/24/1994 0 0 $35,714 $0 High Winds<br />
10/28/1995 10/28/1995 0.2 0 $0 $0 HIGH WINDS<br />
10/1/1998 10/1/1998 0 0 $62,500 $0 Strong Wind<br />
12/1/1998 12/1/1998 0.23 0 $769 $0 Strong Wind<br />
3/22/1999 3/22/1999 0 0 $7,692 $0 Strong Wind<br />
10/15/2003 10/15/2003 0 0 $35,714 $0<br />
Town <strong>of</strong> Greenfield Multi-Hazard Mitigation Plan <strong>2011</strong> • Final Draft 10/25/11 • Page 27
Begin Date End Date Injuries Fatalities<br />
Property<br />
Damage Crop Damage Remarks<br />
11/13/2003 11/14/2003 0 0 $91,667 $0<br />
12/1/2004 12/1/2004 0 0 $37,778 $0 High Wind<br />
9/29/2005 9/29/2005 0 0 $33,889 $0 High Wind<br />
1/15/2006 1/15/2006 0 0 $8,125 $0 Strong Wind<br />
2/17/2006 2/17/2006 0.33 0.11 $211,111 $0 High Wind (G68)<br />
10/20/2006 10/20/2006 0.2 0 $43,000 $0 High Wind (G50)<br />
10/29/2006 10/29/2006 0 0 $12,625 $0 High Wind (G53)<br />
12/1/2006 12/1/2006 0 0 $3,000 $0 High Wind (G55)<br />
Source: Sheldus Database.<br />
Tornados<br />
General Description<br />
Tornados are swirling columns <strong>of</strong> air that typically form in the spring and summer during severe<br />
thunderstorm events. In a relatively short period <strong>of</strong> time and with little or no advance warning, a<br />
tornado can attain rotational wind speeds in excess <strong>of</strong> 250 miles per hour and can cause severe<br />
devastation along a path that ranges from a few dozen yards to over a mile in width. The path <strong>of</strong><br />
a tornado may be hard to predict because they can stall or change direction abruptly. Within<br />
Massachusetts, tornados have occurred most frequently in Worcester County and in communities<br />
west <strong>of</strong> Worcester. In the past 50 years, approximately 20 tornados have occurred in Franklin<br />
County. High wind speeds, hail, and debris generated by tornados can result in loss <strong>of</strong> life,<br />
downed trees and power lines, and damage to structures and other personal property.<br />
Tornados can have devastating effects on infrastructure, property and human health. Striking at<br />
random, their conical winds leave trails <strong>of</strong> devastation, at times more than a mile wide, in their<br />
wake. Small tornadoes, known as ―gustnadoes,‖ have been known to strike in Franklin County,<br />
most recently in Sunderland in 2009. The gustnado does not appear in data compiled on<br />
tornadoes for this report, however, even gustnadoes can cause damage; the 2009 occurrence<br />
destroyed a barn and downed trees in Sunderland.<br />
Location and Extent<br />
On June 1, <strong>2011</strong>, a tornado ripped through western and central Massachusetts, killing one person<br />
and injuring four others. In an area where tornados are rare, this event was a reminder that<br />
tornados do, in fact, impact the region. The fearsome storm downed trees, ripped ro<strong>of</strong>s from<br />
hundreds <strong>of</strong> homes, and damaged many historic properties. On June 15, President Obama signed<br />
a disaster declaration for Hampden and Worcester counties which provided federal funds for<br />
affected residents and properties.<br />
Preservation groups – including Preservation Massachusetts and the Springfield Preservation<br />
Trust – have assisted hardest hit communities, especially Springfield and Monson. In part, these<br />
preservation groups have helped to inventory properties and to encourage <strong>town</strong>s not to rush to<br />
demolish historic structures. The groups also <strong>of</strong>fered a list <strong>of</strong> resources properties owners can<br />
Town <strong>of</strong> Greenfield Multi-Hazard Mitigation Plan <strong>2011</strong> • Final Draft 10/25/11 • Page 28
consult to assist them in making decisions about repairing historic properties. MEMA also<br />
conducted a briefing for historic properties owners and encouraged representatives <strong>of</strong> Historical<br />
Commissions, Historical Societies, libraries, museums, and other non-pr<strong>of</strong>it organizations<br />
dedicated to preserving historic structures to communicate with <strong>town</strong> <strong>of</strong>ficials and FEMA and<br />
MEMA staff throughout the disaster recovery process.<br />
Historic properties in Monson (left) and Springfield were hard hit by a June 1, <strong>2011</strong> tornado.<br />
Prior to the June <strong>2011</strong> tornado, the most recent data on tornados is from the NOAA Database,<br />
Table 3-5, indicating 4 tornados touched down in Franklin County in the last 15 years.<br />
According to the NOAA database, no tornados have been observed directly in Greenfield,<br />
however, on July 11, 1958, a tornado was reported in nearby Erving and was ranked F2<br />
(Significant Tornado) on the Fujita Scale <strong>of</strong> Tornado Intensity. The tornado touched down on<br />
the Connecticut River in an uninhabited area near Warner Road in Erving. The extent <strong>of</strong> damage<br />
it caused is unknown.<br />
Table 3-5: Tornados Events in Franklin County<br />
Year # <strong>of</strong> Tornado Events Annual Property Damage Annual Crop Damage<br />
2010 0 $0 $0<br />
2009 0 $0 $0<br />
2008 0 $0 $0<br />
2007 0 $0 $0<br />
2006 1 $200,000 $0<br />
2005 0 $0 $0<br />
2004 0 $0 $0<br />
2003 0 $0 $0<br />
2002 0 $0 $0<br />
2001 0 $0 $0<br />
2000 0 $0 $0<br />
1999 0 $0 $0<br />
1998 0 $0 $0<br />
1997 2 $100,000 $0<br />
1996 0 $0 $0<br />
Town <strong>of</strong> Greenfield Multi-Hazard Mitigation Plan <strong>2011</strong> • Final Draft 10/25/11 • Page 29
Year # <strong>of</strong> Tornado Events Annual Property Damage Annual Crop Damage<br />
1995 0 $0 $0<br />
1994 0 $0 $0<br />
1993 0 $0 $0<br />
1992 1 $25,000 $0<br />
1991 0 $0 $0<br />
20 $16,250 $0<br />
# <strong>of</strong> Years<br />
Average Annual Property<br />
Damage<br />
Average Annual Crop<br />
Damage<br />
High wind speeds, hail, and debris generated by tornadoes can result in loss <strong>of</strong> life, downed trees<br />
and power lines, and damage to structures and other personal property (cars, etc.). Since the<br />
1950s, there have been over twenty tornadoes in Franklin County. In the last fifteen years, three<br />
tornadoes have been reported in Franklin County, in the <strong>town</strong>s <strong>of</strong> Heath, Charlemont, and<br />
Wendell. A July 2006 tornado in Wendell was rated F2 (Strong) on the Fujita Scale with winds<br />
estimated near 155 mph.<br />
More data and information related to Hurricanes and Tornados is located in the Vulnerability<br />
Assessment section <strong>of</strong> this <strong>plan</strong>.<br />
Microbursts (Includes Thunderstorms and Wind-Related Events)<br />
General Description<br />
The category Microbursts includes thunderstorm events, and associated storm effects including<br />
wind storms, hail and lightning. Microbursts can <strong>of</strong>ten cause tornado-like damage and can be<br />
mistaken for tornadoes. In contrast to the upward rush <strong>of</strong> air in a tornado, air blasts rapidly<br />
downward from thunderstorms to create microbursts. Thunderstorms bring strong winds, rain<br />
and, at times, hail, potentially causing damage to property, crops and utilities and injuries or<br />
deaths to residents. Persistent rain can also cause flooding.<br />
Location and Extent<br />
In July <strong>of</strong> 1994, a brief microburst in Greenfield caused a state disaster declaration and in nearly<br />
$60 K <strong>of</strong> Public Assistance Project Grants to aid in storm recovery. A more recent microburst<br />
event in Greenfield, packed quite a punch. On May 26, 2010 as a result <strong>of</strong> being pummeled by<br />
storms that ripped through the region, Greenfield declared a state <strong>of</strong> emergency. All public<br />
schools were closed and many roads were closed to all but emergency vehicles. More than 100<br />
reports <strong>of</strong> downed trees, utility poles, and wires were received. The storms left more than 27,000<br />
Western Massachusetts Electric Co. customers in the region without power. 8 Assessment by the<br />
Greenfield DPW <strong>of</strong> total costs <strong>of</strong> the storm to the Town <strong>of</strong> Greenfield is approximately $98,000<br />
while costs to private home owners are estimated to be about $150,000, see Table 3-38 in the<br />
Vulnerability Assessment section <strong>of</strong> this <strong>plan</strong> for more information.<br />
8 http://www.masslive.com/news/index.ssf/2010/05/storms_force_<strong>greenfield</strong>_to_dec.html<br />
Town <strong>of</strong> Greenfield Multi-Hazard Mitigation Plan <strong>2011</strong> • Final Draft 10/25/11 • Page 30
© 2010 The Republican Company. All rights reserved. Used with permission.<br />
Damage such as this seen in Greenfield was common in the aftermath <strong>of</strong> the 2010 microburst.<br />
Thunderstorms are much more common in western Massachusetts than tornados and microbursts<br />
and can cause significant damage. While thunderstorms generally do not hit with the force <strong>of</strong> a<br />
tornado or microburst, their higher frequency and more widespread extent – and their associated<br />
hail and lightning – make them a <strong>hazard</strong> to be taken seriously. Existing and future <strong>mitigation</strong><br />
efforts should continue to be developed and employed that will enable the Town to be prepared<br />
for these events. More information and data on microbursts and thunderstorms is located in the<br />
Vulnerability Assessment section <strong>of</strong> this <strong>plan</strong>.<br />
Wildfires/Brush Fires<br />
General Description<br />
According to FEMA, there are three different classes <strong>of</strong> wildland fires: surface fires, ground<br />
fires and crown fires. 9 The most common type <strong>of</strong> wildland fire is a surface fire which burns<br />
slowly along the floor <strong>of</strong> a forest, killing or damaging trees. A ground fire burns on or below the<br />
forest floor and is usually started by lightening. Crown fires move quickly by jumping along the<br />
tops <strong>of</strong> trees. A crown fire may spread rapidly, especially under windy conditions. While<br />
wildland fires have not been a significant problem in Greenfield, there is always a possibility that<br />
changing land use patterns and weather conditions will increase a community‘s vulnerability.<br />
For example, drought conditions can make forests and other open, vegetated areas more<br />
vulnerable to ignition. Once the fire starts, it will burn hotter and be harder to extinguish. Soils<br />
9 FEMA, ―Fact Sheet: Wildland Fires‖, September 1993.<br />
Town <strong>of</strong> Greenfield Multi-Hazard Mitigation Plan <strong>2011</strong> • Final Draft 10/25/11 • Page 31
and root systems starved for moisture are also vulnerable to fire. Residential growth in rural,<br />
forested areas increases the total area that is vulnerable to fire and places homes and<br />
neighborhoods closer to areas where wildfires are more likely to occur.<br />
Location and Extent<br />
The Town <strong>of</strong> Greenfield Fire Department responds to approximately 450 brush fires each year.<br />
Most <strong>of</strong> these fires are started on residential lots to clear grass, leaves, brush and other woody<br />
debris and become a problem when the homeowner can no longer control them. According to<br />
the Massachusetts Fire Incident Reporting System, between 2004 and 2009, thirty five (35)<br />
brushfires were reported in Greenfield. (See Table 3-6.) There were no fires <strong>of</strong> significance in<br />
2010, according to Emergency Management Director, Robert Strahan.<br />
Table 3-6: Massachusetts Fire Incident Reporting System – Brushfires 2004-2009<br />
Department<br />
Total # <strong>of</strong><br />
Brush Fires 2004 2005 2006 2007 2008 2009<br />
BERNARDSTON 44 5 14 7 5 8 5<br />
CHARLEMONT 15 3 1 0 8 1 2<br />
COLRAIN 8 3 1 0 3 0 1<br />
CONWAY 25 4 5 5 3 4 4<br />
DEERFIELD 23 6 5 1 4 7<br />
ERVING 10 4 2 1 0 3 0<br />
GILL 14 0 1 7 4 1 1<br />
GREENFIELD 35 0 1 4 11 13 6<br />
HAWLEY 2 0 0 2 0 0 0<br />
HEATH 6 1 1 0 0 2 2<br />
LEVERETT 11 1 1 3 5 0 1<br />
LEYDEN 3 1 0 0 2 0 0<br />
MONTAGUE CENTER 38 3 8 10 7 1 9<br />
NEW SALEM 14 0 0 3 5 1 5<br />
NORTHFIELD 1 0 0 0 0 1 0<br />
ORANGE 25 4 3 3 9 0 6<br />
SHELBURNE CTR 13 4 2 5 2 0 0<br />
SHELBURNE FALLS 7 0 0 1 4 1 1<br />
SHUTESBURY 4 0 1 0 0 1 2<br />
SOUTH DEERFIELD 18 4 2 3 5 2 2<br />
SUNDERLAND 17 4 6 6 0 1 0<br />
TURNERS FALLS 29 8 5 4 7 1 4<br />
WARWICK 4 2 1 1 0 0 0<br />
WENDELL 9 0 0 6 2 0 1<br />
WHATELY 23 6 7 6 1 3 0<br />
Total 398 63 67 77 84 48 59<br />
While wildfires have not been a significant problem in Greenfield, there is always a possibility<br />
that changing land use patterns and weather conditions will increase a community‘s<br />
vulnerability. For example, drought conditions can make forests and other open, vegetated areas<br />
more vulnerable to ignition. Once the fire starts, it will burn hotter and be harder to extinguish.<br />
Town <strong>of</strong> Greenfield Multi-Hazard Mitigation Plan <strong>2011</strong> • Final Draft 10/25/11 • Page 32
Soils and root systems starved for moisture are also vulnerable to fire. Residential growth in<br />
rural, forested areas increases the total area that is vulnerable to fire and places homes and<br />
neighborhoods closer to areas where wildfires are more likely to occur.<br />
The Town issues approximately 430 burn permits annually. Education in the form <strong>of</strong> guidelines<br />
and rules are included in each burn permit issued and each applicant is required to read,<br />
understand and sign the permit.<br />
Dam Failures<br />
General Description<br />
Although dams and their associated impoundments provide many benefits to a community, such<br />
as water supply, recreation, hydroelectric power generation, and flood control, they also pose a<br />
potential risk to lives and property. Dam failure is not a common occurrence but dams do<br />
represent a potentially disastrous <strong>hazard</strong>. When a dam fails, the potential energy <strong>of</strong> the stored<br />
water behind the dam is instantly released, <strong>of</strong>tentimes with catastrophic consequences, as the<br />
water rushes in a torrent downstream flooding an area engineers refer to as an ―inundation area.‖<br />
The number <strong>of</strong> casualties and the amount <strong>of</strong> property damage will depend upon the timing <strong>of</strong> the<br />
warning provided to downstream residents, the number <strong>of</strong> people living or working in the<br />
inundation area, and the number <strong>of</strong> structures in the inundation area.<br />
Many dams in Massachusetts were built in the 19 th Century without the benefit <strong>of</strong> modern<br />
engineering design and construction oversight. Dams can fail because <strong>of</strong> structural problems due<br />
to age and/or lack <strong>of</strong> proper maintenance. Dam failure can also be the result <strong>of</strong> structural<br />
damage caused by an earthquake or flooding brought on by severe storm events.<br />
Location and Extent<br />
Greenfield is particularly susceptible to disastrous flooding because <strong>of</strong> its location at the<br />
confluence <strong>of</strong> the Connecticut and Deerfield Rivers. Both have major dams. The Connecticut<br />
has 16 large dams (Table 3-7)stretching from Holyoke Dam to the Moore Dam near Littleton<br />
New Hampshire. The Turners Falls Dam is just east <strong>of</strong> Greenfield.<br />
Table 3-7: Dams on the Connecticut River Mainstem:<br />
1. Holyoke, MA 2. Cabot Station, MA<br />
3. Turners Falls, MA 4. Vernon, VT-NH<br />
5. Bellows Falls, VT 6. Wilder, VT-NH<br />
7. Ryegate, VT-NH 8. McIndoes Station, VT-NH<br />
9. Comerford Station, NH 10. Moore Reservoir, NH<br />
11. Gilman Project, VT-NH 12. Lower, VT-NH<br />
13. Murphy, NH 14. First Connecticut Lake, NH<br />
15. Second Connecticut Lake, NH 16. Moose Fall, NH 10<br />
There are 10 hydroelectric dams along the 73-mile length <strong>of</strong> the Deerfield River, earning it its<br />
nickname, "The Hardest Working River." Of particular note are the projects on the Deerfield<br />
10 Two other dams, Enfield Dam in Connecticut and Groverton Dam are breached.<br />
Town <strong>of</strong> Greenfield Multi-Hazard Mitigation Plan <strong>2011</strong> • Final Draft 10/25/11 • Page 33
River owned by TransCanada Corporation and licensed by the Federal Energy Regulatory<br />
Commission (FERC). These projects include the Somerset Dams and Harriman Dams (the two<br />
largest storage reservoirs), Sherman and Fife Brook Dams, and Bear Swamp Upper Reservoir, all<br />
<strong>of</strong> which are classified as High Hazard Dams. The Emergency Action Plans for these projects<br />
include a series <strong>of</strong> inundation maps for each dam which illustrate potential flooding conditions<br />
for downstream areas including portions <strong>of</strong> Greenfield adjacent to the Green, Deerfield and<br />
Connecticut Rivers. 11<br />
A catastrophic failure <strong>of</strong> any one <strong>of</strong> these High Hazard dams would likely result in the cascading<br />
failure <strong>of</strong> all the downstream dams (both High and Low Hazard dams), resulting in widespread<br />
flooding <strong>of</strong> downstream areas in a matter <strong>of</strong> hours. For example, on a sunny day (no additional<br />
precipitation added to released water), water from a catastrophic failure <strong>of</strong> the Harriman Dam<br />
would reach the Route 5 Bridge which spans the Deerfield River (67.6 miles from origin) in 4.6<br />
hours and the confluence <strong>of</strong> the Deerfield and Connecticut Rivers (68.9 miles from origin) in 5<br />
hours. Under ―Probable Maximum Flood‖ (PMF) conditions, the worst-case scenario,<br />
floodwaters from a catastrophic failure <strong>of</strong> the Sherman Dam would reach the Route 5 Bridge in<br />
3.2 hours. Both ―Sunny Day‖ and PMF conditions are presented on the inundation maps for the<br />
five US GEN New England High Hazard Dams. According to inundation mapping for the<br />
Moore Dam, in the event <strong>of</strong> a catastrophic failure under PMF conditions, floodwaters would<br />
reach the Deerfield and Connecticut Rivers in approximately 25 hours.<br />
The remaining five TransCanada dams on the Deerfield River are classified as Low Hazard<br />
Dams; therefore, no Emergency Action Plan or inundation mapping are required by FERC.<br />
Consultants hired by TransCanada examined a ―Sunny Day‖ failure scenario for these dams to<br />
determine the downstream flooding <strong>hazard</strong> potential. Next, the incremental impact was<br />
determined for a dam failure that occurred at a flow equivalent to the 100-year frequency flood.<br />
For these two scenarios, the study indicates that the additional flooding above the 100-year flood<br />
stage was insignificant and therefore these projects do not present a significant <strong>hazard</strong> to life and<br />
property. 12 However, the cascading failure <strong>of</strong> one or more <strong>of</strong> these dams that would occur if one<br />
<strong>of</strong> the High Hazard dams failed would result in the catastrophic flooding shown on the<br />
inundation maps in the EAP.<br />
The 100-year flood plain in Greenfield encompasses approximately 1,449 total acres. Of those<br />
acres, 63 acres are developed land, including an estimated 43 acres <strong>of</strong> developed residential land<br />
and 38 dwellings. The area inundated by a catastrophic failure <strong>of</strong> one <strong>of</strong> the TransCanada dams<br />
would cover substantially more acreage. Emergency responders should review inundation areas<br />
presented in the EAP and identify possible evacuation routes, since significant portions <strong>of</strong><br />
Greenfield and neighboring communities such as Deerfield and Montague, including sections <strong>of</strong><br />
Route 5/10, may be flooded.<br />
The Massachusetts Department <strong>of</strong> Conservation and Recreation (MA DCR) is the agency<br />
responsible for regulating dams in the state (M.G.L. Chapter 253, Section 44 and the<br />
implementing regulations 302 CMR 10.00). Until 2002, DCR was also responsible for<br />
11 ―Emergency Action Plans for the Deerfield River FERC Licensed Projects Nos. 2323 and 2669,‖ prepared for US GEN New<br />
England, Inc., by Kleinschmidt Energy and Water Resource Consultants, November 2003.<br />
12 Ibid.<br />
Town <strong>of</strong> Greenfield Multi-Hazard Mitigation Plan <strong>2011</strong> • Final Draft 10/25/11 • Page 34
conducting dam inspections when state law changed placing the burden <strong>of</strong> inspections on the<br />
owners <strong>of</strong> the dams. In accordance with the new regulations, which went into effect in 2005,<br />
dam owners must register, inspect and maintain dams in good operating condition. Owners <strong>of</strong><br />
High Hazard Potential dams and certain Significant Hazard Potential dams are also required to<br />
prepare, maintain and update Emergency Action Plans. The state has three <strong>hazard</strong> classifications<br />
for dams:<br />
High Hazard Potential: Dams located where failure will likely cause loss <strong>of</strong> life and<br />
serious damage to home(s), industrial or commercial facilities, important public<br />
utilities, main highway(s) or railroad(s).<br />
Significant Hazard Potential: Dams located where failure may cause loss <strong>of</strong> life and<br />
damage home(s), industrial or commercial facilities, secondary highway(s) or<br />
railroad(s) or cause interruption <strong>of</strong> use or service <strong>of</strong> relatively important facilities.<br />
Low Hazard Potential: Dams located where failure may cause minimal property<br />
damage to others. Loss <strong>of</strong> life is not expected.<br />
The inspection schedule for dams is as follows:<br />
Low Hazard dams – 10 years<br />
Significant Hazard dams – 5 years<br />
High Hazard dams – 2 years<br />
The time intervals represent the maximum time between inspections. More frequent inspections<br />
may be performed at the discretion <strong>of</strong> the state. Dams and reservoirs licensed and subject to<br />
inspection by the FERC are excluded from the provisions <strong>of</strong> the state regulations provided that<br />
all FERC-approved periodic inspection reports are provided to the DCR. All other dams are<br />
subject to the regulations unless exempted in writing by DCR. In 2005, the MA DCR Office <strong>of</strong><br />
Dam Safety provided data for the 10 dams in Greenfield. Of these ten dams, seven were<br />
classified as Significant Hazards, two were classified as Low Hazard and one dam had no<br />
<strong>hazard</strong> classification. Four <strong>of</strong> the dams assigned to the Significant Hazard category were last<br />
inspected between June 1998 and May 1999. Two <strong>of</strong> these dams were found to be in good<br />
condition and the remaining two dams were found to be in fair condition. Of the three remaining<br />
dams classified as Significant Hazard dams, two have not been inspected since the mid 1970‘s<br />
and one has not been inspected since 1985. No current information is available on the condition<br />
<strong>of</strong> these dams. One <strong>of</strong> the Low Hazard dams was inspected in July 2003 and found to be in fair<br />
condition. The other Low Hazard dam was last inspected in June 2001 but its condition was not<br />
documented in the information received from DCR. The dam with no <strong>hazard</strong> classification was<br />
last inspected in January 1975. No information is available regarding the condition <strong>of</strong> this dam.<br />
In <strong>2011</strong>, the MA DCR Office <strong>of</strong> Dam Safety‘s Legal Department provided updated data on dams<br />
in Greenfield. The data was generated using new s<strong>of</strong>tware and a new reporting system, according<br />
to the Legal Department. The results are incomplete, with only 4 dams being reported in<br />
Greenfield. After attempts to clarify the data discrepancies were unsuccessful, MEMA advised<br />
using the information from the previous Hazard Mitigation <strong>plan</strong> and confirming the information<br />
directly with the <strong>town</strong>.<br />
According to the Town Engineer, there are only nine dams in <strong>town</strong> rather than the ten reported<br />
by DCR in 2005. The Town <strong>of</strong> Greenfield is the Owner and Caretaker <strong>of</strong> record for six <strong>of</strong> these<br />
nine dams. According to DCR records, four <strong>of</strong> the dams the Town is responsible for are<br />
Town <strong>of</strong> Greenfield Multi-Hazard Mitigation Plan <strong>2011</strong> • Final Draft 10/25/11 • Page 35
classified as Significant Hazards and the remaining two dams are Low Hazard. The remaining<br />
three dams in <strong>town</strong> are under private ownership. All three are classified as Significant Hazard<br />
dams.<br />
Beaver Dams<br />
Along with manmade dams, beaver dams can cause flooding as well. Alteration <strong>of</strong> the landscape<br />
by beavers is a natural process that creates habitat for shore birds, mammals and rare<br />
amphibians. However, beaver ponds can flood structures, roads and utilities, causing costly and<br />
potentially dangerous situations. Beaver activity can also pollute drinking water supplies.<br />
Mitigation measures suggested by Massachusetts Division <strong>of</strong> Fish and Wildlife (MassWildlife)<br />
and other agencies can help communities and homeowners deal with nature‘s master builders.<br />
Until 1996, when a ballot initiative passed restricting the practice, Massachusetts residents were<br />
permitted to trap beavers. That change in policy caused a spike in the beaver population, which,<br />
in turn, led to a sharp increase in complaints about beaver activity and its effects. The law was<br />
modified in 2000 so that <strong>town</strong> Board <strong>of</strong> Health members could issue emergency trapping<br />
permission outside <strong>of</strong> the usual trapping season. State law makes it illegal for any person to<br />
disturb or tear open a beaver dam or beaver lodge without written permission from MassWildlife<br />
and the <strong>local</strong> Conservation Commission or Department <strong>of</strong> Environmental Protection. Permits are<br />
needed to disturb a beaver dam for any reason in Massachusetts. Even dams that cause flooding<br />
require permits to be breached. 13<br />
In <strong>2011</strong>, a bill is under consideration with the State Legislators which would give individuals and<br />
<strong>town</strong>s an additional option when they are having issues with beavers. Under this new bill, a<br />
special permit could be obtained from the State Department <strong>of</strong> Fisheries and Wildlife. The bill<br />
does not aim to repeal the bill that bans trapping but rather allows the issuing <strong>of</strong> an emergency<br />
permit under the provisions allowed within the laws <strong>of</strong> the State. The proposed bill also calls for<br />
the State to begin keeping better records <strong>of</strong> all permits issued and how many gbeavers are<br />
trapped each year. An increased beaver population, combined with land development reducing<br />
beaver habitat, means that humans and beavers continue to clash. Several <strong>mitigation</strong> measures,<br />
when applied thoughtfully, legally and with maintenance measures in mind, can help with<br />
beavers‘ negative effects, while preserving beavers‘ positive impact on the land. 14<br />
While trapping beaver can have short-term benefits, the right conditions for beaver habitat will<br />
eventually lure new beavers. It may be best to combine trapping with measures that discourage<br />
beaver activity that‘s bad for humans. Techniques used to mitigate the flooding damage caused<br />
by beaver include breaching <strong>of</strong> beaver dams, protecting road culverts with fences or guards, and<br />
controlling water levels with water flow devices. All these techniques require a certain degree <strong>of</strong><br />
effort and regular maintenance to insure water levels that can be tolerated (thereby preserving the<br />
positive aspects <strong>of</strong> the associated wetland). See the MassWildlife publication The Use <strong>of</strong> Water<br />
Flow Devices and Flooding Problems Caused by Beaver in Massachusetts for details on these<br />
<strong>mitigation</strong> measures. The following techniques were adapted from that publication.<br />
13 Langlois, S.A. and T.A. Decker. 2004. The Use <strong>of</strong> Water Flow Devices and Flooding Problems Caused by<br />
Beaver in Massachusetts (Rev. Ed.). MA Division <strong>of</strong> Fisheries and Wildlife. 18pp.<br />
14 Otsego County (NY) All Hazards Mitigation Plan, 2010.<br />
Town <strong>of</strong> Greenfield Multi-Hazard Mitigation Plan <strong>2011</strong> • Final Draft 10/25/11 • Page 36
Dam breaching is an immediate but very short-term solution to flooding problems caused<br />
by beaver. Good water control is possible if the breach is kept shallow and broad so that<br />
the water level falls slowly. Opening a deep breach creates a dangerous situation and may<br />
cause serious flooding and erosion downstream. Tractor- or truck-mounted excavators<br />
may be used by <strong>town</strong>, county or state highway employees to remove large amounts <strong>of</strong><br />
material from beaver dams but care should be taken to avoid downstream flooding.<br />
Neighbors should be told where, when, and why a dam excavation is going to be done. If<br />
the method is justified and must be used, it is best done in mid-summer when the water<br />
level is low.<br />
Beavers build dams instinctively. When they sense running water, they start to build or<br />
repair dams. Beavers <strong>of</strong>ten block road culverts with sticks, mud and rocks. This can cause<br />
flooding upstream. Culverts blocked from the inside are difficult to clean and potentially<br />
dangerous. The use <strong>of</strong> meshes and grills, placed on both ends <strong>of</strong> the culvert, can prevent<br />
beavers from entering. Several <strong>mitigation</strong> strategies are listed in The Use <strong>of</strong> Water Flow<br />
Devices and Flooding Problems Caused by Beaver in Massachusetts.<br />
Water Level Control Devices (WLCDs) keep beavers away from an intake pipe that<br />
lowers the water level <strong>of</strong> the pond. It‘s been estimated that only 4.5% <strong>of</strong> beaver problems<br />
in Massachusetts will respond to these devices. Using and maintaining a WLCD in<br />
conjunction with trapping young beavers can allow coexistence for years. Several types<br />
<strong>of</strong> WLCDs are available. For construction details, see The Use <strong>of</strong> Water Flow Devices<br />
and Flooding Problems Caused by Beaver in Massachusetts.<br />
Town <strong>of</strong> Greenfield Department <strong>of</strong> Public Works engineer, Alan Twarog, identified some sites<br />
where beaver dams are having an notable impact on the landscape. They include:<br />
Cherry Rum Brook behind Silvercrest Condominium project and behind Cherry Rum<br />
Plaza. These beaver dams have been breached several times.<br />
Allen Brook <strong>of</strong>f Plain Road. The Town is currently working with landowner to address<br />
this issue.<br />
On July 8, <strong>2011</strong>, the DPW breached a beaver dam on the Cherry Rum Brook after obtaining the<br />
necessary permission to remove the beavers in the area <strong>of</strong> the dam. This year (<strong>2011</strong>) marks the<br />
third year in a row that Greenfield has breached a beaver dam in this same location. Town sewer<br />
lines run nearby the Cherry Rum Brook and, with the water level rising due to the dam, water<br />
was flowing into the sewer lines and the Town was spending money to process this water in their<br />
wastewater treatment <strong>plan</strong>t.<br />
The impoundment caused by this beaver dam is approximately one half mile long by<br />
approximately one tenth mile wide and contains a cattail marsh and <strong>of</strong>fers habitat for many<br />
species – including the great blue heron, frogs, and red wing blackbirds which were observed the<br />
morning <strong>of</strong> the dam removal. Along with impacted the Town‘s sewer system, debris flowing<br />
from the beaver dam periodically causes flooding downstream at State Highway 5 and 10.<br />
Town <strong>of</strong> Greenfield Multi-Hazard Mitigation Plan <strong>2011</strong> • Final Draft 10/25/11 • Page 37
A letter from the Mayor <strong>of</strong> Greenfield (located in Appendix D) outlines the impacts and costs to<br />
the Town that beaver dams have had in recent years. There is also a newspaper article in<br />
Appendix C that describes work the DPW has done to deal with beaver dams.<br />
The impoundment provides wildlife habitat but negatively impacts the The DPW begins the work <strong>of</strong> breaching the beaver dam on July 8, <strong>2011</strong>.<br />
Town‘s sewer system.<br />
Water rushes through the newly breached beaver dam.<br />
Once drained, the Cherry Rum Brook will return to a narrow waterbody<br />
– at least until the next beavers arrive to build a new dam.<br />
Earthquakes<br />
General Description<br />
An earthquake is a sudden, rapid shaking <strong>of</strong> the ground that is caused by the breaking and<br />
shifting <strong>of</strong> rock beneath the Earth‘s surface. Earthquakes can occur suddenly, without warning,<br />
at any time <strong>of</strong> the year. The northeast states experience an average <strong>of</strong> 30 to 40 earthquakes each<br />
year although most are not noticed by people. 15 Ground shaking from earthquakes can rupture<br />
gas mains and disrupt other utility service, damage buildings, bridges and roads, and trigger<br />
other <strong>hazard</strong>ous events such as landslides, avalanches, flash floods (dam failure) and fires. Unreinforced<br />
masonry buildings, buildings with foundations that rest on filled land or<br />
15 Northeast States Emergency Consortium web site: www.nesec.org/<strong>hazard</strong>s/earthquakes.cfm<br />
Town <strong>of</strong> Greenfield Multi-Hazard Mitigation Plan <strong>2011</strong> • Final Draft 10/25/11 • Page 38
unconsolidated, unstable soil, and mobile homes not tied to their foundations are at risk during<br />
an earthquake. 16<br />
Location and Extent<br />
Table 3-8: Northeast Earthquakes with a Magnitude <strong>of</strong> 4.2 or more 1924 - 2007<br />
Location Date Magnitude<br />
Ossipee, NH December 20, 1940 5.5<br />
Ossipee, NH December 24, 1940 5.5<br />
Dover-Foxcr<strong>of</strong>t, ME December 28, 1947 4.5<br />
Kingston, RI June 10, 1951 4.6<br />
Portland, ME April 26, 1957 4.7<br />
Middlebury, VT April 10, 1962 4.2<br />
Near NH Quebec Border, NH June 15, 1973 4.8<br />
West <strong>of</strong> Laconia, NH Jan. 19, 1982 4.5<br />
Plattsburg, NY April 20, 2002 5.1<br />
Source: Northeast States Emergency Consortium: www.nesec.org/<strong>hazard</strong>s/earthquakes.cfm<br />
On June 22, 2010 there was a magnitude 5.8 earthquake in Canada which could be felt in<br />
Greenfield. No damage was reported, but residents stated they felt the quake and were unnerved<br />
by the experience.<br />
Massachusetts introduced earthquake design requirements into their building code in 1975.<br />
However, these specifications apply only to new buildings or to extensively modified buildings.<br />
Existing buildings, bridges, water supply lines, electrical power lines and facilities, etc. have<br />
generally not been designed to withstand the forces <strong>of</strong> an earthquake.<br />
Table 3-9: Northeast States Record <strong>of</strong> Historic Earthquakes<br />
State Years <strong>of</strong> Record Number Of Earthquakes<br />
Connecticut 1668 - 2007 137<br />
Maine 1766 - 2007 544<br />
Massachusetts 1668 - 2007 355<br />
New Hampshire 1638 - 2007 360<br />
Rhode Island 1776 - 2007 38<br />
Vermont 1843 - 2007 73<br />
New York 1840 - 2007 755<br />
Source: Northeast States Emergency Consortium Web site: www.nesec.org/<strong>hazard</strong>s/earthquakes.cfm<br />
16 Federal Emergency Management Agency web site: www.fema.gov/<strong>hazard</strong>s/earthquakes/quake.shtm<br />
Town <strong>of</strong> Greenfield Multi-Hazard Mitigation Plan <strong>2011</strong> • Final Draft 10/25/11 • Page 39
Landslides<br />
General Description<br />
Landslides are geological phenomena that include a wide range <strong>of</strong> ground movement, such as<br />
rock falls, failure <strong>of</strong> slopes and shallow debris flows. They can occur in coastal, mountain, and<br />
river edge environments.<br />
Landslides occur when the stability <strong>of</strong> a slope changes from a stable to an unstable condition. A<br />
change in the stability <strong>of</strong> a slope can be caused by a number <strong>of</strong> factors, acting together or alone.<br />
Natural causes <strong>of</strong> landslides include:<br />
Groundwater pressure acting to destabilize the slope<br />
Loss or absence <strong>of</strong> vertical vegetative structure, soil nutrients, and soil structure (e.g.<br />
after a wildfire)<br />
Erosion <strong>of</strong> the toe <strong>of</strong> a slope by rivers<br />
Weakening <strong>of</strong> a slope through saturation by snowmelt or heavy rains<br />
Earthquakes adding loads to barely-stable slopes<br />
Earthquake-caused liquefaction destabilizing slopes<br />
Volcanic eruptions<br />
Landslides are created by human activities as well, including deforestation, cultivation and<br />
construction, which destabilize already fragile slopes. These activities can include:<br />
Vibrations from machinery or traffic<br />
Blasting<br />
Earthwork which alters the shape <strong>of</strong> a slope, or which imposes new loads on an existing<br />
slope<br />
In shallow soils, the removal <strong>of</strong> deep-rooted vegetation that binds colluvium to bedrock<br />
Construction, agricultural or forestry activities (logging) which change the amount <strong>of</strong><br />
water which infiltrates the soil.<br />
Location and Extent<br />
Landslides in New England occur along highways where rock cuts have been made or along<br />
river corridors where the river bank collapses due to erosion that undercuts the shore.<br />
In recent years, relatively small landslides have been reported in Greenfield on Factory Hollow<br />
Road along the Fall River, on Mead Street and Wisdom Way, and Brook Road and Shelburne<br />
Road. Another incident <strong>of</strong> note affecting a cultural and historic resource involved the 90-acre<br />
Green River Cemetery. This cemetery contains the grave sites <strong>of</strong> many notable historical figures<br />
including a governor and state legislators. The site also includes exemplary funerary art and<br />
sculpture such as the Russell family monument carved by Daniel Chester French, one <strong>of</strong><br />
America‘s foremost sculptors. 17<br />
17 http://www.jsrockwell.com/historic.htm<br />
Town <strong>of</strong> Greenfield Multi-Hazard Mitigation Plan <strong>2011</strong> • Final Draft 10/25/11 • Page 40
In a recent landslide event, the Green River Cemetery‘s banks gave way again. In the early<br />
morning <strong>of</strong> March 7, <strong>2011</strong>, torrential rains swept away a piece <strong>of</strong> cemetery into the backyards <strong>of</strong><br />
homes and nearby streets, about 100 feet below the Cemetery. The landslide sent silt, mud, and<br />
debris from the Green River Cemetery down steep banks and into homes on Meridian Street.<br />
According to Robert Strahan, Emergency Management Director, three houses were damaged,<br />
three detached buildings destroyed, and six automobiles were totaled. The slide caused thousands<br />
<strong>of</strong> dollars in personal property damage and tens <strong>of</strong> thousands <strong>of</strong> dollars in clean-up costs to the<br />
Town.<br />
Residential property in Greenfield, MA was inundated with mud due to a landslide from neighboring Green River Cemetery.<br />
Photo taken by Jeff Brown and courtesy <strong>of</strong> MassLive.com.<br />
According to the Greenfield Recorder, state geologists estimated that about 1,500 to 3,000 cubic<br />
yards <strong>of</strong> mud and debris came down into the yards but that no graves were involved. Three<br />
inches <strong>of</strong> rain in Greenfield over a day and a half contributed to the disaster that caused<br />
thousands <strong>of</strong> dollars worth <strong>of</strong> damage.<br />
Town <strong>of</strong> Greenfield Multi-Hazard Mitigation Plan <strong>2011</strong> • Final Draft 10/25/11 • Page 41
The aftermath <strong>of</strong> the mudslide from the Green River Cemetery included cleanup on a nearby street and bridge..<br />
The company called in to divert water away from homes below and help clear their yards <strong>of</strong><br />
some <strong>of</strong> the mud found that a drainage system that had been installed in 1986 was been plugged<br />
and buried by the mudslide. The drainage system was cleaned out and was found to be in good<br />
shape. The company said that the drainage system, if maintained, should handle any future rains<br />
adequately. The Town indicated that it is the responsibility <strong>of</strong> the Cemetery board to make sure<br />
the system is evaluated and cleared <strong>of</strong> any silt accumulation on a regular basis. See Appendix C<br />
<strong>of</strong> this report for news articles related to this mudslide.<br />
Ice Jams<br />
General Description<br />
Ice jams (or ice dam) occurs when water builds up behind a blockage <strong>of</strong> ice. Ice dams can occur<br />
in various ways, but in New England they predominantly form on rivers and streams and mainly<br />
threaten infrastructure.<br />
When the upstream part <strong>of</strong> a river thaws first and the ice is carried downstream into the stillfrozen<br />
part <strong>of</strong> the watercourse, ice can form an ice dam and flood low lying areas upstream <strong>of</strong> the<br />
jam. Also, once an ice dam breaks apart, the sudden surge <strong>of</strong> water that breaks through the dam<br />
can flood areas downstream <strong>of</strong> the jam. Ice jams and flooding usually occur in spring; however,<br />
they can happen as winter sets in when the downstream reach <strong>of</strong> a river freezes first. Where<br />
floods threaten, the blockage can be removed mechanically.<br />
Location and Extent<br />
According to the Committee, there have been only minor ice jams under a bridge by the<br />
intersection <strong>of</strong> Shelburne Road and Route 2. Ice jams occurring in and near Greenfield could<br />
have an impact similar to flooding or dam failure, depending upon the size and impoundment<br />
associated with the jam. Historical data from the U.S. Army Cold Regions Research and<br />
Engineering Laboratory 18 from 2008 show ice jams occurrences, located by river. Since<br />
recording began there have been no ice jams on the Connecticut River in Greenfield but there<br />
18 www.crrel.usace.army.mil<br />
Town <strong>of</strong> Greenfield Multi-Hazard Mitigation Plan <strong>2011</strong> • Final Draft 10/25/11 • Page 42
have been two in Turners Fall, just upstream from Greenfield. See Table 3-10. On the Deerfield<br />
River, no ice jams have been recorded since 1959 (Table 3-11) and on the Green River none<br />
have been recorded since 1970 (Table 3-12 ).<br />
Table 3-10: Ice Jam Occurrences on the Connecticut River in or near Greenfield<br />
Date Type Latitude Longitude Town Description or other information<br />
01/24/1957 unknown<br />
42° 34‘ 72° 34‘ 43‖ Montague Maximum annual gage height <strong>of</strong> 23.78<br />
48‖ N W City feet. Discharge 36,000 cfs<br />
03/01/1947 Break-Up<br />
Weather Bureau reports ice jam upstream<br />
from gage Connecticut River at<br />
42° 6‘ 5‖ 72° 35‘ 25‖<br />
Springfield Springfield on March 1 (stage 4.5 ft) and<br />
N W<br />
2, 1947 (stage 4.2 ft). Gage datum 37.3 ft<br />
MSL, flood stage 20 ft.<br />
03/10/1946 unknown<br />
03/01/1946 Break-Up<br />
12/21/1945 unknown<br />
03/13/1936 unknown<br />
03/13/1936 Break-Up<br />
42° 34‘<br />
48‖ N<br />
42° 19‘<br />
30‖ N<br />
42° 12‘<br />
50‖ N<br />
42° 19‘<br />
30‖ N<br />
42° 12‘<br />
15‖ N<br />
72° 34‘ 43‖<br />
W<br />
72° 38‘ 30‖<br />
W<br />
72° 36‘ 36‖<br />
W<br />
72° 38‘ 30‖<br />
W<br />
72° 37‘ 0‖<br />
W<br />
Montague<br />
City<br />
Northampton<br />
Holyoke<br />
Northampton<br />
Holyoke<br />
Maximum annual gage height <strong>of</strong> 27.41.<br />
Discharge "about" 71,000 cfs<br />
As reported by The Hartford Courant on<br />
03/12/46, "The Connecticut River crested<br />
at the 18-foot level in Hartford about 7<br />
p.m. Monday and by 8 p.m. had subsided<br />
to 17.5 feet as freeze-up gripped the<br />
whole Connecticut Valley and reduced<br />
the danger <strong>of</strong> a spring flood. Waters were<br />
receding at Northampton, Mass, despite<br />
an ice jam there.<br />
Stage 2.7 ft. Gage datum 97.47 ft, flood<br />
stage 9 ft. NWSFO/NERFC flood stage<br />
19 ft.<br />
Gigantic ice jam in the Connecticut River,<br />
with ice piled 18 to 20 feet high at spots.<br />
This put terrific pressure on the Boston<br />
and Maine railroad embankment<br />
bordering the river and at one point a<br />
bulge was noticeable.<br />
Nearly the entire flow <strong>of</strong> the swollen river<br />
was diverted across the inner part <strong>of</strong> the<br />
Hockanum Meadows, where it threatened<br />
to establish a new channel. This diverted<br />
stream returned to its normal channel near<br />
Mount Tom Junction when the huge ice<br />
barrier broke during the evening <strong>of</strong> March<br />
15, floated downstream at a rate <strong>of</strong> more<br />
than 6 miles per hour, and passed over the<br />
Holyoke dam at a stage <strong>of</strong> 9.5 feet above<br />
the crest.<br />
Table 3-11: Ice Jam Occurrences on the Deerfield River in or near Greenfield<br />
Date Type Latitude Longitude Town Description or other information<br />
01/22/1959 unknown<br />
01/23/1957 unknown<br />
02/08/1941 unknown<br />
42° 32‘<br />
9‖ N<br />
42° 32‘<br />
9‖ N<br />
42° 32‘<br />
9‖ N<br />
72° 39‘ 54‖<br />
W<br />
72° 39‘ 54‖<br />
W<br />
72° 39‘ 54‖<br />
W<br />
West<br />
Deerfield<br />
West<br />
Deerfield<br />
West<br />
Deerfield<br />
Maximum annual gage height <strong>of</strong> 11.46<br />
feet<br />
Maximum annual gage height <strong>of</strong> 7.49<br />
feet. Discharge 9,570 cfs<br />
Maximum annual gage height <strong>of</strong> 8.31<br />
feet. Discharge "about" 10,000 cfs<br />
Town <strong>of</strong> Greenfield Multi-Hazard Mitigation Plan <strong>2011</strong> • Final Draft 10/25/11 • Page 43
03/12/1936 unknown<br />
02/05/1934 unknown<br />
02/17/1930 unknown<br />
02/12/1925 unknown<br />
03/23/1923 unknown<br />
03/21/1918 unknown<br />
42° 37‘<br />
33‖ N<br />
42° 37‘<br />
33‖ N<br />
42° 37‘<br />
33‖ N<br />
42° 37‘<br />
33‖ N<br />
42° 37‘<br />
33‖ N<br />
42° 37‘<br />
33‖ N<br />
72° 51‘ 12‖<br />
W<br />
72° 51‘ 12‖<br />
W<br />
72° 51‘ 12‖<br />
W<br />
72° 51‘ 12‖<br />
W<br />
72° 51‘ 12‖<br />
W<br />
72° 51‘ 12‖<br />
W<br />
Charlemont<br />
Charlemont<br />
Charlemont<br />
Charlemont<br />
Charlemont<br />
Charlemont<br />
Maximum annual gage height <strong>of</strong> 19.9 feet<br />
Maximum annual gage height <strong>of</strong> 8.80 feet<br />
Maximum annual gage height <strong>of</strong> 8.22 feet<br />
Maximum annual gage height <strong>of</strong> 15.97<br />
feet. Discharge 9,330 cfs<br />
Maximum annual gage height <strong>of</strong> 20.0 feet<br />
Maximum annual gage height <strong>of</strong> 11.75<br />
feet<br />
Table 3-12: Ice Jam Occurrences on the Green River in or near Greenfield<br />
Date Type Latitude Longitude Town Description or other information<br />
02/12/1970 unknown<br />
42° 42‘ 72° 40‘ 1‖<br />
Maximum annual gage height, 6.39 feet<br />
Colrain<br />
12‖ N W<br />
due to an ice jam. Discharge 300 cfs<br />
03/12/1965 unknown<br />
Maximum annual gage height, 3.90 feet<br />
42° 11‘ 73° 23‘ 32‖ Great<br />
due to backwater from ice. Discharge 95<br />
31‖ N W Barrington<br />
cfs<br />
02/08/1965 unknown<br />
42° 42‘ 73° 11‘ 15‖<br />
Maximum annual gage height, 3.14 feet<br />
Williams<strong>town</strong><br />
32‖ N W<br />
due to an ice jam. Discharge 50 cfs<br />
01/21/1959 unknown<br />
42° 42‘ 73° 11‘ 15‖<br />
Williams<strong>town</strong> Maximum annual gage height <strong>of</strong> 4.93 feet<br />
01/23/1957 unknown<br />
32‖ N<br />
42° 42‘<br />
32‖ N<br />
W<br />
73° 11‘ 15‖<br />
W<br />
Williams<strong>town</strong><br />
Maximum annual gage height <strong>of</strong> 4.63 feet<br />
Manmade Hazards 19<br />
General Description<br />
Most non-natural or manmade <strong>hazard</strong>s fall into two general categories: intentional acts and<br />
accidental events, although these categories can overlap. Some <strong>of</strong> the <strong>hazard</strong>s included in these<br />
two categories, as defined by MEMA, consist <strong>of</strong> intentional acts such as explosive devices,<br />
biological and radiological agents, arson and cyberterrorism and accidental events such as<br />
nuclear <strong>hazard</strong>s, invasive species, infrastructure failure, industrial and transportation accidents.<br />
Accidental events can arise from human activities such as the manufacture, transportation,<br />
storage, and use <strong>of</strong> <strong>hazard</strong>ous materials.<br />
Note: This <strong>plan</strong> does not address all manmade <strong>hazard</strong>s that could affect Franklin County. A<br />
complete <strong>hazard</strong>s vulnerability analysis was not within the scope <strong>of</strong> this update. For the<br />
purposes <strong>of</strong> the 2010 <strong>plan</strong>, FRCOG has evaluated those non-natural <strong>hazard</strong>s that are <strong>of</strong> an<br />
accidental nature. They include industrial transportation accidents and industrial accidents in a<br />
fixed facility.<br />
Hazardous materials in various forms can cause death, serious injury, long-lasting health effects,<br />
and damage to buildings, homes, and other property. Many products are shipped daily on the<br />
19 Content adapted from Commonwealth <strong>of</strong> Massachusetts State Hazard Mitigation Plan 2010<br />
Town <strong>of</strong> Greenfield Multi-Hazard Mitigation Plan <strong>2011</strong> • Final Draft 10/25/11 • Page 44
nation's highways, railroads, waterways, and pipelines. Chemical manufacturers are one source<br />
<strong>of</strong> <strong>hazard</strong>ous materials, but there are many others, including service stations, hospitals, and<br />
<strong>hazard</strong>ous materials waste sites. Hazardous materials come in the form <strong>of</strong> explosives, flammable<br />
and combustible substances, poisons, and radioactive materials. These substances are most <strong>of</strong>ten<br />
released as a result <strong>of</strong> transportation accidents or because <strong>of</strong> chemical accidents in <strong>plan</strong>ts.<br />
A release may occur at a fixed facility or in transit. Communities with a large industrial base may<br />
be more inclined to experience a <strong>hazard</strong>ous materials release due to the number <strong>of</strong> facilities such<br />
materials in their manufacturing process. Communities with several major roadways may be at a<br />
greater risk due to the number and frequency <strong>of</strong> trucks transporting <strong>hazard</strong>ous materials passing<br />
through.<br />
Industrial Accidents - Transportation<br />
Franklin County transportation systems include road, rail, and air. Accessible and efficient<br />
freight transportation plays a vital function in the economy <strong>of</strong> the region. Most freight and goods<br />
being transported to and from Franklin County are by truck; however, a significant amount <strong>of</strong><br />
freight that moves through the county is being hauled over the three main rail lines. Given that<br />
any freight shipped via air needs first to be trucked to an airport outside the region, air<br />
transportation is not being evaluated in this <strong>plan</strong>.<br />
The major trucking corridors in Franklin County are Interstate 91, running north/south, and<br />
Route 2, running east/west, both <strong>of</strong> which travel through – and intersect in – Greenfield. These<br />
two highways also represent the busiest travel corridors in the region for non-commercial traffic.<br />
According to the Franklin County Hazardous Material Emergency Plan 20 , approximately 13 to<br />
15 trucks per hour traveling through the region contain <strong>hazard</strong>ous materials (Table 3-13).<br />
Interstate 91 and Route 2 carry approximately 12 per hour. Other major roadways passing<br />
through Greenfield include Routes 5/10 and 2A.<br />
Table 3-13: Estimated Levels <strong>of</strong> Hazardous Material Transported on Area Roadways<br />
Number <strong>of</strong> Tank or Van<br />
Roadway<br />
Trucks Carrying Hazardous Materials per hour<br />
Interstate 91 10<br />
Route 2 2<br />
Other major roadways (Routes 5/10, 63, 47, 116,202, 8A, 78,<br />
122, 142, and 2A)<br />
1 or 0<br />
Table 3-14: Estimated Level <strong>of</strong> Hazardous Material Transport on Area Train Lines<br />
Average Number <strong>of</strong> Cars<br />
per Train<br />
Average Number <strong>of</strong> Cars<br />
per Train with<br />
Hazardous Waste<br />
Trains per Day (General<br />
Train Line<br />
Merchandise)<br />
Main Freight Line,<br />
Pan Am Systems<br />
10 to 24 50 4<br />
Connecticut River Line, 2 to 3 30 2<br />
20 Franklin County Local Emergency Planning Committee, Franklin County Hazardous Material<br />
Emergency Plan and Maps, 2006. Based on a one-time survey conducted in 2003.<br />
Town <strong>of</strong> Greenfield Multi-Hazard Mitigation Plan <strong>2011</strong> • Final Draft 10/25/11 • Page 45
Pan Am Systems<br />
East Deerfield Rail Yard,<br />
10 to 15<br />
Pan Am Systems<br />
trains passing through yard<br />
n/a 2 to 5<br />
New England Central 2 60 5<br />
Safe and efficient transportation routes for trucks to and through the region are important to the<br />
region‘s economy to and to the safety <strong>of</strong> its citizens. The safer the transportation routes are, the<br />
less likely a transportation accident will occur. Some challenges to safe transportation routes<br />
were indentified in the FRCOG 2007 Regional Transportation Plan and include:<br />
The lack <strong>of</strong> climbing and turning lanes on Route 2 East. Freight trucks are susceptible to<br />
the <strong>hazard</strong> <strong>of</strong> rapid stops, as they cannot slow the momentum <strong>of</strong> their vehicles quickly.<br />
The severity <strong>of</strong> the exit ramp curves impacts the safety <strong>of</strong> exiting for top-heavy vehicles<br />
such as freight trucks.<br />
Steep declines, including those on Route 2 eastbound west <strong>of</strong> Greenfield. The feasibility<br />
<strong>of</strong> adding runaway truck lanes is being evaluated.<br />
Ten to 24 trains per day travel on the Pan Am Systems Main Freight line which runs through<br />
Greenfield (Table 3-14). On each <strong>of</strong> these trains, an average <strong>of</strong> 4 cars carries <strong>hazard</strong>ous waste.<br />
Additionally, the Deerfield Switch Yard is located just across the Connecticut River in Deerfield,<br />
close enough to Greenfield to have an impact, should a <strong>hazard</strong>ous waste spill occur at that site.<br />
On January 28th, U.S. Department <strong>of</strong> Transportation awarded <strong>of</strong> $70 million for final design and<br />
construction <strong>of</strong> the "Knowledge Corridor" along the Connecticut River rail line in western<br />
Massachusetts. The Knowledge Corridor - Restore Vermonter Project will restore Amtrak's<br />
intercity passenger train service to its original route by relocating the Vermonter from the New<br />
England Central Railroad back to its former route on the Pan Am Southern Railroad. The Pan<br />
Am Southern route provides a shorter and more direct route for the Vermonter between<br />
Springfield and East Northfield, and improves access to densely populated areas along the<br />
Connecticut River. The Pan Am Southern route would include station stops at the former Amtrak<br />
station at Northampton and the new intermodal station at Greenfield. 21<br />
With these improvements to the rail line pending, additional trains are expected to run daily,<br />
possibly increasing risks to nearby neighborhoods. Speeds for freight trains are expected to<br />
increase from 10 to 40 mph with track improvements. These improvements may entice freight<br />
truckers to switch to rail. The EOT expects that by 2030, freight traffic will increase by 50-100%<br />
along the route. 22<br />
It must be noted that improvements to rail lines can have positive economic and social<br />
implications as well as the potentially negative discussed in this section.<br />
21 http://www.massdot.state.ma.us/knowledgecorridor/<br />
22 "Knowledge Corridor: Passenger Rail Study", Alyssa Larose, Robert Ratzenberger and Matthew Viens, December 2009 UMass Student Project<br />
Town <strong>of</strong> Greenfield Multi-Hazard Mitigation Plan <strong>2011</strong> • Final Draft 10/25/11 • Page 46
Industrial Accidents – Fixed Facilities<br />
An accidental <strong>hazard</strong>ous material release can occur wherever <strong>hazard</strong>ous materials are<br />
manufactured, stored, transported, or used. Such releases can affect nearby populations and<br />
contaminate critical or sensitive environmental areas. Those facilities using, manufacturing, or<br />
storing toxic chemicals are required to report their locations and the quantities <strong>of</strong> the chemicals<br />
stored on-site to state and <strong>local</strong> governments.<br />
Table 3-15: Toxics Release Inventory (TRI)<br />
Facility Name Facility Address Chemical Name<br />
Date<br />
Updated<br />
Greenfield Armory 71 Hope Street Fuel Oil #2 2003<br />
Federal St. Sunoco 295 Federal Street Diesel, Gasoline 2003<br />
Greenfield Industries 34 Sanderson St Nitrogen, Fuel Oil #2 2003<br />
Greenfield Neighbors 223 Mohawk Trail Gasoline 2003<br />
Rogers, Lunt & Bowlen 298 Federal St Petroleum Hydrocarbon 2003<br />
Greenfield Mobil 486 Bernardston Rd Gasoline 2003<br />
Mountain View Tire 109 Mohawk Trail Diesel, Gasoline 2003<br />
Verizon-Greenfield 11 Church St. Battery Sulfuric Acid, Kerosene 2003<br />
Rice Oil Company 34 Montague City Rd Fuel Oil #2, Kerosene, Propane 2003<br />
Rice Oil Company 400 Chapman St. Fuel Oil #2, Kerosene, Propane 2003<br />
A.R. Sandri 400 Chapman St Diesel, Gasoline 2003<br />
Fuel oil #2, Kerosene,<br />
A.R. Sandri<br />
191 Cleveland St<br />
Motor/Lubricant Oils, Quenching<br />
Oils 2003<br />
Stop Smart Sunoco 416 Federal St Gasoline, Fuel Oil #2 2003<br />
WTE Recycling<br />
J.K. Electronics<br />
75 Southern Ave<br />
201 Munson St.<br />
Carbon Steel Scrap, Lead Alloy<br />
Scrap, Petroleum Hydrocarbon,<br />
Stainless Steel Scrap 2003<br />
Acetylene, Aluminum Foil, Canola<br />
Oil RBD, Carbon Blk, Blu Ink<br />
Tubes, Epic-Epoxy-Resin Titanium<br />
Dioxide, Copper Wire, Epoxies,<br />
Epoxy Resin, Polyamine, Epoxy-<br />
Hardener, Ethyl Acetate, Ethyl<br />
Alcohol, Ethylene Glycol Anti-<br />
Freeze, Aluminium, Tributyl<br />
Phosphate, Lead Chromate Ink,<br />
Lead Wire Foil, Mercury, Mineral<br />
Spirits, Molybdenum, Naphtha,<br />
VM+P Naphtha Paint, Tin,<br />
Trichloroethylene, Epoxy-Micares<br />
X1087-WE R20, Epoxy-Hardner<br />
Micares P980 2003<br />
Merriam Graves<br />
1159 Bernardston Rd<br />
Cryogenic Liquid Oxygen,<br />
Anhydrous Ammonia 2003<br />
Amerigas Propane LP 44 Montague City Rd Liquid Petroleum gas, Methanol 2003<br />
Source: EPA Toxic Release Inventory, 2010. Note: Table 3-9: Toxics Release Inventory (TRI) in no way indicates any issues with<br />
any <strong>of</strong> the sites but rather is an inventory <strong>of</strong> those facilities meeting TRI reporting requirements.<br />
Town <strong>of</strong> Greenfield Multi-Hazard Mitigation Plan <strong>2011</strong> • Final Draft 10/25/11 • Page 47
The Greenfield CEM Plan identifies facilities that manufacture, store, transport or use <strong>hazard</strong>ous<br />
materials in Greenfield. Because <strong>of</strong> their potentially sensitive nature, they are not listed in this<br />
report but can be accessed by the Emergency Management Director as needed. In addition, the<br />
Toxics Release Inventory (TRI) contains information about more than 650 toxic chemicals that<br />
are being used, manufactured, treated, transported, or released into the environment. Table 3-15<br />
shows those facilities in Greenfield identified by TRI.<br />
A bio-diesel <strong>plan</strong>t slated to be built in the I-91 Industrial Park will also potentially house and use<br />
<strong>hazard</strong>ous materials.<br />
In addition to facilities potentially housing <strong>hazard</strong>ous compounds, the Committee identified the<br />
transportation <strong>of</strong> <strong>hazard</strong>ous materials through Greenfield as a potential manmade <strong>hazard</strong>. Route 2<br />
and the Pan Am Systems Railroad both serve as primary routes for transportation <strong>of</strong> cargo, some<br />
<strong>of</strong> which is <strong>of</strong> a <strong>hazard</strong>ous nature. According to the HMEP 23 Hazardous Materials Survey<br />
Results, the Pan Am Systems Railroad carries 5-12 freight trains in each direction daily with an<br />
average train length <strong>of</strong> 50 cars, an average <strong>of</strong> four <strong>of</strong> which carry <strong>hazard</strong>ous materials. The<br />
<strong>hazard</strong>ous materials regularly carried on these trains passing through Greenfield include:<br />
Hydrocyanic acid<br />
Sulfuric acid<br />
Liquified petroleum gas<br />
Hydrochloric acid<br />
Chlorine<br />
Caustic soda<br />
Methanol<br />
Sodium chloride<br />
The same <strong>plan</strong> identifies <strong>hazard</strong>ous materials being carried on highways. On Route 2, which runs<br />
through Greenfield, an average <strong>of</strong> 2 <strong>hazard</strong>ous materials tank or van trucks travel per hour. The<br />
<strong>hazard</strong>ous materials regularly carried on these trucks passing through Greenfield include:<br />
Gasoline<br />
Fuel oil<br />
Kerosene<br />
Liquified petroleum gas<br />
Propane<br />
Sodium aluminate<br />
Sulfuric acid<br />
NOS liquids 3082<br />
Hazardous facilities located outside <strong>of</strong> <strong>town</strong> boundaries can potentially impact the Town as well.<br />
The Vermont Yankee nuclear power <strong>plan</strong>t is located on the Connecticut River in Vernon,<br />
Vermont, near the Vermont/Massachusetts border and less than 20 miles from Greenfield. In<br />
January 2010, the facility notified the Vermont Department <strong>of</strong> Health that samples taken in<br />
23 http://www.frcog.org/pubs/emergency/Franklin_County_HMEP.pdf<br />
Town <strong>of</strong> Greenfield Multi-Hazard Mitigation Plan <strong>2011</strong> • Final Draft 10/25/11 • Page 48
November 2009 from a ground water monitoring well on site contained tritium. This finding<br />
signals an unintended release <strong>of</strong> radioactive material into the environment. Testing has shown<br />
that contaminated groundwater has leaked into the Connecticut River, though tritium levels in<br />
the river have remained below the lower limit <strong>of</strong> detection.[1]<br />
More recently, the <strong>2011</strong> tsunami and earthquake in Japan that damaged a nuclear power <strong>plan</strong>t<br />
demonstrates the potential vulnerability <strong>of</strong> these facilities to natural disasters, and the geographic<br />
extent that could be impacted by an accident. The future operation <strong>of</strong> the Vermont Yankee power<br />
<strong>plan</strong>t is currently unclear. The Nuclear Regulatory Commission recently extended the <strong>plan</strong>t‘s<br />
operating license for 20 more years, while the State <strong>of</strong> Vermont has denied an extension <strong>of</strong> the<br />
current license, which expires in March 2012. Nevertheless, Town <strong>of</strong>ficials should stay abreast<br />
<strong>of</strong> proper evacuation procedures in the event <strong>of</strong> an accident at the Vermont Yankee nuclear<br />
power <strong>plan</strong>t.<br />
In preparation for a potential accident at Vermont Yankee – or other such potentially catastrophic<br />
event, on July 26th, <strong>2011</strong> twenty-eight <strong>of</strong>ficials and volunteers from a wide range <strong>of</strong> agencies,<br />
including public health, emergency response, housing, social services, and transit, gathered to<br />
discuss and exercise Greenfield‘s emergency dispensing site (EDS) <strong>plan</strong>. The tabletop exercise<br />
was developed to (1) assess Greenfield and Franklin County agencies‘ response to both a<br />
bioterrorism incident and an accident at the <strong>local</strong> nuclear power <strong>plan</strong>t, and (2) to assess the<br />
updated EDS <strong>plan</strong>. This type <strong>of</strong> <strong>plan</strong>ning is ongoing in Greenfield.<br />
[1] Vermont Department <strong>of</strong> Health. http://healthvermont.gov/enviro/rad/vt_yankee.aspx<br />
Town <strong>of</strong> Greenfield Multi-Hazard Mitigation Plan <strong>2011</strong> • Final Draft 10/25/11 • Page 49
Risk Assessment Methodology<br />
In updating Greenfield‘s Multi-Hazard Mitigation Plan, the Franklin Regional Council <strong>of</strong><br />
Governments developed the All Hazards Risk Assessment methodology for assessing the risk <strong>of</strong><br />
<strong>hazard</strong>s. The All Hazards Risk Assessment is an interactive table that the Greenfield Committee<br />
completed with the FRCOG staff to evaluate all the <strong>hazard</strong>s that can impact the <strong>town</strong> based on<br />
frequency <strong>of</strong> occurrence, severity <strong>of</strong> impacts, area <strong>of</strong> occurrence and preparedness. The<br />
methodology yields a Weighted Hazard Index, which is a measure <strong>of</strong> the likelihood <strong>of</strong> future<br />
occurrence for each <strong>hazard</strong> as well as the potential impacts each <strong>hazard</strong> may have on the built<br />
and natural environments, the population and the infrastructure. The methodology yields a<br />
Weighted Hazard Index, which is a measure <strong>of</strong> the likelihood <strong>of</strong> future occurrence for each<br />
<strong>hazard</strong> as well as the potential impacts each <strong>hazard</strong> may have on the built and natural<br />
environments, the population and the infrastructure.<br />
The completed table also gives the <strong>town</strong> an overall understanding <strong>of</strong> the <strong>hazard</strong>s, provides<br />
guidance on which <strong>hazard</strong>s the Town may want to focus <strong>mitigation</strong> efforts on, reaffirms that<br />
Greenfield‘s <strong>plan</strong>ning and preparedness is on track, and shows residents that <strong>town</strong> departments<br />
and agencies are organized in case <strong>of</strong> a natural disaster. Note that the Assessment does not<br />
include manmade <strong>hazard</strong>s, given lack <strong>of</strong> data assessed for this <strong>plan</strong>.<br />
In rating the <strong>hazard</strong>s, the committee considered the following issues for each category:<br />
Issues considered when ranking frequency <strong>of</strong> occurrence:<br />
1) Known risk<br />
2) Historical data (previous occurrences)<br />
Issues considered when ranking severity <strong>of</strong> impacts:<br />
1) Building stock<br />
2) Critical facilities<br />
3) Transportation systems<br />
4) Lifeline utility systems<br />
5) Communications systems and networks<br />
6) High potential loss facilities<br />
7) Hazardous material facilities<br />
8) Economic elements<br />
9) Special consideration areas<br />
10) Historic, cultural, and natural resource areas<br />
11) Natural resources<br />
Issues considered when ranking preparedness:<br />
1) Status <strong>of</strong> current <strong>plan</strong>s<br />
2) Training status<br />
3) Availability <strong>of</strong> backup systems<br />
4) Community resources (equipment, personnel, etc.)<br />
Town <strong>of</strong> Greenfield Multi-Hazard Mitigation Plan <strong>2011</strong> • Final Draft 10/25/11 • Page 50
The following rating charts were used to determine the rating for each event.<br />
Table 3-16: Frequency <strong>of</strong> Occurrence Rating Chart<br />
Classification # Frequency <strong>of</strong> Occurrence<br />
Very High 5 events that occur at least once each year (100% per year)<br />
High 4 events that occur from once in 2 years to once in 4 years (25% to 50% per year)<br />
Medium 3 events that occur from once in 5 years to once in 50 years (2% to 20% per year)<br />
Low 2 events that occur from once in 50 years to once in 100 years (1% to 2% per year)<br />
Very Low 1 events that occur less frequently than once in 100 years (less than 1% per year)<br />
Table 3-17: Severity <strong>of</strong> Occurrence Rating Chart<br />
Classification # Severity <strong>of</strong> Multiple Impacts<br />
Catastrophic 4<br />
Critical 3<br />
Limited 2<br />
Multiple deaths and injuries possible. More than 50% <strong>of</strong> property in affected<br />
area damaged or destroyed. Complete shutdown <strong>of</strong> facilities for 30 days or<br />
more.<br />
Multiple injuries possible. More than 25% <strong>of</strong> property in affected area<br />
damaged or destroyed. Complete shutdown <strong>of</strong> facilities for more than 1<br />
week.<br />
Minor injuries only. More than 10% <strong>of</strong> property in affected area damaged or<br />
destroyed. Complete shutdown <strong>of</strong> facilities for more than 1 day.<br />
Minor 1<br />
Very few injuries, if any. Only minor property damage and minimal<br />
disruption on quality <strong>of</strong> life. Temporary shutdown <strong>of</strong> facilities.<br />
Table 3-18: Severity <strong>of</strong> Impacts Definitions<br />
Severity <strong>of</strong> Impact<br />
Severity <strong>of</strong> Impact Category Definitions<br />
Category<br />
Built<br />
Building Stock includes residential, commercial, industrial, and institutional buildings.<br />
Hazardous Material Facilities include facilities housing industrial/<strong>hazard</strong>ous materials, such<br />
Built<br />
as corrosives, explosives, flammable materials, radioactive materials, and toxins.<br />
Historic, Cultural, and Natural Resource Areas may include buildings, structures, objects,<br />
sites, national and <strong>local</strong> historic or significant districts, and historical archival storage<br />
Built<br />
facilities.<br />
Critical Facilities are essential to the health and welfare <strong>of</strong> the whole population and are<br />
especially important following <strong>hazard</strong> events. Since vulnerability is based on service losses<br />
as well as building structure integrity and content value, assess the effects on the service<br />
function interruption <strong>of</strong> critical facilities as well as their physical aspects. For purposes <strong>of</strong><br />
this <strong>mitigation</strong> <strong>plan</strong>ning guidance, critical facilities may include emergency service facilities<br />
such as hospitals and other medical facilities, jails and juvenile detention centers, police and<br />
fire stations, emergency operations centers, public works facilities, evacuation shelters,<br />
Infrastructure schools, and other uses that house special needs populations.<br />
Transportation Systems include airways (including airports, heliports, etc.), roadways<br />
(including highways, bridges, tunnels, roadbeds, overpasses, transfer centers, etc.), railways<br />
and public transit (including trackage, tunnels, bridges, rail yards, depots, etc.), and<br />
Infrastructure waterways (including canals, locks, seaports, ferries, harbors, dry-docks, piers, etc.).<br />
Lifeline Utility Systems such as potable water, wastewater, oil, natural gas, electric power,<br />
Infrastructure substations, power lines, etc.<br />
Town <strong>of</strong> Greenfield Multi-Hazard Mitigation Plan <strong>2011</strong> • Final Draft 10/25/11 • Page 51
Severity <strong>of</strong> Impact<br />
Category<br />
Infrastructure<br />
Natural<br />
Population<br />
Population<br />
Population<br />
Severity <strong>of</strong> Impact Category Definitions<br />
Communications Systems and Networks such as telephones, emergency service radio<br />
systems, repeater sites and base stations, television and radio stations, etc.<br />
NaturalResources include agricultural land, water supply lands, rivers.<br />
High Potential Loss Facilities include facilities that would have a high loss associated with<br />
them, such as nuclear power <strong>plan</strong>ts or dams.<br />
Economic Elements include major employers, financial centers, and other business or retail<br />
districts in the community that could significantly affect the <strong>local</strong> or regional economy if<br />
interrupted.<br />
Special Consideration Areas include areas <strong>of</strong> high density residential, commercial,<br />
institutional, and industrial development that, if damaged, could result in economic and<br />
functional losses and in high death tolls and injury rates.<br />
Table 3-19: Area <strong>of</strong> Occurrence Rating Chart<br />
Classification # Percentage <strong>of</strong> Town Impacted<br />
Large 3 More than 50% <strong>of</strong> the <strong>town</strong> affected.<br />
Medium 2 10 to 50% <strong>of</strong> the <strong>town</strong> affected.<br />
Isolated 1 Less than 10% <strong>of</strong> the <strong>town</strong> affected.<br />
Table 3-20: Preparedness Rating Chart<br />
Classification #<br />
Poor 3<br />
Fair 2<br />
Good 1<br />
To determine the final <strong>hazard</strong> index for each <strong>hazard</strong>, each category was assigned a weight.<br />
Frequency <strong>of</strong> Occurrence was given the most weight (45%), followed by Severity <strong>of</strong> Impacts<br />
(30%), Area <strong>of</strong> Occurrence (15%), and Preparedness (10%). Ratings were entered into a<br />
spreadsheet which calculated the weighted <strong>hazard</strong> index for each <strong>hazard</strong>. The Weighted Hazard<br />
Index represents the probability <strong>of</strong> occurrence <strong>of</strong> future events. Hazards with higher index scores<br />
represent the events most in need <strong>of</strong> organization focus and resources for emergency <strong>plan</strong>ning<br />
and <strong>mitigation</strong> projects.<br />
The results <strong>of</strong> the All Hazards Vulnerability Assessment can be seen in Table 3-21. The <strong>hazard</strong>s<br />
receiving a Weighted Hazard Index <strong>of</strong> 5 or more are – in order <strong>of</strong> vulnerability – Microbursts<br />
(including wind related events) (6.8), Hurricanes and Tornados (6.1), and Severe Winter Storms<br />
(5.2).<br />
The committee evaluated microbursts and associated thunder and wind storms as particularly<br />
problematic, with issues such as power outages and debris removal common in the aftermath <strong>of</strong><br />
such a storm. This is true <strong>of</strong> snow and ice storms as well. Given these issues and given the<br />
frequency <strong>of</strong> microbursts and wind-related storms, microbursts rated highest on the Weighted<br />
Hazard Index with a 6.8 rating. Hurricanes and severe winter storms rated next highest on the<br />
Index, with severe winter storms causing issues <strong>of</strong> power outages and debris removal, among<br />
other effects.<br />
Town <strong>of</strong> Greenfield Multi-Hazard Mitigation Plan <strong>2011</strong> • Final Draft 10/25/11 • Page 52
The <strong>hazard</strong>s rated on the Weighted Hazard Index between 4 and 5 include floods, tornados,<br />
earthquakes and wildfires. In the case <strong>of</strong> floods, earthquakes and wildfires, there were all<br />
evaluated as having a high frequency <strong>of</strong> occurrence but relatively low severity <strong>of</strong> impact and<br />
limited area <strong>of</strong> occurrence. The Committee acknowledged that earthquake occur quite frequently<br />
in New England, but are rarely large enough to be felt. Landslides, ice dams and dam failures<br />
were rated lowest on the Weighted Hazard Index.<br />
In terms <strong>of</strong> preparedness, the Committee rated the Town as being fair or good for all <strong>hazard</strong>s,<br />
while acknowledging the need for improvements such a:<br />
Implementing Reverse 911 system<br />
Purchasing equipment for tree and debris removal<br />
Increasing debris disposal sites<br />
Sharing <strong>of</strong> equipment and sites on a <strong>multi</strong>ple <strong>town</strong> or regional basis<br />
Conducting a <strong>hazard</strong>ous tree assessment<br />
Purchasing emergency back-up generators for all emergency facilities<br />
Addressing animal control and sheltering during emergencies<br />
Inspecting the Mill and Meridian Street Dams<br />
These needed improvements are included as action items in the Action Plan.<br />
The Weighted Hazard Index is a crucial tool in helping the Committee and Town prioritize its<br />
action items. See the Action Plan to understand how this information was applied to action item<br />
prioritization.<br />
Town <strong>of</strong> Greenfield Multi-Hazard Mitigation Plan <strong>2011</strong> • Final Draft 10/25/11 • Page 53
Table 3-21: TOWN OF GREENFIELD All Hazards Vulnerability Assessment<br />
EVENTS<br />
Frequency <strong>of</strong><br />
Occurrence<br />
(FOO)*<br />
FOO<br />
Weighted<br />
Value<br />
Severity <strong>of</strong> Impacts*<br />
(SOI)<br />
SOI Weighted<br />
Value<br />
Area <strong>of</strong> Occurrence*<br />
Add Weighted<br />
Value<br />
Preparedness<br />
Prep. Weighted<br />
Value<br />
Weighted<br />
Hazard<br />
Index<br />
ASSIGNED WEIGHTING FACTOR 45% 30% 15% 10%<br />
INDEX VALUE 1-5 Built 1-4* Natural 1-4* Population 1-4*<br />
Infrastructure 1-<br />
4*<br />
1-3 1-3<br />
HAZARDS<br />
Microbursts (Includes<br />
Thunderstorms and Wind<br />
Related Events) 5 2.25 3 3 4 3 3.9 3 0.45 2 0.2 6.8<br />
Hurricanes<br />
Severe Winter Storms<br />
4 1.8 3 3 3 3 3.6 3 0.45 2 0.2 6.1<br />
5 2.25 2 2 2 2 2.4 3 0.45 1 0.1 5.2<br />
Floods<br />
Tornados<br />
Earthquakes<br />
Wildfires / Brush Fires<br />
5 2.25 2 1 2 2 2.1 1 0.15 2 0.2 4.7<br />
3 1.35 2 3 2 2 2.7 1 0.15 2 0.2 4.4<br />
5 2.25 1 1 1 1 1.2 3 0.45 2 0.2 4.1<br />
5 2.25 1 2 1 1 1.5 1 0.15 1 0.1 4.0<br />
Landslides<br />
Ice Jams<br />
Dam Failures<br />
3 1.35 2 2 1 2 2.1 1 0.15 2 0.2 3.8<br />
3 1.35 1 2 1 1 1.5 1 0.15 2 0.2 3.2<br />
1 0.45 2 2 2 2 2.4 1 0.15 2 0.2 3.2<br />
Town <strong>of</strong> Greenfield Local Natural Hazard Mitigation Plan 54<br />
June 2010
Vulnerability Assessment<br />
Vulnerability Overview<br />
This section presents exposure, damages, loss estimates, population impacts and data<br />
deficiencies for each <strong>of</strong> the <strong>hazard</strong>s addressed in the Multi-Hazard Identification and Pr<strong>of</strong>ile<br />
Section <strong>of</strong> the Plan. Additionally, an overall vulnerability assessment is provided for each<br />
<strong>hazard</strong>. This analysis is an in-depth look at each <strong>hazard</strong> in Greenfield. Coupled with the All<br />
Hazards Vulnerability Assessment from the previous section, these findings will support<br />
<strong>plan</strong>ning efforts based on a better understanding <strong>of</strong> the potential impacts associated with each<br />
<strong>hazard</strong> and provide a foundation for the <strong>mitigation</strong> strategy presented in Section 5.<br />
Vulnerability Assessment Methodology<br />
The Vulnerability Assessment is a series <strong>of</strong> tables that enabled FRCOG staff to determine the<br />
vulnerability <strong>of</strong> Greenfield to flooding and to calculate the potential costs <strong>of</strong> flooding to the<br />
<strong>town</strong>. 24 Estimated losses for all other <strong>hazard</strong> events were also determined, based on damages<br />
from past recorded events. The potential implications for vulnerable populations such as senior<br />
and low income populations in the event <strong>of</strong> a <strong>hazard</strong> are also assessed.<br />
Environmental Justice<br />
Identifying vulnerable populations in a <strong>town</strong> can be challenging. It can be assumed that senior<br />
populations may be more vulnerable—and thus might be more at risk for certain <strong>hazard</strong>s—due to<br />
their possible loss <strong>of</strong> mobility and the increased likelihood that elderly people live alone and may<br />
have less access to information. People <strong>of</strong> low income may also face higher risks due in part to<br />
less access to information and the higher likelihood <strong>of</strong> living in undesirable or poor quality<br />
housing and/or locations, such as those adjacent to areas zoned industrial or in the floodplain, for<br />
example.<br />
In 1994, President Clinton issued Executive Order 12898, ―Federal Actions to Address<br />
Environmental Justice in Minority Populations and Low-Income Populations,‖ directing federal<br />
agencies to address environmental injustices in their operations and in communities across the<br />
country. Since then, states and municipalities have developed policies and programs to proactively<br />
address environmental equity concerns to help ensure that minority and low-income<br />
communities are not disproportionately impacted by environmental <strong>hazard</strong>s. 25<br />
There are many obstacles that make it challenging for Environmental Justice (EJ) populations to<br />
participate in such things as <strong>plan</strong>ning and development decisions in their communities. These<br />
residents are more likely to be unaware <strong>of</strong> environmental issues due to social issues including<br />
language barriers and limited access to educational resources. In addition, EJ populations are<br />
<strong>of</strong>ten unable to participate in environmental decision-making processes because they <strong>of</strong>ten must<br />
work longer hours to compensate for lower hourly wages. 26 Thus decisions that may directly<br />
impact where they live may be made by a <strong>town</strong> without their voices being heard.<br />
24 These tables were developed to provide <strong>town</strong>s with a template for calculating and estimating potential losses and costs <strong>of</strong> flooding. They draw<br />
from and integrate the work <strong>of</strong> other Natural Hazard Mitigation Plans, specifically the Natural Hazard Mitigation Plan for Thurston County,<br />
Washington, September 2009, but the tables can be linked to the most recent demographic, land use, and infrastructure information (databases)<br />
and automatically calculate and estimate the cost <strong>of</strong> flooding to each <strong>town</strong> or region.<br />
25 http://www.mass.gov<br />
26 http://www.mass.gov/envir/smart_growth_toolkit/pages/mod-ej.html<br />
Town <strong>of</strong> Greenfield Local Natural Hazard Mitigation Plan • January <strong>2011</strong>• Page 55
In 2003, based upon 2000 census data, MassGIS produced Environmental Justice Populations<br />
layers representing neighborhoods across the state with high minority, non-English speaking,<br />
low-income, and foreign-born populations. 27<br />
Town <strong>of</strong> Greenfield Environmental Justice Populations<br />
Source: Mass GIS Data<br />
EJ Populations in Massachusetts are determined by the following criteria:<br />
Households earn 65% or less <strong>of</strong> the statewide household median income; or<br />
27 http://www.mass.gov/mgis/cen2000_ej.htm<br />
Town <strong>of</strong> Greenfield Local Natural Hazard Mitigation Plan • January <strong>2011</strong>• Page 56
25% or more <strong>of</strong> the residents are minority; or<br />
25% or more <strong>of</strong> the residents are foreign-born; or<br />
25% or more <strong>of</strong> the residents are lacking English language pr<strong>of</strong>iciency<br />
Based upon these criteria, the Franklin County <strong>town</strong>s with Environmental Justice populations are<br />
Greenfield, Montague and Orange. Sections <strong>of</strong> all three <strong>town</strong>s were categorized as such based on<br />
the low income criteria. In Greenfield, the EJ area is roughly bounded by Interstate 91 to the<br />
west, Pierce Street to the north, High Street to the east and River Street to the south, as shown in<br />
the map above. Some <strong>of</strong> the EJ area also overlaps with areas in the floodplain, is along the rail<br />
line, and/or is adjacent to areas zoned industrial. See Manmade Hazards for additional<br />
information on impacts to populations related to rail on pages 45-50.<br />
As Greenfield works to mitigate <strong>hazard</strong>s in Town, concentrating public education and outreach<br />
in the EJ area could be a priority. The Town could also evaluate action items to determine if their<br />
implementation could have a disproportionately high and adverse impact to Environmental<br />
Justice populations. Some <strong>hazard</strong> <strong>mitigation</strong> projects with the potential to cause these effects<br />
include flood control projects, and stormwater management projects.<br />
Floods<br />
Hazard Summary<br />
Flooding can be caused by severe storms, such as hurricanes, nor‘easters, and microbursts, as<br />
well as ice jams and snow melt. To determine the vulnerability <strong>of</strong> the Town, properties within<br />
the flood <strong>hazard</strong> area were identified and damage assessments were then generated for the<br />
various classes <strong>of</strong> property — residential, commercial, industrial, public and institutional land<br />
uses. The damage estimates presented in the following tables are rough estimates and reflect a<br />
worst-case scenario. These estimates should be used only within the context <strong>of</strong> this Multi-<br />
Hazard Mitigation <strong>plan</strong>ning effort. Computing detailed damage assessments is a complex task<br />
and is the reason FRCOG developed the linked tables, which use <strong>town</strong> demographics and values.<br />
In updating the Hazard Mitigation Plan for Greenfield, more detailed data was gathered and<br />
calculated for the value <strong>of</strong> residential, commercial, industrial and public/institutional properties<br />
as well as agricultural lands. Transportation and waste disposal land uses were beyond the scope<br />
<strong>of</strong> the assessment.<br />
Data Collected and Used<br />
National weather databases and Town <strong>of</strong> Greenfield data were collected and analyzed. Data on<br />
historic property damage and loss, and injuries and deaths, was collected for Franklin County<br />
from the National Oceanic and Atmospheric Administration‘s (NOAA) National Climatic Data<br />
Center website. This data was used to support an evaluation <strong>of</strong> exposure and potential impacts<br />
associated with this <strong>hazard</strong>. Available historic data were presented in Tables 3-1 and 3-2. The<br />
Commonwealth <strong>of</strong> Massachusetts State Hazard Mitigation Plan 2010 was also reviewed for<br />
information on flooding.<br />
Town <strong>of</strong> Greenfield Local Natural Hazard Mitigation Plan • January <strong>2011</strong>• Page 57
Impact on the Community<br />
Exposure and Loss Estimation<br />
Flooding can cause a wide range <strong>of</strong> issues, from minor nuisance roadway flooding and basement<br />
flooding to major impacts such as roadway closures and residential evacuations. Specific<br />
damages associated with flooding events include the following primary concerns:<br />
Blockages <strong>of</strong> roadways or bridges vital to travel and emergency response<br />
Breaching <strong>of</strong> dams<br />
Damaged or destroyed buildings and vehicles<br />
Uprooted trees causing power and utility outages<br />
Drowning, especially people trapped in cars<br />
Contamination <strong>of</strong> drinking water<br />
Dispersion <strong>of</strong> <strong>hazard</strong>ous materials<br />
Interruption <strong>of</strong> communications and/or transportation systems<br />
Debris management issues including debris removal and identification <strong>of</strong> disposal sites<br />
Property Damage<br />
The following discussion and tables examine the potential cost <strong>of</strong> flooding to Greenfield for land<br />
uses and facilities located in the floodplain should catastrophic flooding occur resulting in a<br />
worst-case scenario. Of Greenfield‘s total <strong>of</strong> 14,037 acres, 1,449 acres – or about 10% – lie<br />
within the 100-year floodplain. Table 3-22 shows the number <strong>of</strong> dwelling units in the flood<br />
<strong>hazard</strong> area (floodplain) in Greenfield. The figures in the last two columns <strong>of</strong> the table are<br />
calculated using data from the U.S. Census and MassGIS. In Greenfield less than 1% <strong>of</strong> the<br />
population resides in the floodplain.<br />
Table 3-22: Number <strong>of</strong> Dwelling Units in the Flood Hazard Area<br />
Total Town<br />
Population 28<br />
Average per<br />
household<br />
population 29<br />
Number <strong>of</strong> Dwelling<br />
Units in Flood<br />
Hazard Area 30<br />
Estimated<br />
population in Flood<br />
Hazard Area<br />
% <strong>of</strong> total<br />
population that<br />
reside in the Flood<br />
Hazard Area<br />
17,456 2.19 38 83 0.005%<br />
Table 3-23 shows the total acreage <strong>of</strong> each type <strong>of</strong> land use – commercial, industrial and<br />
public/institutional – in Greenfield; the total acreage for each <strong>of</strong> the three types <strong>of</strong> land use in the<br />
floodplain in <strong>town</strong>; and the percentage <strong>of</strong> the total acreage for each type <strong>of</strong> land use in the<br />
floodplain in Greenfield. 31 In all, 2% <strong>of</strong> the land in the floodplain is used for commercial,<br />
industrial and public/institutional purposes.<br />
28 U.S. Census, 2010.<br />
29 U.S. Census, 2000.<br />
30 Mass GIS<br />
31 Mass GIS<br />
Town <strong>of</strong> Greenfield Local Natural Hazard Mitigation Plan • January <strong>2011</strong>• Page 58
Table 3-23: Acres <strong>of</strong> Commercial, Industrial and Public/Institutional Land Uses in the<br />
Flood Hazard Area<br />
Total acres <strong>of</strong> land use in<br />
Town<br />
Acres <strong>of</strong> land use in<br />
Flood Hazard Area<br />
% <strong>of</strong> land use acres in the<br />
Flood Hazard Area <strong>of</strong> the<br />
Town<br />
Commercial 402.98 13.57 3%<br />
Industrial 183.13 1.86 1%<br />
Public/Institutional 239.31 4.81 2%<br />
Table 3-24 summarizes the average assessed value <strong>of</strong> the five types <strong>of</strong> land uses in Greenfield in<br />
the floodplain – residential, commercial, industrial, public/institutional and agricultural. 32 The<br />
total worth <strong>of</strong> lands in the floodplain is assessed at almost $4.5 billion. This is <strong>of</strong> concern<br />
because should a catastrophic flooding event befall Greenfield, the assessed values <strong>of</strong> these<br />
structures and facilities would likely be significantly reduced which in turn would severely<br />
impact the <strong>town</strong>‘s tax revenues.<br />
Table 3-24: Average Assessed Value <strong>of</strong> Land Use in Flood Hazard Area<br />
Total Acres<br />
in Town<br />
Total Assessed<br />
Value<br />
Average<br />
Assessed Value<br />
Per Acre<br />
Acres in<br />
Floodplain<br />
Average Assessed<br />
Value in<br />
Floodplain<br />
Residential 2,598.51 $253,678,000 $97,624 42.99 $4,196,873.29<br />
Commercial 11.3 $1,992,179 $176,299 0.49 $86,387<br />
Industrial 2.7 $793,900 $294,037 0.48 $141,138<br />
Table 3-25 lists the estimated value <strong>of</strong> the contents <strong>of</strong> the different classes <strong>of</strong> buildings and<br />
facilities. The value is presented as a percentage <strong>of</strong> the replacement value <strong>of</strong> the building and the<br />
class <strong>of</strong> structure. 33 The percentages vary for certain classes because the replacement cost <strong>of</strong> the<br />
contents is different from institution to business to service.<br />
Table 3-25: Estimates <strong>of</strong> Building Contents by Class<br />
Occupancy Class Contents Value %<br />
Residential (including temporary lodging, dormitory, and nursing homes) 50%<br />
Commercial (including retail, wholesale, pr<strong>of</strong>essional, services, financial,<br />
entertainment & recreation) 100%<br />
Commercial (including hospital and medical <strong>of</strong>fice/clinic) 150%<br />
Commercial Parking 50%<br />
Industrial (including heavy, light technology) 150%<br />
Agriculture 100%<br />
Religion/Non-Pr<strong>of</strong>it 100%<br />
Government Emergency Response 150%<br />
Government General Services 100%<br />
Education Schools/Libraries 100%<br />
Education Colleges/Universities 150%<br />
32 Massachusetts Department <strong>of</strong> Revenue.<br />
33 Town <strong>of</strong> Clay Hazard Mitigation Plan<br />
Town <strong>of</strong> Greenfield Local Natural Hazard Mitigation Plan • January <strong>2011</strong>• Page 59
Table 3-26 shows the total value <strong>of</strong> replacing the structures and contents <strong>of</strong> buildings located in<br />
the floodplain in Greenfield. In total, the structures and building contents are valued at<br />
$293,805,621. It is evident that catastrophic flooding would cause significant economic,<br />
financial and environmental damage.<br />
Table 3-26: Total Building Value in Flood Hazard Area<br />
Building Structure Building Contents Value<br />
Value in Flood in Flood Hazard Area<br />
Hazard Area<br />
Total Building Value in<br />
Flood Hazard Area<br />
Commercial $243,076,431 100% $24,307,643<br />
Industrial $33,819,460 150% $50,729,190<br />
Public/Institutional $184,675 150% $277,013<br />
Table 3-27 identifies the average assessed value <strong>of</strong> all residential, commercial, and industrial<br />
land uses located in the floodplain in Greenfield, and the losses that would result from 1%, 5%,<br />
and 10% damage to this inventory as a result <strong>of</strong> a major flooding event<br />
Table 3-27: Potential Estimated Loss in Flood Hazard Area by Land Use<br />
Average Assessed<br />
1% Damage Loss 5% Damage Loss<br />
Land Use Value <strong>of</strong> Land in<br />
Estimate<br />
Estimate<br />
Floodplain<br />
10% Damage Loss<br />
Estimate<br />
Residential $17,460,450.61 $174,605 $873,023 $1,746,045<br />
Commercial $8,185,386.79 $81,854 $409,269 $818,539<br />
Industrial $343,494.76 $3,435 $17,175 $34,349<br />
Total $25,989,332.17 $259,893.32 $1,299,466.61 $2,598,933.22<br />
Source: Massachusetts Dept. <strong>of</strong> Revenue - Division <strong>of</strong> Local Services, Municipal Databank/Local Aid Section 2010.<br />
Repetitive Loss Properties<br />
Repetitive loss properties are those for which two or more losses <strong>of</strong> at least $1000 each have<br />
been paid under the National Flood Insurance Program (NFIP) within any 10-year period since<br />
1978. According to MEMA, there are no repetitive loss structures in Franklin County. See pages<br />
131-133 for more information on NFIP.<br />
Population Impacts – Senior Citizens and People <strong>of</strong> Low Income<br />
Certain segments <strong>of</strong> Greenfield‘s population – seniors and people <strong>of</strong> low income and/or<br />
Environmental Justice populations– may be more vulnerable to flooding and other events (see<br />
Environmental Justice section, pages 56-58). The Town should be aware <strong>of</strong> the potential needs <strong>of</strong><br />
these residents in the event <strong>of</strong> a <strong>hazard</strong> occurrence Table 3–28 displays the number <strong>of</strong> senior and<br />
people <strong>of</strong> low income residents in Greenfield. It should be noted that there may be overlap<br />
within the two categories, so that the total number <strong>of</strong> individuals exposed may be lower than<br />
what is shown in the table.<br />
Table 3-28: Senior and Low Income Populations in Greenfield Exposed to Hazards<br />
Population Category<br />
Number <strong>of</strong> Persons<br />
Exposed<br />
Percentage <strong>of</strong> Total<br />
Population<br />
Senior (Over 65 years <strong>of</strong> age) 3,178 17.5%<br />
Town <strong>of</strong> Greenfield Local Natural Hazard Mitigation Plan • January <strong>2011</strong>• Page 60
Low Income (Persons with annual incomes less<br />
than $20,000)* 5,320 29.3%<br />
Total 8,498 46.8%<br />
* Low income population was calculated by <strong>multi</strong>plying 2000 U.S. Census Households with Incomes <strong>of</strong> Less than $20,000 (116)<br />
by 2000 U.S. Census Average Household Size (2.45). Source: 2000 U.S. Census.<br />
Overall Vulnerability Assessment<br />
Flooding is common in New England, and can cause significant impacts to the roads, structures,<br />
facilities, utilities, and populations, including Greenfield. Existing and future <strong>mitigation</strong> efforts<br />
should continue to be developed and employed that will enable Greenfield to be prepared for<br />
these events when they occur. Particular areas <strong>of</strong> vulnerability include Environmental Justice and<br />
elderly populations, trailer homes, and infrastructure such as and the low-lying areas that can be<br />
impacted by flooding related to ice jams or rapid snow melt.<br />
Data Deficiencies<br />
In assessing the risks to Greenfield from flood <strong>hazard</strong>s, the following data deficiencies were<br />
identified:<br />
The <strong>town</strong>s <strong>of</strong> Franklin County rely on farming for one <strong>of</strong> its income sources. Little data<br />
exists on <strong>local</strong>ized crop damage due to flooding.<br />
Data for the location and condition <strong>of</strong> dams within Greenfield resides with the DCR<br />
Office <strong>of</strong> Dam Safety and with FERC. New s<strong>of</strong>tware and reporting systems within the<br />
Office <strong>of</strong> Dam Safety has resulted in missing data and questions as to the status <strong>of</strong> some<br />
dams. Requests for additional information have been referred to the Office <strong>of</strong> Dam<br />
Safety‘s Legal Department, which charges for any requests for information.<br />
Severe Winter Storms<br />
Hazard Summary<br />
Severe snow and ice storms are common in Greenfield, <strong>of</strong>ten impacting the Towns‘ roads,<br />
structures, facilities, utilities, and population. Existing and future <strong>mitigation</strong> efforts should<br />
continue to be developed and employed that will enable the Town to be prepared for these<br />
events. Severe winter storms cause significant concern because they happen <strong>of</strong>ten and can be<br />
quite severe; they cost residents money; they require snow and ice removal, which can limit<br />
access to facilities and can cause health problems; they can cause utility failure and flooding<br />
from ice jams; and they put stress on community resources.<br />
Data Collected and Used<br />
National weather databases and Town <strong>of</strong> Greenfield data were collected and analyzed. Data on<br />
historic property damage and loss, and injuries and deaths, was collected for Franklin County<br />
from the National Oceanic and Atmospheric Administration‘s (NOAA) National Climactic Data<br />
Center website. This data was used to support an evaluation <strong>of</strong> exposure and potential impacts<br />
associated with this <strong>hazard</strong>. Available historic data are presented in Table 3-29. The<br />
Commonwealth <strong>of</strong> Massachusetts State Hazard Mitigation Plan 2010 was also reviewed for<br />
information on severe winter storm <strong>hazard</strong> data and <strong>mitigation</strong> measures.<br />
Town <strong>of</strong> Greenfield Local Natural Hazard Mitigation Plan • January <strong>2011</strong>• Page 61
Impact on the Community<br />
Exposure and Loss Estimation<br />
Heavy snowfall coupled with low temperatures <strong>of</strong>ten results in increases in traffic accidents;<br />
disruptions in transportation, commerce, government, and education; utility outages due to<br />
falling trees, branches, and other objects; personal injuries associated with slippery surfaces and<br />
freezing temperatures; and numerous other problems. Specific damages associated with severe<br />
winter storm (snow) events include the following primary concerns:<br />
Injuries and fatalities associated with accidents, low temperatures, power loss, falling<br />
objects and accidents associated with slippery surfaces and snow accumulation<br />
Increases in the frequency and impact <strong>of</strong> traffic accidents, resulting in personal injuries<br />
Ice-related damage to trees, building and infrastructure inventory, and utilities (power<br />
lines, bridges, substations, etc.)<br />
Roads damaged through freeze and thaw processes<br />
Stress on the <strong>local</strong> shelters and emergency response infrastructure<br />
Lost productivity that occurs when people cannot go to work, school, or stores due to<br />
inclement conditions<br />
Debris management issues including debris removal and identification <strong>of</strong> disposal sites<br />
New England‘s climate <strong>of</strong>fers no immunity to the potential damaging effects <strong>of</strong> severe winter<br />
storms. Some minimum damage is anticipated annually, with potential extensive damage<br />
occurring about once every 10 years.<br />
Property Damage<br />
As presented in Table 3-29, historic data for severe winter storm (heavy snow) events indicate<br />
that between 1993 and 2010, 111 heavy snow events were recorded in Franklin County. An<br />
average <strong>of</strong> 6.1 heavy snow and ice events occur each year, causing an average annual property<br />
damage county-wide <strong>of</strong> $4.5 million.<br />
Table 3-29: Severe Winter Storm Events in Franklin County<br />
Year # <strong>of</strong> Heavy Snow/Ice Events Annual Property Damage Annual Crop Damage<br />
2010 3 $30,000 $0<br />
2009 5 $0 $0<br />
2008 12 $6,020,000 $0<br />
2007 7 $10,000 $0<br />
2006 0 $0 $0<br />
2005 9 $625,000 $0<br />
2004 3 $0 $0<br />
2003 5 $50,000 $0<br />
2002 7 $1,605,000 $0<br />
2001 7 $11,000,000 $0<br />
2000 7 $0 $0<br />
1999 6 $0 $0<br />
1998 3 $0 $0<br />
1997 6 $10,030,000 $0<br />
1996 10 $47,000,000 $0<br />
Town <strong>of</strong> Greenfield Local Natural Hazard Mitigation Plan • January <strong>2011</strong>• Page 62
Year # <strong>of</strong> Heavy Snow/Ice Events Annual Property Damage Annual Crop Damage<br />
1995 6 $0 $0<br />
1994 8 $5,050,000 $0<br />
1993 7 $0 $0<br />
18 111 $4,523,333 $0<br />
Source: NOAA National Climactic Data Center. http://www4.ncdc.noaa.gov/cgi-win/wwcgi.dll?wwevent~storms.<br />
As indicated in the Risk Assessment section <strong>of</strong> this <strong>plan</strong>, a winter storm in 2008 left residents in<br />
Franklin Country without power for several days. Greenfield was fortunate; the storm did not<br />
cause power outages in <strong>town</strong>. There was some property damage from the winds that required<br />
clean up and disposal <strong>of</strong> debris. However, because Greenfield did not lose power it became a<br />
refuge. Many residents from around Franklin County relied on the hospitality <strong>of</strong> Greenfield‘s<br />
hotels, motels and inns and restaurants, cafes, and c<strong>of</strong>fee shops to weather the storm and power<br />
outages. Total property damage from this storm total was not available. Estimated costs to the<br />
Town for storm response, including staffing shelters and providing food and water, were also not<br />
available.<br />
Population Impacts<br />
Populations considered most vulnerable to severe winter storm impacts are identified based on a<br />
number <strong>of</strong> factors including their physical and financial ability to react or respond during a<br />
<strong>hazard</strong> and the location and construction quality <strong>of</strong> their housing. Table 3-30 summarizes the<br />
population in Greenfield over the age <strong>of</strong> 65 or living in households with an income below<br />
$20,000 per year. See also Environmental Justice section on pages 56-58.<br />
Table 3-30: Senior and Low Income Populations in Greenfield Exposed to Hazards<br />
Population Category<br />
Number <strong>of</strong> Persons<br />
Exposed<br />
Percentage <strong>of</strong> Total<br />
Population<br />
Senior (Over 65 years <strong>of</strong> age) 3,178 17.5%<br />
Low Income (Persons with annual incomes less<br />
than $20,000)* 5,320 29.3%<br />
Total 8,498 46.8%<br />
* Low income population was calculated by <strong>multi</strong>plying 2000 U.S. Census Households with Incomes <strong>of</strong> Less than<br />
$20,000 (116) by 2000 U.S. Census Average Household Size (2.45). Source: 2000 U.S. Census.<br />
The entire built environment <strong>of</strong> Greenfield is vulnerable to a severe winter storm. Table 3-31<br />
identifies the assessed value <strong>of</strong> all residential, commercial, and industrial land uses in Town, and<br />
the losses that would result from 1%, 5%, and 10% damage to this inventory as a result <strong>of</strong> a<br />
severe winter storm.<br />
Table 3-31: Potential Estimated Loss by Land Use<br />
Land Use<br />
Total Assessed<br />
Value<br />
1% Damage Loss<br />
Estimate<br />
5% Damage Loss<br />
Estimate<br />
10% Damage Loss Estimate<br />
Residential $1,055,388,591 $10,553,886 $52,769,430 $105,538,859<br />
Commercial $243,076,431 $2,430,764 $12,153,822 $24,307,643<br />
Industrial $33,819,460 $338,195 $1,690,973 $3,381,946<br />
Total $1,332,284,482 $13,322,845 $66,614,224 $133,228,448<br />
Source: Massachusetts Department <strong>of</strong> Revenue - Division <strong>of</strong> Local Services, Municipal Databank/Local Aid Section 2010.<br />
Town <strong>of</strong> Greenfield Local Natural Hazard Mitigation Plan • January <strong>2011</strong>• Page 63
Overall Vulnerability Assessment<br />
Severe winter storms are common in New England, <strong>of</strong>ten causing significant impacts to the<br />
roads, structures, facilities, utilities, and population <strong>of</strong> Greenfield. Existing and future <strong>mitigation</strong><br />
efforts should continue to be developed and employed that will enable Greenfield to be prepared<br />
for these events when they occur. The cascade effects <strong>of</strong> severe winter storms include utility<br />
losses, transportation accidents, and flooding. Losses associated with flooding are discussed<br />
earlier in this section. Particular areas <strong>of</strong> vulnerability include low-income and elderly<br />
populations, trailer homes, and infrastructure such as roadways and utilities that can be damaged<br />
by such storms and the low-lying areas that can be impacted by flooding related to ice jams or<br />
rapid snow melt.<br />
Data Deficiencies<br />
In assessing the risks to Greenfield from severe snow and ice storms, the following data<br />
deficiencies were identified:<br />
The <strong>town</strong>s <strong>of</strong> Franklin County rely on farming for one <strong>of</strong> its income sources. Little data<br />
exists on <strong>local</strong>ized crop damage due to these <strong>hazard</strong>s.<br />
Hurricanes<br />
Hazard Summary<br />
Hurricanes and tropical storms are rare in Greenfield but could cause severe impacts such as<br />
flooding, power outages, flying debris, damage to property and injury and loss <strong>of</strong> life. Existing<br />
and future <strong>mitigation</strong> efforts should continue to be developed and employed that will enable the<br />
Town to be prepared for these events.<br />
Hurricanes or tropical cyclones, can spin <strong>of</strong>f tornadoes and bring thunderstorms, high winds and,<br />
in coastal areas, storm surges in the sea, possibly resulting in beach erosion and loss or damage<br />
to property. (See Tornados and Microbursts Section) Inland, hurricanes mainly bring heavy rains<br />
that can cause flooding.<br />
Data Collected and Used<br />
National weather databases and Town <strong>of</strong> Greenfield data were collected and analyzed.<br />
According to the committee, no hurricanes have been experienced in Greenfield. Data on historic<br />
property damage and loss, and injuries and deaths, was collected for Franklin County from the<br />
National Oceanic and Atmospheric Administration‘s (NOAA) National Climatic Data Center<br />
website, and the Spatial Hazard Events and Losses Database (SHELDUS). This data was used to<br />
support an evaluation <strong>of</strong> exposure and potential impacts associated with this <strong>hazard</strong>. The<br />
Commonwealth <strong>of</strong> Massachusetts State Hazard Mitigation Plan 2010 was also reviewed for<br />
information on thunderstorms, hurricanes and tornadoes <strong>hazard</strong> data and <strong>mitigation</strong> measures.<br />
Impact on the Community<br />
Exposure and Loss Estimation<br />
High winds and heavy rain associated with hurricanes and tropical storms can cause damage to<br />
utilities, structures, roads, trees (potentially causing vehicle accidents) and injuries and death.<br />
Town <strong>of</strong> Greenfield Local Natural Hazard Mitigation Plan • January <strong>2011</strong>• Page 64
Other issues associated with this type <strong>of</strong> <strong>hazard</strong> include debris management issues including<br />
debris removal and identification <strong>of</strong> disposal sites.<br />
Property Damage<br />
As presented in Table 3-32, historic data for hurricane and tropical storm events indicate one<br />
hurricane and 16 tropical storms have been recorded in Franklin County. Hurricane Bob in 1991<br />
caused over 5.5 million dollars in property damage in the county, and over $500,000 in crop<br />
damage. Overall, tropical storms and hurricanes have caused an average annual property<br />
damage <strong>of</strong> just over $300,000 over the last 20 years.<br />
Table 3-32: Hurricane and Tropical Storm Events in Franklin County<br />
# <strong>of</strong> Hurricane/Tropical<br />
Year<br />
Annual Property Damage Annual Crop Damage<br />
Storm Events<br />
2009 0 $0 $0<br />
2008 0 $0 $0<br />
2007 0 $0 $0<br />
2006 5 $277,861 $0<br />
2005 1 $33,889 $0<br />
2004 1 $37,778 $0<br />
2003 2 $127,381 $0<br />
2002 0 $0 $0<br />
2001 0 $0 $0<br />
2000 0 $0 $0<br />
1999 1 $7,692 $0<br />
1998 2 $63,269 $0<br />
1997 0 $0 $0<br />
1996 0 $0 $0<br />
1995 1 $0 $0<br />
1994 1 $35,714 $0<br />
1993 0 $0 $0<br />
1992 0 $0 $0<br />
1991 1 $5,555,556 $555,556<br />
1990 2 $7,142 $0<br />
# <strong>of</strong> Years Total # <strong>of</strong> Events<br />
Average Annual Property<br />
Damage<br />
Average Annual Crop<br />
Damage<br />
20 17 $307,314 $27,778<br />
Source: Spatial Hazard Events and Losses Database (SHELDUS), http://webra.cas.sc.edu/hvri/.<br />
Population Impacts<br />
As discussed above, some traffic accidents associated with storm events include injuries and<br />
deaths. However, the number <strong>of</strong> injuries and deaths reported for accidents is generally low.<br />
Populations considered most vulnerable to hurricane and tropical storm impacts in Greenfield are<br />
identified based on a number <strong>of</strong> factors including their physical and financial ability to react or<br />
Town <strong>of</strong> Greenfield Local Natural Hazard Mitigation Plan • January <strong>2011</strong>• Page 65
espond during a <strong>hazard</strong> and the location and construction quality <strong>of</strong> their housing. Table 3-33<br />
summarizes the population over the age <strong>of</strong> 65 or living in households with an annual income<br />
below $20,000. See also Environmental Justice section on pages 56-58.<br />
Table 3-33: Senior and Low Income Populations in Greenfield Exposed to Hazards<br />
Number <strong>of</strong> Persons Percentage <strong>of</strong><br />
Population Category<br />
Exposed Total Population<br />
Senior (Over 65 years <strong>of</strong> age) 3,178 17.5%<br />
Low Income (Persons with annual incomes less than $20,000)* 5,320 29.3%<br />
Total 8,498 46.8%<br />
* Low income population was calculated by <strong>multi</strong>plying 2000 U.S. Census Households with Incomes <strong>of</strong> Less than $20,000 (116)<br />
by 2000 U.S. Census Average Household Size (2.45). Source: 2000 U.S. Census.<br />
Overall Vulnerability Assessment<br />
Hurricanes and tropical storms are uncommon in Franklin County, but could cause significant<br />
damage if they do occur. Existing and future <strong>mitigation</strong> efforts should continue to be developed<br />
and employed that will enable Greenfield to be prepared for these events. The cascade effects <strong>of</strong><br />
severe storms include utility losses and transportation accidents and flooding. Losses associated<br />
with the flood <strong>hazard</strong> are discussed earlier in this section. Particular areas <strong>of</strong> vulnerability<br />
include low-income and elderly populations, trailer homes, and infrastructure such as roadways<br />
and utilities that can be damaged by such storms and the low-lying areas that can be impacted by<br />
flooding.<br />
Data Deficiencies<br />
In assessing the risks to Greenfield from hurricanes and tropical storms, no data deficiencies<br />
were identified.<br />
Tornados<br />
Hazard Summary<br />
While uncommon in Greenfield, tornados could potentially cause severe wind-related damage,<br />
including downed trees and power lines, power outages and damage to the built and natural<br />
environment.<br />
Data Collected and Used<br />
National weather databases and Town <strong>of</strong> Greenfield data were collected and analyzed. Data on<br />
historic property damage and loss, and injuries and deaths, was collected for Franklin County<br />
from the National Oceanic and Atmospheric Administration‘s (NOAA) National Climactic Data<br />
Center website, and the Spatial Hazard Events and Losses Database (SHELDUS). This data was<br />
used to support an evaluation <strong>of</strong> exposure and potential impacts associated with this <strong>hazard</strong>. The<br />
Commonwealth <strong>of</strong> Massachusetts State Hazard Mitigation Plan 2010 was also reviewed for<br />
information on tornado <strong>hazard</strong> data and <strong>mitigation</strong> measures.<br />
Town <strong>of</strong> Greenfield Local Natural Hazard Mitigation Plan • January <strong>2011</strong>• Page 66
Impact on the Community<br />
Exposure and Loss Estimation<br />
High winds and heavy rain and/or hail associated with tornados can cause damage to utilities,<br />
structures, roads, trees (potentially causing vehicle accidents) and injuries and death. Other<br />
issues associated with this type <strong>of</strong> <strong>hazard</strong> include debris management issues including debris<br />
removal and identification <strong>of</strong> disposal sites.<br />
Property Damage<br />
As presented in Table 3-34, historic data for tornado events indicate that between 1991 and 2010,<br />
4 tornados were recorded in Franklin County. Over 20 years, tornados have caused an average <strong>of</strong><br />
$16,000 in property damages yearly.<br />
Table 3-34: Tornado Events in Franklin County<br />
Year # <strong>of</strong> Tornado Events Annual Property Damage Annual Crop Damage<br />
2010 0 $0 $0<br />
2009 0 $0 $0<br />
2008 0 $0 $0<br />
2007 0 $0 $0<br />
2006 1 $200,000 $0<br />
2005 0 $0 $0<br />
2004 0 $0 $0<br />
2003 0 $0 $0<br />
2002 0 $0 $0<br />
2001 0 $0 $0<br />
2000 0 $0 $0<br />
1999 0 $0 $0<br />
1998 0 $0 $0<br />
1997 2 $100,000 $0<br />
1996 0 $0 $0<br />
1995 0 $0 $0<br />
1994 0 $0 $0<br />
1993 0 $0 $0<br />
1992 1 $25,000 $0<br />
1991 0 $0 $0<br />
# <strong>of</strong> Years Total # <strong>of</strong> Events<br />
Average Annual Property<br />
Damage<br />
Average Annual Crop<br />
Damage<br />
20 4 $16,250 $0<br />
Source: NOAA National Climactic Data Center. http://www4.ncdc.noaa.gov/cgi-win/wwcgi.dll?wwevent~storms.<br />
Population Impacts<br />
As discussed above, some traffic accidents associated with tornado events can include injuries<br />
and deaths. However, the number <strong>of</strong> injuries and deaths reported for accidents is generally low.<br />
Populations assessed as being most vulnerable to tornados impacts in Greenfield are identified<br />
based on a number <strong>of</strong> factors including their physical and financial ability to react or respond<br />
during a <strong>hazard</strong> and the location and construction quality <strong>of</strong> their housing. Table 3-35<br />
Town <strong>of</strong> Greenfield Local Natural Hazard Mitigation Plan • January <strong>2011</strong>• Page 67
summarizes the population over the age <strong>of</strong> 65 or living in households with an annual income<br />
below $20,000. See also Environmental Justice section on pages 56-58.<br />
Table 3-35: Senior and Low Income Populations in Greenfield Exposed to Hazards<br />
Population Category<br />
Number <strong>of</strong> Persons<br />
Exposed<br />
Percentage <strong>of</strong> Total<br />
Population<br />
Senior (Over 65 years <strong>of</strong> age) 3,178 17.5%<br />
Low Income (Persons with annual incomes less<br />
than $20,000)* 5,320 29.3%<br />
Total 8,498 46.8%<br />
* Low income population was calculated by <strong>multi</strong>plying 2000 U.S. Census Households with Incomes <strong>of</strong> Less than $20,000 (116)<br />
by 2000 U.S. Census Average Household Size (2.45). Source: 2000 U.S. Census.<br />
The entire built environment <strong>of</strong> Greenfield is vulnerable to the high winds and/or flooding from a<br />
tornado. Table 3-36 identifies the assessed value <strong>of</strong> all residential, commercial, and industrial<br />
land uses in Greenfield, and the losses that would result from 1%, 5%, and 10% damage to this<br />
inventory as a result <strong>of</strong> a tornado.<br />
Table 3-36: Potential Estimated Loss by Land Use<br />
Land Use<br />
Total Assessed<br />
Value<br />
1% Damage Loss<br />
Estimate<br />
5% Damage Loss<br />
Estimate<br />
10% Damage Loss Estimate<br />
Residential $1,055,388,591 $10,553,886 $52,769,430 $105,538,859<br />
Commercial $243,076,431 $2,430,764 $12,153,822 $24,307,643<br />
Industrial $33,819,460 $338,195 $1,690,973 $3,381,946<br />
Total $1,332,284,482 $13,322,845 $66,614,224 $133,228,448<br />
Source: Massachusetts Department <strong>of</strong> Revenue - Division <strong>of</strong> Local Services, Municipal Databank/Local Aid Section 2010.<br />
Overall Vulnerability Assessment<br />
Tornado are not at all common in Greenfield, however these and other wind-related storms such<br />
as hurricanes and microbursts could impact property, crops, utilities and the population <strong>of</strong><br />
Greenfield. Existing and future <strong>mitigation</strong> efforts should continue to be developed and employed<br />
that will enable Greenfield to be prepared for these events. The cascade effects <strong>of</strong> severe storms<br />
include utility losses and transportation accidents and flooding. Losses associated with the flood<br />
<strong>hazard</strong> are discussed earlier in this section. Particular areas <strong>of</strong> vulnerability include low-income<br />
and elderly populations, trailer homes, and infrastructure such as roadways and utilities that can<br />
be damaged by such storms and the low-lying areas that can be impacted by flooding.<br />
Data Deficiencies<br />
In assessing the risks to Greenfield from tornados, no data deficiencies were identified.<br />
Microbursts (Includes Thunderstorms and Wind Related Events)<br />
Hazard Summary<br />
Microbursts are frequent enough in Greenfield to cause the Committee to suggest they be<br />
categorized separately from hurricanes and tornados. Their severe impacts include flooding,<br />
Town <strong>of</strong> Greenfield Local Natural Hazard Mitigation Plan • January <strong>2011</strong>• Page 68
power outages, flying debris, damage to property, as Greenfield experienced in May <strong>of</strong> 2010.<br />
Existing and future <strong>mitigation</strong> efforts should continue to be developed and employed that will<br />
enable the Town to be prepared for these events. Thunderstorms, a sub-category <strong>of</strong> Microbursts,<br />
are common in western Massachusetts and can cause significant damage. Additional data were<br />
available for hail and lightning events, and are included in tables 3-29 and 3-30. Hail and<br />
lightning are events generally associated with thunderstorms.<br />
Data Collected and Used<br />
National weather databases and Town <strong>of</strong> Greenfield data were collected and analyzed. Data on<br />
historic property damage and loss, and injuries and deaths, was collected for Franklin County<br />
from the National Oceanic and Atmospheric Administration‘s (NOAA) National Climactic Data<br />
Center website, and the Spatial Hazard Events and Losses Database (SHELDUS). This data was<br />
used to support an evaluation <strong>of</strong> exposure and potential impacts associated with this <strong>hazard</strong>. The<br />
Commonwealth <strong>of</strong> Massachusetts State Hazard Mitigation Plan 2010 was also reviewed for<br />
information on thunderstorms, hurricanes and tornados <strong>hazard</strong> data and <strong>mitigation</strong> measures.<br />
Impact on the Community<br />
Exposure and Loss Estimation<br />
High winds and heavy rain and/or hail associated with microburst and wind-related storms can<br />
cause damage to utilities, structures, roads, trees (potentially causing vehicle accidents) and<br />
injuries and death. Other issues associated with this type <strong>of</strong> <strong>hazard</strong> include debris management<br />
issues including debris removal and identification <strong>of</strong> disposal sites. The Committee identified<br />
debris management and disposal as an ongoing concern.<br />
Property Damage<br />
Microbursts, severe thunderstorms, hail and lightning events brought about significant property<br />
wreckage in Franklin County in recent years. Thunderstorms, 115 <strong>of</strong> them in the last 19 years,<br />
caused an average annual property loss <strong>of</strong> more than $59,000 (Table 3-37). It is worth noting that<br />
the number <strong>of</strong> thunderstorms has increased in recent years; in the 1990s, there were an average<br />
<strong>of</strong> 3.8 storms per year, according to NOAA data. From 2000 to 2008, NOAA recorded an<br />
average <strong>of</strong> 9.6 storms per year, 2.5 times the previous decade. In 2007 and 2008, the most recent<br />
years with data available, 40 storms were recorded countywide for an average number <strong>of</strong> 20<br />
storms for those two years.<br />
Table 3-37: Thunderstorm Events in Franklin County<br />
Year<br />
# <strong>of</strong> Thunderstorm Annual Property<br />
Events<br />
Damage<br />
Annual Crop Damage<br />
2008 21 $602,000 $0<br />
2007 19 $0 $0<br />
2006 9 $338,000 $0<br />
2005 9 $85,000 $0<br />
2004 4 $30,000 $0<br />
2003 1 $10,000 $0<br />
2002 6 $25,000 $0<br />
2001 5 $0 $0<br />
2000 3 $20,000 $0<br />
1999 5 $0 $0<br />
Town <strong>of</strong> Greenfield Local Natural Hazard Mitigation Plan • January <strong>2011</strong>• Page 69
Year<br />
# <strong>of</strong> Thunderstorm<br />
Events<br />
Annual Property<br />
Damage<br />
Annual Crop Damage<br />
1998 8 $2,000 $0<br />
1997 7 $10,000 $0<br />
1996 5 $0 $0<br />
1995 3 $0 $0<br />
1994 4 $0 $0<br />
1993 0 $0 $0<br />
1992 2 $0 $0<br />
1991 3 $0 $0<br />
1990 1 $0 $0<br />
# <strong>of</strong> Years Total # <strong>of</strong> Events<br />
Average Annual<br />
Property Damage<br />
Average Annual Crop<br />
Damage<br />
19 115 $59,053 $0<br />
Source: NOAA National Climactic Data Center. http://www4.ncdc.noaa.gov/cgi-win/wwcgi.dll?wwevent~storms.<br />
As described in more detail in the Multi-Hazard Identification and Pr<strong>of</strong>ile section, a brief<br />
microburst in 1994 in Greenfield caused a state disaster declaration and in nearly $60 K <strong>of</strong> Public<br />
Assistance Project Grants to aid in storm recovery and a May 2010 microburst caused Greenfield<br />
to declare a state <strong>of</strong> emergency. Assessment by the Greenfield DPW <strong>of</strong> total costs <strong>of</strong> the storm to<br />
the Town <strong>of</strong> Greenfield is approximately $98,000 while costs to private home owners are<br />
estimated to be about $150,000 (Table 3-38).<br />
Table 3-38: Severe Microburst Events in Greenfield<br />
Date Event Location <strong>of</strong> Event Property Damage<br />
July 1994 Microburst Town-Wide $60,000<br />
May 2010 Microburst Town-Wide $248,000<br />
As Table 3-39 shows, 24 hail storms between 1993 and 2010 have caused an average <strong>of</strong> more<br />
than $560,000 in property damage per year. Ten lightning events (Table 3-40) have caused an<br />
average <strong>of</strong> more than $8,000 in property damage per year over the last 15 years in Franklin<br />
County.<br />
Table 3-39: Hail Events in Franklin County<br />
Year # <strong>of</strong> Hail Events Annual Property Damage Annual Crop Damage<br />
2009 0 $0 $0<br />
2008 0 $0 $0<br />
2007 0 $0 $0<br />
2006 5 $1,928,000 $0<br />
2005 1 $305,000 $0<br />
2004 1 $340,000 $0<br />
2003 2 $1,350,000 $0<br />
2002 0 $0 $0<br />
Town <strong>of</strong> Greenfield Local Natural Hazard Mitigation Plan • January <strong>2011</strong>• Page 70
Year # <strong>of</strong> Hail Events Annual Property Damage Annual Crop Damage<br />
2001 0 $0 $0<br />
2000 0 $0 $0<br />
1999 1 $0 $0<br />
1998 0 $0 $0<br />
1997 0 $0 $0<br />
1996 2 $0 $0<br />
1995 5 $0 $0<br />
1994 4 $5,050,000 $0<br />
1993 3 $550,000 $0<br />
# <strong>of</strong> Years Total # <strong>of</strong> Events<br />
Average Annual Property<br />
Damage<br />
Average Annual Crop<br />
Damage<br />
17 24 $560,176 $0<br />
Source: NOAA National Climactic Data Center. http://www4.ncdc.noaa.gov/cgi-win/wwcgi.dll?wwevent~storms.<br />
Table 3-40: Lightning Events in Franklin County<br />
Year # <strong>of</strong> Hail Events Annual Property Damage Annual Crop Damage<br />
2008 1 $10,000 $0<br />
2007 0 $0 $0<br />
2006 0 $0 $0<br />
2005 1 $50,000 $0<br />
2004 1 $35,000 $0<br />
2003 0 $0 $0<br />
2002 1 $15,000 $0<br />
2001 1 $20,000 $0<br />
2000 0 $0 $0<br />
1999 0 $0 $0<br />
1998 0 $0 $0<br />
1997 1 $3,000 $0<br />
1996 0 $0 $0<br />
1995 2 $0 $0<br />
1994 2 $0 $0<br />
# <strong>of</strong> Years Total # <strong>of</strong> Events<br />
Average Annual Property<br />
Damage<br />
Average Annual Crop<br />
Damage<br />
15 10 $8,867 $0<br />
Source: NOAA National Climactic Data Center. http://www4.ncdc.noaa.gov/cgi-win/wwcgi.dll?wwevent~storms.<br />
Population Impacts<br />
As discussed above, some traffic accidents associated with storm events include injuries and<br />
deaths. However, the number <strong>of</strong> injuries and deaths reported for accidents is generally low.<br />
Populations considered most vulnerable to microburst and wind-related storm impacts in<br />
Greenfield are identified based on a number <strong>of</strong> factors including their physical and financial<br />
Town <strong>of</strong> Greenfield Local Natural Hazard Mitigation Plan • January <strong>2011</strong>• Page 71
ability to react or respond during a <strong>hazard</strong> and the location and construction quality <strong>of</strong> their<br />
housing. Table 3-41 summarizes the population over the age <strong>of</strong> 65 or living in households with<br />
an annual income below $20,000. See also Environmental Justice section on pages 56-58.<br />
Table 3-41: Senior and Low Income Populations in Greenfield Exposed to Hazards<br />
Population Category<br />
Number <strong>of</strong> Persons<br />
Exposed<br />
Percentage <strong>of</strong> Total<br />
Population<br />
Senior (Over 65 years <strong>of</strong> age) 3,178 17.5%<br />
Low Income (Persons with annual incomes less<br />
than $20,000)* 5,320 29.3%<br />
Total 8,498 46.8%<br />
* Low income population was calculated by <strong>multi</strong>plying 2000 U.S. Census Households with Incomes <strong>of</strong> Less than $20,000 (116)<br />
by 2000 U.S. Census Average Household Size (2.45). Source: 2000 U.S. Census.<br />
The entire built environment <strong>of</strong> Greenfield is vulnerable to the high winds and/or flooding from a<br />
microburst and wind-related storm. Table 3-42 identifies the assessed value <strong>of</strong> all residential,<br />
commercial, and industrial land uses in Greenfield, and the losses that would result from 1%,<br />
5%, and 10% damage to this inventory as a result <strong>of</strong> a microburst or wind-related storm.<br />
Table 3-42: Potential Estimated Loss by Land Use<br />
Land Use<br />
Total Assessed<br />
Value<br />
1% Damage Loss<br />
Estimate<br />
5% Damage Loss<br />
Estimate<br />
10% Damage Loss Estimate<br />
Residential $1,055,388,591 $10,553,886 $52,769,430 $105,538,859<br />
Commercial $243,076,431 $2,430,764 $12,153,822 $24,307,643<br />
Industrial $33,819,460 $338,195 $1,690,973 $3,381,946<br />
Total $1,332,284,482 $13,322,845 $66,614,224 $133,228,448<br />
Source: Massachusetts Department <strong>of</strong> Revenue - Division <strong>of</strong> Local Services, Municipal Databank/Local Aid Section 2010.<br />
Overall Vulnerability Assessment<br />
Microbursts have occurred with some frequency in Greenfield. These and other wind-related<br />
storms such as thunderstorms can impact property, crops, utilities and the population <strong>of</strong><br />
Greenfield. Existing and future <strong>mitigation</strong> efforts should continue to be developed and employed<br />
that will enable Greenfield to be prepared for these events. The cascade effects <strong>of</strong> severe storms<br />
include utility losses and transportation accidents and flooding. Losses associated with the flood<br />
<strong>hazard</strong> are discussed earlier in this section. Particular areas <strong>of</strong> vulnerability include low-income<br />
and elderly populations, trailer homes, and infrastructure such as roadways and utilities that can<br />
be damaged by such storms and the low-lying areas that can be impacted by flooding.<br />
Data Deficiencies<br />
In assessing the risks to Greenfield from microbursts and other wind-related storms, the<br />
following data deficiencies were identified:<br />
The <strong>town</strong>s <strong>of</strong> Franklin County rely on farming for one <strong>of</strong> its income sources. Little data<br />
exists on <strong>local</strong>ized crop damage due to these <strong>hazard</strong>s.<br />
Town <strong>of</strong> Greenfield Local Natural Hazard Mitigation Plan • January <strong>2011</strong>• Page 72
Wildfires / Brush Fires<br />
Hazard Summary<br />
According to data from Massachusetts Fire Incident Reporting System <strong>of</strong> the Massachusetts<br />
Department <strong>of</strong> Fire Services, the Greenfield Fire Department responded to 35 brushfires between<br />
2004 and 2010. Wildfires can damage woodlands, homes, utilities and buildings, and could<br />
cause injuries or deaths. Existing and future <strong>mitigation</strong> efforts should continue to be developed<br />
and employed that will enable the Town to be prepared for these events. Burn piles that blaze out<br />
<strong>of</strong> control, lightning strikes in forested land, campfires improperly managed, and arson can cause<br />
wildfires. Greenfield is vulnerable to these conflagrations, especially in times <strong>of</strong> drought.<br />
Data Collected and Used<br />
Town <strong>of</strong> Greenfield data were collected and analyzed. Data on historic property damage and<br />
loss, and injuries and deaths, was collected for Franklin County from the NOAA website. Data<br />
from this website shows no wildfires have occurred in or impacted Franklin County in the last 20<br />
years. The Commonwealth <strong>of</strong> Massachusetts State Hazard Mitigation Plan 2010 was also<br />
reviewed for information on wildland fires and brushfires <strong>hazard</strong> data and <strong>mitigation</strong> measures.<br />
Impact to the Community<br />
Exposure and Loss Estimation<br />
A major out-<strong>of</strong>-control wildfire can damage property, utilities and forested land; create smoke<br />
that can cause breathing problems; and injure or kill people. Other issues associated with this<br />
type <strong>of</strong> <strong>hazard</strong> include debris management issues including debris removal and identification <strong>of</strong><br />
disposal sites.<br />
Property Damage<br />
According to Robert Strahan, no property damage, injuries or deaths were recorded for<br />
Greenfield‘s wildfires in 2010 and no fires <strong>of</strong> notable size or scope were reported.<br />
Population Impacts<br />
Populations considered most vulnerable to wildfire impacts are identified based on a number <strong>of</strong><br />
factors including their physical and financial ability to react or respond during a <strong>hazard</strong> and the<br />
location and construction quality <strong>of</strong> their housing. Table 3-43 summarizes the population over<br />
the age <strong>of</strong> 65 or living in households with an income below $20,000 per year. See also<br />
Environmental Justice section on pages 56-58.<br />
Table 3-43: Senior and Low Income Populations in Greenfield Exposed to Hazards<br />
Population Category<br />
Number <strong>of</strong> Persons<br />
Exposed<br />
Percentage <strong>of</strong> Total<br />
Population<br />
Senior (Over 65 years <strong>of</strong> age) 3,178 17.5%<br />
Low Income (Persons with annual incomes less<br />
than $20,000)* 5,320 29.3%<br />
Total 8,498 46.8%<br />
* Low income population was calculated by <strong>multi</strong>plying 2000 U.S. Census Households with Incomes <strong>of</strong> Less than $20,000 (116)<br />
by 2000 U.S. Census Average Household Size (2.45). Source: 2000 U.S. Census.<br />
Town <strong>of</strong> Greenfield Local Natural Hazard Mitigation Plan • January <strong>2011</strong>• Page 73
Because Greenfield has areas that are forested and because it has many historic wooden<br />
structures, the entire built environment <strong>of</strong> the Town could be vulnerable to a wildfire. Table 3-44<br />
identifies the building type and valuation <strong>of</strong> this inventory as well as the losses that would result<br />
from 1%, 5%, and 10% damage to this inventory as a result <strong>of</strong> a wildfire.<br />
Table 3-44: Potential Estimated Loss by Land Use<br />
Land Use<br />
Total Assessed<br />
Value<br />
1% Damage Loss<br />
Estimate<br />
5% Damage Loss<br />
Estimate<br />
10% Damage Loss Estimate<br />
Residential $1,055,388,591 $10,553,886 $52,769,430 $105,538,859<br />
Commercial $243,076,431 $2,430,764 $12,153,822 $24,307,643<br />
Industrial $33,819,460 $338,195 $1,690,973 $3,381,946<br />
Total $1,332,284,482 $13,322,845 $66,614,224 $133,228,448<br />
Source: Massachusetts Department <strong>of</strong> Revenue - Division <strong>of</strong> Local Services, Municipal Databank/Local Aid Section 2010.<br />
Overall Vulnerability Assessment<br />
While wildfires have caused minimal damage, injury and loss <strong>of</strong> life to date in Greenfield, their<br />
potential to destroy property and cause injury or death exists. Existing and future <strong>mitigation</strong><br />
efforts should continue to be developed and employed that will enable Greenfield to be prepared<br />
for these events when they occur. Wildfires can also cause utility disruption and air-quality<br />
problems. Particular areas <strong>of</strong> vulnerability include low-income and elderly populations.<br />
Data Deficiencies<br />
In assessing the risks to Greenfield from wildfire <strong>hazard</strong>s, the following data deficiencies were<br />
identified:<br />
The <strong>town</strong>s <strong>of</strong> Franklin County rely on farming for one <strong>of</strong> its income sources. Little data<br />
exists on <strong>local</strong>ized crop damage due to wildfires.<br />
The Greenfield CEM <strong>plan</strong> is not available for review by the FRCOG.<br />
Dam Failure<br />
Hazard Summary<br />
Dams hold back water, and when a dam fails, the potential energy <strong>of</strong> the stored water behind the<br />
dam is instantly released as water rushes in torrent downstream, flooding an area engineers refer<br />
to as an ―inundation area.‖ The number <strong>of</strong> casualties and the amount <strong>of</strong> property damage will<br />
depend upon the timing <strong>of</strong> the warning provided to downstream residents, the number <strong>of</strong> people<br />
living or working in the inundation area, and the number <strong>of</strong> structures in the inundation area.<br />
Existing and future <strong>mitigation</strong> efforts should continue to be developed and employed that will<br />
enable the Town to be prepared for these events.<br />
When a dam fails, huge quantities <strong>of</strong> water quickly flow downstream. Areas adjacent to a river<br />
or stream or on low ground are in danger <strong>of</strong> being inundated by a large volume <strong>of</strong> water that<br />
could destroy structures, utilities, roadways and bridges, and cause injuries or deaths. Many<br />
dams in Massachusetts were built in the 19 th century without the benefit <strong>of</strong> modern engineering<br />
design and construction oversight. Dams can fail because <strong>of</strong> structural problems due to age<br />
Town <strong>of</strong> Greenfield Local Natural Hazard Mitigation Plan • January <strong>2011</strong>• Page 74
and/or lack <strong>of</strong> proper maintenance. Dam failure can also be the result <strong>of</strong> structural damage<br />
caused by an earthquake or flooding brought on by severe storm events.<br />
Data Collected and Used<br />
Data from the National Oceanic and Atmospheric Administration‘s National Climactic Data<br />
Center website shows no dam failures have occurred in or impacted Franklin County in the last<br />
20 years. According to the members <strong>of</strong> the Local Multi-Hazard Mitigation Team, no dam<br />
failures have occurred in Greenfield in the last 20 years.<br />
Impact to the Community<br />
Exposure and Loss Estimation<br />
While dam failures are rare, their impacts can be devastating, including loss <strong>of</strong> property,<br />
disruption to infrastructure, and injury and death. Other issues associated with this type <strong>of</strong> <strong>hazard</strong><br />
include debris management issues including debris removal and identification <strong>of</strong> disposal sites.<br />
Property Damage<br />
Historic data for dam failure events indicate that between 1993 and 2010, no events were<br />
recorded in Franklin County, causing no property damage or population impacts.<br />
Population Impacts<br />
Populations considered most vulnerable to dam failure are identified based on a number <strong>of</strong><br />
factors including their physical and financial ability to react or respond during a <strong>hazard</strong> and the<br />
location and construction quality <strong>of</strong> their housing. Table 3-45 summarizes the population over<br />
the age <strong>of</strong> 65 or living in households with an income below $20,000 per year. See also<br />
Environmental Justice section on pages 56-58.<br />
Table 3-45: Senior and Low Income Populations in Greenfield Exposed to Hazards<br />
Population Category<br />
Number <strong>of</strong> Persons<br />
Exposed<br />
Percentage <strong>of</strong> Total<br />
Population<br />
Senior (Over 65 years <strong>of</strong> age) 3,178 17.5%<br />
Low Income (Persons with annual incomes less<br />
than $20,000)* 5,320 29.3%<br />
Total 8,498 46.8%<br />
* Low income population was calculated by <strong>multi</strong>plying 2000 U.S. Census Households with Incomes <strong>of</strong> Less than $20,000 (116)<br />
by 2000 U.S. Census Average Household Size (2.45). Source: 2000 U.S. Census.<br />
Structures that lie in the inundation area <strong>of</strong> each <strong>of</strong> the dams in Greenfield are vulnerable to a<br />
dam failure. Table 3-46 identifies the building type and valuation for all residential, commercial,<br />
and industrial uses in Town, as well as the losses that would result from 1%, 5%, and 10%<br />
damage to this inventory as a result <strong>of</strong> a dam failure.<br />
Table 3-46: Potential Estimated Loss by Land Use<br />
Land Use<br />
Total Assessed<br />
Value<br />
1% Damage Loss<br />
Estimate<br />
5% Damage Loss<br />
Estimate<br />
10% Damage Loss Estimate<br />
Residential $1,055,388,591 $10,553,886 $52,769,430 $105,538,859<br />
Commercial $243,076,431 $2,430,764 $12,153,822 $24,307,643<br />
Town <strong>of</strong> Greenfield Local Natural Hazard Mitigation Plan • January <strong>2011</strong>• Page 75
Land Use<br />
Total Assessed<br />
Value<br />
1% Damage Loss<br />
Estimate<br />
5% Damage Loss<br />
Estimate<br />
10% Damage Loss Estimate<br />
Industrial $33,819,460 $338,195 $1,690,973 $3,381,946<br />
Total $1,332,284,482 $13,322,845 $66,614,224 $133,228,448<br />
Source: Massachusetts Department <strong>of</strong> Revenue - Division <strong>of</strong> Local Services, Municipal Databank/Local Aid Section 2010.<br />
Overall Vulnerability Assessment<br />
Dam failures, while rare, can destroy roads, structures, facilities, utilities, and impact the<br />
population <strong>of</strong> Greenfield. Existing and future <strong>mitigation</strong> efforts should continue to be developed<br />
and employed that will enable Greenfield to be prepared for these events when they occur.<br />
Particular areas <strong>of</strong> vulnerability include low-income and elderly populations, buildings in the<br />
floodplain or inundation areas, and infrastructure such as roadways and utilities that can be<br />
damaged by such events. According to the members <strong>of</strong> the Local Multi-Hazard Mitigation Team,<br />
no dam failures have occurred in the last 20 years in Greenfield.<br />
As described in the Hazard Identification and Pr<strong>of</strong>ile section <strong>of</strong> this <strong>plan</strong>, there are two<br />
significant beavers in Greenfield. The one located on Allen Brook, <strong>of</strong>f Plain road has impacted<br />
the private land owner‘s fields and could potentially cause flooding downstream. The Town is<br />
currently working with the landowner to mitigate the issue. See pages 37-39 for more<br />
information on beaver dams.<br />
Data Deficiencies<br />
In assessing the risks to Greenfield from dam failure <strong>hazard</strong>s, the following data deficiencies<br />
were identified:<br />
The <strong>town</strong>s <strong>of</strong> Franklin County rely on farming for one <strong>of</strong> its income sources. Little data<br />
exists on <strong>local</strong>ized crop damage due to dam failure, if any.<br />
Data for the location and condition <strong>of</strong> dams within Greenfield resides with the DCR<br />
Office <strong>of</strong> Dam Safety and with FERC. New s<strong>of</strong>tware and reporting systems within the<br />
Office <strong>of</strong> Dam Safety has resulted in missing data and questions as to the status <strong>of</strong> some<br />
dams. Requests for additional information have been referred to the Office <strong>of</strong> Dam<br />
Safety‘s Legal Department, which charges for any requests for information.<br />
Earthquakes<br />
Hazard Summary<br />
Earthquakes are rare in Franklin County, however temblors are unpredictable and can cause<br />
significant damage to roads, structures, facilities, utilities, and population. Existing and future<br />
<strong>mitigation</strong> efforts should continue to be developed and employed that will enable the Town to be<br />
prepared for earthquakes.<br />
While rare in Franklin County, earthquakes have happened in New England. New England<br />
experiences an average <strong>of</strong> 30 to 40 earthquakes each year although most are not noticed by<br />
Town <strong>of</strong> Greenfield Local Natural Hazard Mitigation Plan • January <strong>2011</strong>• Page 76
people. 34 Ground shaking from earthquakes can rupture gas mains and disrupt other utility<br />
service, damage buildings, bridges and roads, and trigger other <strong>hazard</strong>ous events such as<br />
landslides, avalanches, flash floods (dam failure) and fires. Un-reinforced masonry buildings,<br />
buildings with foundations that rest on filled land or unconsolidated, unstable soil, and mobile<br />
homes not tied to their foundations are at risk during an earthquake. 35<br />
Data Collected and Used<br />
The National Oceanic and Atmospheric Administration recorded no earthquakes for Franklin<br />
County in the last 20 years. The Commonwealth <strong>of</strong> Massachusetts State Hazard Mitigation Plan<br />
2010 was also reviewed for information on earthquake <strong>hazard</strong> data and <strong>mitigation</strong> measures.<br />
Impact on the Community<br />
Exposure and Loss Estimation<br />
A major earthquake could cause severe damage to Greenfield buildings, including older<br />
structures that were built before a 1975 law requiring new buildings to withstand earthquakes.<br />
Other issues associated with this type <strong>of</strong> <strong>hazard</strong> include debris management issues including<br />
debris removal and identification <strong>of</strong> disposal sites.<br />
Property Damage<br />
Historic data for earthquake events indicate that between 1991 and 2010, no earthquakes were<br />
recorded in Franklin County during this period, causing no damage to property. 36<br />
Population Impacts<br />
Populations considered most vulnerable to earthquake impacts are identified based on a number<br />
<strong>of</strong> factors including their physical and financial ability to react or respond during a <strong>hazard</strong> and<br />
the location and construction quality <strong>of</strong> their housing. Table 3-47 summarizes the population<br />
over the age <strong>of</strong> 65 or living in households with an income below $20,000 per year. See also<br />
Environmental Justice section on pages 56-58.<br />
Table 3-47: Senior and Low Income Populations in Greenfield Exposed to Hazards<br />
Population Category<br />
Number <strong>of</strong> Persons<br />
Exposed<br />
Percentage <strong>of</strong> Total<br />
Population<br />
Senior (Over 65 years <strong>of</strong> age) 3,178 17.5%<br />
Low Income (Persons with annual incomes less<br />
than $20,000)* 5,320 29.3%<br />
Total 8,498 46.8%<br />
* Low income population was calculated by <strong>multi</strong>plying 2000 U.S. Census Households with Incomes <strong>of</strong> Less than $20,000 (116)<br />
by 2000 U.S. Census Average Household Size (2.45). Source: 2000 U.S. Census.<br />
The entire built environment <strong>of</strong> Greenfield is vulnerable to earthquakes. Table 3-48 identifies<br />
the assessed value <strong>of</strong> all residential, commercial, and industrial land uses in Greenfield, and the<br />
losses that would result from 1%, 5%, and 10% damage to this inventory as a result <strong>of</strong> an<br />
earthquake.<br />
34 Northeast States Emergency Consortium web site: www.nesec.org/<strong>hazard</strong>s/earthquakes.cfm<br />
35 Federal Emergency Management Agency web site: www.fema.gov/<strong>hazard</strong>s/earthquakes/quake.shtm.<br />
36 NOAA National Climactic Data Center. http://www4.ncdc.noaa.gov/cgi-win/wwcgi.dll?wwevent~storms<br />
Town <strong>of</strong> Greenfield Local Natural Hazard Mitigation Plan • January <strong>2011</strong>• Page 77
Table 3-48: Potential Estimated Loss by Land Use<br />
Land Use<br />
Total Assessed<br />
Value<br />
1% Damage Loss<br />
Estimate<br />
5% Damage Loss<br />
Estimate<br />
10% Damage Loss Estimate<br />
Residential $1,055,388,591 $10,553,886 $52,769,430 $105,538,859<br />
Commercial $243,076,431 $2,430,764 $12,153,822 $24,307,643<br />
Industrial $33,819,460 $338,195 $1,690,973 $3,381,946<br />
Total $1,332,284,482 $13,322,845 $66,614,224 $133,228,448<br />
Source: Massachusetts Department <strong>of</strong> Revenue - Division <strong>of</strong> Local Services, Municipal Databank/Local Aid Section 2010.<br />
Overall Vulnerability Assessment<br />
Earthquakes, while rare, could cause significant impacts and losses to the roads, structures,<br />
facilities, utilities, and population <strong>of</strong> Greenfield. Existing and future <strong>mitigation</strong> efforts should<br />
continue to be developed and employed that will enable Greenfield to be prepared for these<br />
events when they occur. Particular areas <strong>of</strong> vulnerability include low-income and elderly<br />
populations, trailer homes and buildings erected before 1975, and infrastructure such as<br />
roadways and utilities that could be damaged by earthquakes. According to the 2000 U.S.<br />
Census, nearly 78% <strong>of</strong> the housing in Greenfield was built prior to 1970. According to members<br />
<strong>of</strong> the Local Multi-Hazard Mitigation Team, no earthquakes have impacted Greenfield in the last<br />
20 years.<br />
Data Deficiencies<br />
In assessing the risks to Greenfield from earthquakes, no data deficiencies were identified.<br />
Landslides<br />
Hazard Summary<br />
Landslides rarely occur in Franklin County but Greenfield has experienced several in recent<br />
years. Details can be found on pages 43-46. Landslides can impact the built and natural<br />
environments and can displace residents.<br />
Data Collected and Used<br />
National Oceanic and Atmospheric Administration‘s National Climactic Data Center website<br />
shows no landslide events in Franklin County for the last 20 years. The Commonwealth <strong>of</strong><br />
Massachusetts State Hazard Mitigation Plan 2010 was also reviewed for information on landslide<br />
<strong>hazard</strong> data and <strong>mitigation</strong> measures.<br />
Impact to the Community<br />
Exposure and Loss Estimation<br />
While landslides are rare, their impacts can be devastating, including loss <strong>of</strong> property, disruption<br />
to infrastructure, and injury and death. Continued development, particularly on steep slopes or<br />
unstable soils, increases the chances that landslides will be a danger. Other issues associated with<br />
this type <strong>of</strong> <strong>hazard</strong> include debris management issues including debris removal and identification<br />
<strong>of</strong> disposal sites. The Committee identified debris management and disposal as an ongoing<br />
concern.<br />
Town <strong>of</strong> Greenfield Local Natural Hazard Mitigation Plan • January <strong>2011</strong>• Page 78
As noted in the Risk Assessment Section, relatively small landslides have been reported on<br />
Factory Hollow Road along the Fall River, on Mead Street and Wisdom Way, Brook Road and<br />
Shelburne Road, as well as at the 90-acre Green River Cemetery (Table 3-49). A much more<br />
significant mudslide impacted some residents in early <strong>2011</strong>. See pages 41-43 for details.<br />
Table 3-49: Landslide Events in Greenfield<br />
Date Event Description Location <strong>of</strong> Event Property Damage<br />
Ongoing<br />
Ongoing<br />
Ongoing<br />
Small landslide<br />
Small landslide<br />
Small landslide<br />
Factory Hollow Road on<br />
Fall River<br />
Mead Street and Wisdom<br />
Way<br />
Brook Road and Shelburne<br />
Road<br />
Not available<br />
Not available<br />
Not available<br />
Ongoing Small landslide Green River Cemetery Not available<br />
March 7, <strong>2011</strong><br />
Significant landslide<br />
Green River Cemetery and<br />
Meridian Street<br />
Not available<br />
Property Damage and Population Impacts<br />
Historic data for landslide events indicate that between 1993 and 2010, no significant landslide<br />
events were recorded in Franklin County. Populations considered most vulnerable to landslide<br />
impacts are identified based on a number <strong>of</strong> factors including their physical and financial ability<br />
to react or respond during a <strong>hazard</strong> and the location and construction quality <strong>of</strong> their housing.<br />
Table 3-50 summarizes the population over the age <strong>of</strong> 65 or living in households with an income<br />
below $20,000 per year. See also Environmental Justice section on pages 56-58.<br />
Table 3-50: Senior and Low Income Populations in Greenfield Exposed to Hazards<br />
Population Category<br />
Number <strong>of</strong> Persons<br />
Exposed<br />
Percentage <strong>of</strong> Total<br />
Population<br />
Senior (Over 65 years <strong>of</strong> age) 3,178 17.5%<br />
Low Income (Persons with annual incomes less<br />
than $20,000)* 5,320 29.3%<br />
Total 8,498 46.8%<br />
* Low income population was calculated by <strong>multi</strong>plying 2000 U.S. Census Households with Incomes <strong>of</strong> Less than $20,000 (116)<br />
by 2000 U.S. Census Average Household Size (2.45).<br />
Source: 2000 U.S. Census.<br />
Table 3-51 identifies the assessed value <strong>of</strong> all residential, commercial, and industrial uses in<br />
Town, as well as the losses that would result from 1%, 5%, and 10% damage to this inventory as<br />
a result <strong>of</strong> a massive landslide.<br />
Table 3-51: Potential Estimated Loss by Land Use<br />
Land Use<br />
Total Assessed<br />
Value<br />
1% Damage Loss<br />
Estimate<br />
5% Damage Loss<br />
Estimate<br />
10% Damage Loss Estimate<br />
Residential $1,055,388,591 $10,553,886 $52,769,430 $105,538,859<br />
Commercial $243,076,431 $2,430,764 $12,153,822 $24,307,643<br />
Town <strong>of</strong> Greenfield Local Natural Hazard Mitigation Plan • January <strong>2011</strong>• Page 79
Land Use<br />
Total Assessed<br />
Value<br />
1% Damage Loss<br />
Estimate<br />
5% Damage Loss<br />
Estimate<br />
10% Damage Loss Estimate<br />
Industrial $33,819,460 $338,195 $1,690,973 $3,381,946<br />
Total $1,332,284,482 $13,322,845 $66,614,224 $133,228,448<br />
Source: Massachusetts Department <strong>of</strong> Revenue - Division <strong>of</strong> Local Services, Municipal Databank/Local Aid Section 2010.<br />
Overall Vulnerability Assessment<br />
Landslides, while rare in Franklin County, can destroy roads, structures, facilities, utilities, and<br />
impact the population <strong>of</strong> Greenfield. Existing and future <strong>mitigation</strong> efforts should continue to be<br />
developed and employed that will enable Greenfield to be prepared for these events when they<br />
occur. Particular areas <strong>of</strong> vulnerability include low-income and elderly populations, and<br />
buildings, roadways, and utilities near the foot <strong>of</strong> slopes, especially when slopes are destabilized.<br />
According to the members <strong>of</strong> the Local Multi-Hazard Mitigation Team, no landslides have<br />
occurred in the last 20 years in Greenfield.<br />
Data Deficiencies<br />
In assessing the risks to Greenfield from landslides, no data deficiencies were identified.<br />
Ice Jams<br />
Hazard Summary<br />
Ice jams (or ice dams) occur when water builds up behind a blockage <strong>of</strong> ice. Ice jams can occur<br />
in various ways, but in New England they predominantly form on rivers and streams and mainly<br />
threaten infrastructure.<br />
When the upstream part <strong>of</strong> a river thaws first and the ice is carried downstream into the stillfrozen<br />
part <strong>of</strong> the watercourse, ice can form an ice dam and flood low lying areas upstream <strong>of</strong> the<br />
jam. Also, once an ice dam breaks apart, the sudden surge <strong>of</strong> water that breaks through the dam<br />
can flood areas downstream <strong>of</strong> the jam. The resulting flow <strong>of</strong> water when an ice jam is broken<br />
can cause flooding downstream, threatening infrastructure, structures, and roadways.<br />
Data Collected and Used<br />
The National Oceanic and Atmospheric Administration‘s National Climactic Data Center<br />
website shows no ice jam events or damage in Greenfield over the last 20 years and the<br />
Committee reports none <strong>of</strong> significance. The Commonwealth <strong>of</strong> Massachusetts State Hazard<br />
Mitigation Plan 2010 was also reviewed for information on ice jam <strong>hazard</strong> data and <strong>mitigation</strong><br />
measures.<br />
Impact to the Community<br />
Exposure and Loss Estimation<br />
Losses to ice jams include the rising waters along the river or stream that is being dammed, and<br />
the rush <strong>of</strong> water downstream when the dam either melts or is broken up by human intervention.<br />
Buildings, roadways and utilities are threatened by ice blockages. Other issues associated with<br />
this type <strong>of</strong> <strong>hazard</strong> include debris management issues including debris removal and identification<br />
<strong>of</strong> disposal sites.<br />
Town <strong>of</strong> Greenfield Local Natural Hazard Mitigation Plan • January <strong>2011</strong>• Page 80
Property Damage<br />
Data on ice jams in Franklin County indicate that no property damage or injuries or deaths<br />
occurred as the result <strong>of</strong> ice jams in the last 20 years. However, the structures and people most at<br />
risk from an ice jam are those within the floodplain. The average assessed values <strong>of</strong> the<br />
residential, commercial, and industrial land uses located within the floodplain are displayed in<br />
Table 3-52. The total average assessed value for these three land uses within the floodplain is<br />
$4,424,398, with the largest assessed value falling within the residential land use category at<br />
$4,196,873. This is <strong>of</strong> concern because should a catastrophic flooding event befall Greenfield,<br />
the assessed values <strong>of</strong> these structures would likely be significantly reduced, which in turn would<br />
impact the <strong>town</strong>‘s tax revenues.<br />
Table 3-52: Average Assessed Value <strong>of</strong> Land Use in Flood Hazard Area<br />
Total Acres Total Assessed<br />
Average<br />
Assessed Value Acres in<br />
Average<br />
Assessed Value<br />
in Town Value<br />
Per Acre Floodplain in Floodplain<br />
Residential 2,598.51 $253,678,000 $97,624 42.99 $4,196,873<br />
Commercial 11.3 $1,992,179 $176,299 0.49 $86,387<br />
Industrial 2.7 $793,900 $294,037 0.48 $141,138<br />
Source: Massachusetts Department <strong>of</strong> Revenue - Division <strong>of</strong> Local Services, Municipal Databank/Local Aid Section 2010; 2005<br />
MassGIS Land Use data.<br />
Population Impact<br />
Populations considered most vulnerable to ice jam impacts are identified based on a number <strong>of</strong><br />
factors including their physical and financial ability to react or respond during a <strong>hazard</strong> and the<br />
location and construction quality <strong>of</strong> their housing. Table 3-53 summarizes the population over<br />
the age <strong>of</strong> 65 or living in households with an income below $20,000 per year. See also<br />
Environmental Justice section on pages 56-58.<br />
Table 3-53: Senior and Low Income Populations in Greenfield Exposed to Hazards<br />
Population Category<br />
Number <strong>of</strong> Persons<br />
Exposed<br />
Percentage <strong>of</strong> Total<br />
Population<br />
Senior (Over 65 years <strong>of</strong> age) 3,178 17.5%<br />
Low Income (Persons with annual incomes less<br />
than $20,000)* 5,320 29.3%<br />
Total 8,498 46.8%<br />
* Low income population was calculated by <strong>multi</strong>plying 2000 U.S. Census Households with Incomes <strong>of</strong> Less than $20,000 (116)<br />
by 2000 U.S. Census Average Household Size (2.45). Source: 2000 U.S. Census.<br />
The built environment in the floodplain <strong>of</strong> Greenfield is vulnerable to ice jam events. Land uses<br />
located in the floodplain are discussed in the flooding section above. Table 3-54 identifies the<br />
average assessed value for all residential, commercial, and industrial uses in Town, as well as the<br />
losses that would result from 1%, 5%, and 10% damage to this inventory as a result <strong>of</strong> an ice<br />
jam.<br />
Town <strong>of</strong> Greenfield Local Natural Hazard Mitigation Plan • January <strong>2011</strong>• Page 81
Table 3-54: Potential Estimated Loss by Land Use Category<br />
Land Use<br />
Total Acres<br />
in Town<br />
Total Assessed<br />
Value<br />
Average Assessed<br />
Value Per Acre<br />
Acres in Flood<br />
Hazard Area<br />
Average<br />
Assessed Value<br />
in Flood Hazard<br />
Area<br />
Residential 386.05 $121,791,060 $315,480 0.98 $309,170<br />
Commercial 29.44 $7,227,231 $245,490 0.12 $29,459<br />
Industrial 49.29 $295,631,498 $5,997,799 5.45 $32,688,003<br />
Source: Massachusetts Department <strong>of</strong> Revenue - Division <strong>of</strong> Local Services, Municipal Databank/Local Aid Section 2010; 2005<br />
MassGIS Land Use data.<br />
Overall Vulnerability Assessment<br />
Ice jams occur throughout New England, <strong>of</strong>ten causing significant impacts and losses to roads,<br />
structures, facilities, utilities, and the population. Existing and future <strong>mitigation</strong> efforts should<br />
continue to be developed and employed that will enable Greenfield to be prepared for these<br />
events when they occur. Particular areas <strong>of</strong> vulnerability include low-income and elderly<br />
populations, trailer homes, and infrastructure such as roadways near rivers and streams and<br />
utilities and low-lying areas. According to the members <strong>of</strong> the Local Multi-Hazard Mitigation<br />
Team, no ice jams have occurred in the last 20 years in Greenfield.<br />
Data Deficiencies<br />
In assessing the risks to Greenfield from ice jams, no data deficiencies were identified.<br />
Manmade Hazards<br />
Hazard Summary<br />
Manmade <strong>hazard</strong>s are being assessed at the <strong>local</strong> level for the first time in this <strong>plan</strong> update. A<br />
preliminary assessment was made only <strong>of</strong> those manmade <strong>hazard</strong>s <strong>of</strong> an accidental natural, such<br />
as transportation accidents or fixed facility accidents involving <strong>hazard</strong>ous materials. The<br />
potential for these types <strong>of</strong> <strong>hazard</strong>ous materials accidents could be quite high – particularly<br />
transportation related, given the proximity <strong>of</strong> Route 2 and the railroad tracks to the rivers and to<br />
more densely populated areas <strong>of</strong> Town. No formal vulnerability assessment was done on<br />
manmade <strong>hazard</strong>s, however the potential for accidents, the unknown impact <strong>of</strong> such accidents<br />
and the lack <strong>of</strong> well-analyzed data make this <strong>hazard</strong> a high priority on the Action Plan.<br />
Data Deficiencies<br />
Need to research available models and data requirements to adequately evaluate the<br />
potential impact <strong>of</strong> <strong>hazard</strong>ous accidents on the rivers, on drinking water supply, and on<br />
public health.<br />
Town <strong>of</strong> Greenfield Local Natural Hazard Mitigation Plan • January <strong>2011</strong>• Page 82
Development Trends Analysis<br />
In assessing development trends for the Town <strong>of</strong> Greenfield - and the impact those trends might<br />
have on <strong>hazard</strong> <strong>mitigation</strong> - the Committee was asked to evaluate the probability <strong>of</strong> development<br />
in <strong>town</strong> and areas most likely to be targeted for development. The Committee was also asked<br />
about changes in industry, proposed housing and retail development, and any major highway or<br />
public transit improvements that might change accessibility to parts <strong>of</strong> <strong>town</strong>. Additionally, data<br />
such as number <strong>of</strong> construction permits issued, change in population, current zoning bylaws and<br />
the acres <strong>of</strong> developable land was considered.<br />
Pending Development<br />
The Committee forecasted that some development is likely over the next ten years, much <strong>of</strong> it<br />
infill in existing developed areas, including in the down<strong>town</strong>. No subdivisions are being<br />
proposed at this time. In terms <strong>of</strong> commercial development, <strong>plan</strong>s have been submitted to the<br />
Greenfield Planning Board to build a 135,000-square-foot retail store on a 29.5-acre site<br />
northeast <strong>of</strong> the city‘s commercial core. There is also the possibility <strong>of</strong> some development<br />
and/or reuse <strong>of</strong> commercial properties near the rotary. The Bendix site and the Lunt property on<br />
Federal Street are also currently under consideration for clean up and redevelopment. None <strong>of</strong><br />
these properties lie within the floodplain.<br />
Changes in transit include $12.8 million innovative Franklin Regional Transit Center project,<br />
anticipated to be completed in late <strong>2011</strong> and serving as a transportation hub for Franklin County,<br />
supporting public and private transit services. The transit center is designed to encourage future<br />
passenger rail services along the Connecticut River corridor. The 24,000-square-foot ―net zero‖<br />
building is being designed to drastically minimize energy use through energy efficiency<br />
measures and other design features, including the potential for on-site renewable energy<br />
generation. The transit center will be located within the Greenfield Bank Row Urban Renewal<br />
Zone and is part <strong>of</strong> the Greenfield Bank Row Private Development Site. Construction <strong>of</strong> the<br />
transit center will be the first project within the Urban Renewal Zone. It is expected to be a<br />
catalyst for additional investment and redevelopment in down<strong>town</strong> Greenfield, housing <strong>of</strong>fices <strong>of</strong><br />
the Franklin Regional Transit Authority and the FRCOG. 37<br />
Other Development Trends<br />
In addition to the Committee‘s assessment <strong>of</strong> development trends, Census data for building<br />
permits issued was consulted (Table 3-55). For new privately-owned residential building permits<br />
issued in Greenfield, a total <strong>of</strong> 116 permits were issued between the years 2000 and 2009. The<br />
number <strong>of</strong> annual permits issued has remained relatively stable, except for in 2002, when there<br />
number issued was approximately double the number issued in the other years examined.<br />
Although building permits have held fairly steady over the past 10 years, Greenfield‘s population<br />
has actually declined, according to new census information. Total population in 2010 was<br />
17,456, down from 18,168 in 2000 and from 18,866 in 1990. The total 20 year decrease is 1,210,<br />
or 6.5%. This is compared to Franklin County overall which saw an increase <strong>of</strong> 1,280 or 1.8%.<br />
37 http://www.youmovemassachusetts.org/stimulus_13_GreenfieldTransitCenter_041709.pdf<br />
Town <strong>of</strong> Greenfield Local Natural Hazard Mitigation Plan • January <strong>2011</strong>• Page 83
Table 3-55: Decennial Census Total Population Trends - Franklin County Towns<br />
Census Data 10 Year Trend 20 Year Trend<br />
1990-<br />
2010 Census 2000-2010 2000-2010 1990-2010<br />
Area Name 1990 Census 2000 Census<br />
2010<br />
Redistricting Difference Change Difference<br />
Change<br />
Ashfield 1,715 1,800 1,737 -63 -3.5% 22 1.3%<br />
Bernardston 2,048 2,155 2,129 -26 -1.2% 81 4.0%<br />
Buckland 1,928 1,991 1,902 -89 -4.5% -26 -1.3%<br />
Charlemont 1,249 1,358 1,266 -92 -6.8% 17 1.4%<br />
Colrain 1,757 1,813 1,671 -142 -7.8% -86 -4.9%<br />
Conway 1,529 1,809 1,897 88 4.9% 368 24.1%<br />
Deerfield 5,018 4,750 5,125 375 7.9% 107 2.1%<br />
Erving 1,372 1,467 1,800 333 22.7% 428 31.2%<br />
Gill 1,583 1,363 1,500 137 10.1% -83 -5.2%<br />
Greenfield 18,666 18,168 17,456 -712 -3.9% -1,210 -6.5%<br />
Hawley 317 336 337 1 0.3% 20 6.3%<br />
Heath 716 805 706 -99 -12.3% -10 -1.4%<br />
Leverett 1,785 1,663 1,851 188 11.3% 66 3.7%<br />
Leyden 662 772 711 -61 -7.9% 49 7.4%<br />
Monroe 115 93 121 28 30.1% 6 5.2%<br />
Montague 8,316 8,489 8,437 -52 -0.6% 121 1.5%<br />
New Salem 802 929 990 61 6.6% 188 23.4%<br />
Northfield 2,838 2,951 3,032 81 2.7% 194 6.8%<br />
Orange 7,312 7,518 7,839 321 4.3% 527 7.2%<br />
Rowe 378 351 393 42 12.0% 15 4.0%<br />
Shelburne 2,012 2,058 1,893 -165 -8.0% -119 -5.9%<br />
Shutesbury 1,561 1,810 1,771 -39 -2.2% 210 13.5%<br />
Sunderland 3,399 3,777 3,684 -93 -2.5% 285 8.4%<br />
Warwick 740 750 780 30 4.0% 40 5.4%<br />
Wendell 899 986 848 -138 -14.0% -51 -5.7%<br />
Whately 1,375 1,573 1,496 -77 -4.9% 121 8.8%<br />
Franklin County 70,092 71,535 71,372 -163 -0.2% 1,280 1.8%<br />
Massachusetts 6,016,425 6,349,097 6,547,629 198,532 3.1% 531,204 8.8%<br />
Source: U.S. Department <strong>of</strong> Commerce - Census Bureau; Decennial Census Program<br />
As discussed in the Vulnerability Assessment Section <strong>of</strong> this <strong>plan</strong>, current development in the<br />
flood plain includes 825 acres <strong>of</strong> commercial, public/institutional and industrial uses and 43<br />
acres <strong>of</strong> residential use. Given current data available, it is unknown exactly how much <strong>of</strong> the<br />
land in and along the floodplain is undeveloped. Further GIS analysis beyond the scope <strong>of</strong> the<br />
current project would be necessary to determine the exact number <strong>of</strong> developable acres in and<br />
along the floodplain. Further assessment <strong>of</strong> the possible developable lots should take into<br />
consideration constraints such as river buffers, highway setbacks, slopes and other constraining<br />
factors. The fact remains there is a potential for more development in floodplains in Greenfield<br />
and, with that development, the potential flooding impacts on structures and occupants.<br />
Town <strong>of</strong> Greenfield Local Natural Hazard Mitigation Plan • January <strong>2011</strong>• Page 84
Town <strong>of</strong> Greenfield Local Natural Hazard Mitigation Plan • January <strong>2011</strong>• Page 85
Town <strong>of</strong> Greenfield Local Natural Hazard Mitigation Plan • January <strong>2011</strong>• Page 86
4 – MITIGATION STRATEGIES<br />
This section <strong>of</strong> the Hazard Mitigation Plan is the long-term blueprint for reducing the losses<br />
identified in the risk assessment. Each <strong>hazard</strong> includes a detailed <strong>of</strong> current <strong>mitigation</strong> strategies,<br />
a summary table <strong>of</strong> same <strong>mitigation</strong> strategies with suggested additions and changes and, in the<br />
Appendix, any detailed language from Zoning Bylaws and/or Subdivision Rules and<br />
Regulations.<br />
Current Mitigation Strategies<br />
Floods<br />
The Critical Facilities, Infrastructure, 2010 Land Use & Natural Hazards Map for the Town <strong>of</strong><br />
Greenfield shows the 100-year flood zone identified by FEMA flood maps. The 100-year flood<br />
zone is the area that will be covered by water by a flood that has a 1% chance <strong>of</strong> occurring in any<br />
given year. The Map also shows the areas in <strong>town</strong> that are subject to <strong>local</strong>ized flooding<br />
problems, such as the Maple Brook culvert in North and Maple Streets. According to the<br />
Greenfield Town Engineer, the Maple Brook culvert is the primary drainage system for 1,000<br />
acres <strong>of</strong> the <strong>town</strong>‘s most urbanized area. The culvert was built in the 1930‘s. The culvert is in<br />
poor condition and studies have shown that it is significantly undersized for the current flows.<br />
The Town <strong>of</strong> Greenfield has a Capital Project on the books to replace or rehabilitate the culvert.<br />
Estimated project cost as <strong>of</strong> the 2005 Plan was $1,750,000. Town Planner Eric Twarog indicated<br />
the cost <strong>of</strong> the project would need to be re-estimated given how long it has been since it was<br />
initially estimated.<br />
Residential and commercial development has occurred within the 100-year floodplain along the<br />
Deerfield and Connecticut Rivers, especially in the area <strong>of</strong> <strong>town</strong> known as Cheapside. Along the<br />
downstream section <strong>of</strong> the Green River, there is residential and commercial development within<br />
or adjacent to the floodplain. Upstream, the land use within the floodplain <strong>of</strong> the Green River is<br />
predominantly forest and crop or pasture land. Land use within the floodplain <strong>of</strong> the Fall River<br />
is predominantly forest and crop or pasture land with sparse residential development adjacent to<br />
the floodplain.<br />
The major floods recorded in Greenfield during the 20 th Century have been the result <strong>of</strong> rainfall<br />
alone or rainfall combined with snowmelt. Historic records on the Connecticut and Deerfield<br />
Rivers have also cited backwater flooding from ice jams as a significant problem in the past.<br />
One <strong>of</strong> the goals <strong>of</strong> this Multi-Hazard Mitigation Plan is to evaluate all <strong>of</strong> the <strong>town</strong>‘s existing<br />
policies, practices, and <strong>plan</strong>s related to <strong>hazard</strong>s and identify potential gaps in protection.<br />
Existing Policies, Practices, and Plans<br />
Comprehensive Emergency Management (CEM) Plan<br />
The Comprehensive Emergency Management (CEM) Plan for Greenfield lists the following<br />
generic <strong>mitigation</strong> measures for flood <strong>plan</strong>ning and response:<br />
Town <strong>of</strong> Greenfield Local Natural Hazard Mitigation Plan • 87
‣ Identify areas in the community that are flood prone and define methods to minimize the<br />
risk. Review National Flood Insurance Maps.<br />
‣ Disseminate emergency public information and instructions concerning flood<br />
preparedness and safety.<br />
‣ Ensure that Whately is enrolled in the National Flood Insurance Program. See pages 131-<br />
133 for more information <strong>of</strong> NFIP.<br />
‣ Strictly adhere to land use and building codes, (e.g. Wetlands Protection Act), and new<br />
construction should not be built in flood prone areas.<br />
‣ Ensure that flood control works are in good operating condition at all times.<br />
‣ Preserve natural water storage areas.<br />
‣ Maintain <strong>plan</strong>s for managing all flood emergency response activities including addressing<br />
potentially <strong>hazard</strong>ous dams.<br />
The Comprehensive Emergency Management (CEM) Plan for Greenfield lists the following<br />
generic preparedness and response measures for floods:<br />
‣ Place EOC personnel on standby during stage <strong>of</strong> flood ‗watch‘ and monitor NWS/New<br />
England River Forecast Center reports.<br />
‣ Ensure that public warning systems are working properly and broadcast any information<br />
that is needed at this time.<br />
‣ Review mutual aid agreements.<br />
‣ Monitor levels <strong>of</strong> <strong>local</strong> bodies <strong>of</strong> water.<br />
‣ Arrange for all evacuation and sheltering procedures to be ready for activation when<br />
needed.<br />
‣ Carry out, or assist in carrying out needed flood-pro<strong>of</strong>ing measures such as sand bag<br />
placement, etc.<br />
‣ Regulate operation <strong>of</strong> flood control works such as flood gates.<br />
‣ Notify all Emergency Management related groups that will assist with flood response<br />
activities to be ready in case flood ‗warning‘.<br />
‣ Broadcast warning/notification <strong>of</strong> flood emergency.<br />
‣ Coordinate traffic control and proceed with evacuation <strong>of</strong> affected populations as<br />
appropriate.<br />
‣ Open and staff shelters and reception centers.<br />
‣ Undertake, or continue to carry out, flood pro<strong>of</strong>ing measures.<br />
‣ Dispatch search and rescue teams.<br />
‣ Dispatch emergency medical teams<br />
Flood Control Structures<br />
The Town <strong>of</strong> Greenfield has no flood control structures within its corporate boundaries. Floods<br />
on the Connecticut River and portions <strong>of</strong> its major tributaries that are prone to backwater effects<br />
are controlled by nine flood control reservoirs located upstream in Massachusetts, New<br />
Hampshire, and Vermont. The hydro-power facilities in the upstream reaches <strong>of</strong> the Deerfield<br />
River in Vermont (Harriman and Somerset Reservoirs) provide some flood attenuation capacity.<br />
In addition, there are several dams on the Deerfield in Massachusetts controlled by the<br />
TransCanada Corporation and Brookfield Renewable Power that <strong>of</strong>fer minimal flood protection.<br />
Flashboards at the Shelburne Falls Dam and TransCanada Dam No. 4 are designed to fail when<br />
the river reaches flood stage.<br />
Town <strong>of</strong> Greenfield Local Natural Hazard Mitigation Plan • 88
In 2009, the University <strong>of</strong> Massachusetts Transportation Engineering Department developed an<br />
evacuation scenario for Franklin County in the event <strong>of</strong> the failure <strong>of</strong> Harriman Dam. In 2010,<br />
the Franklin Regional Council <strong>of</strong> Governments prepared a supplement to the Franklin County:<br />
Harriman Dam Failure Case Study II done by UMASS. It makes recommendations for<br />
evacuating Greenfield and the other <strong>town</strong>s in the County should the dam fail. 38<br />
Land Use Regulations that Mitigate Impacts from Flooding<br />
The Town <strong>of</strong> Greenfield has adopted several land use regulations that serve to limit or regulate<br />
development in floodplains, to manage stormwater run<strong>of</strong>f, and to protect groundwater and<br />
wetland resources, the latter <strong>of</strong> which <strong>of</strong>ten provide important flood storage capacity. These<br />
regulations are summarized below and their effectiveness evaluated in Table 4-1.<br />
Zoning Bylaws - See Appendix A for details<br />
Floodplain Zoning Ordinance: Section 200-4.13 Floodplain Overlay district<br />
Permitted Uses (Section 200-4.13.E)<br />
Special Permits (Section 200-4.13.F)<br />
Prohibited (Section 200-4.13.I)<br />
Performance Standards Section 200-6.8<br />
Open Space/Cluster Developments Section 200-7.1<br />
Common Open Space Requirements (Section 200-7.1 H)<br />
Earth Removal, Section 200-7.4<br />
Major Development Review, Section 200-7.12<br />
Site Plan Review and Approval (Section 200-8.4)<br />
Subdivision Rules and Regulations - See Appendix A for details<br />
Greenfield‘s Subdivision Rules and Regulations (Chapter 880)<br />
Section 880-9.B Definitive Plan Submission Requirements<br />
Section 880-9.E Wetlands Protection Act.<br />
Section 880-10. Design Requirements<br />
Section 880-11. Open Space<br />
Section 880-12. Protection <strong>of</strong> Natural Features<br />
Section 880.13. Easements<br />
Section 880-14. Environmental Assessment<br />
Town <strong>of</strong> Greenfield Code - See Appendix A for details<br />
Wetlands Protection, Chapter 195<br />
Stormwater System Regulations, Chapter 695<br />
Design Criteria Section 695-12<br />
Water Supply Protection District Section 200-4.14<br />
Limitations upon Uses section (200-4.14.10)<br />
38 Draft Recommendations, Town Recommendations: Supplement to the Failure <strong>of</strong> the Harriman<br />
Dam Evacuation Planning Report.<br />
Town <strong>of</strong> Greenfield Local Natural Hazard Mitigation Plan • 89
2006 Greenfield Open Space and Recreation Plan<br />
As its title implies, the intent <strong>of</strong> Greenfield‘s Open Space and Recreation Plan is not to address<br />
<strong>hazard</strong> <strong>mitigation</strong> or flood control in a direct or comprehensive way. However, the <strong>plan</strong><br />
inventories the natural features and environments in the <strong>town</strong>, many <strong>of</strong> which, such as wetlands,<br />
aquifer recharge areas, farms, rivers, streams, and brooks, include floodplain areas.<br />
Greenfield‘s statement <strong>of</strong> Open Space and Recreation Goals includes protecting important and<br />
strategically located open space and protecting the Town‘s natural resources and the<br />
environment. The Plan‘s Resource Protection Needs Analysis concludes that it is important to<br />
think on a ―watershed scale‖ and coordinate with neighboring communities and other entities on<br />
projects involving the Connecticut and Deerfield Rivers. More specifically, the Plan states that<br />
lands along the Green River, which runs through the heart <strong>of</strong> Greenfield, is a priority. Protecting<br />
lands located near designated water supply areas is also identified as a priority. Greenfield<br />
contains some <strong>of</strong> the most fertile farmland in the county due in large part to its proximity <strong>of</strong><br />
rivers which deposit the rich soil in their floodplains. The Open Space and Recreation Plan<br />
recommended that the Town take a proactive role in protecting these lands through the<br />
Agricultural Preservation Restriction Program (APR), the Chapter 61A programs, and adopting<br />
zoning ordinances for farmland preservation such as a Farmland Preservation Overlay District.<br />
2009 Greenfield Reconnaissance Report<br />
The Massachusetts Heritage Landscape Inventory Program‘s Reconnaissance Report is a<br />
valuable resource for Greenfield, helping to identify those landscapes particularly valued by the<br />
community, especially those that are significant and unprotected. It also contains information on<br />
cultural and historic resources in Town. This inventory could be used by the Committee to help<br />
them prioritize those resources that may be threatened by <strong>hazard</strong>s such as flooding.<br />
2002 Greenfield Master Plan<br />
The Greenfield Master Plan is a statement <strong>of</strong> the community values <strong>of</strong> Greenfield and a directive<br />
for the physical development <strong>of</strong> the <strong>town</strong> that describes how, why, where and when to build,<br />
rebuild or preserve the <strong>town</strong>. As such, it indirectly addresses flooding potential and <strong>mitigation</strong> in<br />
the Land Use Section <strong>of</strong> the Master Plan. Among the Goals <strong>of</strong> the Land Use Section which<br />
indirectly address flooding are:<br />
Preserving agriculture;<br />
Promoting housing choice and natural resource protection through careful site<br />
<strong>plan</strong>ning in outlying areas; and<br />
Siting land uses where the carrying capacity <strong>of</strong> the land is greatest.<br />
Several Implementation Objectives in the Land Use Section also indirectly address flooding by<br />
seeking to preserve open space and encourage environmentally sensitive development patterns.<br />
These specific Objectives encourage:<br />
The initiation <strong>of</strong> an assertive, coordinated, on-going open space resources acquisition<br />
and preservation <strong>plan</strong>; and<br />
Town <strong>of</strong> Greenfield Local Natural Hazard Mitigation Plan • 90
Identifying ways to achieve cluster development as a preferred development pattern<br />
for areas with specific attributes such as water resource protection, agricultural soils,<br />
landscape character, and wildlife habitat and corridors.<br />
The Goal <strong>of</strong> the Natural, Cultural, and Historic Resources Section <strong>of</strong> the Master Plan is the<br />
protection and enhancement <strong>of</strong> Greenfield‘s natural resource systems, cultural resources, and<br />
historic buildings. Preserving and enhancing natural resource systems, such as wetlands and<br />
floodplains, will help to mitigate or prevent flooding. One <strong>of</strong> the objectives <strong>of</strong> this section is to<br />
protect environmentally sensitive areas and to try and site development away from these areas or<br />
mitigate impacts to these areas. Among the Implementation Measures listed in the Natural,<br />
Cultural, and Historic Resources Section <strong>of</strong> the Master Plan is one that would specifically<br />
mitigate or prevent flooding, namely – enforcing the Town‘s Zoning Ordinance and existing<br />
environmental regulations.<br />
The Open Space and Recreation Section <strong>of</strong> the Greenfield Master Plan includes the Goal <strong>of</strong><br />
preserving and providing open space ―…to enhance Greenfield‘s overall environmental quality.‖<br />
One <strong>of</strong> the Objectives listed in this section is to ―[i]ncrease public awareness pertaining to<br />
recreation and conservation opportunities and educate the public in regards to the protection <strong>of</strong><br />
the environment.‖<br />
2005 Bank Row Urban Renewal Plan<br />
This <strong>plan</strong> addresses a specific area <strong>of</strong> <strong>town</strong> – Bank Row – and its historic significance and<br />
existing substandard or blighted conditions. The <strong>plan</strong> could be used to help the Committee<br />
identify other similar areas in <strong>town</strong>, to prioritize those cultural and historic possibly threatened<br />
by <strong>hazard</strong>s such as flooding and to develop <strong>mitigation</strong> strategies.<br />
Town <strong>of</strong> Greenfield Local Natural Hazard Mitigation Plan • 91
Table 4-1: Existing Flood Hazard Mitigation Measures<br />
Type <strong>of</strong><br />
Existing<br />
Protection<br />
Zoning Bylaws<br />
Floodplain<br />
Overlay<br />
District<br />
Description Area Covered Effectiveness <strong>2011</strong> Potential Changes<br />
Permitted uses are<br />
allowed if they do not<br />
require structures, fill or<br />
storage <strong>of</strong> materials.<br />
No encroachment allowed<br />
within the 100-year<br />
floodplain without a<br />
Special Permit.<br />
Special Flood<br />
Hazard Areas<br />
(Zones A, A 1-<br />
30) to indicate<br />
the 100-year<br />
floodplain.<br />
Effective for<br />
regulating new<br />
development<br />
within the 100-<br />
year floodplain.<br />
Consider limiting all<br />
new development<br />
within the 100-year<br />
floodplain.<br />
Accomplished/<br />
Still Relevant?<br />
Still relevant.<br />
Special permit conditions<br />
require no decrease in<br />
flood storage capacity or<br />
increase in flood levels.<br />
Use must not<br />
substantially affect the<br />
water table, water quality<br />
or drainage patterns.<br />
Performance<br />
Standards<br />
Standard (6.8.3.8)<br />
addresses the impacts <strong>of</strong><br />
uncontrolled surface<br />
water run<strong>of</strong>f and<br />
sedimentation <strong>of</strong> surface<br />
waters.<br />
Entire <strong>town</strong>.<br />
Effective for<br />
mitigating<br />
<strong>local</strong>ized<br />
flooding by<br />
regulating<br />
stormwater<br />
run<strong>of</strong>f.<br />
None.<br />
N/A<br />
Open Space<br />
and Cluster<br />
Development<br />
Section<br />
Earth Removal: Regulates<br />
the removal <strong>of</strong> soil, loam,<br />
sand & gravel through a<br />
permitting process and<br />
exempts existing sand<br />
and gravel operations,<br />
and disturbances due to<br />
building construction and<br />
landscaping activities.<br />
Entire <strong>town</strong>.<br />
Not Effective for<br />
controlling<br />
<strong>local</strong>ized<br />
flooding. This<br />
Ordinance does<br />
not include a<br />
purpose.<br />
Add reducing or<br />
eliminating the<br />
potential for <strong>local</strong>ized<br />
flooding events as a<br />
Purpose <strong>of</strong> the<br />
Ordinance.<br />
Still relevant.<br />
This Ordinance Require <strong>mitigation</strong> <strong>of</strong><br />
does not potential impacts from<br />
specifically flooding.<br />
address the<br />
potential for<br />
<strong>local</strong>ized<br />
flooding that soil<br />
removal can<br />
cause.<br />
Still relevant.<br />
Town <strong>of</strong> Greenfield Local Natural Hazard Mitigation Plan • January <strong>2011</strong>• Page 92
Type <strong>of</strong><br />
Existing<br />
Protection<br />
Description Area Covered Effectiveness <strong>2011</strong> Potential Changes<br />
This Ordinance<br />
was written to<br />
address safety,<br />
aesthetics, and<br />
potential traffic<br />
impacts<br />
associated with<br />
soil removal.<br />
Add a reference to the<br />
Town‘s stormwater<br />
regulations.<br />
Accomplished/<br />
Still Relevant?<br />
Still relevant.<br />
Open Space<br />
and Cluster<br />
Development<br />
Section<br />
Major Development<br />
Review:<br />
Requires an Impact<br />
Statement for certain<br />
types <strong>of</strong> development.<br />
The Impact Statement<br />
must include an<br />
evaluation <strong>of</strong> the impact<br />
<strong>of</strong> stormwater, run<strong>of</strong>f,<br />
flooding, erosion,<br />
sedimentation, grading<br />
changes, increased<br />
impervious surface,<br />
discharges to<br />
groundwater, pumping <strong>of</strong><br />
groundwater, wetlands<br />
disruption, and changes to<br />
vegetative cover.<br />
Entire <strong>town</strong>.<br />
Effective for<br />
mitigating<br />
flooding and<br />
flood-related<br />
impacts for<br />
certain types <strong>of</strong><br />
large-scale<br />
developments.<br />
None.<br />
N/A<br />
The Impact Statement<br />
must describe proposed<br />
<strong>mitigation</strong> measures for<br />
identified impacts.<br />
Regulations list the<br />
Environmental Standards<br />
for Impact Statements<br />
that address flooding:<br />
specifically, the project<br />
shall not cause erosion or<br />
flooding <strong>of</strong> the site.<br />
Open Space<br />
and Cluster<br />
Development<br />
Section<br />
Site Plan Review: Project<br />
proponent must submit<br />
information regarding<br />
measures to prevent<br />
flooding and increased<br />
run<strong>of</strong>f and prevent<br />
erosion and<br />
sedimentation.<br />
Required for all Effective for<br />
uses that require preventing<br />
a Special Permit, flooding and<br />
any business, uncontrolled<br />
commercial, stormwater<br />
industrial or run<strong>of</strong>f.<br />
institutional use<br />
(except certain<br />
home<br />
occupations) and<br />
None.<br />
N/A<br />
Town <strong>of</strong> Greenfield Local Natural Hazard Mitigation Plan • January <strong>2011</strong>• Page 93
Type <strong>of</strong><br />
Existing<br />
Protection<br />
Description Area Covered Effectiveness <strong>2011</strong> Potential Changes<br />
any site<br />
containing more<br />
than one (1)<br />
principal use.<br />
Accomplished/<br />
Still Relevant?<br />
Subdivision Rules and Regulations:<br />
Definitive<br />
Plan<br />
Wetlands<br />
Protection Act<br />
Design<br />
Requirements<br />
Proposed layout Entire Town<br />
(including cross sections<br />
and pr<strong>of</strong>iles) <strong>of</strong> sewerage,<br />
storm drainage and water<br />
supply, including invert<br />
elevations, slopes,<br />
capacity, and velocity and<br />
stormwater management<br />
<strong>plan</strong><br />
An erosion control <strong>plan</strong>, Entire Town<br />
indicating the erosion<br />
control measures to be<br />
employed, including<br />
description <strong>of</strong> locations <strong>of</strong><br />
temporary stockpiles,<br />
spoil areas, temporary<br />
drainage systems, slope<br />
stabilization techniques,<br />
sediment basins, etc., and<br />
narrative description <strong>of</strong><br />
how erosion from<br />
individual lots onto<br />
streets and into drainage<br />
systems is proposed to be<br />
controlled.<br />
Guidelines establish that<br />
the development must be<br />
in compliance with the<br />
WPA and the applicant<br />
shall obtain approval<br />
from the Conservation<br />
Commission prior to any<br />
construction activity in<br />
the affected areas.<br />
Entire Town<br />
Requires design to reduce Entire Town<br />
where possible, the<br />
volume <strong>of</strong> cut and fill; the<br />
area over which existing<br />
vegetation will be<br />
disturbed, especially if<br />
within 200 feet <strong>of</strong> a river,<br />
pond, or stream, or<br />
having a slope <strong>of</strong> more<br />
than 15%;the number <strong>of</strong><br />
Effective for None<br />
mitigating<br />
<strong>local</strong>ized<br />
flooding <strong>of</strong> roads<br />
and other<br />
infrastructure.<br />
Effective for None<br />
mitigating<br />
<strong>local</strong>ized<br />
flooding <strong>of</strong> roads<br />
and other<br />
infrastructure.<br />
Effective for None<br />
mitigating<br />
<strong>local</strong>ized<br />
flooding <strong>of</strong> roads<br />
and other<br />
infrastructure<br />
and for<br />
preventing<br />
filling <strong>of</strong> flood<br />
storage areas.<br />
Effective for None<br />
mitigating<br />
<strong>local</strong>ized<br />
flooding <strong>of</strong> roads<br />
and other<br />
infrastructure<br />
and for<br />
preventing<br />
filling <strong>of</strong> flood<br />
storage areas.<br />
N/A<br />
N/A<br />
N/A<br />
N/A<br />
Town <strong>of</strong> Greenfield Local Natural Hazard Mitigation Plan • January <strong>2011</strong>• Page 94
Type <strong>of</strong><br />
Existing<br />
Protection<br />
Description Area Covered Effectiveness <strong>2011</strong> Potential Changes<br />
mature trees removed; the<br />
extent <strong>of</strong> waterway<br />
altered or relocated; the<br />
erosion and siltation; and<br />
flood damage.<br />
Accomplished/<br />
Still Relevant?<br />
Open Space<br />
Protection <strong>of</strong><br />
Natural<br />
Features<br />
Easements<br />
Flood Hazard<br />
Areas<br />
Should contain design<br />
requirements that can<br />
reduce the potential for<br />
flooding.<br />
Should contain design<br />
requirements that can<br />
reduce the potential for<br />
flooding.<br />
Should contain design<br />
requirements that can<br />
reduce the potential for<br />
flooding.<br />
Requires that any portion<br />
<strong>of</strong> a proposed subdivision<br />
which is located within<br />
the 100-year floodplain<br />
shall meet the following<br />
requirements:<br />
All requirements <strong>of</strong> §<br />
200-4.13 Floodplain<br />
District (F) <strong>of</strong> the<br />
Greenfield Zoning<br />
Entire Town<br />
Entire Town<br />
Entire Town<br />
Entire Town<br />
Somewhat Consider adding<br />
effective for prevention <strong>of</strong> flooding<br />
mitigating as an explicitly stated<br />
<strong>local</strong>ized purpose for this<br />
flooding <strong>of</strong> roads requirement.<br />
and other<br />
infrastructure<br />
and for<br />
preventing<br />
filling <strong>of</strong> flood<br />
storage areas.<br />
Still relevant.<br />
Still relevant.<br />
Still relevant.<br />
Somewhat Consider prohibited all Still relevant.<br />
effective for subdivision<br />
mitigating development within the<br />
<strong>local</strong>ized 100-year floodplain.<br />
flooding <strong>of</strong> roads<br />
and other<br />
infrastructure<br />
and for<br />
preventing<br />
filling <strong>of</strong> flood<br />
storage areas.<br />
Town <strong>of</strong> Greenfield Local Natural Hazard Mitigation Plan • January <strong>2011</strong>• Page 95
Type <strong>of</strong><br />
Existing<br />
Protection<br />
Ordinance.<br />
Description Area Covered Effectiveness <strong>2011</strong> Potential Changes<br />
The subdivision,<br />
including utilities and<br />
drainage, shall be<br />
designed to be consistent<br />
with the needs to<br />
minimize flood damage<br />
and provide adequate<br />
drainage.<br />
Accomplished/<br />
Still Relevant?<br />
Town <strong>of</strong> Greenfield Code:<br />
Stormwater<br />
System<br />
Regulation<br />
Subdivisions shall include<br />
base flood elevation data.<br />
Regulations require a<br />
permit for all new<br />
connections to the<br />
stormwater system and<br />
any increases in volume<br />
from existing<br />
development.<br />
Stormwater Management<br />
Plans are required for all<br />
nonresidential uses.<br />
Regulations include<br />
stormwater management<br />
standards, design criteria<br />
and mandate coordination<br />
with the Greenfield<br />
Conservation<br />
Commission.<br />
Entire Town<br />
Effective for None.<br />
mitigating or<br />
preventing<br />
<strong>local</strong>ized<br />
flooding <strong>of</strong> roads<br />
and other<br />
infrastructure<br />
and for<br />
controlling<br />
impacts from<br />
stormwater<br />
run<strong>of</strong>f.<br />
N/A<br />
Water Supply<br />
Protection<br />
District<br />
Regulations protect and<br />
preserve existing and<br />
potential sources <strong>of</strong><br />
groundwater supply and<br />
recharge and watershed<br />
areas.<br />
Areas identified<br />
on the Zoning<br />
Map.<br />
Effective for<br />
mitigating the<br />
potential for<br />
<strong>local</strong>ized<br />
flooding by<br />
preserving open<br />
space in the<br />
watershed and<br />
regulating<br />
stormwater<br />
run<strong>of</strong>f<br />
None.<br />
N/A<br />
Town <strong>of</strong> Greenfield Plans:<br />
Greenfield Inventories natural<br />
Open Space features and<br />
and environments in the<br />
Recreation <strong>town</strong>, including many<br />
Entire <strong>town</strong>.<br />
Effective in<br />
identifying<br />
sensitive<br />
resource areas,<br />
None.<br />
N/A<br />
Town <strong>of</strong> Greenfield Local Natural Hazard Mitigation Plan • January <strong>2011</strong>• Page 96
Type <strong>of</strong><br />
Existing<br />
Protection<br />
Plan<br />
Description Area Covered Effectiveness <strong>2011</strong> Potential Changes<br />
that contain floodplain<br />
areas such as wetlands,<br />
aquifer recharge areas,<br />
farms, rivers, streams<br />
and brooks.<br />
including<br />
floodplains<br />
and<br />
encourages<br />
thinking on a<br />
―watershed<br />
scale‖.<br />
Accomplished/<br />
Still Relevant?<br />
Prioritizes<br />
protecting<br />
areas along the<br />
Green River<br />
and<br />
recommends<br />
that the Town<br />
take a<br />
proactive role<br />
in preserving<br />
farmland,<br />
much <strong>of</strong> which<br />
lies within the<br />
floodplain.<br />
Greenfield<br />
Master Plan<br />
Provides a framework<br />
for guiding<br />
development in Town.<br />
Entire <strong>town</strong>.<br />
Effective in<br />
establishing<br />
priorities for<br />
environmentall<br />
y sensitive<br />
development<br />
that will<br />
mitigate<br />
flooding<br />
impacts.<br />
None.<br />
N/A<br />
Participation<br />
in the<br />
National<br />
Flood<br />
Insurance<br />
Program<br />
As <strong>of</strong> 2003, there were<br />
48 homeowners with<br />
flood insurance<br />
policies.<br />
Areas<br />
identified by<br />
the FEMA<br />
maps.<br />
Effective. None. N/A<br />
State<br />
Building<br />
Code<br />
The Town <strong>of</strong><br />
Greenfield has adopted<br />
the Massachusetts State<br />
Building Code.<br />
Entire Town Effective None. N/A<br />
Town <strong>of</strong> Greenfield Local Natural Hazard Mitigation Plan • January <strong>2011</strong>• Page 97
Type <strong>of</strong><br />
Existing<br />
Protection<br />
Deerfield<br />
River<br />
Watershed<br />
Regional<br />
Open Space<br />
&<br />
Recreation<br />
Plan<br />
Description Area Covered Effectiveness <strong>2011</strong> Potential Changes<br />
This project will be<br />
completed by June 30,<br />
2004. A regional Open<br />
Space Committee will<br />
be formed to implement<br />
a Ten-Year Action<br />
Plan.<br />
Entire Town<br />
and the<br />
Deerfield<br />
River<br />
Watershed.<br />
Effective in<br />
raising<br />
awareness <strong>of</strong><br />
water<br />
resources in<br />
Town and<br />
potential<br />
negative<br />
impacts <strong>of</strong><br />
uncontrolled<br />
development<br />
(loss <strong>of</strong> open<br />
space,<br />
farmland,<br />
stormwater<br />
run<strong>of</strong>f and<br />
other nonpoint<br />
source<br />
pollution).<br />
Will<br />
encourage<br />
thinking on a<br />
watershed<br />
scale<br />
None.<br />
Accomplished/<br />
Still Relevant?<br />
Still<br />
relevant.<br />
Town <strong>of</strong> Greenfield Local Natural Hazard Mitigation Plan • January <strong>2011</strong>• Page 98
Severe Winter Storms<br />
Winter storms can be especially challenging for Emergency Management personnel because,<br />
although the storm has usually been forecast, there is no certain way to predict its length, size or<br />
severity. The Massachusetts Emergency Management Agency (MEMA) serves as the primary<br />
coordinating entity in the state-wide management <strong>of</strong> all types <strong>of</strong> winter storms and monitors the<br />
National Weather Service alerting systems during periods when winter storms are expected. 39<br />
Management Plans<br />
The CEM Plan for Greenfield lists the following generic <strong>mitigation</strong> measures for severe winter<br />
storms:<br />
‣ Develop and disseminate emergency public information concerning winter storms,<br />
especially material which instructs individuals and families how to stock their homes,<br />
prepare their vehicles, and take care <strong>of</strong> themselves during a severe winter storm.<br />
‣ As it is almost guaranteed that winter storms will occur annually in Massachusetts, <strong>local</strong><br />
government bodies should give special consideration to budgeting fiscal resources with<br />
snow management in mind.<br />
‣ Maintain <strong>plan</strong>s for managing all winter storm emergency response activities.<br />
To the extent that some <strong>of</strong> the damages from a winter storm can be caused by flooding, all <strong>of</strong> the<br />
flood protection <strong>mitigation</strong> measures described in Table 4-1 can also be considered as <strong>mitigation</strong><br />
measures for severe snowstorms/ice storms.<br />
The CEM Plan for Greenfield lists the following generic preparedness and response measures for<br />
severe winter storms:<br />
‣ Ensure that warning/notification, and communications systems are in readiness.<br />
‣ Ensure that appropriate equipment and supplies, especially snow removal equipment, are<br />
in place and in good working order.<br />
‣ Review mutual aid agreements.<br />
‣ Designate suitable shelters throughout the community and make their locations known to<br />
the public.<br />
‣ Implement public information procedures during storm ‗warning‘ stage.<br />
‣ Prepare for possible evacuation and sheltering <strong>of</strong> some populations impacted by the storm<br />
(especially the elderly and special needs).<br />
‣ Broadcast storm warning/notification information and instructions.<br />
‣ Conduct evacuation, reception and sheltering activities.<br />
‣ If appropriate, activate media center. Refer to Resource Manual for media center<br />
information.<br />
‣ Dispatch search and rescue teams.<br />
39 Comprehensive Emergency Management Plan for the Town <strong>of</strong> Greenfield, August 2002.<br />
Town <strong>of</strong> Greenfield Local Natural Hazard Mitigation Plan • January <strong>2011</strong>• Page 99
‣ Dispatch emergency medical teams.<br />
‣ Take measures to guard against further danger from power failure, downed trees and<br />
utility lines, ice, traffic problems, etc.<br />
‣ Close roads, and/or limit access to certain areas if appropriate.<br />
‣ Provide assistance to homebound populations needing heat, food, and other necessities.<br />
‣ Provide rescue and sheltering for stranded/lost individuals.<br />
Land Use Regulations that Mitigate Impacts from Severe Winter Storms<br />
Subdivision Rules and Regulations (See Appendix A for details)<br />
Section 3.1.2 Design Standards<br />
Other Mitigation Measures<br />
Severe snowstorms or ice storms can <strong>of</strong>ten result in a small or widespread loss <strong>of</strong> electrical<br />
service. The public water supply wells and water treatment <strong>plan</strong>t are both equipped with standby<br />
power sources. The distribution system functions by gravity; therefore, no auxiliary power is<br />
needed. The sewage pump stations and the wastewater treatment <strong>plan</strong>t are also equipped with<br />
standby power sources.<br />
State Building Code<br />
For new or recently built structures, the primary protection against snow-related damage is<br />
construction according to the State Building Code, which addresses designing buildings to<br />
withstand snow loads. The Town <strong>of</strong> Greenfield is a member <strong>of</strong> the Franklin County Cooperative<br />
Building Inspection Program, which provides building inspection services.<br />
Town <strong>of</strong> Greenfield Local Natural Hazard Mitigation Plan • January <strong>2011</strong>• Page 100
Table 4-2: Existing Severe Winter Storms Hazard Mitigation Measures<br />
Type <strong>of</strong><br />
Existing<br />
Protection<br />
Subdivision Rules and Regulations<br />
Floodplain<br />
Overlay<br />
District<br />
Description Area Covered Effectiveness <strong>2011</strong> Potential Changes<br />
Standards include street Entire Town. Effective. None. N/A<br />
grade regulations (six to 10<br />
percent maximum).<br />
Accomplished/<br />
Still Relevant?<br />
Shelters<br />
State<br />
Building<br />
Code<br />
Shelters for victims <strong>of</strong><br />
natural <strong>hazard</strong>s in<br />
Greenfield have been<br />
identified.<br />
The Town <strong>of</strong> Greenfield<br />
has adopted the MA State<br />
Building Code<br />
Entire Town. Effective. Ensure that identified<br />
shelters have sufficient<br />
back-up utility service<br />
in the event <strong>of</strong> primary<br />
power failure.<br />
Entire Town. Effective. None N/A<br />
Still relevant.<br />
Town <strong>of</strong> Greenfield Local Natural Hazard Mitigation Plan • January <strong>2011</strong>• Page 101
Hurricanes (Tornados included in this section)<br />
The flooding associated with hurricanes and tornados can be a major source <strong>of</strong> damage to<br />
buildings, infrastructure and a potential threat to human lives. Therefore, all <strong>of</strong> the flood<br />
protection <strong>mitigation</strong> measures described in Table 4-1 can also be considered hurricane<br />
<strong>mitigation</strong> measures. High winds that <strong>of</strong>tentimes accompany hurricanes and tornados can also<br />
damage buildings and infrastructure. See Microbursts on following pages for wind-related<br />
<strong>mitigation</strong> measures.<br />
Management Plans<br />
The CEM Plan for Greenfield lists the following generic <strong>mitigation</strong> measures for hurricane and<br />
tornado <strong>plan</strong>ning and response:<br />
‣ Develop and disseminate emergency public information and instructions concerning<br />
hurricane preparedness and safety.<br />
‣ Community leaders should ensure that Greenfield is enrolled in the National Flood<br />
Insurance Program.<br />
‣ Develop and enforce <strong>local</strong> building codes to enhance structural resistance to high winds<br />
and flooding. Build new construction in areas that are not vulnerable to direct hurricane<br />
effects.<br />
‣ Maintain <strong>plan</strong>s for managing all hurricane emergency response activities.<br />
The CEM Plan for Greenfield includes the following generic preparedness and response<br />
measures for hurricanes and tornados:<br />
‣ Ensure that warning/notification systems and equipment is ready for use at the ‗hurricane<br />
warning‘ stage.<br />
‣ Review mutual aid agreements.<br />
‣ Designate suitable wind and flood resistant shelters in the community and make their<br />
locations known to the public.<br />
‣ Prepare for coordination <strong>of</strong> evacuation from potentially impacted areas including<br />
alternate transportation systems and locations <strong>of</strong> special needs facilities.<br />
‣ Activate warning/notification systems to inform public <strong>of</strong> protective measures to be taken<br />
including evacuation where appropriate.<br />
‣ Conduct evacuation <strong>of</strong> affected populations.<br />
‣ Open and staff shelters and reception centers.<br />
‣ Dispatch search and rescue teams.<br />
‣ Dispatch emergency medical teams.<br />
‣ Activate mutual aid activities.<br />
‣ Take measures to guard against further danger from downed trees and utility lines, debris,<br />
etc.<br />
Evacuation Options<br />
The Greenfield CEM <strong>plan</strong>, <strong>local</strong> <strong>of</strong>ficials have identified appropriate shelters for residents in the<br />
case <strong>of</strong> a hurricane or tornado.<br />
Town <strong>of</strong> Greenfield Local Natural Hazard Mitigation Plan • January <strong>2011</strong>• Page 102
Also, the University <strong>of</strong> Massachusetts Transportation Center completed a Four County Scenario<br />
<strong>of</strong> Berkshire, Franklin, Hampshire and Hamden Counties should a hurricane force a full<br />
evacuation <strong>of</strong> Western Massachusetts. The study looks at critical transportation links; what<br />
could be done if such links were totally lost or partially constrained; and what alternative routes<br />
and other transportation services would be needed in order to evacuate people effectively to a<br />
safe location.<br />
Zoning Bylaws<br />
Section 200-7.14 Wireless Communications Facilities.<br />
Restrictions on Development<br />
The only restrictions on development that are wind-related are the provisions in the zoning<br />
Ordinance related to Wireless Communications Facilities. In addition, new mobile homes,<br />
which are susceptible to catastrophic damage during high wind events, are prohibited in <strong>town</strong>.<br />
State Building Code<br />
For new or recently built structures, the primary protection against wind-related damage is<br />
construction according to the State Building Code which adequately addresses designing<br />
buildings to withstand high winds.<br />
Town <strong>of</strong> Greenfield Local Natural Hazard Mitigation Plan • January <strong>2011</strong>• Page 103
Table 4-3: Existing Hurricanes and Tornados Hazard Mitigation Measures<br />
Type <strong>of</strong><br />
Existing<br />
Protection<br />
Zoning Bylaws<br />
Zoning Requires a special permit<br />
regulations from the Zoning Board <strong>of</strong><br />
for wireless Appeals and a building<br />
communicati permit from the Inspector<br />
ons facilities <strong>of</strong> Buildings before a<br />
facility can be erected.<br />
Description Area Covered Effectiveness <strong>2011</strong> Potential Changes<br />
Entire <strong>town</strong>. Effective. Add safety and<br />
prevention <strong>of</strong> windrelated<br />
damage as a<br />
stated purpose.<br />
Accomplished/<br />
Still Relevant?<br />
Still relevant.<br />
Applicant must provide<br />
<strong>plan</strong>s for anchoring and<br />
supporting the structure.<br />
The Ordinance also<br />
establishes a ―fall zone‖<br />
for the structure in relation<br />
to property lines and road<br />
right-<strong>of</strong>-ways.<br />
State<br />
Building<br />
Code<br />
The Town <strong>of</strong> Greenfield<br />
has adopted the<br />
Massachusetts State<br />
Building Code.<br />
Entire Town Effective No Changes N/A<br />
Zoning<br />
Regulations<br />
Prohibiting<br />
new mobile<br />
homes<br />
Town <strong>of</strong> Greenfield<br />
Zoning Ordinance<br />
prohibits the siting <strong>of</strong> new<br />
mobile homes.<br />
Entire Town.<br />
Effective in<br />
reducing the<br />
potential for loss<br />
<strong>of</strong> life and<br />
property<br />
damage.<br />
Existing mobile<br />
homes are<br />
―grandfathered‖<br />
and can be<br />
replaced.<br />
Replacements<br />
must meet<br />
standards <strong>of</strong><br />
current building<br />
code.<br />
Ensure that<br />
replacement mobile<br />
homes be tied down to<br />
reduce the damaging<br />
impacts <strong>of</strong> high winds.<br />
Still relevant.<br />
Town <strong>of</strong> Greenfield Local Natural Hazard Mitigation Plan • January <strong>2011</strong>• Page 104
Microbursts (Includes Thunderstorms and Wind Related Events)<br />
Most damage from microbursts and wind-related events comes from high winds which can fell<br />
trees and electrical wires, generate hurtling debris and, possibly, hail.<br />
Management Plans<br />
The Greenfield CEM Plan lists three generic <strong>mitigation</strong> measures for wind-related storm<br />
<strong>plan</strong>ning and response.<br />
Develop and disseminate emergency public information and instructions concerning<br />
tornado safety, especially guidance regarding in-home protection and evacuation<br />
procedures, and locations <strong>of</strong> public shelters.<br />
Strict adherence should be paid to building code regulations for all new construction.<br />
Maintain <strong>plan</strong>s for managing tornado response activities. Refer to the noninstitutionalized,<br />
special needs and transportation resources listed in the Resource<br />
Manual.<br />
The CEM Plan for Greenfield includes the following generic preparedness and response<br />
measures for wind-related storms:<br />
‣ Designate appropriate shelter space in the community that could potentially withstand<br />
tornado impact.<br />
‣ Periodically test and exercise tornado response <strong>plan</strong>s.<br />
‣ Put Emergency Management on standby at tornado ‗watch‘ stage.<br />
‣ At tornado ‗warning‘ stage, broadcast public warning/notification safety instructions and<br />
status reports.<br />
‣ Conduct evacuation, reception, and sheltering services to victims.<br />
‣ Dispatch search and rescue teams.<br />
‣ Dispatch emergency medical teams.<br />
‣ Activate mutual aid agreements.<br />
‣ Take measures to guard against further injury from such dangers as ruptured gas lines,<br />
downed trees and utility lines, debris, etc.<br />
‣ Acquire needed emergency food, water, fuel, and medical supplies.<br />
‣ Take measures relating to the identification and disposition <strong>of</strong> remains <strong>of</strong> the deceased.<br />
Evacuation Plans<br />
There are shelters for wind-related storm victims identified in the Greenfield CEM Plan.<br />
Zoning<br />
See related information under Hurricanes and Tornados, previous section.<br />
Town <strong>of</strong> Greenfield Local Natural Hazard Mitigation Plan • January <strong>2011</strong>• Page 105
Restrictions on Development<br />
The only restrictions on development that are wind-related are the provisions in the zoning<br />
Ordinance related to Wireless Communications Facilities. In addition, new mobile homes,<br />
which are susceptible to catastrophic damage during high wind events, are prohibited in <strong>town</strong>.<br />
State Building Code<br />
For new or recently built structures, the primary protection against wind-related damage is<br />
construction according to the State Building Code which adequately addresses designing<br />
buildings to withstand high winds.<br />
Town <strong>of</strong> Greenfield Local Natural Hazard Mitigation Plan • January <strong>2011</strong>• Page 106
Table 4-4: Existing Microbursts Storms (Includes Thunderstorms and Wind Related<br />
events) Hazard Mitigation Measures<br />
Type <strong>of</strong><br />
Existing<br />
Protection<br />
Zoning Bylaws<br />
Zoning Requires a special permit<br />
regulations from the Zoning Board <strong>of</strong><br />
for wireless Appeals and a building<br />
communicati permit from the Inspector<br />
ons facilities <strong>of</strong> Buildings before a<br />
facility can be erected.<br />
Description Area Covered Effectiveness <strong>2011</strong> Potential Changes<br />
Applicant must provide<br />
<strong>plan</strong>s for anchoring and<br />
supporting the structure.<br />
The Ordinance also<br />
establishes a ―fall zone‖<br />
for the structure in relation<br />
to property lines and road<br />
right-<strong>of</strong>-ways.<br />
Entire <strong>town</strong>. Effective. Add safety and<br />
prevention <strong>of</strong> windrelated<br />
damage as a<br />
stated purpose.<br />
Accomplished/<br />
Still Relevant?<br />
Still relevant.<br />
State<br />
Building<br />
Code<br />
The Town <strong>of</strong> Greenfield<br />
has adopted the<br />
Massachusetts State<br />
Building Code.<br />
Entire Town Effective No Changes N/A<br />
Zoning<br />
Regulations<br />
Prohibiting<br />
new mobile<br />
homes<br />
Town <strong>of</strong> Greenfield<br />
Zoning Ordinance<br />
prohibits the siting <strong>of</strong> new<br />
mobile homes.<br />
Entire Town.<br />
Effective in<br />
reducing the<br />
potential for loss<br />
<strong>of</strong> life and<br />
property<br />
damage.<br />
Existing mobile<br />
homes are<br />
―grandfathered‖<br />
and can be<br />
replaced.<br />
Replacements<br />
must meet<br />
standards <strong>of</strong><br />
current building<br />
code.<br />
Ensure that<br />
replacement mobile<br />
homes be tied down to<br />
reduce the damaging<br />
impacts <strong>of</strong> high winds.<br />
Still relevant.<br />
Town <strong>of</strong> Greenfield Local Natural Hazard Mitigation Plan • January <strong>2011</strong>• Page 107
Wildfires / Brush Fires<br />
Management Plans and Regulatory Measures<br />
The CEM Plan for Greenfield includes the following generic <strong>mitigation</strong> measures for wildfire<br />
<strong>plan</strong>ning and response:<br />
‣ Promote fire safety measures such as fire-safe landscaping and construction practices to<br />
the public and business communities.<br />
The CEM Plan for Greenfield includes the following generic preparedness and response<br />
measures for tornados:<br />
‣ Restrict outside burning etc. based on moisture levels, fuels supply conditions such as<br />
drought.<br />
‣ Identify high vulnerability or problem areas.<br />
‣ Utilize mutual aid, including the State Fire Mobilization Plan, as needed.<br />
Greenfield also has some specific regulations and programs that pertain to preventing fires.<br />
Burn Permits<br />
The Town <strong>of</strong> Greenfield Fire Department requires a permit for the outdoor burning <strong>of</strong> leaves on<br />
residential property. The Town issued approximately 600 burn permits between January 15 th and<br />
May 1 st <strong>of</strong> 2003 and requires that these permits be obtained in person from the Fire Department.<br />
When an individual comes in to obtain a burn permit, Fire Department personnel educate them<br />
about safe burning practices. This outreach effort has resulted in lowering the number <strong>of</strong> outdoor<br />
residential brush fires that get out <strong>of</strong> the homeowner‘s control.<br />
Subdivision Review<br />
The Fire Department reviews subdivision <strong>plan</strong>s to ensure that their trucks will have adequate<br />
access and that the water supply is adequate for fire-fighting purposes.<br />
Public Education/Outreach<br />
The Fire Department implements ―Safe Schools‖, an ongoing educational program in the schools<br />
to teach fire safety. As mentioned above, the Fire Department also educates homeowners who<br />
apply for burn permits.<br />
Restrictions on Development<br />
There are currently no restrictions on development that are based on the need to mitigate the<br />
<strong>hazard</strong>s <strong>of</strong> wildfires/brushfires.<br />
Town <strong>of</strong> Greenfield Local Natural Hazard Mitigation Plan • January <strong>2011</strong>• Page 108
Table 4-5: Existing Wildfires / Brush Fires Hazard Mitigation Measures<br />
Type <strong>of</strong><br />
Existing<br />
Protection<br />
Zoning Bylaws<br />
Burn<br />
Permits<br />
Subdivision<br />
Review<br />
Description Area Covered Effectiveness <strong>2011</strong> Potential Changes<br />
Residents are required to<br />
appear in person to obtain<br />
burn permits. Fire<br />
Department personnel<br />
provide information on<br />
safe burn practices.<br />
The Fire Department in<br />
involved in the review <strong>of</strong><br />
subdivision <strong>plan</strong>s.<br />
Entire Town. Effective. None. N/A<br />
Entire Town. Effective. None. N/A<br />
Accomplished/<br />
Still Relevant?<br />
Public<br />
Education<br />
and<br />
Outreach<br />
The Fire Department has<br />
an ongoing educational<br />
program in the schools.<br />
Entire Town. Effective. None. N/A<br />
Forestry<br />
Management<br />
A Forestry Management<br />
Program for <strong>town</strong> owned<br />
lands.<br />
Entire Town. Effective. None. N/A<br />
Town <strong>of</strong> Greenfield Local Natural Hazard Mitigation Plan • January <strong>2011</strong>• Page 109
Dam Failures<br />
The only <strong>mitigation</strong> measures in place are the state regulations that control the construction and<br />
inspection <strong>of</strong> dams and the Emergency Action Plans for the FERC-regulated projects on the<br />
Deerfield River.<br />
Management Plans and Regulatory Measures<br />
The Greenfield CEM Plan contains the following generic <strong>mitigation</strong> measures for dam failure:<br />
Develop and conduct public education programs concerning dam <strong>hazard</strong>s.<br />
Maintain up-to-date <strong>plan</strong>s to deal with threat and actual occurrence <strong>of</strong> dam overspill or<br />
failure.<br />
Emergency Management and other <strong>local</strong> government agencies should familiarize<br />
themselves with technical data and other information pertinent to the dams which impact<br />
Greenfield. This should include determining the probable extent and seriousness <strong>of</strong> the<br />
effect to downstream areas.<br />
Dams should be inspected periodically and monitored regularly.<br />
Repairs should be attended to promptly.<br />
As much as is possible burdens on faulty dams should be lessened through stream rechanneling.<br />
Identify dam owners.<br />
Determine minimum notification time for downstream areas.<br />
The Greenfield CEM Plan contains the following generic preparedness and response measures<br />
for dam failure:<br />
‣ Pre-place adequate warning/notification systems in areas potentially vulnerable to dam<br />
failure effects.<br />
‣ Develop procedures for monitoring dam site conditions at first sign <strong>of</strong> any irregularity<br />
that could precipitate dam failure.<br />
‣ Identify special needs populations, evacuations routes, and shelters for dam failure<br />
response.<br />
‣ Have sandbags, sand, and other items to reinforce dam structure or flood pro<strong>of</strong> flood<br />
prone areas.<br />
‣ Disseminate warning/notification <strong>of</strong> imminent or occurring dam failure.<br />
‣ Coordinate evacuation and sheltering <strong>of</strong> affected populations.<br />
‣ Dispatch search and rescue teams.<br />
‣ Coordinate evacuation and sheltering <strong>of</strong> affected populations.<br />
‣ Activate mutual aid if needed.<br />
‣ Acquire additional needed supplies not already in place, such as earth moving machinery.<br />
‣ Establish incident command post as close to affected area as safely possible.<br />
‣ Provide security for evacuated public and private property.<br />
Town <strong>of</strong> Greenfield Local Natural Hazard Mitigation Plan • January <strong>2011</strong>• Page 110
Evacuation Options<br />
Evacuation information is contained in the Town <strong>of</strong> Greenfield CEM Plan.<br />
Permits Required for New Dam Construction<br />
Massachusetts State Law (M.G.L. Chapter 253 Section 45) regulates the construction <strong>of</strong> new<br />
dams. A permit must be obtained from the Department <strong>of</strong> Conservation and Recreation (DCR)<br />
before construction can begin. One <strong>of</strong> the permit requirements is that all <strong>local</strong> approvals or<br />
permits must be obtained.<br />
Dam Inspections<br />
The DCR requires that dams rated as Low Hazards be inspected every ten (10) years and dams<br />
that are rated as Significant Hazards be inspected every five (5) years. Of the nine (9) dams in<br />
Greenfield, the Town is the Owner and Caretaker <strong>of</strong> record for six (6) <strong>of</strong> these dams. According<br />
to DCR records, four (4) <strong>of</strong> the dams the Town is responsible for are classified as Significant<br />
Hazards and the remaining two (2) dams are Low Hazard. The remaining three (3) dams in <strong>town</strong><br />
are under private ownership. All three (3) are classified as Significant Hazard dams. The dam<br />
safety information provided by DCR indicates that four (4) <strong>of</strong> the dams in <strong>town</strong> have not been<br />
inspected according to the required schedule.<br />
Responsibility for dam inspections resides with the owner <strong>of</strong> the dam, which will likely create a<br />
significant financial hardship, both for <strong>town</strong>s and individuals who own dams, and result in fewer<br />
dams being inspected according to the required schedule.<br />
Zoning<br />
While no specific mention is made regarding the construction <strong>of</strong> new dams in either the<br />
Floodplain District (Section 200-4.13) or the Wetlands Protection section (Section 195-1), the<br />
language regarding encroachment and the erection <strong>of</strong> structures in both ordinances would<br />
indicate that a Special Permit would be required from the Zoning Board <strong>of</strong> Appeals and an Order<br />
<strong>of</strong> Conditions would be required from the Conservation Commission.<br />
Restrictions on Development<br />
There are no Town restrictions on dam locations. The DCR issues permits for new dams and<br />
does have the authority to deny a permit if it is determined that the design and/or location <strong>of</strong> the<br />
dam is not acceptable.<br />
Town <strong>of</strong> Greenfield Local Natural Hazard Mitigation Plan • January <strong>2011</strong>• Page 111
Table 4-6: Existing Earthquake Hazard Mitigation Measures<br />
Type <strong>of</strong><br />
Existing<br />
Protection<br />
Zoning Bylaws<br />
Permits<br />
required for<br />
new dam<br />
construction<br />
Description Area Covered Effectiveness <strong>2011</strong> Potential Changes<br />
State law requires a permit<br />
for the construction <strong>of</strong> any<br />
dam.<br />
Entire Town.<br />
Effective.<br />
Ensures dams<br />
are adequately<br />
designed.<br />
None.<br />
Accomplished/<br />
Still Relevant?<br />
N/A<br />
Dam<br />
Inspections<br />
DCR has an inspection<br />
schedule that is based on<br />
the <strong>hazard</strong> rating <strong>of</strong> the<br />
dam (low, significant, high<br />
<strong>hazard</strong>).<br />
Entire Town.<br />
Very Low. The Repeal the state law Still relevant.<br />
state passed a requiring dam owners<br />
law in 2002 to pay for inspections.<br />
shift<br />
Adequate staff and<br />
responsibility for resources should be<br />
inspections from given to DCR to ensure<br />
the state to the the inspection<br />
dam owner. The schedules are<br />
regulations have maintained.<br />
not been issued<br />
so DCR<br />
continues to<br />
inspect only the<br />
High Hazard<br />
dams. It is<br />
highly likely that<br />
the remaining<br />
dams are not<br />
being inspected<br />
according to the<br />
required<br />
schedule.<br />
Map dams and<br />
Inundation Areas.<br />
Still relevant.<br />
Evaluate the Need for Still relevant.<br />
Dam Inspections by the<br />
Town.<br />
Incorporate Dam Safety<br />
into Development<br />
Review process.<br />
Still relevant.<br />
Zoning<br />
Special Permit and/or<br />
Order <strong>of</strong> Conditions<br />
required for dams in<br />
Floodplain district or<br />
wetlands.<br />
Floodplain areas<br />
and those under<br />
the jurisdiction<br />
<strong>of</strong> the<br />
Conservation<br />
Commission.<br />
See also Table 4-1: Existing Flood Hazard Mitigation Measures.<br />
Effective. None. N/A<br />
Town <strong>of</strong> Greenfield Local Natural Hazard Mitigation Plan • January <strong>2011</strong>• Page 112
Earthquakes<br />
Although there are five mapped seismological faults in Massachusetts, there is no discernable<br />
pattern <strong>of</strong> previous earthquakes along these faults nor is there a reliable way to predict future<br />
earthquakes along these faults or in any other areas <strong>of</strong> the state. Consequently, earthquakes are<br />
arguably the most difficult natural <strong>hazard</strong> to <strong>plan</strong> for.<br />
Management Plans<br />
The Greenfield CEM Plan lists five generic earthquake <strong>mitigation</strong> measures, including:<br />
Community leaders in cooperation with Emergency Management Personnel should<br />
obtain <strong>local</strong> geological information and identify and assess structures and land areas that<br />
are especially vulnerable to earthquake impact and define methods to minimize the risk.<br />
Strict adherence should be paid to land use and earthquake resistant building codes for all<br />
new construction.<br />
Periodic evaluation, repair, and/or improvement should be made to older public<br />
structures.<br />
Emergency earthquake public information and instructions should be developed and<br />
disseminated.<br />
Earthquake drills should be held in schools, businesses, special care facilities, and other<br />
public gathering places.<br />
The Greenfield CEM Plan lists the following generic preparedness and response measures for<br />
earthquakes:<br />
‣ Earthquake response <strong>plan</strong>s should be maintained and ready for immediate use.<br />
‣ All equipment, supplies and facilities that would be needed for management <strong>of</strong> an<br />
earthquake occurrence should be maintained for readiness.<br />
‣ Emergency Management personnel should receive periodic training in earthquake<br />
response.<br />
‣ If the designated Emergency Operations Center (EOC) is in a building that would<br />
probably not withstand earthquake impact, another building should be chosen for an<br />
earthquake EOC.<br />
‣ Mass Care shelters for earthquake victims should be pre-designated in structures that<br />
would be most likely to withstand earthquake impact.<br />
‣ It is assumed that all special needs facilities could be affected to some extent by<br />
earthquake effects therefore preparedness measures should be in place to address the<br />
needs <strong>of</strong> all facilities listed in the Resource Manual.<br />
‣ Most likely the entire population <strong>of</strong> the community will be affected by a seismic event.<br />
Estimate the maximum peak population affected, considering peak tourism, special event<br />
populations, and work hours.<br />
‣ EOC will be activated and response will immediately be engaged to address any and all<br />
earthquake effects.<br />
Town <strong>of</strong> Greenfield Local Natural Hazard Mitigation Plan • January <strong>2011</strong>• Page 113
‣ Emergency warning/notification information and instructions will be broadcast to the<br />
public.<br />
‣ Search and rescue teams will be dispatched.<br />
‣ Emergency medical teams will be dispatched.<br />
‣ Firefighters will address fires/explosions, and HAZMAT incidents.<br />
‣ Law enforcement personnel will coordinate evacuation and traffic control.<br />
‣ Reception centers and shelters will be opened and staffed.<br />
‣ Animal control measures will be taken.<br />
‣ Law enforcement personnel will protect critical facilities and conduct surveillance against<br />
criminal activities.<br />
‣ Immediate life-threatening <strong>hazard</strong>s will be addressed such as broken gas lines or downed<br />
utility wires.<br />
‣ Emergency food, water, and fuel will be acquired.<br />
‣ Activate mutual aid.<br />
‣ Measures will be taken relating to identification and disposition <strong>of</strong> remains <strong>of</strong> deceased<br />
by the Chief Medical Examiner.<br />
Evacuation Options<br />
The Greenfield CEM lists shelters for victims <strong>of</strong> earthquakes.<br />
State Building Code<br />
The first edition <strong>of</strong> the Massachusetts State Building Code was issued on January 1, 1975 and<br />
included specific earthquake resistant design standards. These seismic requirements for new<br />
construction have been revised and updated over the years and are part <strong>of</strong> the current, 8th Edition<br />
<strong>of</strong> the Massachusetts State Building Code (780 CMR 120.AA). Given that many structures in<br />
the state and in Greenfield were built before 1975 (nearly 78% were built prior to 1970); it may<br />
be assumed that these structures were built without earthquake resistant design features. It is<br />
also important to note that the earthquake resistant design standards are the minimum standards<br />
for the structure to pass the State Building Code. This does not ensure that the structure will be<br />
perfectly safe during an earthquake. Built areas underlain by artificial fill, sandy or clay soils are<br />
particularly vulnerable to damage during an earthquake.<br />
Restrictions on Development<br />
There are no seismic-related restrictions on development.<br />
Town <strong>of</strong> Greenfield Local Natural Hazard Mitigation Plan • January <strong>2011</strong>• Page 114
Table 4-7: Existing Earthquake Hazard Mitigation Measures<br />
Type <strong>of</strong><br />
Existing<br />
Protection<br />
Zoning Bylaws<br />
State<br />
Building<br />
Code<br />
Description Area Covered Effectiveness <strong>2011</strong> Potential Changes<br />
The Town <strong>of</strong> Greenfield<br />
has adopted the<br />
Massachusetts State<br />
Building Code.<br />
Entire Town Effective No Changes N/A<br />
Accomplished/<br />
Still Relevant?<br />
Town <strong>of</strong> Greenfield Local Natural Hazard Mitigation Plan • January <strong>2011</strong>• Page 115
Landslides<br />
Regulating land use and development to avoid construction on steep slopes and ensuring that<br />
construction does not reduce slope stability is one way to mitigate the <strong>hazard</strong> potential <strong>of</strong><br />
landslides. The <strong>mitigation</strong> measures for landslides were found to be the same as for Floods.<br />
Please see Table 4-1: Existing Flood Hazard Mitigation Measures for summary <strong>of</strong> the above<br />
Land Use Regulations and Appendix A detailed Land Use Regulations.<br />
Ice Jams<br />
The most common <strong>hazard</strong> associated with ice jams is flooding upstream <strong>of</strong> the ice jam. Therefore<br />
strategies to mitigate flooding are also appropriate for mitigating the impacts <strong>of</strong> ice jams. Please<br />
see Current Mitigation Strategies for Flooding section and refer to Table 4-1: Existing Flood<br />
Hazard Mitigation Measures as well as Appendix A for complete language for same measures.<br />
Town <strong>of</strong> Greenfield Local Natural Hazard Mitigation Plan • January <strong>2011</strong>• Page 116
Manmade Hazards<br />
Timely, informative and accurate notification <strong>of</strong> a <strong>hazard</strong>ous material emergency is critical for an<br />
effective emergency response and for the safety and protection <strong>of</strong> Greenfield‘s citizens. With the<br />
frequency <strong>of</strong> transportation <strong>of</strong> <strong>hazard</strong>ous materials via Route 2 and railroad, the possibility exists<br />
<strong>of</strong> a catastrophic accident or spill. Strategies to <strong>plan</strong> for the evacuation <strong>of</strong> residents and for the<br />
cleanup <strong>of</strong> any chemical spill are key to <strong>hazard</strong> <strong>mitigation</strong>.<br />
Management Plans and Regulatory Measures<br />
The following are generic preparedness and response measures for manmade <strong>hazard</strong>s listed in<br />
the Town CEM Plan, specifically <strong>hazard</strong>ous materials emergencies:<br />
‣ The immediate notification <strong>of</strong> the community emergency coordinator and the State is<br />
required when a release <strong>of</strong> an extremely <strong>hazard</strong>ous substance or <strong>hazard</strong>ous chemical in an<br />
amount above the Reportable Quantity (RQ) occurs. Specific information is required by<br />
the notification such as chemical name, method <strong>of</strong> release, health effects, medical<br />
attention and protective actions.<br />
‣ The Hazardous Materials Release Report Form must be used in the event <strong>of</strong> the release <strong>of</strong><br />
a <strong>hazard</strong>ous substance<br />
‣ Both <strong>local</strong> and State response personnel, including the DEP must be notified immediately<br />
<strong>of</strong> a release. The <strong>local</strong> point <strong>of</strong> contact is the <strong>local</strong> fire department through the 911<br />
dispatch Center.<br />
Evacuation Options<br />
Evacuation <strong>of</strong> an incident site could be required upon the recommendation <strong>of</strong> the on-scene<br />
commander. The routes <strong>of</strong> evacuation and staging areas for the evacuees will be determined by<br />
the Incident Commander. Once the incident site has been evacuated, law enforcement <strong>of</strong>ficials<br />
will support expanded evacuation if required. The necessity for additional evacuation will be<br />
determined by the Incident Commander.<br />
Town <strong>of</strong> Greenfield Local Natural Hazard Mitigation Plan • January <strong>2011</strong>• Page 117
Future Mitigation Strategies<br />
As part <strong>of</strong> the <strong>multi</strong>-<strong>hazard</strong> <strong>mitigation</strong> <strong>plan</strong>ning process undertaken by the Greenfield Multi-<br />
Hazard Planning Committee, existing gaps in protection and possible deficiencies were identified<br />
and discussed. The Committee then developed general goal statements and action items that,<br />
when implemented, will help to reduce risks and future damages from <strong>hazard</strong>s. The goal<br />
statements, action items, <strong>town</strong> department(s) responsible for implementation, and the proposed<br />
timeframe for implementation for each category <strong>of</strong> <strong>hazard</strong> are described below. There are also<br />
several general action items that were developed.<br />
In addition, when identifying and analyzing its comprehensive range <strong>of</strong> specific <strong>mitigation</strong><br />
actions and projects, Greenfield‘s NH Planning Committee was particularly attentive to reducing<br />
the effects <strong>of</strong> each <strong>hazard</strong> on new and existing structures and infrastructure.<br />
Several <strong>of</strong> the action items have <strong>multi</strong>ple benefits because, if implemented, these action items<br />
will mitigate or prevent damages from more than one type <strong>of</strong> <strong>hazard</strong>. For example, updating the<br />
Subdivision Regulations to require new utility lines be placed underground will prevent property<br />
damage and loss <strong>of</strong> service in the event <strong>of</strong> high winds (tornado or hurricane), severe snow and<br />
ice storms, and mitigate the impacts <strong>of</strong> flooding and wildfires/brushfires.<br />
Hazard Mitigation Goal Statements and Action Plan<br />
As part <strong>of</strong> the <strong>multi</strong>-<strong>hazard</strong> <strong>mitigation</strong> <strong>plan</strong>ning process undertaken by the Greenfield Multi-<br />
Hazard Mitigation Planning Committee, existing gaps in protection and possible deficiencies<br />
were identified and discussed. The committee then developed general goal statements and action<br />
items that, when implemented, will help to reduce risks and future damages from <strong>hazard</strong>s. The<br />
goal statements, action items, Town department(s) responsible for implementation, and the<br />
proposed timeframe for implementation for each category <strong>of</strong> <strong>hazard</strong> are described below. There<br />
are also several general action items that were developed.<br />
Action items from the previous <strong>plan</strong> were carried over where they were still applicable and/or<br />
where the item had not yet been completed.<br />
Town <strong>of</strong> Greenfield Local Natural Hazard Mitigation Plan • January <strong>2011</strong>• Page 118
<strong>2011</strong> Action Plan<br />
Prioritization <strong>of</strong> Goals and Action Items<br />
As part <strong>of</strong> the <strong>multi</strong>-<strong>hazard</strong> <strong>mitigation</strong> <strong>plan</strong>ning process undertaken by the Committee, existing<br />
gaps in protection and possible deficiencies were identified and discussed. The committee then<br />
developed general goal statements and action items that, when implemented, will help to reduce<br />
risks and future damages from <strong>hazard</strong>s. The goal statements, action items, Town department(s)<br />
responsible for implementation, and the proposed timeframe for implementation for each<br />
category <strong>of</strong> <strong>hazard</strong> is located in Table 4-8: <strong>2011</strong> Greenfield Local Multi-Hazard Mitigation<br />
Prioritized Action Plan.<br />
The Committee prioritized Mitigation Action Items by examining the results <strong>of</strong> the All Hazards<br />
Risk Assessment completed by the Committee. The All Hazards Risk Assessment is an<br />
interactive table that the Committee completed with the FRCOG staff to evaluate all the <strong>hazard</strong>s<br />
that can impact the <strong>town</strong> based on frequency <strong>of</strong> occurrence, severity <strong>of</strong> impacts, area <strong>of</strong><br />
occurrence and preparedness. The completed table gives the <strong>town</strong> an overall understanding <strong>of</strong><br />
the <strong>hazard</strong>s, provides guidance on which <strong>hazard</strong>s the Town may want to focus <strong>mitigation</strong> efforts<br />
on, reaffirms that Greenfield‘s <strong>plan</strong>ning and preparedness is on track, and shows residents that<br />
<strong>town</strong> departments and agencies are organized in case <strong>of</strong> a natural disaster. Those <strong>hazard</strong>s<br />
receiving the highest Weighted Hazard Index number were assigned the highest priority as<br />
shown in Tables 4-8 and 4-9. Note: The All Hazards Risk Assessment was conducted prior to<br />
Tropical Storm Irene. It is not know whether the Assessment would have been significantly<br />
changed if it had been conducted after Irene.<br />
Table 4-8: Weighted Hazard Index Priority Level<br />
Weighted Hazard Index<br />
Priority Level<br />
> 5 High<br />
4.0 – 5.0 Medium<br />
< 4.0 Low<br />
Table 4-9: Hazard Priority Level Rating<br />
Hazard Weighted Hazard Index Priority Level<br />
Microbursts (Includes Thunderstorms<br />
and Wind Related Events) 6.8<br />
High<br />
Hurricanes 6.1 High<br />
Severe Winter Storms 5.2 High<br />
Floods 4.7 Medium<br />
Tornados 4.4 Medium<br />
Earthquakes 4.1 Medium<br />
Wildfires and Brush Fires 4.0 Medium<br />
Landslides 3.8 Low<br />
Ice Jams 3.2 Low<br />
Dam Failures 3.2 Low<br />
Town <strong>of</strong> Greenfield Local Natural Hazard Mitigation Plan • January <strong>2011</strong>• Page 119
Because the ranking <strong>of</strong> priorities was based on the results <strong>of</strong> the All Hazards Risk Assessment,<br />
factors such as <strong>local</strong> knowledge <strong>of</strong> the frequency <strong>of</strong> occurrence <strong>of</strong> <strong>hazard</strong> events, the severity <strong>of</strong><br />
impacts to the population, infrastructure, and the built and natural environments, the location and<br />
extent <strong>of</strong> impacts <strong>of</strong> the <strong>hazard</strong> events, and the <strong>town</strong>‘s preparedness to respond to <strong>hazard</strong> events<br />
were included in the prioritization process. The Committee‘s process also considered the<br />
anticipated benefits from the implementation <strong>of</strong> each Action Item to the population, the <strong>town</strong>‘s<br />
infrastructure, and to the built and natural environment. For most <strong>of</strong> the Action Items, project<br />
costs are not specifically known but there was consideration <strong>of</strong> whether or not the <strong>town</strong> currently<br />
had the technical and administrative capability to carry out the <strong>mitigation</strong> measures. Even when<br />
the political will exists to implement the Action Items, the fact remains that Greenfield is a <strong>town</strong><br />
that relies heavily on a relatively small number <strong>of</strong> paid staff, many <strong>of</strong> whom have <strong>multi</strong>ple<br />
responsibilities, and a dedicated group <strong>of</strong> volunteers who serve on <strong>town</strong> boards. The <strong>town</strong> does<br />
not have money to hire consultants and engineers to assist them with implementation <strong>of</strong> Action<br />
Items. Limited technical assistance is available from the Franklin Regional Council <strong>of</strong><br />
Governments. However, the availability <strong>of</strong> FRCOG staff can be constrained by the availability<br />
<strong>of</strong> grant funding.<br />
The final <strong>2011</strong> Greenfield Natural Local Hazards Mitigation Prioritized Action Plan is shown in<br />
Table 4-10. Potential funding sources to assist the <strong>town</strong> with implementation <strong>of</strong> the Action Item<br />
were listed. Finally, each Action Item was given an estimated completion date and assigned a<br />
responsible department or board.<br />
With respect to Manmade Hazards, the potential for fixed facility and transportation <strong>hazard</strong>ous<br />
materials accidents could be high – particularly transportation related accidents, given the<br />
proximity <strong>of</strong> Route 2 and the railroad tracks to rivers and to more densely populated areas <strong>of</strong><br />
Town. However, no formal vulnerability assessment was done for manmade <strong>hazard</strong>s due to the<br />
lack <strong>of</strong> available data to use in an appropriate assessment model. The potential for these types <strong>of</strong><br />
manmade <strong>hazard</strong>s to occur, the unknown impact <strong>of</strong> such accidents on the <strong>town</strong>‘s population,<br />
infrastructure, and the natural and built environment, and the lack <strong>of</strong> available and well-analyzed<br />
data make this <strong>hazard</strong> and the implementation <strong>of</strong> associated Action Items a high priority.<br />
Town <strong>of</strong> Greenfield Local Natural Hazard Mitigation Plan • January <strong>2011</strong>• Page 120
Table 4-10: <strong>2011</strong> Greenfield Local Multi-Hazard Mitigation Prioritized Action Plan<br />
Hazard Goal Action Item<br />
Responsible Department /<br />
Board<br />
Benefits What Areas<br />
Primarily? Built (B),<br />
Natural (N), Population<br />
(P), Infrastructure (I)<br />
Potential Funding Source<br />
Estimated Completion<br />
Date<br />
Status<br />
HIGH PRIORTY (> 5.0 Weighted Hazard Index)<br />
MULTIPLE HAZARDS<br />
To provide adequate shelter, water, food and basic first aid to displaced residents in the event <strong>of</strong> a natural disaster.<br />
Identify existing shelters<br />
that are equipped with an<br />
auxiliary power supply<br />
and/or are earthquake<br />
resistant. Disseminate<br />
this information to<br />
appropriate <strong>town</strong><br />
departments.<br />
Identify potential<br />
locations for new shelters,<br />
in particular, buildings<br />
that are equipped with an<br />
auxiliary power supply<br />
and/or are earthquake<br />
resistant. Disseminate<br />
this information to<br />
appropriate <strong>town</strong><br />
departments.<br />
Inventory supplies at<br />
existing shelters.<br />
Establish arrangements<br />
with <strong>local</strong> or neighboring<br />
vendors for supplying<br />
shelters with potable<br />
water, food and first aid<br />
supplies in the event <strong>of</strong> a<br />
natural disaster.<br />
Purchase generators for<br />
the DPW and emergency<br />
back-up generators for all<br />
emergency facilities.<br />
Emergency Management<br />
Director, Building<br />
Inspector, Department <strong>of</strong><br />
Public Works P Town 2012 Started and on-going<br />
Emergency Management<br />
Director, Building<br />
Inspector, Department <strong>of</strong><br />
Public Works P Town 2012 Started and on-going<br />
Emergency Management<br />
Director, Fire<br />
Department, Police<br />
Department P Town 2012 Started and on-going<br />
Planning Department,<br />
Department <strong>of</strong> Public<br />
Works P, I MEMA, FEMA 2012 Started and on-going<br />
To ensure adequate communication and coordination among all emergency personnel in the event <strong>of</strong> a natural disaster.<br />
The Multi-Hazard<br />
Mitigation Planning<br />
Committee will<br />
Emergency Management<br />
Director, Greenfield<br />
Multi-Hazard Mitigation B, N, P, I Town 2012 Started and on-going<br />
Town <strong>of</strong> Greenfield Local Natural Hazard Mitigation Plan • January <strong>2011</strong>• Page 121
Hazard Goal Action Item<br />
collaborate with<br />
appropriate state and <strong>local</strong><br />
partners to integrate<br />
relevant Action Items<br />
from this <strong>plan</strong> into the<br />
Greenfield<br />
Comprehensive<br />
Emergency Management<br />
Plan.<br />
Purchase equipment to<br />
assist with tree removal<br />
and debris associated with<br />
a <strong>hazard</strong> or disaster.<br />
Identify sites for city-wide<br />
or regional debris disposal<br />
and processing.<br />
Review strategies for<br />
animal control and<br />
sheltering during and after<br />
a disaster or <strong>hazard</strong>.<br />
Responsible Department /<br />
Board<br />
Planning Committee<br />
Benefits What Areas<br />
Primarily? Built (B),<br />
Natural (N), Population<br />
(P), Infrastructure (I)<br />
Potential Funding Source<br />
Estimated Completion<br />
Date<br />
Department <strong>of</strong> Public<br />
Works B, I Town, MEMA, FEMA<br />
Dependent upon<br />
Funding<br />
Not Yet Started<br />
Planning Department,<br />
Department <strong>of</strong> Public<br />
Works, Health<br />
Department B, I Town 2014 Not Yet Started<br />
Police Department,<br />
Department <strong>of</strong> Public<br />
Works, Health<br />
Department P, I Town, MEMA, FEMA 2014 Not Yet Started<br />
To provide adequate notification and information regarding evacuation procedures, etc., to residents in the event <strong>of</strong> a natural disaster.<br />
Investigate the feasibility<br />
<strong>of</strong> a Reverse 911 system<br />
for the Town <strong>of</strong><br />
Greenfield. Develop a<br />
preliminary project<br />
proposal and cost<br />
estimate.<br />
Collect, periodically<br />
update, and disseminate<br />
information on <strong>local</strong> radio<br />
stations and Greenfield<br />
Cable Television<br />
regarding fire safety, what<br />
to include in a ―home<br />
survival kit‖, how to<br />
prepare homes and other<br />
structures to withstand<br />
flooding and high winds,<br />
and the proper evacuation<br />
Police Department, Fire<br />
Department, Department<br />
<strong>of</strong> Public Works P Town 2014 Started and on-going<br />
Police Department, Fire<br />
Department, Department<br />
<strong>of</strong> Public Works P Town<br />
This action has been<br />
implemented and will<br />
continue over the next 5<br />
years.<br />
Status<br />
This action has been<br />
implemented and will<br />
continue over the next 5<br />
years.<br />
Town <strong>of</strong> Greenfield Local Natural Hazard Mitigation Plan • January <strong>2011</strong>• Page 122
Hazard Goal Action Item<br />
Responsible Department /<br />
Board<br />
Benefits What Areas<br />
Primarily? Built (B),<br />
Natural (N), Population<br />
(P), Infrastructure (I)<br />
Potential Funding Source<br />
procedures to follow<br />
during a natural disaster.<br />
MICROBURSTS (INCLUDES THUNDERSTORMS AND WIND-RELATED EVENTS) – These action items could also apply to thunderstorms, hurricanes and tornados<br />
HURRICANES<br />
To minimize the loss <strong>of</strong> life, damage to property, and the disruption <strong>of</strong> governmental services and general business activities due to microbursts.<br />
Estimated Completion<br />
Date<br />
Review and update<br />
Section 200-7.14 <strong>of</strong> the<br />
Greenfield Zoning<br />
Ordinance that regulates<br />
wireless communication<br />
facilities. Consider<br />
adding ―safety‖ and ―the<br />
prevention <strong>of</strong> wind-related<br />
damage‖ as one <strong>of</strong> the<br />
purposes <strong>of</strong> the<br />
Ordinance. Planning Department B, P Town Spring 2012 Still relevant<br />
Enforce the State Building<br />
Code to ensure new<br />
buildings are designed to<br />
withstand high winds. Building Inspector B, P Town<br />
Encourage the<br />
construction <strong>of</strong> new<br />
homes with basements or<br />
crawl spaces to provide<br />
shelter during a tornado,<br />
hurricane or other storm<br />
event with high winds. Building Inspector B, P Town<br />
Review and update the<br />
Subdivision Regulations.<br />
Special consideration<br />
should be given to<br />
requiring that new utilities<br />
be placed underground. Planning Department I Town Complete<br />
Inventory Town trees for<br />
Health Status<br />
Department <strong>of</strong> Public<br />
Works I, B, P Town<br />
This action has been<br />
implemented and will<br />
continue over the next 5<br />
years.<br />
This action has been<br />
implemented and will<br />
continue over the next 5<br />
years.<br />
This action will continue<br />
over the next 5 years.<br />
To minimize the loss <strong>of</strong> life, damage to property, and the disruption <strong>of</strong> governmental services and general business activities due to hurricanes and tropical storms.<br />
Status<br />
Implemented and ongoing<br />
Implemented and ongoing<br />
Revised Subdivision<br />
Regulations were<br />
adopted by the Planning<br />
Board on 11/21/08.<br />
Implemented and ongoing<br />
See action items related to<br />
microbursts (above) N/A N/A N/A N/A N/A<br />
Town <strong>of</strong> Greenfield Local Natural Hazard Mitigation Plan • January <strong>2011</strong>• Page 123
Hazard Goal Action Item<br />
Responsible Department /<br />
Board<br />
Benefits What Areas<br />
Primarily? Built (B),<br />
Natural (N), Population<br />
(P), Infrastructure (I)<br />
Potential Funding Source<br />
Estimated Completion<br />
Date<br />
Status<br />
SEVERE WINTER STORMS<br />
MANMADE HAZARDS<br />
To minimize the loss <strong>of</strong> life, damage to property, and the disruption <strong>of</strong> governmental services and general business activities due to severe winter storms.<br />
MEDIUM PRIORTY (4.0 – 5.0 Weighted Hazard Index)<br />
FLOODS<br />
Review and update the<br />
Subdivision Regulations.<br />
Special consideration<br />
should be given to<br />
requiring that new utilities<br />
be placed underground. Planning Department P, I Town Complete<br />
Research appropriate<br />
vulnerability assessment<br />
models for fixed facility<br />
and transportation<br />
<strong>hazard</strong>ous materials<br />
accidents, collect relevant<br />
data, and populate model<br />
to further prioritize<br />
manmade <strong>hazard</strong> action<br />
items.<br />
Develop an evacuation<br />
<strong>plan</strong> and notification<br />
system in the event <strong>of</strong> a<br />
chemical spill in a fixed<br />
structure or in a<br />
transportation setting such<br />
as Route 2 or the railroad.<br />
Seek technical assistance<br />
to ensure annual update <strong>of</strong><br />
Town <strong>of</strong> Greenfield CEM<br />
Plan.<br />
Emergency Management<br />
Director, Planning<br />
Department, FRCOG B, N, P, I FEMA 2013<br />
Emergency Management<br />
Director, Planning<br />
Department P FEMA 2013<br />
Emergency Management<br />
Director B, N, P, I FEMA<br />
This action will continue<br />
over the next 5 years.<br />
To minimize the loss <strong>of</strong> life, damage to property, and the disruption <strong>of</strong> governmental services and general business activities due to high winds associated with flooding.<br />
Make improvements to<br />
drainage and road on Glen<br />
Rd, essential for access to<br />
<strong>town</strong>‘s water supply<br />
reservoir.<br />
Department <strong>of</strong> Public<br />
Works B, N, P, I Grants, Town<br />
Dependent Upon<br />
Funding<br />
Revised Subdivision<br />
Regulations were<br />
adopted by the Planning<br />
Board on 11/21/08.<br />
New Action Item. Not<br />
yet started.<br />
New Action Item. Not<br />
yet started.<br />
New Action Item. Not<br />
yet started.<br />
New Action Item. Not<br />
yet started.<br />
Town <strong>of</strong> Greenfield Local Natural Hazard Mitigation Plan • January <strong>2011</strong>• Page 124
Hazard Goal Action Item<br />
Responsible Department /<br />
Board<br />
Benefits What Areas<br />
Primarily? Built (B),<br />
Natural (N), Population<br />
(P), Infrastructure (I)<br />
Potential Funding Source<br />
Fortify and flood pro<strong>of</strong><br />
the wastewater treatment<br />
<strong>plan</strong>t to 144 feet<br />
(currently at 140 feet)<br />
Department <strong>of</strong> Public<br />
Works B, N, P, I FEMA, MEMA, Town<br />
Replacement and<br />
rehabilitation <strong>of</strong> the<br />
existing Maple Brook<br />
Culvert in North and Department <strong>of</strong> Public<br />
Maple Streets.<br />
Works I Grant(s)<br />
Review and update the<br />
Floodplain District<br />
Overlay Zoning<br />
Ordinance. Special<br />
consideration should be<br />
given to further restricting<br />
or eliminating new<br />
development within the<br />
100-year floodplain. Planning Department B, N Town Spring 2012<br />
Estimated Completion<br />
Date<br />
Dependent Upon<br />
Funding – High Priority<br />
Dependent Upon<br />
Funding<br />
As appropriate, consider<br />
adding flood prevention<br />
and <strong>mitigation</strong> to the<br />
Purpose Section <strong>of</strong> the<br />
Land Use regulations<br />
reviewed in Section 4 and<br />
noted in Table 4-1 <strong>of</strong> this<br />
report. Planning Department B, P Town Spring 2012<br />
Review evacuation<br />
procedures for the flood<br />
prone areas in <strong>town</strong><br />
(identified on the map)<br />
and mapped dam failure<br />
Inundation Areas, and<br />
update, if necessary.<br />
Coordinate with state and<br />
regional agencies to<br />
identify a location(s) for<br />
the temporary storage <strong>of</strong><br />
contaminated and/or<br />
<strong>hazard</strong>ous flood debris.<br />
Support <strong>local</strong> and<br />
regional, watershed-wide<br />
open space protection<br />
Emergency Management<br />
Director, Police<br />
Department, Fire<br />
Department P Town 2013<br />
Department <strong>of</strong> Public<br />
Works, Planning<br />
Department, Franklin<br />
County LEPC N 2013<br />
Planning Department,<br />
Town Council<br />
N<br />
This action has been<br />
implemented and will<br />
continue over the next 5<br />
Status<br />
New Action Item. Not<br />
yet started.<br />
Not yet started.<br />
Not yet started. Still<br />
relevant.<br />
Not yet started. Still<br />
relevant.<br />
Not yet started. Still<br />
relevant.<br />
Not yet started. Still<br />
relevant.<br />
This action has been<br />
implemented and will<br />
continue over the next 5<br />
Town <strong>of</strong> Greenfield Local Natural Hazard Mitigation Plan • January <strong>2011</strong>• Page 125
TORNADOS<br />
Hazard Goal Action Item<br />
WILDFIRES /BRUSH FIRES<br />
efforts, particularly in<br />
floodplain areas.<br />
Responsible Department /<br />
Board<br />
Benefits What Areas<br />
Primarily? Built (B),<br />
Natural (N), Population<br />
(P), Infrastructure (I)<br />
Potential Funding Source<br />
Estimated Completion<br />
Date<br />
To minimize the loss <strong>of</strong> life, damage to property, infrastructure and natural resources, and the disruption <strong>of</strong> governmental services and general business activities due to tornados.<br />
See microburst-related<br />
Action Items above N/A N/A N/A N/A N/A<br />
To minimize the loss <strong>of</strong> life, damage to property, infrastructure and natural resources, and the disruption <strong>of</strong> governmental services and general business activities due to wildfires/brushfires.<br />
years.<br />
years.<br />
Status<br />
Encourage forest<br />
stewardship practices that<br />
produce more stable,<br />
successional forested<br />
landscapes and which<br />
reduce the risk <strong>of</strong> fire<br />
<strong>hazard</strong>s (such as the<br />
removal <strong>of</strong> slash).<br />
Conservation<br />
Commission, Planning<br />
Department, Fire<br />
Department<br />
N, P<br />
Educate homeowners<br />
about general fire safety<br />
when issuing burn<br />
permits. Fire Department N, P<br />
West Side Water<br />
Distribution Tank and 20-<br />
inch Main. This project<br />
would construct a 3.5<br />
million gallon water<br />
storage tank on the west<br />
side <strong>of</strong> <strong>town</strong> <strong>of</strong>f <strong>of</strong> Gorge<br />
Road and a 20-inch water<br />
transmission main to<br />
Main Street to address<br />
poor pressures and flows<br />
(especially critical for<br />
firefighting) as well as<br />
provide a backup for the<br />
Rocky Mountain Storage<br />
tank. This project has<br />
been identified as an<br />
infrastructure need since<br />
the 1970‘s.<br />
Department <strong>of</strong> Public<br />
Works I Grant(s)<br />
This action has been<br />
implemented and will<br />
continue over the next 5<br />
years.<br />
This action has been<br />
implemented and will<br />
continue over the next 5<br />
years.<br />
Dependent Upon<br />
Funding<br />
This action has been<br />
implemented and will<br />
continue over the next 5<br />
years.<br />
This action has been<br />
implemented and will<br />
continue over the next 5<br />
years.<br />
Not yet started.<br />
Town <strong>of</strong> Greenfield Local Natural Hazard Mitigation Plan • January <strong>2011</strong>• Page 126
EARTHQUAKES<br />
Hazard Goal Action Item<br />
LOW PRIORTY (< 4.0 Weighted Hazard Index)<br />
LANDSLIDES<br />
Responsible Department /<br />
Board<br />
Benefits What Areas<br />
Primarily? Built (B),<br />
Natural (N), Population<br />
(P), Infrastructure (I)<br />
Potential Funding Source<br />
Estimated Completion<br />
Date<br />
To minimize the loss <strong>of</strong> life, damage to property, infrastructure and natural resources, and the disruption <strong>of</strong> governmental services and general business activities due to earthquakes.<br />
Town Departmental<br />
Review <strong>of</strong> Critical<br />
Facilities: The Town<br />
should review its<br />
municipal buildings and<br />
structures to determine if<br />
they are particularly<br />
vulnerable to earthquake<br />
damage and determine if<br />
any retr<strong>of</strong>itting measures<br />
could mitigate this<br />
vulnerability.<br />
Emergency Management<br />
Director, Building<br />
Inspector, Department <strong>of</strong><br />
Public Works, Planning<br />
Department, Police<br />
Department B Town 2013<br />
Ensure Compliance with<br />
the Massachusetts State<br />
Building Code: The<br />
Building Inspector should<br />
ensure that all new<br />
construction complies<br />
with the appropriate<br />
seismic requirements <strong>of</strong><br />
the State Building Code. Building Inspector B Town<br />
This action has been<br />
implemented and will<br />
continue over the next 5<br />
years.<br />
To minimize the loss <strong>of</strong> life, damage to property, infrastructure and natural resources, and the disruption <strong>of</strong> governmental services and general business activities due to landslides.<br />
Town Departmental<br />
Review <strong>of</strong> Local Roads,<br />
State Highways and<br />
Interstates: The Town<br />
should review its roadway<br />
system to determine if<br />
they are particularly<br />
vulnerable to landslide<br />
damage and determine if<br />
any retr<strong>of</strong>itting measures<br />
<strong>of</strong> rock cuts could<br />
mitigate this vulnerability.<br />
Department <strong>of</strong> Public<br />
Works, Planning<br />
Department I Town 2014<br />
Status<br />
Not yet started. Still<br />
relevant.<br />
This action has been<br />
implemented and will<br />
continue over the next 5<br />
years.<br />
Not yet started. Still<br />
relevant.<br />
Town Departmental Conservation N Town 2014 Not yet started. Still<br />
Town <strong>of</strong> Greenfield Local Natural Hazard Mitigation Plan • January <strong>2011</strong>• Page 127
ICE JAMS<br />
Hazard Goal Action Item<br />
Review <strong>of</strong> River and<br />
Stream Embankments:<br />
The Conservation<br />
Commission should<br />
identify and report on<br />
unstable embankments.<br />
Responsible Department /<br />
Board<br />
Commission, Planning<br />
Department, Department<br />
<strong>of</strong> Public Works<br />
Benefits What Areas<br />
Primarily? Built (B),<br />
Natural (N), Population<br />
(P), Infrastructure (I)<br />
Potential Funding Source<br />
Estimated Completion<br />
Date<br />
To minimize the loss <strong>of</strong> life, damage to property, infrastructure and natural resources, and the disruption <strong>of</strong> governmental services and general business activities due to ice jams and associated flooding.<br />
relevant.<br />
Status<br />
DAM FAILURES<br />
See Floods section for<br />
related Action Items N/A N/A N/A N/A N/A<br />
To minimize the loss <strong>of</strong> life, damage to property, and the disruption <strong>of</strong> governmental services and general business activities due to dam failures.<br />
The Mill and Meridian<br />
Street Dams were<br />
identified by the<br />
Committee as possibly<br />
being in poor condition.<br />
Both should be inspected<br />
as soon as possible.<br />
The Town Engineer, the<br />
Department <strong>of</strong> Public<br />
Works and other relevant<br />
Town <strong>of</strong>ficials should<br />
review the dams, their<br />
inundation areas, and<br />
recent (if available)<br />
inspection reports to<br />
determine if any dams<br />
should be inspected or reinspected.<br />
Map Dams and<br />
Inundation Areas. The<br />
Town <strong>of</strong> Greenfield<br />
should prepare a GIS map<br />
that shows the location <strong>of</strong><br />
all dams in the <strong>town</strong> and<br />
immediately upstream <strong>of</strong><br />
the <strong>town</strong>‘s borders and the<br />
areas that are likely to be<br />
Department <strong>of</strong> Public<br />
Works, Planning<br />
Department, Town<br />
Engineer P, I Town<br />
Department <strong>of</strong> Public<br />
Works, Planning<br />
Department, Town<br />
Engineer P, I Grant(s)<br />
Emergency Management<br />
Director, Department <strong>of</strong><br />
Public Works, Planning<br />
Department P, I Grant(s)<br />
This item is ongoing and<br />
will continue over the<br />
next five years<br />
Dependent Upon<br />
Funding<br />
Dependent Upon<br />
Funding<br />
The Meridian Street<br />
Dam is on a yearly<br />
inspection schedule and<br />
the Mill Street Dam is<br />
on a 5-year inspection<br />
schedule.<br />
Not yet started. Still<br />
relevant.<br />
Not started – still<br />
relevant.<br />
Town <strong>of</strong> Greenfield Local Natural Hazard Mitigation Plan • January <strong>2011</strong>• Page 128
Hazard Goal Action Item<br />
flooded in the event <strong>of</strong> a<br />
dam failure. This map<br />
should include the<br />
Inundation Areas for the<br />
US GEN High Hazard<br />
dams on the Deerfield<br />
River. All public safety<br />
<strong>of</strong>ficials in the Town<br />
should be made aware <strong>of</strong><br />
the map.<br />
Incorporate Dam Safety<br />
into Development<br />
Review. The Planning<br />
Department, Planning<br />
Board, and Zoning Board<br />
<strong>of</strong> Appeals should consult<br />
the Dam and Inundation<br />
Areas map during their<br />
review <strong>of</strong> major<br />
development proposals,<br />
especially subdivisions. If<br />
there is a dam upstream <strong>of</strong><br />
a proposed development,<br />
the dam should be<br />
inspected prior to the start<br />
<strong>of</strong> construction to ensure<br />
that the dam is safe.<br />
Consider incorporating<br />
this requirement into the<br />
zoning Ordinance as a<br />
Dam Safety Overlay<br />
district.<br />
Identify locations for<br />
emergency shelters and<br />
evacuation routes for<br />
people who live in an<br />
Responsible Department /<br />
Board<br />
Benefits What Areas<br />
Primarily? Built (B),<br />
Natural (N), Population<br />
(P), Infrastructure (I)<br />
Department <strong>of</strong> Public<br />
Works, Planning<br />
Department, Planning<br />
Board, Zoning Board <strong>of</strong><br />
Appeals B, N, P, I Town<br />
Potential Funding Source<br />
Police Department, Fire<br />
Department, Planning<br />
Department P Town 2014<br />
Estimated Completion<br />
Date<br />
Dependent Upon the<br />
Preparation <strong>of</strong> a GIS<br />
Map with Dam<br />
Inundation Areas<br />
inundation area.<br />
See Floods section for<br />
additional Action Items N/A N/A N/A N/A N/A<br />
Status<br />
The Town will amend<br />
its Land Use<br />
Regulations by adding<br />
flood prevention and<br />
<strong>mitigation</strong> to the<br />
Purpose Section <strong>of</strong> the<br />
Land Use regulations<br />
reviewed in Section 4<br />
and noted in Table 4-1<br />
<strong>of</strong> this report.<br />
Not started – still<br />
relevant.<br />
Town <strong>of</strong> Greenfield Local Natural Hazard Mitigation Plan • January <strong>2011</strong>• Page 129
National Flood Insurance Program Compliance<br />
The U.S. Congress established the National Flood Insurance Program (NFIP) in 1968, with the<br />
passage <strong>of</strong> the National Flood Insurance Act <strong>of</strong> 1968. ―For decades, the national response to<br />
flood disasters was generally limited to constructing flood-control works such as dams, levees,<br />
seawalls, and the like, and providing disaster relief to flood victims. This approach did not<br />
reduce losses, nor did it discourage unwise development. In some instances, it may have actually<br />
encouraged additional development. To compound the problem, the public generally could not<br />
buy flood coverage from insurance companies, and building techniques to reduce flood damage<br />
were <strong>of</strong>ten overlooked.<br />
―In the face <strong>of</strong> mounting flood losses and escalating costs <strong>of</strong> disaster relief to the general<br />
taxpayers, the U.S. Congress created the NFIP. The intent was to reduce future flood damage<br />
through community floodplain management ordinances, and provide protection for property<br />
owners against potential losses through an insurance mechanism that requires a premium to be<br />
paid for the protection.‖ 40<br />
The State <strong>of</strong> Massachusetts, through its <strong>local</strong> communities, 41 complies with the NFIP in part by<br />
enforcing the Wetlands Protection Act (WPA), which helps restrict development in flood-prone<br />
areas, enforcing the State Building Code, which regulates building specifications and additional<br />
related zoning bylaws, such as a floodplain overlay district. At the <strong>local</strong> level, Greenfield‘s<br />
compliance with the NFIP is enforced through the building inspector and building code, the<br />
Conservation Commission and wetland and floodplain regulations, and the zoning bylaws and<br />
subdivision regulations related to flooding. While the <strong>local</strong> building code cannot be more<br />
restrictive than the state building code, the <strong>local</strong> Conservation Commission can restrict<br />
development above and beyond the requirements in the WPA. The ability <strong>of</strong> the Conservation<br />
Commission to further regulate development in flood prone areas could be a crucial tool in flood<br />
<strong>mitigation</strong>. In additional, the ability <strong>of</strong> the Select Board to adopt further bylaws such as a<br />
floodplain overlay district could also mitigate flooding.<br />
The Town <strong>of</strong> Greenfield participates in the National Flood Insurance Program. As <strong>of</strong> 2010, there<br />
were 48 policies in effect in Greenfield for a total <strong>of</strong> $10,284,700 worth <strong>of</strong> insurance. FEMA has<br />
not identified any repetitive flood loss structures in the Town <strong>of</strong> Greenfield. The Town is not a<br />
member <strong>of</strong> the Community Rating System, which entitles policyholders to a discount on flood<br />
insurance premiums. The CRS ranking is based on the steps the <strong>town</strong> has taken to control flood<br />
losses. See following pages for more information on NFIP.<br />
NFIP Community Rating System (CRS) 42<br />
The <strong>town</strong> is not a member <strong>of</strong> the NFIP Community Rating System, which entitles policyholders<br />
to a discount on flood insurance premiums. The Community Rating System is a part <strong>of</strong> NFIP<br />
and provides incentives and tools to further these goals. The goals <strong>of</strong> the CRS are to recognize,<br />
40 http://www.fema.gov/library/viewRecord.do?id=1404<br />
41 Massachusetts is a Home Rule state, the <strong>local</strong> communities have significant power and authority to implement state regulations<br />
and many <strong>town</strong>s adopt their own wetland and floodplain regulations that are more stringent than state requirements.<br />
42 http://training.fema.gov/EMIWeb/CRS/<br />
Town <strong>of</strong> Greenfield Local Natural Hazard Mitigation Plan • January <strong>2011</strong>• Page 130
encourage, and reward, by the use <strong>of</strong> flood insurance premium adjustments, community and state<br />
activities beyond the minimum required by the NFIP that:<br />
Reduce flood damage to insurable property,<br />
Strengthen and support the insurance aspects <strong>of</strong> the NFIP, and<br />
Encourage a comprehensive approach to floodplain management.<br />
The Community Rating System reduces flood insurance premiums to reflect what a community<br />
does above and beyond the National Flood Insurance Program‘s (NFIP) minimum standards for<br />
floodplain regulation. The objective <strong>of</strong> the CRS is to reward communities for what they are<br />
doing, as well as to provide an incentive for new flood protection activities. It provides lower<br />
insurance premiums under the National Flood Insurance Program. The premium reduction is in<br />
the form <strong>of</strong> a CRS Class, similar to the classifications used for fire insurance. For example, a<br />
Class 1 provides a 45% premium reduction while a Class 10 provides no reduction. The CRS<br />
Class is based on the floodplain management activities a community implements. In many cases,<br />
these are activities already implemented by the community, the state, or a regional agency. The<br />
more activities implemented, the better the CRS class.<br />
Benefits <strong>of</strong> participating in the Community Rating System:<br />
Money stays in the community instead <strong>of</strong> being spent on insurance premiums.<br />
Every time residents pay their insurance premiums, they are reminded that the<br />
community is working to protect them from flood losses, even during dry years.<br />
The activities credited by the CRS provide direct benefits to the community, including:<br />
o Enhanced public safety,<br />
o Reduction in damage to property and public infrastructure,<br />
o Avoidance <strong>of</strong> economic disruption and losses,<br />
o Reduction <strong>of</strong> human suffering, and<br />
o Protection <strong>of</strong> the environment.<br />
Local flood programs will be better organized and more formal.<br />
The community can evaluate the effectiveness <strong>of</strong> its flood program against a nationally<br />
recognized benchmark.<br />
Technical assistance in designing and implementing some activities is available at no<br />
charge.<br />
The community will have an added incentive to maintain its flood programs over the<br />
years.<br />
The public information activities will build a knowledgeable constituency interested in<br />
supporting and improving flood protection measures.<br />
Costs to the <strong>local</strong> government to participate in the Community Rating System:<br />
The community must designate a CRS Coordinator who prepares the application papers<br />
and works with FEMA and the Insurance Services Office (ISO) during the verification<br />
visit.<br />
Each year the community must recertify that it is continuing to implement its activities. It<br />
must provide copies <strong>of</strong> relevant materials (e.g., permit records).<br />
The community must maintaining elevation certificates, permit records, and old Flood<br />
Insurance Rate Maps forever.<br />
Town <strong>of</strong> Greenfield Local Natural Hazard Mitigation Plan • January <strong>2011</strong>• Page 131
The community must maintain other records <strong>of</strong> its activities for five years, or until the<br />
next ISO verification visit, whichever comes sooner.<br />
Community Rating System Process<br />
One <strong>of</strong> the actions that Greenfield can take to improve their CRS rating (and subsequently lower<br />
their premiums) is to develop a CRS <strong>plan</strong>. The CRS 10-step <strong>plan</strong>ning process provides additional<br />
points for activities that communities can take during their <strong>plan</strong>ning process that go above the<br />
minimum described below, thus possibly lowering insurance rates. At a minimum, an approved<br />
<strong>multi</strong>-<strong>hazard</strong> <strong>mitigation</strong> <strong>plan</strong> that addresses floods could qualify for CRS credit. Although<br />
communities are not required to participate in CRS in order to receive approval <strong>of</strong> a Local Multi-<br />
Hazard Mitigation Plan, FEMA encourages jurisdictions to integrate the CRS <strong>plan</strong>ning steps into<br />
their <strong>multi</strong>-<strong>hazard</strong> <strong>mitigation</strong> <strong>plan</strong>s.<br />
Credit is provided for preparing, adopting, implementing, evaluating, and updating a<br />
comprehensive floodplain management <strong>plan</strong> or repetitive loss area analyses. The Community<br />
Rating System does not specify what must be in a <strong>plan</strong>, but it only credits <strong>plan</strong>s that have been<br />
prepared and kept updated according to CRS standard <strong>plan</strong>ning process. Credit is also provided<br />
for implementing a habitat conservation <strong>plan</strong>.<br />
Community Rating System Credit Points 43<br />
A total <strong>of</strong> up to 359 points are provided for three elements. Up to 294 points are provided for<br />
adopting and implementing a floodplain management <strong>plan</strong> (FMP) that was developed using the<br />
following standard <strong>plan</strong>ning process. There must be some credit for each <strong>of</strong> the 10 <strong>plan</strong>ning steps<br />
(Table 4-11).<br />
Table 4-11: CRSC Standard Planning Process Steps<br />
Step<br />
Maximum Points<br />
1. Organize to prepare the <strong>plan</strong> 10<br />
2. Involve the public 85<br />
3. Coordinate with other agencies 25<br />
4. Assess the <strong>hazard</strong> 20<br />
5. Assess the problem 35<br />
6. Set goals 2<br />
7. Review possible activities 30<br />
8. Draft an action <strong>plan</strong> 70<br />
9. Adopt the <strong>plan</strong> 2<br />
10. Implement, evaluate, and revise 15<br />
Up to 50 additional points are provided for conducting repetitive loss area analyses (RLAA) and<br />
up to additional 15 points are provided for adopting and implementing a Habitat Conservation<br />
Plan (HCP).<br />
43 FEMA Local Multi-Hazard Mitigation Planning Guidance, July 1, 2008.<br />
Town <strong>of</strong> Greenfield Local Natural Hazard Mitigation Plan • January <strong>2011</strong>• Page 132
More information is available at http://www.fema.gov/business/nfip/crs.shtm. A copy <strong>of</strong> the<br />
―Local Official‘s Guide to Saving Lives, Preventing Property Damage, and Reducing the Cost <strong>of</strong><br />
Flood Insurance‖ is including in the Appendix <strong>of</strong> this <strong>plan</strong> or can be downloaded at<br />
http://www.fema.gov/library.<br />
Town <strong>of</strong> Greenfield Local Natural Hazard Mitigation Plan • January <strong>2011</strong>• Page 133
5 – PLAN ADOPTION AND MAINTENANCE<br />
Plan Adoption<br />
The Franklin Regional Council <strong>of</strong> Governments (FRCOG) provided support to the Greenfield<br />
Local Multi-Hazard Mitigation Planning Committee as they underwent the <strong>plan</strong>ning process.<br />
Town <strong>of</strong>ficials such as the Planning Department Director and Emergency Management Director<br />
were invaluable resources to the FRCOG and provided background and policy information and<br />
municipal documents, which were crucial to facilitating completion <strong>of</strong> the <strong>plan</strong>.<br />
When the preliminary draft <strong>of</strong> the Local Multi-Hazard Mitigation Plan was completed, copies<br />
were disseminated to the Greenfield Local Multi-Hazard Mitigation Planning Committee for<br />
comment and approval. The Committee was comprised <strong>of</strong> representatives <strong>of</strong> Town boards and<br />
departments who bear the responsibility for implementing the action items and recommendations<br />
<strong>of</strong> the completed <strong>plan</strong>.<br />
Copies <strong>of</strong> the Final Draft Local Multi-Hazard Mitigation Plan for the Town <strong>of</strong> Greenfield were<br />
distributed to the Town boards and to Northfield Mountain Facility for their review and<br />
comment. A copy <strong>of</strong> the <strong>plan</strong> was also available at the Planning Department for public review.<br />
Once reviewed and approved by MEMA, the <strong>plan</strong> was sent to the Federal Emergency<br />
Management Agency (FEMA) for their approval. On _____, the Select Board voted to adopt the<br />
<strong>plan</strong>.<br />
The implementation <strong>of</strong> the Greenfield Local Multi-Hazard Mitigation Plan will begin following<br />
its approval by MEMA and FEMA and formal adoption by the Greenfield Select Board.<br />
Specific Town departments and boards will be responsible for ensuring the development <strong>of</strong><br />
policies, bylaw revisions, and programs as described in Table 4-9: <strong>2011</strong> Greenfield Local Multi-<br />
Hazard Mitigation Prioritized Action Plan. The Greenfield Multi-Hazard Mitigation Planning<br />
Committee will oversee the implementation <strong>of</strong> the <strong>plan</strong>.<br />
Monitoring, Evaluating, and Updating the Plan<br />
The measure <strong>of</strong> success <strong>of</strong> the Greenfield Local Multi-Hazard Mitigation Plan will be the<br />
number <strong>of</strong> identified <strong>mitigation</strong> strategies implemented. In order for the Town to become more<br />
disaster resilient and better equipped to respond to natural disasters, there must be a coordinated<br />
effort between elected <strong>of</strong>ficials, appointed bodies, Town employees, regional and state agencies<br />
involved in disaster <strong>mitigation</strong>, and the general public.<br />
The Greenfield Multi-Hazard Planning Committee will meet on an annual basis or as needed<br />
(i.e., following a natural disaster) to monitor the progress <strong>of</strong> implementation, evaluate the<br />
success or failure <strong>of</strong> implemented recommendations, and brainstorm for strategies to remove<br />
obstacles to implementation. Following these discussions, it is anticipated that the committee<br />
may decide to reassign the roles and responsibilities for implementing <strong>mitigation</strong> strategies to<br />
different Town departments and/or revise the goals and objectives contained in the <strong>plan</strong>. At a<br />
minimum, the committee will review and update the <strong>plan</strong> every five years, beginning in the fall<br />
Town <strong>of</strong> Greenfield Local Natural Hazard Mitigation Plan • January <strong>2011</strong>• Page 134
<strong>of</strong> 2014. The meetings <strong>of</strong> the committee will be organized and facilitated by the staff <strong>of</strong> the<br />
Greenfield Town Administrator. Increasing committee membership to include entities such as<br />
the Planning Board and the Conservation Commission could help improve the completion rate <strong>of</strong><br />
action items.<br />
As is the case with many Franklin County <strong>town</strong>s, Greenfield‘s government relies on few public<br />
servants filling many roles, upon citizen volunteers and upon limited budgets. As such,<br />
implementation <strong>of</strong> the recommendations <strong>of</strong> this <strong>plan</strong> could be a challenge to the Committee. As<br />
the Committee meets regularly to assess progress, it should strive to identify shortfalls in staffing<br />
and funding and other issues which may hinder Plan implementation. The Committee should<br />
seek technical assistance from the Franklin Regional Council <strong>of</strong> Governments to help alleviate<br />
some <strong>of</strong> the staffing shortfalls. The Committee could also seek assistance and funding from such<br />
sources as are listed in Table 5-1.<br />
Table 5-1: Potential Funding Sources for Hazard Mitigation Plan Implementation<br />
Funding<br />
Estimated Annual<br />
Description<br />
Source<br />
Funding<br />
Hazard<br />
Mitigation<br />
Grant Program<br />
Provides post-disaster funds to communities to help implement<br />
long-term <strong>hazard</strong> <strong>mitigation</strong> strategies.<br />
$15M (from three past<br />
Presidential disaster<br />
declarations)<br />
Flood<br />
Mitigation<br />
Assistance<br />
Program<br />
Community<br />
Development<br />
Block Grant<br />
SBA<br />
Small Business<br />
Administration<br />
State Office for<br />
Mitigation<br />
Funding<br />
Manufactured<br />
Homebuilders<br />
Association<br />
National<br />
Association <strong>of</strong><br />
Homebuilders<br />
Provides pre-disaster funds. There are three types <strong>of</strong> grants:<br />
<strong>plan</strong>ning grants, project grants, and technical assistance grants.<br />
Requires a 25% non-Federal match and is based on the total<br />
number <strong>of</strong> NFIP policies in the State.<br />
Although this funding comes from HUD, it is made available to<br />
communities through the State Economic and Community<br />
Development Administration. The grants are used to expand<br />
affordable housing and economic opportunities, and to revitalize<br />
communities by improving community facilities and services.<br />
Post-disaster low interest, long-term loans given to homeowners,<br />
renters, businesses, or private non-pr<strong>of</strong>it organizations. Up to 20%<br />
<strong>of</strong> the loan amount can be used for <strong>hazard</strong> <strong>mitigation</strong> actions.<br />
This newly created State Office was authorized by a recent act <strong>of</strong><br />
the State Legislature. This Office will make funds available to<br />
<strong>local</strong> communities for <strong>hazard</strong> <strong>mitigation</strong> <strong>plan</strong>ning through an<br />
increase in the State‘s gasoline tax.<br />
The State is interested in forming an agreement with this<br />
association to develop an earthquake-resistant homes campaign.<br />
The State is pursuing a relationship with this association and is<br />
discussing how the association can assist the State in promoting<br />
construction <strong>of</strong> safe rooms.<br />
$500,000<br />
$2M<br />
$500,000 (based<br />
on past disasters)<br />
$5M<br />
In-kind services<br />
In-kind services<br />
Incorporating the Plan into Existing Planning Mechanisms<br />
Upon approval <strong>of</strong> the Greenfield Local Hazards Mitigation Plan by FEMA, the Committee will<br />
provide all interested parties and implementing departments with a copy <strong>of</strong> the <strong>plan</strong>, with<br />
emphasis on Table 4-9: <strong>2011</strong> Greenfield Local Multi-Hazard Mitigation Prioritized Action Plan.<br />
The committee should also consider initiating a discussion with each department on how the <strong>plan</strong><br />
can be integrated into that department‘s ongoing work. At a minimum, the <strong>plan</strong> should be<br />
distributed to and reviewed with the following entities:<br />
Town <strong>of</strong> Greenfield Local Natural Hazard Mitigation Plan • January <strong>2011</strong>• Page 135
a. Fire Department<br />
b. Emergency Management Director<br />
c. Police Department<br />
d. Public Works / Highway Department<br />
e. Planning Board<br />
f. Zoning Board <strong>of</strong> Appeals<br />
g. Conservation Commission<br />
h. Franklin County Regional Emergency Planning Committee<br />
i. Building Inspector<br />
j. Select Board<br />
k. Board <strong>of</strong> Health<br />
Incorporating the Greenfield Local Multi-Hazard Mitigation Plan into existing and future<br />
<strong>plan</strong>ning mechanisms could help ensure its success and implementation. Some possible <strong>plan</strong>ning<br />
mechanisms could include:<br />
Incorporation <strong>of</strong> relevant Hazards Mitigation information into the Open Space and<br />
Recreation Plan. There are opportunities to discuss findings <strong>of</strong> the <strong>hazard</strong> <strong>mitigation</strong> <strong>plan</strong><br />
and incorporate them into Environmental Inventory and Analysis section <strong>of</strong> the OSRP<br />
and to include appropriate action items from the <strong>hazard</strong> <strong>mitigation</strong> <strong>plan</strong> in the OSRP<br />
Action Plan.<br />
When the Final Draft Local Multi-Hazard Mitigation Plan for the Town <strong>of</strong> Greenfield is<br />
distributed to the Town boards for their review, a letter asking each board to endorse any<br />
action item that lists that board as a responsible party would help to encourage<br />
completion <strong>of</strong> action items.<br />
The Planning Board could include discussions <strong>of</strong> the Hazards Mitigation Plan Action<br />
Items in one meeting annually and assess progress.<br />
Town <strong>of</strong> Greenfield Local Natural Hazard Mitigation Plan • January <strong>2011</strong>• Page 136
6 – APPENDICES<br />
Appendix A: Zoning Bylaws and Subdivision Regulations<br />
Zoning Bylaws (Excerpts)<br />
Floodplain Zoning Ordinance: Section 200-4.1:<br />
Floodplain Overlay district. Greenfield‘s Zoning Ordinance, last amended October 20, 2010<br />
establishes a Floodplain Overlay District (Section 200-4.13) for ―the purposes <strong>of</strong> protecting the<br />
public health, safety, and general welfare, to protect human life and property from the <strong>hazard</strong>s <strong>of</strong><br />
periodic flooding, to reduce the public costs resulting from flood damage, to preserve the natural<br />
flood control characteristics and the flood storage capacity <strong>of</strong> the floodplain, and to preserve and<br />
maintain the groundwater table and ground water recharge areas within the floodplain.‖<br />
Specifically, the Ordinance requires that:<br />
Permitted Uses (Section 200-4.13.E) in the Floodplain Overlay District include the following<br />
uses with low flood damage potential and causing no obstructions to flood flows shall be<br />
allowed in the 100-year floodplain provided they are permitted in the underlying district and they<br />
do not require structures, fill, or storage <strong>of</strong> materials or equipment:<br />
1. Agricultural uses such as farming, grazing, truck farming, horticulture, etc;<br />
2. Forestry and nursery uses;<br />
3. Outdoor recreational uses, including fishing, boating, play areas, etc;<br />
4. Conservation <strong>of</strong> water, <strong>plan</strong>ts, wildlife;<br />
5. Wildlife management areas, foot, bicycle, and horse paths;<br />
6. Temporary nonresidential structures used in connection with fishing, growing,<br />
harvesting, storage, or sale <strong>of</strong> crops raised on the premises;<br />
7. Buildings lawfully existing prior to the adoption <strong>of</strong> these provisions;<br />
8. Installation <strong>of</strong> utility, sewer or septic systems, water supplies and production, and water<br />
lines provided the Department <strong>of</strong> Public Works is satisfied that there is adequate<br />
protection against breaking, leaking, short-circuiting, grounding, igniting, or floating<br />
during flooding;<br />
9. The portion <strong>of</strong> any lot within the Floodplain District may be used to meet the lot area or<br />
yard requirements for the district in which the remainder <strong>of</strong> the lot is located.<br />
The following are uses in the Floodplain Overlay District requiring Special Permits (Section<br />
200-4.13.F). No encroachment shall be permitted within the 100-year floodplain as shown on the<br />
FIRM Maps unless a special permit is granted by the Zoning Board <strong>of</strong> Appeals. Encroachment<br />
shall include:<br />
1. Structures or buildings erected, constructed, or otherwise created or moved;<br />
2. Reconstruction or repair due to flood damage and improvement or expansion <strong>of</strong> any<br />
building or structure lawfully existing prior to the adoption <strong>of</strong> these provisions;<br />
3. Storage, dumping, filling, excavation, disposal or transfer <strong>of</strong> earth or other material;<br />
Town <strong>of</strong> Greenfield Local Natural Hazard Mitigation Plan • January <strong>2011</strong>• Page 137
4. Installation <strong>of</strong> driveways or roads to serve areas outside the floodplain district where<br />
other access is not feasible.<br />
The following are uses in the Floodplain Overlay District that are Prohibited (Section 200-<br />
4.13.I). No encroachment shall be permitted in the floodway as shown on the FBFM Maps, and<br />
the following uses are prohibited in the 100-year floodplain:<br />
Solid waste landfills, junkyards, dumps;<br />
1. The manufacture, storage, or disposal <strong>of</strong> <strong>hazard</strong>ous, toxic, or radioactive wastes;<br />
2. The temporary or permanent storage or disposal <strong>of</strong> materials used in snow and ice control<br />
including sand, salt or other deicing chemicals;<br />
3. The outdoor storage or placement <strong>of</strong> storage tanks, above or below ground, for petroleum<br />
products or other <strong>hazard</strong>ous material;<br />
4. The storage, dumping, filling, dredging, excavation, disposal, transfer, or removal <strong>of</strong><br />
earth or other material except as permitted by special permit under this provision.<br />
Performance Standards Section 6.8<br />
The purpose <strong>of</strong> the Zoning Ordinance Performance Standards, amended in July <strong>of</strong> 2009, is ―to<br />
ensure that any use allowed by right or special permit in any district is conducted in a manner<br />
which does not adversely affect the surrounding natural or human environment by creating a<br />
dangerous, injurious or objectionable condition.‖ One <strong>of</strong> the standards (6.8.8 A) directly<br />
addresses the impacts <strong>of</strong> uncontrolled surface water run<strong>of</strong>f and sedimentation as follows:<br />
Whenever the existing contours <strong>of</strong> the land are altered; grading, site design, and<br />
construction shall be designed to prevent soil erosion, sedimentation, uncontrolled<br />
surface water run<strong>of</strong>f or alteration <strong>of</strong> run<strong>of</strong>f to or from abutting properties. The primary<br />
reasons for having erosion and sedimentation control measures in place are to:<br />
o Prevent topsoil from migrating <strong>of</strong>f a construction site,<br />
o Protect the Town‘s streets and storm water systems,<br />
o Protect adjacent property from siltation, and<br />
o Protect fish and other wildlife from siltation <strong>of</strong> ponds, lakes, streams and rivers.<br />
Procedure:<br />
o These standards shall pertain to all building sites under new construction or<br />
redevelopment. The applicant shall submit an erosion and sedimentation control<br />
<strong>plan</strong> to the Inspector <strong>of</strong> Buildings for approval. If Site Plan Review and Approval<br />
is required under the Greenfield Zoning Ordinance, an erosion and sedimentation<br />
control <strong>plan</strong> shall be submitted to the reviewing authority along with all other<br />
submittal requirements.<br />
o The Inspector <strong>of</strong> Buildings or any <strong>of</strong> his designees shall conduct a site visit to<br />
ensure that all temporary erosion and sedimentation control measures required<br />
under this policy are properly installed prior to and maintained throughout<br />
construction. Failure to comply with these standards may result in a stop work<br />
order or the revocation <strong>of</strong> permits.<br />
o Erosion <strong>of</strong> soil and sedimentation shall be minimized by using the following<br />
erosion control standards, which are in addition to any erosion control measures<br />
required by the Greenfield Conservation Commission as part <strong>of</strong> the issuance <strong>of</strong> a<br />
Town <strong>of</strong> Greenfield Local Natural Hazard Mitigation Plan • January <strong>2011</strong>• Page 138
wetland related permit (Negative Determination <strong>of</strong> Applicability with Conditions<br />
or an Order <strong>of</strong> Conditions).<br />
o Temporary erosion control measures shall be installed for the following:<br />
• All construction areas that slope toward the road or an abutting property<br />
shall require a properly installed siltation fence and/or baled hay barrier to<br />
prevent siltation <strong>of</strong> the roadway or neighboring property.<br />
• All wetland areas shall be protected by a properly installed siltation<br />
barrier. Work that occurs in or within 100 feet <strong>of</strong> a wetland resource area<br />
or within 200 feet <strong>of</strong> a perennial river or stream requires filing with the<br />
Greenfield Conservation Commission. In areas outside the jurisdiction <strong>of</strong><br />
the Conservation Commission but where the ground slopes toward a<br />
wetland area, a properly installed siltation fence and/or baled hay barrier<br />
shall be required.<br />
• Stockpiles <strong>of</strong> loam shall be protected by a siltation fence and/or baled hay<br />
barrier. Stockpiles that remain on site for longer than 30 days shall also be<br />
seeded to prevent erosion. These measures shall remain until all material<br />
has been placed or disposed <strong>of</strong>f site.<br />
• The smallest practical area <strong>of</strong> land shall be disturbed at any one time.<br />
• The duration <strong>of</strong> exposure <strong>of</strong> disturbed areas due to stripping <strong>of</strong> vegetation,<br />
soil removal, and regarding shall be kept to a minimum.<br />
• Baled hay barriers and siltation fencing are to be maintained and cleaned<br />
until all slopes have a healthy stand <strong>of</strong> grass or other approved vegetation.<br />
• Baled hay and mulch shall be mowings <strong>of</strong> acceptable herbaceous growth,<br />
free from noxious weeds or woody stems. No salt hay shall be used.<br />
• All disturbed areas shall be loamed and seeded with grass or other<br />
approved vegetation.<br />
• After all disturbed areas have been stabilized, the temporary erosion<br />
control measures are to be removed. Disturbed areas resulting from<br />
removal <strong>of</strong> the temporary erosion control measures shall be repaired and<br />
seeded.<br />
• A temporary mud tracking bed (construction entrance) shall be put in<br />
place at each site entrance where necessary. This tracking bed shall consist<br />
<strong>of</strong> a four (4) inch minimum layer <strong>of</strong> 1 ¾ inch crushed stone and shall be a<br />
minimum <strong>of</strong> twenty (20) feet in length and fifteen (15) feet in width. This<br />
bed shall be maintained during construction to prevent tracking or flowing<br />
<strong>of</strong> sediment onto the public right-<strong>of</strong>-way and shall be removed prior to the<br />
placement <strong>of</strong> a gravel base and pavement.<br />
• It shall be the responsibility <strong>of</strong> the contractor to control blowing dust and<br />
soil. Dust control shall be used during grading operations if the grading is<br />
to occur within five hundred (500) feet <strong>of</strong> an occupied residence or place<br />
<strong>of</strong> business and may consist <strong>of</strong> grading fine soils on calm days only or<br />
dampening the ground with water.<br />
• Permanent erosion control and vegetative measures shall be in accordance<br />
with the Erosion and Sediment Control and Vegetative Practices in Site<br />
Development Guides published by the U.S. Department <strong>of</strong> Agriculture,<br />
Natural Resources Conservation Service.<br />
Town <strong>of</strong> Greenfield Local Natural Hazard Mitigation Plan • January <strong>2011</strong>• Page 139
• The construction <strong>of</strong> roads or structures on slopes <strong>of</strong> fifteen (15) percent or<br />
greater shall require a special permit from the Planning Board. Such<br />
permit shall only be granted if the Board finds that adequate provisions<br />
have been made to protect against soil erosion and sedimentation, soil<br />
instability and uncontrolled surface water run<strong>of</strong>f.<br />
Open Space/Cluster Developments Section 200-7.1<br />
The Zoning Ordinance Open Space/Cluster Developments Part A, amended in May <strong>of</strong> 2007 lists<br />
as its purpose in part the following:<br />
Promotes a more efficient use <strong>of</strong> land in harmony with its natural features<br />
Encourages a less sprawling form <strong>of</strong> development that consumes less open land<br />
Encourages the permanent preservation <strong>of</strong> open space, agricultural lands and other<br />
natural resources<br />
This type <strong>of</strong> residential development can preserve larger areas <strong>of</strong> undeveloped land which in turn<br />
could reduce the impacts <strong>of</strong> stormwater run<strong>of</strong>f. The Common Open Space Requirements<br />
(Section 200-7.1 H) require that preserved open space shall be at least twenty-five (25) percent<br />
<strong>of</strong> the total land area <strong>of</strong> the tract not including wetlands, floodplains and slopes in excess <strong>of</strong><br />
twenty-five (25) percent. In addition, ―[a]t least one-half (1/2) <strong>of</strong> the open space shall be shaped<br />
for land uses such as recreation and agriculture.‖<br />
Earth Removal, Section 200-7.4<br />
Any removal <strong>of</strong> earth products shall be undertaken only in accordance with the Soil Removal<br />
regulations (Chapter 154 <strong>of</strong> the Town <strong>of</strong> Greenfield Code) require that a license be issued by the<br />
Greenfield Selectmen prior to the removal <strong>of</strong> soil, loam, sand or gravel from land not in public<br />
use except in conjunction with construction <strong>of</strong> a building, landscaping activities, or the continued<br />
operation <strong>of</strong> an existing sand and gravel pit. The Soil Removal regulations do not mention flood<br />
prevention or <strong>mitigation</strong>.<br />
Major Development Review, Section 200-7.12<br />
According to this section, amended in May 2006, the purpose <strong>of</strong> this ordinance is to identify and<br />
attempt to mitigate potential negative impacts to the City <strong>of</strong> Greenfield, such as to Town<br />
services, traffic patterns, the environment, abutting properties, or the public health and safety,<br />
caused directly or indirectly by major development.<br />
Site Plan Review and Approval (Section 200-8.4)<br />
The Site Plan Review and Approval section <strong>of</strong> the Greenfield Zoning Ordinance specifically<br />
mentions flooding and requires mitigating potential impacts from flooding. The purpose <strong>of</strong> the<br />
Site Plan Review and Approval section <strong>of</strong> the Greenfield Zoning Ordinance is to ensure that new<br />
development reasonably protects the visual, environmental and aesthetic qualities <strong>of</strong> the<br />
neighborhood and the Town. Site <strong>plan</strong> review and approval is required for all uses that require a<br />
Special Permit, any business, commercial, industrial or institutional use (except certain home<br />
occupations) and any site containing more than one (1) principal use. The applicant must submit<br />
information regarding the measures to:<br />
Town <strong>of</strong> Greenfield Local Natural Hazard Mitigation Plan • January <strong>2011</strong>• Page 140
Prevent pollution <strong>of</strong> surface and groundwater, increased run<strong>of</strong>f, changes in groundwater<br />
levels, and flooding.<br />
Control measures to prevent erosion and sedimentation during and after construction and<br />
the sequence <strong>of</strong> grading and construction activities, location <strong>of</strong> temporary control<br />
measures, and final stabilization <strong>of</strong> the site.<br />
Approval guidelines that the Planning Board uses include:<br />
Provision for integrating the project into the existing terrain and surrounding landscape<br />
by minimizing use <strong>of</strong> wetlands, steep slopes, and hilltops; protecting visual amenities and<br />
scenic views; preserving unique natural or historical features; minimizing tree, vegetation<br />
and soil removal; and minimizing grade changes;<br />
Provisions for surface run<strong>of</strong>f and drainage which protects the site and adjacent properties<br />
from erosion, maximizes groundwater recharge, and prevents the collection <strong>of</strong> surface<br />
run<strong>of</strong>f on paved surfaces which may obstruct pedestrian or vehicular flow;<br />
Measures to prevent pollution <strong>of</strong> surface or groundwater, and to prevent increased<br />
flooding;<br />
Section 200-7.14 <strong>of</strong> the Greenfield Zoning Ordinance regulates wireless communications<br />
facilities. The Ordinance does not mention safety as one <strong>of</strong> the purposes <strong>of</strong> the Ordinance.<br />
However, the Ordinance does require a special permit from the Zoning Board <strong>of</strong> Appeals and a<br />
building permit from the Inspector <strong>of</strong> Buildings before a facility can be erected and the applicant<br />
must provide <strong>plan</strong>s for anchoring and supporting the structure. The Ordinance also establishes a<br />
―fall zone‖ for the structure in relation to property lines and road right-<strong>of</strong>-ways. The Ordinance<br />
does not prohibit the construction <strong>of</strong> wireless communications facilities within flood-prone areas.<br />
Subdivision Rules and Regulations (Excerpts)<br />
Greenfield‘s Subdivision Rules and Regulations (Chapter 880) were adopted on May 29, 1984 –<br />
and subsequently amended on November 21, 2008 – for the purpose <strong>of</strong> ―protecting the safety,<br />
convenience and welfare <strong>of</strong> the inhabitants <strong>of</strong> Greenfield by regulating the laying out and<br />
construction <strong>of</strong> ways in subdivisions providing access to the several lots therein, but which have<br />
not become public ways, and ensuring sanitary conditions in the subdivisions and, in proper<br />
cases, parks and open areas.‖ The Planning Board and Board <strong>of</strong> Appeals shall exercise their<br />
powers to secure the safety <strong>of</strong> residents in the case <strong>of</strong> fire, flood, panic and other emergencies<br />
and to ensure adequate drainage for the subdivision.<br />
The Subdivision Rules and Regulations contain several provisions that mitigate the potential for<br />
flooding, including:<br />
Section 880-9.B Definitive Plan Submission Requirements requires the proponent to:<br />
o Proposed layout (including cross sections and pr<strong>of</strong>iles) <strong>of</strong> sewerage, storm drainage<br />
and water supply, including invert elevations, slopes, capacity, and velocity.<br />
o Indication <strong>of</strong> all areas believed to be subject to control under the Wetlands Protection<br />
Act, MGL c. 131, § 40, under procedures outlined at 310 CMR 10.00.<br />
Town <strong>of</strong> Greenfield Local Natural Hazard Mitigation Plan • January <strong>2011</strong>• Page 141
o Stormwater management <strong>plan</strong> in compliance with the provisions <strong>of</strong> Chapter 695 <strong>of</strong><br />
the Greenfield Code<br />
o An erosion control <strong>plan</strong>, indicating the erosion control measures to be employed,<br />
including description <strong>of</strong> locations <strong>of</strong> temporary stockpiles, spoil areas, temporary<br />
drainage systems, slope stabilization techniques, sediment basins, etc., and narrative<br />
description <strong>of</strong> how erosion from individual lots onto streets and into drainage systems<br />
is proposed to be controlled. Review comments on the <strong>plan</strong> by the Conservation<br />
Commission and by the Soil Conservation Service or by others acceptable to the<br />
Board as expert in soil erosion. Any site disturbing more than one (1) acre must have<br />
a detailed Storm Water Pollution Prevention Plan (SWPPP) and an Erosion Control<br />
Plan submitted to and approved by the EPA or its designee in accordance with EPA‘s<br />
NPDES Phase II regulations.<br />
Section 880-9.E Wetlands Protection Act.<br />
o (1) In accordance with MGL c. 131, § 40, no person shall remove, fill, dredge or alter<br />
any bank, beach, dune, flat, marsh, meadow or swamp bordering on any existing<br />
creek, river, stream, pond, lake or any land under said waters or subject to flooding<br />
without filing a written notice <strong>of</strong> intention to perform said work with the <strong>local</strong><br />
Conservation Commission and the Department <strong>of</strong> Environmental Protection.<br />
o (2) In order to determine if the proposed subdivision, or parts there<strong>of</strong>, are subject to<br />
the provisions <strong>of</strong> the Wetlands Protection Act, the Planning Board will, where it<br />
deems necessary, submit a copy <strong>of</strong> the definitive <strong>plan</strong> to the Conservation<br />
Commission. The Conservation Commission shall, to the extent practicable, file a<br />
report with the Planning Board not later than forty-five (45) days after receipt <strong>of</strong> the<br />
<strong>plan</strong> stating that the proposed <strong>plan</strong>s are not subject to the provisions <strong>of</strong> the Wetlands<br />
Protection Act, or the Wetlands Protection Act applies to certain designated areas. In<br />
the event the <strong>plan</strong> shall be governed by said Act, the Planning Board shall include in<br />
its decision for approval a condition that the applicant shall obtain approval from the<br />
Conservation Commission prior to any construction activity in the affected areas.<br />
Section 880-10. Design Requirements states, in part, that all subdivisions shall be designed to<br />
reduce, to the extent reasonably possible:<br />
o Volume <strong>of</strong> cut and fill;<br />
o Area over which existing vegetation will be disturbed, especially if within 200 feet <strong>of</strong><br />
a river, pond, or stream, or having a slope <strong>of</strong> more than 15%;<br />
o Number <strong>of</strong> mature trees removed;<br />
o Extent <strong>of</strong> waterway altered or relocated;<br />
o Erosion and siltation; and<br />
o Flood damage.<br />
Section 880-11. Open Space, Section 880-12. Protection <strong>of</strong> Natural Features, and Section<br />
880.13. Easements contain design requirements that can reduce the potential for flooding.<br />
However, the prevention <strong>of</strong> flooding is not explicitly stated as a purpose for these<br />
requirements.<br />
Town <strong>of</strong> Greenfield Local Natural Hazard Mitigation Plan • January <strong>2011</strong>• Page 142
Section 880-14. Environmental Assessment. A comparative environmental assessment may<br />
be required for any subdivision creating frontage <strong>of</strong> ten (10) or more dwelling units within<br />
one thousand (1,000) feet <strong>of</strong> a perennial river or stream as defined by the Massachusetts<br />
Wetlands Protection Act Regulations (310 CMR 10.00). The scope <strong>of</strong> such assessment,<br />
including development alternatives to be compared and consequences to be studied, shall be<br />
as agreed to by the Planning Board and may be required to include up to two (2) major<br />
alternatives to the <strong>plan</strong> proposed including a cluster version, with as much <strong>of</strong> the following<br />
information as determined by the Planning Board to be necessary for <strong>plan</strong> evaluation; and<br />
shall be prepared by an interdisciplinary team to include a land surveyor, civil engineer, and<br />
an architect or landscape architect, unless otherwise agreed to by the Planning Board.<br />
o Narrative discussion <strong>of</strong> differences among alternatives regarding, in part, the<br />
following:<br />
Impact upon surface water quality and level;<br />
Impact upon ground water quality and level;<br />
Material effects upon important wildlife habitats, outstanding botanical<br />
features, and scenic or historic environs;<br />
Capability <strong>of</strong> soils, vegetative cover, and proposed erosion control efforts to<br />
support proposed development without danger <strong>of</strong> erosion, silting, or other<br />
instability;<br />
Relationship to the requirements <strong>of</strong> MGL c. 131, ~~ 40 and 40A (the<br />
Wetlands Protection Act).<br />
Estimated phosphate and nitrate loading on ground water and surface water<br />
from septic tanks, lawn fertilizer, and other activities within the development.<br />
o Discussion <strong>of</strong> impact on a waterway <strong>of</strong> a subdivision with topographical features <strong>of</strong><br />
more than thirty (30) feet above said waterway.<br />
Section 880-16. Flood Hazard Areas. Any portion <strong>of</strong> a proposed subdivision which is located<br />
within the 100-year floodplain as shown on the Town <strong>of</strong> Greenfield Flood Insurance Rate<br />
Maps (FIRM) together with the Flood Boundary and Floodway Maps contained in the Flood<br />
Insurance Study shall meet the following requirements:<br />
o All requirements <strong>of</strong> § 200-4.13 Floodplain District (F) <strong>of</strong> the Greenfield Zoning<br />
Ordinance.<br />
o The subdivision, including utilities and drainage, shall be designed to be consistent<br />
with the needs to minimize flood damage and provide adequate drainage.<br />
o Subdivisions shall include base flood elevation data.<br />
Section 3.1.2 Design Standards <strong>of</strong> the Town <strong>of</strong> Greenfield Subdivision Rules and Regulations set<br />
grade limits on streets, which, although not specified as weather <strong>hazard</strong> <strong>mitigation</strong>, can serve to<br />
minimize the potential for motor vehicle accidents during severe winter storms (i.e., reduce road<br />
icing).<br />
Vertical grades should not exceed six (6) percent for primary roads and ten (10)<br />
percent for secondary roads; and<br />
Town <strong>of</strong> Greenfield Local Natural Hazard Mitigation Plan • January <strong>2011</strong>• Page 143
Horizontal alignment must provide minimum safe stopping sight distances for motor<br />
vehicle traffic. This is specified as 300 feet for primary roads and 200 feet for<br />
secondary roads.<br />
The Town also requires a permit from the Department <strong>of</strong> Public Works for a curb cut on <strong>town</strong>owned<br />
roads and a permit for a curb cut on state-owned roads must be obtained from Mass<br />
Highway. These permits help to ensure proper driveway and roadway drainage and help<br />
minimize icing during winter storms. Large residential developments and commercial<br />
developments are required to manage stormwater (discussed above in the flooding section)<br />
which also helps to reduce icing from melting snow.<br />
Town <strong>of</strong> Greenfield Code (Excerpts)<br />
Wetlands Protection, Chapter 195<br />
Chapter 195 <strong>of</strong> the Town <strong>of</strong> Greenfield Code, adopted by the Town Council <strong>of</strong> the Town <strong>of</strong><br />
Greenfield in 2001, addresses the protection <strong>of</strong> wetland resources within the <strong>town</strong> and includes<br />
provisions to address issues particular to Greenfield. The Ordinance includes a brief ex<strong>plan</strong>ation<br />
<strong>of</strong> the intended purpose and intent <strong>of</strong> each <strong>of</strong> the provisions. The prevention <strong>of</strong> flooding events<br />
or the <strong>mitigation</strong> <strong>of</strong> impacts from flooding are addressed directly and indirectly in this<br />
Ordinance, as indicated below. The italicized sections are the <strong>town</strong>‘s intended purpose for each<br />
provision.<br />
A minimum <strong>of</strong> a 25-foot naturally vegetated ―No Disturb Zone‖ shall be maintained<br />
or provided between resource areas and all altered areas. A wider ―No Disturb Zone‖<br />
may be required within the 100-foot buffer zone. This provision serves to ensure<br />
protection from negative impacts during construction activities and the long-term<br />
viability <strong>of</strong> a resource area. It also serves to preserve, intact, a portion <strong>of</strong> the<br />
floodplain associated with some resource areas.<br />
A list <strong>of</strong> prohibited new uses within the 100-year floodplain. These restrictions serve<br />
to protect areas within the floodplain from potential sources <strong>of</strong> contamination from<br />
pollutants. Vehicles and their accessories (road salt, sand, oil, gas) stored in the<br />
floodplain will pollute surface water during flooding events. Vehicles and their<br />
accessories can also become dangerous debris during a flooding event.<br />
100% compensatory storage shall be provided for all flood storage volume that will<br />
be lost as the result <strong>of</strong> a proposed project within the 100-year floodplain. This<br />
provision clarifies that the Commission considers all incremental reductions in flood<br />
storage capacity to be significant over time, and therefore requires replacement at a<br />
1:1 ratio.<br />
The Commission shall not consider the replication <strong>of</strong> wetlands adequate <strong>mitigation</strong><br />
for the destruction <strong>of</strong> resource areas. Alteration <strong>of</strong> wetlands requiring replication<br />
shall be permitted only where the landowner will be deprived <strong>of</strong> substantially all<br />
Town <strong>of</strong> Greenfield Local Natural Hazard Mitigation Plan • January <strong>2011</strong>• Page 144
economic use <strong>of</strong> the property, there are no reasonable alternatives, and the wetland<br />
area to be lost is minimized to the greatest extent possible. The purpose <strong>of</strong> this<br />
provision is to provide clarification that the destruction <strong>of</strong> natural wetlands shall only<br />
be considered as a last resort. In general, the Commission shall not permit<br />
replication <strong>of</strong> wetlands because replication does not in fact substitute for many<br />
wetlands values. Proposed wetlands replications are at the discretion <strong>of</strong> the<br />
Commission based upon solid scientific reasoning and shall not be permitted simply<br />
based upon a proposed 1:1 replication ratio or the “highest and best use” <strong>of</strong> a<br />
property based upon development potential.<br />
Stormwater System Regulations, Chapter 695<br />
Chapter 695 <strong>of</strong> the Town <strong>of</strong> Greenfield Code, dated June 2003, contains regulations governing<br />
the use <strong>of</strong> the <strong>town</strong>‘s stormwater system. The regulations specifically address flood prevention.<br />
The stated purpose <strong>of</strong> the regulations is to ―…ensure high water quality standards and address<br />
any potential water quantity problems associated with development and to:<br />
Preserve hydrologic conditions that closely resemble pre-development conditions;<br />
Prevent flooding by managing the peak discharge and volume <strong>of</strong> run<strong>of</strong>f; and<br />
Reduce the amount <strong>of</strong> suspended solids and other pollutants in order to maintain<br />
water quality.‖<br />
The Stormwater System Regulations establish a permitting process that governs any new<br />
discharge or increase in the volume <strong>of</strong> discharge <strong>of</strong> stormwater to a public way or stormwater<br />
sewer. There are two (2) classes <strong>of</strong> stormwater permit applications: Residential (single and tw<strong>of</strong>amily<br />
dwelling units) and Nonresidential (<strong>multi</strong>-family dwellings, subdivisions, commercial,<br />
industrial and institutional uses). For Nonresidential stormwater connection permits, an<br />
applicant must submit a Stormwater Management Plan to the Department <strong>of</strong> Public Works. The<br />
Stormwater Management Plan must be coordinated with requirements <strong>of</strong> the Wetlands Protection<br />
Act and the Greenfield Conservation Commission. The Stormwater System Regulations<br />
establish Stormwater Management Standards (section 695-11) that mitigate the potential for<br />
flooding, including:<br />
The stormwater management system shall be designed so that the post-development<br />
peak discharge rates do not exceed the pre-development discharge rates for a 10-year<br />
24-hour storm.<br />
Loss <strong>of</strong> annual recharge to groundwater should be minimized through the use <strong>of</strong><br />
infiltration measures to the maximum extent practicable. The annual recharge from<br />
the post-development site should approximate the annual recharge from the predevelopment<br />
or existing site conditions based on soil types.<br />
The regulations also include Design Criteria that address flood prevention and <strong>mitigation</strong>.<br />
Section 695-12 states:<br />
Stormwater management systems are encouraged to be designed to incorporate the<br />
use <strong>of</strong> natural topography and land cover. The use <strong>of</strong> such features as natural swales<br />
Town <strong>of</strong> Greenfield Local Natural Hazard Mitigation Plan • January <strong>2011</strong>• Page 145
and depressions as they exist prior to development to the degree that they can<br />
accommodate the additional flow <strong>of</strong> water are recommended.<br />
All stormwater management systems shall be designed to provide an emergency<br />
overflow system, and incorporate measures to provide a non-erosive velocity <strong>of</strong> flow<br />
along its length and at any outfall.<br />
Inspection and maintenance agreements are also required for stormwater management systems<br />
located on private land.<br />
Town <strong>of</strong> Greenfield Local Natural Hazard Mitigation Plan • January <strong>2011</strong>• Page 146
Appendix B: Massachusetts Cultural Resource Information System<br />
Inv. No. Property Name Street Year<br />
GRE.A Main Street Historic District<br />
GRE.B<br />
GRE.C<br />
GRE.D<br />
GRE.E<br />
GRE.F<br />
GRE.G<br />
GRE.H<br />
GRE.I<br />
GRE.J<br />
GRE.K<br />
GRE.L<br />
GRE.M<br />
GRE.N<br />
GRE.O<br />
GRE.P<br />
GRE.Q<br />
GRE.R<br />
GRE.S<br />
GRE.T<br />
GRE.U<br />
GRE.W<br />
East Main - High Street Historic District<br />
Central Main Street Area<br />
Crescent Street - Highland Avenue Area<br />
Factory Hollow Road Area<br />
Fort Square<br />
Grinnell - Congress - Prospect Streets Area<br />
Hope Street Area<br />
Lampblack Road Area<br />
Leonard Street Area<br />
Meridian Street - Petty Plain Road Area<br />
Mill Street Area<br />
Pierce - Garfield Streets Area<br />
Nash's Mill<br />
North Meadows<br />
Riddell - Hastings - Haywood Streets Area<br />
Washington Streetscape<br />
Sanderson Street Area<br />
Franklin County Fairgrounds<br />
Green River Cemetery<br />
Highland Park - Temple Woods - Rocky Mountain Park<br />
Riverside Archaeological District<br />
GRE.X Greenfield Tap and Die Plant #1<br />
GRE.Y<br />
Lower Federal Street Area<br />
GRE.186 Keefe, Jeremiah House 17 Abbott St 1902<br />
GRE.187 Davenport, William A. House 21 Abbott St 1900<br />
GRE.188 Rosen, David House 22 Abbott St 1905<br />
GRE.189 37 Abbott St 1900<br />
GRE.218 Adams, Andrew House 127 Adams Rd 1815<br />
GRE.136 Conway Street Elementary School Allen St 1909<br />
GRE.927 B & M Railroad Connecticut River Main Line Bridge Allen St 1934<br />
GRE.407 The C. Bau Photography Studio 4 Ames St 1990<br />
GRE.145 Threadwell Tap and Die Company Arch St 1882<br />
GRE.919 Arch Street Overpass Arch St 1848<br />
GRE.29 Prospect Hill School for Girls 4 Armory St 1856<br />
GRE.920 Bank Row Underpass Bank Row 1846<br />
GRE.87 First National Bank and Trust <strong>of</strong> Greenfield 9 Bank Row 1929<br />
Town <strong>of</strong> Greenfield Local Natural Hazard Mitigation Plan • January <strong>2011</strong>• Page 147
Inv. No. Property Name Street Year<br />
GRE.88 First Franklin County Courthouse 15 Bank Row 1813<br />
GRE.89 Pond, Frank A. Block 19-21 Bank Row 1874<br />
GRE.90 Siano Block 25-27 Bank Row 1921<br />
GRE.91 Coleman, William - Hollister, J. H. House 36 Bank Row 1797<br />
GRE.92 Chevalier Block 38-46 Bank Row 1916<br />
GRE.270 Ambercrombie Building 56 Bank Row 1892<br />
GRE.271 King's Appliance Store 60 Bank Row<br />
GRE.245 Phillips, McHard House 205 Barton Rd 1782<br />
GRE.246 Barton, Isaac House 283 Barton Rd 1837<br />
GRE.247 Allen, J. S. House 335 Barton Rd 1797<br />
GRE.379 Sawyer - Tyler House and Farm 1 Bascom Rd 1870<br />
GRE.201 Beacon Street School Beacon St 1929<br />
GRE.932 Beacon Field Beacon St 1912<br />
GRE.204 Wells, F. E. Tool Manufacturing Company 39 Beacon St 1910<br />
GRE.250 Sprague, Avery - Newton, Hervey C. House Bernardston Rd 1845<br />
GRE.251 Stoneleigh - Prospect Hill School for Girls Bernardston Rd 1930<br />
GRE.255 Fay, Damon L. Farm Bernardston Rd 1852<br />
GRE.249 Sprague, Asa House 560 Bernardston Rd 1840<br />
GRE.252 Davis, George House 611 Bernardston Rd 1937<br />
GRE.253 Stevens, R. E. House 629 Bernardston Rd 1940<br />
GRE.254 Winer, Benjamin Home 633 Bernardston Rd 1930<br />
GRE.256 Bullard, Silas House 804 Bernardston Rd 1865<br />
GRE.257 Bullard, Mark House 878 Bernardston Rd 1881<br />
GRE.258 Spaulding, Varney House 890 Bernardston Rd 1835<br />
GRE.259 Pickett, Samuel House 908 Bernardston Rd 1820<br />
GRE.262 Strickland, Russell F. House 1012 Bernardston Rd 1830<br />
GRE.807 Log Plain Cemetery 1037 Bernardston Rd 1802<br />
GRE.190 3 Bowker St 1900<br />
GRE.191 22 Bowker St 1830<br />
GRE.214 Canada Hill Elementary School 40 Canada Hill Rd 1920<br />
GRE.272 Victoria Theater 13-25 Chapman St 1913<br />
GRE.275 Outlet Store 14-18 Chapman St 1890<br />
GRE.274 Rist Building 26 Chapman St 1920<br />
GRE.273 Deland Building 27-31 Chapman St 1911<br />
GRE.108 Mohawk Engraving Company Building 52 Chapman St 1900<br />
GRE.109 Chapman, Henry House 58 Chapman St 1850<br />
GRE.151 Wiley and Russell Box Company 330 Chapman St 1912<br />
GRE.152 Guiding Star Grange 401 Chapman St 1932<br />
GRE.45 Comstock, Samuel W. House Chestnut Hill 1890<br />
Town <strong>of</strong> Greenfield Local Natural Hazard Mitigation Plan • January <strong>2011</strong>• Page 148
Inv. No. Property Name Street Year<br />
GRE.77 Saint James Protestant Episcopal Church 8 Church St 1847<br />
GRE.422 Saint James Protestant Episcopal Church Rectory 8 Church St<br />
GRE.336 Stevens House 18 Church St 1900<br />
GRE.334 Prentice House 19 Church St 1870<br />
GRE.333 Eldrich House 20 Church St 1860<br />
GRE.78 Potter, Waymes N. House 24 Church St 1885<br />
GRE.79 First Methodist Episcopal Church 25 Church St 1885<br />
GRE.329 Wise House 40 Church St 1864<br />
GRE.80 Greenfield Historic Society Building 43 Church St 1851<br />
GRE.328 44 Church St 1920<br />
GRE.327 46-48 Church St 1920<br />
GRE.81 Fay, Charles F. - Griswold, Whiting House 51 Church St 1854<br />
GRE.392 Long, Alanson House and Farm 175 Cleveland St 1838<br />
GRE.922 Colrain Road Bridge over Allen Brook Colrain Rd 1905<br />
GRE.810 Lower Meadows Cemetery 213 Colrain Rd 1793<br />
GRE.219 Arms, Moses Farmhouse 248 Colrain Rd 1777<br />
GRE.221 Belgrade, David House 350 Colrain Rd 1939<br />
GRE.222 Nims, Thomas Barn 370 Colrain Rd 1810<br />
GRE.223 Nims, Thomas Homestead 465 Colrain Rd 1826<br />
GRE.224 Nims, Prudence House 479 Colrain Rd 1847<br />
GRE.225 Brook, Allen Farmhouse 620 Colrain Rd 1766<br />
GRE.226 Coleman, Capt. Thadeus House 637 Colrain Rd 1813<br />
GRE.227 Wells, Capt. Ebenezer House 638 Colrain Rd 1747<br />
GRE.811 Upper Meadows Cemetery 711 Colrain Rd 1821<br />
GRE.228 Smead, Asaph House 729 Colrain Rd 1810<br />
GRE.229 Wells Tavern 758 Colrain Rd 1780<br />
GRE.230 Parmenter, Dea. Elias A. - Spear, George House 789 Colrain Rd 1851<br />
GRE.232 Old Tavern Farm 817 Colrain Rd 1740<br />
GRE.30 Washburn, William B. House 35 Congress St 1859<br />
GRE.31 Wiley, Solon L. House 60 Congress St 1877<br />
GRE.141 North Parish School Conway St 1920<br />
GRE.137 Emerson, Pr<strong>of</strong>essor L. O. House 70 Conway St 1840<br />
GRE.138 Severance, Charles D. House 93 Conway St 1910<br />
GRE.139 Newton, James House 117-119 Conway St 1850<br />
GRE.140 Smart, Albert J. House 136 Conway St 1870<br />
GRE.917 Country Club Road Overpass Country Club Rd 1848<br />
GRE.83 Second Franklin County Courthouse Court Sq 1848<br />
GRE.310 Second Congregational Church Court Sq 1868<br />
GRE.903 Civil War Monument Court Sq 1870<br />
Town <strong>of</strong> Greenfield Local Natural Hazard Mitigation Plan • January <strong>2011</strong>• Page 149
Inv. No. Property Name Street Year<br />
GRE.46 Snow, Walter N. House 50 Crescent St 1895<br />
GRE.178 Grammar School Davis St 1902<br />
GRE.175 63-65 Davis St 1845<br />
GRE.16 Harugari Hall Deerfield St 1886<br />
GRE.908 Cheapside Railroad Bridge Deerfield St 1912<br />
GRE.17 Potter, Mary Pratt - Ward Elizabeth House 50 Deerfield St 1850<br />
GRE.18 98 Deerfield St 1850<br />
GRE.99 11 Deven St 1850<br />
GRE.135 Franklin County Jail and House <strong>of</strong> Correction Elm St 1886<br />
GRE.134 Mitchell, J. E. House 34 Elm St 1875<br />
GRE.244 Green River Pumping Station Eunice Williams Dr 1896<br />
GRE.901 Pumping Station Bridge Eunice Williams Dr 1972<br />
GRE.916 Williams, Eunice Monument Eunice Williams Dr 1884<br />
GRE.215 Little Brick House 7 Factory Hollow Rd 1830<br />
GRE.905 Factory Hollow Mill Bell Tower 12 Factory Hollow Rd 1830<br />
GRE.217 Hastings, Obed House 17 Factory Hollow Rd 1700<br />
GRE.216 Wood, Seth House and Store 24 Factory Hollow Rd 1835<br />
GRE.373 30 Factory Hollow Rd 1900<br />
GRE.374 39 Factory Hollow Rd 1933<br />
GRE.375 53 Factory Hollow Rd 1900<br />
GRE.910 First Meeting House Marker and Watering Trough Federal St 1894<br />
GRE.911 Revolutionary War Memorial Federal St 1916<br />
GRE.154 Pioneer National Bank and Trust Company 1 Federal St 1970<br />
GRE.938 Untitled Sculpture 1 Federal St 1975<br />
GRE.153 Corsiglia Block 8 Federal St 1898<br />
GRE.428 Rosge Garden Building - Donovan Block 18 Federal St 1926<br />
GRE.155 Levy Block 26-28 Federal St 1915<br />
GRE.409 Famous Bill's Restaurant 30-44 Federal St 1900<br />
GRE.156 Odd Fellows Block 31 Federal St 1922<br />
GRE.157 Schick, Jacob Block 41 Federal St 1912<br />
GRE.410 Greenfield Electric Light and Power Company Office 45 Federal St 1930<br />
GRE.159 Graves Bakery 54 Federal St 1910<br />
GRE.158 Greenfield Power and Light Company Service Station 55R Federal St 1918<br />
GRE.160 Mansion House Hotel Garage 62 Federal St 1915<br />
GRE.411 Greenfield Co-Operative Bank 63 Federal St 1950<br />
GRE.161 Knights <strong>of</strong> Columbus Block 70 Federal St 1926<br />
GRE.162 Brown's Toy Company Store 78-80 Federal St 1922<br />
GRE.163 Weldon Hotel Garage 90 Federal St 1909<br />
GRE.164 Wilcox, George Auto Dealership 100 Federal St 1930<br />
Town <strong>of</strong> Greenfield Local Natural Hazard Mitigation Plan • January <strong>2011</strong>• Page 150
Inv. No. Property Name Street Year<br />
GRE.165 Wiley - O'Brien, Dr. John C. House 111 Federal St 1845<br />
GRE.168 Leonard, Theodore House 116 Federal St 1850<br />
GRE.183 Greenfield First Baptist Church 116 Federal St 1912<br />
GRE.166 Federal Street Elementary School 125 Federal St 1911<br />
GRE.167 Third Greenfield High School 125 Federal St 1904<br />
GRE.412 Hull, A. N. House 128 Federal St 1880<br />
GRE.413 Lamb, J. H. House 132 Federal St 1880<br />
GRE.419 Krohne's Automotive Service Garage 151 Federal St 1912<br />
GRE.420 155-157 Federal St 1900<br />
GRE.421 159-161 Federal St 1900<br />
GRE.414 Bardwell, Oscar House 162 Federal St 1885<br />
GRE.417 Scobey, C. House 166 Federal St 1880<br />
GRE.418 Stratton, O. House 168-170 Federal St 1890<br />
GRE.415 Ingell and Shepard Funeral Home 180 Federal St 1923<br />
GRE.801 Federal Street Cemetery 187 Federal St 1803<br />
GRE.802 Pierce, John J. Burial Lot 187 Federal St<br />
GRE.425<br />
189 Federal St<br />
GRE.180 Fourth Greenfield Senior High School 195 Federal St 1924<br />
GRE.198 Pierce, John D. House 196 Federal St 1887<br />
GRE.199 Woodleigh Villa 220 Federal St 1888<br />
GRE.416 224 Federal St 1900<br />
GRE.200 First National Stores 226-230 Federal St 1927<br />
GRE.367 Severance, Asa House 234 Federal St 1896<br />
GRE.368 Parker, George W. House 240 Federal St 1903<br />
GRE.369 Allen, Dr. Porter C. House 244 Federal St 1906<br />
GRE.370 Corbin, Charles G. House 246 Federal St 1910<br />
GRE.212 Lunt Silversmith Factory 298 Federal St 1890<br />
GRE.371 Braff's Royal Cleaners 430 Federal St 1950<br />
GRE.106 Greenfield Storage 1 Fiske Ave 1915<br />
GRE.267 Avenue Lighting 10 Fiske Ave 1920<br />
GRE.68 Greenfield Library Association Building 7 Franklin St 1878<br />
GRE.351 Washburn House 15 Franklin St 1882<br />
GRE.350 Fiske, O. H. House 23 Franklin St 1890<br />
GRE.349 Reed Apartments 24 Franklin St 1915<br />
GRE.69 Russell, Isabella House 29 Franklin St 1890<br />
GRE.348 Howland House 34 Franklin St 1860<br />
GRE.347 37 Franklin St 1960<br />
GRE.346 Ward House 42 Franklin St 1880<br />
GRE.345 Smead House 43 Franklin St 1880<br />
Town <strong>of</strong> Greenfield Local Natural Hazard Mitigation Plan • January <strong>2011</strong>• Page 151
Inv. No. Property Name Street Year<br />
GRE.344 Crafts, Fannie E. House 68 Franklin St 1880<br />
GRE.343 Newcomb House 69 Franklin St 1865<br />
GRE.331 81 Franklin St 1880<br />
GRE.332 Burrage House 87 Franklin St 1924<br />
GRE.243 Greenfield Town Farm 34 Glenbrook Dr 1847<br />
GRE.396 Greenfield Town Farm Barn 34 Glenbrook Dr 1909<br />
GRE.924 Gerrett Bridge Green River Rd 1907<br />
GRE.233 Smead, Capt. Thomas House 11 Green River Rd 1794<br />
GRE.234 Ewers, Henry A. Blacksmith Shop 18 Green River Rd 1840<br />
GRE.235 Smead, Jonathan House 200 Green River Rd 1739<br />
GRE.236 Smead, Lemuel House 276 Green River Rd 1766<br />
GRE.32 Conant, Samuel D. House 3 Grinnell St 1880<br />
GRE.33 Wells, F. O. House 9 Grinnell St 1880<br />
GRE.34 Reed, Frank H. House 16 Grinnell St 1880<br />
GRE.35 Hardison, F. S. House 26 Grinnell St 1882<br />
GRE.36 Day, Charles J. House 29 Grinnell St 1880<br />
GRE.37 Allen, Sylvester House 41 Grinnell St 1836<br />
GRE.38 55 Grinnell St 1880<br />
GRE.210 Akey, Clifford House 11 Haywood St 1900<br />
GRE.211 Greenfield Machine Company 38 Haywood St 1900<br />
GRE.812 Country Farms Cemetery Health Camp Rd 1794<br />
GRE.276 Hoyt House 11-15 High St 1883<br />
GRE.277 Walker Funeral Home 14 High St 1893<br />
GRE.278 Lamb House 17 High St 1851<br />
GRE.70 Beals, Dr. Joseph House 21 High St 1845<br />
GRE.71 Simons, H. K. House 22 High St 1875<br />
GRE.320 Arms, George House 23-25 High St 1850<br />
GRE.72 Kellog, Dwight B. - Conant, Chester C. House 28 High St 1854<br />
GRE.321 Forbes House 29 High St 1850<br />
GRE.322 Packard House 32 High St 1855<br />
GRE.323 Moors - Comstock House 35 High St 1850<br />
GRE.324 36-38 High St 1855<br />
GRE.73 Taylor, Rinaldo Rinaldine - Russell, Nathaniel Hse 40 High St 1855<br />
GRE.74 Field, Charles R. House 43 High St 1870<br />
GRE.326 Fletcher House 51 High St 1870<br />
GRE.75 Weldon Hotel, The 54 High St 1905<br />
GRE.76 Bolter, Cyprian - Jones, Orra Martin Cottage 77 High St 1852<br />
GRE.205 Hastings, Lemuel - Riddell, John Wesley House 186 High St 1790<br />
GRE.206 193 High St 1915<br />
Town <strong>of</strong> Greenfield Local Natural Hazard Mitigation Plan • January <strong>2011</strong>• Page 152
Inv. No. Property Name Street Year<br />
GRE.209 Taylor, Lewis House 210 High St 1930<br />
GRE.41 Lupinwood Highland Ave 1890<br />
GRE.42 Cutler, Nahum Sawin House 35 Highland Ave 1886<br />
GRE.43 Field, David C. G. - Esleek, Augustine W. House 58 Highland Ave 1895<br />
GRE.44 Rogers, George E. House 93 Highland Ave 1903<br />
GRE.22 Cutler, Lyons and Field Shoe Factory Hope St 1891<br />
GRE.27 Hope St 1890<br />
GRE.403 Mohawk Cadillac Company Repair Garage 36 Hope St 1920<br />
GRE.404 Father Mathew Temperance Society Hall 44 Hope St 1920<br />
GRE.21 Greenfield Armory 71 Hope St 1910<br />
GRE.23 Saint Paul's Lutheran Church 88 Hope St 1883<br />
GRE.24 Noyes, B. B. Foundry 106 Hope St 1893<br />
GRE.25 123 Hope St 1870<br />
GRE.26 Toiletine Building 143 Hope St 1910<br />
GRE.264 Childs, Timothy - Bascom, Moses House 509 Lampblack Rd 1774<br />
GRE.380 Griswold Farmhouse 588 Lampblack Rd 1873<br />
GRE.376 Griswold Farmstead 599 Lampblack Rd 1920<br />
GRE.377 Philips - Bascom House 672 Lampblack Rd 1830<br />
GRE.378 Chapin, C. House 692 Lampblack Rd 1820<br />
GRE.100 Main Street Primary School 7 Legion Ave 1877<br />
GRE.169 Mosa, G. W. House 8-10 Leonard St 1880<br />
GRE.170 Whitney, E. House 11 Leonard St 1885<br />
GRE.171 12 Leonard St 1895<br />
GRE.386 15 Leonard St 1900<br />
GRE.381 16 Leonard St 1895<br />
GRE.172 Smith, C. House 17 Leonard St 1900<br />
GRE.382 18 Leonard St 1895<br />
GRE.385 21 Leonard St 1900<br />
GRE.173 Partenheimer, Philip House 22 Leonard St 1883<br />
GRE.384 23 Leonard St 1900<br />
GRE.383 27 Leonard St 1880<br />
GRE.394 Green River Booster Pumping Station - North Bldg Leyden Rd 1922<br />
GRE.395 Green River Booster Pumping Station - South Bldg Leyden Rd 1923<br />
GRE.237 Wilder, Samuel House 21 Leyden Rd 1835<br />
GRE.238 Parsonage, The 31 Leyden Rd 1845<br />
GRE.265 Nash, Daniel House 36 Leyden Rd 1820<br />
GRE.239 Newcomb, Allyn S. House 46 Leyden Rd 1885<br />
GRE.240 Martindale, Uriah and Theodore House 127 Leyden Rd 1835<br />
GRE.241 Smead, Charles Dea. House 219 Leyden Rd 1840<br />
Town <strong>of</strong> Greenfield Local Natural Hazard Mitigation Plan • January <strong>2011</strong>• Page 153
Inv. No. Property Name Street Year<br />
GRE.242 Smead, Jonathan Jr. House 274 Leyden Rd 1765<br />
GRE.808 Hebrew Cemetery Log Plain Rd 1924<br />
GRE.925 Log Plain Road Bridge over Mill - Barton Brook Log Plain Rd 1939<br />
GRE.260 Adams, George House 136 Lover's Ln 1870<br />
GRE.915 Spanish War Memorial Main St 1928<br />
GRE.918 Main Street Arch Main St 1848<br />
GRE.939 Peace Symbol - Greenfield Civil War Memorial Main St 1965<br />
GRE.940 Serpentine Wall - Greenfield War Memorial Main St 1965<br />
GRE.127 Goodell Manufacturing Company 1 Main St 1897<br />
GRE.124 Coombs, Joseph House 6 Main St 1854<br />
GRE.123 Noyes, Baxter B. House 8 Main St 1895<br />
GRE.126 Simons House 30 Main St 1865<br />
GRE.399 Benson Block 94 Main St 1915<br />
GRE.398 Sears Building 102 Main St 1929<br />
GRE.397 Abrahamson Furniture and Appliance Building 122 Main St 1918<br />
GRE.94 130 Main St 1913<br />
GRE.95 Holy Trinity Roman Catholic Church 133 Main St 1871<br />
GRE.426 Holy Trinity Roman Catholic Church Rectory 133 Main St 1901<br />
GRE.96 138 Main St 1916<br />
GRE.400 McLellan Women's Clothing Store 142 Main St 1940<br />
GRE.402 Penny, J. C. Department Store 144 Main St 1940<br />
GRE.97 Potter, W. N. Grain Store 155 Main St 1910<br />
GRE.401 Cohn, Simon L. Block 156 Main St 1928<br />
GRE.408 Miles, Isaac House 173 Main St 1855<br />
GRE.101 Blake Block 201 Main St 1909<br />
GRE.102 Kennedy - Maniatty Block 204-206 Main St 1904<br />
GRE.103 Ragovin Block 205-209 Main St 1924<br />
GRE.104 Pond - Coughlin Block 217-219 Main St 1902<br />
GRE.311 National Shoe Service 221-223 Main St 1915<br />
GRE.105 Pillar Building 226-228 Main St 1845<br />
GRE.110 Botsford Block 231 Main St 1873<br />
GRE.111 Union - Taylor Block 232-240 Main St 1854<br />
GRE.112 Sullivan Building 233 Main St 1873<br />
GRE.268 Bor<strong>of</strong>sky Block 239 Main St 1947<br />
GRE.113 American House 242-258 Main St 1876<br />
GRE.269 Greenfield Police Station 253 Main St 1936<br />
GRE.115 Wiley - Cohn Block 269 Main St 1845<br />
GRE.116 Heritage NIS Bank 270 Main St 1976<br />
GRE.118 Pond's Block 276-294 Main St 1874<br />
Town <strong>of</strong> Greenfield Local Natural Hazard Mitigation Plan • January <strong>2011</strong>• Page 154
Inv. No. Property Name Street Year<br />
GRE.117 Sheldon Block 277 Main St 1912<br />
GRE.119 Arms, George A. Block 285-291 Main St 1876<br />
GRE.120 Hollister Block 298-302 Main St 1874<br />
GRE.121 Bird - Hovey Block 310 Main St 1812<br />
GRE.122 Franklin County Trust Company Building 324 Main St 1972<br />
GRE.84 Franklin Savings Bank 332 Main St 1911<br />
GRE.85 Allen Corner Block 351 Main St 1827<br />
GRE.86 Garden Theater Block 353-367 Main St 1928<br />
GRE.48 Greenfield Masonic Block 375 Main St 1896<br />
GRE.49 Lyons - Nims Building 377-379 Main St 1871<br />
GRE.50 Unitarian Church Hall 397 Main St 1837<br />
GRE.51 All Souls Unitarian Church 399 Main St 1894<br />
GRE.52 Greenfield Savings and Loan Bank 400 Main St 1963<br />
GRE.53 Leavitt - Hovey House 402 Main St 1797<br />
GRE.54 Second Greenfield Fire Station 412 Main St 1936<br />
GRE.55 Franklin County Court House 425 Main St 1931<br />
GRE.56 U. S. Post Office - Greenfield Main Branch 442 Main St 1916<br />
GRE.57 Greenfield YMCA 451 Main St 1949<br />
GRE.58 Coldbrook Springs Baptist Church 463 Main St 1842<br />
GRE.59 Snow, Newell House - Greenfield Club 466 Main St 1881<br />
GRE.60 Elliott, William House 473 Main St 1836<br />
GRE.61 Wright, Aaron H. - Sanderson, John H. House 474 Main St 1881<br />
GRE.62 Ripley, Franklin - Root, Rebecca L. House 479 Main St 1834<br />
GRE.63 Gould, Elijah Addison - Clapp, Henry Wells House 486 Main St 1827<br />
GRE.64 Bird, George - Fessenden, Franklin Goodrich House 488 Main St 1845<br />
GRE.65 Morgan, Alexander - Allen, Franklin R. House 491 Main St 1816<br />
GRE.66 Smith, Martin House 497 Main St 1824<br />
GRE.67 Grinnell, George - Tufts, Nathan House 500 Main St 1846<br />
GRE.179 Day, Nina L. House 23 Maple St 1900<br />
GRE.15 Snow, Newell Factory Mead St 1879<br />
GRE.5 Greenfield Tap and Die Plant #1 - Boiler Building Meridian St 1860<br />
GRE.7 Green River Elementary School Meridian St 1949<br />
GRE.352 Greenfield Tap and Die Plant #1 - Pump House Meridian St 1860<br />
GRE.353 Greenfield Tap and Die Plant #1 - Machine Shop Meridian St 1890<br />
GRE.354 Greenfield Tap and Die Plant #1 - Hardening Shop Meridian St 1887<br />
GRE.355 Greenfield Tap and Die Plant #1 - Machine Shop Meridian St 1889<br />
GRE.356 Greenfield Tap and Die Plant #1 - Hardening Shop Meridian St 1888<br />
GRE.357 Greenfield Tap and Die Plant #1 - Storehouse Meridian St 1896<br />
GRE.358 Greenfield Tap and Die Plant #1 - Meter House Meridian St 1896<br />
Town <strong>of</strong> Greenfield Local Natural Hazard Mitigation Plan • January <strong>2011</strong>• Page 155
Inv. No. Property Name Street Year<br />
GRE.359 Greenfield Tap and Die Plant #1 - Machine Shop Meridian St 1891<br />
GRE.360 Greenfield Tap and Die Plant #1 - Restaurant Meridian St 1945<br />
GRE.361 Greenfield Tap and Die Plant #1 - Machine Shop Meridian St 1887<br />
GRE.362 Greenfield Tap and Die Plant #1 - Squaring Shop Meridian St 1912<br />
GRE.363 Greenfield Tap and Die Plant #1 - Auto Shop Meridian St 1912<br />
GRE.364 Greenfield Tap and Die Plant #1 - Machine Shop Meridian St 1920<br />
GRE.365 Greenfield Tap and Die Plant #1 - Oil Filter Bldg. Meridian St 1970<br />
GRE.907 Meridian Marker Meridian St 1870<br />
GRE.921 Wiley and Russell Bridge Meridian St 1917<br />
GRE.934 Greenfield Tap and Die Plant #1 - Smokestack Meridian St 1930<br />
GRE.935 Greenfield Tap and Die Plant #1 - Canal Meridian St<br />
GRE.936 Greenfield Tap and Die Plant #1 - Wood Crib Dam Meridian St<br />
GRE.937 Greenfield Tap and Die Plant #1 - Flood Walls Meridian St 1938<br />
GRE.6 98 Meridian St 1860<br />
GRE.107 Miles Hotel 10 Miles St 1900<br />
GRE.406 B&M Railroad - Fitchburgh Line Divisional Offices 59 Miles St 1914<br />
GRE.923 Mill Street Bridge over Green River Mill St 1910<br />
GRE.11 Greenfield Monumental Works Shop 9 Mill St 1911<br />
GRE.372 Jones, Levi House 15 Mill St 1845<br />
GRE.12 38 Mill St 1900<br />
GRE.388 Green River Mill Company Worker Housing 51 Mill St 1838<br />
GRE.914 Three State Long View Tower Mohawk Trail 1952<br />
GRE.10 Abercrombie Elementary School Montague City Rd 1920<br />
GRE.926 Pierce, Gen. Frederick E. Bridge Montague City Rd 1947<br />
GRE.8 Cheapside District Schoolhouse 21 Montague City Rd 1800<br />
GRE.9 151 Montague City Rd 1890<br />
GRE.40 Eager, Noah - Temple, Philo Farm 230 Mountain Rd 1815<br />
GRE.1 Westside Chapel 59 Munson St 1909<br />
GRE.2 Newton, Alpheus House 176 Munson St 1826<br />
GRE.913 Turner, Capt. William Monument Nash's Mill Rd 1905<br />
GRE.931 Nash's Mills Bridge over Green River Nash's Mill Rd 1933<br />
GRE.335 1-3 Newell Ct 1909<br />
GRE.82 Potter, Aaron D. and Sons Garage 13 Newell Ct 1896<br />
GRE.261 McHard Red Salt Box House Newell Pond Pl 1750<br />
GRE.902 Langstroth Memorial Newton Pl 1948<br />
GRE.128 Rugg Manufacturing Company 105 Newton St 1855<br />
GRE.203 Sisters <strong>of</strong> Saint Joseph Convent North St 1929<br />
GRE.405 Olive Street Garage 11 Olive St 1922<br />
GRE.93 Pierce, E. Lumber Company Planing Mill 30 Olive St 1860<br />
Town <strong>of</strong> Greenfield Local Natural Hazard Mitigation Plan • January <strong>2011</strong>• Page 156
Inv. No. Property Name Street Year<br />
GRE.427 Mohawk Cadillac Company Repair Shop 33 Olive St 1922<br />
GRE.47 Gun House Hill 30 Orchard St 1895<br />
GRE.429 Phelps, Col. Ansel House 13 Osgood St<br />
GRE.342 McClellan House 3 Park St 1850<br />
GRE.330 5 Park St 1970<br />
GRE.341 Thayer House 7-9 Park St 1870<br />
GRE.340 Field House 10 Park St 1883<br />
GRE.339 Sheldon House 11 Park St 1865<br />
GRE.338 Scotts House 14 Park St 1900<br />
GRE.337 15 Park St 1920<br />
GRE.366 Nichols, Louise J. House 7 Peirce St 1895<br />
GRE.195 Pierce Street Primary School Pierce St 1894<br />
GRE.194 Second Baptist Church 27 Pierce St 1898<br />
GRE.196 Chauncey Wing and Sons Mailing Machine Factory 78 Pierce St 1892<br />
GRE.197 Diamond Electric Soap Company 85 Pierce St 1900<br />
GRE.220 Bass, Nathaniel House 318 Plain Rd 1820<br />
GRE.174 Inkwell House 61 Pleasant St 1850<br />
GRE.184 12-14 Pond St 1900<br />
GRE.185 Houston, Hayden House 27 Pond St 1900<br />
GRE.13 Field, Charles A. Baby Carriage Manufacturing Co. Power Sq 1860<br />
GRE.14 Greenfield Electric Light and Power Company Power Sq 1900<br />
GRE.28 Thompson, John Webber House 34 Prospect St 1840<br />
GRE.207 21 Riddell St 1894<br />
GRE.208 23 Riddell St 1890<br />
GRE.912 Green River Railroad Bridge River Rd 1918<br />
GRE.900 Poet Seat Tower Rocky Mountain 1912<br />
GRE.928 Route 2 Eastbound Ramp over I-91 Northbound Rt 2 1964<br />
GRE.929 Route 2 Eastbound Ramp over I-91 Southbound Rt 2 1964<br />
GRE.930 Route 2 Westbound Ramp over I-91 Northbound Rt 2 1964<br />
GRE.933 Cheapside Bridge Rt 5 1931<br />
GRE.39 Russell St 1850<br />
GRE.424<br />
8 Sanderson St<br />
GRE.181 Otterson, James P. S. - Spencer, Archer J. House 10 Sanderson St 1890<br />
GRE.423<br />
14 Sanderson St<br />
GRE.182 Greenfield Tap and Die Factory #2 34 Sanderson St 1889<br />
GRE.177 Richardson, John B. House 25-27 School St 1840<br />
GRE.114 New England Telephone and Telegraph Company Bldg 53 School St 1912<br />
GRE.176 Brown, Frank H. House 162 School St 1898<br />
GRE.248 Greenfield District #7 Schoolhouse Severance St 1873<br />
Town <strong>of</strong> Greenfield Local Natural Hazard Mitigation Plan • January <strong>2011</strong>• Page 157
Inv. No. Property Name Street Year<br />
GRE.909 Commemorative Watering Trough Shattuck Park 1903<br />
GRE.132 Newton Street School Shelburne Rd 1915<br />
GRE.129 Potter, J. Warren House 107 Shelburne Rd 1800<br />
GRE.390 Edgemere Inn, The 140 Shelburne Rd 1920<br />
GRE.389 Turnbull's Green Mountain Ice Cream Company 184 Shelburne Rd 1926<br />
GRE.133 Falcon Knight Motors Showroom and Service Station 189 Shelburne Rd 1927<br />
GRE.809 High Street Cemetery 11 Silver St 1768<br />
GRE.387 Newton, Samuel House 287 Silver St 1812<br />
GRE.142 North Meeting House District School 384 Silver St 1839<br />
GRE.143 Graves, John J. House 399 Silver St 1824<br />
GRE.130 Arms, Ebenezer Farm 54 Thayer Rd 1800<br />
GRE.213 Turners Falls Rd 1880<br />
GRE.263 Snow, Barnabus House Upper Bernardston Rd 1795<br />
GRE.20 Green River Primary School Washington St 1857<br />
GRE.19 57 Washington St 1840<br />
GRE.98 Millers Falls Tool Company Wells St 1892<br />
GRE.144 Hunt, Wilfred E. Feeds Store 121 1/2 Wells St 1922<br />
GRE.146 Pray, Frank G. House 143 Wells St 1880<br />
GRE.147 Pray, Robert E. House 149 Wells St 1900<br />
GRE.148 Pray, Frank G. House 153 Wells St 1900<br />
GRE.393 Knight, Theodore R. House 189 Wells St 1870<br />
GRE.149 238 Wells St 1905<br />
GRE.150 Bickford Machine Company 309 Wells St 1908<br />
GRE.125 W<strong>of</strong>fenden, Judson House 61 West Fort Sq 1915<br />
GRE.4 Green River Cemetery Mortuary Chapel Wisdom Way 1921<br />
GRE.803 Our Lady <strong>of</strong> Sorrows Cemetery Wisdom Way 1923<br />
GRE.906 Russell Family Memorial Tombstone Wisdom Way 1926<br />
GRE.806 Green River Cemetery 56 Wisdom Way 1851<br />
GRE.904 Franklin County Fairground Gates 85 Wisdom Way 1917<br />
GRE.3 Franklin County Fairgrounds Roundhouse Barn 89 Wisdom Way 1899<br />
GRE.805 Catholic Cemetery, Old 171 Wisdom Way 1804<br />
GRE.804 Calvary Catholic Cemetery 202 Wisdom Way 1877<br />
GRE.131 Woodard, H. G. House Woodard St 1835<br />
GRE.192 7 Woodleigh St 1900<br />
GRE.193 11 Woodleigh St 1900<br />
Town <strong>of</strong> Greenfield Local Natural Hazard Mitigation Plan • January <strong>2011</strong>• Page 158
Appendix C: In the News<br />
Tropical Storm Irene<br />
From August 30, <strong>2011</strong><br />
Town <strong>of</strong> Greenfield Local Natural Hazard Mitigation Plan • January <strong>2011</strong>• Page 159
Town <strong>of</strong> Greenfield Local Natural Hazard Mitigation Plan • January <strong>2011</strong>• Page 160
Town <strong>of</strong> Greenfield Local Natural Hazard Mitigation Plan • January <strong>2011</strong>• Page 161
From August 31, <strong>2011</strong><br />
Town <strong>of</strong> Greenfield Local Natural Hazard Mitigation Plan • January <strong>2011</strong>• Page 162
Town <strong>of</strong> Greenfield Local Natural Hazard Mitigation Plan • January <strong>2011</strong>• Page 163<br />
From September 6, <strong>2011</strong>
Town <strong>of</strong> Greenfield Local Natural Hazard Mitigation Plan • January <strong>2011</strong>• Page 164
From September 1, <strong>2011</strong><br />
Town <strong>of</strong> Greenfield Local Natural Hazard Mitigation Plan • January <strong>2011</strong>• Page 165
Town <strong>of</strong> Greenfield Local Natural Hazard Mitigation Plan • January <strong>2011</strong>• Page 166
Town <strong>of</strong> Greenfield Local Natural Hazard Mitigation Plan • January <strong>2011</strong>• Page 167
From August 30, <strong>2011</strong><br />
Town <strong>of</strong> Greenfield Local Natural Hazard Mitigation Plan • January <strong>2011</strong>• Page 168
Beaver Dams<br />
See pages 37-39 for photos and more information on beaver dams in Greenfield.<br />
Town <strong>of</strong> Greenfield Local Natural Hazard Mitigation Plan • January <strong>2011</strong>• Page 169
Mud Slides<br />
Town <strong>of</strong> Greenfield Local Natural Hazard Mitigation Plan • January <strong>2011</strong>• Page 170
Town <strong>of</strong> Greenfield Local Natural Hazard Mitigation Plan • January <strong>2011</strong>• Page 171
Appendix D: Town Correspondence, Public Outreach, Sign Ins, Agendas<br />
Town <strong>of</strong> Greenfield Local Natural Hazard Mitigation Plan • January <strong>2011</strong>• Page 172
Town <strong>of</strong> Greenfield Local Natural Hazard Mitigation Plan • January <strong>2011</strong>• Page 173
Greenfield Local Natural<br />
Hazards Mitigation Plan<br />
The Greenfield Natural Hazards Mitigation Planning Committee, in partnership with<br />
the Franklin Regional Council <strong>of</strong> Governments (FRCOG), is currently updating a draft<br />
Hazard Mitigation Plan for Greenfield. The purpose <strong>of</strong> this Hazard Mitigation Plan<br />
update is to identify natural and other <strong>hazard</strong>s that may impact the community;<br />
conduct a risk assessment to identify infrastructure at the highest risk for being<br />
damaged by <strong>hazard</strong>s; inventory and assess current Town <strong>hazard</strong> <strong>mitigation</strong> policies,<br />
programs, and regulations; and identify action steps to prevent damage to property<br />
and loss <strong>of</strong> life.<br />
Once the updated Plan is approved by FEMA and adopted by the Town, Greenfield<br />
will be eligible for state and federal grant monies to fund pre- and post-disaster<br />
<strong>mitigation</strong> projects.<br />
A copy <strong>of</strong> the draft Local Natural Hazards Mitigation Plan is available at the<br />
Greenfield Town Hall and Greenfield Department <strong>of</strong> Planning and Development and is<br />
available online at (Insert link here) Comments are being accepted on the Plan until<br />
July 15, <strong>2011</strong>.<br />
Now available for your comments!<br />
For more information contact:<br />
Eric Twarog, Director <strong>of</strong> Planning and Development, (413) 772-1549, EricT@<strong>greenfield</strong>-ma.gov<br />
Mary Praus, Land Use Planner, FRCOG, (413) 774-1194 X107, mpraus@frcog.org<br />
Town <strong>of</strong> Greenfield Local Natural Hazard Mitigation Plan • January <strong>2011</strong>• Page 174
Stakeholder Letter sent to:<br />
Greenfield High School<br />
Greenfield Community College<br />
Baystate Franklin Medical Center<br />
Stonely Burnham School<br />
FirstLight Power in Northfield<br />
The Towns <strong>of</strong> Deerfield, Gill, Bernardston and Montague<br />
October 24, <strong>2011</strong><br />
Dear [Stakeholder Name],<br />
The Town <strong>of</strong> Greenfield has been working with the Franklin Regional Council <strong>of</strong> Governments<br />
(FRCOG) Planning Department to update its Local Multi-Hazard Mitigation Plan, last completed<br />
in 2004. A Local Multi-Hazard Mitigation Planning Committee was created for the purpose <strong>of</strong><br />
updating the <strong>plan</strong>, and is comprised <strong>of</strong> the Town <strong>of</strong> Greenfield Emergency Management<br />
Director, Department <strong>of</strong> Planning Director, Public Health Director, Planning Board Chair, Police<br />
Department, Department <strong>of</strong> Public Works and Historical Commission.<br />
The Committee values and encourages input from members <strong>of</strong> the community and requests your<br />
involvement in the process. As such, a draft <strong>of</strong> the <strong>plan</strong> is available at the Town <strong>of</strong> Greenfield<br />
Planning Department. Please feel free to contact Eric Twarog, Director <strong>of</strong> Planning and<br />
Development at EricT@<strong>greenfield</strong>-ma.gov or (413) 772-1549 to request a copy <strong>of</strong> the Plan.<br />
We look forward to your review <strong>of</strong> the Draft Greenfield Local Natural Hazards Mitigation Plan<br />
and any feedback that you may have.<br />
Sincerely,<br />
[Insert Name and Contact]<br />
Cc: Mary Praus, FRCOG<br />
Town <strong>of</strong> Greenfield Local Natural Hazard Mitigation Plan • January <strong>2011</strong>• Page 175
FRANKLIN REGIONAL<br />
COUNCIL OF GOVERNMENTS<br />
452 Main Street – Greenfield, Massachusetts 01301-3313<br />
Telephone 413-774-3167 – Fax 413-774-3169 – www.frcog.org<br />
Executive Director – Linda Dunlavy<br />
AGENDA<br />
Town <strong>of</strong> Greenfield<br />
Local Natural Hazards Mitigation Planning Committee Meeting<br />
Greenfield Town Hall<br />
14 Court Square<br />
August 18, 2010<br />
1:00 – 3:00 p.m.<br />
1. Introductions – Eric Twarog, Dept. <strong>of</strong> Planning & Development (1:00 p.m.)<br />
2. Overview <strong>of</strong> the 2010 <strong>plan</strong>ning process from MEMA and the changes to the Greenfield<br />
Natural Hazards Mitigation Plan – Kimberly Noake MacPhee, FRCOG (1:10 p.m.)<br />
3. General review <strong>of</strong> and comment on Draft <strong>of</strong> the Natural Hazards Mitigation Plan – Whit<br />
Sanford, FRCOG (1:30 p.m.)<br />
4. Review <strong>of</strong> Draft <strong>of</strong> Chapter 3: Hazard Identification & Analysis* – Whit Sanford,<br />
FRCOG (1:45 p.m.)<br />
5. Review <strong>of</strong> Draft <strong>of</strong> Chapter 4: Mitigation Strategies – Kimberly Noake MacPhee,<br />
FRCOG (2:15 p.m.)<br />
6. Review <strong>of</strong> Final Draft <strong>of</strong> Section 5: Plan Adoption and Maintenance – Whit Sanford,<br />
FRCOG (2:45 p.m.)<br />
7. Review <strong>of</strong> Draft Critical Facilities Map – Kimberly Noake MacPhee, FRCOG (as time<br />
permits)<br />
8. Next Steps (2:55 p.m.)<br />
__________________________<br />
*Materials to be distributed at the meeting.<br />
Town <strong>of</strong> Greenfield Local Natural Hazard Mitigation Plan • January <strong>2011</strong>• Page 176
FRANKLIN REGIONAL<br />
COUNCIL OF GOVERNMENTS<br />
452 Main Street – Greenfield, Massachusetts 01301-3313<br />
Telephone 413-774-3167 – Fax 413-774-3169 – www.frcog.org<br />
Executive Director – Linda Dunlavy<br />
MEMORANDUM: August 13, 2010<br />
FROM:<br />
TO:<br />
Whitty Sanford, Assistant Planner<br />
Natural Hazards Mitigation Plan Committee<br />
RE: Meeting on August 18, 2010<br />
Please read and be prepared to comment on the enclosed Greenfield Local Natural<br />
Hazards Mitigation Plan for our meeting on August 18 at 1:00 PM (see agenda). I<br />
sent most <strong>of</strong> you an electronic version earlier today, so that you would have an<br />
opportunity to read it over the weekend.<br />
FRCOG needs you to comment on the whole <strong>plan</strong>, but also wants your specific<br />
input on the revised sections (new text = underlined; deleted text = strike through;<br />
highlighted text = needs your specific input and expertise or is text that has yet to<br />
be updated by FRCOG staff). If you have any questions as you are reading the<br />
Plan, please don't hesitate to call Kimberly or me.<br />
We look forward to meeting with you and to discussing the Greenfield NHM Plan<br />
in depth this Wednesday.<br />
Town <strong>of</strong> Greenfield Local Natural Hazard Mitigation Plan • January <strong>2011</strong>• Page 177
Town <strong>of</strong> Greenfield Local Natural Hazard Mitigation Plan • January <strong>2011</strong>• Page 178
Town <strong>of</strong> Greenfield Local Natural Hazard Mitigation Plan • January <strong>2011</strong>• Page 179
In attendance:<br />
Eric Twarog, Director <strong>of</strong> Planning and Development<br />
Alan Twarog, Department <strong>of</strong> Public Works<br />
Town <strong>of</strong> Greenfield Local Natural Hazard Mitigation Plan • January <strong>2011</strong>• Page 180
Appendix E: Plan Approval and Adoption<br />
The Town <strong>of</strong> Greenfield Planning Board formally adopted this<br />
Local Multi-Hazard Mitigation Plan by<br />
vote at their meeting.<br />
Roxann Wedegartner, Chair<br />
Linda Smith, Vice Chair<br />
Mary Newton, Clerk<br />
James Allen<br />
Clayton Sibley<br />
Following approval by the Greenfield Planning Board, this Local Multi-Hazard<br />
Mitigation Plan was accepted by the Mayor <strong>of</strong> Greenfield<br />
William Martin<br />
Date<br />
Town <strong>of</strong> Greenfield Local Natural Hazard Mitigation Plan • January <strong>2011</strong>• Page 181