LGCDP M&E Framework
LGCDP M&E Framework
LGCDP M&E Framework

Create successful ePaper yourself
Turn your PDF publications into a flip-book with our unique Google optimized e-Paper software.
Ains<br />
Local Government and Community<br />
Development Programme<br />
MONITORING AND<br />
EVALUATION<br />
FRAMEWORK<br />
Local Government and Community Development Programme<br />
Ministry of Local Development<br />
Lalitpur, Nepal<br />
1
CONTENT<br />
1. <strong>LGCDP</strong> MONITORING AND EVALUATION FRAMEWORK 3<br />
1.1. GOAL 3<br />
1.2. PURPOSE 4<br />
1.3. OUTCOMES 7<br />
2. <strong>LGCDP</strong> MONITORING AND EVALUATION PLAN 21<br />
MONITORING 22<br />
EVALUATION 23<br />
REPORTING 24<br />
MONITORING AND EVALUATION PLAN 25<br />
ANNEX 1: MONITORING AND EVALUATION FRAMEWORK 28<br />
ANNEX 2: TEMPLATE FOR INDICATOR TRACKING SHEET 37<br />
ANNEX 3: QUESTIONS FOR SAMPLE SURVEYS 38<br />
2
1. <strong>LGCDP</strong> Monitoring and Evaluation<br />
<strong>Framework</strong><br />
The development and refinement of a Monitoring and Evaluation <strong>Framework</strong> for <strong>LGCDP</strong><br />
followed a three-step sequence:<br />
a) a careful, participatory analysis of the results statements,<br />
b) an analysis which key aspects of the result statement should be covered<br />
by indicators,<br />
c) the development of indicators with indicator baselines, indicator targets,<br />
means of verification, the frequency of collection and the responsible<br />
person or unit for collecting the data.<br />
These recommendations for a <strong>LGCDP</strong> M&E framework are the result of a broad, participatory<br />
process. They emerged from three one-day workshops with key stakeholders from the MLD,<br />
government agencies and development partners (DPs), individual meetings with key<br />
partners, a de-briefing workshop and two rounds of written comments on indicators and the<br />
draft framework.<br />
1.1. GOAL<br />
The overarching goal of <strong>LGCDP</strong> is “to contribute towards poverty reduction through<br />
inclusive responsive and accountable local governance and participatory<br />
community-led development that will ensure increased involvement of women,<br />
Dalits, Adibasi, Janajatis, Muslims Madhesis, disadvantaged groups in the local<br />
governance process”.<br />
To keep the <strong>LGCDP</strong> Monitoring and Evaluation <strong>Framework</strong> simple, yet effective, it is<br />
recommended to limit monitoring of the overall goal for two reasons:<br />
• An overall monitoring of national poverty reduction in Nepal is: (a) too ambitious<br />
for <strong>LGCDP</strong> and the MLD, and (b) already done extensively by a number of other<br />
actors in Nepal, including the National Planning Commission through its Poverty<br />
Monitoring and Analysis System and the Central Bureau of Statistics.<br />
• The second half of the goal statement (“through inclusive responsive and accountable<br />
local governance and participatory community-led development that will ensure<br />
increased involvement of women, Dalits, Adibasi, Janajatis, Muslims Madhesis,<br />
disadvantaged groups in the local governance process”) merely defines the means<br />
used for poverty reduction. These means are already captured on the purpose and<br />
outcome level and do not need to be monitored separately.<br />
Instead of building a parallel (and redundant) poverty monitoring system to monitor <strong>LGCDP</strong>’s<br />
goal, it is recommended to make use of existing poverty monitoring systems like the<br />
Poverty Monitoring and Analysis System (PMAS) of the National Planning Commission, the<br />
District Monitoring Information System (DMIS), the Nepal Human Development Reports and<br />
the Millennium Development Reports. If needed, <strong>LGCDP</strong> can provide specific support to<br />
these poverty monitoring systems to obtain poverty data at a highly disaggregated level, for<br />
example by supporting the District Poverty Monitoring and Analysis System (DPMAS).<br />
3
1.2. PURPOSE<br />
The purpose of <strong>LGCDP</strong> is the "improved access to locally and inclusively prioritised<br />
public goods and services".<br />
Analysis of Outcome formulation:<br />
• One key aspect of the outcome refers to improved access. Access to public goods<br />
and services is improved if citizens need less time to travel to the site where the<br />
service is provided and if the service is delivered in less time.<br />
• Another key aspect of the outcome statement refers to the fact that access is locally<br />
and inclusively prioritised. More in detail, this aspect refers to two concerns:<br />
o<br />
o<br />
“inclusively prioritised”: public goods and services to be provided by the<br />
DDCs, municipalities and VDCs are based on the demand of the local<br />
communities, including women, the poor and the disadvantaged groups<br />
“locally prioritised”: public goods and services to be provided by the DDCs,<br />
municipalities and VDCs are agreed upon by representatives of the groups<br />
from the area (rather than centrally), including women, the poor and the<br />
disadvantaged groups.<br />
• Public goods refers to public infrastructure provided or supported by local<br />
governments and line ministries at the local level. Based on consultations with key<br />
stakeholders, public goods of DDCs and VDCs in the context of <strong>LGCDP</strong> refers mostly<br />
to (ranked according to importance):<br />
1. road (earth roads)<br />
2. drinking water (reservoirs, pipes)<br />
3. education (school buildings, teacher salaries, primary & secondary schools) 1<br />
4. electricity (national grid, micro hydro)<br />
5. health<br />
• Public services in the context of <strong>LGCDP</strong> refers to the timely availability of services<br />
typically provided by DDCs, municipalities and VDCs like legal, registration and<br />
community services (e.g. vital registration, paralegal services, mediation) and social<br />
security (allowances for senior citizens, widows, disabled and single women, etc.).<br />
locally and<br />
inclusively prioritised<br />
access<br />
access to public goods<br />
(especially roads, drinking water, education,<br />
electricity, health)<br />
access to public services (especially legal,<br />
registration and community services as well as<br />
social security)<br />
1 These public goods can also be regarded as a public service.<br />
4
Access to public goods/general<br />
Indicator: Average time for rural households to reach the nearest of 15 key facilities in<br />
minutes and hours<br />
Rationale: The indicator provides a broad overview of changes in access to public goods. It is an<br />
equally weighted average of 15 facilities (as tracked by the Nepal Living Standard Survey):<br />
primary school, health post, bus stop, paved road, dirt road (vehicle passable and<br />
impassable), local shop, haatbazar, market centre, agriculture centre, sajha/cooperatives,<br />
commercial bank, source of water, post office, telephone booth.<br />
Limits: • The indicator refers only to rural households. The data for both rural and urban<br />
together is currently not published.<br />
• Data for the indicator is very similar to the data for the poorest quintile of<br />
households. The reason can be that poor households tend to live in rural areas.<br />
• The indicator needs to be manually calculated based on the data published in the<br />
NLSS.<br />
• The interval between data collection of the Nepal Living Standard Survey is long<br />
with seven years. The next Living Standard Survey is planned for 2010.<br />
• The data is taken from the cross section (rather than from the panel) because it is<br />
available sooner. 2<br />
Baseline: 1 hour 59 minutes (2003/2004)<br />
Target: 1 hour 30 minutes (2012)<br />
Means of<br />
Nepal Living Standard Survey (cross section)<br />
Verification<br />
Frequency every 7 years<br />
Responsibility Central Bureau of Statistics<br />
Access to public goods/roads<br />
Indicator: % of rural households which have access to a dirt road (vehicle passable) within<br />
30 minutes<br />
Rationale: The construction of vehicle passable dirt roads is a typical service provided by local<br />
governments through <strong>LGCDP</strong>. This indicator focuses on the rural areas, where the gap is<br />
wider. The data refers to the time for one-way travel to the facility, irrespective of the<br />
mode of transport.<br />
Limits: • The interval between data collection of the Nepal Living Standard Survey is long<br />
with seven years. The next Living Standard Survey is planned for 2010.<br />
• To bridge the gap, the <strong>LGCDP</strong> Sample Surveys can collect data for this indicator<br />
in-between NLSS cycles. However, the data collected through these two tools<br />
might not be 100% comparable.<br />
Baseline: 67.6% (2003/2004)<br />
Target: 75% (2012)<br />
Means of<br />
Nepal Living Standard Survey (cross section) / <strong>LGCDP</strong> Sample Surveys<br />
Verification<br />
Frequency every 7 years / 2 years (2009, 2011, 2013)<br />
Responsibility Central Bureau of Statistics / M&E Section of MLD<br />
Indicator: Mean time taken by rural households to reach nearest dirt road (vehicle<br />
passable) in hours and minutes<br />
Rationale: The construction of vehicle passable dirt roads is a typical services provided by local<br />
governments through <strong>LGCDP</strong>. This indicator focuses on the rural areas, where the gap is<br />
wider (for urban areas, the average time is only 3 minutes). The data refers to the time for<br />
one-way travel to the facility, irrespective of the mode of transport.<br />
Limits: • see above<br />
Baseline: 3 hours 7 minutes (2003/2004)<br />
Target: 2 hours 30 minutes (2012)<br />
Means of<br />
Nepal Living Standard Survey (cross section) / <strong>LGCDP</strong> Sample Surveys<br />
Verification<br />
Frequency every 7 years / 2 years (2009, 2011, 2013)<br />
Responsibility Central Bureau of Statistics / M&E Section of MLD<br />
2 Cross section Living Standard data is published sooner than the data from the household panel. The cross section data from<br />
the NLSS 2003/2004, for example, was published in December 2004, while the analysis of panel households was published only<br />
in March 2006.<br />
5
Access to public goods/drinking water<br />
Indicator: % of rural households with sustainable access to improved water source<br />
Rationale: Drinking water through reservoirs and pipes is a typical service provided by local<br />
governments through <strong>LGCDP</strong>.<br />
Limits:<br />
According to the Nepal Demographic and Health Surveys, “improved source” refers to piped<br />
water into house/yard/plot, public tap/standpipe, tube well or borehole, protected dug,<br />
protected spring and rainwater. Non-improved source include unprotected dug well,<br />
unprotected spring, tanker truck, surface water.<br />
Baseline: 80.2% (2006)<br />
Target:<br />
Target to be determined<br />
Means of<br />
Nepal Demographic and Health Surveys<br />
Verification<br />
Frequency not known<br />
Responsibility Population Division, Ministry of Health and Population<br />
Access to public services<br />
Indicators: • % of citizens that say that the services of DDCs are more accessible than<br />
they were one year ago<br />
• % of citizens that say that the services of VDCs are more accessible than<br />
they were one year ago<br />
• % of citizens that say that the services of municipalities are more<br />
accessible than they were one year ago<br />
Rationale: Apart from access to infrastructure, this indicator captures changes in perceived<br />
accessibility of public services delivered by the DDC, VDCs and municipalities. The indicator<br />
generally captures “access” to services, which includes that the person providing the<br />
service is available, accessible, able and capable of providing it. The indicator tracks<br />
changes in perception over a one-year period rather than a static measure of client<br />
satisfaction.<br />
Limits: • This indicator does not disaggregate the different types of services provided by<br />
the DDCs/VDCs/municipalities, but gives an overall picture of changes in the<br />
perceptions of citizens. The data is obviously subjective and influenced by many<br />
external factors. However, at a highly aggregated level and tracked over<br />
numerous years the data will be able to show trends and tendencies.<br />
• The one-year recall was chosen because changes in perception can be reasonably<br />
expected within a year, and it is not too far for citizens to still be able to<br />
remember the status 12 months ago.<br />
Baseline: To be determined by <strong>LGCDP</strong> baseline survey in 2009<br />
Target:<br />
To be determined after the <strong>LGCDP</strong> baseline survey<br />
Means of<br />
<strong>LGCDP</strong> sample surveys<br />
Verification<br />
Frequency every 2 years (2009, 2011, 2013)<br />
Responsibility M&E Section of MLD<br />
6
1.3. OUTCOMES<br />
OUTCOME 1<br />
<strong>LGCDP</strong> Outcome 1: Citizens and Communities engaged actively with Local<br />
Governments and hold them accountable<br />
Analysis of Outcome formulation:<br />
• The outcome contains two separate but related elements: a) engagement with<br />
local governments, and b) holding local governments accountable.<br />
• Although the outcome refers to both citizens as well as communities, the programme<br />
implies that in many cases, citizens will engage with local governments through<br />
community organizations.<br />
• Although not specifically mentioned in the outcome formulation, the logic of <strong>LGCDP</strong><br />
implies a particular emphasis on engaging those citizens who have previously not<br />
been involved in community organizations and in local government. Many (but not<br />
all) of these citizens will be members of a marginalized group and/or women.<br />
• Communities broadly refers to permanent and temporary communities and to<br />
formal as well as informal communities.<br />
• “Engaged” refers to an involvement during planning, decision-making,<br />
implementation and monitoring of local government activities. It refers to a<br />
participatory approach and should result in a high degree of ownership.<br />
• Local governments refer to District Development Committees (DDCs), Village<br />
Development Committees (VDC) and Municipalities.<br />
• Holding local governments accountable includes two key elements: a) being aware<br />
and understanding what local government can/should do, b) transparency by being<br />
able to ask questions to local governments on financial and other issues.<br />
citizens and communities engaged actively with Local Governments and<br />
hold them accountable<br />
engagement<br />
with local<br />
governments<br />
holding local<br />
governments<br />
accountable<br />
planning implementation representation inclusion knowledge transparency<br />
7
a) ENGAGEMENT WITH LOCAL GOVERNMENTS<br />
Engaging with local governments, together with holding them accountable, is a key component of this outcome.<br />
It refers to engagements in planning and implementation of local government activities and is based on an<br />
inclusive process. Taking part in local government is the ultimate level of active engagement.<br />
Indicators: • % of citizens that think that they are now more involved in the decisionmaking<br />
process of DDCs than one year ago<br />
• % of citizens that think that they are now more involved in the decisionmaking<br />
process of VDCs than one year ago<br />
• % of citizens that think that they are now more involved in the decisionmaking<br />
process of municipalities than one year ago<br />
Rationale: These three indicators track the level of satisfaction with being engaged in local<br />
governance. It is based on the recall method and refers to one year.<br />
Limits: • These indicators are based on subjectively perceived levels of engagement as a proxy<br />
for actual changes in engagement with local governments The data is obviously<br />
subjective and influenced by external factors. However, at a highly aggregated level<br />
and tracked over numerous years the data will be able to show trends and tendencies.<br />
Baseline: To be determined by <strong>LGCDP</strong> baseline survey in 2009<br />
Target:<br />
To be determined after the <strong>LGCDP</strong> baseline survey<br />
Means of<br />
<strong>LGCDP</strong> Sample Surveys<br />
Verification<br />
Frequency every 2 years (2009, 2011, 2013)<br />
Responsibility M&E Section of MLD<br />
Planning<br />
Indicator: % of all ward committees which hold at least one planning meeting per year<br />
Rationale: This indicator broadly reflects the level of citizen’s engagement in the planning process at<br />
local levels by tracking how many ward committees are functioning (defined as holding at<br />
least one planning meeting per year). This indicator is supplemented by the indicator<br />
below.<br />
Limits: • The % figure will initially be low due to the fact that the most of the wards<br />
committees are currently not established and/or functional.<br />
• There are 9 wards in each of the 3,915 VDCs and 9 to 35 wards in a municipality,<br />
resulting in approximately 36,000 wards.<br />
Baseline:<br />
Target:<br />
Means of<br />
Verification<br />
Frequency<br />
Responsibility<br />
currently not available; the data should be collected through two sources:<br />
• sample surveys conducted by MLD<br />
• collection of administrative data from VDCs, DDCs to MLD<br />
Sample surveys can continue to collect this data for triangulation and quality control of<br />
administrative data. An indicative target is 90%.<br />
every 2 years (2009, 2011, 2013 for sample survey) / annually (administrative data)<br />
M&E Section of MLD (for both survey and administrative data)<br />
Indicator: Total number of citizens who participate in planning meeting at ward level per<br />
year in Nepal<br />
Rationale: The overall number of participants at ward planning meetings over time is an additional,<br />
broad measure of the changing levels of participation at the grass-root level. In addition,<br />
the aggregation of data through administrative channels will be a major step constructing<br />
information gathering channels through the MLD M&E Section. This indicator complements<br />
the indicator above.<br />
Limits: • Not all wards will immediately have planning meetings in year one of <strong>LGCDP</strong>. The<br />
numbers therefore only reflect those wards where planning meetings have taken<br />
place.<br />
Baseline:<br />
see above<br />
Target:<br />
Means of<br />
Verification<br />
Frequency every 2 years (2009, 2011, 2013 for sample survey) / annually (administrative data)<br />
Responsibility M&E Section of MLD (for both survey and administrative data)<br />
8
Indicators: • % of participants at all ward level planning meetings in Nepal per year who<br />
are Dalits (as proxy for all DAGs)<br />
• % of participants at all ward level planning meetings in Nepal per year who<br />
are women<br />
Rationale: This data is a broad measure of the inclusiveness of the planning process at the grassroot<br />
level. It refers to Dalits as a proxy for all disadvantaged groups and to women as a<br />
key disadvantaged group.<br />
Limits: • The correlation between Dalits and disadvantaged groups in general is reportedly<br />
high. The first indicator is a simple proxy (indirect) indicator to measure the level<br />
of participation of all disadvantaged groups (Dalits, Adibasi, Janajatis, Muslims,<br />
Madhesis).<br />
Baseline:<br />
Target:<br />
Means of<br />
Verification<br />
Frequency<br />
Responsibility<br />
currently not available; the data should be collected through two sources:<br />
• sample surveys conducted by MLD<br />
• collection of administrative data from VDCs, DDCs to MLD<br />
sample surveys can continue to collect this data for triangulation and quality control of<br />
administrative data<br />
every 2 years (2009, 2011, 2013 for sample survey) / annually (administrative data)<br />
M&E Section of MLD (for both survey and administrative data)<br />
Indicator: % of project proposals submitted by women’s groups in VDC annual plans<br />
Rationale: This indicator is a proxy for the capacity and skills of a key disadvantaged group, women,<br />
to participate in local planning. The underlying assumption is that better knowledge,<br />
abilities and skills in women’s groups will translate into a higher percentage of projects<br />
being funded.<br />
Limits: • This indicator tracks the % of projects proposed, but does not capture the extent<br />
to which these proposals are actually funded. But because this indicator is a<br />
proxy for changes in capacity and skills, this limit is intentional.<br />
• This indicator does not chapter change in capacity and skills of other<br />
disadvantaged groups. The reason for this is that <strong>LGCDP</strong> does not want to<br />
discourage mixed groups, which would make it difficult what constitutes a DAG<br />
group and what not.<br />
Baseline:<br />
Target:<br />
Means of<br />
Verification<br />
Frequency<br />
Responsibility<br />
currently not available; the data should be collected through two sources:<br />
• sample surveys conducted by MLD<br />
• collection of administrative data from VDCs, DDCs to MLD<br />
sample surveys can continue to collect this data for triangulation and quality control of<br />
administrative data<br />
every 2 years (2009, 2011, 2013 for sample survey) / annually (administrative data)<br />
M&E Section of MLD (for both survey and administrative data)<br />
Implementation<br />
Indicator: % of VDCs and municipality block grants spent on projects requested by<br />
exclusively women’s or disadvantaged groups through the ward committee (as<br />
defined in the Interim Constitution)<br />
Rationale: • This indicator is goes beyond participation and tracks the funds actually spent on<br />
proposals by women’s or disadvantaged groups<br />
Limits: • The local government guidelines stipulate that a minimum 15% of block grant from the<br />
central government goes to women or members of DAGs. The <strong>LGCDP</strong> GE/SI strategy<br />
suggests a minimum of 25%.<br />
• The indicator will therefore measure a) to what extent the guidelines are followed, and<br />
b) if and to what extent local bodies go beyond the 15% minimum.<br />
• For the sake of simplicity, this indicator aggregates the data for both VDCs and<br />
municipalities. However, arriving at this % figure implies that separate data also must<br />
be available.<br />
Baseline: To be determined by <strong>LGCDP</strong> baseline survey in 2009<br />
Target: 30% (2012)<br />
Means of<br />
Verification<br />
Frequency<br />
Responsibility<br />
Data should be collected through two sources:<br />
• sample surveys conducted by MLD<br />
• collection of administrative data from VDCs, DDCs to MLD<br />
sample surveys can continue to collect this data for triangulation and quality control of<br />
administrative data<br />
every 2 years (2009, 2011, 2013 for sample survey) / annually (administrative data)<br />
M&E Section of MLD (for both survey and administrative data)<br />
9
Representation<br />
Indicator: Number of poor households (based on 8 indicators used in MLD DAG mapping) where<br />
no member was previously engaged in any organization in the last 3 years, but<br />
now is engaged in either school management committee, health management<br />
committee or VDC<br />
Rationale: • This indicator looks at the number of people who have been left out of the decisionmaking<br />
process at local level in the past but could be encouraged be become engaged<br />
in some way.<br />
Limits: • This indicator tracks membership in three key organizations at the local level: the<br />
school management committee, the health management committee and the Village<br />
Development Committee) as a proxy for all organizations closely related to<br />
participation in decision-making at the local level.<br />
• Data for this indicator is difficult to collect and based on a previous DAG mapping<br />
exercise. However, this data is at the core <strong>LGCDP</strong>, therefore collecting data for it is<br />
paramount.<br />
Baseline:<br />
To be determined after first data collection by social mobilizers<br />
Target:<br />
To be determined after<br />
Means of<br />
Verification<br />
This data will need to be collected through administrative data from <strong>LGCDP</strong>’s social<br />
mobilizers. The details for this data collection exercise still need to be established.<br />
Frequency annually<br />
Responsibility M&E Section of MLD through social mobilizsers<br />
Indicators: • % of women in all Integrated Planning Committees at VDC level<br />
• % of members of disadvantaged groups in all Integrated Planning<br />
Committees at VDC level<br />
Rationale: • This indicator reflects the level of representation by women and disadvantaged groups<br />
in the planning process at VDC, DDC and municipality level.<br />
Limits: • Currently, Integrated Planning Committees do not exist. The percentage figure<br />
depends on the number of Integrated Planning Committees formed.<br />
• The first of these indicators tracks only the VDC level as a proxy for the DDC and the<br />
municipality level. The underlying assumption is that clear changes at the VDC level<br />
will most likely be reflected at the DDC and municipality level.<br />
Baseline: To be determined by <strong>LGCDP</strong> baseline survey in 2009<br />
Target:<br />
To be determined after the <strong>LGCDP</strong> baseline survey<br />
Means of<br />
Verification<br />
Frequency<br />
Responsibility<br />
Inclusion<br />
Data should be collected through two sources:<br />
• sample surveys conducted by MLD<br />
• collection of administrative data from VDCs, DDCs to MLD<br />
sample surveys can continue to collect this data for triangulation and quality control of<br />
administrative data<br />
every 2 years (2009, 2011, 2013 for sample survey) / annually (administrative data)<br />
M&E Section of MLD (for both survey and administrative data)<br />
Indicators: • % of total budget of DDCs which explicitly targets women<br />
• % total budget of DDCs which explicitly targets members of disadvantaged<br />
groups<br />
Rationale: • These indicators go beyond block grants and track ‘inclusiveness’ by looking at the<br />
overall share of the DDC budget which is spent on women and members of<br />
disadvantaged groups<br />
Limits: • The difficulty will be to determine objectively if funds are explicitly target women<br />
and/or disadvantaged groups or if they only implicitly effect them (but many others as<br />
well). The definitions will need be clearly laid out in the Gender and DAG Budget Audit<br />
guidelines.<br />
Baseline: To be determined by <strong>LGCDP</strong> baseline survey in 2009<br />
Target:<br />
To be determined after the <strong>LGCDP</strong> baseline survey<br />
Means of<br />
Verification<br />
Frequency<br />
Responsibility<br />
Data should be collected through three sources:<br />
• <strong>LGCDP</strong> Sample Surveys,<br />
• Gender Budget Audits<br />
• Sample DAG Budget Audits<br />
every 2 years (2009, 2011, 2013 for sample survey) / annually (administrative data)<br />
M&E Section of MLD / GESI Section of MLD<br />
10
) ACCOUNTABILITY<br />
The following indicators refer to knowledge rather than directly accountability. The reason for it is that knowledge<br />
is a prerequisite for asking questions to local governments. Without knowing key information, asking questions on<br />
financial issues is difficult. These indicators are more sensitive to change than direct indicators on accountability<br />
and serve as an indirect proxy for the process leading to accountability.<br />
Municipalities<br />
Indicators: • % of citizens who can identify at least three concrete, completed activities<br />
of the municipality in the past 12 months<br />
• % of citizens who can approximately identify the total annual budget of<br />
municipalities during the current year (+/-20%)<br />
Rationale: Knowledge is a prerequisite for accountability and transparency. These indicators track the<br />
level of knowledge on the activities by municipalities and their approximate annual budget.<br />
Limits: • These indicators track changes in knowledge over time.<br />
• The sample survey must be conducted to exclude activities by NGOs and focus merely<br />
on activities by municipalities.<br />
Baseline: To be determined by <strong>LGCDP</strong> baseline survey in 2009<br />
Target:<br />
To be determined after the <strong>LGCDP</strong> baseline survey<br />
Means of<br />
<strong>LGCDP</strong> sample surveys<br />
Verification<br />
Frequency Every 2 years (2009, 2011, 2013)<br />
Responsibility M&E Section of MLD<br />
VDCs<br />
Indicators: • % of citizens who can identify at least three concrete, completed activities<br />
of the VDC in the past 12 months<br />
• % of citizens who can approximately identify the total annual budget of the<br />
VDCs during the current year(+/-20%)<br />
Rationale: see above<br />
Limits:<br />
see above<br />
Baseline: To be determined by <strong>LGCDP</strong> baseline survey in 2009<br />
Target:<br />
To be determined after the <strong>LGCDP</strong> baseline survey<br />
Means of<br />
<strong>LGCDP</strong> sample surveys<br />
Verification<br />
Frequency Every 2 years (2009, 2011, 2013)<br />
Responsibility M&E Section of MLD<br />
DDCs<br />
Indicator: • % of citizens who can identify at least three concrete, completed activities<br />
of the DDC in the past 12 months<br />
Rationale: see above<br />
Limits:<br />
see above<br />
Baseline: To be determined by <strong>LGCDP</strong> baseline survey in 2009<br />
Target:<br />
To be determined after the <strong>LGCDP</strong> baseline survey<br />
Means of<br />
<strong>LGCDP</strong> sample surveys<br />
Verification<br />
Frequency Every 2 years (2009, 2011, 2013)<br />
Responsibility M&E Section of MLD<br />
11
OUTCOME 2<br />
<strong>LGCDP</strong> Outcome 2: Increased capacity of local governments to manage resources<br />
and deliver basic services in an inclusive and equitable manner<br />
Analysis of Outcome formulation:<br />
• The outcome primarily refers to the capacity of the three entities of local<br />
governments: DDCs, municipalities and VDCs.<br />
• The outcome explicitly refers to two types of capacity: a) the capacity to manage<br />
resources, and b) the capacity to deliver basic social services.<br />
• The capacity to manage resources implies planning, implementing, monitoring and<br />
reporting on resources.<br />
• The delivery of basic social services refers to those basic services which are<br />
typically provided by DDCs, municipalities, and VDCs.<br />
• While not explicit, the outcome also contains the perspective of a sustainable<br />
increase in local resources. A key element of sustainability is the increasing<br />
mobilization of internal revenues.<br />
• In addition, the outcome refers to the fact that both the management of resources<br />
and delivery of basic social services should be done in an inclusive and equitable<br />
manner.<br />
Outcome Indicators<br />
Capacity of<br />
DDCs, municipalities and VDCs to manage<br />
resources and deliver basic services in an inclusive<br />
an equitable manner<br />
manage resources<br />
deliver basic social services<br />
12
a.) MANAGING RESOURCES<br />
DDCs<br />
Indicator: % of all 75 DDCs that meet all 15 minimum Conditions (as defined in 12/2008<br />
by MLD based on LSGA 1999) per fiscal year<br />
Rationale: This indicator broadly reflects the extent to which DDCs fulfil the minimum requirements<br />
for managing resources as defined in the Local Self-Government Act 1999.<br />
Limits: • Currently, only 12 of a total of 15 indicators are in use due to the absence of local<br />
elections. Until local elections are held, DDCs are assessed based on 12 instead of<br />
15 indicators.<br />
Baseline: 63% (06/2008)<br />
Target: 100% (12/2012)<br />
Means of<br />
National Synthesis Report by the Local Bodies Fiscal Commission (LBFC)<br />
Verification<br />
Frequency annually<br />
Responsibility Local Bodies Fiscal Commission (LBFC)<br />
Indicator: % of all 75 DDCs that score above 50 point in all 62 performance measurements<br />
and meet minimum score in all 8 functional areas per fiscal year<br />
Rationale: This composite, qualitative indicator broadly reflects the performance of DDCs in managing<br />
resources. Performance is measured through a score card with up to 100 points, including<br />
8 topics: planning and programme management performance, budget management,<br />
financial management performance, fiscal resource mobilization capacity, budget release<br />
and programme execution, communication and transparency, monitoring and evaluation,<br />
organization, service delivery and property management<br />
Limits: • Currently, only 57 out of 62 performance measurement criteria can be used due<br />
to the absence of elected local bodies.<br />
• For the baseline data collection in 2008, a slightly revised indicator framework was<br />
used then for the assessment in 2009. Slight modifications in this composite<br />
qualitative indicator can also be expected in the future, but should not effect the<br />
overall picture provided by this indicator.<br />
Baseline: 41% (06/2008)<br />
Target: 90% (12/2012)<br />
Means of<br />
National Synthesis Report by the Local Bodies Fiscal Commission (LBFC)<br />
Verification<br />
Frequency annually<br />
Responsibility Local Bodies Fiscal Commission (LBFC)<br />
Indicator: % of all 75 DDCs that spend more than 80% of planned capital development<br />
budget per year<br />
Rationale: This indicator refers to the capacity of DDCs to make use of earmarked funding. “Planned<br />
capital development budget” refers to budget line 6.4., 6.5., and 6.6.<br />
Limits: • An analysis of LBFC financial records needs to be done to calculate a baseline<br />
figure. The documentation required for such an analysis is reportedly available.<br />
Baseline: To be determined by analyzing LBFC financial records in 2009<br />
Target: To be determined after analyzing LBFC financial records in 2009<br />
Means of<br />
Local Bodies Fiscal Commission (LBFC) financial records<br />
Verification<br />
Frequency annually<br />
Responsibility Local Bodies Fiscal Commission (LBFC)<br />
13
Indicator: % of all 75 DDCs that spend more than 10% of internal income explicitly on<br />
women, children, DAGs, ethnic groups, disabled and old people per fiscal year<br />
Rationale: This indicator measures the extent to which DDCs spend their own resources at least<br />
partially on marginalized groups.<br />
Limits: • The indicator does only count DDCs that spend more than 10% of internal resources<br />
on marginalized groups. It does not capture the how much more DDCs spend above<br />
10% of internal income.<br />
• The indicator lumps together a diverse and large group of marginalized people.<br />
However, better and more disaggregated is currently not collected through the MC/PM<br />
system of MLD.<br />
Baseline: 29% (06/2008)<br />
Target: 75% (12/2012)<br />
Means of<br />
Annual MC/PM assessment report for DDCs<br />
Verification<br />
Frequency annually<br />
Responsibility Local Bodies Fiscal Commission (LBFC)<br />
Indicator: % of all 75 DDCs that have less then 2% irregular expenditure (Beruju)<br />
Rationale: This indicator measures the extent to which DDCs are following financial rules and<br />
regulations.<br />
Limits: • In this indicator, “irregular expenditure (Beruju)” is defined as per audit reports.<br />
• The indicator does only count those DDCs that have less than 2% irregular<br />
expenditures. It does not capture the extent to which DDCs approach 0% irregular<br />
expenditures or surpass the 2% threshold.<br />
Baseline: 9% (06/2008)<br />
Target: 80% (2012)<br />
Means of<br />
National Synthesis Report by the Local Bodies Fiscal Commission (LBFC)<br />
Verification<br />
Frequency annually<br />
Responsibility Local Bodies Fiscal Commission (LBFC)<br />
Municipalities<br />
Indicator: % of all 58 municipalities that meet the Minimum Conditions (as defined by<br />
MLD) per year<br />
Rationale: This indicator broadly reflects the extent to which municipalities fulfil the minimum<br />
requirements for managing resources as defined in the Local Self-Government Act 1999.<br />
Limits: -<br />
Baseline: not available yet; first assessment of municipalities will be done in June 2009<br />
Target: 100% (2012)<br />
Means of<br />
National Synthesis Report by the Local Bodies Fiscal Commission (LBFC)<br />
Verification<br />
Frequency annually<br />
Responsibility Local Bodies Fiscal Commission (LBFC)<br />
Indicator(s) on performance measurements to be defined pending the finalization of the municipality MC/PM<br />
guidelines<br />
14
VDCs<br />
Indicator: % of all 3915 VDCs that meet the Minimum Conditions (as defined by MLD)<br />
Rationale: This indicator broadly reflects the extent to which VDCs fulfil the minimum requirements for<br />
managing resources as defined in the Local Self-Government Act 1999.<br />
Limits: • For the baseline, only 900 VDCs will be assessed in June 2009. The number will<br />
gradually be increased to include all 3915 VDCs. Therefore, the % figure in the<br />
indicator will refer to a changing total of VDCs.<br />
Baseline:<br />
not available yet; will be collected through a VDC assessment for initially 900 VDCs in June<br />
2009<br />
Target: 100% (2012)<br />
Means of<br />
National Synthesis Report by the Local Bodies Fiscal Commission (LBFC)<br />
Verification<br />
Frequency annually<br />
Responsibility Local Bodies Fiscal Commission (LBFC)<br />
MONITORING AND REPORTING<br />
Indicator: % of <strong>LGCDP</strong> outcome indicators (for which data supposed to be available) are<br />
updated per year<br />
Rationale: This indicator broadly reflects the ability of local bodies and the Ministry of Local<br />
Development to obtain, enter, process and aggregate data, including administrative data<br />
collected directly by the MLD from the local level.<br />
Limits: • The M&E framework for <strong>LGCDP</strong> is limited to key data and refers specifically to<br />
<strong>LGCDP</strong>. However, this indicator can serve as a proxy for the overall capacity to<br />
streamline data collection and aggregation from VDCs to DDCs, and thereby to<br />
MLD.<br />
• The indicator only refers to the outcome level, since purpose indicators will not be<br />
updated every year.<br />
Baseline:<br />
not available; will be collected once the performance monitoring framework of <strong>LGCDP</strong> is<br />
finalized;<br />
Target: 100% (2012)<br />
Means of<br />
<strong>LGCDP</strong> indicator tracking sheets<br />
Verification<br />
Frequency annually<br />
Responsibility M&E Section of MLD<br />
Indicator: % of DDCs that submit to MLD an annual report (based on a template designed<br />
by the MLD which includes a synthesized report on VDCs) within 15th August<br />
Rationale: This indicator broadly reflects the ability of DDCs to obtain key data from VDCs.<br />
Limits: • A new reporting template still needs to be designed by MLD.<br />
Baseline:<br />
not available; will be collected during the first year when the new template is available<br />
Target: 100% (2012)<br />
Means of<br />
Reports from DDCs submitted to MLD<br />
Verification<br />
Frequency annually<br />
Responsibility M&E Section of MLD<br />
15
) BASIC SOCIAL SERVICES<br />
Indicator: % of citizens who say that the infrastructure (roads, drinking water, electricity)<br />
offered by the local governments better meet their needs than last year<br />
Rationale: This indicator reflects the perception of citizens that basic social services by local<br />
governments in general (DDCs, VCDs and municipalities) has improved over the past year.<br />
This indicator also serves as a very indirect proxy of client satisfaction for other services<br />
provided by local governments.<br />
Limits: • The indicator relies on proper questioning and a recall technique.<br />
Baseline: To be determined by <strong>LGCDP</strong> baseline survey in 2009<br />
Target:<br />
To be determined after the <strong>LGCDP</strong> baseline survey<br />
Means of<br />
Sample surveys by MLD<br />
Verification<br />
Frequency Every 2 years (2009, 2011, 2013)<br />
Responsibility M&E Section of MLD<br />
Indicator: % of DDCs which increase their internal revenues (excluding central grants) by<br />
at least 15% compared to the previous fiscal year<br />
Rationale: This indicator reflects the extent to which DDCs manage to increase internal revenue<br />
collection. The indicator is:<br />
• a proxy indicator for an increase in management capacity of DDC staff<br />
• a indicator for sustainability of local governance, since internal revenues can<br />
become a cornerstone of financing social services on the district level;<br />
Limits: • The indicator does not reflect the extent to which individual DDCs exceed a<br />
15% increase.<br />
Baseline: To be determined by <strong>LGCDP</strong> baseline survey in 2009<br />
Target:<br />
To be determined after the baseline survey<br />
Means of<br />
Sample Surveys by MLD<br />
Verification<br />
Frequency Every two years (2009, 2011, 2013)<br />
Responsibility M&E Section of MLD<br />
Indicator: Number of <strong>LGCDP</strong> pilot projects which were scaled up with government or<br />
development partner funds outside the <strong>LGCDP</strong> budget<br />
Rationale: This indicator reflects the extent to which pilot projects initiated by the <strong>LGCDP</strong> has been<br />
successful and are regarded as promising initiatives worth further, external funding.<br />
Limits: • The indicator is based on the assumption that if pilots are proven to be<br />
successful, additional funding is available to scale up these interventions.<br />
Baseline: 0 (4/2009)<br />
Target: 3 (04/2012)<br />
Means of<br />
MLD reports<br />
Verification<br />
Frequency annually<br />
Responsibility M&E Section of MLD<br />
16
OUTCOME 3<br />
<strong>LGCDP</strong> Outcome 3: Strengthened policy and national institutional framework for<br />
devolution and local self-governance<br />
Analysis of Outcome formulation:<br />
• The outcome refers to two broad issues: a) policies and b) the institutional<br />
framework for devolution.<br />
• Policies refers to laws passed by the parliament and regulations and guidelines<br />
produced by the cabinet and by ministries. Although the constitution is not a policy, it<br />
plays a significant role for setting policies in the current context for devolution in<br />
Nepal. Equally, strategies refer to the implementation of policies.<br />
• The “national institutional framework” refers to institutions beyond the Ministry<br />
of Local Development.<br />
• “Devolution” and “local self-governance” are similar concepts, but devolution is<br />
more concrete in further defining a certain type of local self-governance.<br />
Outcome 3<br />
policy for devolution is stronger (staffing<br />
policies, Sector-Wide Approach, sector<br />
devolution)<br />
national institutional framework is stronger (Local<br />
Bodies Fiscal Commission, DMIS)<br />
17
SECTOR WIDE APPROACH<br />
Indicator: Number of development partners that sign a Joint Financial Agreement<br />
Rationale: This indicator reflects the extent to which Nepal is moving towards a Sector-Wide Approach<br />
in Decentralization and Devolution. The Joint Financial Agreement is an important step<br />
towards a Sector-Wide Approach, which will realistically not be fully realized until 2012.<br />
Limits: • The assumption for this indicator is that the more development partners join<br />
the Joint Financial Agreement, the more a SWAp is perceived by development<br />
partners as a viable path to support the Government of Nepal.<br />
Baseline: 0 (4/2009)<br />
Target: 10 (2012)<br />
Means of<br />
Joint Financial Agreement document<br />
Verification<br />
Frequency trimesterely<br />
Responsibility <strong>LGCDP</strong> PCU<br />
Indicator:<br />
Rationale:<br />
Total funds paid into Joint Financial Agreement basket in million USD<br />
This indicator complements the indicator above by adding total funds to the number of<br />
development partners. Only the two indicators together provide a complete picture of<br />
progress towards a SWAp.<br />
Limits: • see above<br />
Baseline: 0m (4/2009)<br />
Target: 400m (2012)<br />
Means of<br />
<strong>LGCDP</strong> financial records<br />
Verification<br />
Frequency trimesterely<br />
Responsibility <strong>LGCDP</strong> PCU<br />
SECTOR DEVOLUTION<br />
Indicator: Number of Secretary-level meetings, participated in by at least five line<br />
ministries that explicitly include agenda on decentralization, held per year<br />
Rationale: This indicator is an indirect proxy indicator for the level of coordination and importance of<br />
decentralization in key sectors. As a proxy indicator, it does not imply that <strong>LGCDP</strong> aims at<br />
increasing the number of Secretary-level meetings, but serves as an indication of<br />
decentralization is taking on a more prominent role in Nepal.<br />
Limits: • The number of meetings itself does not reflect sector devolution, but can<br />
serve as a valid proxy in the absence of a more direct indicator. The<br />
underlying assumption is that a significant increase over time in discussions<br />
on decentralization at the level of Secretaries indicates a change in the level<br />
of coordination and importance of Decentralization<br />
Baseline: 0 (2008)<br />
Target: 3 (2012)<br />
Means of<br />
Meeting agenda of MLD<br />
Verification<br />
Frequency annually<br />
Responsibility Policy Coordination Committee/Decentralization Section at MLD<br />
18
STAFFING POLICIES<br />
Indicator: Local Service Commission Act passed to regularize local recruitment<br />
Rationale: The Local Service Commission Act is a key element to improve staffing policies.<br />
Limits: • The act itself does not indicate changes in staffing itself, but is an indicator<br />
for staffing policies. The effect on staffing itself is captured by additional<br />
indicators.<br />
Baseline: No (2009)<br />
Target: Yes (2012)<br />
Means of<br />
Local Service Commission Act<br />
Verification<br />
Frequency annually<br />
Responsibility M&E Section of MLD<br />
Indicator: % of local government staff (DDCs, municipalities and VDCs) that are women<br />
Rationale: With the staffing policies in place, changes in staff composition are to be expected over<br />
time. Women are a key target group of <strong>LGCDP</strong> and are therefore captured through this<br />
indicator.<br />
Limits: • This indicator does not distinguish between different levels of local<br />
government adminstrations. However, at an aggregated level it provides an<br />
indication of change over the years.<br />
• The indicator aggregates data for DDCs, municipalities and VDCs, thereby<br />
potentially blurring differences between the three levels of local governance<br />
in Nepal.<br />
• Data should be collected through the <strong>LGCDP</strong> sample surveys and<br />
administrative data through the MLD. Sample surveys can continue to collect<br />
this data for triangulation and quality control of administrative data.<br />
Baseline: To be determined by <strong>LGCDP</strong> baseline survey in 2009<br />
Target: 33% (2012)<br />
Means of<br />
<strong>LGCDP</strong> Sample survey / administrative data<br />
Verification<br />
Frequency Every 2 years / annually<br />
Responsibility MLD M&E Section / MLD Personnel Administration Section<br />
Indicator: % of local government staff (DDCs, municipalities and VDCs) that are Dalits (as<br />
proxy for all disadvantaged groups)<br />
Rationale: With the staffing policies in place, changes in staff composition are to be expected over<br />
time. Dalits serve as a proxy for all disadvantaged groups.<br />
Limits: • Given the difficulty in clearly defining and identifying who belongs to a<br />
disadvantaged group, Dalits serve as a proxy for all disadvantaged groups.<br />
The underlying assumption is that changes in the staffing level of Dalits are<br />
likely to indicate changes in the staffing level for other disadvantaged groups.<br />
• The indicator aggregates data for DDCs, municipalities and VDCs, thereby<br />
potentially blurring differences between the three levels of local governance<br />
in Nepal.<br />
• Data should be collected through the <strong>LGCDP</strong> sample surveys and<br />
administrative data through the MLD.<br />
• Sample surveys can continue to collect this data for triangulation and quality<br />
control of administrative data.<br />
Baseline: To be determined by <strong>LGCDP</strong> baseline survey in 2009<br />
Target:<br />
To be determined after the <strong>LGCDP</strong> baseline survey<br />
Means of<br />
<strong>LGCDP</strong> Sample survey / administrative data<br />
Verification<br />
Frequency Every 2 years / annually<br />
Responsibility MLD M&E Section / MLD Personnel Administration Section<br />
19
LOCAL BODIES FISCAL COMMISSION / DMIS<br />
Indicator: LBFC database contains data on internal and external revenue generation<br />
disaggregated by all DDCs, all VDCs and all municipalities<br />
Rationale: Strengthened policies and institutional frameworks require reliable data for decisionmaking.<br />
A key function of the Local Bodies Fiscal Commission is the collection and analysis<br />
of data from DDCs, VDCs and municipalities.<br />
Limits: • The indicator is not registering partial progress, but is only registering<br />
progress if data by all three levels of local governance are available.<br />
Baseline: No (2009)<br />
Target: Yes (2012)<br />
Means of<br />
LBFC database<br />
Verification<br />
Frequency annually<br />
Responsibility <strong>LGCDP</strong> PCU<br />
Indicator: Number of unique visitors on DMIS section in MLD website per trimester<br />
Rationale: This proxy indicator tracks both the availability and quality of data collected by the Local<br />
Bodies Fiscal Commission. The underlying assumption is that the number of users<br />
accessing data from DMIS will only increase and remain at a high level if a) sufficient data<br />
is publicly and easily available and b) this data is of sufficient quality. This data can be<br />
easily collected using free online tools like Google Analysis.<br />
Limits: • The indicator only captures web-based access to data from the data base.<br />
The underlying assumption is that changes in web-based access correspond<br />
with the overall use of the data.<br />
• By tracking “unique visitors”, the same visitors accessing data on different<br />
days are counted multiple times.<br />
Baseline: 0 (2009)<br />
Target:<br />
To be determined<br />
Mov<br />
MLD website<br />
Frequency annually<br />
Responsibility M&E Section of MLD<br />
LOCAL BODIES ASSOCIATIONS<br />
Indicator: % of LDOs in DDCs who think that ADDCN is performing better now then one<br />
year ago<br />
Rationale: This indicator tracks the perception of changes in ADDCN performance and the satisfaction<br />
of its main clients over time. It serves as a proxy for changes in the performance of this<br />
Local Body.<br />
Limits: • The indicator tracks perceptions rather than actual changes. The underlying<br />
assumption is that significant improvements in performance will – over time –<br />
be reflected by changes in the perception of its key clients.<br />
Baseline: To be determined by <strong>LGCDP</strong> baseline survey in 2009<br />
Target:<br />
To be determined after the <strong>LGCDP</strong> baseline survey<br />
Means of<br />
Sample surveys by MLD<br />
Verification<br />
Frequency Every 2 years (2009, 2011, 2013)<br />
Responsibility M&E Section of MLD<br />
Indicator: % of Executive Officers in municipalities who think that MuAN is performing<br />
better now then one year ago<br />
Rationale: This indicator tracks the perception of changes in MuAN performance and the satisfaction<br />
of its main clients over time. It serves as a proxy for changes in the performance of this<br />
Local Body.<br />
Limits: • see above<br />
Baseline: To be determined by <strong>LGCDP</strong> baseline survey in 2009<br />
Target:<br />
To be determined after the <strong>LGCDP</strong> baseline survey<br />
Mov<br />
Sample surveys by MLD<br />
Frequency Every 2 years (2009, 2011, 2013)<br />
Responsibility M&E Section of MLD<br />
20
Indicator: % of VDC Secretaries who think that NAVIN is performing better now then one<br />
year ago<br />
Rationale: This indicator tracks the perception of changes in NAVINs performance and the satisfaction<br />
of its main clients over time. It serves as a proxy for changes in the performance of this<br />
Local Body.<br />
Limits: • see above<br />
Baseline: To be determined by <strong>LGCDP</strong> baseline survey in 2009<br />
Target:<br />
To be determined after the <strong>LGCDP</strong> baseline survey<br />
Means of<br />
Sample surveys by MLD<br />
Verification<br />
Frequency Every 2 years (2009, 2011, 2013)<br />
Responsibility M&E Section of MLD<br />
MAINSTREAMING GENDER EQUALITY AND SOCIAL INCLUSION<br />
Indicator: % of DDCs that conduct GE/SI audit per year (proxy for implementation of<br />
GE/SI strategy)<br />
Rationale: This indicator is a proxy for the extent the GE/SI is implemented.<br />
Limits: • The proxy indicator does not track implementation per se, but a key aspect of<br />
the implementation of the GE/SI strategy.<br />
• The indicator does not capture the extent to which audit results are acted<br />
upon.<br />
Baseline: 0 (04/2009)<br />
Target: 50% (2012)<br />
Means of<br />
MLD administrative data<br />
Verification<br />
Frequency annually<br />
Responsibility M&E Section of MLD<br />
CHILD-FRIENDLY LOCAL GOVERNANCE<br />
Outcome<br />
Indicator:<br />
Number of local bodies (VDC, Municipalities and district) that have adopted<br />
child-friendly local governance (CFLG)<br />
Rational: • Child-Friendly Local Governance is reflected in the TYIP and NPC annual<br />
planning guidelines.<br />
• There is a provision for allocating 25% of VDC block grant for CFLG VDCs in<br />
the approved VDC block grant guidelines.<br />
• The child-friendly approach is accepted as key principles of local governance<br />
in the <strong>LGCDP</strong> programme document.<br />
Limits:<br />
Just adoption may not ensure that local bodies have agreed to implement the CFLG<br />
framework and guidelines<br />
Baseline: 0 (2008)<br />
Four districts, one Municipality and 6 VDCs have initiated CFLG.<br />
Target: 122 (2012)<br />
75 VDCs, 37 districts and 10 Municipality<br />
Means of<br />
MLD annual reports<br />
Verification<br />
Frequency Annual<br />
21
2. <strong>LGCDP</strong> Monitoring and Evaluation Plan<br />
MONITORING<br />
We propose to build <strong>LGCDP</strong>’s performance monitoring system around four pillars:<br />
• MC/PM Assessments (annually)<br />
• MLD administrative data (ongoing)<br />
• <strong>LGCDP</strong> Sample Surveys (every two years)<br />
• Indicator tracking (trimesterely)<br />
MC/PM Assessments of DDCs, municipalities and VDCs are a convenient,<br />
meaningful and already existing data collection mechanism (for DDCs). To monitor<br />
<strong>LGCDP</strong>, MC/PM assessments can provide a) information on overall progress through<br />
highly aggregated, qualitative indicator using a scorecard approach, and b)<br />
disaggregated information on detailed progress in fields of particular interest to<br />
<strong>LGCDP</strong> (for example inclusive decision-making or financial irregularities). MC/PM<br />
assessments for DDCs, municipalities and VDCs need to be done during the 3 rd<br />
trimester before the Nepal fiscal year begins on July 15 th .<br />
Recommendation:<br />
⇒ make extensive but selective use of aggregated and disaggregated<br />
MC/PM Assessment data for monitoring progress of <strong>LGCDP</strong><br />
Administrative data from MLD is currently only collected with regard to financial<br />
and physical progress. Over time, however, MLD should be increasingly able to<br />
collect, aggregate and analyze key administrative data from VDCs through DDCs. To<br />
be able to do that, MLD – especially its M&E Section - will need substantive support<br />
through <strong>LGCDP</strong>.<br />
Recommendation:<br />
⇒ start improving the capacity of MLD with a focus on collecting, entering,<br />
aggregating and analyzing readily available administrative data (e.g.<br />
number of participants at DDC planning meeting, degree of participation of<br />
DAGs)<br />
⇒ immediately increase the capacity of the M&E section of the MLD by hiring<br />
a DMIS/data analysis staff to aggregate already existing data<br />
22
<strong>LGCDP</strong> Sample Surveys do complement the MC/PM assessments and<br />
administrative data in two important ways: First, sample surveys can directly address<br />
the citizens. Second, sample surveys can provide – at least initially – administrative<br />
data from VDCs on a sample basis before the MLD is able to set up a comprehensive<br />
data collection system.<br />
Recommendation:<br />
⇒ conduct a sample survey every 2 years: more often will not add much<br />
value to the information gathered, less often is too late to inform decisionmaking<br />
for <strong>LGCDP</strong>; include the questions from the <strong>LGCDP</strong> M&E framework<br />
in all surveys (see Annex 3)<br />
⇒ make use of external quality control for sample surveys; sample<br />
surveys are expensive and methodologically challenging; if the sampling<br />
methodology is not sound (and not perceived as being sound), the<br />
credibility of <strong>LGCDP</strong>’s entire monitoring system is at stake<br />
⇒ even if more administrative data is collected from DDCs and municipalities,<br />
continue using sample surveys for at least 6 more years to provide quality<br />
control and triangulation to data obtained through administrative<br />
channels<br />
Indicator tracking combines key data from the MC/PM Assessment, the sample<br />
surveys and additional data from the MLD and other external resources. The<br />
indicator data will be updated on a trimesterely basis, since monthly data collection<br />
would be cumbersome without adding much value. Performance indicator tracking<br />
will be done using the indicator tracking sheets described in Annex 2.<br />
Recommendation:<br />
⇒ update indicator tracking sheets described in Annex 2<br />
trimesterely as simple key tool for tracking indicators<br />
The <strong>LGCDP</strong> programme document does currently not define risks at any level, with<br />
the only exception of fiduciary risks. Before a system can be set up to monitor risks,<br />
these risks need to be clearly defined.<br />
Recommendation:<br />
⇒ clearly define risks for <strong>LGCDP</strong> at at least two levels (output to<br />
outcome, outcome to purpose) as a first step to monitor risks<br />
23
EVALUATION<br />
Given the potentially powerful monitoring tools of <strong>LGCDP</strong> (sample surveys, MC/PM<br />
assessments), evaluations can be kept to a minimum to not unduly overburden<br />
programme management.<br />
Recommendation:<br />
⇒ commission two external evaluations (2010 and 2013) and conduct<br />
two internal reviews (2009 and 2011)<br />
The first external evaluation, a mid-term evaluation, focuses on implementation<br />
issues of <strong>LGCDP</strong>. The emphasis is put on activities, the delivery of outputs and initial<br />
indications on progress towards the three <strong>LGCDP</strong> outcomes. The mid-term evaluation<br />
will inform the MLD and its development partners if and how the design of the<br />
programme needs to be adjusted.<br />
The second external evaluation, a final evaluation, focuses on results. The key<br />
question to be answered by the evaluation is: Have the outputs delivered by <strong>LGCDP</strong><br />
over the past years resulted in clear and evident progress towards the three <strong>LGCDP</strong><br />
outcomes? The final evaluation also focuses on possible changes on the purpose<br />
level and analyzes lessons learned from the programme.<br />
Alternating with the evaluations are internal reviews by the Government of Nepal<br />
and its development partners. Internal reviews are defined in the <strong>LGCDP</strong> programme<br />
document as mechanism for proposing changes in the programme document and the<br />
implementation modalities.<br />
REPORTING<br />
Keeping reporting requirements light but meaningful is paramount, given the high<br />
amount of monitoring reports and evaluations produced by the M&E system (sample<br />
survey reports, MC/PM assessment reports, evaluation reports, internal review<br />
reports, etc.).<br />
Recommendation:<br />
⇒ keep monthly progress reports light, activity and output focused and<br />
for MLD-internal use only<br />
⇒ focus on trimester progress reports and annual reports based on the<br />
fiscal year for a broader audience<br />
⇒ use indicator tracking sheets as key mandatory reporting tool for<br />
trimesterely and annual reports<br />
⇒ focus reports which are for <strong>LGCDP</strong> management on outcomes<br />
24
<strong>LGCDP</strong> MONITORING AND EVALUATION PLAN<br />
MONITORING EVALUATION REPORTING<br />
1<br />
2066 st Trimester:<br />
• Indicator framework<br />
• M&E Plan<br />
2nd Trimester:<br />
• Sample Survey I (Baseline Survey)<br />
• MC/PM Assessment DDCs<br />
• MC/PM Assessment Municipalities<br />
• MC/PM Assessment VDCs<br />
• Indicator tracking update<br />
3 rd Trimester:<br />
• Indicator tracking update<br />
2067<br />
1 st Trimester:<br />
• Indicator tracking update<br />
2 nd Trimester:<br />
• MC/PM Assessment DDCs<br />
• MC/PM Assessment Municipalities<br />
• MC/PM Assessment VCDs<br />
• Indicator tracking update<br />
3 rd Trimester:<br />
• Indicator tracking update<br />
2068<br />
1 st Trimester:<br />
• Indicator tracking update<br />
2 nd Trimester:<br />
• Sample Survey II<br />
• MC/PM Assessment DDCs<br />
• MC/PM Assessment Municipalities<br />
• MC/PM Assessment VCDs<br />
• Indicator tracking update<br />
3rd Trimester:<br />
• Internal Review (“Joint Annual Review”)<br />
3 rd Trimester:<br />
• External Mid-Term Evaluation (“Mid-Term<br />
Review”)<br />
2 nd Trimester:<br />
• <strong>LGCDP</strong> Trimesterly Report<br />
3 rd Trimester:<br />
• <strong>LGCDP</strong> Trimesterly Report<br />
• <strong>LGCDP</strong> Annual Report (fiscal year)<br />
1 st Trimester:<br />
• <strong>LGCDP</strong> Trimesterly Report<br />
2 nd Trimester:<br />
• <strong>LGCDP</strong> Trimesterly Report<br />
3 rd Trimester:<br />
• <strong>LGCDP</strong> Trimesterly Report<br />
• <strong>LGCDP</strong> Annual Report (fiscal year)<br />
1 st Trimester:<br />
• <strong>LGCDP</strong> Trimesterly Report<br />
2 nd Trimester:<br />
• <strong>LGCDP</strong> Trimesterly Report<br />
3 rd Trimester:<br />
• Indicator tracking update 3rd Trimester:<br />
• Internal Review (“Joint Annual Review”)<br />
3 rd Trimester:<br />
• <strong>LGCDP</strong> Trimesterly Report<br />
25
of GoN and DPs • <strong>LGCDP</strong> Annual Report (fiscal year)<br />
26
2069<br />
1 st Trimester:<br />
• Indicator tracking update<br />
2 nd Trimester:<br />
• MC/PM Assessment DDCs<br />
• MC/PM Assessment Municipalities<br />
• MC/PM Assessment VCDs<br />
• Indicator tracking update<br />
3 rd Trimester:<br />
• Indicator tracking update<br />
2070<br />
1 st Trimester:<br />
• Indicator tracking update<br />
2 nd Trimester:<br />
• Sample Survey III<br />
• Indicator tracking update<br />
3 rd Trimester:<br />
• Indicator tracking update<br />
1 st Trimester:<br />
• Final Evaluation (“External Review”)<br />
1 st Trimester:<br />
• <strong>LGCDP</strong> Trimesterly Report<br />
2 nd Trimester:<br />
• <strong>LGCDP</strong> Trimesterly Report<br />
3 rd Trimester:<br />
• <strong>LGCDP</strong> Trimesterly Report<br />
• <strong>LGCDP</strong> Annual Report (fiscal year)<br />
1 st Trimester:<br />
• <strong>LGCDP</strong> Trimesterly Report<br />
2 nd Trimester:<br />
• <strong>LGCDP</strong> Trimesterly Report<br />
3 rd Trimester:<br />
• <strong>LGCDP</strong> Trimesterly Report<br />
• <strong>LGCDP</strong> Annual Report (fiscal year)<br />
27
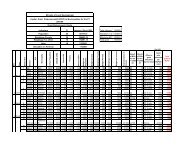
ANNEX 1: MONITORING AND EVALUATION FRAMEWORK<br />
28
Indicators Indicator Baseline Indicator Target Means of Verification Responsibility Frequency<br />
Goal: Contribute towards poverty reduction through inclusive responsive and accountable local governance and participatory community-led<br />
development<br />
see PMAS, Nepal Human Development Report Nepal MDG reports<br />
Purpose: Improved access to locally and inclusively prioritized public goods and services<br />
a) ACCESS TO PUBLIC GOODS<br />
• Average time for rural households to reach the nearest of 15 key<br />
facilities 3 in minutes and hours<br />
ROADS<br />
• % of rural households that have access to a dirt road (vehicle<br />
passable) within 30 minutes<br />
• Mean time taken by rural households to reach nearest dirt road<br />
(vehicle passable) in hours and minutes<br />
DRINKING WATER<br />
• % of rural households with sustainable access to improved<br />
water source<br />
b) ACCESS TO PUBLIC SERVICES<br />
• % of citizens that say that the services of DDCs are more<br />
accessible than they were one year ago<br />
• % of citizens that say that the services of VDCs are more<br />
accessible than they were one year ago<br />
• % of citizens that say that the services of municipalities are<br />
more accessible that they were one year ago<br />
1 h 59 m<br />
(2003/4)<br />
67.6%<br />
(2003/4)<br />
3 h 7 m<br />
(2003/4)<br />
80.2 %<br />
(2006)<br />
TBD by <strong>LGCDP</strong> BLS<br />
2009<br />
TBD by <strong>LGCDP</strong> BLS<br />
2009<br />
TBD by <strong>LGCDP</strong> BLS<br />
2009<br />
1 h 30 m<br />
(2012)<br />
75%<br />
(2012)<br />
2 h 30 m<br />
(2012)<br />
To be determined<br />
(TBD)<br />
TBD after <strong>LGCDP</strong><br />
BLS<br />
TBD after <strong>LGCDP</strong><br />
BLS<br />
TBD after <strong>LGCDP</strong><br />
BLS<br />
NLSS (cross section) CBS 7 years<br />
NLSS (cross section) / <strong>LGCDP</strong><br />
Sample Surveys<br />
NLSS (cross section) / <strong>LGCDP</strong><br />
Sample Surveys<br />
Nepal Demographic and Health<br />
Surveys<br />
<strong>LGCDP</strong> Sample Surveys<br />
<strong>LGCDP</strong> Sample Surveys<br />
<strong>LGCDP</strong> Sample Surveys<br />
CBS / MLD<br />
M&E Section<br />
CBS / MLD<br />
M&E Section<br />
MHP<br />
MLD M&E<br />
Section<br />
MLD M&E<br />
Section<br />
MLD M&E<br />
Section<br />
7 years / 2 years (2009,<br />
2011, 2013)<br />
7 years / 2 years (2009,<br />
2011, 2013)<br />
not known<br />
2 years (2009, 2013,<br />
2011)<br />
2 years (2009, 2011,<br />
2013)<br />
2 years (2009, 2011,<br />
2013)<br />
3 The 15 key facilities tracked by the Nepal Living Standard Survey are: primary school, health post, bus stop, paved road, dirt road (vehicle passable), dirt road (vehicle impassable), local shop, haat<br />
bazaar, market centre, Krishi Kendra, Sajha, commercial bank, source of drinking water, post office, telephone boot<br />
29
Indicators Indicator Baseline Indicator Target Means of Verification Responsibility Frequency<br />
Outcome 1:<br />
Citizens and communities engaged actively with local governments and hold them accountable (15.7m USD)<br />
a) ENGAGEMENT WITH LOCAL GOVERNMENTS<br />
• % of citizens that think that they are now more involved in the<br />
decision-making process of DDCs than one year ago<br />
• % of citizens that think that they are now more involved in the<br />
decision-making process of VDCs than one year ago<br />
• % of citizens that think that they are now more involved in the<br />
decision-making process of municipalities than one year ago<br />
PLANNING<br />
• % of all ward committees of VDCs and municipalities which hold<br />
at least one planning meeting per year<br />
• Total number of citizens who participate in planning meeting at<br />
ward level per year in Nepal<br />
• % of participants at all ward level planning meetings in Nepal per<br />
year who are Dalits (as proxy for all DAGs)<br />
• % of participants at all ward level planning meetings in Nepal per<br />
year who are women<br />
• % of project proposals submitted by women’s groups in VDC<br />
annual plans<br />
IMPLEMENTATION<br />
• % of VDCs and municipality block grants spent on projects<br />
requested by women’s or disadvantaged groups through<br />
the ward committee (as defined in the Interim Constitution)<br />
REPRESENTATION<br />
• Number of poor households (based on 8 indicators used in MLD<br />
DAG mapping) where no member was previously engaged in<br />
any organization in the last 3 years, but now is engaged in<br />
either school management committee, health management<br />
committee or VDC<br />
• % of women in all Integrated Planning Committees at VDC<br />
level<br />
• % of members of disadvantaged groups in all Integrated Planning<br />
Committees at VDC level<br />
TBD by <strong>LGCDP</strong> BLS<br />
2009<br />
TBD by <strong>LGCDP</strong> BLS<br />
2009<br />
TBD by <strong>LGCDP</strong> BLS<br />
2009<br />
TBD by <strong>LGCDP</strong><br />
Sample Survey<br />
(See Note 1)<br />
TBD by <strong>LGCDP</strong><br />
Sample Survey<br />
(See Note 1)<br />
TBD by <strong>LGCDP</strong><br />
Sample Survey<br />
(See Note 1)<br />
TBD by <strong>LGCDP</strong><br />
Sample Survey<br />
(See Note 1)<br />
TBD by <strong>LGCDP</strong><br />
Sample Survey<br />
(See Note 1)<br />
TBD by <strong>LGCDP</strong><br />
Sample Survey<br />
(See Note 1)<br />
TBD by <strong>LGCDP</strong><br />
Sample Survey<br />
(See Note 2)<br />
TBD by <strong>LGCDP</strong><br />
Sample Survey<br />
(See Note 3)<br />
TBD by <strong>LGCDP</strong><br />
Sample Survey<br />
(See Note 3)<br />
TBD after <strong>LGCDP</strong><br />
BLS<br />
TBD after <strong>LGCDP</strong><br />
BLS<br />
TBD after <strong>LGCDP</strong><br />
BLS<br />
90%<br />
(12/2012)<br />
900,000<br />
(12/2012)<br />
TBD after the<br />
<strong>LGCDP</strong> Sample<br />
Survey<br />
TBD after the<br />
<strong>LGCDP</strong> Sample<br />
Survey<br />
TBD after the<br />
<strong>LGCDP</strong> Sample<br />
Survey<br />
MLD Sample Surveys MLD M&E Section 2 years (2009, 2011,<br />
2013)<br />
MLD Sample Surveys MLD M&E Section 2 years (2009, 2011,<br />
2013)<br />
MLD Sample Surveys MLD M&E Section 2 years (2009, 2011,<br />
2013)<br />
Sample Surveys / MLD M&E Section 2 years (2009, 2011,<br />
administrative data 4 2013) / annually<br />
Sample Surveys /<br />
administrative data<br />
Sample Surveys /<br />
administrative data<br />
Sample Surveys /<br />
administrative data<br />
Sample Surveys /<br />
administrative data<br />
30% (12/2012) Sample Surveys /<br />
administrative data<br />
TBD after the<br />
<strong>LGCDP</strong> Sample<br />
Survey<br />
TBD after the<br />
<strong>LGCDP</strong> Sample<br />
Survey<br />
TBD after the<br />
<strong>LGCDP</strong> Sample<br />
Survey<br />
Performance system of<br />
<strong>LGCDP</strong> social mobilizers<br />
Sample survey/<br />
administrative records<br />
Sample survey/<br />
administrative records<br />
MLD M&E Section 2 years (2009, 2011,<br />
2013) / annually<br />
MLD M&E Section 2 years (2009, 2011,<br />
2013) / annually<br />
MLD M&E Section 2 years (2009, 2011,<br />
2013) / annually<br />
MLD M&E Section 2 years (2009, 2011,<br />
2013) / annually<br />
MLD M&E Section 2 years (2009, 2011,<br />
2013) / annually<br />
MLD M&E Section<br />
through social<br />
mobilizers<br />
MLD M&E Section<br />
MLD M&E Section<br />
annually<br />
Annually<br />
Annually<br />
4 The data will first be collected exclusively through sample surveys. When MLD has established a system to collect administrative data, the means of verification will bet he administrative data by the<br />
M&E Section in the MLD. However, sample surveys will continue to be conducted a) as a quality control to administrative data and b) for triangulation.<br />
30
INCLUSION<br />
• % total budget of DDCs which explicitly targets women (as<br />
defined in the Gender Budget Audit guidelines)<br />
• % total budget of DDCs which explicitly targets members of<br />
disadvantaged groups (as defined in the DAG Budget<br />
Audits)<br />
TBD by <strong>LGCDP</strong><br />
Sample Survey<br />
(See Note 4)<br />
TBD by <strong>LGCDP</strong><br />
Sample Survey<br />
(See Note 4)<br />
Note 1: This will be determined only after Ward Committees are set up<br />
Note 2: This number will be “0” initially<br />
Note 3: This will be determined after Integrated Planning Committees at VDC, DDC and municipality level have been set up<br />
Note 4: This will be determined after first Gender Budget Audits and DAG Budget Audits are conducted<br />
15% (12/2012) Gender Budget Audits GESI Section of MLD Annually<br />
15% (12/2012) Sample DAG Budget Audits GESI Section of MLD Annually<br />
b) ACCOUNTABILITY<br />
MUNICIPALITY<br />
• % of citizens who can identify at least three concrete, completed<br />
activities of the municipality in the past 12 months<br />
• % of citizens who can approximately identify current year total<br />
annual budget of the municipality (+/- 20%)<br />
VDCs<br />
• % of citizens who can identify at least three concrete, completed<br />
activities of the VDC in the past 12 months<br />
• % of citizens who can approximately identify current year total<br />
annual budget of the VDC (+/- 20%)<br />
DDCs<br />
• % of citizens who can identify at least three concrete, completed<br />
activities of the DDC in the past 12 months<br />
TBD by <strong>LGCDP</strong><br />
BLS 2009<br />
TBD by <strong>LGCDP</strong><br />
BLS 2009<br />
TBD by <strong>LGCDP</strong><br />
BLS 2009<br />
TBD by <strong>LGCDP</strong><br />
BLS 2009<br />
TBD by <strong>LGCDP</strong><br />
BLS 2009<br />
TBD after <strong>LGCDP</strong><br />
BLS<br />
TBD after <strong>LGCDP</strong><br />
BLS<br />
TBD after <strong>LGCDP</strong><br />
BLS<br />
TBD after <strong>LGCDP</strong><br />
BLS<br />
TBD after <strong>LGCDP</strong><br />
BLS<br />
MLD Sample Surveys MLD M&E Section 2 years (2009, 2011,<br />
2013)<br />
MLD Sample Surveys MLD M&E Section 2 years (2009, 2011,<br />
2013)<br />
MLD Sample Surveys MLD M&E Section 2 years (2009, 2011,<br />
2013)<br />
MLD Sample Surveys MLD M&E Section 2 years (2009, 2011,<br />
2013)<br />
MLD Sample Surveys MLD M&E Section 2 years (2009, 2011,<br />
2013)<br />
to be finalized: one or two indicators on the level of activities and effectiveness of evaluation societies<br />
31
Indicators Indicator Baseline Indicator Target Means of Verification Responsibility Frequency<br />
Output 1:<br />
Communities and community organizations participate actively in local governance processes (17.0m USD)<br />
• Social Mobilization Guidelines drafted No<br />
Yes Social Mobilization<br />
M&E Section of MLD One-off<br />
(04/2009)<br />
(2010) Guidelines<br />
• DAG mapping by households completed No<br />
Yes DAG mapping report M&E Section of MLD One-off<br />
(04/2009)<br />
(2010)<br />
• No. of VCDs covered by social mobilization through <strong>LGCDP</strong> 0<br />
3,915 <strong>LGCDP</strong> administrative <strong>LGCDP</strong> PCU<br />
Trimesterly<br />
(04/2009)<br />
(2012) records<br />
• No. of municipalities covered by social mobilization through <strong>LGCDP</strong> 0<br />
58<br />
<strong>LGCDP</strong> administrative <strong>LGCDP</strong> PCU<br />
Trimesterly<br />
(04/2009)<br />
(2012) records<br />
• Performance system for social mobilizers in place No<br />
Yes Performance system <strong>LGCDP</strong> PCU<br />
One-off<br />
(04/2009)<br />
(2010) guidelines<br />
• % of citizens who say that they are satisfied with the performance of<br />
the local social mobilizer<br />
Social Mobilizers<br />
Performance system<br />
<strong>LGCDP</strong> PCU<br />
annually<br />
pending design<br />
of performance<br />
system<br />
pending design of<br />
performance<br />
system<br />
• % of citizens from DAG households who say that they are satisfied<br />
with the performance of the local social mobilizer<br />
pending design<br />
of performance<br />
system<br />
Pending first PM<br />
TBD after sample<br />
survey<br />
Social Mobilizers<br />
Performance system<br />
<strong>LGCDP</strong> PCU<br />
annually<br />
• Number of Ward Citizen’s Committees meetings functional in<br />
VDCs and municipalities (at least 2 meetings per year)<br />
pending first<br />
data collection<br />
pending first data<br />
collection<br />
Administrative data in MLD M&E Section in MLD annually<br />
• Number of Integrated Planning Formulation Committees<br />
(IPFC) (at least 1 meeting(s) per year)<br />
pending first<br />
data collection<br />
pending first data<br />
collection<br />
Administrative data in MLD M&E Section in MLD annually<br />
• % of 75 DDCs that conduct a Public/community Audit per year pending first<br />
data collection<br />
• % of 75 DDCs that conduct a Social Audit per year pending first<br />
data collection<br />
pending first data<br />
collection<br />
pending first data<br />
collection<br />
Administrative data in MLD M&E Section in MLD annually<br />
Administrative data in MLD M&E Section in MLD annually<br />
Output 2:<br />
Increased capacity of citizens, communities and marginalized groups to assert their rights and hold local governments accountable (8.7m USD)<br />
indicators to be defined once key activities are better defined (e.g. information, education and communication activities; Local Governance and Accountability Facility)<br />
32
Indicators Indicator Baseline Indicator Target Means of Verification Responsibility Frequency<br />
Outcome 2:<br />
Increased capacity of Local Governments to manage resources and deliver basic services in an inclusive and equitable manner (150.8m)<br />
a.) MANAGING RESOURCES (DDCs)<br />
• % of all 75 DDCs that meet all 15 5 minimum conditions (as<br />
defined in 12/2008 by the MLD based on LSGA 1999) per fiscal year<br />
63%<br />
(06/2008)<br />
100%<br />
(12/2012)<br />
National Synthesis Report by LBFC LBFC annually<br />
• % of DDCs that score above 50 points in all 62 6 performance<br />
measurements and meet the minimum score in all 8 functional<br />
areas<br />
• % of all 75 DDCs that spend more than 80% of planned capital<br />
development budget 7 per year<br />
• % of all 75 DDCs that spend more than 10% of internal income<br />
explicitly on women, children, DAGs, disabled and old people<br />
per fiscal year<br />
41%<br />
(06/2008)<br />
TBD after<br />
analysis of LBFC<br />
financial records<br />
in 2009<br />
29%<br />
(06/2008)<br />
90%<br />
(12/2012)<br />
TBD after<br />
analysis of LBFC<br />
financial records<br />
in 2009<br />
75%<br />
(12/2012)<br />
National Synthesis Report by LBFC LBFC annually<br />
LBFC financial records LBFC annually<br />
Annual MC/PM assessment report<br />
for DDCs<br />
• % of all 75 DDCs that have less then 2% irregular expenditure 8 9%<br />
80% Annual MC/PM assessment report LBFC<br />
annually<br />
(06/2008) (12/2012) for DDCs<br />
MANAGING RESOURCES (MUNICIPALITIES)<br />
• % of all 58 municipalities that meet the Minimum Conditions (as MC/PM<br />
100% National Synthesis Report LBFC LBFC annually<br />
defined by MLD based on LSGA in 1999) per fiscal year<br />
assessment.2009 (2012)<br />
Indicator(s) on performance measurements to be defined pending the finalization of the municipality MC/PM guidelines<br />
MANAGING RESOURCES (VDCs)<br />
• % of all 3915 VDCs that meet the Minimum Conditions (as defined<br />
by MLD based on LSGA in 1999)<br />
MC/PM<br />
assessment 2009<br />
100% (2012) National Synthesis Report by LBFC LBFC annually<br />
MONITORING AND REPORTING<br />
• % of outcome indicators for which data supposed to be available<br />
are updated per year<br />
• % of DDCs that submit to MLD an annual report based on a<br />
template designed by MLD which includes a synthesized report on<br />
VDCs within August 15 th<br />
b.) BASIC SOCIAL SERVICES<br />
• % of citizens who say that the infrastructure (roads, drinking<br />
water, electricity) offered by the local governments better meet their<br />
needs than last year<br />
• % of DDCs which increase their internal revenues (excludes<br />
revenue sharing and central grants) by at least 15% compared to the<br />
previous fiscal year<br />
• Number of <strong>LGCDP</strong> pilot projects which were scaled up with<br />
government or development partner funds outside the <strong>LGCDP</strong> budget<br />
TBD after<br />
assessment in<br />
2009<br />
template not yet<br />
designed<br />
TBD by <strong>LGCDP</strong><br />
BLS 2009<br />
TBD by <strong>LGCDP</strong><br />
BLS 2009<br />
0<br />
(04/2009)<br />
LBFC<br />
100% (2012) <strong>LGCDP</strong> indicator tracking sheets M&E Section of<br />
MLD<br />
100% (2012) Reports from DDCs submitted to<br />
MLD<br />
TBD after <strong>LGCDP</strong><br />
BLS<br />
TBD after <strong>LGCDP</strong><br />
BLS<br />
3<br />
(04/2012)<br />
Sample surveys<br />
M&E Section of<br />
MLD<br />
M&E Section of<br />
MLD<br />
annually<br />
annually<br />
annually<br />
annually<br />
Financial records of LBFC LBFC annually<br />
MLD reports<br />
M&E Section of<br />
MLD<br />
annually<br />
5 currently only 12 out of 15 minimum conditions are in use<br />
6 currently only 57 out of 62 performance measurements are in use<br />
7 this refers to budget line 6.4., 6.5., 6.6.<br />
8 as defined by the final audit report per fiscal year<br />
33
Indicators Indicator Baseline Indicator Target Means of Verification Responsibility Frequency<br />
Output 3:<br />
Local governments gain access to greater fiscal resources in equitable and appropriate ways (121.0m USD)<br />
• Number of DDCs assessed on MC/PM by MLD on MC/PM per fiscal<br />
75<br />
75 Annual MC/PM Assessment for LBFC<br />
annually<br />
year<br />
(06/2008)<br />
(2012) DDCs<br />
• Number of municipalities assessed by MLD on MC/PM per fiscal<br />
0<br />
58 Annual MC/PM Assessment for LBFC<br />
annually<br />
year<br />
(04/2009)<br />
(2010) municipalities<br />
• Number of VDCs assessed by DDCs through out contracting per<br />
0<br />
3915 DDC Assessment Compilation LBFC<br />
annually<br />
fiscal year<br />
(04/2009) (07/2009) report<br />
• Block grand funds disbursed through <strong>LGCDP</strong> to DDCs in million<br />
8.2m<br />
11.25m <strong>LGCDP</strong> financial records (block <strong>LGCDP</strong> PCU Trimesterly<br />
USD per fiscal year<br />
(2008/9) (2012/13) grant allocation)<br />
• Block grand funds disbursed to Municipalities in million USD per<br />
0m<br />
2.5m <strong>LGCDP</strong> financial records (block <strong>LGCDP</strong> PCU Trimesterly<br />
fiscal year<br />
(2008/9) (2012/13) grant allocation)<br />
• Block grand funds disbursed to VCDs in million USD per fiscal year 0m<br />
29m <strong>LGCDP</strong> financial records (block <strong>LGCDP</strong> PCU Trimesterly<br />
(2008/9) (2012/13) grant allocation)<br />
Output 4:<br />
Appropriate capacity building services passed on to all levels of the local government service delivery system (26.4m USD)<br />
• % of DDCs and municipalities that receive capacity development 0% (4/2009) 100% (2012) <strong>LGCDP</strong> financial records <strong>LGCDP</strong> PCU Trimesterly<br />
grants through <strong>LGCDP</strong> per fiscal year<br />
• Funds of capacity development grants disbursed per fiscal year<br />
0m<br />
3m <strong>LGCDP</strong> financial records <strong>LGCDP</strong> PCU Trimesterly<br />
in million USD to DDCs and municipalities<br />
(4/2009)<br />
(2012)<br />
• Number of guidelines and operational manuals produced<br />
1<br />
12 <strong>LGCDP</strong> Trimesterly reports <strong>LGCDP</strong> PCU Trimesterly<br />
through <strong>LGCDP</strong><br />
(04/2009)<br />
(2012)<br />
• Number of procurement plans by DDCs produced with <strong>LGCDP</strong><br />
0<br />
75 <strong>LGCDP</strong> Trimesterly reports <strong>LGCDP</strong> PCU Trimesterly<br />
support per fiscal year<br />
(04/2009) (04/2012)<br />
• Number of DDCs having Capacity Development Plan TBD by <strong>LGCDP</strong><br />
75 <strong>LGCDP</strong> Trimesterly reports <strong>LGCDP</strong> PCU Trimesterly<br />
BLS 2009 (04/2012)<br />
Output 5:<br />
Local governments service delivery mechanisms and processes fine-tuned (3.4m USD)<br />
• Number of decentralization pilots funded through <strong>LGCDP</strong> 0<br />
(03/2009)<br />
2<br />
(2012)<br />
<strong>LGCDP</strong> Trimesterly reports <strong>LGCDP</strong> PCU Trimesterly<br />
34
Indicators Indicator Baseline Indicator Target Means of Verification Responsibility Frequency<br />
Outcome 3:<br />
Strengthened policy and national institutional framework for devolution and local self-governance (5.8m USD)<br />
SECTOR-WIDE APPROACH<br />
• Number of development partners (DPs) that sign Joint Financial<br />
Agreement<br />
0<br />
(04/2009)<br />
10<br />
(2012)<br />
Joint Financial Agreement <strong>LGCDP</strong> PCU Trimesterly<br />
• Total funds paid into Joint Financial Agreement basket in<br />
million USD<br />
0<br />
(04/2009)<br />
SECTOR DEVOLUTION<br />
• Number of secretary-level meetings, participated in by at<br />
0<br />
least five line ministries that explicitly includes agenda on<br />
(2008)<br />
decentralization, held per year<br />
STAFFING POLICIES<br />
• Local Service Commission Act passed to regularize local<br />
No<br />
recruitment<br />
(04/2009)<br />
• % of local government staff (DDCs, municipalities and VDCs) TBD by <strong>LGCDP</strong><br />
that are women<br />
BLS 2009<br />
• % of local government staff (DDCs, municipalities and VDCs) TBD by <strong>LGCDP</strong><br />
that are Dalits (as proxy for all disadvantaged groups)<br />
BLS 2009<br />
LOCAL BODIES FISCAL COMMISSION / DMIS<br />
• LBFC database contains data on internal and external revenue<br />
No<br />
generation disaggregated by all DDCs, all VDCs and all<br />
(04/2009)<br />
municipalities<br />
• Number of unique visitors on DMIS website per Trimester 0<br />
(04/2009)<br />
LOCAL BODIES ASSOCIATIONS<br />
• % of LDOs of DDCs who think that ADDCN is performing better TBD by <strong>LGCDP</strong><br />
now then one year ago<br />
BLS 2009<br />
• % of Executive Officers of municipalities who think that MuAN is TBD by <strong>LGCDP</strong><br />
performing better now then one year ago<br />
BLS 2009<br />
• % of VDC Secretaries who think that NAVIN is performing better TBD by <strong>LGCDP</strong><br />
now then one year ago<br />
BLS 2009<br />
MAINSTREAMING GENDER EQUALITY AND SOCIAL INCLUSING<br />
• % of DDCs that conduct GE/SI audit per year (proxy for<br />
0<br />
implementation of GE/SI strategy)<br />
(04/2009)<br />
CHILD-FRIENDLY LOCAL GOVERNANCE<br />
• Number of local bodies (VDCs, municipalities and DDCs) that have<br />
adopted child-friendly local governance<br />
0<br />
(04/2009)<br />
600 million<br />
(2012)<br />
3<br />
(2012)<br />
Yes<br />
(2012)<br />
33%<br />
(2012)<br />
TBD after <strong>LGCDP</strong><br />
BLS<br />
Yes<br />
(2012)<br />
<strong>LGCDP</strong> financial records <strong>LGCDP</strong> PCU Trimesterly<br />
Meeting minutes<br />
Local Service Commission<br />
Act<br />
Sample survey /<br />
administrative data<br />
Sample survey /<br />
administrative data<br />
Policy Coordination<br />
Committee/Decentralization<br />
Section at MLD<br />
MLD M&E Section<br />
MLD Personnel<br />
Administration Section<br />
MLD Personnel<br />
Administration Section<br />
annually<br />
one-off<br />
LBFC database <strong>LGCDP</strong> PCU one-off<br />
2 years / annually<br />
2 years / annually<br />
TBD MLD website MLD M&E Section Trimesterly<br />
TBD after <strong>LGCDP</strong><br />
BLS<br />
TBD after <strong>LGCDP</strong><br />
BLS<br />
TBD after <strong>LGCDP</strong><br />
BLS<br />
50%<br />
(2012)<br />
122<br />
(2012)<br />
<strong>LGCDP</strong> Sample Surveys MLD M&E Section 2 years<br />
<strong>LGCDP</strong> Sample Surveys MLD M&E Section 2 years<br />
<strong>LGCDP</strong> Sample Surveys MLD M&E Section 2 years<br />
MLD administrative data MLD M&E Section annually<br />
MLD annual reports MLD M&E Section annually<br />
35
Indicators Indicator Baseline Indicator Target Means of Verification Responsibility Frequency<br />
Output 6:<br />
Policy framework for decentralization promoted a more enabling environment for effective, transparent and accountable local governance (1.5m USD)<br />
• Review of decentralization and sector devolution policy drafted No<br />
Yes Review document <strong>LGCDP</strong> PCU One-off<br />
(04/2009)<br />
(2012)<br />
• Child-friendly national framework and guidelines developed No<br />
Yes Approved document from <strong>LGCDP</strong> PCU<br />
One-off<br />
(04/2009)<br />
(2012) MLD<br />
• Sector devolution guideline published No<br />
Yes Guideline document <strong>LGCDP</strong> PCU One-off<br />
(04/2009)<br />
(2012)<br />
• SWAP framework document drafted No<br />
Yes SWAP framework<br />
<strong>LGCDP</strong> PCU<br />
One-off<br />
(04/2009)<br />
(2012) document<br />
• Number of reviews of lessons learned on „demand“ side of local<br />
0<br />
1<br />
Review documents <strong>LGCDP</strong> PCU Trimesterly<br />
governance linked to <strong>LGCDP</strong><br />
(2009)<br />
(2012)<br />
• Local Service Commission Act drafted No<br />
Yes LSCA draft document <strong>LGCDP</strong> PCU One-off<br />
(04/2009)<br />
(2012)<br />
• National Capacity Development Strategy drafted No<br />
Yes Strategy document <strong>LGCDP</strong> PCU One-off<br />
(04/2009)<br />
(2012)<br />
• Number of outcome and impact studies published under <strong>LGCDP</strong> 0<br />
1<br />
Study documents <strong>LGCDP</strong> PCU Trimesterly<br />
(04/2009)<br />
(2012)<br />
Output 7:<br />
Capacity of central government and national non-government institutions strengthened to provide appropriate support to local governments is enhanced (2.0m USD)<br />
• Number of new articles on policy analysis published by MLD in<br />
0 (2008) 48 (2012) Journal Swashasan at MLD Information and Trimesterly<br />
Journal of Local Governance<br />
http://mld.gov.np<br />
Publication Unit<br />
• Formula for intergovernment fiscal transfers revised No (04/2009) Yes (2012) Formula document <strong>LGCDP</strong> PCU One-off<br />
• Fiscal Decentralization Roadmap updated No (04/2009) Yes (2012) Roadmap document <strong>LGCDP</strong> PCU One-off<br />
• Number of Revenue Potential Studies of VDCs, DDCs and<br />
0 (2008) 3 (2012) Study documents <strong>LGCDP</strong> PCU Trimesterly<br />
municipalities conducted by LBFC<br />
• Capacity assessment of all three LB associations (ADDCN, MuAN, No (04/2009) Yes (2012) Capacity Assessment <strong>LGCDP</strong> PCU<br />
One-off<br />
NAVIN) published<br />
documents<br />
• All three Local Bodies associations (ADDCN, MuAN, NAVIN) have No (04/2009) Yes (2012) Observation of office <strong>LGCDP</strong> PCU<br />
One-off<br />
a furnished office building<br />
buildings<br />
• DMIS data is available online No (04/2009) Yes (2012) DMIS website <strong>LGCDP</strong> PCU One-off<br />
• Number of senior Local Government staff trained on Gender<br />
0 (04/2009) TBD <strong>LGCDP</strong> administrative <strong>LGCDP</strong> PCU<br />
Trimesterly<br />
Equality / Social Inclusion under <strong>LGCDP</strong><br />
records<br />
• Number of decentralization focal points of line ministries trained in 0 (04/2009) TBD <strong>LGCDP</strong> administrative <strong>LGCDP</strong> PCU Trimesterly<br />
decentralization under <strong>LGCDP</strong><br />
records<br />
Output 8:<br />
Support provided for programme implementation (2.3m USD)<br />
• Total funds in million USD dollars spent on pilots (output 8) TBD<br />
(2009)<br />
2.3m<br />
(2012)<br />
<strong>LGCDP</strong> financial records <strong>LGCDP</strong> PCU Trimesterly<br />
36
ANNEX 2: TEMPLATE FOR INDICATOR TRACKING SHEET<br />
<strong>LGCDP</strong> Results<br />
(Outputs, Outcome,<br />
Purpose)<br />
Indicators<br />
Baseline<br />
(2008)<br />
1st<br />
Trimester<br />
2st<br />
Trimester<br />
3rd<br />
Trimester<br />
1st<br />
Trimester<br />
2nd<br />
Trimester<br />
etc.<br />
Target<br />
(2012)<br />
OUTCOME 2:<br />
Increase capacity of local<br />
governments to manage<br />
resources and deliver<br />
basic services in an<br />
inclusive and equitable<br />
way<br />
% of DDCs that initiate<br />
MC/PM reporting on their<br />
own<br />
% increase of local<br />
revenues compared to<br />
2007<br />
15%<br />
(01/2009)<br />
5%<br />
(2007)<br />
15% 15% 24% 24% 24% ....... 95%<br />
(12/2012)<br />
5% 5% 16% 16% 16% ....... 50%<br />
(12/2012)<br />
Roles of central<br />
government and local<br />
bodies delineated<br />
no<br />
(01/2009)<br />
no no no yes yes ....... yes<br />
(12/2010)<br />
37
ANNEX 3: DATA REQUIREMENT FOR<br />
<strong>LGCDP</strong> SAMPLE SURVEYS<br />
38
HOUSEHOLD / CITIZEN LEVEL<br />
% of rural households that have access to a dirt road (vehicle passable) within 20 minutes (PURPOSE)<br />
Mean time taken by rural households to reach nearest dirt road (vehicle passable) in hours and minutes (PURPOSE)<br />
% of citizens that say that the services of DDCs are more accessible than they were one year ago (PURPOSE)<br />
% of citizens that say that the services of VDCs are more accessible than they were one year ago<br />
% of citizens that say that the services of municipalities are more accessible that they were one year ago<br />
% of citizens that think that they are now more involved in the decision process by DDCs than one year ago (OUTCOME 1)<br />
% of citizens that think that they are now more involved in the decision process by VDCs than one year ago (OUTCOME 1)<br />
% of citizens that think that they are now more involved in the decision process by municipalities than one year ago<br />
(OUTCOME 1)<br />
Number of citizens who participate in planning meeting at ward level per year in Nepal (OUTCOME 1)<br />
% of citizens who can identify at least three concrete, completed activities of the municipality in the past 12 months<br />
(OUTCOME 1)<br />
% of citizens who can approximately identify the latest annual budget of the municipalities (+/- 20%) (OUTCOME 1)<br />
% of citizens who can identify at least three concrete, completed activities of the VDC in the past 12 months (OUTCOME<br />
1)<br />
% of citizens who can approximately identify the latest annual budget of the VDC (+/- 20%) (OUTCOME 1)<br />
% of citizens who can identify at least three concrete, completed activities of the DDC in the past 12 months (OUTCOME<br />
1)<br />
% of citizens who say that the infrastructure (roads, drinking water, electricity) offered by the local governments better<br />
meet their needs than last year (OUTCOME 2)<br />
% of local government staff (DDCs, municipalities and VDCs) that are women (OUTCOME 3)<br />
% of local government staff (DDCs, municipalities and VDCs) that are Dalits (proxy for all Digs) (OUTCOME 3)<br />
MUNICIPALITIES<br />
% of all ward committees of VDCs and municipalities which hold at least one planning meeting per year (OUTCOME 1)<br />
% of VDCs and municipality block grants spent on projects requested by women’s or disadvantaged groups through<br />
the ward committee (OUTCOME 1)<br />
% of local government staff (DDCs, municipalities and VDCs) that are women<br />
% of local government staff (DDCs, municipalities and VDCs) that are Dalits (as proxy for all disadvantaged groups)<br />
% of Executive Officers who think that MuAN is performing better now then one year ago (OUTCOME 3)<br />
DDCs<br />
% of local government staff (DDCs, municipalities and VDCs) that are women<br />
% of local government staff (DDCs, municipalities and VDCs) that are Dalits (as proxy for all disadvantaged groups)<br />
% of DDC LDOs who think that ADDCN is performing better now then one year ago (OUTCOME 3)<br />
VDCs<br />
% of all ward committees of VDCs and municipalities which hold at least one planning meeting per year (OUTCOME 1)<br />
% of participants at all ward level planning meetings in Nepal per year who are Dalits (as proxy for all DAGs) (OUTCOME 1)<br />
% of participants at all ward level planning meetings in Nepal per year who are women (OUTCOME 1)<br />
% of VDC project proposals submitted by women’s groups in VDC annual plans<br />
% of VDCs and municipality block grants spent on projects requested by women’s or disadvantaged groups through<br />
the ward committee (OUTCOME 1)<br />
% of women in all Integrated Planning Committees at VDC level (OUTCOME 1)<br />
% of members of disadvantaged groups in all Integrated Planning Committees at VDC level (OUTCOME 1)<br />
% of local government staff (DDCs, municipalities and VDCs) that are women (OUTCOME 3)<br />
% of local government staff (DDCs, municipalities and VDCs) that are Dalits (as proxy for all disadvantaged groups)<br />
% of VDC secretaries who think that NAVIN is performing better now then one year ago<br />
39