The Impact of Wind Power Projects on Residential Property Values ...
The Impact of Wind Power Projects on Residential Property Values ...
The Impact of Wind Power Projects on Residential Property Values ...

You also want an ePaper? Increase the reach of your titles
YUMPU automatically turns print PDFs into web optimized ePapers that Google loves.
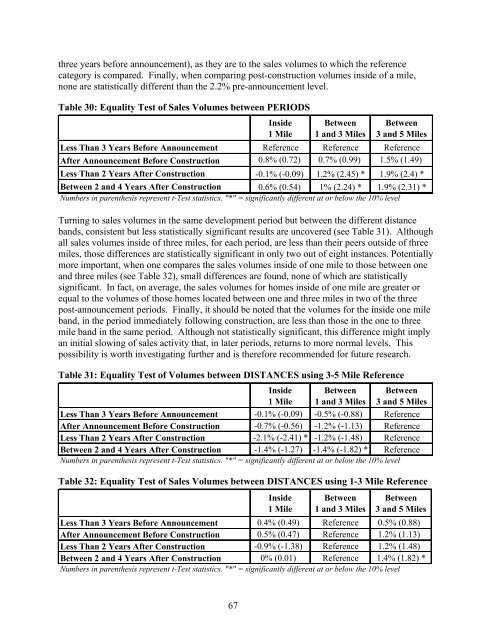
three years before announcement), as they are to the sales volumes to which the reference<br />
category is compared. Finally, when comparing post-c<strong>on</strong>structi<strong>on</strong> volumes inside <str<strong>on</strong>g>of</str<strong>on</strong>g> a mile,<br />
n<strong>on</strong>e are statistically different than the 2.2% pre-announcement level.<br />
Table 30: Equality Test <str<strong>on</strong>g>of</str<strong>on</strong>g> Sales Volumes between PERIODS<br />
Inside<br />
1 Mile<br />
Between<br />
1 and 3 Miles<br />
Between<br />
3 and 5 Miles<br />
Less Than 3 Years Before Announcement Reference Reference Reference<br />
After Announcement Before C<strong>on</strong>structi<strong>on</strong> 0.8% (0.72) 0.7% (0.99) 1.5% (1.49)<br />
Less Than 2 Years After C<strong>on</strong>structi<strong>on</strong> -0.1% (-0.09) 1.2% (2.45) * 1.9% (2.4) *<br />
Between 2 and 4 Years After C<strong>on</strong>structi<strong>on</strong> 0.6% (0.54) 1% (2.24) * 1.9% (2.31) *<br />
Numbers in parenthesis represent t-Test statistics. "*" = significantly different at or below the 10% level<br />
Turning to sales volumes in the same development period but between the different distance<br />
bands, c<strong>on</strong>sistent but less statistically significant results are uncovered (see Table 31). Although<br />
all sales volumes inside <str<strong>on</strong>g>of</str<strong>on</strong>g> three miles, for each period, are less than their peers outside <str<strong>on</strong>g>of</str<strong>on</strong>g> three<br />
miles, those differences are statistically significant in <strong>on</strong>ly two out <str<strong>on</strong>g>of</str<strong>on</strong>g> eight instances. Potentially<br />
more important, when <strong>on</strong>e compares the sales volumes inside <str<strong>on</strong>g>of</str<strong>on</strong>g> <strong>on</strong>e mile to those between <strong>on</strong>e<br />
and three miles (see Table 32), small differences are found, n<strong>on</strong>e <str<strong>on</strong>g>of</str<strong>on</strong>g> which are statistically<br />
significant. In fact, <strong>on</strong> average, the sales volumes for homes inside <str<strong>on</strong>g>of</str<strong>on</strong>g> <strong>on</strong>e mile are greater or<br />
equal to the volumes <str<strong>on</strong>g>of</str<strong>on</strong>g> those homes located between <strong>on</strong>e and three miles in two <str<strong>on</strong>g>of</str<strong>on</strong>g> the three<br />
post-announcement periods. Finally, it should be noted that the volumes for the inside <strong>on</strong>e mile<br />
band, in the period immediately following c<strong>on</strong>structi<strong>on</strong>, are less than those in the <strong>on</strong>e to three<br />
mile band in the same period. Although not statistically significant, this difference might imply<br />
an initial slowing <str<strong>on</strong>g>of</str<strong>on</strong>g> sales activity that, in later periods, returns to more normal levels. This<br />
possibility is worth investigating further and is therefore recommended for future research.<br />
Table 31: Equality Test <str<strong>on</strong>g>of</str<strong>on</strong>g> Volumes between DISTANCES using 3-5 Mile Reference<br />
Inside<br />
1 Mile<br />
Between<br />
1 and 3 Miles<br />
Between<br />
3 and 5 Miles<br />
Less Than 3 Years Before Announcement -0.1% (-0.09) -0.5% (-0.88) Reference<br />
After Announcement Before C<strong>on</strong>structi<strong>on</strong> -0.7% (-0.56) -1.2% (-1.13) Reference<br />
Less Than 2 Years After C<strong>on</strong>structi<strong>on</strong> -2.1% (-2.41) * -1.2% (-1.48) Reference<br />
Between 2 and 4 Years After C<strong>on</strong>structi<strong>on</strong> -1.4% (-1.27) -1.4% (-1.82) * Reference<br />
Numbers in parenthesis represent t-Test statistics. "*" = significantly different at or below the 10% level<br />
Table 32: Equality Test <str<strong>on</strong>g>of</str<strong>on</strong>g> Sales Volumes between DISTANCES using 1-3 Mile Reference<br />
Inside<br />
1 Mile<br />
Between<br />
1 and 3 Miles<br />
Between<br />
3 and 5 Miles<br />
Less Than 3 Years Before Announcement 0.4% (0.49) Reference 0.5% (0.88)<br />
After Announcement Before C<strong>on</strong>structi<strong>on</strong> 0.5% (0.47) Reference 1.2% (1.13)<br />
Less Than 2 Years After C<strong>on</strong>structi<strong>on</strong> -0.9% (-1.38) Reference 1.2% (1.48)<br />
Between 2 and 4 Years After C<strong>on</strong>structi<strong>on</strong> 0% (0.01) Reference 1.4% (1.82) *<br />
Numbers in parenthesis represent t-Test statistics. "*" = significantly different at or below the 10% level<br />
67