Haubenschild Farms Final Report - The Minnesota Project
Haubenschild Farms Final Report - The Minnesota Project
Haubenschild Farms Final Report - The Minnesota Project

You also want an ePaper? Increase the reach of your titles
YUMPU automatically turns print PDFs into web optimized ePapers that Google loves.
<strong>The</strong> <strong>Minnesota</strong> <strong>Project</strong> August 2002<br />
Results to Date<br />
In September 1999, construction was complete and the manure began to be fed to the<br />
digester. On September 9, the engine was started using propane in order to heat the manure<br />
in the tank. By October 1, biogas production was sufficient to fuel the engine.<br />
Electricity and Biogas Production<br />
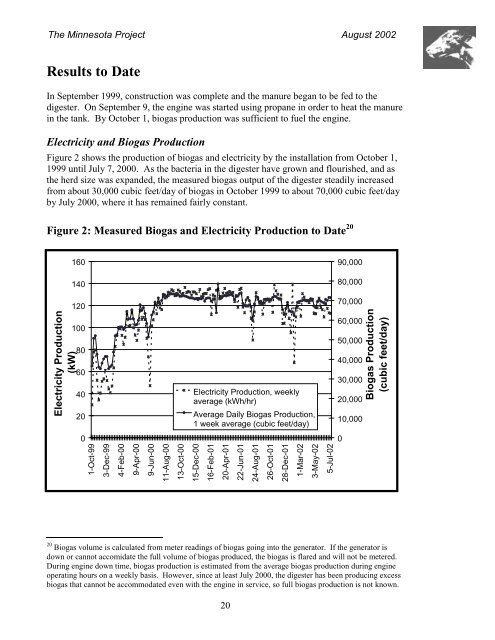
Figure 2 shows the production of biogas and electricity by the installation from October 1,<br />
1999 until July 7, 2000. As the bacteria in the digester have grown and flourished, and as<br />
the herd size was expanded, the measured biogas output of the digester steadily increased<br />
from about 30,000 cubic feet/day of biogas in October 1999 to about 70,000 cubic feet/day<br />
by July 2000, where it has remained fairly constant.<br />
Figure 2: Measured Biogas and Electricity Production to Date 20<br />
160<br />
90,000<br />
140<br />
80,000<br />
Electricity Production<br />
(kW)<br />
120<br />
100<br />
80<br />
60<br />
40<br />
20<br />
Electricity Production, weekly<br />
average (kWh/hr)<br />
Average Daily Biogas Production,<br />
1 week average (cubic feet/day)<br />
70,000<br />
60,000<br />
50,000<br />
40,000<br />
30,000<br />
20,000<br />
10,000<br />
Biogas Production<br />
(cubic feet/day)<br />
0<br />
0<br />
1-Oct-99<br />
3-Dec-99<br />
4-Feb-00<br />
9-Apr-00<br />
9-Jun-00<br />
11-Aug-00<br />
13-Oct-00<br />
15-Dec-00<br />
16-Feb-01<br />
20-Apr-01<br />
22-Jun-01<br />
24-Aug-01<br />
26-Oct-01<br />
28-Dec-01<br />
1-Mar-02<br />
3-May-02<br />
5-Jul-02<br />
20 Biogas volume is calculated from meter readings of biogas going into the generator. If the generator is<br />
down or cannot accomidate the full volume of biogas produced, the biogas is flared and will not be metered.<br />
During engine down time, biogas production is estimated from the average biogas production during engine<br />
operating hours on a weekly basis. However, since at least July 2000, the digester has been producing excess<br />
biogas that cannot be accommodated even with the engine in service, so full biogas production is not known.<br />
20