Strategy Survival Guide
Strategy Survival Guide
Strategy Survival Guide

You also want an ePaper? Increase the reach of your titles
YUMPU automatically turns print PDFs into web optimized ePapers that Google loves.
Step One: Define the problem explicitly<br />
Ask yourself:<br />
• What are the questions I need to answer?<br />
• Conceptually, how do I answer each of the questions?<br />
• What will the final output look like?<br />
Step Two: Understand the audience<br />
Determine who the target audience will be and keep in mind their background when preparing data to share.<br />
Pre-empting your audience and their needs, and designing Excel and other output to suit those needs will<br />
save 'low-value’ added time repackaging output.<br />
Step Three: Design, don’t type<br />
Having now envisaged the output and understood your audience, think about how to design your Excel<br />
analysis to best meet those aspirations:<br />
• Spend the time up front to design the spreadsheet<br />
• If necessary, write a brief work plan<br />
• Ask yourself: how accurate does the analysis have to be? How long do I have to generate the<br />
model?<br />
• Design the spreadsheet workbook<br />
• Always have an assumptions sheet, this will help with sensitivity analysis<br />
• Make other sheets flow logically from the assumptions sheet<br />
• Sketch out a classification of variables:<br />
• Static variable: variable that is unlikely to change.<br />
• Dynamic variable: variable that you do not know accurately and you are likely to want to test the<br />
sensitivity to a range of the variable<br />
• Calculated fields: variables that are derived as a direct result of static and dynamic variables<br />
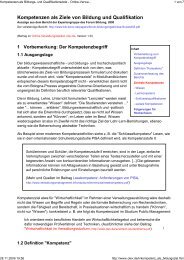
First, it will be useful to classify variables according to type which will then help in writing the model, for<br />
example:<br />
Variable<br />
Household density<br />
Store reach<br />
Number of households per store<br />
Household penetration<br />
Annual spend per customer<br />
Annual revenue per store<br />
Gross margin<br />
Annual fixed costs<br />
Annual profits<br />
Initial investment<br />
NPV period<br />
Discount rate<br />
NPV<br />
Type<br />
Dynamic<br />
Static<br />
Calculated<br />
Dynamic<br />
Static<br />
Calculated<br />
Static<br />
Static<br />
Calculated<br />
Static<br />
Static<br />
Static<br />
Calculated<br />
Secondly, laying-out a workbook design will save you time in writing the model in Excel. In general, Excel<br />
workbooks should follow this generic design:<br />
<strong>Strategy</strong> <strong>Survival</strong> <strong>Guide</strong> – <strong>Strategy</strong> Skills<br />
Page 130