Benefit Cost Analysis Technical Memo - Oklahoma Department of ...
Benefit Cost Analysis Technical Memo - Oklahoma Department of ...
Benefit Cost Analysis Technical Memo - Oklahoma Department of ...

You also want an ePaper? Increase the reach of your titles
YUMPU automatically turns print PDFs into web optimized ePapers that Google loves.
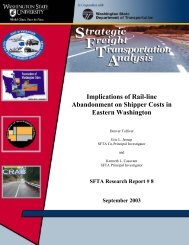
Table 5: Annual Economic <strong>Cost</strong>s, Present Values, Project Net Present Values, and <strong>Benefit</strong>/<strong>Cost</strong> Ratios<br />
Present Values<br />
at 7% at 3%<br />
20-year evaluation<br />
2010 2011 2012 2013 2014 2015 2016 2017 2018 2019 2020 2021 2022 2023 2024 2025 2026 2027 2028 2029<br />
RAIL<br />
Annual rail cars hauled 1,927 1,927 1,927 2,249 2,571 2,892 2,950 3,009 3,069 3,130 3,193 3,257 3,322 3,388 3,456 3,525 3,596 3,668 3,741 3,816<br />
Annual commodity tons carried 173,430 173,430 173,430 202,410 231,390 260,280 265,486 270,795 276,211 281,735 287,370 293,118 298,980 304,960 311,059 317,280 323,625 330,098 336,700 343,434<br />
Annual ton-miles carried 93,305,340 93,305,340 93,305,340 108,896,580 124,487,820 140,030,640 142,831,253 145,687,878 148,601,635 151,573,668 154,605,141 157,697,244 160,851,189 164,068,213 167,349,577 170,696,569 174,110,500 177,592,710 181,144,564 184,767,456<br />
Fuel consumed 235,620 235,620 235,620 274,991 314,363 353,613 360,685 367,899 375,257 382,762 390,417 398,225 406,190 414,314 422,600 431,052 439,673 448,466 457,436 466,584<br />
Locomotive miles 25,918 25,918 25,918 30,249 34,580 38,897 39,675 40,469 41,278 42,104 42,946 43,805 44,681 45,575 46,486 47,416 48,364 49,331 50,318 51,324<br />
$ 34,546,759 $ 50,699,988 Shipper cost $ 2,239,328 $ 2,239,328 $ 2,239,328 $ 2,613,518 $ 2,987,708 $ 3,360,735 $ 3,427,950 $ 3,496,509 $ 3,566,439 $ 3,637,768 $ 3,710,523 $ 3,784,734 $ 3,860,429 $ 3,937,637 $ 4,016,390 $ 4,096,718 $ 4,178,652 $ 4,262,225 $ 4,347,470 $ 4,434,419<br />
$ 241,827 $ 354,900 <strong>Cost</strong>, CO2 $ 15,675 $ 15,675 $ 15,675 $ 18,295 $ 20,914 $ 23,525 $ 23,996 $ 24,476 $ 24,965 $ 25,464 $ 25,974 $ 26,493 $ 27,023 $ 27,563 $ 28,115 $ 28,677 $ 29,251 $ 29,836 $ 30,432 $ 31,041<br />
$ 5,701 $ 8,289 <strong>Cost</strong>, HC $ 405 $ 400 $ 395 $ 455 $ 513 $ 569 $ 572 $ 575 $ 578 $ 581 $ 584 $ 596 $ 608 $ 620 $ 632 $ 645 $ 658 $ 671 $ 684 $ 698<br />
$ - $ - <strong>Cost</strong>, CO $ - $ - $ - $ - $ - $ - $ - $ - $ - $ - $ - $ - $ - $ - $ - $ - $ - $ - $ - $<br />
-<br />
$ 237,011 $ 344,327 <strong>Cost</strong>, NOx $ 16,971 $ 16,734 $ 16,496 $ 18,976 $ 21,376 $ 23,689 $ 23,799 $ 23,904 $ 24,004 $ 24,099 $ 24,187 $ 24,671 $ 25,164 $ 25,668 $ 26,181 $ 26,705 $ 27,239 $ 27,783 $ 28,339 $ 28,906<br />
$ 346,493 $ 503,362 <strong>Cost</strong> PM10 $ 24,819 $ 24,471 $ 24,123 $ 27,747 $ 31,255 $ 34,634 $ 34,794 $ 34,946 $ 35,090 $ 35,226 $ 35,353 $ 36,060 $ 36,781 $ 37,517 $ 38,267 $ 39,033 $ 39,813 $ 40,610 $ 41,422 $ 42,250<br />
$ 2,626,993 $ 3,855,312 <strong>Cost</strong>, accidents $ 170,282 $ 170,282 $ 170,282 $ 198,736 $ 227,190 $ 255,556 $ 260,667 $ 265,880 $ 271,198 $ 276,622 $ 282,154 $ 287,797 $ 293,553 $ 299,424 $ 305,413 $ 311,521 $ 317,752 $ 324,107 $ 330,589 $ 337,201<br />
$ 38,004,784 $ 55,766,177 Total Economic <strong>Cost</strong>, Rail $ 2,467,481 $ 2,466,890 $ 2,466,299 $ 2,877,726 $ 3,288,955 $ 3,698,708 $ 3,771,777 $ 3,846,290 $ 3,922,274 $ 3,999,760 $ 4,078,776 $ 4,160,351 $ 4,243,558 $ 4,328,429 $ 4,414,998 $ 4,503,298 $ 4,593,364 $ 4,685,231 $ 4,778,936 $ 4,874,514<br />
TRUCK (RAIL IN 2010 AND 2011)<br />
Annual commodity tons carried 173,430 173,430 173,430 202,410 231,390 260,280 265,486 270,795 276,211 281,735 287,370 293,118 298,980 304,960 311,059 317,280 323,625 330,098 336,700 343,434<br />
Annual ton-miles carried 93,305,340 93,305,340 93,305,340 108,896,580 124,487,820 140,030,640 142,831,253 145,687,878 148,601,635 151,573,668 154,605,141 157,697,244 160,851,189 164,068,213 167,349,577 170,696,569 174,110,500 177,592,710 181,144,564 184,767,456<br />
Annual truck trips 8,259 9,639 11,019 12,394 12,642 12,895 13,153 13,416 13,684 13,958 14,237 14,522 14,812 15,109 15,411 15,719 16,033 16,354<br />
Annual truck vehicle miles 4,443,111 5,185,551 5,927,991 6,668,126 6,801,488 6,937,518 7,076,268 7,217,794 7,362,150 7,509,393 7,659,580 7,812,772 7,969,027 8,128,408 8,290,976 8,456,796 8,625,932 8,798,450<br />
Fuel consumed 235,620 235,620 888,622 1,037,110 1,185,598 1,333,625 1,360,298 1,387,504 1,415,254 1,443,559 1,472,430 1,501,879 1,531,916 1,562,554 1,593,805 1,625,682 1,658,195 1,691,359 1,725,186 1,759,690<br />
$ 105,708,790 $ 159,001,891 Shipper cost $ 2,239,328 $ 2,239,328 $ 7,464,427 $ 8,711,726 $ 9,959,026 $ 11,202,451 $ 11,426,500 $ 11,655,030 $ 11,888,131 $ 12,125,893 $ 12,368,411 $ 12,615,780 $ 12,868,095 $ 13,125,457 $ 13,387,966 $ 13,655,726 $ 13,928,840 $ 14,207,417 $ 14,491,565 $ 14,781,396<br />
$ 2,785,870 $ 4,226,693 <strong>Cost</strong>, CO2 $ 15,675 $ 15,675 $ 202,473 $ 236,306 $ 270,139 $ 303,866 $ 309,944 $ 316,143 $ 322,466 $ 328,915 $ 335,493 $ 342,203 $ 349,047 $ 356,028 $ 363,149 $ 370,412 $ 377,820 $ 385,376 $ 393,084 $ 400,945<br />
$ 23,270 $ 34,505 <strong>Cost</strong>, VOC $ 405 $ 400 $ 1,994 $ 2,257 $ 2,499 $ 2,721 $ 2,683 $ 2,642 $ 2,598 $ 2,552 $ 2,503 $ 2,553 $ 2,604 $ 2,656 $ 2,709 $ 2,764 $ 2,819 $ 2,875 $ 2,933 $ 2,991<br />
$ - $ - <strong>Cost</strong>, CO $ - $ - $ - $ - $ - $ - $ - $ - $ - $ - $ - $ - $ - $ - $ - $ - $ - $ - $ - $<br />
-<br />
$ 1,241,397 $ 1,674,396 <strong>Cost</strong>, NOx $ 16,971 $ 16,734 $ 207,810 $ 217,793 $ 220,692 $ 216,431 $ 188,309 $ 158,975 $ 128,392 $ 96,522 $ 63,326 $ 64,593 $ 65,885 $ 67,202 $ 68,546 $ 69,917 $ 71,316 $ 72,742 $ 74,197 $ 75,681<br />
$ 89,134 $ 111,860 <strong>Cost</strong> PM10 $ 24,819 $ 24,471 $ 5,123 $ 5,594 $ 5,954 $ 6,203 $ 5,821 $ 5,423 $ 5,006 $ 4,570 $ 4,114 $ 4,197 $ 4,281 $ 4,366 $ 4,454 $ 4,543 $ 4,634 $ 4,726 $ 4,821 $ 4,917<br />
$ 42,666,225 $ 64,791,248 <strong>Cost</strong>, accidents $ 170,282 $ 170,282 $ 3,110,178 $ 3,629,886 $ 4,149,594 $ 4,667,688 $ 4,761,042 $ 4,856,263 $ 4,953,388 $ 5,052,456 $ 5,153,505 $ 5,256,575 $ 5,361,706 $ 5,468,940 $ 5,578,319 $ 5,689,886 $ 5,803,683 $ 5,919,757 $ 6,038,152 $ 6,158,915<br />
$ 16,035,662 $ 24,404,766 Highway maintenance cost $ - $ - $ 1,177,425 $ 1,374,171 $ 1,570,918 $ 1,767,053 $ 1,802,394 $ 1,838,442 $ 1,875,211 $ 1,912,715 $ 1,950,970 $ 1,989,989 $ 2,029,789 $ 2,070,385 $ 2,111,792 $ 2,154,028 $ 2,197,109 $ 2,241,051 $ 2,285,872 $ 2,331,589<br />
$ 168,550,347 $ 254,245,359 Total Economic <strong>Cost</strong>, Truck $ 2,467,481 $ 2,466,890 $ 12,169,429 $ 14,177,733 $ 16,178,821 $ 18,166,413 $ 18,496,693 $ 18,832,917 $ 19,175,191 $ 19,523,623 $ 19,878,323 $ 20,275,889 $ 20,681,407 $ 21,095,035 $ 21,516,936 $ 21,947,275 $ 22,386,220 $ 22,833,944 $ 23,290,623 $ 23,756,436<br />
$ 130,545,563 $ 198,479,182 <strong>Benefit</strong> <strong>of</strong> the Project (Truck minus Rail) $ - $ - $ 9,703,129 $ 11,300,007 $ 12,889,866 $ 14,467,706 $ 14,724,916 $ 14,986,627 $ 15,252,917 $ 15,523,864 $ 15,799,547 $ 16,115,538 $ 16,437,849 $ 16,766,606 $ 17,101,938 $ 17,443,977 $ 17,792,856 $ 18,148,713 $ 18,511,688 $ 18,881,921<br />
$ 29,315,434 $ 30,851,638 PROJECT COST $ 20,818,450 $ 11,287,499<br />
this assumes same on-going O&M cost as at present -- fewer problems but higher level <strong>of</strong> track maintenance<br />
4.45 6.43 B/C Ratio<br />
$ 101,230,129 $ 167,627,544 Net Present Value <strong>of</strong> Project<br />
6 6 Years to Break-Even<br />
10