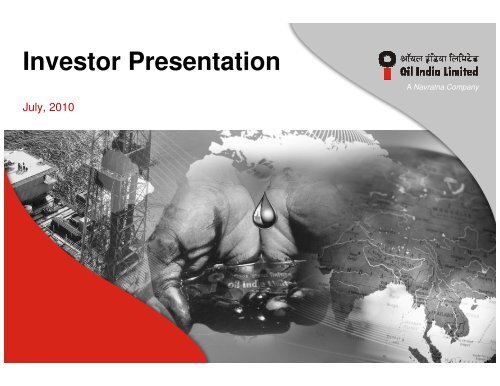
Investor Presentation - Oil India Limited
Investor Presentation - Oil India Limited
Investor Presentation - Oil India Limited

Create successful ePaper yourself
Turn your PDF publications into a flip-book with our unique Google optimized e-Paper software.
<strong>Investor</strong> <strong>Presentation</strong><br />
A Navratna Company<br />
July, 2010
Disclaimer<br />
This presentation contains certain forward looking statements concerning OIL <strong>India</strong>’s future business prospects<br />
and business profitability, which are subject to a number of risks and uncertainties and the actual results could<br />
materially differ from those in such forward looking statements. The risks and uncertainties relating to these<br />
statements include, but not limited to, risks and uncertainties, regarding fluctuations in earnings, our ability to<br />
manage growth, competition (both domestic and international), economic growth in <strong>India</strong>, ability to attract and<br />
retain highly skilled professionals, time and cost over runs on projects, our ability to manage our international<br />
operations, government policies and actions with respect to investments, fiscal deficits, regulations, etc.,<br />
interest and other fiscal costs generally prevailing in the economy. The company does not undertake to make<br />
any announcement in case any of these forward looking statements become materially incorrect in future or<br />
update any forward looking statements made from time to time by or on behalf of the company.<br />
2
Sector Fundamentals
Global <strong>Oil</strong> and Gas Trends<br />
Brent oil price futures/forwards and forecasts<br />
(USD/bbl)<br />
160<br />
(Rebased to Brent)<br />
85<br />
LTM oil price and equity market performance<br />
140<br />
120<br />
100<br />
80<br />
60<br />
40<br />
20<br />
75<br />
65<br />
55<br />
45<br />
35<br />
+115%<br />
+76%<br />
+32%<br />
0<br />
2003 2005 2007 2009 2011 2013<br />
25<br />
Mar-09 Jun-09 Aug-09 Nov-09 Mar-10<br />
Broker high/ low range<br />
ICE Brent futures (Mar-10)<br />
CERA Global Fissures (Mar-10)<br />
CERA Break Point (Mar-10)<br />
Source: Broker reports, Bloomberg, Wood Mackenzie, CERA<br />
Historical Brent<br />
Wood Mackenzie (Mar-10)<br />
CERA Asian Phoenix (Mar-10)<br />
Broker average (Mar-10)<br />
Brent<br />
FTSE Eurofirst (<strong>Oil</strong> and Gas)<br />
FTSE AIM (<strong>Oil</strong> and Gas)<br />
Source: Datastream, FactSet market data as at March 2010<br />
Most analyst reports point to a long term increase in the prices of crude oil as reflected in the Brent oil<br />
price futures and the recovery in the <strong>Oil</strong>-related indices<br />
4
Domestic Industry Environment<br />
Steady growth in domestic energy consumption<br />
driven by <strong>India</strong>’s economic growth story 1<br />
(mmtoe)<br />
261<br />
295<br />
344<br />
379<br />
433 469<br />
Energy sources (%)<br />
Crude oil and natural gas sources would tend to grow<br />
in significance as the <strong>India</strong>n economy develops<br />
Energy Sources - <strong>India</strong><br />
Natural<br />
Gas<br />
10%<br />
Hydro<br />
5%<br />
Nuclear<br />
1%<br />
1997 2000 2004 2006 2008 2009<br />
Note:<br />
1. As of 31 st December 2009 (BP Statistical Review of World Energy, 2010)<br />
Significant supply deficit in the domestic market 1<br />
Total<br />
Consumption<br />
Crude <strong>Oil</strong> (mmbbls) Natural gas (bcm) Deficit<br />
Production<br />
1,162<br />
51.9<br />
12.6<br />
24%<br />
Crude <strong>Oil</strong><br />
32%<br />
Energy Sources - Global<br />
Hydro<br />
7%<br />
Nuclear<br />
6% Coal<br />
29%<br />
Coal<br />
52%<br />
887<br />
275<br />
76%<br />
39.3<br />
Natural Gas<br />
24%<br />
Crude <strong>Oil</strong><br />
34%<br />
1. As of 31 st December 2009 (BP Statistical Review of World Energy, 2010)<br />
5
<strong>India</strong>: Energy Scenario<br />
Primary Energy Consumption (MTOE)<br />
Iran<br />
205<br />
Canada<br />
Crude <strong>Oil</strong> Consumption (MTOE)<br />
97<br />
S Korea<br />
238<br />
Brazil<br />
104<br />
France<br />
242<br />
S Korea<br />
104<br />
Germany<br />
290<br />
Germany<br />
114<br />
Canada<br />
319<br />
UAE<br />
122<br />
Japan<br />
464<br />
Russia<br />
125<br />
<strong>India</strong><br />
469<br />
4.2% of total<br />
<strong>India</strong><br />
149<br />
3.4% of total<br />
Russia<br />
635<br />
Japan<br />
198<br />
China<br />
2,177<br />
China<br />
405<br />
USA<br />
2,182<br />
USA<br />
843<br />
• 53% of primary energy consumed by 5 countries<br />
• Total Energy Consumption - 11164.3 MMTOE<br />
• <strong>India</strong> is the 4th largest consumer of Primary Energy<br />
• World oil consumption (2008): 3,882.1 MTOE<br />
• <strong>India</strong> is the 4th largest consumer of <strong>Oil</strong> comprising<br />
3.4% of total<br />
Note:<br />
1. As of 31 st December 2009 (BP Statistical Review of World Energy, 2010)<br />
6
OIL <strong>India</strong> – An Overview
<strong>Oil</strong> <strong>India</strong>: Brief Overview<br />
̌<br />
Rich Heritage<br />
Independent <strong>India</strong>’s first commercial oil discoveries, with the first made in 1953<br />
̌<br />
Integrated O&G<br />
Player<br />
Presence across <strong>Oil</strong> & Gas Value Chain (E&P, Transportation and Downstream)<br />
Infrastructure to support growth<br />
̌<br />
Large Acreage<br />
Domestic acreage: 127,879 square kilometers;<br />
International acreage: 41,656 square kilometers<br />
̌<br />
Strong Reserve<br />
Base<br />
Total 2P reserves of over 957 mmboe; with RR ratio of over 165% in FY10<br />
̌<br />
Strong<br />
Financials<br />
Revenue: INR 8,860 Cr. (FY10), INR 1,817 Cr. Q1(FY11)<br />
PAT : INR 2,610 Cr. (FY 10), INR 501 Q1(FY11)<br />
Market cap : USD 7.07 bn 1<br />
<strong>India</strong>’s premier <strong>Oil</strong> & Gas “Navratna” company engaged in the exploration, development, production and<br />
transportation of crude oil and natural gas in <strong>India</strong><br />
Note:<br />
1. As of July 23, 2010<br />
8
Our Vision<br />
"The fastest growing energy company with a global presence providing value to the shareholder"<br />
Fastest growing Energy Company with highest profitability.<br />
Delight customers with quality products and services at competitive prices<br />
Learning Organization, nurturing initiatives, innovations and aspirations with best practices<br />
Team, committed to honesty, integrity, transparency and mutual trust creating employee pride<br />
Fully committed to safety, health and environment<br />
Responsible corporate citizen deeply committed to socio-economic development in its areas<br />
of operations<br />
9
Rich heritage of building a company<br />
• Independent <strong>India</strong>’s first commercial oil discoveries were made<br />
by Assam <strong>Oil</strong> Company<br />
– Nahorkatiya, Assam – 1953<br />
– Moran, Assam – 1956<br />
• Incorporated as Joint Sector Company on 18 February, 1959<br />
– 2/3 rd Owned by Assam <strong>Oil</strong> Company / Burmah <strong>Oil</strong> Company<br />
– 1/3 rd Owned by Government of <strong>India</strong><br />
• Became a Public Sector Undertaking, GOI on 14 October, 1981<br />
• Five decades of experience in Exploration & Production<br />
• Second largest national oil and gas company in <strong>India</strong><br />
• Achieved overwhelming response in its maiden public issue on<br />
30 September 2009<br />
10
Integrated <strong>Oil</strong> & Gas Player<br />
Exploration<br />
Production<br />
Transportation<br />
Downstream<br />
Domestic: 30 E&P<br />
blocks 1<br />
International: Egypt,<br />
Gabon, Iran, Libya,<br />
Nigeria, Timor Leste,<br />
Venezuela and<br />
Yemen 2<br />
Discoveries: 15 Small<br />
to Medium 3 size<br />
discoveries recently<br />
50 years of<br />
experience<br />
FY 10 Produced<br />
25.70 mm bbl of<br />
Crude oil:<br />
– 40 installations<br />
– 1,315 km pipelines<br />
FY 10 Produced 2.4<br />
bcm of Natural gas<br />
– 29 installations<br />
– 571 km pipelines<br />
Advanced Recovery<br />
techniques to<br />
maximize production<br />
Crude <strong>Oil</strong>:<br />
– 1,157 km pipeline ;<br />
~6 MMT capacity<br />
Multi-Product:<br />
– 660 km pipeline;<br />
1.72 MMT capacity<br />
Overseas pipeline:<br />
– 10% stake in 741<br />
km pipeline (Sudan)<br />
Natural Gas:<br />
– 23% stake in 192<br />
km DNPL 3 in NE<br />
Refining and<br />
marketing petroleum<br />
products:<br />
– 26% equity stake<br />
in NRL 1<br />
Gas cracker project:<br />
– 10% equity stake<br />
in BCPL 2<br />
City gas business –<br />
– Signed MOU with<br />
GAIL, HPCL, IOCL<br />
and BPCL<br />
Note:<br />
1. 9 blocks have been awarded under NELP VIII.<br />
2. Participating interests in exploration and development blocks.<br />
3. Small to Medium size discoveries: Estimated proved plus probable reserves size of less than 30 mn barrels of oil and oil equivalent gas<br />
4. MMBOE – Million Barrels of <strong>Oil</strong> Equivalent<br />
Note:<br />
1. NRL – Numaligarh Refinery <strong>Limited</strong><br />
2. BCPL – Brahmaputra Cracker and Polymer <strong>Limited</strong><br />
3. DNPL – Duliajan-Numaligarh Pipeline <strong>Limited</strong><br />
11
Strong Domestic Acreage Base<br />
Blocks Op N/Op Total<br />
NELP 12 18 30<br />
Pre-NELPJV - 3 3<br />
PEL (Nom) 19 - 19<br />
PML 13 - 13<br />
Total 44 21 65<br />
<br />
ASSAM +AP<br />
AA-ONN<br />
AA-ONN<br />
AA-ONN<br />
AA-ONN<br />
30%<br />
90%<br />
50%<br />
85%<br />
<br />
<br />
<br />
<br />
<br />
<br />
60%<br />
60%<br />
75%<br />
RJ-ONN<br />
RJ-ONN<br />
RJ-ONN<br />
<br />
AA-ONN 20%<br />
<br />
AA-ONN 85%<br />
AAP-ON<br />
AA-ONN<br />
AA-ONN<br />
16%<br />
15%<br />
10%<br />
AA-ONN 50%<br />
15%<br />
GK-OSJ-3<br />
Summary of Acreage (sq. km.)<br />
41,656<br />
4,809<br />
2,519<br />
6,041 1<br />
16,600 2<br />
PEL Nomination<br />
JV/PSC (NO)<br />
NELP (NO)<br />
97,910<br />
Total Area – 169,535 Sq. Km<br />
PML Nomination<br />
NELP (Operator)<br />
Overseas (PI)<br />
<br />
CY-DWN 50%<br />
CY-DWN<br />
KG-OSN<br />
20%<br />
Strong<br />
presence in<br />
prospective<br />
East Coast<br />
30%<br />
KG-DWN 15%<br />
KG-DWN<br />
AN-DWN<br />
MN-OSN<br />
10%<br />
20%<br />
KG-DWN 15%<br />
Note:<br />
NO – Non-operator<br />
PI – Participatory Interests<br />
AN-DWN 30%<br />
1. Includes a 40% PI in the Kharsang fields of area 11 sq. km.<br />
2. Includes 3,992 Sq Km of Joint Operatorship<br />
20%<br />
KG-DWN 10%<br />
KG-ONN 90%<br />
MN-DWN<br />
+<br />
<br />
20%<br />
AN-DWN 40%<br />
AN-DWN 40%<br />
AN-DWN 30%<br />
MZ-ONN<br />
WB-ONN<br />
KG-DWN<br />
<br />
75%<br />
25%<br />
10%<br />
<br />
Map Not to Scale<br />
NELP I-VIII<br />
Nomination ML(s)/PEL(s)<br />
JVC Blocks<br />
OIL as Operator<br />
+ Joint Operator<br />
12
With Dominant International Footprint<br />
50<br />
50<br />
25(Sonatrach)<br />
7,087<br />
2,710<br />
6,629<br />
LIBYA<br />
Area 86<br />
Area 102/4<br />
Area 95/96<br />
EGYPT<br />
Block 3<br />
Block 4<br />
8,287<br />
2,600<br />
25<br />
(GSPC)<br />
17.5 (Suntera)<br />
2,094<br />
NIGERIA<br />
OPL 205<br />
SUDAN<br />
Pipeline<br />
741 km 10<br />
45<br />
3,761<br />
GABON<br />
Shakti<br />
IRAN<br />
Farsi Offshore<br />
3,500 20(OVL)<br />
3.5<br />
Repsol 11%<br />
Petronas 11%<br />
OVL 11%<br />
IOC 3.5%<br />
203<br />
180<br />
VENEZUELA<br />
Corabobo 1 North<br />
Corabobo 1 Central<br />
TIMOR LESTE<br />
Block K<br />
2,384<br />
12.5<br />
(Reliance)<br />
Total:<br />
19 Blocks<br />
Area – 41,656 sq.km<br />
Operator<br />
Area (Sq. Km)<br />
YEMEN<br />
Block 82<br />
Block 83<br />
1,857<br />
364<br />
15<br />
(Medco)<br />
OIL’s Participating Interest (%)<br />
13
Exploration and Development Growth Mapping (Acreage)<br />
Acreage (Sq. Km)<br />
180000<br />
160000<br />
140000<br />
120000<br />
100000<br />
80000<br />
60000<br />
40000<br />
20000<br />
Nomination Including Pre-<br />
NELP JVs (Till 1998)<br />
Current Acreage<br />
~ 10 Times Growth<br />
Domestic = 127,879 sq.km<br />
Overseas = 41,656 sq.km<br />
NELP<br />
(1999 onwards)<br />
+<br />
Overseas<br />
(2005 onwards)<br />
0<br />
Very limited<br />
Scope for Growth<br />
Operation Area – NE, RJ, UP, Uttarakhand<br />
Competition<br />
Level Playing Field<br />
Operation Area – Pan <strong>India</strong> + Overseas<br />
14
Strong Reserve Base with Significant Growth Potential<br />
In MMBBL As on 01/04/2010<br />
1600<br />
1400<br />
1,437<br />
1200<br />
1000<br />
957<br />
522<br />
800<br />
600<br />
400<br />
200<br />
0<br />
377<br />
521<br />
239<br />
915<br />
580<br />
282<br />
1P 2P 3P<br />
Crude <strong>Oil</strong> Natural Gas<br />
1P Reserves represent:<br />
≥ 11 Years current production of Crude <strong>Oil</strong><br />
≥ 15 Years current production of Natural Gas<br />
≥ 12 Years current production of O+OEG<br />
15
Healthy and Consistent Reserve Replacement Ratio<br />
Reserve Replacement Ratio (x)<br />
1.59 2.04 2.04 1.69 1.65<br />
Crude <strong>Oil</strong> and Natural Gas (O+OEG) Production and Reserve Accretion (in MMTOE)<br />
8.4<br />
10.4 10.3<br />
9.4 9.7<br />
5.3 5.1 5.1<br />
5.6 5.9<br />
FY2006 FY2007 FY2008 FY2009 FY2010<br />
Production (O + OEG) Accretion<br />
Adequate reserve replenishment<br />
16
Integrated In-house E&P Infrastructure To Support Growth<br />
Infrastructure to Support E&P Activities<br />
Production & Storage Facilities<br />
Two 2D and<br />
One 3D<br />
Seismic Crew<br />
Six Logging<br />
Trucks<br />
72<br />
Production<br />
Installations<br />
14 W/over<br />
Rigs<br />
11 Drilling<br />
Rigs<br />
5,000 Km<br />
O&G<br />
Pipelines<br />
~150k KL<br />
Crude<br />
Storage<br />
In house Expertise and Integration across Energy Infrastructure<br />
17
Strategy to Deliver Long Term Growth and Shareholder Value<br />
1<br />
Use Advanced Techniques to<br />
Improve Existing Productivity<br />
Continue to induct world<br />
class technology<br />
5<br />
Explore Non-conventional<br />
energy sources<br />
Explore alternate energy<br />
opportunities in existing<br />
acreage as well as inorganic<br />
opportunities<br />
Further Integrate<br />
Business Portfolio<br />
and Diversify across<br />
Geographies<br />
2 Increase Reserves and<br />
Production in Existing Acreage<br />
Accelerate exploration efforts<br />
Develop fields with potential<br />
4<br />
Vertical Integration<br />
3<br />
Inorganic Growth<br />
Diversify revenues through<br />
downstream investments<br />
Improve profitability by<br />
extending into higher margin<br />
product value chain<br />
Acquire blocks to augment<br />
existing reserve base<br />
Acquisition of companies<br />
that are value accretive<br />
18
Significant Investment Lined Up in Next 2 Years<br />
USD 1.9 bn of investment plans in the next two fiscal years<br />
Significant focus on Exploration and Development of existing acreage potential and M&A<br />
2010-2011: Rs 47,964 mn 2011-2012: Rs 36,579 mn<br />
M&A<br />
46%<br />
Exploration &<br />
Appraisal<br />
32%<br />
Domestic<br />
Assets<br />
9%<br />
Overseas<br />
Projects<br />
11%<br />
M&A<br />
1%<br />
Overseas<br />
Projects<br />
4%<br />
Domestic<br />
Assets<br />
6%<br />
Development<br />
12%<br />
Development<br />
27%<br />
Exploration &<br />
Appraisal<br />
52%<br />
19
Planned Activities in FY11<br />
3D Seismic Surveys<br />
984<br />
1,798<br />
Exploratory Drilling<br />
17<br />
34<br />
Development Drilling<br />
30<br />
46<br />
FY10<br />
FY11<br />
3D Planned in FY11<br />
– 250 SqKm in Assam<br />
& AP (FY10: 744)<br />
– 1,448 SqKm in<br />
NELP planned in<br />
FY11 (FY10: 240)<br />
– Focus in Rajasthan<br />
and KG<br />
100 SqKm Overseas<br />
planned (FY10: NIL)<br />
FY10<br />
Assam & AP<br />
FY11<br />
– 17 wells planned in<br />
FY11 (FY10: 13)<br />
NELP: 14 wells planned<br />
(FY10: 3); primarily RJ<br />
and KG<br />
Overseas drilling<br />
– Total planned 3<br />
wells (FY10: 1)<br />
FY10<br />
FY11<br />
Major thrust continues<br />
to be in Assam & AP<br />
– 44 wells for FY11<br />
(FY10: 30)<br />
2 new wells planned in<br />
Rajasthan<br />
Over 50% increase in 3D Surveys, Exploratory and Development Drilling Planned.<br />
20
OIL: Strategy in Place To Deliver Long Term Value<br />
Organic Growth- supported by our E&P Programme<br />
– To enhance the production of crude oil on a sustainable basis from the existing assets in NE region<br />
– To increase the gas sales significantly in NE region<br />
– To discover hydrocarbons in our NELP & overseas exploration acreages<br />
Inorganic Growth in JV with IOCL - supported by US$2bn cash<br />
– To acquire small-medium sized producing properties equivalent to the organic growth<br />
Selective Diversification & down-stream integration- supported by MOU’s<br />
– To participate in down stream ventures of refining & petrochemicals on a selective basis<br />
– To venture into shale gas in our nominated acreages in the NE Region<br />
– To venture into alternative sources of energy<br />
– To venture into CNG /CGD<br />
More Stress on Core Business.<br />
21
Shareholding pattern<br />
1.6%<br />
3.4%<br />
3.5%<br />
0.7%<br />
12.4%<br />
78.4%<br />
Promoters (GOI)<br />
Public & Others<br />
MF<br />
• Listing :Listed on BSE/NSE on 30 th Sept 2009<br />
• Number of shares : 240.45 mn<br />
• Dividend :FY10 Int dividend/share : Rs.18<br />
F Dividend (Prop)/ share : Rs.16<br />
• Share price (H/L) :Rs.1560/ Rs.1019<br />
• Market Cap :Rs. 32509 cr / USD 7.07 bn<br />
Bodies Corporate<br />
FII<br />
FI / Banks<br />
Key shareholders<br />
% Shareholding<br />
<strong>India</strong>n <strong>Oil</strong> Corporation 4.45%<br />
Bharat Petroleum Corporation 2.23%<br />
Hindustan Petroleum Corporation 2.23%<br />
ICICI Prudential Life Insurance 1.29%<br />
HDFC Standard Life Insurance 1.13%<br />
HDFC Trustee Co Ltd-HDFC Top 200 Fund 0.54%<br />
HDFC Trustee Co Ltd-HDFC Equity Fund 0.41%<br />
Reliance Life Insurance Company <strong>Limited</strong> 0.36%<br />
22
23-Jul-10<br />
22-Jul-10<br />
21-Jul-10<br />
23<br />
Performance of OIL’s Shares (W.r.t. Sector)<br />
OIL SHARE PERFORMANCE VS. ONGC (FROM 22.06.2010 TO 23.07.2010)<br />
1,500.00<br />
1,450.00<br />
1,400.00<br />
1,350.00<br />
1,300.00<br />
1,250.00<br />
1,200.00<br />
1,150.00<br />
22-Jun-10<br />
23-Jun-10<br />
24-Jun-10<br />
25-Jun-10<br />
28-Jun-10<br />
29-Jun-10<br />
30-Jun-10<br />
1-Jul-10<br />
2-Jul-10<br />
5-Jul-10<br />
6-Jul-10<br />
7-Jul-10<br />
8-Jul-10<br />
9-Jul-10<br />
12-Jul-10<br />
13-Jul-10<br />
14-Jul-10<br />
15-Jul-10<br />
16-Jul-10<br />
19-Jul-10<br />
20-Jul-10<br />
OIL SHARE PRICE`<br />
OIL ONGC
Performance of OIL’s Shares (w.r.t. SENSEX / NIFTY)<br />
OIL SHARE PERFORMANCE VS. SENSEX (FROM 22.06.2010 TO 23.07.2010)<br />
1,500.00<br />
1,440.00<br />
1,380.00<br />
1,320.00<br />
1,260.00<br />
1,200.00<br />
1,140.00<br />
20,000.00<br />
19,500.00<br />
19,000.00<br />
18,500.00<br />
18,000.00<br />
17,500.00<br />
17,000.00<br />
16,500.00<br />
16,000.00<br />
22-Jun-10<br />
23-Jun-10<br />
24-Jun-10<br />
25-Jun-10<br />
28-Jun-10<br />
29-Jun-10<br />
30-Jun-10<br />
1-Jul-10<br />
2-Jul-10<br />
5-Jul-10<br />
6-Jul-10<br />
7-Jul-10<br />
8-Jul-10<br />
9-Jul-10<br />
12-Jul-10<br />
13-Jul-10<br />
14-Jul-10<br />
15-Jul-10<br />
16-Jul-10<br />
19-Jul-10<br />
20-Jul-10<br />
21-Jul-10<br />
22-Jul-10<br />
23-Jul-10<br />
OIL SHARE PRICE `<br />
24<br />
OIL SENSEX<br />
OIL SHARE PERFORMANCE VS. NIFTY (FROM 22.06.2010 TO 23.07.2010)<br />
1,500.00<br />
1,450.00<br />
1,400.00<br />
1,350.00<br />
1,300.00<br />
1,250.00<br />
1,200.00<br />
1,150.00<br />
5,800.00<br />
5,700.00<br />
5,600.00<br />
5,500.00<br />
5,400.00<br />
5,300.00<br />
5,200.00<br />
5,100.00<br />
22-Jun-10<br />
23-Jun-10<br />
24-Jun-10<br />
25-Jun-10<br />
28-Jun-10<br />
29-Jun-10<br />
30-Jun-10<br />
1-Jul-10<br />
2-Jul-10<br />
5-Jul-10<br />
6-Jul-10<br />
7-Jul-10<br />
8-Jul-10<br />
9-Jul-10<br />
12-Jul-10<br />
13-Jul-10<br />
14-Jul-10<br />
15-Jul-10<br />
16-Jul-10<br />
19-Jul-10<br />
20-Jul-10<br />
21-Jul-10<br />
22-Jul-10<br />
23-Jul-10<br />
OIL SHARE PRICE `<br />
OIL NIFTY
OIL has Outperformed the Benchmark Indices Since Listing<br />
140%<br />
130%<br />
28.3%<br />
120%<br />
14.4%<br />
110%<br />
100%<br />
3.8%<br />
3.4%<br />
90%<br />
80%<br />
Sep 09 Nov 09 Jan 10 Feb 10 Apr 10 Jun 10<br />
Source: Bloomberg as on June 30, 2010<br />
<strong>Oil</strong> <strong>India</strong> ONGC BSE <strong>Oil</strong> & Gas Index SENSEX<br />
25
Recent Developments
Select Highlights for FY2010<br />
OIL’s shares listed in Mumbai Stock Exchange on 30.09.2009.<br />
<br />
<br />
<br />
Achieved the highest daily rate of crude oil production of 3.61 MTPA (> 26 mmbbls/Year)<br />
Achieved the highest daily rate of natural gas production of 6.67 MMSCMD in North East and<br />
potential of 0.93 MMSCMD in Rajasthan<br />
Navratna status awarded in April’ 2010, allowing it enhanced autonomy<br />
Performance during 2010 :<br />
Parameter Unit 2009-10 % Increase over<br />
2008- 09<br />
Drilling m 144,862 25<br />
Crude <strong>Oil</strong> Production MMBBL 25.70 3<br />
Crude <strong>Oil</strong> Sales MMBBL 25.76 4.22<br />
Natural Gas Production BCM 2.415 6.44<br />
Natural Gas sales BCM 1.86 7.2<br />
<br />
Award of Block in Venezuela on 10th Feb’ 2010, Mixed Company Contract signed on 12th May’<br />
2010<br />
27
Select Highlights for FY2010 (Contd.)<br />
<br />
<br />
<br />
<br />
<br />
<br />
Completed 660 Km long NRL – Siliguri Product Pipeline.<br />
LPG plant completed 26 years of continuous service with excellent track record of 99% Plant<br />
Load Capacity. LPG production of 44,950 tonnes in 2009-10 was 103.1% of target<br />
Made six hydrocarbon discoveries in Assam. Reserve Accretion was 9.65 MMTOE (101.6% of<br />
target).<br />
Awarded 9 blocks in NELP-VIII round - the highest so far by OIL - 2 as Operator, 1 as Joint<br />
Operator and PIs in 6.<br />
Entry in Offshore as Operator<br />
Entry in Deep Water Block as Joint Operator<br />
Duliajan – Numaligarh Gas Pipeline (DNPL) Project likely to be completed by Aug, 2010.<br />
<br />
<br />
<br />
Completed Preliminary Activities in order to Develop CNG Network in Assam<br />
Measurement of Carbon footprint initiated.<br />
Revisiting Long Term Strategic Plan and PMS.<br />
28
Key Developments<br />
Numaligarh Refinery Shutdown<br />
• Numaligarh Refinery Shutdown since 16th March, 2010 to End June, 2010<br />
– Resulting in a loss of approx. 0.13 MMT of Crude oil & 28 mmscm of NG<br />
– Actions are in hand to make up for the Loss<br />
Revision of Natural Gas Prices<br />
• Price for Natural Gas increased to USD 4.2/ MMBTU ;<br />
• Consequentially additional Gross Revenue Generation of Rs. 520 Crores (Annualised)<br />
• Consequentially additional Net Revenue Generation of Rs.347 Crores (Annualised)<br />
• Impact on EPS of Rs. 14.4 per share on annualised basis<br />
29
Partial De-Control<br />
Parikh Committee Recommendation<br />
EGoM Decision<br />
Petrol To be Deregulated<br />
̌ Petrol Prices De-regulated<br />
Diesel To be Deregulated<br />
̌ Diesel Prices Partially De-regulated<br />
Increase of Rs. 6 per Litre for Kerosene<br />
̌ Increase of Rs. 3 per Litre for Kerosene<br />
Increase of Rs. 100 per Cylinder for LPG<br />
̌ Increase of Rs. 35 per Cylinder for LPG<br />
30
Operating Performance
Crude <strong>Oil</strong> and Natural Gas Production<br />
Crude <strong>Oil</strong> Production (mm bbl)<br />
Natural Gas Production (mm scm)<br />
0.93<br />
• NRL shutdown impact in Q1 FY11 – 0.93 mm bbl<br />
32
Crude <strong>Oil</strong> Production Cost (Assam & AP)<br />
7.09 7.10<br />
6.80 6.80<br />
7.24<br />
7.24<br />
4.80<br />
4.80
Low Finding & Development Costs<br />
Finding and Development Costs (USD / bbl)<br />
OIL has the Advantage of Low Finding & Development costs.<br />
34
Financial Performance
Sharing of Subsidy by Upstream Companies<br />
Rs. In Crores<br />
2006-07 2007-08 2008-09 2009-10 Q1-FY10 Q1-FY11<br />
ONGC 17,025 22,001 28,226 11,554 429 5,516<br />
OIL 1,994 2,307 3,023 1,549 58 730<br />
GAIL 1,488 1,401 1,694 1,326 75 445<br />
Total 20,507 25,709 32,943 14,430 561 6691<br />
% SHARING<br />
2006-07 2007-08 2008-09 2009-10 Q1-FY10 Q1-FY11<br />
ONGC 83% 86% 86% 80% 77% 82%<br />
OIL 10% 9% 9% 11% 10% 11%<br />
GAIL 7% 5% 5% 9% 13% 7%<br />
Total 100% 100% 100% 100% 100% 100%<br />
36
Realized Price<br />
(USD/barrel)<br />
83.22<br />
81.69<br />
78.1<br />
68.53<br />
58.13<br />
55.57<br />
56.21<br />
57.49<br />
55.65<br />
49.68<br />
36.15<br />
39.01 39.80 39.39<br />
33.79<br />
FY2008 FY2009 FY2010 Q1 FY10 Q1 FY'11<br />
Gross Realized Price Realized Price after Subsidy/Discount Net Realized Price<br />
37
Strong Revenue and Profitability<br />
Revenue and Profitability analysis (INR Cr.)<br />
38
Strong Net-worth and Book Capital<br />
Networth (INR Cr.) and Book Value Analysis (INR)<br />
39
Cash Flow and EBITDA Margin<br />
Cash Flow (INR Cr.) EBITDA (INR Cr.) and EBITDA MARGIN (%)<br />
EBITDA<br />
EBITDA MARGIN<br />
Consistent and Attractive Cash Flow Generation<br />
40
Dividends distribution and Earnings per share highlights<br />
Dividends distribution<br />
Earnings per share and Debt-Equity ratio<br />
The dividend per share has shown a consistent<br />
uptrend<br />
Steady increase in EPS and minimal debt on the<br />
balance sheet<br />
41
Guidance: FY11<br />
2009-10 2010-11 (Target)<br />
Crude oil production 3.57 mmt 3.70 MMT<br />
Natural gas production 2,415 mmscm 2,620 mmscm<br />
<br />
<br />
<br />
<br />
<br />
Increase in Exploratory and Development Drilling Meterage<br />
Increase in Work Overs<br />
Enhanced Water Injection<br />
Endeavour to Enhance LPG production through NGL Recycling<br />
Endeavour to Reduce Gas Flaring by Inducting LNG Technology<br />
42
Conclusion<br />
<br />
<br />
<br />
<br />
<br />
<br />
<br />
<br />
<br />
Stable Operations, Looking for Growth<br />
Company with Good Operating Track Record<br />
Sound Financial Health<br />
Company with more than 5 Decades of E&P Expertise<br />
Large Prospective E&P Acreage<br />
Entry into Deepwater/Offshore Blocks as Operator<br />
Entry into discovered assets in Venezuela, Acquisition Thrust continues<br />
Spreading its Wings : NE Pan <strong>India</strong> Global<br />
Diversifying into New Areas<br />
43
Thank You
Venezuela - Project Carabobo<br />
• Contains two Blocks – North and Central<br />
• OIL’s PI – 3.5% [PdVSA-60%, REPSOL, PETRONAS, OVL – 11% each, IOC-3.5%]<br />
• Contract Period – 25 Years, Possible Extension – 15 Years<br />
• Estd <strong>Oil</strong> In Place – 27.3 billion barrels<br />
• Recoverable Reserve (in 25 Years) - 3 billion barrels<br />
• Expected Daily Production – 400,000 bbl<br />
• Expected Annual Production – 146 Mn bbl<br />
• Estd. Investment for OIL - $ 424 Mn [Debt: Equity – 1.5:1]<br />
45
Crude oil production<br />
Crude <strong>Oil</strong> (mmbbls)<br />
28<br />
27<br />
27.12<br />
26<br />
25<br />
24.95<br />
25.7<br />
24<br />
23<br />
22<br />
22.69<br />
22.99<br />
22.17<br />
22.38<br />
21<br />
2004-05 2005-06 2006-07 2007-08 2008-09 2009-10 2010-11<br />
46<br />
Year
Crude oil production<br />
7000<br />
8000<br />
9000<br />
10000<br />
MTPD<br />
Daily Production Rate<br />
47<br />
4000<br />
5000<br />
6000<br />
4/1/2006<br />
5/16/2006<br />
6/30/2006<br />
8/14/2006<br />
9/28/2006<br />
11/12/2006<br />
12/27/2006<br />
2/10/2007<br />
3/27/2007<br />
5/11/2007<br />
6/25/2007<br />
8/9/2007<br />
9/23/2007<br />
11/7/2007<br />
12/22/2007<br />
2/5/2008<br />
3/21/2008<br />
5/5/2008<br />
6/19/2008<br />
8/3/2008<br />
9/17/2008<br />
11/1/2008<br />
12/16/2008<br />
1/30/2009<br />
3/16/2009<br />
4/30/2009<br />
6/14/2009<br />
7/29/2009<br />
9/12/2009<br />
10/27/2009<br />
12/11/2009<br />
1/25/2010<br />
3/11/2010<br />
4/25/2010<br />
6/9/2010<br />
7/24/2010<br />
MTPD<br />
Time
12.07.2010<br />
(9904 MTPD)<br />
7/24/2010<br />
7/18/2010<br />
7/12/2010<br />
7/6/2010<br />
6/30/2010<br />
Crude oil production – NRL effect<br />
10000<br />
Daily produciton rate 29.06.2010<br />
(9705 MTPD)<br />
8000<br />
MTPD<br />
6000<br />
4000<br />
1/1/2010<br />
1/7/2010<br />
1/13/2010<br />
1/19/2010<br />
1/25/2010<br />
1/31/2010<br />
2/6/2010<br />
2/12/2010<br />
2/18/2010<br />
2/24/2010<br />
3/2/2010<br />
3/8/2010<br />
3/14/2010<br />
3/20/2010<br />
3/26/2010<br />
4/1/2010<br />
4/7/2010<br />
4/13/2010<br />
4/19/2010<br />
4/25/2010<br />
5/1/2010<br />
5/7/2010<br />
5/13/2010<br />
5/19/2010<br />
5/25/2010<br />
5/31/2010<br />
6/6/2010<br />
6/12/2010<br />
6/18/2010<br />
6/24/2010<br />
<strong>Oil</strong> production cutback on account of NRL S/D<br />
Total direct oil production loss : 130, 000 tonnes<br />
Time<br />
48
Refinery wise Crude <strong>Oil</strong> Delivery<br />
Qty in bbls<br />
Particulars Q1 FY'11 Q1 FY'10 Variation % Variation<br />
IOC(AOD) 1,095,063 508,486 586,578 115.36<br />
IOC (GHY) 1,710,390 1,403,462 306,928 21.87<br />
IOC (BGR) 1,609,146 777,360 831,785 107.00<br />
NRL 1,084,137 3,472,910 (2,388,772) (68.78)<br />
Total 5,498,736 6,162,218 (663,482) (10.77)<br />
49