Statement of J. Richard Berman, Assistant Inspector General for ...
Statement of J. Richard Berman, Assistant Inspector General for ...
Statement of J. Richard Berman, Assistant Inspector General for ...

You also want an ePaper? Increase the reach of your titles
YUMPU automatically turns print PDFs into web optimized ePapers that Google loves.
STATEMENT OF J. RICHARD BERMAN<br />
ASSISTANT INSPECTOR GENERAL FOR AUDITS<br />
U. S. DEPARTMENT OF HOMELAND SECURITY<br />
BEFORE THE<br />
SUBCOMMITTEE ON EMERGENCY PREPAREDNESS,<br />
SCIENCE, AND TECHNOLOGY<br />
COMMITTEE ON HOMELAND SECURITY<br />
U. S. HOUSE OF REPRESENTATIVES<br />
APRIL 12, 2005
Mr. Chairman and Members <strong>of</strong> the Committee:<br />
Thank you <strong>for</strong> the opportunity to be here today to discuss our work on the Department <strong>of</strong><br />
Homeland Security’s (the Department’s) first responder grant programs. My remarks<br />
will focus on our March 2004 report entitled, “Distributing and Spending “First<br />
Responder” Grant Funds,” and the actions taken by the Department’s Office <strong>for</strong><br />
Domestic Preparedness (ODP), and its Office <strong>of</strong> State and Local Government<br />
Coordination and Preparedness (SLGCP), <strong>of</strong> which the ODP is now a part, to resolve<br />
recommendations made in that report. Our audit covered funds awarded under the FY<br />
2002 State Domestic Preparedness Program (SDPP), the FY 2003 State Homeland<br />
Security Grant Program (SHSGP), and the FY 2003 SHSGP Part II.<br />
<strong>General</strong>ly, we found that states, local jurisdictions, and first responder organizations had<br />
been slow to receive and spend ODP first responder grant funds. For example, as <strong>of</strong><br />
February 2004, <strong>of</strong> the $882 million in FY 2002 SDPP and FY 2003 SHGP funds awarded<br />
by the ODP, 79% still remained in the U.S. Treasury. Because our report is a year old,<br />
we have updated a table showing more current draw down in<strong>for</strong>mation and attached it to<br />
this statement as Attachment 1. As <strong>of</strong> April 2005, only 29% <strong>of</strong> the $882 million has not<br />
been drawn down.<br />
We identified numerous reasons <strong>for</strong> the delayed spending. In some instances, states and<br />
local jurisdictions had delayed spending funds pending the completion <strong>of</strong> state-wide risk<br />
assessments and homeland security strategies and the development <strong>of</strong> detailed spending<br />
plans. We also identified numerous other reasons <strong>for</strong> delayed spending -- some<br />
unavoidable but others that could be mitigated. For example, many states and<br />
jurisdictions complained <strong>of</strong> unclear federal guidance, inadequate staffing resulting from<br />
the economic downturn and budget shortages, and, in some instances, equipment<br />
backorders caused by the same equipment being purchased by our military.<br />
Expenditures do not tell the whole story, however. We also found that while only a small<br />
percentage <strong>of</strong> the funds had been drawn down, much <strong>of</strong> the remainder had been<br />
committed or obligated. In addition, these are reimbursement programs, and some states<br />
and jurisdictions had already purchased equipment but had not yet requested<br />
reimbursement under the grants.<br />
SLGCP responded positively to our report and agreed with most <strong>of</strong> our<br />
recommendations. In addition, the Department has made considerable progress in<br />
responding to state and local government <strong>of</strong>ficials’ calls <strong>for</strong> the establishment <strong>of</strong> a “onestop-shop”<br />
that would consolidate the various preparedness grants into a single,<br />
comprehensive program. The Department also created the Task Force on State and<br />
Local Homeland Security Funding. The Task Force report, published in June 2004,<br />
mirrored many <strong>of</strong> the findings <strong>of</strong> our audit. Further, the GAO published a report in<br />
2
February 2005, HOMELAND SECURITY – Management <strong>of</strong> First Responder Grant<br />
Programs Has Improved, but Challenges Remain, that documents the Department’s<br />
progress in many <strong>of</strong> the areas identified in our report.<br />
Following are the major findings and recommendations we made along with the status <strong>of</strong><br />
the Department’s actions to address them.<br />
Delayed Spending <strong>of</strong> Grant Funds<br />
We found that state and local government administrative practices <strong>of</strong>ten delayed their<br />
spending <strong>of</strong> grant funds. Often, the ability <strong>of</strong> states and localities to spend grant funds<br />
expeditiously was complicated by the need to adhere to state and local legal and<br />
procurement requirements and approval processes.<br />
We recommended that the ODP identify and publish best practices that result in faster<br />
and more efficient grant processing and spending. For example, identify state<br />
procurement practices that result in first responder equipment being supplied in a timely<br />
and cost effective manner.<br />
Department ef<strong>for</strong>ts are under way to identify and disseminate best practices, including<br />
how states and localities manage legal and procurement issues that affect grant<br />
distribution. The Department’s Homeland Security Advisory Council Task Force stated<br />
in its June 2004 report that some jurisdictions have been “very innovative” in developing<br />
mechanisms to support the procurement and delivery <strong>of</strong> emergency-response-related<br />
equipment. The task <strong>for</strong>ce recommended that, among other things, the Department<br />
should, in coordination with state, county, and other governments, identify, compile, and<br />
disseminate best practices to help states address grant management issues. The ODP has<br />
established a new Homeland Security Preparedness Technical Assistance Program<br />
service to enhance the grant management capabilities <strong>of</strong> state administrative agencies.<br />
Also, the Department established a password protected web site, Lessons Learned<br />
In<strong>for</strong>mation Sharing, which allows states, local governments, and first responder<br />
organizations to share best practices.<br />
Need <strong>for</strong> More Meaningful Reporting by States<br />
Although only a small percentage <strong>of</strong> the funds had been drawn down, the amount States’<br />
reported drawing down did not provide a clear picture <strong>of</strong> states’ actual progress <strong>for</strong> three<br />
reasons. First, some states had obligated and spent substantial amounts but had not yet<br />
drawn down the funds. Second, states were inconsistent in how they reported funds as<br />
being obligated. Third, 30 <strong>of</strong> the 56 states and territories reported on a cash basis and did<br />
not report obligations at all.<br />
We recommended that the ODP require more meaningful reporting by states so it can<br />
track progress more accurately and assist states when necessary. Specifically, we<br />
recommended they ensure that the definition <strong>of</strong> obligation is consistent <strong>for</strong> both<br />
programmatic and financial reporting purposes and require states using a “cash basis”<br />
accounting system to report the value <strong>of</strong> binding agreements to be funded by first<br />
3
esponder grant funds. The Task Force also recommended standardized terminology and<br />
real-time tracking capabilities.<br />
The ODP has not changed its reporting requirements <strong>for</strong> obligations. However, starting<br />
in fiscal year 2004 and continuing in fiscal year 2005, states are required to submit Initial<br />
Strategy Implementation Plans that show how planned grant expenditures are linked to<br />
larger projects, which in turn support specific goals and objectives in the state homeland<br />
security strategy. In addition to these plans, the ODP requires states to submit biannual<br />
strategy implementation reports showing how the actual expenditure <strong>of</strong> grant funds is<br />
linked to strategy goals and objectives. While these changes should be helpful, we will<br />
continue to follow-up with the ODP on implementing our recommendation to report<br />
obligations.<br />
Need <strong>for</strong> Clear Federal Guidance<br />
State and local <strong>of</strong>ficials told us that planning ef<strong>for</strong>ts were <strong>of</strong>ten delayed because first<br />
responders and emergency <strong>of</strong>ficials did not have clear federal guidance on equipment,<br />
training, exercises, and preparedness levels, making it difficult <strong>for</strong> them to prioritize their<br />
needs.<br />
We recommended that the ODP accelerate the development <strong>of</strong> federal guidelines <strong>for</strong> first<br />
responder capabilities, equipment, training, and exercises.<br />
In responding to our recommendation, ODP’s Executive Director said that, in addition to<br />
developing a standardized Weapons <strong>of</strong> Mass Destruction awareness training program,<br />
ODP was developing national per<strong>for</strong>mance standards <strong>for</strong> assessing domestic<br />
preparedness capabilities and identifying gaps in those capabilities. Homeland Security<br />
Presidential Directive-8 called <strong>for</strong> a new national preparedness goal and per<strong>for</strong>mance<br />
measures, standards <strong>for</strong> preparedness assessments and strategies, and a system <strong>for</strong><br />
assessing the nation’s overall preparedness. The Department issued an Interim National<br />
Preparedness Goal on April 1, 2005. . The goal is a product <strong>of</strong> a capabilities-based<br />
planning process that led to the identification <strong>of</strong> core capabilities that the Nation and its<br />
states, communities, and citizens need to possess. By mid-April 2005, the Department<br />
plans to issue detailed instructions on how communities can use the Goal and a<br />
description <strong>of</strong> how the Goal will be used in the future to manage Federal preparedness<br />
assistance. For FY 2006, states and urban areas are to update their Homeland Security<br />
Preparedness Strategies to reflect how they will address seven National Priorities in order<br />
to receive further Federal preparedness assistance. These priorities include: 1) implement<br />
the National Incident Management System and National Response Plan; 2) expanded<br />
regional collaboration; 3) implement the Interim National Infrastructure Protection Plan;<br />
4) strengthen in<strong>for</strong>mation sharing and collaboration capabilities; 5) strengthen<br />
interoperable communications capabilities; 6) strengthen capabilities <strong>for</strong> detection,<br />
response, and decontamination <strong>of</strong> chemical, biological, radiological, nuclear, or explosive<br />
materials; and 7) strengthen medical surge and mass prophylaxis capabilities. For FY<br />
2007, states and urban areas will need to revise their Homeland Security Preparedness<br />
Strategies to align with the Final National Preparedness Goal in order to receive further<br />
4
Federal preparedness assistance. The Department plans to issue the Final National<br />
Preparedness Goal and a Target Capabilities List, updated to include the target levels <strong>of</strong><br />
capabilities, on October 1, 2005.<br />
Need to revise the 45 day Transfer Rule<br />
Fiscal year 2003 appropriation language required states to transfer grant funds within 45<br />
days <strong>of</strong> the funds being awarded by the ODP. We found no evidence that the 45-day<br />
transfer rule sped up spending. States met the requirement by declaring funds obligated<br />
once they decided how they would distribute them to jurisdictions. The rule did not get<br />
the funds into the hands <strong>of</strong> the jurisdictions or streamline burdensome administrative<br />
processes.<br />
We recommended that the ODP seek a legislative change to revise or eliminate the 45-<br />
day transfer rule to allow more time <strong>for</strong> planning.<br />
The requirement was lengthened to 60 days by the fiscal year 2005 appropriation (House<br />
Conference Report 108-774).<br />
Formal Grant Monitoring System Lacking<br />
At the time <strong>of</strong> our audit, the ODP had not implemented a <strong>for</strong>mal grant monitoring system,<br />
and ODP staff had not conducted frequent field visits to monitor grant recipients.<br />
We recommended that the ODP publish program monitoring guidance and ensure that<br />
states report their progress in achieving program and per<strong>for</strong>mance goals and objectives.<br />
We also recommended that the ODP monitor state oversight <strong>of</strong> local jurisdictions’<br />
compliance with grant requirements, and develop per<strong>for</strong>mance standards that can be used<br />
to measure the overall success <strong>of</strong> the grant programs, including baselines against which to<br />
measure progress.<br />
The ODP updated its grant-monitoring guidance in fiscal year 2004 and established new<br />
monitoring goals. According to the guidance, at least one <strong>of</strong>fice file review and one onsite<br />
visit should be completed <strong>for</strong> each state each fiscal year. In addition, the<br />
requirements <strong>for</strong> Initial Strategy Implementation Plans and biannual strategy<br />
implementation reports, discussed earlier, should improve monitoring. As <strong>of</strong> September<br />
2004, the ODP had filled 138 staff positions, as compared with 63 filled positions at the<br />
end <strong>of</strong> fiscal year 2003. That should help alleviate the staffing shortages that contributed<br />
to ODP’s inability to conduct frequent grantee monitoring.<br />
Approved Equipment Lists Change Each Year<br />
The approved equipment list changed each year, generally broadening the selection <strong>of</strong><br />
equipment permitted. State and jurisdiction <strong>of</strong>ficials complained that keeping track <strong>of</strong><br />
what could be purchased with each grant was confusing and time consuming. We agreed<br />
and saw no reason that a single list could not be applied to all years.<br />
5
We recommended that the ODP allow states to use the most recent ODP-approved<br />
equipment list when purchasing equipment with prior-year grant funds.<br />
However, the ODP did not agree with our recommendation, stating that “allowing<br />
grantees to use current or future equipment lists that may differ from those provided by<br />
ODP in previous years will ultimately have a negative impact upon accounting practices,<br />
vendor selection, equipment maintenance, and training and calibration programs<br />
managed by ODP grantees.” We will continue to look at this issue as we continue our<br />
audits <strong>of</strong> state and local spending <strong>of</strong> first responder grant funds.<br />
Consolidation <strong>of</strong> Preparedness Grants Under SLGCP<br />
The Department has made considerable progress in consolidating grant programs into a<br />
one-stop-shop <strong>for</strong> states and local jurisdictions. In developing and implementing a<br />
national program to enhance the capacity <strong>of</strong> state and local agencies to respond to<br />
incidents <strong>of</strong> terrorism, the Department has integrated numerous distinct, yet related,<br />
preparedness grant initiatives and programs into a single program under the auspices <strong>of</strong><br />
SLGCP. Under the $2.6 billion Fiscal Year 2005 Homeland Security Grant Program,<br />
SLGCP consolidated the application process and administration <strong>of</strong> six programs: State<br />
Homeland Security Program, Urban Areas Security Initiative, Law En<strong>for</strong>cement<br />
Terrorism Prevention Program, Citizen Corps, Emergency Management Per<strong>for</strong>mance<br />
Grants, and Metropolitan Medical Response System Program Grants. Attachment 2 lists<br />
the Department’s major preparedness grant programs, including those still outside<br />
SLGCP.<br />
Although SLGCP has program management and monitoring responsibility <strong>for</strong> grants<br />
awarded under the Fiscal Year 2005 Homeland Security Grant Program, it relies upon the<br />
Justice Department’s Office <strong>of</strong> the Comptroller <strong>for</strong> grant fund distribution and assistance<br />
with financial management support. In the Department’s 2004 financial statement audit<br />
report, the independent auditors noted that SLGCP management was not actively<br />
involved in the financial reporting <strong>of</strong> its activities and had not obtained a thorough<br />
understanding <strong>of</strong> the control activities over its financial reporting process per<strong>for</strong>med by<br />
the Justice Department. As a result, SLGCP lacks assurance that the processing <strong>of</strong> its<br />
financial activities coincides with its business operations, are reported accurately, and<br />
controlled properly.<br />
***************************<br />
That concludes my prepared remarks, Mr. Chairman. I will be happy to answer any<br />
questions you or the members may have.<br />
6
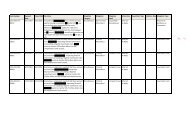
Attachment 1<br />
Department <strong>of</strong> Homeland Security<br />
Office <strong>of</strong> State and Local Government Coordination and Preparedness<br />
First Responder Grants FYs 2002 - 2004<br />
Grants<br />
FY 2002 State Domestic Preparedness<br />
Program<br />
FY 2003 State Homeland Security Grant<br />
Program Part I<br />
FY 2003 State Homeland Security Grant<br />
Program Part II<br />
Awarded<br />
($4.6B)<br />
Drawn<br />
February 2004<br />
($342M)<br />
Drawn<br />
April 2005<br />
($1.7B)<br />
Percent<br />
Drawn<br />
(37%)<br />
$315,841,000 $114,637,167 $278,058,077 88%<br />
$566,295,000 $70,721,430 $350,759,198 62%<br />
$1,500,000,000 $156,409,171 $759,595,402 51%<br />
FY 2004 Homeland Security Grant Program $2,220,000,000 - $317,763,857 14%<br />
GRAND TOTAL $4,602,136,000 $341,767,768 $1,706,176,534 37%<br />
Note: The FY 2004 grant includes funds <strong>for</strong> State Homeland Security,<br />
Law En<strong>for</strong>cement Terrorrsm Prevention, and Citizen Corps Programs.<br />
Source: U.S. Department <strong>of</strong> Justice, Office <strong>of</strong> Justice Programs
Awarded<br />
($316M)<br />
FY 2002 State Domestic Preparedness Program<br />
Drawn<br />
February 2004<br />
($115M)<br />
Drawn<br />
April 2005<br />
($278M)<br />
Percent Drawn<br />
(88%)<br />
State<br />
Alabama $5,317,000 $2,866,889 3,415,121 64%<br />
Alaska 2,783,000 71,600 2,661,315 96%<br />
American Samoa 828,000 181,808 714,671 86%<br />
Arizona 5,770,000 2,552,407 5,522,838 96%<br />
Arkansas 4,141,000 1,409,372 3,945,997 95%<br />
Cali<strong>for</strong>nia 24,831,000 2,519,960 22,365,829 90%<br />
Colorado 5,220,000 528,749 4,893,363 94%<br />
Connecticut 4,626,000 1,245,655 4,227,554 91%<br />
Delaware 2,887,000 0 2,887,000 100%<br />
District <strong>of</strong> Columbia 2,747,000 2,558,690 2,558,690 93%<br />
Florida 12,967,000 8,702,835 12,967,000 100%<br />
Georgia 7,797,000 942,500 2,393,000 31%<br />
Guam 892,000 753,037 782,786 88%<br />
Hawaii 3,172,000 74,071 1,748,006 55%<br />
Idaho 3,226,000 640,401 2,395,696 74%<br />
Illinois 10,604,000 5,777,509 10,226,949 96%<br />
Indiana 6,400,000 1,151,268 4,833,571 76%<br />
Iowa 4,308,000 3,444,273 4,307,046 100%<br />
Kansas 4,151,000 3,940,345 4,081,006 98%<br />
Kentucky 5,048,000 759,630 4,723,981 94%<br />
Louisiana 5,331,000 686,341 5,330,997 100%<br />
Maine 3,213,000 2,657,172 3,213,000 100%<br />
Maryland 5,881,000 4,244,702 5,881,000 100%<br />
Massachusetts 6,579,000 5,929,733 6,559,646 100%<br />
Michigan 8,958,000 5,875,820 8,841,855 99%<br />
Minnesota 5,631,000 3,014,307 5,473,066 97%<br />
Mississippi 4,255,000 107,619 3,145,484 74%<br />
Missouri 6,079,000 4,225,100 6,051,500 100%<br />
Montana 2,967,000 1,245,902 2,950,859 99%<br />
Nebraska 3,502,000 1,865,113 3,445,584 98%<br />
Nevada 3,693,000 2,874,192 3,498,038 95%<br />
New Hampshire 3,328,000 424,849 2,238,692 67%<br />
New Jersey 7,948,000 0 3,442,939 43%<br />
New Mexico 3,574,000 106,091 3,125,886 87%<br />
New York 14,953,000 0 14,400,000 96%<br />
North Carolina 7,706,000 3,517,086 7,569,851 98%<br />
North Dakota 2,794,000 1,240,166 2,794,000 100%<br />
Northern Mariana Islands 835,000 545,917 631,603 76%<br />
Ohio 9,897,000 5,435,537 9,894,773 100%<br />
Oklahoma 4,656,000 0 1,729,388 37%<br />
Oregon 4,637,000 682,682 3,404,254 73%<br />
Pennsylvania 10,512,000 2,578,458 8,625,437 82%<br />
Puerto Rico 4,894,000 182,426 989,817 20%<br />
Rhode Island 3,063,000 1,170,550 2,371,377 77%<br />
South Carolina 5,028,000 2,539,155 5,025,963 100%<br />
South Dakota 2,868,000 1,362,448 2,868,000 100%<br />
Tennessee 6,140,000 2,026,109 6,137,538 100%<br />
Texas 16,196,000 1,587,327 14,505,713 90%<br />
Utah 3,849,000 2,001,356 3,664,922 95%<br />
Vermont 2,772,000 1,883,177 2,772,000 100%<br />
Virginia 7,062,000 5,560,966 7,062,000 100%<br />
Virgin Islands 861,000 125,923 299,010 35%<br />
Washington 6,276,000 2,527,968 6,274,466 100%<br />
West Virginia 3,567,000 3,567,000 3,567,000 100%<br />
Wisconsin 5,925,000 2,724,977 5,925,000 100%<br />
Wyoming 2,696,000 0 2,696,000 100%<br />
GRAND TOTAL $315,841,000 $114,637,167 $278,058,077 88%
FY 2003 State Homeland Security Grant Program Part I<br />
Awarded<br />
($566M)<br />
Drawn<br />
February 2004<br />
($71M)<br />
Drawn<br />
April 2005<br />
($350M)<br />
Percent Drawn<br />
(62%)<br />
State<br />
Alabama $9,457,000 $98,821 1,392,304 15%<br />
Alaska 4,995,000 25,255 1,716,783 34%<br />
American Samoa 1,482,000 0 924,430 62%<br />
Arizona 10,584,000 1,440,515 5,973,784 56%<br />
Arkansas 7,394,000 2,521,666 4,599,720 62%<br />
Cali<strong>for</strong>nia 45,023,000 2,966,828 20,219,379 45%<br />
Colorado 9,480,000 0 4,067,980 43%<br />
Connecticut 8,265,000 0 3,189,322 39%<br />
Delaware 5,185,000 0 3,544,671 68%<br />
District <strong>of</strong> Columbia 4,910,000 0 2,767,903 56%<br />
Florida 23,654,000 2,273,323 14,717,142 62%<br />
Georgia 14,188,000 1,858,500 8,355,600 59%<br />
Guam 1,596,000 75,566 477,945 30%<br />
Hawaii 5,693,000 127,534 1,504,445 26%<br />
Idaho 5,803,000 572,511 4,281,841 74%<br />
Illinois 18,879,000 4,955,513 14,513,986 77%<br />
Indiana 11,399,000 4,859,562 6,844,335 60%<br />
Iowa 7,656,500 58,210 3,752,731 49%<br />
Kansas 7,401,000 252,327 5,022,728 68%<br />
Kentucky 9,001,000 1,655,413 5,679,514 63%<br />
Louisiana 9,451,000 95,686 4,403,442 47%<br />
Maine 5,751,000 1,009,281 2,920,002 51%<br />
Maryland 10,585,000 275,912 7,358,991 70%<br />
Massachusetts 11,711,000 40,803 6,662,261 57%<br />
Michigan 15,918,000 574,941 10,143,155 64%<br />
Minnesota 10,076,000 351,914 6,396,071 63%<br />
Mississippi 7,582,000 724,245 4,372,455 58%<br />
Missouri 10,834,000 1,815,200 8,187,100 76%<br />
Montana 5,303,000 233,966 4,000,972 75%<br />
Nebraska 6,254,500 551,663 5,052,655 81%<br />
Nevada 6,771,000 1,259,919 5,028,183 74%<br />
New Hampshire 5,727,000 334,006 2,851,128 50%<br />
New Jersey 14,222,000 0 3,371,396 24%<br />
New Mexico 6,401,000 73,673 3,268,846 51%<br />
New York 26,492,000 13,000,000 23,400,000 88%<br />
North Carolina 13,908,000 516,434 8,319,525 60%<br />
North Dakota 4,983,000 565,640 3,496,377 70%<br />
Northern Mariana Islands 1,496,000 0 1,221,848 82%<br />
Ohio 17,510,000 2,652,971 14,598,963 83%<br />
Oklahoma 8,304,000 0 3,209,367 39%<br />
Oregon 8,336,000 199,478 3,967,113 48%<br />
Pennsylvania 18,570,000 209,395 11,930,437 64%<br />
Puerto Rico 8,727,000 0 372,770 4%<br />
Rhode Island 5,489,000 1,899,312 2,926,272 53%<br />
South Carolina 9,017,000 276,082 7,221,765 80%<br />
South Dakota 5,131,000 1,011,363 3,476,128 68%<br />
Tennessee 10,978,000 22,742 6,207,870 57%<br />
Texas 29,538,000 1,652,929 25,295,231 86%<br />
Utah 6,937,000 1,190,913 5,400,517 78%<br />
Vermont 4,963,000 1,466,921 3,046,183 61%<br />
Virginia 12,716,000 4,175,589 10,826,160 85%<br />
Virgin Islands 1,542,000 14,173 1,374,337 89%<br />
Washington 11,294,000 6,355,323 9,244,406 82%<br />
West Virginia 6,340,000 1,319,768 6,318,501 100%<br />
Wisconsin 10,565,000 3,109,642 8,967,750 85%<br />
Wyoming 4,827,000 0 2,374,477 49%<br />
GRAND TOTAL $566,295,000 $70,721,430 $350,759,198 62%
State<br />
FY 2003 State Homeland Security Grant Program Part II<br />
Awarded<br />
($1,500M)<br />
Drawn<br />
February 2004<br />
($156M)<br />
Drawn<br />
April 2005<br />
($759M)<br />
Percent Drawn<br />
(51%)<br />
Alabama $25,049,000 $1,622,255 8,322,439 33%<br />
Alaska 13,230,000 42,651 5,992,365 45%<br />
American Samoa 3,926,000 214,152 1,287,923 33%<br />
Arizona 28,033,000 1,268,220 14,939,062 53%<br />
Arkansas 19,585,000 3,241,401 10,603,463 54%<br />
Cali<strong>for</strong>nia 119,256,000 19,071,957 54,682,765 46%<br />
Colorado 25,111,000 36,388 5,024,511 20%<br />
Connecticut 21,893,000 0 4,004,009 18%<br />
Delaware 13,733,000 0 5,402,463 39%<br />
District <strong>of</strong> Columbia 13,006,000 1,734,000 4,416,788 34%<br />
Florida 62,655,000 5,871,373 20,782,841 33%<br />
Georgia 37,579,000 2,171,100 18,652,100 50%<br />
Guam 4,226,000 0 516,940 12%<br />
Hawaii 15,079,000 1,144,242 3,046,943 20%<br />
Idaho 15,375,000 890,469 7,984,990 52%<br />
Illinois 50,005,000 0 13,695,463 27%<br />
Indiana 30,194,000 9,763,354 23,326,932 77%<br />
Iowa 20,282,000 267,648 7,375,994 36%<br />
Kansas 19,603,000 18,143 11,165,231 57%<br />
Kentucky 23,838,000 728,915 10,744,098 45%<br />
Louisiana 25,037,000 543,563 12,093,956 48%<br />
Maine 15,232,000 672,150 10,434,854 69%<br />
Maryland 28,037,000 379,785 16,665,648 59%<br />
Massachusetts 31,020,000 3,020,181 17,888,354 58%<br />
Michigan 42,162,000 194,246 12,329,274 29%<br />
Minnesota 26,690,000 494,163 16,031,381 60%<br />
Mississippi 20,083,000 391,420 8,010,850 40%<br />
Missouri 28,697,000 3,092,700 13,957,000 49%<br />
Montana 14,047,000 86,157 10,220,280 73%<br />
Nebraska 16,568,000 1,503,965 12,300,789 74%<br />
Nevada 17,935,000 845,534 14,437,350 80%<br />
New Hampshire 15,172,000 61,911 8,488,729 56%<br />
New Jersey 37,671,000 2,318,265 10,142,511 27%<br />
New Mexico 16,956,000 0 4,055,589 24%<br />
New York 70,172,000 60,000,000 63,000,000 90%<br />
North Carolina 36,840,000 250,620 17,575,785 48%<br />
North Dakota 13,200,000 148,962 7,688,381 58%<br />
Northern Mariana Islands 3,963,000 0 1,006,511 25%<br />
Ohio 46,378,000 1,500,277 28,437,748 61%<br />
Oklahoma 21,996,000 183,362 3,189,827 15%<br />
Oregon 22,081,000 675,958 11,729,706 53%<br />
Pennsylvania 49,189,000 866,720 18,318,697 37%<br />
Puerto Rico 23,118,000 0 0 0%<br />
Rhode Island 14,540,000 9,285,838 10,647,548 73%<br />
South Carolina 23,882,000 262,375 15,127,185 63%<br />
South Dakota 13,591,000 0 11,230,930 83%<br />
Tennessee 29,080,000 0 8,261,025 28%<br />
Texas 78,238,000 649,310 50,318,015 64%<br />
Utah 18,374,000 3,388,303 13,904,574 76%<br />
Vermont 13,147,000 559,084 8,922,639 68%<br />
Virginia 33,683,000 11,140,543 31,434,282 93%<br />
Virgin Islands 4,085,000 0 3,523,107 86%<br />
Washington 29,917,000 1,211,789 12,773,364 43%<br />
West Virginia 16,792,000 0 12,565,609 75%<br />
Wisconsin 27,985,000 4,595,725 24,491,538 88%<br />
Wyoming 12,784,000 0 6,425,046 50%<br />
GRAND TOTAL $1,500,000,000 $156,409,171 $759,595,402 51%
State<br />
FY 2004 Homeland Security Program<br />
Awarded<br />
($2.2B)<br />
Drawn<br />
April 2005<br />
($317M)<br />
Percent Drawn<br />
(14%)<br />
Alabama 36,853,000 2,714,470 7%<br />
Alaska 19,465,000 1,558,172 8%<br />
American Samoa 5,776,000 345,872 6%<br />
Arizona 41,243,000 4,516,940 11%<br />
Arkansas 28,815,000 4,907,162 17%<br />
Cali<strong>for</strong>nia 175,457,000 6,853,827 4%<br />
Colorado 36,944,000 9,369,112 25%<br />
Connecticut 32,403,000 0 0%<br />
Delaware 20,206,000 36,042 0%<br />
District <strong>of</strong> Columbia 19,248,000 0 0%<br />
Florida 92,182,000 4,201,648 5%<br />
Georgia 55,288,000 4,462,400 8%<br />
Guam 6,217,000 0 0%<br />
Hawaii 22,186,000 363,684 2%<br />
Idaho 22,621,000 1,648,342 7%<br />
Illinois 73,571,000 20,142,691 27%<br />
Indiana 44,422,000 4,719,597 11%<br />
Iowa 29,841,000 1,863,059 6%<br />
Kansas 28,842,000 765,145 3%<br />
Kentucky 35,073,000 1,086,071 3%<br />
Louisiana 36,836,000 1,334,610 4%<br />
Maine 22,409,000 4,575,818 20%<br />
Maryland 41,251,000 1,158,382 3%<br />
Massachusetts 45,638,500 2,199,964 5%<br />
Michigan 62,032,000 3,944,784 6%<br />
Minnesota 39,267,000 5,347,176 14%<br />
Mississippi 29,547,000 1,829,395 6%<br />
Missouri 42,221,000 10,413,200 25%<br />
Montana 20,668,000 1,075,630 5%<br />
Nebraska 24,376,000 4,234,831 17%<br />
Nevada 26,387,000 3,886,240 15%<br />
New Hampshire 22,321,000 189,655 1%<br />
New Jersey 55,424,000 3,518,168 6%<br />
New Mexico 24,946,000 307,972 1%<br />
New York 103,243,000 88,671,000 86%<br />
North Carolina 54,203,000 88,960 0%<br />
North Dakota 19,421,000 5,753,980 30%<br />
Northern Mariana Islands 5,830,000 0 0%<br />
Ohio 68,235,000 21,261,300 31%<br />
Oklahoma 32,362,000 319,486 1%<br />
Oregon 32,487,000 7,552,711 23%<br />
Pennsylvania 72,370,500 1,055,308 1%<br />
Puerto Rico 34,014,000 0 0%<br />
Rhode Island 21,392,000 1,631,709 8%<br />
South Carolina 35,138,000 1,796,420 5%<br />
South Dakota 19,996,000 4,946,423 25%<br />
Tennessee 42,786,000 1,316,749 3%<br />
Texas 115,110,000 17,806,205 15%<br />
Utah 27,033,000 9,691,504 36%<br />
Vermont 19,342,000 3,912,941 20%<br />
Virginia 49,556,000 14,257,501 29%<br />
Virgin Islands 6,009,000 153,185 3%<br />
Washington 44,015,000 884,477 2%<br />
West Virginia 24,705,000 9,279,040 38%<br />
Wisconsin 41,173,000 13,814,902 34%<br />
Wyoming 18,809,000 0 0%<br />
GRAND TOTAL $2,207,206,000 $317,763,857 14%
Attachment 2<br />
MIGRATION OF DHS GRANT PROGRAMS<br />
Appropriation<br />
Administering Office<br />
Program<br />
Migration Year<br />
FY 2004 FY 2005<br />
DHS/SLGCP Homeland Security Grant Program<br />
$3,195,000,000 $2,610,000,000 2004<br />
- Formula-Based Grants/State Homeland Security Grant Program (ODP) 1,700,000,000 1,100,000,000 2004<br />
- Law En<strong>for</strong>cement Terrorism Prevention Grants (ODP) 500,000,000 400,000,000 2004<br />
- Citizen Corps (EP&R) 40,000,000 15,000,000 2004<br />
- High-Threat, High-Density Urban Areas Grants/Urban Areas Security Initiative (ODP) 725,000,000 885,000,000 2005<br />
- Emergency Management Per<strong>for</strong>mance Grants (EP&R) 180,000,000 180,000,000 2005<br />
- Metropolitan Medical Response System (EP&R) 50,000,000 30,000,000 2005<br />
Demonstration/Continuing/Competitive Training Grants (ODP)<br />
Firefighter Assistance Grants (EP&R)<br />
Rail, Freight, and Transit Security Grants<br />
Port Security Grants (TSA)<br />
Intercity Bus Security Grants (TSA)<br />
Trucking Industry Security Grants (TSA)<br />
$60,000,000 $55,000,000 2005<br />
$750,000,000 $715,000,000 2004<br />
N/A $150,000,000 N/A<br />
$125,000,000 $150,000,000 2005<br />
$10,000,000 $10,000,000 2005<br />
$22,000,000 $5,000,000 2005<br />
DHS/EP&R Urban Search and Rescue<br />
$60,000,000 $30,000,000 N/A<br />
National Disaster Medical System<br />
$34,000,000 $34,000,000 N/A<br />
Sources:<br />
House Report 108-774; House Report 108-280; DHS Fiscal Year 2005 Homeland Security Grant Program - Program Guidelines and Application Kit; and DHS/SLGCP<br />
A-133 Audit Supplement, Attachment VI.