- Page 1 and 2:
Universidade do Minho Escola de Ci
- Page 3 and 4:
É AUTORIZADA A REPRODUÇÃO PARCIA
- Page 6:
Acknowledgments/ Agradecimentos
- Page 9 and 10:
Às 2 mosqueteiras ausentes, Joana
- Page 12 and 13:
Abstract The challenges facing the
- Page 14 and 15:
Resumo
- Page 16 and 17:
Resumo Os desafios que a indústria
- Page 18 and 19:
molecular ficou retida à superfíc
- Page 20 and 21:
Table of contents Acknowledgments /
- Page 22 and 23:
CATs- Catalases CBD- Carbohydrate b
- Page 24 and 25:
Chapter 1 General Introduction: App
- Page 26 and 27:
General Introduction: Application o
- Page 28 and 29:
1. Biotechnology in textile industr
- Page 30 and 31:
3. Role of enzymes in textile indus
- Page 32 and 33:
General Introduction: Application o
- Page 34 and 35:
General Introduction: Application o
- Page 36 and 37:
General Introduction: Application o
- Page 38 and 39:
General Introduction: Application o
- Page 40 and 41:
7. Serine proteases: subtilisins Ge
- Page 42 and 43:
General Introduction: Application o
- Page 44 and 45:
General Introduction: Application o
- Page 46 and 47:
General Introduction: Application o
- Page 48 and 49:
General Introduction: Application o
- Page 50 and 51:
General Introduction: Application o
- Page 52 and 53:
12.1 Decolourization of dyes and te
- Page 54 and 55:
General Introduction: Application o
- Page 56 and 57:
References General Introduction: Ap
- Page 58 and 59:
General Introduction: Application o
- Page 60 and 61:
General Introduction: Application o
- Page 62 and 63:
General Introduction: Application o
- Page 64 and 65: General Introduction: Application o
- Page 66 and 67: General Introduction: Application o
- Page 68 and 69: General Introduction: Application o
- Page 70 and 71: General Introduction: Application o
- Page 72: Chapter 2 Surface Modification of S
- Page 75 and 76: Subchapter 2.1 52
- Page 77 and 78: Subchapter 2.1 major material of co
- Page 79 and 80: Subchapter 2.1 End uses include swe
- Page 81 and 82: Subchapter 2.1 References Battistel
- Page 83 and 84: Subchapter 2.1 60
- Page 85 and 86: Subchapter 2.2 62
- Page 87 and 88: Subchapter 2.2 Abstract Cutinase fr
- Page 89 and 90: Subchapter 2.2 2. Materials and met
- Page 91 and 92: Subchapter 2.2 Scheme 1. Thermodyna
- Page 93 and 94: Subchapter 2.2 14000 rpm at 4 ºC.
- Page 95 and 96: Subchapter 2.2 3. Results and discu
- Page 97 and 98: Mutation Subchapter 2.2 Table III.
- Page 99 and 100: Subchapter 2.2 Table IV. Hydrophobi
- Page 101 and 102: Subchapter 2.2 References Ansaldi M
- Page 103 and 104: Subchapter 2.2 80
- Page 105 and 106: Subchapter 2.3 82
- Page 107 and 108: Subchapter 2.3 Abstract Two polyami
- Page 109 and 110: Subchapter 2.3 aliphatic polyester.
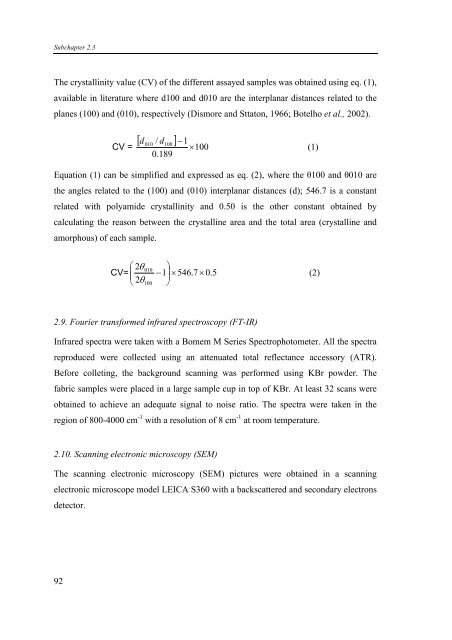
- Page 111 and 112: Subchapter 2.3 2.3. Determination o
- Page 113: Subchapter 2.3 2.7. Enzymatic hydro
- Page 117 and 118: Subchapter 2.3 Table I. Protein ads
- Page 119 and 120: Subchapter 2.3 In the same set of e
- Page 121 and 122: Subchapter 2.3 98 Protein in soluti
- Page 123 and 124: Subchapter 2.3 100 Protein in solut
- Page 125 and 126: Subchapter 2.3 Table II. Time of wa
- Page 127 and 128: Subchapter 2.3 104 Abs 60 50 40 30
- Page 129 and 130: Subchapter 2.3 Acknowledgments The
- Page 131 and 132: Subchapter 2.3 Lau Y, Bruice C. 199
- Page 133 and 134: Subchapter 2.4 110
- Page 135 and 136: Subchapter 2.4 Abstract The effect
- Page 137 and 138: Subchapter 2.4 A balance between en
- Page 139 and 140: Subchapter 2.4 flask with stirring
- Page 141 and 142: Subchapter 2.4 118 TPA (mM) TPA (mM
- Page 143 and 144: Subchapter 2.4 of native cutinase a
- Page 145 and 146: Subchapter 2.4 122 K/S Increase (%)
- Page 147 and 148: Subchapter 2.4 References Araújo R
- Page 149 and 150: Subchapter 2.4 126
- Page 152 and 153: Surface Modification of Cellulose A
- Page 154 and 155: Surface Modification of Cellulose A
- Page 156 and 157: Surface Modification of Cellulose A
- Page 158 and 159: Surface Modification of Cellulose A
- Page 160 and 161: Surface Modification of Cellulose A
- Page 162 and 163: Surface Modification of Cellulose A
- Page 164 and 165:
Surface Modification of Cellulose A
- Page 166 and 167:
Surface Modification of Cellulose A
- Page 168 and 169:
Surface Modification of Cellulose A
- Page 170 and 171:
Surface Modification of Cellulose A
- Page 172 and 173:
Surface Modification of Cellulose A
- Page 174 and 175:
Surface Modification of Cellulose A
- Page 176 and 177:
Surface Modification of Cellulose A
- Page 178 and 179:
Surface Modification of Cellulose A
- Page 180 and 181:
Surface Modification of Cellulose A
- Page 182 and 183:
Chapter 3 Enzymatic Modification of
- Page 184 and 185:
SubChapter 3.1 Introduction
- Page 186 and 187:
1. Properties of Wool Enzymatic Mod
- Page 188 and 189:
Enzymatic Modification of Wool Surf
- Page 190 and 191:
3.3. Bleaching Enzymatic Modificati
- Page 192 and 193:
Enzymatic Modification of Wool Surf
- Page 194 and 195:
Enzymatic Modification of Wool Surf
- Page 196 and 197:
Subchapter 3.2 Strategies Towards t
- Page 198 and 199:
Strategies Towards the Functionaliz
- Page 200 and 201:
1. Introduction Strategies Towards
- Page 202 and 203:
Strategies Towards the Functionaliz
- Page 204 and 205:
Strategies Towards the Functionaliz
- Page 206 and 207:
Strategies Towards the Functionaliz
- Page 208 and 209:
Strategies Towards the Functionaliz
- Page 210 and 211:
Strategies Towards the Functionaliz
- Page 212 and 213:
Strategies Towards the Functionaliz
- Page 214 and 215:
Strategies Towards the Functionaliz
- Page 216 and 217:
Strategies Towards the Functionaliz
- Page 218 and 219:
4. Discussion Strategies Towards th
- Page 220 and 221:
References Strategies Towards the F
- Page 222 and 223:
Strategies Towards the Functionaliz
- Page 224 and 225:
Subchapter 3.3 Enzymatic Hydolysis
- Page 226 and 227:
Enzymatic Hydolysis of Wool with a
- Page 228 and 229:
1. Introduction Enzymatic Hydolysis
- Page 230 and 231:
Enzymatic Hydolysis of Wool with a
- Page 232 and 233:
Enzymatic Hydolysis of Wool with a
- Page 234 and 235:
Enzymatic Hydolysis of Wool with a
- Page 236 and 237:
Enzymatic Hydolysis of Wool with a
- Page 238 and 239:
References Enzymatic Hydolysis of W
- Page 240 and 241:
Chapter 4 General Discussion and Fu
- Page 242 and 243:
General Discussion and Future persp
- Page 244 and 245:
General Discussion and Future Persp
- Page 246 and 247:
References General Discussion and F
- Page 248 and 249:
Appendix
- Page 250 and 251:
SOB TE buffer Autoclave Tryptone 2%
- Page 252:
Dissolve the nucleic acids in 30 μ


