Nuclear Production of Hydrogen, Fourth Information Exchange ...
Nuclear Production of Hydrogen, Fourth Information Exchange ... Nuclear Production of Hydrogen, Fourth Information Exchange ...
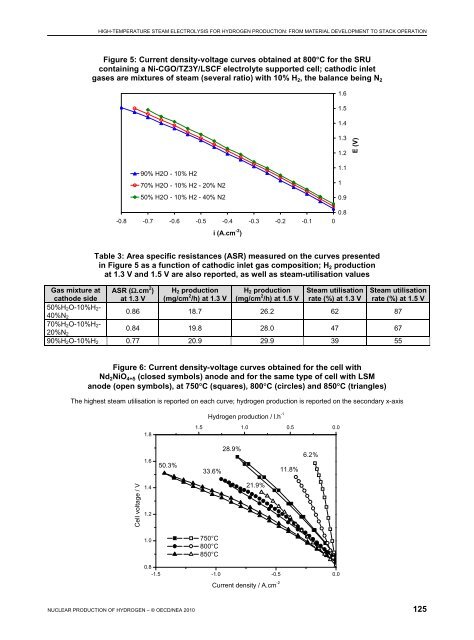
HIGH-TEMPERATURE STEAM ELECTROLYSIS FOR HYDROGEN PRODUCTION: FROM MATERIAL DEVELOPMENT TO STACK OPERATION Figure 4: Durability test at 820°C; evolution of cells’ voltages over 406 hours, with a current of 36 A applied on the stack 1.80 E (V) 1.70 1.60 1.50 cell 1 cell 2 cell 3 1.40 1.30 1.20 0 50 100 150 200 250 300 350 400 Time (h) Table 2: Degradation rate calculated from the curves presented in Figure 4 for the three cells U (t = 0) U (t = 406 h) Degradation ΔV/1 000 h Degradation %/1 000 h Cell 1 1.40 1.67 0.677 49 Cell 2 1.24 1.29 0.123 10 Cell 3 1.33 1.52 0.468 35 high degradation rates in HTSE operation mode (Hartvigsen, 2007; Mawdsley, 2008; O’Brien, 2007). For Cell 1 and Cell 3, the durability curve is not linear over the period. In particular a shift in voltage is observed around 200 hours on the Cell 1 curve. It was associated with a temperature increase on the stack, which could reflect a crack in the cell, consistent with the fact that this cell was found cracked when the stack was opened after the end of the test. SRU performances Performances obtained at 800°C on the SRU with a Ni-CGO/TZ3Y/LSCF electrolyte supported cell are reported in Figure 5 and in Table 3. Depending on the cathodic inlet gas mixture, ASR between 0.77 and 0.86 Ω.cm 2 were obtained. Hydrogen productions between 18.7 and 20.9 mg/cm 2 /h were achieved at 1.3 V, which were increased to 26.2 to 29.9 mg/cm 2 /h when a voltage of 1.5 V was considered. These productions corresponded to a steam utilisation rate between 62 and 39% at 1.3 V and between 87 and 55% at 1.5 V, respectively. It can be noted that the lowest target set by the RelHy project in terms of hydrogen production was 30 mg/cm 2 /h. This target was achieved according to the results reported at 1.5 V and for the cathodic inlet gas with the highest steam concentration. Performances on single cells containing nickelate oxygen electrode Current-voltage curves recorded on a single cell containing the Nd 2 NiO 4+δ oxygen electrode is given in Figure 6 for the three temperatures 750, 800 and 850°C. For comparison i-V curves measured on the same cell but containing classical LSM oxygen electrode are also reported. i-V measurements highlight 124 NUCLEAR PRODUCTION OF HYDROGEN – © OECD/NEA 2010
HIGH-TEMPERATURE STEAM ELECTROLYSIS FOR HYDROGEN PRODUCTION: FROM MATERIAL DEVELOPMENT TO STACK OPERATION Figure 5: Current density-voltage curves obtained at 800°C for the SRU containing a Ni-CGO/TZ3Y/LSCF electrolyte supported cell; cathodic inlet gases are mixtures of steam (several ratio) with 10% H 2 , the balance being N 2 1.6 1.5 1.4 1.3 1.2 E (V) 90% H2O - 10% H2 70% H2O - 10% H2 - 20% N2 50% H2O - 10% H2 - 40% N2 1.1 1 0.9 0.8 -0.8 -0.7 -0.6 -0.5 -0.4 -0.3 -0.2 -0.1 0 i (A.cm -2 ) Table 3: Area specific resistances (ASR) measured on the curves presented in Figure 5 as a function of cathodic inlet gas composition; H 2 production at 1.3 V and 1.5 V are also reported, as well as steam-utilisation values Gas mixture at cathode side ASR (Ω.cm 2 ) at 1.3 V H 2 production (mg/cm 2 /h) at 1.3 V H 2 production (mg/cm 2 /h) at 1.5 V Steam utilisation rate (%) at 1.3 V Steam utilisation rate (%) at 1.5 V 50%H 2O-10%H 2- 40%N 2 0.86 18.7 26.2 62 87 70%H 2O-10%H 2- 20%N 2 0.84 19.8 28.0 47 67 90%H 2O-10%H 2 0.77 20.9 29.9 39 55 Figure 6: Current density-voltage curves obtained for the cell with Nd 2 NiO 4+δ (closed symbols) anode and for the same type of cell with LSM anode (open symbols), at 750°C (squares), 800°C (circles) and 850°C (triangles) The highest steam utilisation is reported on each curve; hydrogen production is reported on the secondary x-axis 1.8 Hydrogen production / l.h -1 1.5 1.0 0.5 0.0 1.6 50.3% 33.6% 28.9% 11.8% 6.2% Cell voltage / V 1.4 1.2 21.9% 1.0 750°C 800°C 850°C 0.8 -1.5 -1.0 -0.5 0.0 Current density / A.cm -2 NUCLEAR PRODUCTION OF HYDROGEN – © OECD/NEA 2010 125
- Page 75 and 76: THE CONCEPT OF NUCLEAR HYDROGEN PRO
- Page 77: THE CONCEPT OF NUCLEAR HYDROGEN PRO
- Page 80 and 81: CANADIAN NUCLEAR HYDROGEN R&D PROGR
- Page 82 and 83: CANADIAN NUCLEAR HYDROGEN R&D PROGR
- Page 84 and 85: CANADIAN NUCLEAR HYDROGEN R&D PROGR
- Page 86 and 87: CANADIAN NUCLEAR HYDROGEN R&D PROGR
- Page 88 and 89: CANADIAN NUCLEAR HYDROGEN R&D PROGR
- Page 90 and 91: APPLICATION OF NUCLEAR-PRODUCED HYD
- Page 92 and 93: APPLICATION OF NUCLEAR-PRODUCED HYD
- Page 94 and 95: APPLICATION OF NUCLEAR-PRODUCED HYD
- Page 96 and 97: APPLICATION OF NUCLEAR-PRODUCED HYD
- Page 98 and 99: APPLICATION OF NUCLEAR-PRODUCED HYD
- Page 100 and 101: APPLICATION OF NUCLEAR-PRODUCED HYD
- Page 103 and 104: STATUS OF THE INL HIGH-TEMPERATURE
- Page 105 and 106: STATUS OF THE INL HIGH-TEMPERATURE
- Page 107 and 108: STATUS OF THE INL HIGH-TEMPERATURE
- Page 109 and 110: STATUS OF THE INL HIGH-TEMPERATURE
- Page 111 and 112: STATUS OF THE INL HIGH-TEMPERATURE
- Page 113 and 114: STATUS OF THE INL HIGH-TEMPERATURE
- Page 115 and 116: STATUS OF THE INL HIGH-TEMPERATURE
- Page 117 and 118: STATUS OF THE INL HIGH-TEMPERATURE
- Page 119: STATUS OF THE INL HIGH-TEMPERATURE
- Page 122 and 123: HIGH-TEMPERATURE STEAM ELECTROLYSIS
- Page 124 and 125: HIGH-TEMPERATURE STEAM ELECTROLYSIS
- Page 128 and 129: HIGH-TEMPERATURE STEAM ELECTROLYSIS
- Page 131: MATERIALS DEVELOPMENT FOR SOEC Mate
- Page 134 and 135: A METALLIC SEAL FOR HIGH-TEMPERATUR
- Page 136 and 137: A METALLIC SEAL FOR HIGH-TEMPERATUR
- Page 138 and 139: A METALLIC SEAL FOR HIGH-TEMPERATUR
- Page 140 and 141: A METALLIC SEAL FOR HIGH-TEMPERATUR
- Page 142 and 143: DEGRADATION MECHANISMS IN SOLID OXI
- Page 144 and 145: DEGRADATION MECHANISMS IN SOLID OXI
- Page 146 and 147: DEGRADATION MECHANISMS IN SOLID OXI
- Page 149 and 150: CAUSES OF DEGRADATION IN A SOLID OX
- Page 151 and 152: 70 μm CAUSES OF DEGRADATION IN A S
- Page 153 and 154: CAUSES OF DEGRADATION IN A SOLID OX
- Page 155 and 156: CAUSES OF DEGRADATION IN A SOLID OX
- Page 157 and 158: NUCLEAR HYDROGEN USING HIGH TEMPERA
- Page 159 and 160: NUCLEAR HYDROGEN USING HIGH TEMPERA
- Page 161 and 162: NUCLEAR HYDROGEN USING HIGH TEMPERA
- Page 163 and 164: NUCLEAR HYDROGEN USING HIGH TEMPERA
- Page 165 and 166: NUCLEAR HYDROGEN USING HIGH TEMPERA
- Page 167: SESSION III: THERMOCHEMICAL SULPHUR
- Page 170 and 171: CEA ASSESSMENT OF THE SULPHUR-IODIN
- Page 172 and 173: CEA ASSESSMENT OF THE SULPHUR-IODIN
- Page 174 and 175: CEA ASSESSMENT OF THE SULPHUR-IODIN
HIGH-TEMPERATURE STEAM ELECTROLYSIS FOR HYDROGEN PRODUCTION: FROM MATERIAL DEVELOPMENT TO STACK OPERATION<br />
Figure 5: Current density-voltage curves obtained at 800°C for the SRU<br />
containing a Ni-CGO/TZ3Y/LSCF electrolyte supported cell; cathodic inlet<br />
gases are mixtures <strong>of</strong> steam (several ratio) with 10% H 2 , the balance being N 2<br />
1.6<br />
1.5<br />
1.4<br />
1.3<br />
1.2<br />
E (V)<br />
90% H2O - 10% H2<br />
70% H2O - 10% H2 - 20% N2<br />
50% H2O - 10% H2 - 40% N2<br />
1.1<br />
1<br />
0.9<br />
0.8<br />
-0.8 -0.7 -0.6 -0.5 -0.4 -0.3 -0.2 -0.1 0<br />
i (A.cm -2 )<br />
Table 3: Area specific resistances (ASR) measured on the curves presented<br />
in Figure 5 as a function <strong>of</strong> cathodic inlet gas composition; H 2 production<br />
at 1.3 V and 1.5 V are also reported, as well as steam-utilisation values<br />
Gas mixture at<br />
cathode side<br />
ASR (Ω.cm 2 )<br />
at 1.3 V<br />
H 2 production<br />
(mg/cm 2 /h) at 1.3 V<br />
H 2 production<br />
(mg/cm 2 /h) at 1.5 V<br />
Steam utilisation<br />
rate (%) at 1.3 V<br />
Steam utilisation<br />
rate (%) at 1.5 V<br />
50%H 2O-10%H 2-<br />
40%N 2<br />
0.86 18.7 26.2 62 87<br />
70%H 2O-10%H 2-<br />
20%N 2<br />
0.84 19.8 28.0 47 67<br />
90%H 2O-10%H 2 0.77 20.9 29.9 39 55<br />
Figure 6: Current density-voltage curves obtained for the cell with<br />
Nd 2 NiO 4+δ (closed symbols) anode and for the same type <strong>of</strong> cell with LSM<br />
anode (open symbols), at 750°C (squares), 800°C (circles) and 850°C (triangles)<br />
The highest steam utilisation is reported on each curve; hydrogen production is reported on the secondary x-axis<br />
1.8<br />
<strong>Hydrogen</strong> production / l.h -1<br />
1.5 1.0 0.5 0.0<br />
1.6<br />
50.3%<br />
33.6%<br />
28.9%<br />
11.8%<br />
6.2%<br />
Cell voltage / V<br />
1.4<br />
1.2<br />
21.9%<br />
1.0<br />
750°C<br />
800°C<br />
850°C<br />
0.8<br />
-1.5 -1.0 -0.5 0.0<br />
Current density / A.cm -2<br />
NUCLEAR PRODUCTION OF HYDROGEN – © OECD/NEA 2010 125


