Oakland Schools District Service Report 2012
Oakland Schools District Service Report 2012
Oakland Schools District Service Report 2012

Create successful ePaper yourself
Turn your PDF publications into a flip-book with our unique Google optimized e-Paper software.
2011-<strong>2012</strong><br />
DISTRICT<br />
SERVICE<br />
REPORT<br />
OCTOBER <strong>2012</strong><br />
• assistance<br />
• consultations<br />
• professional<br />
development<br />
• resources<br />
• programs
2011-<strong>2012</strong> <strong>District</strong> <strong>Service</strong> <strong>Report</strong> • October <strong>2012</strong> 2<br />
focusing on RESULTS<br />
October <strong>2012</strong><br />
Dear Reader:<br />
This year, <strong>Oakland</strong> <strong>Schools</strong> marks 50 years of leadership, innovation and results for students, schools and the<br />
community. The <strong>Oakland</strong> <strong>Schools</strong> Board of Education and I invite you to review the 2011-<strong>2012</strong> <strong>District</strong> <strong>Service</strong><br />
<strong>Report</strong> to get a sense of what we do each year. We continue to use a variety of methods to capture data that<br />
accurately reflects the services we provided to <strong>Oakland</strong> County schools over the past year. Wherever possible, we<br />
also include trend data.<br />
The <strong>District</strong> <strong>Service</strong> <strong>Report</strong> for 2011-<strong>2012</strong> reflects our ongoing commitment to increase student achievement, serve<br />
the diverse needs of <strong>Oakland</strong> County schools, and decrease costs while increasing efficiencies. <strong>Oakland</strong> <strong>Schools</strong><br />
uses the information presented in this report to inform our work; to look at which services are used, by whom, and<br />
how frequently, so that we can continue to adapt our service delivery and staffing to best meet priority, emerging<br />
and continuing district needs. In fact, during our first organization-wide quality assurance review with AdvancED,<br />
<strong>Oakland</strong> <strong>Schools</strong> was commended for using data to prioritize services and programs.<br />
It is our hope that the <strong>District</strong> <strong>Service</strong> <strong>Report</strong> is also used by <strong>Oakland</strong> County school districts to review how they<br />
are using our services, resources and products that are designed to contribute to improved student achievement and<br />
provide time or cost savings to their districts. We must continue to find ways to work together in ever more efficient<br />
and cost-effective ways. We believe that this publication illustrates how districts are making greater use of the<br />
Intermediate School <strong>District</strong> while optimizing their efficiency.<br />
As always, I encourage and welcome your feedback on this document. How are we doing and how can we improve<br />
this publication? Please email Communication <strong>Service</strong>s at communications@oakland.k12.mi.us with your<br />
comments and suggestions. Thank you.<br />
Sincerely,<br />
Dr. Vickie L. Markavitch<br />
Superintendent<br />
Scan the QR code to the right for resources on current education-related topics.
table of CONTENTS<br />
Focusing on results<br />
How this data was collected...............................................................................................4<br />
What is an intermediate school district?...........................................................................4<br />
AdvancED...........................................................................................................................4<br />
Our six strategic goals.........................................................................................................4<br />
Our mission, beliefs and credo...................................................................................... 4-5<br />
Our customers and service areas ......................................................................................5<br />
<strong>Service</strong> highlights ...............................................................................................................5<br />
Here’s who we are<br />
Our Board of Education.....................................................................................................6<br />
<strong>Oakland</strong> <strong>Schools</strong> Administration..................................................................................... 6<br />
<strong>Oakland</strong> <strong>Schools</strong> Leadership Team .................................................................................6<br />
Here’s what we do for districts<br />
<strong>Oakland</strong> <strong>Schools</strong> takes accountability seriously...............................................................7<br />
<strong>Oakland</strong> <strong>Schools</strong> finances..................................................................................................7<br />
Direct support to local districts..........................................................................................8<br />
<strong>District</strong>s save money with cooperative purchasing..........................................................9<br />
Professional Development<br />
Professional Development opportunities.......................................................................20<br />
Assistance, consultations and resources provided<br />
Instructional <strong>Service</strong>s.......................................................................................................22<br />
Support <strong>Service</strong>s................................................................................................................24<br />
Technology <strong>Service</strong>s.........................................................................................................25<br />
Human Resources.............................................................................................................29<br />
Production Printing and Graphics..................................................................................30<br />
Fingerprinting...................................................................................................................31<br />
Medicaid............................................................................................................................32<br />
REMC................................................................................................................................33<br />
Did you know?..................................................................................................................34<br />
Our customers say.............................................................................................................35<br />
What we do for students<br />
Improving student achievement......................................................................................10<br />
Graduation rates changed................................................................................................12<br />
Career Focused Education...............................................................................................13<br />
Campus enrollment trends, academy enrollment, worksite placements<br />
and academic credits................................................................................................... 14-16<br />
Special Education.............................................................................................................17<br />
Homeless and Wraparound <strong>Service</strong>s..............................................................................18<br />
Truancy.............................................................................................................................19<br />
2011-<strong>2012</strong> <strong>District</strong> <strong>Service</strong> <strong>Report</strong> • October <strong>2012</strong> 3
2011-<strong>2012</strong> <strong>District</strong> <strong>Service</strong> <strong>Report</strong> • October <strong>2012</strong> 4<br />
focusing on RESULTS<br />
How this data was collected<br />
In an effort to focus on results and accountability, <strong>Oakland</strong> <strong>Schools</strong> has taken<br />
steps to track the services provided to local districts through both quantitative and<br />
qualitative measures.<br />
For 2011-<strong>2012</strong>, <strong>Oakland</strong> <strong>Schools</strong> used a variety of tools to collect data in the areas of:<br />
• Professional development<br />
• Assistance and consultation<br />
• Direct services to students<br />
• Student achievement<br />
These tools included scannable checklists, Excel spreadsheets and project<br />
management software. EBMS software is also used by our Event Management team<br />
to schedule professional development workshops, register participants and track<br />
State Board Continuing Education Units (SB-CEUs).<br />
As we continue to report our services to district customers, we seek to continuously<br />
improve our service tracking methods and find meaningful ways to convey our<br />
value to our constituents. Please share your feedback with us. Call Communication<br />
<strong>Service</strong>s at 248.209.2145 or email communications@oakland.k12.mi.us with your<br />
comments.<br />
What is an intermediate school district?<br />
This year, <strong>Oakland</strong> <strong>Schools</strong> marks 50 years of leadership, innovation and results for<br />
students, schools and the community. Created by the Legislature in 1962, <strong>Oakland</strong><br />
<strong>Schools</strong> is one of Michigan’s 57 educational service agencies that saves money and<br />
resources for K-12 districts by providing consolidated support and services; trains<br />
teachers in the latest research-based methods; pilots innovative programs; and<br />
coordinates early childhood, special education and vocational services across their<br />
region. <strong>Oakland</strong> <strong>Schools</strong> is an autonomous, tax-supported public school district<br />
governed by Michigan General School Laws.<br />
The mission of Michigan’s educational service agencies (ISDs, RESAs and RESDs)<br />
is to provide visionary leadership and quality services to strengthen teaching and<br />
learning for all citizens.<br />
AdvancED<br />
In June, <strong>2012</strong> <strong>Oakland</strong> <strong>Schools</strong> was granted accreditation from the AdvancED<br />
Accreditation Commission, the national commission that confers the North<br />
Central Association Commission on Accreditation and School Improvement (NCA<br />
CASI) accreditation seal. The AdvancED ESA Accreditation process provides a<br />
national protocol for education service agencies committed to systemic, systematic,<br />
and sustainable continuous improvement. The process supports, enhances, and<br />
stimulates growth and improvement throughout the agency. The accreditation<br />
process involves three ongoing components: 1) meeting high quality standards; 2)<br />
implementing a continuous process of improvement; and 3) engaging in quality<br />
assurance through internal and external review. The agency’s accreditation is for a<br />
five-year term with regular monitoring of progress and reporting occurring during<br />
the term.<br />
Our six strategic goals<br />
These broad, organizational strategic directions guide the work of <strong>Oakland</strong> <strong>Schools</strong><br />
and provide the framework for departmental planning and initiatives.<br />
1. Maximize learning<br />
2. Increase collaborative opportunities<br />
3. Build the capacity for continuous improvement<br />
4. Close gaps and reduce inequities<br />
5. Advocate for public education<br />
6. Foster communication and engagement<br />
Our mission, beliefs and credo<br />
Our mission<br />
<strong>Oakland</strong> <strong>Schools</strong>: Learning today. Transforming tomorrow.<br />
Our beliefs<br />
We believe:<br />
• It’s about service.<br />
• Students form the lens through which our best educational decisions are made.<br />
• All students can and will learn.<br />
• Collaboration builds understanding.<br />
• Education is a shared responsibility.<br />
• Our success depends upon our employees.<br />
• Change is opportunity.<br />
• Lifelong learning is a key to lifelong success.<br />
• Effective relationships are powerful.<br />
• Differences expand our thinking.<br />
• Visionary leadership creates a dynamic environment.<br />
• We must develop leaders for tomorrow.<br />
• Ethical behavior is everyone’s responsibility.
Our credo<br />
<strong>Service</strong>, expertise, and excellence form the foundation of <strong>Oakland</strong> <strong>Schools</strong>. We<br />
prepare students to be meaningful contributors in a diverse society. Continuous<br />
learning drives our efforts to support local districts and the community while<br />
fostering a global perspective. Organizational strength and effectiveness come from<br />
inclusion, advocacy, innovation, and leadership. We share responsibility for leading<br />
the <strong>Oakland</strong> County educational community.<br />
We believe our first responsibility is to the educators of <strong>Oakland</strong> County, their<br />
students and families. We believe that all students can learn, and will, given the<br />
right resources and time. Our services, products, tools, and knowledge are focused<br />
to support high levels of student achievement, maximize resources and meet<br />
compliance obligations. Through visionary leadership and inclusive relationships,<br />
we develop regional capacity for the continuous improvement of student learning.<br />
We believe every employee can be highly productive. We support ongoing learning<br />
by providing necessary tools and resources. We hold one another to a high standard<br />
of professionalism, respect, integrity, and fairness. Together, we embrace a culture<br />
that promotes ideas and innovation<br />
as it encourages creativity and fun.<br />
We deliver high quality service as we<br />
advocate for every child.<br />
We collaborate with the <strong>Oakland</strong><br />
County community and develop<br />
strong partnerships with all levels<br />
of government, business, social<br />
agencies, and education to enhance<br />
the quality of life in this region. These<br />
collaborations strengthen teaching and<br />
learning and increase opportunities<br />
for <strong>Oakland</strong> County students as they<br />
graduate to a global economy.<br />
For all those with whom we work and<br />
whom we serve, we pledge to partner<br />
in practices that honor collaboration,<br />
responsible stewardship of public<br />
resources, transparent business practices and ethical behavior.<br />
Our customers and service areas<br />
The <strong>Oakland</strong> <strong>Schools</strong> service area encompasses:<br />
• Population of more than 1.2 million people<br />
• 910 square miles; close to 90,000 acres of parks<br />
• 28 public school districts<br />
• 17 public school academies<br />
• 81 reporting nonpublic school buildings<br />
• 186 elementary schools<br />
• 62 middle and junior high schools<br />
• 60 senior high and alternative high schools<br />
• Four <strong>Oakland</strong> <strong>Schools</strong> Technical Campuses (OSTC) in Clarkston, Pontiac,<br />
Royal Oak, and Wixom<br />
• Approximately 217,000 students – 194,277 from public schools (Audited FTE,<br />
October 5, 2011) and 22,876 from nonpublic schools (March 1, <strong>2012</strong> Headcount)<br />
• Close to 24,000 students receive Special Education programs and services<br />
• Approximately 23,000 <strong>Oakland</strong> County public school employees (CEPI, REP<br />
Summary 2011)<br />
<strong>Service</strong> highlights<br />
<strong>Oakland</strong> <strong>Schools</strong> is committed to improving student<br />
achievement through the research-based development and<br />
effective delivery and support of innovative, high quality<br />
instructional products and services in partnership with the<br />
schools we serve.<br />
Serving the diverse needs of <strong>Oakland</strong> County schools and<br />
217,000 students is our primary focus. We support teaching<br />
and learning in the areas of general, special and career focused<br />
education, and provide assistance in business operations and<br />
technology. We also support mandated compliance with state<br />
and federal regulations with a variety of services.<br />
Everything a district needs - from workshops on the latest<br />
teaching methods, on-site consulting and help with school<br />
improvement and curriculum; to management software, food<br />
service support and testing of students with special needs (and<br />
more) - is provided by <strong>Oakland</strong> <strong>Schools</strong>.<br />
<strong>Oakland</strong> <strong>Schools</strong>’ commitment to regionalizing services and supporting<br />
collaboration across <strong>Oakland</strong> County enables local schools and districts to operate<br />
more efficiently and economically, saving administrative costs/dollars that can be<br />
used directly in the classroom.<br />
2011-<strong>2012</strong> <strong>District</strong> <strong>Service</strong> <strong>Report</strong> • October <strong>2012</strong> 5
2011-<strong>2012</strong> <strong>District</strong> <strong>Service</strong> <strong>Report</strong> • October <strong>2012</strong> 6<br />
here’s WHO we are<br />
Our Board of Education<br />
<strong>Oakland</strong> <strong>Schools</strong> is overseen by the <strong>Oakland</strong> <strong>Schools</strong> Board of Education. Our<br />
Board is elected to six-year staggered terms every other year by the boards of<br />
<strong>Oakland</strong> County’s 28 school districts. Candidates are often local board members but<br />
need only be registered electors.<br />
The Board meets at 7 PM on the second and fourth Monday of the month at<br />
<strong>Oakland</strong> <strong>Schools</strong>. Special meetings are scheduled as needed. These public meetings<br />
are posted both on the <strong>Oakland</strong> <strong>Schools</strong> website and at the <strong>Oakland</strong> <strong>Schools</strong><br />
Educational <strong>Service</strong> & Professional Development Center, as are property transfer<br />
hearings. Meeting schedules, agendas, minutes, and handouts are posted on the<br />
<strong>Oakland</strong> <strong>Schools</strong> website at www.oakland.k12.mi.us under Board of Education<br />
Information, located on the upper left portion of the home page.<br />
The <strong>Oakland</strong> <strong>Schools</strong> Board of Education<br />
George Ehlert, President<br />
Connie R. Williams, Vice President<br />
Barbara DeMarco, Treasurer<br />
Dr. Theresa Rich, Secretary<br />
Marc Katz, Trustee<br />
<strong>Oakland</strong> <strong>Schools</strong> Administration<br />
Superintendent: Vickie L. Markavitch, Ph.D.............................................248.209.2123<br />
Deputy Superintendent for Instructional <strong>Service</strong>s:<br />
Terri Spencer, Ed.D.................................................................................248.209.2141<br />
Deputy Superintendent of Finance & Operations: Robert Moore, Jr.......248.209.2092<br />
<strong>Oakland</strong> <strong>Schools</strong> Leadership Team<br />
Capital & Building Projects and Facility Operations: Judy Miller............ 248.209.2172<br />
Career Focused Education and OSTC: Mary Kaye Aukee....................... 248.209.2154<br />
Communication <strong>Service</strong>s: Danelle Gittus, APR......................................... 248.209.2181<br />
Early Childhood: Joan Lessen-Firestone, Ph.D......................................... 248.209.2035<br />
Financial <strong>Service</strong>s: William Mull................................................................. 248.209.2122<br />
Government Relations and Pupil <strong>Service</strong>s: Lisa Hansknecht................... 248.209.2137<br />
Human Resources: Mark Hansen................................................................ 248.209.2059<br />
Learning <strong>Service</strong>s: Michael Yocum, Ph.D.................................................. 248.209.2037<br />
Legal Affairs: Sherry L. McMillan, J.D....................................................... 248.209.2062<br />
Regional <strong>Service</strong>s: Katrina Brunette, Interim............................................. 248.209.2209<br />
School Quality and REAP: Larry Thomas.................................................. 248.209.2297<br />
Special Education: Kathy Barker................................................................. 248.209.2533<br />
Technology <strong>Service</strong>s: Tammy Evans........................................................... 248.209.2187<br />
Pictured from left to right:<br />
Barbara DeMarco, Connie Williams, Marc Katz,<br />
Dr. Theresa Rich, and George Ehlert
what we do for DISTRICTS<br />
<strong>Oakland</strong> <strong>Schools</strong> takes<br />
accountability seriously<br />
As an intermediate school district, much of what we do is mandated by<br />
federal or state laws with built-in reporting requirements. In addition to<br />
these requirements, <strong>Oakland</strong> <strong>Schools</strong> also communicates regularly with<br />
referent groups and associations to ensure that stakeholders are made aware<br />
of the services, resources, and assistance provided for the funding we receive.<br />
These include:<br />
• An annual budget meeting with school board designates and<br />
superintendents who review the <strong>Oakland</strong> <strong>Schools</strong> budget and pass<br />
resolutions at the local district level regarding support for the General<br />
Fund budget as presented.<br />
• Referent groups such as the <strong>Oakland</strong> County Superintendents<br />
Association, <strong>Oakland</strong> County School Boards Association, <strong>Oakland</strong><br />
County School Business Officials, <strong>Oakland</strong> County Teaching & Learning<br />
Council, and many others.<br />
• A countywide Special Education Parent Advisory Council (PAC) who meets<br />
regularly to provide input on Special Education issues and review the ISD Special<br />
Education plan.<br />
• A countywide Education Advisory Group made up of community and business<br />
leaders for Career Focused Education.<br />
• A regular update to the <strong>Oakland</strong> <strong>Schools</strong> Continuous Improvement Plan (CIP)<br />
that includes organizational goals, activities to accomplish those goals, and<br />
progress measures.<br />
• Independent financial audits of the <strong>Oakland</strong> <strong>Schools</strong> revenues and expenditures<br />
that are reported to the <strong>Oakland</strong> <strong>Schools</strong> Board of Education and shared with the<br />
local districts we serve.<br />
• Ongoing reporting to the Michigan Department of Education to ensure<br />
compliance.<br />
• Annual publication and website posting of our ISD Annual <strong>Report</strong> and the<br />
Budget and Salary/Compensation Transparency <strong>Report</strong>ing.<br />
$<strong>Oakland</strong> <strong>Schools</strong> returned 96.6 cents of every<br />
dollar to local districts through direct services<br />
in 2011-<strong>2012</strong>.<br />
Recipient of<br />
Certificate of Excellence in Financial <strong>Report</strong>ing for<br />
Comprehensive Annual Financial <strong>Report</strong><br />
from the Association of School Business Officials<br />
Fiscal Years 1996-2001, 2003-2011<br />
<strong>Oakland</strong> <strong>Schools</strong> finances<br />
<strong>Oakland</strong> <strong>Schools</strong> is financed by <strong>Oakland</strong> County taxpayers through an annual<br />
authorized property tax millage. The combined millage rate for 2011-<strong>2012</strong> was<br />
3.3690 mills. <strong>Oakland</strong> <strong>Schools</strong> operates using three major funds:<br />
• General Education Fund funds instructional and administrative support for<br />
districts and obtains its revenue largely from a property tax levy. <strong>Oakland</strong> <strong>Schools</strong><br />
was authorized to collect 0.2003 of a mill on the county tax base for 2011-<strong>2012</strong>.<br />
• Special Education Fund was supported by a tax of 2.5456 mills levied on<br />
the county tax base for 2011-<strong>2012</strong>. This fund supports Special Education<br />
administration, student services, educational consulting services at <strong>Oakland</strong><br />
<strong>Schools</strong> and center programs in local districts.<br />
• Career Focused Education Fund was supported primarily by a levy of 0.6231<br />
on the <strong>Oakland</strong> County tax base in 2011-<strong>2012</strong>. This fund supports Vocational<br />
Technical Education administration, the four <strong>Oakland</strong> <strong>Schools</strong> Technical<br />
Campuses that serve students from all 28 local school districts, and the CFE<br />
Regional Plan.<br />
• In addition to the three major funds, grants are actively sought to defray costs of<br />
regional projects. <strong>Oakland</strong> <strong>Schools</strong> serves as the fiscal agent for many such grants<br />
that fund ongoing and pilot projects for the benefit of <strong>Oakland</strong> County students.<br />
2011-<strong>2012</strong> <strong>District</strong> <strong>Service</strong> <strong>Report</strong> • October <strong>2012</strong> 7
2011-<strong>2012</strong> <strong>District</strong> <strong>Service</strong> <strong>Report</strong> • October <strong>2012</strong> 8<br />
what we do for DISTRICTS<br />
Direct support to local districts<br />
<strong>Oakland</strong> <strong>Schools</strong> is committed to putting the vast majority of our dollars directly<br />
where the funds can most benefit students - in our schools and classrooms. The<br />
dollars that flow through the intermediate school district are carefully monitored<br />
to ensure that they are spent as mandated, audited regularly, and go back to local<br />
districts to support the teaching and learning mission. We are pleased to be able to<br />
say that in 2011-<strong>2012</strong>, 96.6% of our recurring funding went to support programs and<br />
services in our county’s school districts.<br />
In the graphic below, Indirect <strong>Service</strong>s are defined as the administrative-specific<br />
appropriation units in the General Education Fund, Special Education Fund,<br />
Career Focused Education Fund, plus inter-fund transfers, debt service, and capital<br />
outlay in specific Capital Projects funds.<br />
<strong>Oakland</strong> <strong>Schools</strong> Fiscal Year 2011 Total Expenditure Summary<br />
96.6% Direct <strong>Service</strong>s provided to LEAs, PSAs<br />
$250 million<br />
3.4% Indirect <strong>Service</strong>s<br />
$8.8 million
<strong>District</strong>s save money with<br />
Cooperative Purchasing<br />
The <strong>Oakland</strong> <strong>Schools</strong> Office of Procurement & Contracting:<br />
• Reviews and compiles an online cooperative bid listing for local, regional, state<br />
and national bids for districts. Check it out at www.cooperativecontracts.com<br />
• Provides an online bidders list for <strong>Oakland</strong> County districts<br />
• Assists districts with conducting Invitations for Bids (IFBs) and Requests for<br />
Proposals (RFPs) as needed<br />
• Coordinates and facilitates countywide bid efforts for the <strong>Oakland</strong> County School<br />
Purchasing Officials (OCSPO)<br />
• Conducts various county-wide bids to support local districts such as drug and<br />
alcohol testing, student transportation, and temporary staffing services.<br />
• Educates the vendor community on how to do business with school districts in<br />
<strong>Oakland</strong> County at vendor outreach events.<br />
Please visit www.oakland.k12.mi.us/ProcurementandContracting for more<br />
information on how we can help you maximize your resources with these cost<br />
efficiencies.<br />
$Cost savings and revenue enhancements vary depending on<br />
State mandates, grants, and local district demands. In 2011-<br />
<strong>2012</strong> these savings and enhancements brought <strong>Oakland</strong><br />
County districts approximately $95,944,128*<br />
* Up from $78,075,104 last year<br />
In 2011-<strong>2012</strong>, districts participated in the following consortia and cooperative<br />
agreements:<br />
• $2,813,005 was spent through the OCSPO cooperative bids for office supplies,<br />
furniture, paper, magazine subscriptions, school bus parts, tires and custodial<br />
supplies in 2011.<br />
• Rebates totaling $51,064 were allocated to <strong>Oakland</strong> County districts participating<br />
in the recommended Staples Business Advantage contract through OCSPO<br />
National Joint Powers Alliance (NJPA).<br />
• $7,125,752 was spent statewide through the Association of Educational<br />
Purchasing Agencies (AEPA) bids and $3,332,240 was spent through National<br />
Joint Powers Alliance (NJPA) cooperative bids. This generated revenues of<br />
$93,141 and $31,940 respectively, which helped to cover administrative costs for<br />
the program.<br />
• A beverage consortium including four <strong>Oakland</strong> County school districts generated<br />
revenue and exclusivity payments of over $97,906.<br />
• Members of the MOR Purchasing Cooperative for food, supplies and USDA<br />
foods (in <strong>Oakland</strong>, Macomb and Wayne Counties) spent $14,187,025 in<br />
discounted products and services, saving them time and effort. In addition, the<br />
MOR Cooperative distributed an additional $121,480 to member districts in<br />
USDA entitlement discounts as a result of using a common bank of commodity<br />
entitlement dollars for the MOR Cooperative.<br />
2011-<strong>2012</strong> <strong>District</strong> <strong>Service</strong> <strong>Report</strong> • October <strong>2012</strong> 9
2011-<strong>2012</strong> <strong>District</strong> <strong>Service</strong> <strong>Report</strong> • October <strong>2012</strong> 10<br />
what we do for STUDENTS<br />
Improving student achievement<br />
It is <strong>Oakland</strong> <strong>Schools</strong>’ role to work behind the scenes, helping those who teach<br />
<strong>Oakland</strong> County’s students. Although we do not have direct responsibility for<br />
guiding student achievement, we believe there is indeed a correlation between the<br />
instructional support we provide and the instructional gains made by students of the<br />
teachers we train, coach and support. We are proud to be counted among the reasons<br />
behind the outstanding achievement of <strong>Oakland</strong> County students as we compare<br />
them to the state averages of standardized tests.<br />
<strong>Oakland</strong> County students consistently achieve above the state average in all areas assessed by<br />
the MEAP. The two line graphs on this page summarize <strong>Oakland</strong> County student achievement<br />
in math and reading for grades 3-8 in relation to the statewide results. In 2011-12 the MDE<br />
raised the cut scores on all MEAP tests (back to 2007-08) to reflect “College-ready” standards.<br />
Therefore, these results appear lower than the MEAP results reported in previous years.<br />
Percent "College Ready" Proficient<br />
100<br />
90<br />
80<br />
70<br />
60<br />
50<br />
40<br />
30<br />
20<br />
10<br />
MEAP Math Grades 3-8 2007-08 - 2011-12<br />
<strong>Oakland</strong> Michigan <strong>Oakland</strong> - MI<br />
60<br />
57<br />
53 51 51<br />
53 55 56 56 57 57 57 57<br />
55 56<br />
53<br />
52 52 55 56<br />
53 52 53<br />
49<br />
46 45 44 44<br />
41<br />
41<br />
40<br />
36<br />
33 35 36 37 40 42 40 40<br />
38 40 39 40 39 38<br />
34<br />
35 36 37 37 39 36 37 32<br />
29<br />
30<br />
27 29 29<br />
15 17 16 16 15 15 15 18 19 19<br />
16 16<br />
17 18 17 17 16<br />
18 16<br />
18<br />
13 16 18 16 16<br />
14 14 15 16 15<br />
0<br />
07-08<br />
08-09<br />
09-10<br />
10-11<br />
11-12<br />
07-08<br />
08-09<br />
09-10<br />
10-11<br />
11-12<br />
07-08<br />
08-09<br />
09-10<br />
10-11<br />
11-12<br />
07-08<br />
08-09<br />
09-10<br />
10-11<br />
11-12<br />
07-08<br />
08-09<br />
09-10<br />
10-11<br />
11-12<br />
07-08<br />
08-09<br />
09-10<br />
10-11<br />
11-12<br />
3rd 4th 5th 6th 7th 8th<br />
Math<br />
The two bar graphs at the top of page 11 show math and reading achievement trend data<br />
for each NCLB group for <strong>Oakland</strong> County students. The MEAP mathematics results combined<br />
for grades 3-8 for each group show relatively little change over the past 4 years. The Fall 2011<br />
MEAP math results were up a single percentage point. Math results for English Language<br />
Learners improved by 5 percentage points. Most of the other groups experienced very little<br />
change. Reading results have shown a trend of steady improvement. Fall 2011 reading results<br />
were up for every one of the 15 groups shown and in most cases were the highest they have<br />
been over this 5 year period.<br />
The two bar graphs at the bottom of page 11 show the trends for each NCLB group for<br />
eleventh grade students on the MME (Michigan Merit Examination. The <strong>2012</strong> mathematics<br />
MME performance improved slightly overall and for most groups of students but dropped<br />
slightly for students with IEPs (Individual Educational Plans (Special Education)), English<br />
Language Learners, and Asian students. <strong>2012</strong> reading MME results rose overall and for all<br />
groups of students except English Language Learners.<br />
The following acronyms appear in the charts on page 11:<br />
ED = Economically Disadvantaged<br />
ELL = English Language Learners<br />
LEP = Limited English Proficient<br />
Percent "College Ready" Proficient<br />
MEAP Reading Grades 3-8 2007-08 - 2011-12<br />
<strong>Oakland</strong> Michigan <strong>Oakland</strong> - MI<br />
100<br />
90<br />
77<br />
74 73 73 76 75 76 79 80<br />
77<br />
75<br />
68 69 71 71 70 70 71 72<br />
67 68 68 69<br />
70<br />
66 66<br />
63<br />
67 68<br />
69<br />
67<br />
60 65 65 65<br />
65 63 62 63 64<br />
63<br />
58 59<br />
60 60 59<br />
56 57 60<br />
57 56<br />
50<br />
56<br />
52<br />
40<br />
30<br />
20<br />
70<br />
68 66<br />
63 61<br />
61<br />
56 56<br />
53 52<br />
10 10 10 8 9<br />
10 10 9 10 8<br />
10 12 10 11 10 11 10<br />
10<br />
9 8 10 11 11 10 11 9 10 9<br />
11 10 9<br />
0<br />
07-08<br />
08-09<br />
09-10<br />
10-11<br />
11-12<br />
07-08<br />
08-09<br />
09-10<br />
10-11<br />
11-12<br />
07-08<br />
08-09<br />
09-10<br />
10-11<br />
11-12<br />
07-08<br />
08-09<br />
09-10<br />
10-11<br />
11-12<br />
07-08<br />
08-09<br />
09-10<br />
10-11<br />
11-12<br />
07-08<br />
08-09<br />
09-10<br />
10-11<br />
11-12<br />
3rd 4th 5th 6th 7th 8th<br />
Reading
MEAP Math 3-8 Combined 2007-08 - 2011-12 by NCLB Group<br />
MEAP Reading 3-8 Combined 2007-08 - 2011-12 by NCLB Group<br />
07-08 08-09 09-10 10-11 11-12<br />
07-08 08-09 09-10 10-11 11-12<br />
100<br />
100<br />
90<br />
90<br />
80<br />
80<br />
Percent Proficient<br />
70<br />
60<br />
50<br />
40<br />
30<br />
20<br />
10<br />
Percent Proficient<br />
70<br />
60<br />
50<br />
40<br />
30<br />
20<br />
0<br />
All w/o IEPwith IEP Not ED ED Not ELL ELL Female Male Am.India Asian Black Hispanic WhiteMultiracia<br />
(77881) (70696) (7185) (54627)(23254)<br />
(73567) (4314) (38169)(39712)<br />
n (247) (5969) (13024) (3175) (53938) l (1528)<br />
07-08 47.899 51.103 19.663 55.629 20.525 48.778 30.867 46.309 49.421 30.154 77.263 19.041 26.945 52.482 43.868<br />
08-09 53.797 57.42 22.337 62.607 25.54 54.865 34.348 52.625 54.92 33.333 80.274 25.257 31.206 58.742 54.16<br />
09-10 54.413 57.728 25.39 64.482 28.644 55.805 38.892 53.634 55.161 36.496 82.925 24.796 31.581 59.434 56.303<br />
10-11 52 55.75 19.833 62.616 25.83 53.149 29.299 51.806 52.185 36.434 82.226 22.094 33.007 57.039 54.331<br />
11-12 52.603 55.741 21.726 63.461 27.096 53.675 34.33 52.383 52.815 42.105 82.409 21.576 34.331 57.852 55.039<br />
10<br />
0<br />
All w/o IEPwith IEP Not ED ED Not ELL ELL Female Male Am.India Asian Black Hispanic WhiteMultiracia<br />
(77285) (70475) (6810) (54251)(23034)<br />
(73271) (4014) (37990)(39295)<br />
n (248) (5826) (12988) (3127) (53574) l (1522)<br />
07-08 67.106 71.083 31.511 74.069 42.365 68.725 32.896 70.48 63.863 55.28 78.19 41.084 47.439 72.693 69.524<br />
08-09 67.916 72.12 31.019 75.548 43.286 69.59 34.254 70.561 65.375 54.462 79.738 43.134 46.894 73.411 69.817<br />
09-10 72.401 76.213 38.346 80.119 52.509 74.399 49.118 76.028 68.905 63.869 83.206 49.71 51.15 77.505 74.919<br />
10-11 70.552 75.143 31.064 79.033 49.573 72.291 34.131 74.794 66.475 57.529 83.595 47.735 54.124 75.591 72.872<br />
11-12 73.644 77.129 37.577 81.698 54.676 75.32 43.049 77.82 69.607 61.694 85.256 51.494 59.386 78.568 76.15<br />
Group (Number of Students)<br />
Group (Number of Students)<br />
MME Math 11th Grade 2007-08 - 2011-12 by NCLB Group<br />
MME Reading 11th Grade 2007-08 - 2011-12 by NCLB Group<br />
07-08 08-09 09-10 10-11 11-12<br />
07-08 08-09 09-10 10-11 11-12<br />
100<br />
100<br />
90<br />
90<br />
80<br />
80<br />
Percent Proficient<br />
70<br />
60<br />
50<br />
40<br />
30<br />
20<br />
10<br />
0<br />
All<br />
(14145)<br />
w/o IEPwith IEP<br />
(12924) (1221)<br />
Not ED E.D.<br />
(10204) (3941)<br />
Not ELL E.L.L.<br />
(13701) (444)<br />
Female Male<br />
(7066) (7079)<br />
Am.<br />
Asian Black Hispanic<br />
Indian<br />
(875) (2720) (406)<br />
(42)<br />
White<br />
(9865)<br />
07-08 30.353 32.443 5.1048 34.402 8.1032 30.809 12.216 27.284 33.426 23.256 66.253 3.3607 17.77 35.123 26<br />
08-09 34.831 37.272 5.4348 40.502 10.175 35.349 15.467 32.065 37.557 18.644 68.892 6.7926 18.567 40.252 29.412<br />
09-10 34.013 36.585 5.168 41.066 10.555 34.528 10.968 31.125 36.88 22.222 67.779 6.0564 16.897 40.006 23.232<br />
10-11 37.1 40.046 7.1261 46.047 11.703 37.811 15.299 35.479 38.705 20.455 75.666 6.8868 18.814 43.218 34.266<br />
11-12 39.371 42.533 5.8968 49.255 13.778 40.165 14.865 37.277 41.461 21.429 74.4 8.6765 24.877 45.352 41.35<br />
Multiracial<br />
(237)<br />
Percent Proficient<br />
70<br />
60<br />
50<br />
40<br />
30<br />
20<br />
10<br />
0<br />
All<br />
(14222)<br />
w/o IEPwith IEP<br />
(12981) (1241)<br />
Not ED E.D.<br />
(10236) (3986)<br />
Not ELL E.L.L.<br />
(13774) (448)<br />
Female Male<br />
(7099) (7123)<br />
Am.<br />
Asian Black Hispanic<br />
Indian<br />
(875) (2761) (408)<br />
(42)<br />
White<br />
(9899)<br />
07-08 58.942 62.127 20.562 63.812 32.362 60.027 16.246 62.658 55.222 56.818 75.616 27.585 40.138 66.327 60<br />
08-09 56.591 59.245 24.911 62.57 30.857 57.746 13.684 60.304 52.942 48.333 70.566 27.623 43.974 63.736 50.725<br />
09-10 60.324 63.95 20.102 68.01 34.943 61.378 12.903 63.195 57.472 51.351 78.617 30.131 44.33 68.144 47.525<br />
10-11 58.576 62.071 23.178 67.382 33.864 59.927 17.035 61.055 56.118 33.333 79.782 27.145 45.385 66.287 63.194<br />
11-12 62.038 65.657 24.174 70.828 39.463 63.62 13.393 66.291 57.799 45.238 78.514 32.38 48.775 69.33 67.932<br />
Multiracial<br />
(237)<br />
Group (Number of Students)<br />
Group (Number of Students)<br />
2011-<strong>2012</strong> <strong>District</strong> <strong>Service</strong> <strong>Report</strong> • October <strong>2012</strong> 11
2011-<strong>2012</strong> <strong>District</strong> <strong>Service</strong> <strong>Report</strong> • October <strong>2012</strong> 12<br />
what we do for STUDENTS<br />
Graduation rates changed<br />
The four-year cohort graduation rate for <strong>Oakland</strong> County students has been about<br />
79% for the past three years and has been just four percentage points higher than<br />
the same statistic for the State of Michigan. The <strong>Oakland</strong> County five-year and<br />
six-year graduation rates have declined slightly while those statewide rates have been<br />
stable. The five and six year rates are slightly higher than the four year rates for both<br />
<strong>Oakland</strong> and Michigan students.<br />
The four-year cohort graduation rate for students with Individual Educational Plans<br />
(IEPs) has declined from 69% for the Class of 2007 to 60% for the Class of 2011. A<br />
very similar pattern may be seen in the data for the State of Michigan. The five-year<br />
graduation rates are substantially higher than the four-year rates, but the rate for<br />
<strong>Oakland</strong> County students has declined while the Michigan rate has remained stable.<br />
Percent Graduating<br />
100<br />
90<br />
80<br />
70<br />
60<br />
50<br />
40<br />
30<br />
20<br />
10<br />
81.8 81<br />
75.4 75.5 75.23 75.95<br />
6.4 5.5<br />
84.28083628 83.551962<br />
84.77366255 83.79885122<br />
82.10948696 81.9 82.40370328<br />
79.03 80.2 78.56805014<br />
74.33<br />
4, 5 & 6 Year Graduation Rates Classes of 2007- 2011<br />
<strong>Oakland</strong> Michigan <strong>Oakland</strong> Minus MI<br />
3.8 4.25 4.238050136 5.380836279 4.491962004<br />
2.949486959 2.7<br />
78.9 79.06 79.16 79.2 79.58 80.06 79.86<br />
0<br />
2009<br />
2008<br />
6 Year Graduation Rate 2007<br />
Class of ....<br />
2010<br />
2009<br />
2008<br />
5 Year Graduation Rate 2007<br />
2011<br />
2010<br />
4, 5 & 6 Year Graduation Rates for Students with Individual Educational Plans (I.E.P.s)<br />
2009<br />
2008<br />
4 Year Graduation Rate 2007<br />
<strong>Oakland</strong> Michigan <strong>Oakland</strong> minus Michigan<br />
5.193662551<br />
3.738851222 2.54370328<br />
100<br />
90<br />
Percent Graduating<br />
80<br />
70<br />
60<br />
50<br />
40<br />
69<br />
61<br />
67<br />
64 64<br />
58 57 57<br />
60<br />
52<br />
74 73 72<br />
66<br />
65<br />
66<br />
70<br />
65<br />
75 76<br />
73<br />
67 68 68<br />
30<br />
20<br />
10<br />
8 9<br />
7 6<br />
8 7 8<br />
6 6<br />
8 7<br />
5<br />
0<br />
2007 2008 2009 2010 2011 2007 2008 2009 2010 2007 2008 2009<br />
4 Year Class of ... 5 Year 6 Year
Career Focused Education (CFE)<br />
<strong>Oakland</strong> <strong>Schools</strong> operates four AdvancED (NCA) accredited regional technical<br />
campuses, where students spend half their school day pursuing education and<br />
training in Michigan’s six Career Pathways. In addition to the rigorous and relevant<br />
programs offered at the <strong>Oakland</strong> <strong>Schools</strong> Technical Campuses, the Career Focused<br />
Education department offers many other effective programs and services for<br />
<strong>Oakland</strong> County students. 2011-<strong>2012</strong> highlights include:<br />
• Eighth grade students in all <strong>Oakland</strong> County school districts initiated Education<br />
Development Plans (EDPs) using Career Cruising software made available by<br />
<strong>Oakland</strong> <strong>Schools</strong>.<br />
• Local districts and the <strong>Oakland</strong> <strong>Schools</strong> Technical Campuses conducted selfreviews<br />
of 60 state-funded Career Technical Education (CTE) programs.<br />
• <strong>Oakland</strong> County CFE directed and articulated more than 300 CTE agreements<br />
with Baker College, Davenport, Ferris University, Macomb Community College,<br />
Mott Community College, <strong>Oakland</strong> Community College, and Schoolcraft<br />
College.<br />
• 24 county high schools and two <strong>Oakland</strong> <strong>Schools</strong> Technical Campuses<br />
competed in the 12th season of OCCRA (<strong>Oakland</strong> County Competitive Robotics<br />
Association). More than 90% of students and coaches surveyed rated their overall<br />
OCCRA experience as good or excellent and would recommend it to other<br />
students.<br />
• The 14th annual Global Trade Mission served more than 130 students from<br />
<strong>Oakland</strong> County.<br />
• 39 students were acknowledged for outstanding technical achievement at the<br />
CTE Student Recognition ceremony.<br />
• 209 students from <strong>Oakland</strong> County districts attended The Beaumont Saturday<br />
Series for Emerging Technologies in Health Care hosted by Beaumont Hospitals.<br />
<strong>District</strong>s save money with CFE<br />
• <strong>Oakland</strong> <strong>Schools</strong> distributed $1,260,000 from the countywide vocational millage<br />
to the 28 local school districts to support personnel and other costs of delivering<br />
career development activities and $1,600,000 for CTE programs.<br />
• Career Cruising software (including pilot program of Course Planner for 18<br />
districts and Spanish Translation for 11 districts) was purchased regionally,<br />
providing a value of $82,590.<br />
• Purchased ACT’s EXPLORE and PLAN career and college readiness<br />
assessments for all 28 districts, progressively preparing students for the Michigan<br />
Merit Exam, providing a value of $232,866.<br />
For the full OSTC Annual <strong>Report</strong>, please visit http://www.ostconline.com<br />
• Provided KeyTrain interactive training system for all 28 districts, including career<br />
and college readiness curriculum, based on the ACT WorkKeys assessment<br />
system, creating a value of $52,500.<br />
• CDX Automotive software was distributed to seven districts (eight high schools),<br />
providing a value of $29,903.<br />
• Microsoft Office Specialist certification examinations were provided for four<br />
districts (seven high schools), saving the schools $22,225.<br />
• Purchased DELMIA (Digital Manufacturing) and CATIA (Product Lifecycle<br />
Management) software to support the architectural and mechanical drafting<br />
programs in 11 districts (15 high schools), providing a value of $29,172.<br />
• CTE Assessment Tests were provided to 20 districts (32 high schools) for<br />
Accounting, Health Sciences and Business, Management, & Administration<br />
programs, saving the districts $33,240.<br />
• Transportation reimbursement back to the districts (82% of actual cost) provided<br />
a cost savings of $2,000,000 for transporting students to the <strong>Oakland</strong> <strong>Schools</strong><br />
Technical Campuses.<br />
• Students attend a technical campus for a half day at no charge to their local<br />
districts. The count day enrollment of <strong>Oakland</strong> County school district students<br />
at our campuses was 2,692 for the first semester of the 2011-<strong>2012</strong> school year and<br />
2,465 for the second semester. The combined .5 foundation allowance retained<br />
by the local districts (the average foundation allowance of $8,220 x .5 x count<br />
day enrollment) totaled $11,064,120 for the first semester and $10,131,150 for the<br />
second semester of the 2011-<strong>2012</strong> school year, saving the districts $21,195,270.<br />
$A variety of Career Focused Education efforts saved districts<br />
$26,537,766.<br />
2011-<strong>2012</strong> <strong>District</strong> <strong>Service</strong> <strong>Report</strong> • October <strong>2012</strong> 13
2011-<strong>2012</strong> <strong>District</strong> <strong>Service</strong> <strong>Report</strong> • October <strong>2012</strong> 14<br />
what we do for STUDENTS<br />
Biotechnology<br />
and<br />
Environmental<br />
Science<br />
Business,<br />
Management,<br />
Marketing, and<br />
Technology<br />
Construction<br />
Technology<br />
Culinary<br />
Arts/<br />
Hospitality<br />
Engineering/<br />
Emerging<br />
Technologies<br />
Health<br />
Sciences<br />
Human<br />
<strong>Service</strong>s<br />
Transportation<br />
Technology<br />
Visual<br />
Imaging<br />
Technology<br />
Semester<br />
Totals<br />
Sem 1 Sem 2 Sem 1 Sem 2 Sem 1 Sem 2 Sem 1 Sem 2 Sem 1 Sem 2 Sem 1 Sem 2 Sem 1 Sem 2 Sem 1 Sem 2 Sem 1 Sem 2 Sem 1 Sem 2<br />
Avondale 0 0 8 8 1 1 5 5 5 5 6 5 4 3 9 5 0 0 38 32<br />
Berkley 5 2 18 17 4 3 18 9 4 2 24 17 11 10 17 13 6 4 107 77<br />
Birmingham 5 4 5 4 4 6 5 5 4 4 8 7 5 8 12 11 6 5 54 54<br />
Bloomfield Hills 3 2 2 1 2 2 5 5 2 2 1 0 6 4 3 4 0 1 24 21<br />
Brandon 9 8 20 18 15 14 18 18 10 12 10 9 4 2 12 9 9 9 107 99<br />
Clarenceville 2 2 5 5 0 0 7 7 1 1 7 7 0 0 4 4 3 3 29 29<br />
Clarkston 34 37 23 25 25 24 23 25 15 14 50 51 7 7 50 49 22 23 249 255<br />
Clawson 5 5 4 4 5 6 3 4 5 5 16 16 0 0 9 9 7 6 54 55<br />
Farmington 10 7 26 23 2 1 21 19 13 12 17 14 5 5 18 10 11 10 123 101<br />
Ferndale 3 3 8 7 11 11 10 9 3 2 12 12 11 10 8 8 3 3 69 65<br />
Hazel Park 3 3 5 6 0 0 9 6 2 3 18 15 4 4 1 1 1 1 43 39<br />
Holly 3 2 7 5 6 5 17 18 6 5 7 3 0 0 15 15 7 5 68 58<br />
Huron Valley 13 13 23 20 0 0 17 17 10 9 23 19 9 6 23 30 11 12 129 126<br />
Lake Orion 8 7 9 8 11 12 30 28 15 14 26 20 19 21 36 32 6 6 160 148<br />
Lamphere 1 1 2 2 1 1 3 3 4 4 10 10 0 0 6 6 3 3 30 30<br />
Madison 2 2 6 6 1 1 1 1 2 1 13 12 1 2 5 3 2 2 33 30<br />
Novi 2 3 9 7 0 0 6 6 1 2 9 9 0 0 7 7 2 2 36 36<br />
Oak Park 2 1 11 8 2 2 5 3 3 4 13 10 10 15 4 3 4 6 54 52<br />
Oxford 1 1 3 4 0 0 5 5 2 3 2 3 6 7 1 1 0 0 20 24<br />
Pontiac 2 2 8 3 18 9 18 12 7 8 18 14 12 11 10 6 0 1 93 66<br />
Rochester 3 3 24 19 13 13 27 26 20 20 17 16 16 16 20 19 5 4 145 136<br />
Royal Oak 10 9 2 2 5 5 12 14 7 7 13 13 7 7 10 8 4 4 70 69<br />
South Lyon 17 14 17 19 0 0 12 14 20 18 22 19 0 0 30 27 7 7 125 118<br />
Southfield 17 16 10 9 13 8 11 12 9 8 45 37 2 2 13 11 9 9 129 112<br />
Troy 2 1 3 3 7 7 1 2 2 2 10 9 6 5 6 6 5 5 42 40<br />
Walled Lake 32 27 30 26 0 0 29 28 35 34 45 43 7 9 38 39 16 15 232 221<br />
Waterford 15 11 13 13 29 22 33 28 19 17 37 33 14 13 35 24 8 7 203 168<br />
West Bloomfield 6 7 2 3 0 0 11 9 8 9 11 9 3 3 11 9 7 7 59 56<br />
Public School Academies 2 1 9 9 1 0 15 16 8 7 13 12 16 15 6 6 3 3 73 69<br />
Tuition Paid Students 3 3 4 3 1 3 0 0 2 3 0 0 48 30 3 5 0 0 61 47<br />
Northville (Tuition Paid) 2 1 5 5 0 0 6 6 1 1 6 7 0 0 10 9 3 3 33 0<br />
Cluster Semester TOTAL 222 198 321 292 177 156 383 360 245 238 509 451 233 215 432 389 170 166 2,692 2,465
<strong>Oakland</strong> <strong>Schools</strong> Technical Campus Enrollment (above)<br />
The table above breaks down each semester’s student enrollment in Career Focused Education programs at the four regional <strong>Oakland</strong> <strong>Schools</strong> Technical Campuses (OSTCs) by sending<br />
school district and cluster of study.<br />
Transporta;on <br />
Technology <br />
16% <br />
Human <strong>Service</strong>s: Culinary <br />
Arts/ Hospitality <br />
14% <br />
OSTC Career Cluster Enrollment <br />
Human <strong>Service</strong>s: <br />
Cosmetology <br />
9% <br />
Visual <br />
Imaging <br />
Technology <br />
7% <br />
Biotechnology <br />
and <br />
Environmental <br />
Science <br />
8% Business, <br />
Management, <br />
Marke;ng, <br />
and Technology <br />
12% <br />
Health <br />
Sciences <br />
19% <br />
Construc;on Technology <br />
6% <br />
Engineering/ <br />
Emerging Technologies <br />
9% <br />
OSTC Career Cluster Enrollment<br />
2011-<strong>2012</strong><br />
The pie chart above illustrates the composition of our<br />
student body by cluster. The nine national career clusters<br />
are incorporated into Michigan’s Career Pathways system.<br />
<strong>Oakland</strong> <strong>Schools</strong> technical programs are provided at no cost<br />
to individual districts or students because they are fully funded<br />
by an <strong>Oakland</strong> County vocational education millage.<br />
Worksite placements<br />
Worksite placements provide OSTC students with valuable<br />
work experience; advanced employer-provided training;<br />
and effective exploratory opportunities which help them<br />
to determine a focus for their future technical training.<br />
These activities are delivered through the cooperation and<br />
participation of the regional business community. Exploratory<br />
activities are usually unpaid and short-term (no more than 45<br />
hours total). Students are generally paid for more advanced<br />
worksite training regimens such as ongoing internships and<br />
field studies.<br />
Student Worksite Placements<br />
Student Worksite 3 Year Placements Trends- 3 Year Trends<br />
350<br />
300<br />
250<br />
200<br />
150<br />
100<br />
50<br />
0<br />
15<br />
77<br />
63<br />
325<br />
278<br />
233<br />
102<br />
73<br />
45<br />
109<br />
90<br />
74<br />
Northeast Northwest Southeast Southwest<br />
2009-10 2010-11 2011-12<br />
Both paid and unpaid worksite experiences are governed by<br />
conditions and requirements delineated in student-specific<br />
training agreements. The chart above shows the number of<br />
OSTC students who participated in at least one paid and/or<br />
unpaid worksite placement with a training agreement, over<br />
the past three years.<br />
Semester Enrollment Trends by Campus<br />
2011-<strong>2012</strong><br />
These charts document the three-year semester count day<br />
enrollment trends at the <strong>Oakland</strong> <strong>Schools</strong> Technical Campuses.<br />
1,000<br />
800<br />
600<br />
400<br />
200<br />
0<br />
1,000<br />
800<br />
600<br />
400<br />
200<br />
0<br />
First Semester Count Day<br />
893<br />
767<br />
651<br />
695<br />
682<br />
634<br />
694<br />
641<br />
660<br />
788<br />
761<br />
747<br />
Northeast Northwest Southeast Southwest<br />
2009-2010 2010-2011 2011-<strong>2012</strong><br />
Second Semester Count Day<br />
830<br />
682<br />
578<br />
688<br />
649<br />
593<br />
658<br />
598<br />
590<br />
752<br />
721<br />
704<br />
Northeast Northwest Southeast Southwest<br />
2009-2010 2010-2011 2011-<strong>2012</strong><br />
2011-<strong>2012</strong> <strong>District</strong> <strong>Service</strong> <strong>Report</strong> • October <strong>2012</strong> 15
2011-<strong>2012</strong> <strong>District</strong> <strong>Service</strong> <strong>Report</strong> • October <strong>2012</strong> 16<br />
what we do for STUDENTS<br />
800 <br />
700 <br />
600 <br />
500 <br />
400 <br />
300 <br />
200 <br />
100 <br />
0 <br />
129 <br />
36 <br />
87 <br />
357 <br />
175 <br />
271 <br />
320 <br />
280 <br />
OSTC Certificates OSTC Cer2ficates and Cer2fica2ons <br />
and Certifications - 3 Year Trends<br />
3 Year Trends <br />
94 <br />
426 <br />
361 <br />
114 <br />
500 <br />
454 <br />
333 <br />
318 <br />
305 <br />
409 <br />
Student Certificates, Licenses and Certifications: The chart above sums up the numerous certificates and certifications earned by students<br />
at the four <strong>Oakland</strong> <strong>Schools</strong> Technical Campuses during the past three school years. The awards certify that students have exceeded expectations<br />
of competency in essential core, technical or workplace skills. Standards and testing for these achievements are established by business and<br />
industry.<br />
Academic credits (at right):<br />
The <strong>Oakland</strong> <strong>Schools</strong> Technical Campuses integrate academic content in their career and technical education (CTE) courses using a collaborative<br />
instructional delivery model. <strong>Oakland</strong> <strong>Schools</strong> recommends academic credit for students who meet specific subject area content expectations in the<br />
areas of English Language Arts, Math and Science.<br />
346 <br />
09‐10 10‐11 11‐12 09‐10 10‐11 11‐12 09‐10 10‐11 11‐12 09‐10 10‐11 11‐12 <br />
Northeast Northwest Southeast Southwest <br />
Core Cer9ficates Technical Cer9ficates Na9onal Skills Cer9fica9ons <br />
285 <br />
161 <br />
484 <br />
606 <br />
198 <br />
359 <br />
489 <br />
120 <br />
427 <br />
347 <br />
458 <br />
613 <br />
369 <br />
754 <br />
396 <br />
323 <br />
530 <br />
Academic Credits<br />
2011-<strong>2012</strong><br />
Avondale 14<br />
Berkley 33<br />
Birmingham 32<br />
Bloomfield Hills 8<br />
Brandon 39<br />
Clarenceville 18<br />
Clarkston 243<br />
Clawson 27<br />
Farmington 100<br />
Ferndale 39<br />
Hazel Park 34<br />
Holly 40<br />
Huron Valley 67<br />
Lake Orion 17<br />
Lamphere 10<br />
Madison 24<br />
Novi 18<br />
Oak Park 26<br />
Oxford 3<br />
Pontiac 44<br />
Rochester 83<br />
Royal Oak 22<br />
South Lyon 64<br />
Southfield 51<br />
Troy 32<br />
Walled Lake 162<br />
Waterford 120<br />
West Bloomfield 14<br />
Northville 19<br />
Public School<br />
Academies 10<br />
TOTAL 1.408
Special Education<br />
<strong>Oakland</strong> <strong>Schools</strong> Special Education Department provides services to the districts<br />
and Public School Academies of <strong>Oakland</strong> County on behalf of the more than 24,000<br />
students with disabilities that have an Individualized Educational Program (IEP).<br />
<strong>Service</strong>s range from direct student level instruction to systems level support. The<br />
efforts of the department are designed to be efficient and effective, while minimizing<br />
the use of the county and federal special education dollars.<br />
Coordinated <strong>Oakland</strong> <strong>Schools</strong>’ Special Education services that create cost benefit<br />
for districts include support for programming and service provision for students<br />
with low incidence disabilities. This is inclusive of teacher consultant services and<br />
eligibility determination assistance; short term problem-solving; procurement and<br />
training in the use of assistive technology devices; augmentation and alternative<br />
communication technology selection; the maintenance/repair of equipment;<br />
audiological assessments for eligibility determination; and the provision of alternate<br />
text materials/technology.<br />
Compliance technical assistance is provided through web-based materials, personal<br />
contacts, and trainings. Personnel with extensive knowledge in early childhood and<br />
post-school transitioning lead countywide initiatives and ongoing support to local<br />
personnel.<br />
<strong>District</strong> monitoring for alignment with local, state and federal rules and regulations<br />
is conducted in coordination with the Michigan Department of Education.<br />
Professional learning opportunities are available year round and occur in multiple<br />
formats. In addition to training and coaching by <strong>Oakland</strong> <strong>Schools</strong>’ staff, national<br />
expertise is utilized to lead local district personnel in implementing research-based<br />
practices.<br />
Direct Teacher Consultant <strong>Service</strong>s to students with IEPs within <strong>Oakland</strong> County<br />
realized a savings to districts of $2,800,900. The provision of educational products,<br />
books, assistive technology, and equipment repair provided a cost benefit to districts<br />
of $2,430,476.<br />
Special Education provided educational products and books,<br />
assistive technology, equipment repair, and classroom tool<br />
$kits, saving districts $5,231,376.<br />
By maintaining 11.62% of tax levied Special Education<br />
funds, districts were provided $115,150,182 to offset<br />
Special Education costs.<br />
2011-<strong>2012</strong> <strong>District</strong> <strong>Service</strong> <strong>Report</strong> • October <strong>2012</strong> 17
2011-<strong>2012</strong> <strong>District</strong> <strong>Service</strong> <strong>Report</strong> • October <strong>2012</strong> 18<br />
what we do for STUDENTS<br />
Homeless Student<br />
Education Program<br />
Last year, Michigan saw a 38% increase in homeless<br />
students. <strong>Oakland</strong> County has been hit hard with<br />
homeless student increases. Most homeless students<br />
miss significant amounts of school, due to frequent<br />
moves in unstable living conditions and a lack of<br />
transportation.<br />
The <strong>Oakland</strong> <strong>Schools</strong> program ensures that homeless<br />
students receive seamless educational services,<br />
including enrollment, educational placement, links to<br />
community services and advocacy, and representation<br />
between schools and districts.<br />
<strong>Oakland</strong> <strong>Schools</strong> assists districts with transportation<br />
and supply costs for the thousands of homeless<br />
students in <strong>Oakland</strong> County every year. Under the<br />
Federal McKinney-Vento law, districts are mandated<br />
to identify and serve homeless students. With the<br />
guidance and support of the ISD barriers to education<br />
are removed.<br />
<strong>Oakland</strong> County<br />
Wraparound <strong>Service</strong>s<br />
Wraparound is a unique strengths-based, family-led,<br />
process that helps high-risk students avoid costly and<br />
disruptive out-of-school or out-of-home placement.<br />
The Wraparound process is a team-based activity that<br />
helps groups of people involved in a student’s life work<br />
together toward a common goal. An individualized<br />
plan to assure students can experience success in their<br />
communities, homes, and schools is created, using<br />
intensive supports coordination.<br />
Keeping children placed in their homes and attending<br />
school through the use of the Wraparound model is a<br />
tremendously cost-effective and highly efficient use of<br />
community resources and offers real hope for children.<br />
Homeless Student Education Program<br />
Students Served<br />
Wraparound Students Served<br />
2009-2010 2010-2011 2011-<strong>2012</strong> 2009-2010 2010-2011 2011-<strong>2012</strong><br />
Avondale 4 17 28 12 23 16<br />
Berkley 18 19 11 2 3 10<br />
Birmingham 33 27 39 0 0 0<br />
Bloomfield 14 6 17 0 2 1<br />
Brandon 20 74 68 8 9 5<br />
Clarenceville 25 35 33 0 13 0<br />
Clarkston 9 23 24 6 0 20<br />
Clawson 27 24 36 0 0 1<br />
Farmington 36 68 80 1 5 10<br />
Ferndale 46 104 45 10 4 4<br />
Hazel Park 38 16 32 13 21 39<br />
Holly 40 49 36 10 11 18<br />
Huron Valley 88 67 86 0 15 13<br />
Lake Orion 64 78 91 2 5 8<br />
Lamphere 11 19 10 0 0 0<br />
Madison 28 22 29 9 7 8<br />
Novi 25 15 9 3 6 6<br />
Oak Park 86 20 35 2 2 4<br />
Oxford 23 59 16 2 3 2<br />
Pontiac 117 85 169 75 85 99<br />
Rochester 25 25 41 6 7 8<br />
Royal Oak 58 49 31 5 5 5<br />
South Lyon 85 79 107 20 7 9<br />
Southfield 210 101 165 12 18 22<br />
Troy 23 31 25 7 8 8<br />
Walled Lake 40 60 106 3 10 10<br />
Waterford 119 110 103 9 15 34<br />
West Bloomfield 7 23 28 13 22 21<br />
TOTAL 1,319 1,305 1,500 230 306 381
Truancy<br />
If they don’t go to school, children can’t receive<br />
a comprehensive education with a multitude of<br />
specialized services to support their growth and<br />
learning. That’s why the <strong>Oakland</strong> <strong>Schools</strong> Truancy<br />
team promotes the 3 A’s – Attendance, Attachment<br />
and Achievement – and emphasizes early intervention,<br />
a special Back to School program for middle school<br />
students, the <strong>Oakland</strong> County Truancy Task Force,<br />
and court intervention when needed. The Back to<br />
School program identifies and addresses the issues that<br />
may stand in the way of good school attendance for<br />
middle school students.<br />
Truancy Cases<br />
Back To School Students<br />
2009-2010 2010-2011 2011-<strong>2012</strong> 2009-2010 2010-2011 2011-<strong>2012</strong><br />
Avondale 43 35 22 45 55 39<br />
Berkley 12 13 25 63 74 86<br />
Birmingham 8 9 10 0 0 5<br />
Bloomfield 9 6 12 0 0 25<br />
Brandon 16 17 29 23 25 27<br />
Clarenceville 10 19 13 51 54 68<br />
Clarkston 23 31 47 0 51 55<br />
Clawson 11 13 9 51 61 69<br />
Farmington 56 95 52 121 196 171<br />
Ferndale 39 32 28 33 37 39<br />
Hazel Park 14 17 50 60 81 93<br />
Holly 16 12 10 19 20 0<br />
Huron Valley 40 33 32 65 72 40<br />
Lake Orion 38 29 44 32 64 39<br />
Lamphere 11 17 17 46 65 46<br />
Madison 50 46 48 26 55 48<br />
Novi 34 16 12 4 0 0<br />
Oak Park 13 31 70 8 16 66<br />
Oxford 40 17 25 26 11 17<br />
Pontiac 216 301 317 19 95 176<br />
Rochester 21 47 71 90 179 116<br />
Royal Oak 30 28 27 81 86 93<br />
South Lyon 28 33 28 44 48 37<br />
Southfield 147 201 243 40 173 205<br />
Troy 6 12 19 23 22 24<br />
Walled Lake 61 56 66 130 133 198<br />
Waterford 12 33 96 66 46 74<br />
West Bloomfield 20 20 19 76 221 178<br />
TOTAL 1,024 1,219 1,441 1,242 1,940 2,024<br />
2011-<strong>2012</strong> <strong>District</strong> <strong>Service</strong> <strong>Report</strong> • October <strong>2012</strong> 19
2011-<strong>2012</strong> <strong>District</strong> <strong>Service</strong> <strong>Report</strong> • October <strong>2012</strong> 20<br />
professional DEVELOPMENT<br />
If <strong>Oakland</strong> <strong>Schools</strong> does not provide direct instruction to <strong>Oakland</strong> County<br />
students, how can we have a positive and continuing impact on improving<br />
student achievement? One of the most important ways we do this is by providing<br />
professional development – classes, workshops, training – to school staff. In<br />
providing teachers and other school employees with the tools and resources to help<br />
them sharpen their skills and deliver quality classroom instruction, we ultimately –<br />
and positively – impact student achievement.<br />
The chart on the next page illustrates district participation in regional professional<br />
development offered by <strong>Oakland</strong> <strong>Schools</strong> from July 1, 2011 - June 30, <strong>2012</strong>.<br />
• Number of Regional Participants for a district indicates the number of district<br />
staff that attended workshops offered by <strong>Oakland</strong> <strong>Schools</strong> for all <strong>Oakland</strong> County<br />
school districts. Please note that individuals from a district may have attended<br />
more than one workshop and may be counted more than once. Most of these<br />
workshops were offered on-site at <strong>Oakland</strong> <strong>Schools</strong> and required registration<br />
through our Event Management department.<br />
• Number of Regional Events (EBMS) indicates number of workshops in which<br />
a district was represented by one or more participants. Note that events are not<br />
totaled since participants from different districts may have attended the same<br />
event (resulting in multiple counting of same event).<br />
• Number of Customized Participants for a district indicates the number of district<br />
staff that attended customized professional development offered at district<br />
request. Please note that individuals from a district may have attended more than<br />
one workshop and may be counted more than once.<br />
• Number of Customized Events indicates number of workshops customized for<br />
each district. These events are totaled since participants from different districts<br />
did not attend the same event.<br />
In addition to the 38,009 participants below who<br />
attended 1,640 events, an additional 24,035<br />
participants attended 759 more events<br />
(these participants attended other countywide and<br />
multi-district professional development events in which<br />
they were not identified by individual district).<br />
Number of SB-CEUs Earned indicates number of State Board Continuing Education<br />
Units that participants received as a result of their full attendance at workshops.<br />
SB-CEUs Earned<br />
Number of Participants<br />
Number of SB-CEUs Earned<br />
2009-2010 2010-2011 2011-<strong>2012</strong> 2009-2010 2010-2011 2011-<strong>2012</strong><br />
Avondale 23 29 45 44 39 79<br />
Berkley 44 52 75 81 93 116<br />
Birmingham 114 114 185 221 225 203<br />
Bloomfield 69 87 121 118 125 194<br />
Brandon 37 47 58 69 73 61<br />
Clarenceville 22 29 22 49 40 20<br />
Clarkston 174 202 265 608 391 437<br />
Clawson 37 39 82 36 53 89<br />
Farmington 225 153 223 457 205 328<br />
Ferndale 50 44 82 76 107 103<br />
Hazel Park 32 40 98 40 79 87<br />
Holly 58 84 114 143 123 168<br />
Huron Valley 71 61 93 137 92 109<br />
Lake Orion 52 54 71 12 87 102<br />
Lamphere 30 53 47 90 91 80<br />
Madison 14 20 25 15 33 60<br />
Novi 73 41 133 186 54 119<br />
Oak Park 49 51 117 103 73 143<br />
Oxford 47 104 96 82 212 165<br />
Pontiac 72 71 78 121 99 96<br />
Rochester 262 311 310 600 587 612<br />
Royal Oak 39 69 121 74 121 133<br />
South Lyon 52 52 40 120 137 127<br />
Southfield 69 59 72 111 84 88<br />
Troy 26 29 60 32 36 78<br />
Walled Lake 100 104 162 215 144 236<br />
Waterford 119 165 177 217 213 264<br />
West Bloomfield 47 57 111 62 77 110<br />
TOTAL 2,007 2,221 3,083 4,117 3,692 4,409
*CEPI, REP FTE Summary 2011<br />
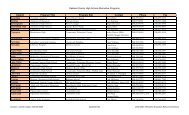
Regional Professional Development<br />
Customized Professional Development<br />
Number of Particpants Number of Events Number of Participants Number of Events<br />
Total<br />
<strong>District</strong><br />
Staff* 2009-2010 2010-2011 2011-<strong>2012</strong> 2009-2010 2010-2011 2011-<strong>2012</strong> 2009-2010 2010-2011 2011-<strong>2012</strong> 2009-2010 2010-2011 2011-<strong>2012</strong><br />
Avondale 477 174 268 351 89 73 111 1,150 646 791 48 44 59<br />
Berkley 532 322 494 421 128 136 136 790 398 1,215 34 30 48<br />
Birmingham 1,231 681 796 1,114 205 185 151 1,166 1,145 1,703 54 69 60<br />
Bloomfield 1,006 429 549 571 158 143 155 869 260 614 34 54 82<br />
Brandon 368 196 332 292 105 96 101 228 574 931 13 21 41<br />
Clarenceville 214 104 222 178 58 66 76 501 237 441 21 13 20<br />
Clarkston 882 433 669 860 151 172 173 1,413 373 266 28 27 38<br />
Clawson 279 187 311 377 104 107 108 748 867 880 44 49 29<br />
Farmington 1,387 648 625 867 193 164 178 787 581 1,100 28 24 63<br />
Ferndale 499 312 292 314 125 88 117 252 426 201 29 31 33<br />
Hazel Park 611 216 261 407 85 96 130 612 957 792 31 54 39<br />
Holly 461 239 245 344 106 83 85 336 194 164 13 22 24<br />
Huron Valley 1,347 422 441 521 162 123 120 531 306 303 28 18 21<br />
Lake Orion 849 454 559 577 161 140 136 940 580 1,013 39 31 56<br />
Lamphere 365 274 293 284 89 92 96 275 339 489 20 25 29<br />
Madison 149 113 103 122 64 47 64 129 366 150 11 25 20<br />
Novi 658 220 277 485 88 87 101 623 176 1,287 41 27 36<br />
Oak Park 412 301 346 473 103 99 123 1,234 709 1,027 50 64 87<br />
Oxford 540 299 269 371 146 90 112 482 638 500 17 29 27<br />
Pontiac 1,007 398 429 592 141 114 159 1,076 914 697 73 74 60<br />
Rochester 1,772 737 886 1,169 198 189 190 1,637 1,567 2,020 75 88 92<br />
Royal Oak 556 276 478 648 116 148 150 432 182 402 28 23 29<br />
South Lyon 803 301 362 319 100 93 101 308 431 506 13 13 35<br />
Southfield 974 348 353 358 131 113 116 463 460 524 26 26 46<br />
Troy 1,448 475 288 589 137 110 136 2,052 447 1,519 62 23 42<br />
Walled Lake 1,570 524 622 731 179 148 133 1,105 261 1,018 19 19 43<br />
Waterford 1,480 576 802 1,081 174 172 213 670 3,708 1,608 32 52 70<br />
West Bloomfield 817 196 429 663 112 136 163 795 363 769 27 24 26<br />
TOTAL 22,694 9,855 12,001 15,079 - - - 21,604 18,105 22,930 938 999 1,255<br />
2011-<strong>2012</strong> <strong>District</strong> <strong>Service</strong> <strong>Report</strong> • October <strong>2012</strong> 21
2011-<strong>2012</strong> <strong>District</strong> <strong>Service</strong> <strong>Report</strong> • October <strong>2012</strong> 22<br />
assistance, consultations & RESOURCES provided<br />
School staff need ongoing support and consultation in order to bring their best to<br />
the classroom (and every facet of school life) every day. Professional development<br />
plus consultation plus assistance equals a complete system of services and resources<br />
that support <strong>Oakland</strong> County educators in the classroom, driving a bus, counseling<br />
students, or providing building or district leadership. That’s why <strong>Oakland</strong> <strong>Schools</strong><br />
offers a wide variety of on-call, online and just-in-time services that supplement the<br />
professional development we deliver.<br />
Instructional <strong>Service</strong>s<br />
Those <strong>Oakland</strong> <strong>Schools</strong> services that are directly focused on improving student<br />
achievement through professional development, consultation, instructional<br />
resources, and providing other classroom support fall under the umbrella of<br />
Instructional <strong>Service</strong>s. <strong>Oakland</strong> County schools know they can count on the services<br />
provided by the Instructional <strong>Service</strong>s departments – Career Focused Education,<br />
Early Childhood, Learning <strong>Service</strong>s, School Quality, Special Education – to deliver<br />
everything they need to support and improve classroom instruction.<br />
Examples of assistance<br />
Through a partnership between the Learning <strong>Service</strong>s and Career Focused<br />
Education Departments, with authoring assistance from multiple <strong>Oakland</strong> County<br />
local school districts, a multi-disciplined, integrated performance-based curriculum<br />
was created to assist districts in simultaneously meeting multiple federal mandates<br />
and state curriculum standards in a single unit of study in order to work smart. The<br />
curriculum meets the sixth through eighth grade Michigan Educational Technology<br />
Standards (METS) mandated by the No Child Left Behind (NCLB) Technological<br />
literacy requirement, and the seventh through eighth grade Educational<br />
Development Plan (EDP) requirement (using Career Cruising).<br />
In order to support parents, the first and most important teachers of children birth to<br />
five, the Early Childhood department distributed 33,637 parent focused materials.
Instructional <strong>Service</strong>s Assistance<br />
Points of<br />
Assistance<br />
2011-<strong>2012</strong><br />
Hours of<br />
Assistance<br />
Avondale 122 137.00<br />
Berkley 174 248.50<br />
Birmingham 231 333.45<br />
Bloomfield 176 132.55<br />
Brandon 139 218.05<br />
Clarenceville 59 65.05<br />
Clarkston 213 246.75<br />
Clawson 70 90.25<br />
Farmington 292 348.50<br />
Ferndale 133 222.00<br />
Hazel Park 187 500.25<br />
Holly 67 82.75<br />
Huron Valley 132 144.05<br />
Lake Orion 230 284.75<br />
Lamphere 88 121.00<br />
Madison 113 393.25<br />
Novi 137 168.00<br />
Oak Park 402 2,301.30<br />
Oxford 90 97.55<br />
Pontiac 622 3,319.75<br />
Rochester 464 678.35<br />
Royal Oak 238 255.00<br />
South Lyon 140 147.75<br />
Southfield 245 203.80<br />
Troy 193 244.25<br />
Walled Lake 279 342.75<br />
Waterford 269 342.75<br />
West Bloomfield 126 160.50<br />
TOTAL 5,631 11,829.90<br />
<strong>District</strong>s save money with Instructional <strong>Service</strong>s<br />
• The Regional Education Media Centers Association of Michigan (REMCAM) negotiated a per building price of<br />
$605 for Discovery Streaming for the 2011-<strong>2012</strong> school year. This is a significant reduction from the list price of<br />
$2,195 per secondary building and $1,670 per elementary building. During the 2011-<strong>2012</strong> school year, <strong>Oakland</strong><br />
<strong>Schools</strong> (REMC 17) once again subsidized the use of Discovery Streaming, saving <strong>Oakland</strong> County public schools<br />
a total of $125,840. Through the statewide pricing and the ISD subsidy, <strong>Oakland</strong> County schools saved $424,800.<br />
• During the 2011-12 school year, <strong>Oakland</strong> County teachers logged into their streaming video accounts 77,772 times<br />
to download or stream over 283,517 videos and video clips. Teachers also accessed over 2,613 copyright friendly<br />
images for use in presentations and documents. More than 550 articles from the included encyclopedia were also<br />
viewed.<br />
• The Common Core Curriculum and the Scope Curriculum for districts ($1,500 per grade level per subject)<br />
provided benefit at value of $576,000.<br />
• REMC countywide purchasing under market costs provided savings to districts of $6,427,533. (See page 33 for<br />
details)<br />
• 27 of our 28 districts implemented the Atlas Curriculum Mapping System.<br />
• <strong>Oakland</strong> <strong>Schools</strong> negotiated a price of $1.50 per student for Atlas Rubicon a savings of $2.50 off the regular pricing.<br />
With the <strong>Oakland</strong> <strong>Schools</strong> subsidy of $.75 per student, we saved districts $3.25 per student for a total savings of<br />
$650,000 across the county.<br />
• Instructional <strong>Service</strong>s reimbursed districts $342,601 for substitute costs so that teachers could attend professional<br />
development.<br />
• <strong>Oakland</strong> <strong>Schools</strong> operated <strong>Oakland</strong> Opportunity Academy (OOA), an alternative education option for high<br />
school students, for six school districts. 140 students attended OOA in 2011-<strong>2012</strong>, saving the districts a combined<br />
$574,840.<br />
• The Widening Advancements for Youth (WAY) program had 144 students saving districts $216,000.<br />
A variety of Instructional <strong>Service</strong>s efforts saved <strong>Oakland</strong> County districts<br />
$$9,248,838.<br />
2011-<strong>2012</strong> <strong>District</strong> <strong>Service</strong> <strong>Report</strong> • October <strong>2012</strong> 23
2011-<strong>2012</strong> <strong>District</strong> <strong>Service</strong> <strong>Report</strong> • October <strong>2012</strong> 24<br />
assistance, consultations & RESOURCES provided<br />
Support <strong>Service</strong>s<br />
At <strong>Oakland</strong> <strong>Schools</strong>, we serve student learning in many ways – some more direct than others. By focusing on<br />
cost savings, efficiencies of scale, and supporting the technological framework for delivery of instruction and its<br />
assessment, <strong>Oakland</strong> <strong>Schools</strong> employees play an important role in maximizing the dollars that go into every <strong>Oakland</strong><br />
County classroom. Support <strong>Service</strong>s departments – Communication <strong>Service</strong>s, Financial <strong>Service</strong>s, Government<br />
Relations and Pupil <strong>Service</strong>s, Human Resources, JobLink <strong>Service</strong> Center, Legal Affairs, Regional <strong>Service</strong>s –<br />
including the Office of Procurement and Contracting, and Technology <strong>Service</strong>s – support and strengthen the<br />
ancillary services that are essential for the smooth operation of every school.<br />
• <strong>Oakland</strong> coordinates the Michigan Green <strong>Schools</strong> program for <strong>Oakland</strong><br />
<strong>Schools</strong> (in 2011-<strong>2012</strong>, 183 <strong>Oakland</strong> County <strong>Schools</strong> earned this<br />
designation).<br />
<strong>Oakland</strong> <strong>Schools</strong> Support <strong>Service</strong>s documented 3,338.85 hours of assistance<br />
to <strong>Oakland</strong> County school districts. Technology <strong>Service</strong>s provided an<br />
additional 20,942.10 hours of assistance, bringing the total to 24,280.95 hours<br />
of service to our local districts.<br />
<strong>District</strong>s save money with Support <strong>Service</strong>s<br />
• Transportation <strong>Service</strong>s worked with 18 school districts to collaborate on<br />
routes reducing mileage by 119,640 miles for the school year and saving<br />
$784,758.00. This team also provided state-mandated safety education for<br />
933 bus drivers, mechanics and supervisors and specialized professional<br />
development opportunities for 177 mechanics, special education drivers<br />
and aides, school bus driver trainers and business office managers.<br />
• Pupil Accounting, Legal and Truancy services saved local districts<br />
$5,741,904.<br />
• <strong>Oakland</strong> <strong>Schools</strong> Shipping and Receiving drove more than 50,000 miles<br />
last year, providing timely pick up and delivery services to all districts in<br />
<strong>Oakland</strong> County.<br />
• Additional support services through Communication <strong>Service</strong>s, Event<br />
Management, and Legal Affairs saved $226,625.17.<br />
$A variety of Support <strong>Service</strong>s efforts saved <strong>Oakland</strong> County districts<br />
$27,361,991.<br />
Support <strong>Service</strong>s Assistance<br />
Points of<br />
Assistance<br />
2011-<strong>2012</strong><br />
Hours of<br />
Assistance<br />
Avondale 11 56.00<br />
Berkley 27 277.50<br />
Birmingham 13 108.75<br />
Bloomfield 11 141.50<br />
Brandon 15 72.50<br />
Clarenceville 12 33.35<br />
Clarkston 12 108.00<br />
Clawson 17 74.50<br />
Farmington 16 169.00<br />
Ferndale 10 117.75<br />
Hazel Park 23 84.75<br />
Holly 15 50.25<br />
Huron Valley 15 159.25<br />
Lake Orion 13 70.75<br />
Lamphere 24 65.25<br />
Madison 15 76.50<br />
Novi 17 57.50<br />
Oak Park 12 102.75<br />
Oxford 13 135.00<br />
Pontiac 14 239.50<br />
Rochester 16 191.50<br />
Royal Oak 12 110.25<br />
South Lyon 11 76.75<br />
Southfield 13 132.00<br />
Troy 13 157.75<br />
Walled Lake 18 211.50<br />
Waterford 15 154.00<br />
West Bloomfield 16 104.75<br />
TOTAL 419 3,338.85
Technology <strong>Service</strong>s<br />
Technology <strong>Service</strong>s provides high-quality systems, solutions and support to<br />
<strong>Oakland</strong> County schools. Some highlights from 2010-2011 include:<br />
• 27 of 28 districts participated in Inform (data analysis).<br />
• <strong>Oakland</strong> <strong>Schools</strong> student information system customer districts increased from 17<br />
to 20.<br />
• ONE - Barracuda SPAM Filtering blocks over 7 million SPAM emails per month.<br />
• <strong>District</strong> staff accessed approximately 1,588 distance learning programs, 3,985<br />
educational programs, and down-linked 1,981 videos using the ONE Network.<br />
• Moodle hosting for 29 districts, 1 international academy consortium, one site for<br />
CFE campuses, 3 PSAs hosted by <strong>Oakland</strong> <strong>Schools</strong>.<br />
• 54,759 different people (staff and students) used Moodle services; visited <strong>Oakland</strong><br />
<strong>Schools</strong> Moodle sites 227,869,472 times.<br />
<strong>District</strong>s save money with Technology <strong>Service</strong>s<br />
• Technical assistance for ONE Network for all districts at no cost provided benefit<br />
valued at $2,000 per district, totaling $56,000.<br />
• ONE (<strong>Oakland</strong> Network for Education) subsidy for consortium members at<br />
$200,000.<br />
• Hosted ONE Moodle Learning Management System at no charge for 29 districts<br />
saving $72,500.00.<br />
• Hosted ONE Follett Library Management System at no charge for 29 districts<br />
saving $72,500.00.<br />
• Server hosting services provided for six districts at a cost savings of $3,000 per<br />
district totaling $24,000.<br />
• Long-term on-site technical support for districts at no cost provided benefit<br />
valued at $196,500.<br />
• Technical assistance for business applications for eight districts at no cost<br />
provided benefit valued at $12,000 per district totaling $96,000.<br />
• Student Information System (MISTAR) saved $56,795 each for twenty districts<br />
totaling $1,113,900.<br />
• AMS Business, Finance and HR applications saved $85,797 each for six districts<br />
totaling $514,782.<br />
• Internet <strong>Service</strong> Provider (valued in market at $45K for equivalent 10MB<br />
connection) provided for all districts totaling $1,260,000.<br />
• Barracuda SPAM filtering provided for 18 districts at $8,000 each, totaling<br />
$144,000.<br />
• Pearson Inform Data Analysis licensing subsidy provided for all districts totaling<br />
$400,000.<br />
<strong>Oakland</strong> <strong>Schools</strong> Technology <strong>Service</strong>s and Learning <strong>Service</strong>s department have<br />
teamed up to provide a county-wide learning management system to our districts<br />
(at no cost to districts). Our services include hosting and maintaining the software<br />
on our servers and supporting districts’ use of the software with application support,<br />
educational technology consulting, and teacher training.<br />
$Technology <strong>Service</strong>s saved <strong>Oakland</strong> County districts<br />
$4,150,182.<br />
2011-<strong>2012</strong> <strong>District</strong> <strong>Service</strong> <strong>Report</strong> • October <strong>2012</strong> 25
2011-<strong>2012</strong> <strong>District</strong> <strong>Service</strong> <strong>Report</strong> • October <strong>2012</strong> 26<br />
assistance, consultations & RESOURCES provided<br />
The tables on pages 27-28 illustrate <strong>Oakland</strong> County school district usage of online applications provided by <strong>Oakland</strong> <strong>Schools</strong>.<br />
AESOP - Substitute calling and placement application.<br />
AMS - Finance, HR, Procurement, and Budgeting application.<br />
Atlas Rubicon - Curriculum management application.<br />
Barracuda SPAM Filtering - is done for all districts that elect to participate. <strong>District</strong> email is<br />
routed through the Barracuda devices, located at both the primary and secondary head ends, in<br />
order to filter all “Blacklisted” SPAM, reducing the amount of inappropriate email sent to each<br />
district.<br />
Direct Certification - directly certifies students who are eligible for free lunch, using<br />
demographic information about the student and comparing it against data supplied by the state.<br />
Students living in households which appear on the tape are pre-approved for free lunch status.<br />
Non-Pub - application is used by non-public schools that educate students living in <strong>Oakland</strong><br />
County. <strong>Oakland</strong> LEAs receive reports annually from this system about those students residing<br />
within their district boundaries.<br />
NovaNet - a web-based online curriculum for in-school credit recovery, summer programs,<br />
alternative and teen parent programs, adult education, GED, and work-force preparation.<br />
Polyplot - Transportation management application.<br />
KEY<br />
• Current customer district = X<br />
• Year district is planning on<br />
implementing = 20XX<br />
• <strong>District</strong> and OS in discussion<br />
for conversion = D<br />
eSurvey - <strong>Oakland</strong> <strong>Schools</strong> developed electronic survey application.<br />
Follet Library Management - Library management application.<br />
General ASP - a technology-based résumé database system used to match applicant<br />
qualifications to teaching positions in member districts.<br />
Inform - a comprehensive web-based tool that provides the analysis tools to aggregate and<br />
disaggregate different types of testing, proficiency, and demographic information.<br />
Michigan Literacy Progress Profile (MLPP) Assistant - a browser-based tool designed for<br />
teachers to quickly and efficiently enter MLPP data and compile results.<br />
MIstar - Student Information System including: scheduling, attendance, grade reporting, parent<br />
portal, student portal, etc.<br />
Moodle - an open source software, with no cost for licensing, and no contracts. <strong>Oakland</strong><br />
<strong>Schools</strong> Moodle hosting is offered to the districts at no cost. <strong>District</strong>s do not need to ration<br />
Moodle courses, accounts, and training and educators feel empowered to experiment allowing<br />
online learning to be inclusive.<br />
MSDS - State of Michigan student data collection system.
AV<br />
Repair<br />
Technical Assistance Calls Received and Resolved for <strong>District</strong>s<br />
Business<br />
Office<br />
Consulting CGI AMS <strong>District</strong> Hosting<br />
eSurvey<br />
System Follet MISTAR Moodle<br />
2011-<strong>2012</strong> <strong>District</strong> <strong>Service</strong> <strong>Report</strong> • October <strong>2012</strong> 27<br />
Pearson<br />
Inform<br />
State<br />
<strong>Report</strong>ing<br />
Technology<br />
Support<br />
<strong>District</strong> Total<br />
All <strong>District</strong>s 43.00 0.00 2,954.00 0.00 0.00 3.00 2,066.00 6.00 71.00 195.00 628.00 5,966.00<br />
Avondale 2.00 0.00 0.00 0.00 2.75 0.00 106.25 0.00 4.50 3.25 4.00 122.75<br />
Berkley 0.00 0.00 6.50 3.50 0.00 0.00 46.25 0.00 4.50 0.50 9.00 70.25<br />
Birmingham 4.75 0.00 0.00 0.00 0.00 0.00 274.50 0.00 28.00 1.50 4.25 313.00<br />
Bloomfield 13.00 0.00 0.00 0.00 35.80 0.00 256.50 0.00 13.50 2.00 1.50 322.30<br />
Brandon 5.50 216.25 678.25 0.00 0.00 0.00 188.00 0.00 17.50 9.50 2.25 1,117.25<br />
Clarenceville 3.00 0.00 473.00 0.00 0.00 0.00 90.50 0.00 1.00 1.00 11.00 579.50<br />
Clarkston 17.75 0.00 0.00 0.00 0.00 0.00 76.00 3.00 15.50 1.00 8.75 122.00<br />
Clawson 2.25 21.50 431.55 0.00 0.00 3.00 319.50 5.00 7.50 6.75 0.00 797.05<br />
Farmington 5.75 0.00 0.00 0.00 0.00 18.50 1,181.25 0.00 57.25 4.00 0.00 1,266.75<br />
Ferndale 4.00 0.00 0.00 0.00 0.00 2.00 203.00 0.00 27.75 0.00 1.50 238.25<br />
Hazel Park 0.00 5.00 904.00 0.00 0.00 0.00 74.00 0.00 2.50 3.50 0.00 989.00<br />
Holly 0.00 0.00 0.00 0.00 0.00 0.00 45.75 0.00 13.50 0.50 2.00 61.75<br />
Huron Valley 24.50 0.00 0.00 0.00 8.50 0.00 144.75 0.00 52.00 0.50 2.25 232.50<br />
Lake Orion 14.50 1.00 0.00 0.00 0.00 3.00 92.75 0.00 8.00 1.00 17.75 138.00<br />
Lamphere 7.40 0.00 0.00 0.00 0.00 0.00 279.25 0.00 16.75 2.25 7.00 312.65<br />
Madison 4.75 143.75 527.00 0.00 0.00 0.00 159.50 0.00 0.25 3.50 5.00 843.75<br />
Novi 9.00 0.00 4.00 0.00 0.00 1.50 164.75 0.00 5.50 1.50 2.00 188.25<br />
Oak Park 25.75 0.00 0.00 0.00 0.00 0.00 282.00 0.00 10.50 1.50 3.00 322.75<br />
Oxford 12.00 0.00 0.00 0.00 0.00 0.00 67.50 0.00 0.00 1.50 2.00 83.00<br />
Pontiac 30.50 38.25 3,089.80 1.00 0.00 0.00 585.00 0.00 15.00 3.25 53.50 3,816.30<br />
Rochester 54.25 0.00 0.00 0.00 0.00 0.00 85.75 0.00 21.50 1.00 1.00 163.50<br />
Royal Oak 9.75 0.00 0.00 5.50 0.00 8.00 995.25 0.00 18.25 0.00 55.75 1,092.50<br />
South Lyon 5.25 0.00 0.00 0.00 0.00 0.00 91.75 0.00 45.00 1.00 11.00 154.00<br />
Southfield 0.00 0.00 0.00 0.00 0.00 0.00 307.00 0.00 3.50 1.75 5.25 317.50<br />
Troy 33.50 0.00 0.00 0.00 0.00 0.00 73.25 0.00 2.50 0.50 5.25 115.00<br />
Walled Lake 21.25 0.00 0.00 0.00 0.00 0.00 141.25 0.00 0.00 1.75 2.00 166.25<br />
Waterford 7.00 0.00 0.00 0.00 0.50 0.00 925.80 0.00 0.00 0.00 0.00 933.30<br />
West Bloomfield 1.50 0.00 0.00 0.00 0.00 4.00 90.50 0.00 0.50 0.50 0.00 97.00<br />
TOTAL 361.90 425.75 9,068.10 10.00 47.55 43.00 9,413.55 14.00 463.25 250.00 845.00 20,942.10
2011-<strong>2012</strong> <strong>District</strong> <strong>Service</strong> <strong>Report</strong> • October <strong>2012</strong> 28<br />
assistance, consultations & RESOURCES provided<br />
Business<br />
(AMS)<br />
Student<br />
(MIStar) MLPP ONE AESOP<br />
2011-<strong>2012</strong> Online Application Usage<br />
General<br />
ASP (App<br />
Trkg) Non-Pub MSDS Inform<br />
Technical<br />
Consulting<br />
(long term)<br />
Web and/or<br />
Email Hosted<br />
(long term)<br />
Avondale X X X X X X X X X X X<br />
Barracuda<br />
(SPAM<br />
filtering)<br />
Berkley X X X X X X X X X X X X X<br />
Birmingham X X X X X X X X X X X<br />
Bloomfield X X X X X X X X X X<br />
Brandon X X X X X X X X X X<br />
Clarenceville X X X X X X X X X X X X X<br />
Clarkston X X X X X X X X X<br />
Clawson X X X X X X X X X X<br />
Farmington X X X X X X X X X X<br />
Ferndale X X X X X X X X X X X X<br />
Hazel Park X X X X X X X X X X X<br />
Holly X X X X X X X X X X X<br />
Huron Valley X X X X X X X X X X X<br />
Lake Orion X X X X X X X X X<br />
Lamphere X X X X X X X X X X X X X<br />
Madison X X X X X X X X X X X X X<br />
Novi X X X X X X X X X X<br />
Oak Park X X X X X X X X X X<br />
Oxford X X X X X X X X X<br />
Pontiac X X X X X X X X X X X X X X<br />
NovaNet<br />
Atlas<br />
Rubicon<br />
Rochester X X X X X X X X X<br />
Royal Oak X X X X X X X X X<br />
South Lyon X X X X X X X<br />
Southfield X X X X X X X X X X X X<br />
Troy X X X X X X X X X X<br />
Walled Lake X X X X X X X X<br />
Waterford 2013 X X X X X X<br />
West Bloomfield X X X X X X X X X X<br />
Moodle<br />
Follet<br />
Library<br />
Mgt<br />
Server<br />
Hosting<br />
PolyPlot
Human Resources<br />
In addition to building and maintaining<br />
positive employee relations by<br />
supporting the goals, mission and vision<br />
of <strong>Oakland</strong> <strong>Schools</strong>, Human Resources<br />
supports the work of our local districts<br />
through processing certifications,<br />
supporting new mandates on<br />
fingerprinting for all school employees,<br />
and job postings, for local districts<br />
participating in the <strong>Oakland</strong> Human<br />
Resources Consortium (OHRC).<br />
Certification Approvals<br />
During the 2011-<strong>2012</strong> school year,<br />
<strong>Oakland</strong> <strong>Schools</strong> processed certification<br />
approvals for <strong>Oakland</strong> County school<br />
districts as indicated in the table at<br />
right. Temporary approvals are for<br />
persons who are going to school<br />
working toward a certain Special<br />
Education endorsement or approval.<br />
Approvals are for school social<br />
workers, Special Education directors<br />
or supervisors. They are not an<br />
endorsement on a teaching certificate<br />
but rather an approval letter from the<br />
Michigan Department of Education.<br />
<strong>Oakland</strong> Human<br />
Resources Consortium<br />
The <strong>Oakland</strong> Human Resources<br />
Consortium (OHRC) is a consortium<br />
of <strong>Oakland</strong> County school districts<br />
dedicated to the recruitment, selection,<br />
employment, and professional growth<br />
of quality educators and other school<br />
district employees. When candidates<br />
submit their applications through the<br />
online process, they are entered into the<br />
OHRC database and made available to<br />
all districts in the Consortium.<br />
Certification Approvals<br />
2010-<br />
2011<br />
2011-<br />
<strong>2012</strong><br />
Avondale 2 2<br />
Berkley 6 3<br />
Birmingham 1 3<br />
Bloomfield 9 7<br />
Brandon 7 1<br />
Clarkston 6 12<br />
Clawson 3 3<br />
Farmington 9 4<br />
Ferndale 4 0<br />
Hazel Park 3 7<br />
Holly 8 3<br />
Huron Valley 12 9<br />
Lake Orion 10 7<br />
Lamphere 7 3<br />
Madison 2 1<br />
Oak Park 0 4<br />
Oxford 0 1<br />
Pontiac 3 5<br />
Rochester 10 6<br />
Royal Oak 1 1<br />
South Lyon 10 3<br />
Southfield 19 24<br />
Troy 4 8<br />
Walled Lake 11 8<br />
Waterford 10 12<br />
West Bloomfield 3 1<br />
TOTAL 160 138<br />
Number of <strong>Oakland</strong> Human Resources Consortium Postings<br />
2009-2010 2010-2011 2011-<strong>2012</strong><br />
Avondale 21 36 58<br />
Berkley 0 11 12<br />
Birmingham 35 61 77<br />
Clarenceville 5 24 17<br />
Clarkston 44 36 49<br />
Holly 25 35 23<br />
Huron Valley 184 293 218<br />
Lake Orion 0 34 104<br />
Lamphere 81 132 192<br />
Madison 5 71 41<br />
Novi 25 70 97<br />
Oxford 48 45 76<br />
Pontiac 79 143 161<br />
Rochester 43 57 218<br />
Royal Oak 68 95 94<br />
South Lyon 23 29 74<br />
Walled Lake 12 26 34<br />
Waterford 143 270 296<br />
West Bloomfield 62 133 125<br />
TOTAL 903 1,601 1,966<br />
$Countywide consortium for the provision of substitutes<br />
resulted in countywide savings of more than $50,000<br />
per year for participating districts.<br />
2011-<strong>2012</strong> <strong>District</strong> <strong>Service</strong> <strong>Report</strong> • October <strong>2012</strong> 29
2011-<strong>2012</strong> <strong>District</strong> <strong>Service</strong> <strong>Report</strong> • October <strong>2012</strong> 30<br />
assistance, consultations & RESOURCES provided<br />
Production Printing & Graphics <strong>Service</strong>s<br />
Purchased by <strong>Oakland</strong> County School <strong>District</strong>s<br />
Production Printing and Graphics<br />
Production Printing and Graphics offers quality printing and design at a low price,<br />
while remaining dedicated to personalized service and the use of new technology.<br />
<strong>Service</strong>s include electronic document transmission and printing; color printing;<br />
district delivery of print orders; full service print shop; page layout and design.<br />
This table illustrates the Total Cost of district usage of low-cost, high-quality print resources<br />
provided by the <strong>Oakland</strong> <strong>Schools</strong> Regional <strong>Service</strong>s Print Production and Graphics Team.<br />
Total Cost indicates the sum of all aspects of design, print and delivery. In addition to Print<br />
Production and Graphic <strong>Service</strong>s, this table illustrates district purchases from Production Printing<br />
and Graphics.<br />
$Production Printing and Graphics saves districts<br />
$477,161.*<br />
*<strong>Oakland</strong> <strong>Schools</strong> pricing is approximately 50% of commercial printing.<br />
2009-2010 2010-2011 2011-<strong>2012</strong><br />
Avondale 752 279 241<br />
Berkley 5,853 7,632 7,382<br />
Birmingham 1,045 0 270<br />
Bloomfield Hills 93,067 106,754 69,804<br />
Brandon 1,553 803 2,527<br />
Clarenceville 0 1,683 1,114<br />
Clarkston 8,349 10,453 15,031<br />
Clawson 6,957 994 6,651<br />
Farmington 1,044 8,185 66,800<br />
Ferndale 102 0 0<br />
Hazel Park 89 0 0<br />
Holly 372 982 2,199<br />
Huron Valley 15,070 7,455 6,597<br />
Lake Orion 201 129 714<br />
Lamphere 7,909 0 7,437<br />
Madison 96 5,006 7,085<br />
Novi 7,795 8,302 4,934<br />
Oak Park 6,500 27,787 13,407<br />
Oxford 13,444 9,096 2,432<br />
Pontiac 87,334 88,491 53,494<br />
Rochester 27,632 22,099 18,903<br />
Royal Oak 0 0 499<br />
South Lyon 21,187 22,843 22,562<br />
Southfield 2,275 3,196 2,849<br />
Troy 1,859 2,422 12,130<br />
Walled Lake 5,909 10,061 8,793<br />
Waterford 144,230 132,733 122,515<br />
West Bloomfield 233 9,377 21,032<br />
TOTAL $460,859 $486,762 $477,161
Fingerprinting<br />
To assist <strong>Oakland</strong> County school districts in maintaining compliance with the<br />
State mandated School Safety Legislation (2005 PA 129-131 and 138), <strong>Oakland</strong><br />
<strong>Schools</strong> and the <strong>Oakland</strong> Association of School Personnel Administrators (OASPA),<br />
established a digital fingerprinting program.<br />
This table shows the number of district staff who have come to <strong>Oakland</strong> <strong>Schools</strong> for<br />
fingerprinting services.<br />
Number of Staff Fingerprinted at <strong>Oakland</strong> <strong>Schools</strong><br />
2009-2010 2010-2011 2011-<strong>2012</strong><br />
Avondale 24 11 4<br />
Berkley 43 14 5<br />
Birmingham 81 54 55<br />
Bloomfield Hills 60 61 22<br />
Brandon 22 5 7<br />
Clarenceville 4 1 0<br />
Clarkston 81 71 2<br />
Clawson 19 18 2<br />
Farmington 10 2 1<br />
Ferndale 63 22 10<br />
Hazel Park 22 24 14<br />
Holly 38 50 21<br />
Huron Valley 136 63 62<br />
Lake Orion 70 60 33<br />
Lamphere 43 51 66<br />
Madison 2 9 4<br />
Novi 40 42 23<br />
Oak Park 10 0 0<br />
Oxford 102 112 78<br />
Pontiac 99 72 9<br />
Rochester 74 8 8<br />
Royal Oak 27 16 7<br />
South Lyon 0 0 0<br />
Southfield 18 10 0<br />
Troy 0 0 0<br />
Walled Lake 108 35 52<br />
Waterford 5 1 2<br />
West Bloomfield 41 33 2<br />
TOTAL 1,242 845 489<br />
2011-<strong>2012</strong> <strong>District</strong> <strong>Service</strong> <strong>Report</strong> • October <strong>2012</strong> 31
2011-<strong>2012</strong> <strong>District</strong> <strong>Service</strong> <strong>Report</strong> • October <strong>2012</strong> 32<br />
assistance, consultations & RESOURCES provided<br />
Medicaid <strong>Service</strong>s<br />
<strong>Oakland</strong> <strong>Schools</strong> processes billings on<br />
behalf of <strong>Oakland</strong> County’s 28 local<br />
school districts and two public school<br />
academies for health services provided<br />
in the schools for Medicaid eligible<br />
special education students. This is a<br />
voluntary program provided at no cost<br />
to the districts and helps to offset some<br />
of the health care costs these students<br />
incur. Important components of the<br />
program are monitoring and compliance<br />
services, which are provided to ensure<br />
the qualifications of personnel, medical<br />
necessity and outcomes of services<br />
provided and accuracy of billing.<br />
The accompanying table illustrates<br />
resources provided to all <strong>Oakland</strong> County<br />
school districts as related to the Medicaid<br />
School Based <strong>Service</strong>s Program.<br />
The number of participating clinicians may<br />
change from month to month, therefore an<br />
average number was used under the column<br />
“Average # of Clinicians.”<br />
The column “Total Amount Paid to<br />
LEA in FY ‘12” indicates the payments<br />
issued to the local school districts during<br />
fiscal year 2011-12 for the Direct<br />
<strong>Service</strong> Program, which includes direct<br />
health services and special education<br />
transportation, and for the Administrative<br />
Outreach Program totaling $22,363,975.<br />
Average<br />
Number of<br />
Clinicians<br />
Medicaid<br />
Eligible<br />
Students<br />
The Medicaid School Based <strong>Service</strong>s<br />
reimbursement methodology, which has been in effect since July 2008, is cost based and annually<br />
reconciled. The payments made to the local districts and public school academies were distributed<br />
in August 2011, March <strong>2012</strong> and June <strong>2012</strong> for the 2011-12 school fiscal year in accordance with<br />
the reconciliation timeframe established by the Michigan Department of Community Health.<br />
*Payment on hold until billing issues are cleared and FY12 Initial Settlement is distributed.<br />
Direct <strong>Service</strong><br />
Workshop<br />
Participants<br />
Speech<br />
Referrals<br />
Obtained<br />
(A) Administrative<br />
Outreach Program (AOP)<br />
Paid to LEA in FY '12<br />
(B) Direct <strong>Service</strong>(DS) and<br />
Transportation<br />
DS & AOP<br />
Deferral<br />
Total Amount Paid to<br />
LEA (A + B) in FY '12<br />
Avondale 41 115 0 37 9,008.08 424,987.31 433,995.39<br />
Berkley 41 121 0 122 3,834.77 247,954.98 * 251,789.75<br />
Birmingham 91 97 90 414 22,308.94 1,135,400.81 1,157,709.75<br />
Bloomfield Hills 118 152 25 160 39,245.59 1,705,661.76 1,744,907.35<br />
Brandon 30 160 0 57 5,505.56 173,949.62 * 179,455.18<br />
Clarenceville 13 125 0 76 4,600.53 93,282.70 97,883.23<br />
Clarkston 167 202 272 139 26,853.74 1,021,513.26 1,048,367.00<br />
Clawson 36 70 0 198 6,360.83 360,788.63 367,149.46<br />
Farmington 154 294 170 404 51,578.74 1,888,552.57 1,940,131.31<br />
Ferndale 31 154 0 186 6,210.38 268,817.99 275,028.37<br />
Hazel Park 76 373 0 202 16,936.61 337,961.58 354,898.19<br />
Holly 101 294 0 139 3,821.04 442,297.12 * 446,118.16<br />
Huron Valley 198 382 199 524 15,172.53 851,092.73 * 866,265.26<br />
Lake Orion 72 270 19 0 26,594.36 898,438.98 925,033.34<br />
Lamphere 52 146 22 135 2,955.45 288,917.62 * 291,873.07<br />
Madison 11 113 0 32 3,705.89 179,753.88 183,459.77<br />
Novi 59 73 0 0 22,962.25 586,597.41 609,559.66<br />
Oak Park 41 262 0 126 6,031.21 400,224.56 406,255.77<br />
Oxford 50 130 22 238 14,002.45 264,847.99 278,850.44<br />
Pontiac 154 701 71 355 6,555.96 1,201,628.50 1,208,184.46<br />
Rochester 293 334 190 524 64,704.95 2,297,841.16 2,362,546.11<br />
Royal Oak 46 174 43 25 10,471.26 459,541.21 * 470,012.47<br />
South Lyon 62 242 59 639 16,188.57 440,573.34 456,761.91<br />
Southfield 87 459 0 73 39,910.29 1,069,335.47 1,109,245.76<br />
Troy 97 207 70 1,133 25,743.16 1,203,979.38 1,229,722.54<br />
Walled Lake 139 390 102 477 46,657.12 1,663,015.86 1,709,672.98<br />
Waterford 147 550 145 419 19,897.59 1,037,501.20 * 1,057,398.79<br />
West Bloomfield 83 160 0 447 23,323.17 878,376.61 901,699.78<br />
TOTAL 2,490 6,750 1,499 7,281 541,141.02 21,822,834.23 22,363,975.25<br />
$Local districts received $22,363,975 through<br />
Medicaid Revenue in <strong>Oakland</strong> County in 2011-<strong>2012</strong>.
Regional Education<br />
Media Center<br />
(REMC)<br />
The REMC Statewide $AVE (<strong>Schools</strong><br />
Aggregated Volume in Education) Bid<br />
Project is a service of the 28 REMCs in<br />
Michigan, including <strong>Oakland</strong> <strong>Schools</strong>/<br />
REMC 17. The Project aggregates the<br />
purchasing power of schools statewide<br />
and provides large volume bid prices<br />
on a variety of educational resources.<br />
Products include: supplies, equipment,<br />
software, computer and networking,<br />
paper, and catalog discounts.<br />
Michigan schools saved over $52.5<br />
million in 2011. <strong>Oakland</strong> County<br />
public and private schools saved over<br />
$6.7 million in 2011. The chart below<br />
shows specific information for each<br />
of the <strong>Oakland</strong> County public school<br />
districts. At the June <strong>2012</strong> REMC<br />
Summer Inservice, REMC 17 was<br />
recognized for having the largest<br />
increase in sales in 2011.<br />
Regional Educational Media Center Association (REMC) Statewide SAVE Project<br />
Quantity Educational List Price REMC SAVE Sales Savings Percent Savings<br />
Avondale 12,861 $139,608 $85,380 $54,228 38%<br />
Berkley 21,719 $342,782 $215,879 $126,903 37%<br />
Birmingham 43,769 $1,688,174 $1,341,510 $346,664 20%<br />
Bloomfield 14,230 $662,211 $372,422 $289,789 43%<br />
Brandon 15,404 $199,647 $131,195 $68,452 34%<br />
Clarenceville 12,360 $190,636 $114,736 $75,900 39%<br />
Clarkston 38,629 $794,185 $543,370 $250,815 31%<br />
Clawson 9,769 $1,510,432 $1,145,724 $364,708 24%<br />
Farmington 56,504 $789,056 $457,125 $331,931 42%<br />
Ferndale 16,056 $258,884 $145,862 $113,022 43%<br />
Hazel Park 4,221 $90,567 $71,265 $19,302 21%<br />
Holly 12,982 $679,873 $599,053 $80,821 11%<br />
Huron Valley 25,197 $421,920 $289,880 $132,040 31%<br />
Lake Orion 25,780 $491,360 $283,647 $207,713 42%<br />
Lamphere 14,481 $516,813 $336,096 $180,717 34%<br />
Madison 3,668 $125,341 $76,106 $49,235 39%<br />
Novi 18,149 $548,689 $485,640 $63,048 11%<br />
Oak Park 861 $37,090 $30,578 $6,513 17%<br />
Oxford 17,101 $325,091 $211,571 $113,520 34%<br />
Pontiac 11,357 $286,316 $118,722 $167,594 58%<br />
Rochester 37,986 $644,575 $340,856 $303,719 47%<br />
Royal Oak 24,563 $259,493 $132,599 $126,895 48%<br />
South Lyon 38,934 $577,461 $329,108 $248,353 43%<br />
Southfield 15,854 $1,009,786 $820,936 $188,850 18%<br />
Troy 51,077 $2,819,368 $1,753,519 $1,065,849 37%<br />
Walled Lake 24,454 $441,620 $279,361 $162,259 36%<br />
Waterford 22,073 $384,550 $261,882 $122,668 31%<br />
West Bloomfield 12,654 $738,221 $598,012 $140,209 18%<br />
<strong>Oakland</strong> <strong>Schools</strong> 9,719 $1,708,556 $682,739 $1,025,818 56%<br />
REMC TOTALS 612,412 $18,682,307 $12,254,774 $6,427,533 34%<br />
2011-<strong>2012</strong> <strong>District</strong> <strong>Service</strong> <strong>Report</strong> • October <strong>2012</strong> 33
• Tax Valuations & Rates<br />
• School Election Results<br />
2011-<strong>2012</strong> <strong>District</strong> <strong>Service</strong> <strong>Report</strong> • October <strong>2012</strong> 34<br />
did you KNOW?<br />
To remind us – and you – of what the intermediate school district is here to do, we use the acronym ISD (which usually stands for Intermediate School <strong>District</strong>)<br />
in a little different way:<br />
Increase student achievement<br />
Serve diverse needs of schools<br />
Decrease costs/increase efficiencies<br />
For more <strong>Oakland</strong> <strong>Schools</strong> publications, please visit www.oakland.k12.mi.us, click on About Us, then Publications.<br />
Follow us on:<br />
Twitter - http://twitter.com/oaklandschools or @<strong>Oakland</strong><strong>Schools</strong><br />
Facebook - https://www.facebook.com/OSMichigan<br />
Pinterest - http://pinterest.com/oaklandschools<br />
who we are<br />
& WHAT WE DO<br />
YouTube - http://www.youtube.com/user/oaklandschoolsmi<br />
Schooltube - http://www.schooltube.com/organization/220396/<br />
Our blog - http://oaklandschoolsmi.com<br />
<strong>Oakland</strong> <strong>Schools</strong> website - www.oakland.k12.mi.us<br />
summaries<br />
&<br />
August <strong>2012</strong><br />
SURVEYS<br />
2011-<strong>2012</strong><br />
• Pupil Accounting<br />
• Financial Data<br />
May <strong>2012</strong>
our customers SAY...<br />
Project Star has proven very successful in identification of children at risk of child care<br />
expulsion due to needing mental health supports and services in <strong>Oakland</strong> County.<br />
The collaboration between <strong>Oakland</strong> <strong>Schools</strong> and OCCMHA is outstanding. We look forward<br />
to partnering with <strong>Oakland</strong> <strong>Schools</strong> in support of Project Star for fiscal year 2013.<br />
Jennifer Muller<br />
Manager, <strong>Service</strong> Network - SED<br />
<strong>Oakland</strong> County Community Mental Health Authority<br />
I wanted to thank you very much for all of your hard work and effort in helping the OEC<br />
graduation to take place. What a day and night! The grads, their families, the staff and<br />
administration from both WBSD and OCC were so very impressed, it was a night they will<br />
remember forever. FYI, the lift for our handicapped student worked wonderfully. Whoever<br />
found it, we owe you a debt of gratitude! Once again, thank you from the bottom of the<br />
collective OEC heart for making June 1st a night to remember.<br />
Gayle Sturt MA, LPC, NCC, Counselor<br />
West Bloomfield School <strong>District</strong>, <strong>Oakland</strong> Early College and <strong>Oakland</strong> Opportunity Academy<br />
Thank you for the hard work and dedication that each of you have put into developing a<br />
cutting edge social studies curriculum for use by our teachers across the state and here<br />
in Monroe County. There are many teachers using this curriculum and the curriculum<br />
directors here in Monroe County are especially grateful for the content and professional<br />
development.<br />
Please accept my heartfelt thanks and congratulations for everything you have done.<br />
May each of you find satisfaction in the knowledge that you have made a difference in the<br />
lives of teachers and children across our state. Have a wonderful summer.<br />
Chuck Estep<br />
Curriculum Resource Consultant<br />
Monroe County Intermediate School <strong>District</strong><br />
I am writing this note to let you and your fellow associates at Wraparound know how<br />
important your function in our society is. You have added a whole new realm of happiness<br />
and contentment that was lost. The material possessions you’ve provided added a feeling<br />
of wealth. You’ve helped make our family calm.<br />
Wraparound customer<br />
I am a US History teacher at the American School of Kuwait. I grew up in Royal Oak and<br />
attended Royal Oak <strong>Schools</strong> K-12, and after graduating from Central Michigan I returned<br />
to Royal Oak and was able to land a long-term sub position at Royal Oak High School<br />
under the tutelage of a former teacher and coach of mine, Alec Snyder. Alec was the one<br />
who introduced me to the <strong>Oakland</strong> <strong>Schools</strong> ‘Scope and Sequence’ curriculum.<br />
I am emailing you because this is hands down, the best information and curriculum that I<br />
have ever seen available for educators. The amount of time and effort that was put into<br />
it is astounding and I would like to thank you for your hard work on it. Though tailored<br />
for a Michigan classroom, you created a system that is easily adaptable to any place, even<br />
Kuwait! When presenting this to my administration, they were so impressed by what you<br />
and other collaborators at <strong>Oakland</strong> <strong>Schools</strong> had done, that we as a school have decided<br />
to formulate a K-12 Scope and sequence that fits in with an American international<br />
education.<br />
I spread the word about this amazing resource to anyone who will listen and I hope that<br />
the teachers back in <strong>Oakland</strong> Country appreciate what you have done as much as I do.<br />
Again, thank you so much for all the effort you put into creating this!<br />
Jeffrey Wilusz<br />
AP US History / US History / Sociology<br />
American School of Kuwait<br />
2011-<strong>2012</strong> <strong>District</strong> <strong>Service</strong> <strong>Report</strong> • October <strong>2012</strong> 35
The photos used in the <strong>District</strong> <strong>Service</strong> <strong>Report</strong> were<br />
provided and are used with permission from the local<br />
districts in <strong>Oakland</strong> County Michigan.<br />
Communication <strong>Service</strong>s<br />
2111 Pontiac Lake Road<br />
Waterford, MI 48328-2736<br />
248.209.2145<br />
www.oakland.k12.mi.us<br />
<strong>Oakland</strong> <strong>Schools</strong> does not discriminate on the basis of sex, race, color, national origin, religion, height, weight, marital status, sexual orientation (subject to the limits of applicable law), age, genetic information, or disability in its programs, services, activities or employment opportunities.<br />
Inquiries related to employment discrimination should be directed to the Director of Human Resources at 248.209.2059, 2111 Pontiac Lake Road, Waterford, MI 48328-2736. For all other inquiries related to discrimination, contact the Director of Legal Affairs at 248.209.2062,<br />
2111 Pontiac Lake Road, Waterford, MI 48328-2736.