Cycle network and route planning guide - NZ Transport Agency
Cycle network and route planning guide - NZ Transport Agency
Cycle network and route planning guide - NZ Transport Agency

Create successful ePaper yourself
Turn your PDF publications into a flip-book with our unique Google optimized e-Paper software.
APPENDIX 2<br />
SCALING CYCLE COUNTS<br />
Introduction<br />
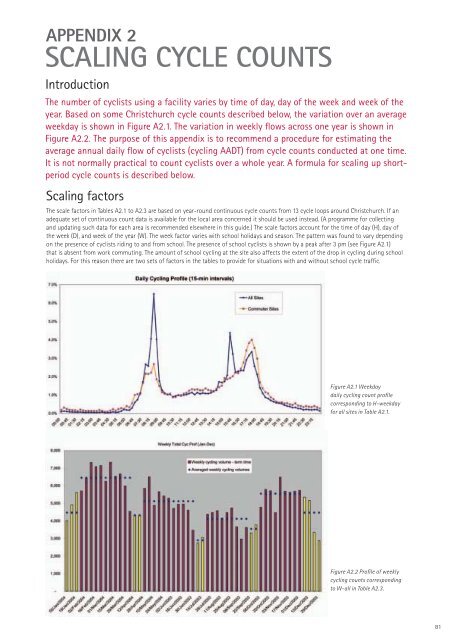
The number of cyclists using a facility varies by time of day, day of the week <strong>and</strong> week of the<br />
year. Based on some Christchurch cycle counts described below, the variation over an average<br />
weekday is shown in Figure A2.1. The variation in weekly flows across one year is shown in<br />
Figure A2.2. The purpose of this appendix is to recommend a procedure for estimating the<br />
average annual daily flow of cyclists (cycling AADT) from cycle counts conducted at one time.<br />
It is not normally practical to count cyclists over a whole year. A formula for scaling up shortperiod<br />
cycle counts is described below.<br />
Scaling factors<br />
The scale factors in Tables A2.1 to A2.3 are based on year-round continuous cycle counts from 13 cycle loops around Christchurch. If an<br />
adequate set of continuous count data is available for the local area concerned it should be used instead. (A programme for collecting<br />
<strong>and</strong> updating such data for each area is recommended elsewhere in this <strong>guide</strong>.) The scale factors account for the time of day (H), day of<br />
the week (D), <strong>and</strong> week of the year (W). The week factor varies with school holidays <strong>and</strong> season. The pattern was found to vary depending<br />
on the presence of cyclists riding to <strong>and</strong> from school. The presence of school cyclists is shown by a peak after 3 pm (see Figure A2.1)<br />
that is absent from work commuting. The amount of school cycling at the site also affects the extent of the drop in cycling during school<br />
holidays. For this reason there are two sets of factors in the tables to provide for situations with <strong>and</strong> without school cycle traffic.<br />
Figure A2.1 Weekday<br />
daily cycling count profile<br />
corresponding to H-weekday<br />
for all sites in Table A2.1.<br />
Figure A2.2 Profile of weekly<br />
cycling counts corresponding<br />
to W-all in Table A2.3.<br />
81