Cycle network and route planning guide - NZ Transport Agency
Cycle network and route planning guide - NZ Transport Agency
Cycle network and route planning guide - NZ Transport Agency

Create successful ePaper yourself
Turn your PDF publications into a flip-book with our unique Google optimized e-Paper software.
7.4 Use of <strong>route</strong>s by cyclists<br />
7.4.1 Road hierarchy method<br />
Description<br />
District plans usually include maps of the road hierarchy in their areas (typically arterial, collector <strong>and</strong> local roads).<br />
A first assumption could be that the number of cyclists wishing to use a particular link in the road <strong>network</strong> will be in direct<br />
proportion to those using motor traffic on that link. So highly trafficked roads could be expected to carry relatively high volumes of<br />
cycle traffic, given appropriate cycling conditions.<br />
Advantage<br />
This method gives the simplest <strong>and</strong><br />
quickest indication of potential cycle<br />
dem<strong>and</strong> across the whole area.<br />
Disadvantages<br />
Cyclists may avoid sections of arterial<br />
roads that they perceive as hazardous or<br />
unpleasant for cycling, or may take a short<br />
cut not available to motor traffic.<br />
Cycling conditions may be perceived as so<br />
dangerous or unpleasant that people either<br />
cease cycling or don’t take it up in the first<br />
place. This suppressed or latent dem<strong>and</strong><br />
for cycling might be realised if cycling<br />
conditions were improved.<br />
Recommendations<br />
This method is a good way to begin<br />
assessing cycle dem<strong>and</strong>. Other cycle<br />
dem<strong>and</strong> assessment methods should be<br />
used to refine further the underst<strong>and</strong>ing<br />
of cycle travel patterns in an area.<br />
7.4.2 <strong>Cycle</strong> crash data<br />
Description<br />
<strong>Cycle</strong> crash data for a long period of time can indicate those <strong>route</strong>s that cyclists have difficulty negotiating safely.<br />
Useful crash data can be obtained from the LTSA, ambulance services <strong>and</strong> RCAs’ databases of locally reported crashes.<br />
Advantage<br />
This data is readily available <strong>and</strong> is also needed for evaluating cycle <strong>route</strong> options.<br />
Disadvantages<br />
LTSA data generally excludes crashes<br />
that do not involve a motor vehicle, <strong>and</strong><br />
off-road crashes.<br />
Ambulance data has good location<br />
information but is biased towards the<br />
more serious injuries.<br />
This method will be poor at identifying:<br />
• sections of the road <strong>network</strong> that carry<br />
significant numbers of cyclists <strong>and</strong> are<br />
relatively safe for cyclists<br />
• off-road <strong>route</strong>s (ambulance data is<br />
useful here).<br />
Also, cyclists may avoid hazardous sections<br />
of an otherwise desirable cycle <strong>route</strong>.<br />
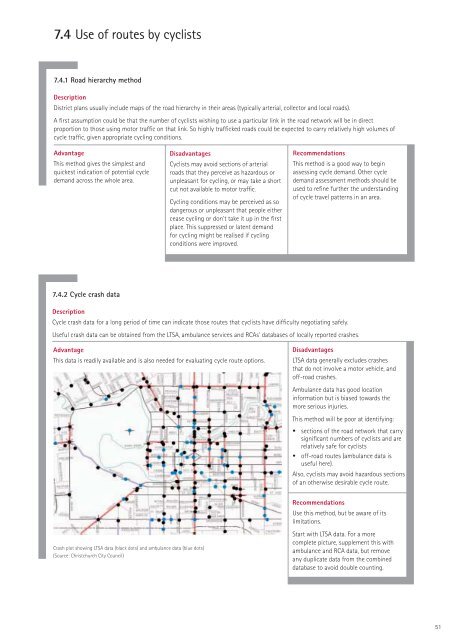
Crash plot showing LTSA data (black dots) <strong>and</strong> ambulance data (blue dots)<br />
(Source: Christchurch City Council)<br />
Recommendations<br />
Use this method, but be aware of its<br />
limitations.<br />
Start with LTSA data. For a more<br />
complete picture, supplement this with<br />
ambulance <strong>and</strong> RCA data, but remove<br />
any duplicate data from the combined<br />
database to avoid double counting.<br />
51