Health and Global Environmental Change SERIES, No. 2 Heat ...
Health and Global Environmental Change SERIES, No. 2 Heat ...
Health and Global Environmental Change SERIES, No. 2 Heat ...

You also want an ePaper? Increase the reach of your titles
YUMPU automatically turns print PDFs into web optimized ePapers that Google loves.
<strong>Health</strong> <strong>and</strong> <strong>Global</strong> <strong>Environmental</strong> <strong>Change</strong><br />
<strong>SERIES</strong>, <strong>No</strong>. 2<br />
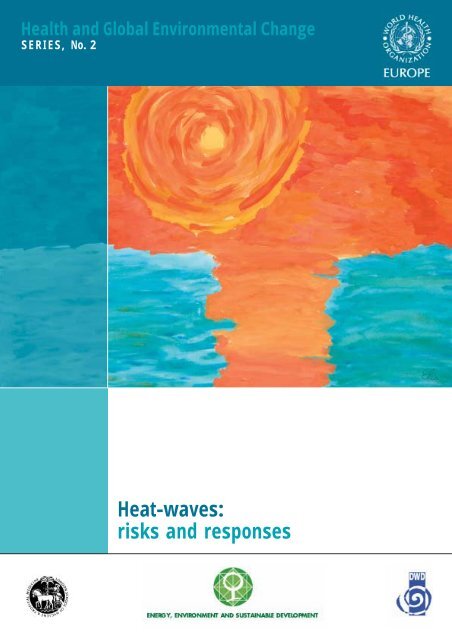
<strong>Heat</strong>-waves:<br />
risks <strong>and</strong> responses
<strong>Health</strong> <strong>and</strong> <strong>Global</strong> <strong>Environmental</strong> <strong>Change</strong><br />
<strong>SERIES</strong>, <strong>No</strong>. 2<br />
<strong>Heat</strong>-waves:<br />
risks <strong>and</strong> responses<br />
Lead authors:<br />
Christina Koppe,<br />
Sari Kovats,<br />
Gerd Jendritzky<br />
<strong>and</strong> Bettina Menne<br />
Contributing authors:<br />
Jürgen Baumüller,<br />
Arieh Bitan,<br />
Julio Díaz Jiménez,<br />
Kristie L. Ebi,<br />
George Havenith,<br />
César López Santiago,<br />
Paola Michelozzi,<br />
Fergus Nicol,<br />
Andreas Matzarakis,<br />
Glenn McGregor,<br />
Paulo Jorge <strong>No</strong>gueira,<br />
Scott Sheridan<br />
<strong>and</strong> Tanja Wolf
Abstract<br />
High air temperatures can affect human health <strong>and</strong> lead to additional deaths even under current climatic conditions. <strong>Heat</strong>waves<br />
occur infrequently in Europe <strong>and</strong> can significantly affect human health, as witnessed in summer 2003.This report<br />
reviews current knowledge about the effects of heat-waves, including the physiological aspects of heat illness <strong>and</strong><br />
epidemiological studies on excess mortality,<strong>and</strong> makes recommendations for preventive action.Measures for reducing heatrelated<br />
mortality <strong>and</strong> morbidity include heat health warning systems <strong>and</strong> appropriate urban planning <strong>and</strong> housing design.<br />
More heat health warnings systems need to be implemented in European countries. This requires good coordination<br />
between health <strong>and</strong> meteorological agencies <strong>and</strong> the development of appropriate targeted advice <strong>and</strong> intervention<br />
measures. More long-term planning is required to alter urban bioclimates <strong>and</strong> reduce urban heat isl<strong>and</strong>s in summer.<br />
Appropriate building design should keep indoor temperatures comfortable without using energy-intensive space cooling.<br />
As heat-waves are likely to increase in frequency because of global climate change, the most effective interventions,<br />
measures <strong>and</strong> policies to protect the health of vulnerable Europeans need to be developed <strong>and</strong> evaluated.<br />
2<br />
Text editing: David J Breuer<br />
Design <strong>and</strong> layout: Emilio Dotto EDB&RDB<br />
Cover design: Elis Martinelli<br />
Printed by: Colombo<br />
Keywords<br />
CLIMATE<br />
GREENHOUSE EFFECTS<br />
HEAT STROKE - prevention <strong>and</strong> control<br />
RISK ASSESSMENT<br />
RISK MANAGEMENT<br />
INFORMATION SYSTEMS<br />
ENVIRONMENTAL MONITORING<br />
CITY PLANNING<br />
Address requests about publications of the WHO Regional Office to:<br />
• by e-mail Download this pubblication from http://www.euro.who.int/globalchange<br />
publicationrequests@euro.who.int (for copies of publications)<br />
permissions@euro.who.int (for permission to reproduce them)<br />
pubrights@euro.who.int (for permission to translate them)<br />
• by post Publications<br />
WHO Regional Office for Europe<br />
Scherfigsvej 8<br />
DK-2100 Copenhagen Ø, Denmark<br />
© World <strong>Health</strong> Organization 2004<br />
All rights reserved.The Regional Office for Europe of the World <strong>Health</strong> Organization welcomes requests for permission to<br />
reproduce or translate its publications, in part or in full.<br />
The designations employed <strong>and</strong> the presentation of the material in this publication do not imply the expression of any<br />
opinion whatsoever on the part of the World <strong>Health</strong> Organization concerning the legal status of any country, territory, city<br />
or area or of its authorities, or concerning the delimitation of its frontiers or boundaries.Where the designation “country or<br />
area” appears in the headings of tables, it covers countries, territories, cities, or areas. Dotted lines on maps represent<br />
approximate border lines for which there may not yet be full agreement.<br />
The mention of specific companies or of certain manufacturers’ products does not imply that they are endorsed or<br />
recommended by the World <strong>Health</strong> Organization in preference to others of a similar nature that are not mentioned. Errors<br />
<strong>and</strong> omissions excepted, the names of proprietary products are distinguished by initial capital letters.<br />
The World <strong>Health</strong> Organization does not warrant that the information contained in this publication is complete <strong>and</strong> correct<br />
<strong>and</strong> shall not be liable for any damages incurred as a result of its use.The views expressed by authors or editors do not<br />
necessarily represent the decisions or the stated policy of the World <strong>Health</strong> Organization.
Contents<br />
FOREWORDS 4<br />
ACKNOWLEDGEMENTS 8<br />
1. INTRODUCTION 9<br />
2. CLIMATE CHANGE AND TEMPERATURE EXTREMES 11<br />
2.1. Observed changes in the frequency <strong>and</strong> intensity of heat-waves 12<br />
2.2. <strong>Heat</strong>-waves <strong>and</strong> future climate change 15<br />
3. THE IMPACT OF HEAT ON HUMAN HEALTH 17<br />
3.1. Physiological aspects of temperature regulation 18<br />
3.2. Epidemiological studies of heat 26<br />
4. HEAT HEALTH WARNING SYSTEMS 35<br />
4.1. Methods used by heat health warning systems 36<br />
4.2. <strong>Heat</strong> stress indicators 37<br />
4.3. Public health responses 40<br />
4.4. Survey of heat health warning systems in Europe 42<br />
4.5. Case studies 46<br />
4.6. Recommendations 58<br />
4.7. Research gaps 61<br />
4.8. Current research into the development of heat health warning systems 62<br />
5. URBAN BIOCLIMATOLOGY 65<br />
5.1. Introduction 66<br />
5.2. Urban climates <strong>and</strong> urban heat isl<strong>and</strong>s 67<br />
5.3. Urban bioclimates 73<br />
5.4. Urban planning, design <strong>and</strong> architecture 76<br />
5.5. Indoor environment 83<br />
5.6. Potential impact of climate change on urban climate 89<br />
5.7. Discussion <strong>and</strong> recommendations 92<br />
6. CONCLUSIONS AND RECOMMENDATIONS 95<br />
6.1. The research community 95<br />
6.2. Public health agencies <strong>and</strong> meteorological services 96<br />
6.3. Long-term intervention strategies 97<br />
REFERENCES 98<br />
ANNEX 1. Programme of the cCASHh Workshop<br />
on Vulnerability to Thermal Stresses, 5–7 May 2003, Freiburg, Germany 112<br />
ANNEX 2. Questionnaire on extreme thermal events <strong>and</strong> health warning systems 114<br />
ANNEX 3. Current status of heat health warning systems in Europe 116<br />
ANNEX 4. Projection of climate change in European cities 118<br />
3
Foreword<br />
This important publication, reviewing the effects of heat stress on health <strong>and</strong> potential strategies to<br />
reduce vulnerability to thermal stress, is the work of a strong collaborative team of investigators from<br />
several European countries. It is particularly timely given the high-profile effects of the heat-wave in<br />
France in 2003 that have reinforced the need for societies to cope more effectively with heat-waves.<br />
The ageing of the European population, together with the potential effects of climate change, may<br />
exacerbate the threats to human health posed by thermal stress in the future. <strong>Heat</strong>-health warning<br />
systems offer the potential for collaboration between meteorological agencies <strong>and</strong> health authorities.<br />
However, merely issuing warnings is unlikely to substantially reduce heat-related deaths. Community<br />
outreach to vulnerable groups will be necessary, <strong>and</strong> the impact of such systems must be evaluated to<br />
ensure that they deliver the promise of reducing heat-related deaths.The challenge of reducing the<br />
effects of thermal stress, especially on elderly people, also requires commitment from policy-makers<br />
<strong>and</strong> building designers to improve indoor environments without using approaches that lead to<br />
increases in greenhouse gas emissions. <strong>Health</strong> researchers <strong>and</strong> those studying the built environment<br />
need to collaborate to determine cost-effective designs to reduce thermal stress.<br />
This publication makes an important contribution to underst<strong>and</strong>ing of the effects of thermal stress<br />
<strong>and</strong> effective responses. It complements other work such as that on the health effects of floods <strong>and</strong><br />
the effects of climate on infectious diseases that has been undertaken under the Climate <strong>Change</strong> <strong>and</strong><br />
Adaptation Strategies for Human <strong>Health</strong> (cCASHh) project.The contributors to this publication are to<br />
be congratulated on marshalling existing evidence in an accessible form <strong>and</strong> indicating research<br />
questions that still need to be addressed.<br />
4<br />
Andy Haines<br />
Dean<br />
London School of Hygiene <strong>and</strong> Tropical Medicine<br />
United Kingdom
Foreword<br />
When the Climate <strong>Change</strong> <strong>and</strong> Adaptation Strategies for Human <strong>Health</strong> (cCASHh) project started on 1<br />
May 2001, few people would have thought that its results would be so timely.<br />
The heat-wave of August 2003 in Europe <strong>and</strong> its high toll of victims in various parts of Europe have<br />
made it clear once again that no one on this planet will remain unaffected by the effects of climate<br />
change. One heat-wave does not prove that the world is getting hotter, but last summer’s weather fit a<br />
global trend that has seen previous records shattered with increasing regularity.Although the<br />
historical data for heat-waves may leave much to be desired, the August heat-wave in Europe has<br />
certainly broken all records for heat-induced human deaths.<br />
This publication summarizes the findings of work package 3 of the project Vulnerability Assessment of<br />
thermal stresses. It shows that health care <strong>and</strong> social systems are ill prepared for thermal stresses <strong>and</strong><br />
that intervention plans <strong>and</strong> effective technical intervention are lacking.The publication identifies the<br />
research gaps <strong>and</strong> formulates recommendations.<br />
Relatively little research has been carried out on the effects of climate change on human health.This<br />
type of research requires an interdisciplinary approach.The cCASHh project is a good example.<br />
Coordinated by WHO, it comprises eight partners from six countries <strong>and</strong> brings together researchers<br />
from different disciplines.<br />
Congratulations to all the participants for their hard work in producing this important <strong>and</strong><br />
comprehensive publication.<br />
Karin Zaunberger<br />
Project Officer<br />
Research Directorate-General<br />
European Commission<br />
5
Foreword<br />
Human beings are closely linked to the atmospheric environment via their heat budget. Extreme<br />
thermal conditions can harm the health of people with limited capacity for acclimatization, as was<br />
shown by the heat-wave that struck central, western <strong>and</strong> southern Europe in August 2003. <strong>Heat</strong>-waves<br />
appear to constitute a great health risk even in moderate climates.<br />
Such extreme events are expected to occur again because of the natural variability of climate <strong>and</strong> the<br />
assumed climate change.Taking appropriate precautionary measures has thus become urgent.The key<br />
term is adaptation.The Climate <strong>Change</strong> <strong>and</strong> Adaptation Strategies for Human <strong>Health</strong> (cCASHh) project<br />
provides basic findings on the capacity of the population to adapt to extreme thermal conditions <strong>and</strong><br />
has identified several strategies for reducing vulnerability. <strong>Heat</strong> health warning systems, with<br />
intervention measures adjusted to local conditions, can save lives in critical cases. Long-term goals<br />
should include reducing urban heat isl<strong>and</strong>s through climate-related urban planning <strong>and</strong> designing<br />
buildings to create favourable indoor climates without the use of air-conditioning. Maximizing the<br />
effectiveness of such adaptation measures requires intense multidisciplinary cooperation between<br />
experts in numerous fields.<br />
Based on German Federal law, the Deutscher Wetterdienst carries out pure <strong>and</strong> applied research in<br />
public health.This is probably unique among national meteorological services, <strong>and</strong> the Deutscher<br />
Wetterdienst therefore plays an appreciated role in human biometeorology within the World<br />
Meteorological Organization. I am very happy to report that there has been close <strong>and</strong> fruitful<br />
collaboration between WHO, the London School of Hygiene <strong>and</strong> Tropical Medicine <strong>and</strong> the Deutscher<br />
Wetterdienst on this fundamental issue. I would like to thank the European Commission for funding<br />
this forward-looking research.<br />
6<br />
Udo Gärtner<br />
President<br />
Deutscher Wetterdienst<br />
Permanent Representative of Germany with the World Meteorological Organization
Foreword<br />
Severe floods, windstorms, heat-waves <strong>and</strong> cold-spells have affected the European Region during the<br />
last few years.The political, social, environmental <strong>and</strong> health consequences of these episodes have<br />
stimulated debate on whether appropriate action can prevent at least some of the health effects of<br />
such extreme weather <strong>and</strong> climate events.<br />
The current increasing instability of the global climate system is predicted to potentially lead to an<br />
increase in climate variability. In particular, the frequency <strong>and</strong> intensity of extreme temperatures is<br />
expected to change.An unprecedented heat-wave affected the European Region in summer 2003,<br />
causing excess mortality in France, northern Italy <strong>and</strong> Portugal.<br />
The assessment of the environmental <strong>and</strong> health effects of this <strong>and</strong> previous heat-waves has<br />
highlighted a number of knowledge gaps <strong>and</strong> problems in public health responses.To date, heat-waves<br />
have not been considered a serious risk to human health with “epidemic” potential in the European<br />
Region. Reducing the health impact of future heat-waves requires addressing fundamental questions,<br />
such as whether heat-waves can be predicted, detected <strong>and</strong> prevented <strong>and</strong> how this can be achieved.<br />
Knowledge gaps exist in the relationship between heat exposure <strong>and</strong> a range of health outcomes; in<br />
underst<strong>and</strong>ing interactions between harmful air pollutants <strong>and</strong> extreme weather <strong>and</strong> climate events; in<br />
harmonizing episode analysis; <strong>and</strong> in evaluating the effectiveness of heat-related public health<br />
interventions.There is ongoing debate on whether <strong>and</strong> how to develop heat health warning systems,<br />
to provide space cooling in specific locations <strong>and</strong> to develop public advice <strong>and</strong> community-based<br />
activities that support the social <strong>and</strong> health-related welfare of elderly people <strong>and</strong> other high-risk<br />
groups to reduce their vulnerability to temperature extremes. Cost–effectiveness analysis will be<br />
needed.<br />
Public health authorities have started to respond to these challenges <strong>and</strong> have initiated some<br />
programmes to prepare populations <strong>and</strong> increase their capacity to tolerate extreme weather events;<br />
however, more work needs to be done to describe these responses <strong>and</strong> to evaluate their effectiveness.<br />
This publication summarizes the main findings of reviews carried out within the cCASHh (Climate<br />
<strong>Change</strong> <strong>and</strong> Adaptation Strategies for Human <strong>Health</strong>) project, coordinated by the WHO Regional Office<br />
for Europe. In particular, this report addresses physiological <strong>and</strong> epidemiological aspects of heat stress<br />
<strong>and</strong> assesses measures for reducing mortality <strong>and</strong> morbidity from heat stress such as heat health<br />
warning systems, urban planning <strong>and</strong> indoor climate.<br />
We are confident that this publication will contribute to further stimulating debate <strong>and</strong> research on<br />
this subject, supporting the efforts of public health authorities to better target intervention strategies<br />
for prevention.<br />
Roberto Bertollini<br />
Director<br />
Division of Technical Support, <strong>Health</strong> Determinants<br />
WHO Regional Office for Europe<br />
7
Acknowledgements<br />
This publication is the result of a few years of research efforts within the project Climate <strong>Change</strong> <strong>and</strong><br />
Adaptation Strategies for Human <strong>Health</strong> in Europe (cCASHh) funded by the European Commission<br />
(Grant <strong>No</strong>. EVK2-2000-00070) coordinated by Bettina Menne <strong>and</strong> Roberto Bertollini of the WHO<br />
Regional Office for Europe.<br />
Christina Koppe (Deutscher Wetterdienst, Business Unit Human Biometeorology, Freiburg, Germany),<br />
Sari Kovats (Centre on <strong>Global</strong> <strong>Change</strong> <strong>and</strong> <strong>Health</strong>, London School of Hygiene <strong>and</strong> Tropical Medicine,<br />
United Kingdom) <strong>and</strong> Gerd Jendritzky (Deutscher Wetterdienst, Business Unit Human Biometeorology,<br />
Freiburg, Germany) were the main authors.<br />
The coordinators <strong>and</strong> authors would like to thank the following for contributing to the text: Jürgen<br />
Baumüller, L<strong>and</strong>eshaupstadt Stuttgart, Amt für Umweltschutz, Abteilung Stadtklimatologie, Stuttgart,<br />
Germany;Arieh Bitan, Department of Geography <strong>and</strong> the Human Environment,Tel Aviv University, Israel;<br />
Julio Díaz Jiménez,Centro Universitario de Salud Pública,Madrid,Spain;Kristie L.Ebi,<strong>Global</strong> <strong>Change</strong> <strong>and</strong><br />
<strong>Health</strong>, WHO Regional Office for Europe (currently Exponent <strong>Health</strong> Group, USA); George Havenith,<br />
Human Thermal Environments Laboratory, Department of Human Sciences, Loughborough, United<br />
Kingdom;Tom Kosatsky,WHO Regional Office for Europe; César López Santiago,Autonomous University<br />
of Madrid, University Centre of Public <strong>Health</strong>, <strong>Environmental</strong> <strong>Health</strong> Group, Madrid, Spain; Paola<br />
Michelozzi, Department of Epidemiology, Lazio, Rome, Italy; Fergus Nicol, LEARN, London Metropolitan<br />
University, London, United Kingdom;Andreas Matzarakis, Meteorologisches Institut, Universität Freiburg,<br />
Freiburg,Germany;Glenn McGregor,University of Birmingham,School of Geography <strong>and</strong> <strong>Environmental</strong><br />
Sciences, Birmingham, United Kingdom; Paulo Jorge <strong>No</strong>gueira, Onsa – Observatório Nacional de Saúde,<br />
Instituto Nacional de Saúde Dr. Ricardo Jorge, Lisbon, Portugal; Scott Sheridan, Kent State University,<br />
Department of Geography, Kent, OH, USA; <strong>and</strong> Tanja Wolf,WHO Regional Office for Europe.<br />
The coordinators <strong>and</strong> authors would like to thank the following people for participating in the cCASHh<br />
Workshop on Vulnerability to Thermal Stresses, 5–7 May 2003, Freiburg, Germany organized by the<br />
Deutscher Wetterdienst <strong>and</strong> WHO <strong>and</strong> the very useful suggestions received during this meeting:Teresa<br />
Abrantes, Instituto de Meteorologia, Centro de Analise e Previsao do Tempo (CAPT), Lisbon, Portugal;<br />
Tanja Cegnar, <strong>Environmental</strong> Agency, Ljubljana, Slovenia;Aline Chiabai, Fondazione Enrico Mattei,Venice,<br />
Italy; Hans-Martin Füssel, Potsdam Institute for Climate Impact Research (PIK), Department for<br />
Integrated Systems Analysis,Potsdam,Germany;Peter Höppe,Institut für Arbeits und Umweltmedizin der<br />
Universität München, Munich, Germany; Gudrun Laschewski, Deutscher Wetterdienst, Business Unit<br />
Human Biometeorology, Freiburg, Germany; Michael van Lieshout, Integrated Assessment Scientist,<br />
International Centre for Integrative Studies (ICIS), Maastricht, the Netherl<strong>and</strong>s;Anna Paldy, Fodor Jozsef<br />
National Center for Public <strong>Health</strong>, National Institut of <strong>Environmental</strong> <strong>Health</strong>, Budapest, Hungary; <strong>and</strong><br />
Thomas Voigt, European Topic Centre/Air <strong>and</strong> Climate <strong>Change</strong>, Berlin, Germany.<br />
8
A changing climate is expected to increase average summer temperatures <strong>and</strong> the frequency <strong>and</strong><br />
intensity of hot days. <strong>Heat</strong>-waves in Europe are associated with significant morbidity <strong>and</strong> mortality. A<br />
preliminary analysis of the 2003 heat-wave in Europe estimated that it caused 14 802 excess deaths in<br />
France (National Institute of Public <strong>Health</strong> Surveillance, 2003), 2045 excess deaths in the United<br />
Kingdom, 2099 in Portugal. Ongoing epidemiological studies will better describe <strong>and</strong> contribute<br />
substantial evidence to the underst<strong>and</strong>ing of health effects of heat-waves in Europe <strong>and</strong> add significantly<br />
to targeting interventions.<br />
This report summarizes the main findings of reviews carried out within the cCASHh (Climate <strong>Change</strong><br />
<strong>and</strong> Adaptation Strategies for Human <strong>Health</strong>) project <strong>and</strong> a consultative workshop with experts <strong>and</strong><br />
stakeholders from 10 countries. It addresses the health impact of heat, aspects of prevention <strong>and</strong><br />
adaptation such as heat health warning systems, urban planning elements <strong>and</strong> aspects of building<br />
design.<br />
This study was funded by the European Commission.The key objectives of the overall cCASHh project<br />
are:<br />
• to identify the vulnerability of European populations to the adverse effects of climate change on<br />
human health;<br />
• to review current measures, technologies, policies <strong>and</strong> barriers related to improving the capacity of<br />
human populations to adapt to climate change;<br />
• to identify the measures, technologies <strong>and</strong> policies <strong>and</strong> approaches to implementation that are most<br />
effective <strong>and</strong> appropriate for European populations to successfully adapt to climate change;<br />
• to provide estimates of the health benefits of specific strategies or combinations of strategies for<br />
adaptation for vulnerable populations under various climate change scenarios; <strong>and</strong><br />
• to estimate the costs (of climate-related damage <strong>and</strong> implementing adaptive measures) <strong>and</strong> benefits<br />
(both of climate change <strong>and</strong> of adaptation strategies), including auxiliary benefits independent of<br />
climate change.<br />
The research project covers the 15 current European Union countries <strong>and</strong> the 10 countries that are<br />
scheduled to accede to the European Union in 2004. In some cases, however, assessment was extended<br />
to countries in the eastern part of the WHO European Region.The project is scheduled to be completed<br />
by July 2004.<br />
To achieve these objectives, vulnerability assessment, a conceptual framework for adaptation, policy<br />
analysis, economic analysis <strong>and</strong> scenarios will be applied to thermal stress, floods, vector-borne diseases<br />
<strong>and</strong> waterborne <strong>and</strong> foodborne diseases.<br />
The research within the cCASHh project is divided into 11 work packages.Work package 3 deals with<br />
vulnerability to thermal stress <strong>and</strong> has the following objectives:<br />
• to identify populations in Europe that are particularly vulnerable to heat stress <strong>and</strong> to identify <strong>and</strong><br />
reduce this vulnerability; <strong>and</strong><br />
• to identify <strong>and</strong> evaluate strategies for adaptation.<br />
1.INTRODUCTION<br />
9
Within this work package, the Deutscher Wetterdienst, the London School of Hygiene <strong>and</strong> Tropical<br />
Medicine reviewed available literature, conducted a qualitative assessment of heat warning systems in<br />
Europe <strong>and</strong> conducted time-series analysis of mortality <strong>and</strong> weather parameters in a number of<br />
European cities. The WHO European Centre for Environment <strong>and</strong> <strong>Health</strong> in collaboration with the<br />
Deutscher Wetterdienst <strong>and</strong> the London Scool of Hygiene <strong>and</strong> Tropical Medicine organized the cCASHh<br />
Workshop on Vulnerability to Thermal Stresses on 5–7 May 2003 in Freiburg, Germany:<br />
• to identify the potential impact of climate change on heat-related morbidity <strong>and</strong> mortality;<br />
• to review <strong>and</strong> evaluate existing short-term <strong>and</strong> long-term adaptation measures;<br />
• to make recommendations for implementing <strong>and</strong> evaluating heat health warning systems <strong>and</strong> other<br />
appropriate strategies to reduce heat stress; <strong>and</strong><br />
• to identify information gaps <strong>and</strong> research needs.<br />
During the Workshop, the current state of knowledge of the potential to reduce heat stress through<br />
urban planning <strong>and</strong> heat health warning systems was presented, with a focus on developing criteria for<br />
evaluating their effectiveness.<br />
The Deutscher Wetterdienst, Business Unit Human Biometeorology in Freiburg, Germany kindly hosted<br />
the Workshop. Experts were asked to prepare short presentations (Annex 1).<br />
There are still many knowledge gaps, however this report should help to stimulate debate <strong>and</strong> plan<br />
responses to heat-waves in the future.<br />
10
2. CLIMATE CHANGE<br />
AND TEMPERATURE EXTREMES<br />
2.1. Observed changes in the frequency <strong>and</strong> intensity of heat-waves<br />
2.2. <strong>Heat</strong>-waves <strong>and</strong> future climate change<br />
11
2.1. Observed changes in the frequency <strong>and</strong> intensity of heat-waves<br />
2.1. Observed changes in the frequency <strong>and</strong><br />
intensity of heat-waves<br />
The Third Assessment Report of the Intergovernmental Panel on Climate <strong>Change</strong> (Houghton et al.,2001)<br />
stated that “there is new <strong>and</strong> stronger evidence that most of the warming observed over the last 50 years<br />
is attributable to human activities”. Detecting climate change is difficult because any climate change<br />
“signal” is superimposed on the background “noise” of natural climate variability. Nevertheless, there is<br />
now good evidence that the climate is changing.The global average l<strong>and</strong> <strong>and</strong> sea surface temperature<br />
increased by 0.6 ± 0.2 °C over the 20th century (Houghton et al., 2001). Nearly all of this increase<br />
occurred in two periods: 1910–1945 <strong>and</strong> since 1976 (Fig. 1). At the regional scale, warming has been<br />
observed in all continents,with the greatest temperature changes occurring at middle <strong>and</strong> high latitudes<br />
in the <strong>No</strong>rthern Hemisphere.<br />
Extreme weather events are, by definition, rare stochastic events. With climate change, even if the<br />
statistical distribution of such events remains the same, a shift in the mean will entail a nonlinear<br />
response in the frequency of extreme events (Fig. 2).<br />
12<br />
Fig. 1. Variation of the surface temperature of the <strong>No</strong>rthern Hemisphere over the last millennium<br />
<strong>No</strong>rthern Hemisphere anomaly (°C) relative to 1961 to 1990<br />
1.0<br />
0.5<br />
0.0<br />
-0.5<br />
-1.0<br />
1000 years<br />
Source: Houghton et al. (2001).<br />
1998 instrumental data<br />
(AD 1902 to 1999)<br />
1200<br />
Reconstruction<br />
(AD 1000 to 1980)<br />
Reconstruction<br />
(40 year smoothed)<br />
1998 instrumental value<br />
1400 1600 1800 2000
Fig. 2. <strong>Change</strong>s in the probability of extreme weather events<br />
Probability of occurrence<br />
Less cold<br />
weather<br />
Source: Houghton et al. (2001).<br />
Previous climate<br />
Increase in mean temperature<br />
New climate<br />
COLD AVERAGE HOT<br />
2. CLIMATE CHANGE AND TEMPERATURE EXTREMES<br />
More hot<br />
weather<br />
Fig. 3. <strong>Change</strong> of daily maximum temperatures (°C per decade) in the summer half-year, 1976–1999<br />
N<br />
o C/decade<br />
> 0.3<br />
0.2 to 0.3<br />
0.1 to 0.2<br />
0 to 0.1<br />
pos. but n.s. at 5%<br />
n.s. at 25%<br />
neg. but n.s. at 5%<br />
–0.1 to 0<br />
–0.2 to –0.1<br />
–0.3 to –0.2<br />
< –0.3<br />
Source: Klein Tank et al. (2002).<br />
More<br />
record hot<br />
weather<br />
13
2.1. Observed changes in the frequency <strong>and</strong> intensity of heat-waves<br />
Few studies have looked at the instrumental record to determine whether the frequency or intensity of<br />
temperature extremes has changed (IPCC). Houglton et. al, “developed estimates of confidence in<br />
observed <strong>and</strong> projected changes in extreme weather events”.Higher minimum temperatures seem to be<br />
very likely to occur. This is partly because long data series are required of sufficient quality <strong>and</strong> are often<br />
not available. Analyses using monthly gridded temperature data around the world since 1951 indicate<br />
that the recent increase in global surface temperatures is accompanied both by reductions in the areas<br />
affected by extremely low temperatures <strong>and</strong> by increases in the areas with extremely high temperatures.<br />
Analyses of proxy data for the <strong>No</strong>rthern Hemisphere indicate that the increase in temperature in the<br />
20th century is likely to have been the largest in any century during the past 1000 years (Fig. 1).<br />
Although the trend towards warmer average global surface temperatures has been uneven over the last<br />
century, the trend for the period since 1976 is roughly three times that for the past 100 years as whole.<br />
<strong>Global</strong> climate change is likely to be accompanied by an increase in the frequency <strong>and</strong> intensity of heatwaves<br />
as well as by warmer summers <strong>and</strong> milder winters.The European climate assessment (Klein Tank<br />
et al.,2002) confirms that Europe has experienced an unprecedented rate of warming in recent decades.<br />
From 1976 to 1999, the annual number of warm extremes increased twice as fast as expected based on<br />
the corresponding decrease in the number of cold extremes. During this period, minimum (night-time)<br />
temperatures increased more strongly than maximum (day-time) temperatures. Fig. 3 illustrates the<br />
trends in daily maximum temperatures in Europe for the period 1976–1999.The frequency of very hot<br />
days in central Engl<strong>and</strong> has increased since the 1960s, with extreme summers in 1976, 1983, 1990 <strong>and</strong><br />
1995 (Hulme et al., 2002). Sustained hot days (taken as heat-waves) have become more frequent,<br />
especially in May <strong>and</strong> July.<br />
14
2.2. <strong>Heat</strong>-waves <strong>and</strong> future climate change<br />
2. CLIMATE CHANGE AND TEMPERATURE EXTREMES<br />
Recent scientific assessments indicate that, as global temperatures continue to increase because of<br />
climate change, the number <strong>and</strong> intensity of extreme events are likely to increase (World Meteorological<br />
Organization, 2003). New record extreme events occur every year somewhere around the globe, but in<br />
recent years the numbers of such extremes have been increasing.<br />
Table 1 depicts an assessment of confidence in observed changes in extremes of weather <strong>and</strong> climate<br />
during the latter half of the 20th century (left column) <strong>and</strong> in projected changes during the 21st century<br />
(right column). This assessment relies on observational <strong>and</strong> modelling studies as well as the physical<br />
plausibility of future projections across all commonly used scenarios <strong>and</strong> is based on expert judgement<br />
(Houghton et al., 2001).<br />
The impact of extreme summer heat on human health may be exacerbated by increases in humidity.<br />
<strong>Heat</strong>-waves usually occur in synoptic situations with pronounced slow air mass development <strong>and</strong><br />
movement, leading to intensive <strong>and</strong> prolonged heat stress. However, even short or moderate heat<br />
episodes adversely affect human health.<br />
TABLE 1. ESTIMATES OF CONFIDENCE IN OBSERVED AND PROJECTED CHANGES IN EXTREME WEATHER AND CLIMATE EVENTS<br />
Confidence in observed<br />
changes (latter half of the<br />
20th century)<br />
Likely<br />
Very likely<br />
Very likely<br />
Likely over many areas<br />
Source: adapted from Houghton et al. (2001).<br />
<strong>Change</strong>s in phenomenon<br />
Higher maximum temperatures <strong>and</strong> more hot days over<br />
nearly all l<strong>and</strong> areas<br />
Higher minimum temperatures, fewer cold days <strong>and</strong><br />
frost days over nearly all l<strong>and</strong> areas<br />
Reduced diurnal temperature range over most l<strong>and</strong><br />
areas<br />
Increase of heat index (combination of temperature <strong>and</strong><br />
humidity) over l<strong>and</strong> areas<br />
Confidence in projected changes<br />
(during the 21st century)<br />
Very likely<br />
Very likely<br />
Very likely<br />
Very likely over most areas<br />
15
3. THE IMPACT OF HEAT<br />
ON HUMAN HEALTH<br />
3.1. Physiological aspects of temperature regulation<br />
3.2. Epidemiological studies of heat<br />
17
3.1. Physiological aspects of temperature regulation<br />
3.1. Physiological aspects of temperature<br />
regulation<br />
3.1.1. Mechanisms of heat exchange<br />
The body temperature regulation centres in the brain (hypothalamus) attempt to keep the body core<br />
temperature within healthy limits. At rest this is about 37 °C, but with exercise the temperature can<br />
increase to 38–39 °C without any detrimental effect on health, as long as the thermoregulatory system<br />
is within its control range.<br />
Staying within the control range (the predictive zone) requires the body to balance heat production by<br />
the body <strong>and</strong> possible other heat gains (such as solar radiation) with heat loss. <strong>Heat</strong> is produced as a<br />
result of the metabolic activity required to perform activities. Most of the energy the body uses is<br />
released as heat.The body can lose this heat by convection (warming of air or water around the body),<br />
by conduction (contact with solids, such as the floor), respiration (air inhaled is usually cooler <strong>and</strong> dryer<br />
than exhaled air) radiation <strong>and</strong> evaporation of sweat (Fig. 4). When air temperature <strong>and</strong> water vapour<br />
pressure increase, the gradients between skin <strong>and</strong> environment required for these heat losses decrease<br />
<strong>and</strong> heat loss is reduced.When air temperature approaches skin temperature, heat loss by convection<br />
approaches zero, <strong>and</strong> heat may even be gained when air temperature rises above skin temperature. In<br />
these cases the main (<strong>and</strong> sometimes only) avenue left for losing heat is by producing sweat <strong>and</strong><br />
18<br />
Fig. 4. <strong>Heat</strong> gains <strong>and</strong> heat losses in hot environments<br />
< 5%<br />
Respiration<br />
< 10%<br />
Source: adapted from Havenith (2003).<br />
Convection<br />
75%<br />
Sweat evaporation<br />
Conduction<br />
0-20%<br />
External work<br />
< 1%<br />
SUN<br />
Radiation<br />
(highly variable)
evaporation, <strong>and</strong> even this is compromised with increasing vapour pressure. <strong>Heat</strong> production then<br />
exceeds losses <strong>and</strong> the body temperature increases.<br />
Several effector mechanisms inside the body are involved in regulating body temperature. The most<br />
important ones for heat are sweat production to lose heat from the skin <strong>and</strong> skin blood flow to transport<br />
heat from the body core <strong>and</strong> the muscles to the skin. During heat stress, the proper functioning of both<br />
systems is essential for thermal regulation. If they are unduly stressed <strong>and</strong> cannot match the<br />
thermoregulatory dem<strong>and</strong>s, this leads to excessive strain on the body <strong>and</strong> eventually may cause heat<br />
illness. Additional effector mechanisms are an increase in some hormones (antidiuretic hormone <strong>and</strong><br />
aldosterone), in respiratory rate <strong>and</strong> in heart rate.<br />
For body temperature to remain stable (heat storage = 0), heat loss needs to balance heat production.<br />
The heat balance can be written as (Havenith, 2002):<br />
<strong>Heat</strong> storage = heat production – heat loss = (metabolic rate – external work) – (conduction +<br />
radiation + convection + evaporation + respiration)<br />
Even heat loss components can lead to heat gain under certain circumstances.The environmental factors listed<br />
in Table 2 influence the heat loss components <strong>and</strong> should therefore be considered in assessing heat stress.<br />
TABLE 2. ENVIRONMENTAL FACTORS AND THEIR EFFECTS ON THE HUMAN HEAT BALANCE<br />
<strong>Environmental</strong> factor<br />
Air temperature<br />
Radiant temperature<br />
Surface temperature<br />
Air humidity<br />
Wind speed<br />
Effect on human heat balance<br />
T(skin) > T(air)<br />
T(skin) < T(air)<br />
Radiant heat exchange between skin <strong>and</strong><br />
environment<br />
Conductive heat exchange (minor role)<br />
Evaporative heat loss or gain<br />
Convection <strong>and</strong> evaporation<br />
3. THE IMPACT OF HEAT ON HUMAN HEALTH<br />
Explanation<br />
Convective heat loss from the skin to the environment<br />
Convective heat gain from the environment to body skin<br />
In the sun, radiant temperature can easily exceed<br />
temperature, which results in radiant heat transfer from the<br />
environment to the skin<br />
The amount of moisture (not relative humidity!) in the air<br />
determines whether moisture (sweat) in vapour form flows<br />
from the skin to the environment or vice versa. Evaporation of<br />
sweat is the most important avenue for the body to dissipate<br />
its surplus heat.<br />
<strong>Heat</strong> exchange increases with increasing wind speed<br />
19
3.1. Physiological aspects of temperature regulation<br />
3.1.2. <strong>Heat</strong>-related illness<br />
Skin eruptions, heat fatigue, heat cramps, heat syncope, heat exhaustion <strong>and</strong> heat stroke are classical heatrelated<br />
illnesses. Most heat-related illnesses (except for skin eruptions <strong>and</strong> heat cramps) are in essence<br />
consequences of varying severity of failure in the thermoregulatory system.<br />
The least severe form is heat syncope, caused by a failure of the circulation to maintain blood pressure<br />
<strong>and</strong> supply oxygen to the brain. As soon as the patient is horizontal, the system recovers quickly.The<br />
decline in blood pressure is related to a reduction in venous return, caused by the expansion of the<br />
circulatory volume by dilation of skin arteries <strong>and</strong> veins, often combined with lowered plasma volume<br />
because of dehydration.This is exacerbated when no muscle pump (activity) is present to support the<br />
venous return of blood to the heart (such as a soldier st<strong>and</strong>ing still in a parade).<br />
When the muscle pump is active (such as during exercise), blood pressure can be kept up longer <strong>and</strong><br />
body heating may progress further, together with high cardiovascular stress, leading to heat exhaustion.<br />
If the high heat load from exercise <strong>and</strong>/or climate in such cases is not removed, this may progress into<br />
heat stroke, in which extreme body temperature (above 40.5 °C) leads to damage to cellular structures<br />
<strong>and</strong> the thermoregulatory system with a high risk of mortality.This typically is diagnosed in fit young<br />
adults who continue exercising despite feeling unwell, such as during competitions. <strong>Heat</strong> stroke has a<br />
high case–fatality ratio <strong>and</strong> a rapid onset. Complications of heat stroke include adult respiratory distress<br />
syndrome, kidney failure, liver failure <strong>and</strong> disseminated intravascular coagulation (Donoghue et al.,<br />
1997). Severe functional impairment was observed in 33% of 58 patients admitted with heat stroke<br />
during the Chicago heat-wave, with no improvement after 1 year in those still alive (Dematte et al.,<br />
1998). Deaths from heat stroke may be underreported because heat stroke is similar to other more<br />
familiar causes of death,especially coronary or cerebral thrombosis,once the body is no longer hot itself<br />
or in a hot environment (Keatinge et al., 1986; Mirch<strong>and</strong>ani et al., 1996).<br />
For less fit subjects (such as some elderly people), heat-related illnesses can occur at low levels of<br />
exercise or even in the absence of exercise. Low fitness levels lead to a low cardiovascular reserve <strong>and</strong><br />
20<br />
TABLE 3. SYMPTOMS OF DEHYDRATION ACCORDING TO THE PERCENTAGE OF BODY WEIGHT<br />
Degree<br />
of dehydration<br />
2%<br />
4%<br />
6%<br />
8%<br />
12%<br />
14%<br />
Source: adapted from Havenith (2003).<br />
Liquid loss (litres)<br />
for a 70-kg person<br />
1.4<br />
2.8<br />
4.2<br />
5.6<br />
8.4<br />
9.8<br />
Symptoms<br />
Thirst<br />
plus dry mouth<br />
plus increased heart rate <strong>and</strong> increased body temperature<br />
plus swollen tongue, difficult speech, reduced mental <strong>and</strong> physical<br />
performance<br />
Recovery only after parenteral fluid administration<br />
Rapid temperature increase <strong>and</strong> death
thus to low heat tolerance. In addition, several other predisposing factors can accelerate the<br />
development of high body temperatures. Similar to fitness, these mostly affect the sweating system<br />
(reduced cooling), skin vasodilation (reduced heat movement from core to skin) or cardiovascular<br />
reactivity (problems with supply to vital organs <strong>and</strong> with blood pressure).<br />
However, even when exposure is less severe, these processes in reaction to heat can also affect health<br />
through other pathways. The increased cardiovascular load in heat (vasodilation <strong>and</strong> dehydration)<br />
exacerbates other health problems such as cardio-vascular disease. Some cause-<strong>and</strong>-effect relationships<br />
with heat are unclear apart from the additional strain on the system caused by heat, but coronary <strong>and</strong><br />
cerebral thrombosis are thought to be related to the loss of water <strong>and</strong> salt in warm environments leading<br />
to haemoconcentration <strong>and</strong> a thrombogenic increase in viscosity <strong>and</strong> the density of platelets <strong>and</strong> red<br />
blood cells.<br />
Increased sweat production in heat can lead to dehydration.A fit, acclimatized person can produce up<br />
to 3 litres of sweat per hour; a normal person produces up to 1 litre of sweat per hour.Table 3 lists the<br />
symptoms of dehydration.<br />
3.1.3. Predisposing factors for heat-related illnesses<br />
The main predisposing factors for heat-related illness are:<br />
• age;<br />
• lack of acclimatization;<br />
• dehydration because of reduced food <strong>and</strong> liquid uptake, intestinal problems, use of diuretics <strong>and</strong><br />
alcohol abuse;<br />
• use of other drugs affecting the temperature regulation system,such as phenotiazines <strong>and</strong> barbiturates<br />
<strong>and</strong> other medications;<br />
• low fitness;<br />
• overweight; <strong>and</strong><br />
• fatigue, sleep deprivation, long-term high-level exercise <strong>and</strong> protective clothing.<br />
3.1.3.1. Responses in elderly people<br />
Older people are more vulnerable to heat because of intrinsic changes in the regulatory system <strong>and</strong>/or<br />
because of the presence of drugs that interfere with normal homeostasis. Few studies of physiological<br />
heat tolerance have been undertaken in older (>65) people (Drinkwater & Horvath,1979;Basu & Samet,<br />
2002). As homeostasis is impaired,elderly people may not be aware that they are becoming ill from high<br />
temperatures <strong>and</strong> therefore may not take action to reduce their exposure. Several studies have shown<br />
that elderly people in institutions, such as residential care homes, are vulnerable to heat-related illness<br />
<strong>and</strong> death (Bull & Morton, 1975; Lye & Kamal 1977; Faunt et al., 1995; Pajares Ortiz et al., 1997).<br />
Havenith et al. (1995) studied the response to heat stress in a warm, humid environment in a<br />
heterogeneous sample of 56 subjects aged 20–73 years. The effect of age on body temperature <strong>and</strong><br />
sweating was negligible compared with effects related to maximum oxygen uptake (as an indicator for<br />
fitness). Chronological age, however, independently affected cardiovascular effector response.<br />
Low fitness is one factor that makes elderly people susceptible to heat-related morbidity <strong>and</strong> mortality.<br />
Another factor is the relatively high percentage of people with illnesses <strong>and</strong> disabilities within the<br />
3. THE IMPACT OF HEAT ON HUMAN HEALTH<br />
21
3.1. Physiological aspects of temperature regulation<br />
elderly population. In the United Kingdom, 41% of people aged 65–74 years <strong>and</strong> 52% of those 75 years<br />
or older reported that their lifestyle was limited by illness or disability versus 22% among all age groups<br />
(Havenith, 2001a). This also influences well-being in various thermal environments. In addition,<br />
medication use associated with illness often adversely affects thermoregulation (Havenith, 2001a).<br />
Since elderly people have reduced sweating capacity, it is essential that the sweat they produce<br />
evaporates (Havenith, 2001a).This does not happen if ambient water vapour pressure is high.This fact<br />
stresses the importance of examining not only air temperature in analysing heat-related morbidity <strong>and</strong><br />
mortality but also water vapour pressure, or an atmospheric moisture equivalent.<br />
3.1.3.2. Physiological acclimatization<br />
Short-term heat acclimatization usually takes 3–12 days (Table 5), but complete (long-term)<br />
acclimatization to an unfamiliar thermal environment may take several years (Babayev, 1986; Frisancho,<br />
1991).Acclimatization includes several mechanisms (Table 4) <strong>and</strong> has been studied in sports medicine,<br />
including improved thermal comfort <strong>and</strong> exercise performance.<br />
As long as sweating is continuous, people can withst<strong>and</strong> remarkably high temperatures, provided that<br />
water <strong>and</strong> sodium chloride, the most important physiological constituents of sweat, are replaced.<br />
Short-term heat acclimatization leads to sweat appearing at the skin surface, at a lower body<br />
temperature. It increases the maximal sweat volume <strong>and</strong> lowers the salt concentration (Hori, 1995).<br />
22<br />
TABLE 4. PHYSIOLOGY OF HEAT ACCLIMATIZATION<br />
Increased thermal comfort<br />
Core temperature – reduced<br />
Sweating – improved<br />
• Earlier onset<br />
• Higher rate<br />
• Redistribution<br />
• Resistance to hydromeiosis<br />
Skin blood flow – increased<br />
• Earlier onset<br />
• Higher flow<br />
Metabolic rate – lowered<br />
Source: Armstrong, 1998<br />
Increased exercise performance<br />
Cardiovascular stability – improved<br />
• Heart rate – lowered<br />
• Stroke volume – increased<br />
• Blood pressure – better maintained<br />
• Myocardial compliance – increased<br />
Fluid balance – improved<br />
• Thirst – increased<br />
• Electrolyte loss – reduced<br />
• Total body water – increased<br />
• Plasma volume – increased <strong>and</strong> better defence
In addition, acclimatization results in a reduced core temperature threshold for skin vasodilation.<br />
Venoconstrictor tone also increases during the first day of acclimatization (Havenith, 2001b). Short-term<br />
acclimatization gradually disappears over a period of several weeks after the heat stress ends.Table 5 lists<br />
several studies of the time required to gain or to lose short-term heat acclimatization.<br />
In most of these studies, people have spent several hours per day in the environment to which they<br />
were to acclimatize. Comparing the studies directly is difficult, however, because exposure patterns<br />
differ.<br />
In contrast to short-term adaptation, long-term adaptive changes are stable <strong>and</strong> remain for a long period.<br />
Long-term adaptation results in less sweat with a lower salt intake, a lower rise in core temperature <strong>and</strong><br />
a lower increase in heart rate at a given heat load (Hori, 1995).<br />
TABLE 5. STUDIES OF SHORT-TERM HEAT ACCLIMATIZATION<br />
Acclimatization indicator<br />
Acclimatization gain<br />
Sweat rate<br />
Rectal temperature, heart rate<br />
Sweat rate<br />
Heart rate, plasma volume expansion <strong>and</strong><br />
perceived exertion decrease<br />
Renal NaCl decrease<br />
Rectal temperature decrease<br />
Sweat NaCl decrease<br />
Sweat rate increase<br />
Acclimatization loss<br />
Rectal temperature<br />
25% loss of acclimatization<br />
40% loss of acclimatization<br />
50% loss of acclimatization<br />
Heart rate<br />
40% loss of acclimatization<br />
75% loss of acclimatization<br />
90% loss of acclimatization<br />
Sweat rate<br />
65% loss of acclimatization<br />
80% loss of acclimatization<br />
100% loss of acclimatization<br />
Days<br />
3–4<br />
8<br />
< 8<br />
4–5<br />
5–6<br />
6–7<br />
7–8<br />
10–12<br />
7<br />
14<br />
21<br />
7<br />
14<br />
21<br />
7<br />
14<br />
21<br />
Reference<br />
Hori (1995)<br />
Williams & Heyns (1969)<br />
Armstrong & Dziados (1986)<br />
Williams et al. (1967)<br />
3. THE IMPACT OF HEAT ON HUMAN HEALTH<br />
23
3.1. Physiological aspects of temperature regulation<br />
3.1.3.3. Dehydration<br />
Sufficient fluid intake during heat-waves is essential. Dehydration seems to be a critical factor in<br />
contributing to heat mortality, in particular in the frail <strong>and</strong> older populations. The prevalence of<br />
inadequate hydration or dehydration for elderly residents of nursing homes was determined to be 33%<br />
(Colling et al., 1994 <strong>and</strong> Mentes et al., 1999 cited in Mentes & Culp, 2003); 50–92% of nursing homes<br />
residents had inadequate fluid intake (Chidester & Spangler,1997 cited in Mentes & Culp,2003).Patients<br />
in long-term care who were assessed as confused using the Cognitive Assessment Scale,had significantly<br />
lower intake of fluid over 24 hours than lucid patients (Hodgkinson et al., 2003). The presence of<br />
multiple diseases <strong>and</strong>/or treatment puts elderly nursing home residents at risk for dehydration<br />
(Hodgkinson et al., 2003).Alcohol depresses the central nervous system <strong>and</strong> through increased diuresis<br />
can further aggravate dehydration.<br />
Age, mobility <strong>and</strong> functional ability, gender, visual impairment, speaking ability, incontinence <strong>and</strong> the<br />
frequency of ingestion sessions were associated with higher risk of dehydration in 17 reviewed articles<br />
(Hodgkinson et al., 2003). Incontinence was not found to be a statistically significant risk factor for<br />
dehydration. However, it was a risk factor for significantly lower fluid intake compared with continent<br />
subjects (Hodgkinson et al., 2003).<br />
In fact, the insidious state of chronic underhydration becomes a physiological balancing act in which<br />
frail elderly people become increasingly susceptible to minor environmental or physiological stressors<br />
that can precipitate dehydration <strong>and</strong> subsequent acute health problems. The ramifications of chronic<br />
underhydration are further obscured by the fact that, once an elderly individual is hospitalized <strong>and</strong><br />
treated for an acute health crisis such as pneumonia, the antecedent condition of underhydration is<br />
often overlooked (Mentes & Culp, 2003). Strategies for providing adequate fluids (in an experimental<br />
study) included st<strong>and</strong>ardized 180 ml of fluid intake with each medication administration, fluid rounds<br />
in morning <strong>and</strong> evening <strong>and</strong> “happy hours” or “tea time” twice a week in the late afternoon (Mentes &<br />
Culp, 2003).The recommended daily intake of fluids should not be less than 1600 ml per 24 hours to<br />
ensure adequate hydration.<br />
When heat stress levels are low, there is a small chance of hyperhydration (over drinking), leading to<br />
hyponatremia. This typically occurs in young, fit persons participating in sporting events of long<br />
duration.<br />
3.1.3.4. Fitness<br />
Age <strong>and</strong> illness are strong predictors in this sense, as age highly correlates with increasing illness,<br />
disability, drug use <strong>and</strong> reduced fitness. Havenith et al. (1995) found that, in general, the higher the<br />
maximal oxygen uptake (indicating aerobic fitness) of an individual <strong>and</strong>/or the larger the individual, the<br />
lower the heat strain observed in a warm humid climate (air temperature 35 °C, 80% relative humidity).<br />
Physical fitness tends to decrease with age because the average level of physical activity declines. More<br />
strain is placed on the cardiovascular system <strong>and</strong> less cardiovascular reserve is left, because any activity<br />
performed becomes more stressful.The cardiovascular reserve is especially relevant to the capacity for<br />
thermoregulation, as it determines the capacity to move heat for dissipation from the body core to the<br />
skin by blood flow. Decline in fitness can cause a vicious circle, as the increased strain experienced with<br />
activity may promote even further reduction in activity, which again may further reduce fitness. In<br />
addition, exposure to heat <strong>and</strong> cold is avoided, which leads to a loss of acclimatization to heat <strong>and</strong> cold.<br />
At the population level, these <strong>and</strong> other changes reduce muscle strength, work capacity, the ability to<br />
transport heat from the body core to the skin, hydration levels, vascular reactivity <strong>and</strong> cardiovascular<br />
stability (blood pressure) among elderly people.These effects will place elderly people at a higher risk<br />
in extreme conditions, leading to an increase in morbidity <strong>and</strong> mortality (Havenith, 2001a).<br />
24
3.1.3.5. Overweight<br />
Overweight is another factor that increases the risk of heat-related illnesses <strong>and</strong> is often correlated with<br />
low fitness levels.The thermal conductivity of fatty tissues (about 200 W · m –1 · K –1 ) is lower than that of<br />
other tissues in the body (such as muscles, about 400 W · m –1 · K –1 ). Subcutaneous tissue is therefore an<br />
insulative barrier to conductive heat flow. In an obese person, less heat can be produced per unit mass<br />
before the temperature of the core tissues increases.To dissipate heat, obese people have to direct more<br />
blood flow through the subcutaneous vessels, <strong>and</strong> obese people therefore have higher cardiovascular<br />
strain <strong>and</strong> higher heart rates when exposed to heat stress. For these reasons, obese people are more<br />
susceptible to moderate heat stress, injuries <strong>and</strong> heat stroke. However, the difference in heat strain<br />
between obese <strong>and</strong> lean individuals appears to diminish when air temperature exceeds skin<br />
temperature.When environmental temperatures surpass skin temperatures, the lean individual will gain<br />
heat through radiation <strong>and</strong> convection at a quicker rate per unit mass (Anderson, 1999). Havenith et al.<br />
(1995) state that anthropometric measures <strong>and</strong> body composition significantly but secondarily<br />
influence physiological responses,such as mean arterial blood pressure,forearm blood flow <strong>and</strong> forearm<br />
vascular conductance.<br />
3. THE IMPACT OF HEAT ON HUMAN HEALTH<br />
25
3.2. Epidemiological studies of heat<br />
3.2. Epidemiological studies of heat<br />
3.2.1. How should heat episodes be defined?<br />
<strong>Heat</strong>-waves are rare events that vary in character <strong>and</strong> impact even in the same location. Arriving at a<br />
st<strong>and</strong>ardized definition of a heat-wave is difficult;the World Meteorological Organization (WMO) has not<br />
yet defined the term. However, several approaches can be used to define a heat-wave.<br />
A heat-wave can be defined based on an absolute or a relative threshold of weather variables or as a<br />
combination of both. A relative threshold has the advantage of accounting for local differences in the<br />
perception of heat.<br />
A survey of the meteorological services in Europe showed that an operational definition of heat-wave is<br />
applied in some countries.These definitions are based on:<br />
• air temperature threshold; or<br />
• air temperature threshold <strong>and</strong> minimum duration; or<br />
• indices based on a combination of air temperature <strong>and</strong> relative humidity.<br />
The temperature thresholds used in the definitions in Europe have a north–south <strong>and</strong> a west–east<br />
gradient.The more the country is situated in the south-east, the higher the threshold.This was expected,<br />
because summers are usually hotter in southern <strong>and</strong> continental Europe than in the part of Europe that<br />
is influenced by the Atlantic Ocean.<br />
In addition, the length of the summer season <strong>and</strong> the rate of temperature change can be included in the<br />
definition of a heat-wave to be able to incorporate the concept of short-term acclimatization over the<br />
summer.There is good evidence that heat-waves early in the summer have greater effects on heat-related<br />
morbidity <strong>and</strong> mortality than heat-waves later in the summer (Hajat et al., 2002).<br />
3.2.2. How should deaths be attributed to heat episodes?<br />
Ambient thermal conditions are an important type of environmental exposure <strong>and</strong> are responsible for a<br />
quantifiable burden of mortality <strong>and</strong> morbidity.A range of epidemiological methods have been used to<br />
estimate the effect of the thermal environment on mortality <strong>and</strong> morbidity <strong>and</strong> thus estimate<br />
temperature-attributable mortality.<br />
Fig. 5 shows the mean monthly correlation coefficient for the smoothed residuals of perceived<br />
temperature 1 <strong>and</strong> total mortality rate based on 30 years of data from Baden-Württemberg (southwestern<br />
Germany). During the warmest months of the year (June, July <strong>and</strong> August), the correlation coefficient is<br />
between 0.5 <strong>and</strong> 0.7, which indicates that the thermal environment (described by the perceived<br />
temperature) has a relatively high impact on mortality for an environmental factor. The relationship<br />
between temperature <strong>and</strong> mortality <strong>and</strong> morbidity has been studied using different epidemiological<br />
designs, such as descriptive studies on heat-waves, mapping studies, time–series studies, case–control<br />
studies <strong>and</strong> case–crossover studies. Time–series studies are an efficient design for analysing the<br />
relationship between temperature (or other climate parameters) <strong>and</strong> mortality for populations in single<br />
<strong>and</strong> multiple regions over long time periods. These methods are considered sufficiently rigorous to<br />
1 Perceived temperature (°C) is the air temperature of a reference environment in which the perception of heat<br />
<strong>and</strong>/or cold would be the same as under the actual conditions.<br />
26
assess short-term associations (day-to-day <strong>and</strong> week-to-week) between environmental exposure <strong>and</strong><br />
mortality if such factors as the seasonal cycle <strong>and</strong> other long-term trends are adjusted for.Time–series<br />
methods are used to quantify the relationship between mortality <strong>and</strong> temperature across the whole<br />
temperature range.A linear relationship derived from such a time–series study is fitted above <strong>and</strong> below<br />
a threshold temperature where mortality is lowest (Fig. 6).This threshold reflects adaptation to the local<br />
climate (Keatinge et al., 2000).<br />
Fig. 5. Correlation coefficient between the smoothed residuals of perceived temperature (PTm) <strong>and</strong> total<br />
mortality rate in Baden-Württemberg (southwestern Germany), 1968–1997<br />
24<br />
21<br />
18<br />
15<br />
12<br />
9<br />
6<br />
3<br />
0<br />
–3<br />
–6<br />
PTm (°C)<br />
Mean PTm Correlation coefficient<br />
JAN FEB MAR APR MAY JUN JUL AUG SEP OCT NOV DEC<br />
The residuals are the deviation of the daily values from the filtered data (101-day Gaussian filter).<br />
The mortality impact of individual heat-wave events has been estimated using descriptive episode<br />
analyses. Several studies have shown that deaths from heat-related causes in the International<br />
Classification of Diseases are underreported in mortality statistics.A 10-day heat-wave in Athens in 1987<br />
resulted in 926 deaths classified as heat-related.However,the attributable excess mortality was estimated<br />
to be more than 2000 (Katsouyanni et al., 1988).<br />
Many studies estimate or calculate attributable or “excess”mortality from heat episodes.Excess mortality<br />
is estimated by subtracting the “expected”mortality from the observed mortality.The expected mortality<br />
is calculated using a variety of measures, including moving averages <strong>and</strong> averages from similar time<br />
periods in previous years. Estimates are therefore very sensitive to the method used to estimate the<br />
“expected”mortality (Whitmann et al.,1997;Kovats & Koppe,forthcoming).Published studies have used<br />
different methods, <strong>and</strong> this makes comparison difficult (Table 6).<br />
Comparing the results of the various national assessments carried out during the heat-wave in 2003 is<br />
very difficult.For example, preliminary analysis of the 2003 heat-wave in France estimated that it caused<br />
3. THE IMPACT OF HEAT ON HUMAN HEALTH<br />
Correlation coefficient<br />
0.8<br />
0.7<br />
0.6<br />
0.5<br />
0.4<br />
0.3<br />
0.2<br />
0.1<br />
0<br />
–0.1<br />
–0.2<br />
27
3.2. Epidemiological studies of heat<br />
TABLE 6. HEAT-WAVES IN EUROPE: EPISODE ANALYSES<br />
<strong>Heat</strong>-wave<br />
Birmingham, Engl<strong>and</strong>, 1976<br />
London, Engl<strong>and</strong>, 1976<br />
Portugal, 1981<br />
Rome, Italy, 1983<br />
Athens, Greece, 1987<br />
London, Engl<strong>and</strong>, 1995<br />
Source: Kovats & Koppe (forthcoming).<br />
28<br />
Fig. 6. Relationship between maximum daily temperature <strong>and</strong> mortality in a European city<br />
The fitted values<br />
of the predictive<br />
model<br />
(unadjusted)<br />
The crude<br />
mortality<br />
counts<br />
Total mortality<br />
300<br />
250<br />
200<br />
150<br />
100<br />
Attributable mortality<br />
Number of deaths increased by 10%; excess seen primarily in men<br />
<strong>and</strong> women 70–79 years<br />
9.7% increase in Engl<strong>and</strong> <strong>and</strong> Wales <strong>and</strong> 15.4% in Greater London.<br />
Almost two-fold increase in mortality rate among elderly hospital<br />
inpatients (but not other inpatients)<br />
1906 excess deaths (all causes, all ages) in Portugal, 406 in Lisbon<br />
(in July), including 63 heat deaths<br />
65 heat stroke deaths during heat-wave in the Latio region. 35%<br />
increase in deaths in July 1983 compared with July 1982 among<br />
those 65 years or older in Rome<br />
2690 heat-related hospital admissions <strong>and</strong> 926 heat-related deaths,<br />
estimated excess mortality > 2000<br />
619 excess deaths; 8.9% increase in all-cause mortality <strong>and</strong> 15.4% in<br />
Greater London compared with moving average of 31 days for that<br />
period in all age groups<br />
Reference<br />
Ellis et al. (1980)<br />
Lye & Kamal (1977)<br />
Garcia et al. (1999)<br />
Todisco (1983)<br />
Daily temperature (°C)<br />
–10 0 10 20 30<br />
Katsouyanni et al. (1988)<br />
Rooney et al. (1998)
14 802 excess deaths (National Institute of Public <strong>Health</strong> Surveillance, 2003). Similar assessments were<br />
carried out in other countries such as Spain <strong>and</strong> Italy, but the conclusions in these countries were<br />
different. Although more than 6000 excess deaths were informally reported during the heat-wave in<br />
Spain, only 59 were accepted as being caused by the heat-wave (Table7).<br />
3. THE IMPACT OF HEAT ON HUMAN HEALTH<br />
TABLE 7. PROVISIONAL ESTIMATES FOR MORTALITY ATTRIBUTED TO THE HEAT-WAVE IN NOVEMBER, 2003 ACCORDING TO COUNTRY<br />
Country<br />
Engl<strong>and</strong> <strong>and</strong> Wales<br />
France<br />
Italy<br />
Portugal<br />
Spain<br />
a % excess deaths = ([observed – expected]/expected) * 100<br />
Source: Kovats, Wolf <strong>and</strong> Menne, 2004<br />
<strong>Heat</strong>stroke<br />
deaths<br />
<strong>No</strong>t reported<br />
<strong>No</strong>t reported<br />
<strong>No</strong>t reported<br />
7<br />
59<br />
Excess deaths<br />
(%) a ,all ages<br />
2 045 (16%)<br />
14 802 (60%)<br />
3 134 (15%)<br />
2 099 (26%)<br />
Evaluation in<br />
progress<br />
Time period<br />
4 to 13 August<br />
1 to 20 August<br />
1 June to 15 August<br />
1 June to 31 August<br />
Method for estimating<br />
baseline mortality<br />
Average of deaths for same period in<br />
years 1998 to 2002 inclusive<br />
Average of deaths for same period in<br />
years 2000 to 2002<br />
Deaths in same period in 2002<br />
Deaths in same period in 1997–2002<br />
The international literature demonstrates that heat increases death rates from cardiovascular <strong>and</strong><br />
respiratory disease by placing extra stress on an already stressed system – the precipitating event in a<br />
person with chronic disease. Table 8 shows the change in mortality rate from respiratory <strong>and</strong><br />
cardiovascular diseases per 1 °C increase in temperature above the given threshold.<br />
However, the preliminary information from France shows that all-cause mortality increased in the<br />
Central Region of France between 1 <strong>and</strong> 20 August 2003.Among persons older than 75 years, mortality<br />
from heat-related causes such as from heat stroke, dehydration <strong>and</strong> hyperthermia increased most, <strong>and</strong><br />
among those younger than 75 years, mortality related to pre-existing mental problems had the biggest<br />
increase.<br />
During extreme events, a proportion of deaths are likely to have occurred in very ill people, with the<br />
event bringing forward these deaths by a matter of days or weeks. The absolute contribution of this<br />
short-term mortality displacement in terms of premature mortality is very difficult to estimate but has<br />
implications for estimating the burden of disease.<br />
29<br />
Reference<br />
Office for National Statistics<br />
(2003)<br />
National Institute of Public<br />
<strong>Health</strong> Surveillance (2003)<br />
Conti (2003)<br />
Personal communication from<br />
Ministério de Saúde (ministry<br />
of health), Portugal,<br />
17 <strong>No</strong>vember 2003<br />
Ministry of <strong>Health</strong> <strong>and</strong><br />
Consumer Affairs (2003)
3.2. Epidemiological studies of heat<br />
<strong>Heat</strong> is likely to significantly affect nonfatal outcomes. However, few time-series studies have quantified<br />
the effect of heat exposure on hospital admissions or other morbidity indicators.<br />
30<br />
TABLE 8. IMPACT OF TEMPERATURE ON CAUSE SPECIFIC MORTALITY:<br />
PERCENTAGE INCREASE IN DEATHS ABOVE THE THRESHOLD TEMPERATURE (95% CONFIDENCE INTERVALS)<br />
Respiratory<br />
mortality<br />
5.7% (–2.9, 8.2)<br />
3.11%<br />
4.7% (2.2, 7.1)<br />
Cardiovascular<br />
mortality<br />
2.9% (–0.4, 7.4)<br />
1.13%<br />
0.8% (–0.4, 2.0)<br />
Temperature<br />
threshold (°C)<br />
24<br />
16.5<br />
3.2.3. Who is most vulnerable to heat?<br />
10<br />
Population<br />
Valencia, Spain<br />
The Netherl<strong>and</strong>s<br />
Oslo, <strong>No</strong>rway<br />
Reference<br />
Ballester et al. (1997)<br />
Kunst et al. (1993)<br />
Nafstad et al. (2001)<br />
Vulnerability to heat depends on climate factors (such as the frequency of heat-waves) <strong>and</strong> on individual<br />
risk factors, including medical, behavioural <strong>and</strong> environmental factors. Kilbourne (1992, 1999) has<br />
identified as predictive of heat stroke <strong>and</strong> heat-related death <strong>and</strong> illnesses:<br />
• being elderly;<br />
• impaired cognition, such as dementia<br />
• pre-existing disease;<br />
• use of certain medications;<br />
• level of hydration;<br />
• living alone;<br />
• housing (such as living in a certain building type or on a higher floor); <strong>and</strong><br />
• the presence <strong>and</strong> use of air-conditioning in the home or residential institution.<br />
A case–control study after the 1995 Chicago heat-wave confirmed that people at increased risk were:<br />
already ill; confined to bed; unable to care for themselves; isolated; <strong>and</strong> without air-conditioning<br />
(Semenza et al., 1996). More than 60% of the people who died during the 2003 heat-wave in France died<br />
in hospitals, private health care institutions <strong>and</strong> maison de retrait (National Institute of Public <strong>Health</strong><br />
Surveillance, 2003).<br />
Epidemiological studies indicate that risk in men <strong>and</strong> women does not differ significantly. Studies,<br />
however, vary concerning the age at which vulnerability is shown to increase. Most population-based<br />
time–series studies show an effect in adult age groups (Pajares Ortiz et al., 1997), with the effect larger<br />
among people 65 years or older versus other ages (Fig. 7).As these studies used predetermined age for
Fig. 7. Average annual rate of heat-related deaths a per million population in the United States resulting<br />
from weather conditions according to age group, 1979–1997<br />
Rate<br />
5.0<br />
4.5<br />
4.0<br />
3.5<br />
3.0<br />
2.5<br />
2.0<br />
1.5<br />
1.0<br />
0.5<br />
0<br />
Age group (years)<br />
3. THE IMPACT OF HEAT ON HUMAN HEALTH<br />
0.35<br />
0.30<br />
0.25<br />
0.20<br />
0.15<br />
0.10<br />
0.5<br />
0<br />
0–14 15–19 20–24 25–34 35–44 45–54 55–64 65–74 75–84 85<br />
0–4 5–0 10–14<br />
a Underlying cause of death attributed to excess heat exposure classified according to ICD-9 code E900.0 “due to weather conditions (deaths)”.<br />
Source: Centers for Disease Control <strong>and</strong> Prevention (2002).<br />
elderly people, the age at which vulnerability is increased has not been examined in more detail in<br />
various populations.Children <strong>and</strong> infants are at risk of heat-related death (Fig.7).Overall mortality in this<br />
group is very low in industrialized countries. In the United States, less than 4% of all persons dying from<br />
heat caused by weather conditions are aged 4 years of age or younger (Centers for Disease Control <strong>and</strong><br />
Prevention, 2002). Some heat deaths among children are caused by being left in cars on hot days<br />
(Donoghue et al., 1997).<br />
People with lower socioeconomic status may be more vulnerable to heat-related mortality because of<br />
poorer-quality housing <strong>and</strong> a lack of air-conditioning. Populations in more deprived areas within a city<br />
are also more likely to have other risk factors for heat-related death. Several studies that investigated<br />
heat-related mortality rates in different neighbourhoods reveal the importance of socioeconomic factors<br />
(Semenza et al., 1996; Smoyer, 1998a, b). The physical <strong>and</strong> social isolation of elderly people further<br />
increases their vulnerability to dying during a heat-wave (Klinenberg, 2002).<br />
Given the vulnerability to heat of the elderly population, it is important to note that life expectancy <strong>and</strong><br />
the ageing population in Europe are increasing. Germany, Italy <strong>and</strong> Spain have the highest ageing index,<br />
defined as the ratio of the population older than 65 years to that 0–14 years old (Fig. 8).<br />
31<br />
Rate<br />
Age group (years)
3.2. Epidemiological studies of heat<br />
3.2.4. Case study: the health impact of thermal extremes in Madrid, Spain<br />
The distribution of all-cause daily mean mortality in Madrid versus daily maximum outdoor temperature<br />
from 1986 to 1997 shows the usual V-shaped relationship (Fig. 9), with a minimum at 30.8 °C (comfort<br />
temperature).The right branch of the curve has a much steeper slope than the left one.This leads to the<br />
conclusion that heat affects mortality more acutely than does cold (Alberdi et al., 1998). The daily<br />
maximum temperature at which the slope of the relationship between mortality <strong>and</strong> temperature<br />
becomes steeper is 36.5 °C (Díaz et al., 2002a). Days with maximum temperatures above this threshold<br />
are called extremely hot days.The synoptic conditions when extremely hot days occur are in general<br />
situations with low pressure <strong>and</strong> with southerly wind as well as stagnating weather conditions linked to<br />
high-pressure conditions (García et al., 2002).<br />
In Madrid the greatest effect of extremely hot days on mortality is on women older than 75 years (28.4%<br />
increase per 1 °C above 36.5 °C).The increase in cardiovascular mortality is stronger than the increase<br />
from respiratory mortality. For men, the increase in mortality is higher in the age group between 65 to<br />
75 years (14.7% increase per 1 °C over 36.5 °C), but with a higher contribution of mortality from<br />
respiratory diseases (Díaz et al., 2002a). Preliminary results for children under 10 years of age did not<br />
show any statistical association between the occurrence of extremely hot days <strong>and</strong> an increase of daily<br />
mortality in Madrid (for this period).<br />
For Seville the results were very similar (Díaz et al., 2002b) but the heat stress threshold was 41 °C<br />
because the inhabitants of Andalusia’s capital are better adapted to thermal stress.<br />
32<br />
Fig. 8. Ageing index (the ratio of the population older than 65 years to that 0–14 years old) in countries in<br />
the WHO European Region, latest available data for each country<br />
0.1–0.3<br />
0,3–0,5<br />
0.5–0.8<br />
0.8–0.9<br />
0.9–1.2<br />
<strong>No</strong> data<br />
Source: <strong>Health</strong> for All Database of the WHO Regional Office for Europe
A comparison between Madrid <strong>and</strong> Lisbon shows that the threshold for the increase in mortality was<br />
33 °C in Lisbon, <strong>and</strong> the synoptic atmospheric conditions related to extremely hot days were situations<br />
with easterly winds <strong>and</strong> stagnation during high-pressure situations.The impact on mortality associated<br />
with extremely hot days was higher for Lisbon, with 31.1% mortality increase per 1 °C increase versus<br />
21.5% in Madrid (García et al., submitted).<br />
Total mortality<br />
Fig. 9. Relationship between all-cause mortality <strong>and</strong> maximum daily temperature in Madrid, 1986–1997<br />
120<br />
115<br />
110<br />
105<br />
100<br />
95<br />
90<br />
85<br />
80<br />
75<br />
70<br />
0 2 4 6 8 10 12 14 16 18 20 22 24 26 28 30 32 34 36 38 40 42 44 46 48 50<br />
Maximum daily temperature (°C)<br />
Source: Díaz & López Santiago (2003).<br />
3. THE IMPACT OF HEAT ON HUMAN HEALTH<br />
33
4. HEAT HEALTH WARNING SYSTEMS<br />
4.1. Methods used by heat health warning systems<br />
4.2. <strong>Heat</strong> stress indicators<br />
4.3. Public health responses<br />
4.4. Survey of heat health warning systems in Europe<br />
4.5. Case studies<br />
4.6. Recommendations<br />
4.7. Research gaps<br />
4.8. Current research into the development of heat health warning systems<br />
35
4.1. Methods used by heat helth warning systems<br />
4.1. Methods used by heat health warning<br />
systems<br />
One strategy to reduce the current burden of mortality from heat-waves is heat health warning systems<br />
that use weather forecasts to predict heat-related effects on human health.The essential components of<br />
such systems are identifying weather situations that adversely affect human health, monitoring weather<br />
forecasts,implementing mechanisms for issuing warnings when a weather situation that could adversely<br />
affect health is forecast <strong>and</strong> promoting public health activities to prevent heat-related illness <strong>and</strong> death.<br />
Little is currently known about the effectiveness of these systems in reducing heat-related mortality.<br />
Active measures, such as community-based implementation of warning systems to ensure that<br />
vulnerable elderly people are reached <strong>and</strong> that appropriate advice is given,are required.Implementation<br />
will vary according to local circumstances, <strong>and</strong> more evaluation of potential implementation strategies<br />
in Europe is needed.<br />
<strong>Heat</strong> health warning systems are adapted to individual cities <strong>and</strong> therefore vary widely in the methods<br />
used.An effective heat health warning system requires (Auger & Kosatsky, 2002):<br />
• sufficiently reliable heat-wave forecasts for the population of interest (meteorological component);<br />
• robust underst<strong>and</strong>ing of the cause-<strong>and</strong>-effect relationships between the thermal environment <strong>and</strong><br />
health (epidemiological, statistical <strong>and</strong> biometeorological component);<br />
• effective response measures to implement within the window of lead-time provided by the warning<br />
(public health component); <strong>and</strong><br />
• a community that is able to provide the needed infrastructure (public health component).<br />
A heat health warning system first requires identifying weather conditions associated with adverse<br />
effects on health (the heat stress indicator). The accuracy of the weather forecast is important. Falsepositives<br />
may result in resources being wasted, <strong>and</strong> false-negatives represent a missed opportunity for<br />
prevention. Both result in a loss of confidence in the forecasts. As the complexity of the indicator<br />
increases, this increases the likelihood of an incorrect forecast.<br />
An important factor is the timeliness of the warning in relation to the response.The heat stress indicator<br />
should be forecast 12–48 hours in advance to give enough time for the response plan to be<br />
implemented.The maximum lead-time for an extreme heat event is about 2 days, as this is the limit for<br />
current numerical prediction models in accurately forecasting local weather conditions.<br />
36
4.2. <strong>Heat</strong> stress indicators<br />
Many methods are used to identify situations that adversely affect human health.These methods can be<br />
grouped into simple <strong>and</strong> complex approaches. <strong>Heat</strong> health warning systems should take into account<br />
that different populations respond differently to the same weather conditions. The thresholds above<br />
which heat stress conditions become sufficiently hazardous to human health to warrant a health<br />
warning vary between locations depending on their climate. Further, identifying the threshold is a<br />
practical decision <strong>and</strong> therefore subject to a range of other criteria such as credibility, accuracy (for<br />
example, changing the threshold for a warning might improve the sensitivity of a system) <strong>and</strong> cost (for<br />
example, the frequency of triggering a warning influences the cost of the warning system).Thresholds<br />
can be derived from biometeorological studies of human comfort under conditions of high<br />
temperatures <strong>and</strong> high humidity. Thresholds can also be derived from statistical analyses of the<br />
relationship between weather indices <strong>and</strong> mortality.<br />
4.2.1. Simple indices<br />
Simple methods are based on thresholds of air temperature (mean, maximum or minimum) or a<br />
combination of air temperature <strong>and</strong> a measure of humidity, sometimes with consideration of how long<br />
the thresholds are exceeded.Simple methods are easy to calculate <strong>and</strong> forecast.The accuracy of forecasts<br />
based on simple indices using only one or two parameters is therefore relatively high because<br />
uncertainty increases as the numbers of input variables increase. In addition, they are more easily<br />
understood by the general public <strong>and</strong> other stakeholders (such as health service providers).<br />
4.2.1.1. Apparent temperature<br />
The apparent temperature is a measure of relative discomfort from combined heat <strong>and</strong> high humidity. It<br />
was developed by Steadman (1979a, b) <strong>and</strong> is based on physiological studies of evaporative skin cooling<br />
for various combinations of ambient temperature <strong>and</strong> humidity.The apparent temperature equals the<br />
actual air temperature when the dew-point temperature is 14 °C. At higher dew-points, the apparent<br />
temperature exceeds the actual temperature <strong>and</strong> measures the increased physiological heat stress <strong>and</strong><br />
discomfort associated with humidity that is higher than comfortable.When the dew-point is less than 14<br />
°C,the apparent temperature is less than the actual air temperature <strong>and</strong> measures the reduced stress <strong>and</strong><br />
increased comfort associated with lower humidity <strong>and</strong> greater evaporative skin cooling. It does not<br />
account for wind velocity <strong>and</strong> radiation.<br />
4.2.1.2. <strong>Heat</strong> index <strong>and</strong> mean heat index<br />
The United States National Oceanic <strong>and</strong> Atmospheric Administration issues heat warnings for the entire<br />
United States based on the mean heat index.The mean heat index is an average of the heat index from<br />
the hottest <strong>and</strong> coldest times of each day <strong>and</strong> is therefore more representative of the entire 24-hour<br />
period than a single daily maximum value. Forecasts are provided routinely for conditions 3 to 7 days in<br />
advance on the web site of the National Oceanic <strong>and</strong> Atmospheric Administration (Fig. 10).<br />
When severe conditions are forecast within 2 days, the National Oceanic <strong>and</strong> Atmospheric<br />
Administration issues an alert (more severe than a warning) to the public <strong>and</strong> relevant agencies.<br />
4. HEAT HEALTH WARNING SYSTEMS<br />
37
4.2. <strong>Heat</strong> stress indicators<br />
Probability of mean heat index exceeding<br />
4.2.2. Complex indices<br />
Complex indices include all important meteorological <strong>and</strong> physiological parameters that needed to<br />
better describe the physiological heat load: air temperature, water vapour pressure, wind velocity <strong>and</strong><br />
short- <strong>and</strong> long-wave radiant fluxes. The complex methods used in heat health warning systems are<br />
primarily based on synoptic weather classifications (derived from observed meteorological parameters)<br />
<strong>and</strong> heat budget models (which use meteorological parameters to predict physiological heat load).<br />
4.2.2.1. Indices based on heat budget models<br />
Complete heat budget (energy balance) models take all mechanisms of heat exchange into account <strong>and</strong><br />
are therefore thermophysiologically relevant to individual exposures <strong>and</strong> experiences. Most of the<br />
approaches refer to a reference environment in which the perception of cold <strong>and</strong>/or heat would be the<br />
same as under the actual conditions.<br />
Fanger’s predicted mean vote (Fanger, 1970) is the heat load that would be required to restore a state of<br />
comfort.This is evaluated by Fanger’s comfort equation based on a complete heat budget model of the<br />
human body with simple approaches considering skin temperature <strong>and</strong> sweat rate.The predicted mean<br />
vote is still very popular for assessing indoor climate.<br />
Perceived Temperature is used in Germany. The Perceived Temperature is the air temperature of a<br />
reference environment in which the perception of heat <strong>and</strong>/or cold would be the same as under the<br />
actual conditions (Staiger et al., 1997). In the reference environment, the wind velocity is reduced to a<br />
slight draught, <strong>and</strong> the mean radiant temperature is equal to the air temperature. Perceived Temperature<br />
is based on the comfort equation of Fanger <strong>and</strong> uses the predicted mean vote correction of Gagge et al.<br />
(1986) to account more accurately for latent heat fluxes (evaporation). The thermophysiological<br />
38<br />
Fig. 10. Three- to seven-day forecast of mean heat index for Dallas, Texas, USA<br />
Thursday Friday Saturday Sunday Monday<br />
OCT 03 OCT 04 OCT 05 OCT 06 OCT 07<br />
Mean heat index 82 °F 82 °F 76 °F 70 °F 69 °F<br />
100 °F 0% 0% 0% 0% 0%<br />
95 °F 0% 0% 0% 0% 0%<br />
90 °F 1% 1% 0% 0% 0%<br />
85 °F 20% 22% 2% 0% 0%<br />
80 °F 69% 68% 21% 0% 0%<br />
75 °F 94% 94% 62% 15% 7%<br />
70 °F 100% 100% 91% 48% 40%<br />
Source: National Weather Service, National Oceanic <strong>and</strong> Atmospheric Administration (http://www.hpc.ncep.noaa.gov/heat_index.shtml, accessed 29 October 2003).
assessment is made for a st<strong>and</strong>ardized person, referred to as Klima Michel 2 ,who adapts his clothing<br />
between 0.5 <strong>and</strong> 1.75 clo 3 (baseline clothing in July is 1.0 clo).The assessment procedure is designed<br />
for staying outdoors (Jendritzky et al., 2000).<br />
4.2.2.2. Indices based on synoptic approaches<br />
The synoptic approaches are based on the identification of weather types in a given locality. Several<br />
studies have identified that specific weather types (air masses) adversely affect mortality (Kalkstein &<br />
Davis, 1989). Kalkstein extended this approach to warning systems in the 1980s. <strong>Heat</strong> health warning<br />
systems that use this method have now been set up in several cities in the United States, such as<br />
Cincinnati, Dayton, New Orleans, Philadelphia, Phoenix <strong>and</strong> Washington, DC.<br />
The synoptic procedure classifies days that are considered to be meteorologically homogeneous.This is<br />
accomplished by aggregaling days in terms of seven meteorological variables (air temperature, dew<br />
point temperature, visibility, total cloud cover, sea-level air pressure, wind speed <strong>and</strong> wind direction)<br />
measured four times daily (Kalkstein, 1991).<br />
2 The Klima Michel model is a complete heat budget model of the human body based on the comfort equation<br />
by Fanger (1970). Klima Michel is a st<strong>and</strong>ardization required to assess the thermal environment. Klima Michel<br />
is a man who is 35 years old, is 175 cm tall <strong>and</strong> weighs 75 kg.<br />
3 Clo units express clothing insulation. 1.0 clo is equivalent to 0.155 m 2 •K/W.<br />
4. HEAT HEALTH WARNING SYSTEMS<br />
39
4.3. Public health responses<br />
4.3. Public health responses<br />
When a threshold is expected to be exceeded or an oppressive air mass is forecast to arrive, a response<br />
is required.The warning procedures can be one-, two- or three-tiered.A one-tiered system has a single<br />
level of response (yes or no). <strong>No</strong>rth America has many two- or three-tiered warning systems. These<br />
include a “watch” or an “alert” when a particular level of heat stress occurs or is forecast <strong>and</strong> an<br />
emergency (“warning”) stage when the heat stress is projected to exceed the threshold for the active<br />
response plan to be put into action. The Philadelphia system, for example, has a three-step warning<br />
procedure (Fig. 18).The benefit of this multi-staged early warning approach is that response plans are<br />
graded as the confidence in the forecast increases. It provides a maximum 2-day lead-time for<br />
intervention activities.This gives public health officials an opportunity to weigh the costs of response<br />
actions against the risk posed to the public (National Academy of Sciences, 2000: 87).<br />
There are many different levels of response.The basic (passive) response is to issue a warning of high<br />
temperatures (heat stress conditions) through the mass media (television, radio <strong>and</strong> public web sites).<br />
Public warnings are aimed at the wider community to modify the behaviour of individuals <strong>and</strong> to increase<br />
awareness of the dangers connected with heat exposure in order to reduce heat-related impact.<br />
Warnings therefore need to be linked to specific advice on how people recognize the problem <strong>and</strong> what<br />
they should do to protect themselves <strong>and</strong> others. The United States Centers for Disease Control <strong>and</strong><br />
Prevention have issued guidelines for reducing heat-related illness (Box 1).These guidelines summarize<br />
the general advice that is issued throughout <strong>No</strong>rth America, Australia <strong>and</strong> Europe. Nevertheless, the<br />
advice concerning the use of fans might potentially need revision, as in severe heat, fans can add to the<br />
level of heat stress, in particular when ambient humidity is high. On the other h<strong>and</strong> using fans even<br />
when temperature exceeds 35 °C can provide comfort, because normally the increase in evaporative<br />
40<br />
Box 1. Guidelines on preventing <strong>and</strong> managing heat of the United States Centers for Disease Control <strong>and</strong> Prevention<br />
• Drink more fluids (nonalcoholic), regardless of your activity level. Don’t wait until you’re thirsty to drink. Warning: If your<br />
doctor generally limits the amount of fluid you drink or has you on water pills, ask him how much you should drink while the<br />
weather is hot.<br />
• Don’t drink liquids that contain caffeine, alcohol, or large amounts of sugar – these actually cause you to lose more body fluid.<br />
Also, avoid very cold drinks, because they can cause stomach cramps.<br />
• Stay indoors <strong>and</strong>, if at all possible, stay in an air-conditioned place. If your home does not have air-conditioning, go to the<br />
shopping mall or public library – even a few hours spent in air-conditioning can help your body stay cooler when you go back<br />
into the heat. Call your local health department to see if there are any heat-relief shelters in your area.<br />
• Electric fans may provide comfort, but when the temperature is higher than 35 °C, fans will not prevent heat-related illness.<br />
Taking a cool shower or bath or moving to an air-conditioned place is a much better way to cool off.<br />
• Wear lightweight, light-colored, loose-fitting clothing.<br />
• NEVER leave anyone in a closed, parked vehicle.
heat loss is higher than the increase in sensible heat gain. However, intake of liquids must be increased<br />
to avoid dehydration.There is no scientific consensus on the efficacy of fans.<br />
A more active approach includes warning providers of health or welfare service <strong>and</strong> planned intervention<br />
activities being in place.The Philadelphia intervention schedule is one example (Kalkstein, 2001).<br />
• The “buddy” system is promoted: mass-media announcements encourage friends, relatives,<br />
neighbours, <strong>and</strong> other volunteers to make daily visits to elderly people during hot weather.<br />
• The <strong>Heat</strong>line is activated, which provides information <strong>and</strong> counselling to the general public on<br />
avoiding heat stress, by telephone.<br />
• Department of <strong>Health</strong> field teams make home visits to people requiring more attention than can be<br />
provided over the <strong>Heat</strong>line.<br />
• Nursing <strong>and</strong> personal care boarding home interventions: when a warning is issued, these facilities are<br />
informed of the high-risk heat situation.<br />
• Utility service suspension is halted during warm periods.<br />
• Hospital emergency staffing is increased.<br />
• Daytime outreach to homeless people is carried out.<br />
Intervention plans should be best suited to local needs, through coordination between the local health<br />
agencies <strong>and</strong> meteorological officials (Cegnar & Kalkstein, 2000). A comprehensive warning system<br />
should involve multiple agencies, such as: city managers, public health <strong>and</strong> social services workers <strong>and</strong><br />
emergency medical officers.<br />
• Although anyone at any time can suffer from heat-related illness, some people are at greater risk than others. Check regularly<br />
on: infants <strong>and</strong> young children, people aged 65 or older, people who have a mental illness <strong>and</strong> those who are physically ill,<br />
especially with heart disease or high blood pressure.<br />
• Visit adults at risk at least twice a day <strong>and</strong> closely watch them for signs of heat exhaustion or heat stroke. Infants <strong>and</strong> young<br />
children, of course, need much more frequent watching.<br />
If you must be out in the heat<br />
• Limit your outdoor activity to morning <strong>and</strong> evening hours.<br />
• Cut down on exercise. If you must exercise, drink two to four glasses of cool, nonalcoholic fluids each hour. A sports beverage<br />
can replace the salt <strong>and</strong> minerals you lose in sweat. Warning: if you are on a low-salt diet, talk with your doctor before<br />
drinking a sports beverage. Remember the warning in the first “tip” (above), too.<br />
• Try to rest often in shady areas.<br />
• Protect yourself from the sun by wearing a wide-brimmed hat (also keeps you cooler) <strong>and</strong> sunglasses <strong>and</strong> by putting on<br />
sunscreen of SPF 15 or higher (the most effective products say “broad spectrum” or “UVA/UVB protection” on their labels).<br />
4. HEAT HEALTH WARNING SYSTEMS<br />
41
4.4. Survey of heat health warning systems in Europe<br />
4.4. Survey of heat health warning systems<br />
in Europe<br />
National meteorological services in Europe were surveyed by questionnaire to identify heat health<br />
warning systems <strong>and</strong> to evaluate their benefits. The goal of this questionnaire was to underst<strong>and</strong><br />
whether the national services define heat-waves,whether they have heat warning systems <strong>and</strong> how they<br />
work.Questionnaires (Annex 2) were sent to 45 countries in the WHO European Region.<br />
Fifteen countries declared that they had a heat health warning system (Fig. 11,Annex 3). In Germany,<br />
warnings are given only to the health resorts in the southwestern part of the country. In Portugal the<br />
system only covers the district of Lisbon <strong>and</strong> in Italy only the city of Rome.<br />
42<br />
Fig. 11. <strong>Heat</strong> health warning systems (HHWSs) in Europe.<br />
HHWS type 1<br />
HHWS type 2<br />
HHWS type 3 (in capital)<br />
any other kind of heat warming<br />
<strong>No</strong> HHWS<br />
<strong>No</strong> data<br />
4.4.1. Criteria for initiating heat warnings<br />
All countries except Germany use simple weather indices based on temperature <strong>and</strong>/or humidity to<br />
forecast the effects of weather on health (Table 9). Eight countries use simple temperature thresholds<br />
(Azerbaijan, Belarus, Czech Republic, Greece, Latvia, Malta, Serbia <strong>and</strong> Montenegro <strong>and</strong> Spain).Three use<br />
a combination of temperature <strong>and</strong> relative humidity (Romania, The former Yugoslav Republic of
TABLE 9. THRESHOLD CRITERIA FOR RELEASING HOT WEATHER WARNINGS<br />
Country<br />
Temperature threshold<br />
Azerbaijan<br />
Belarus<br />
Czech Republic<br />
Greece<br />
Latvia<br />
Malta<br />
Portugal (district of Lisbon)<br />
Serbia <strong>and</strong> Montenegro<br />
Spain<br />
Romania<br />
The former Yugoslav<br />
Republic of Macedonia<br />
Turkey<br />
Southwestern Germany<br />
Criteria for releasing the warning<br />
40 °C in more than 30% of the territory–42 °C in one region<br />
35 °C<br />
29 °C medium heat stress; 33 °C high heat stress<br />
38 °C<br />
33 °C<br />
40 °C<br />
Daily maximum temperature > 32 °C <strong>and</strong> other parameters<br />
derived from local temperature–mortality relationship<br />
35 °C–20 °C<br />
Temperature <strong>and</strong> humidity threshold<br />
Complex index threshold<br />
Temperature humidity index: (ITU) ≥ 80<br />
ITU = T(°F) – (0.55 – 0.55*RH/100)*(T(°F) – 58)<br />
RH: relative humidity<br />
Increasing heat index (apparent temperature)<br />
Temperature > 27 °C <strong>and</strong> relative humidity > 40%<br />
Maximum perceived temperature > 26 °C<br />
Reference<br />
temperature<br />
<strong>No</strong>t specified<br />
“Air temperature”<br />
“Maximum air temperature”<br />
“Maximum air temperature for<br />
3 consecutive days”<br />
“Air temperature”<br />
“Maximum air temperature”<br />
Maximum temperature<br />
Maximum air temperature<br />
Minimum air temperature<br />
Maximum temperature<br />
Macedonia <strong>and</strong> Turkey), <strong>and</strong> The former Yugoslav Republic of Macedonia uses the mean heat index (see<br />
above). Greece, Latvia <strong>and</strong> Romania use their definition of a heat-wave as the condition for releasing hot<br />
weather warnings.<br />
4. HEAT HEALTH WARNING SYSTEMS<br />
43
4.4. Survey of heat health warning systems in Europe<br />
In southwestern Germany, warnings are given to health resorts when the forecast perceived<br />
temperature exceeds a given threshold (maximum perceived temperature greater than 26 °C).Perceived<br />
Temperature is a complex indicator derived from a complete heat budget model.<br />
The threshold criteria for the Lisbon heat health warning system is 32 °C. The system was initiated<br />
during summer 1999.The basis of this system is the ÍCARO index developed at the National Institute of<br />
<strong>Health</strong>.The model uses a 3-day forecast value of maximum temperature to predict heat-related deaths.<br />
The model output is sent to the National <strong>Health</strong> Directorate <strong>and</strong> the Directorate of Civil Protection (see<br />
below).<br />
In general, warnings are ended when the criteria for releasing the warning are no longer met.<br />
4.4.2. Target population<br />
Warnings are given on different scales.Warnings on the national scale are given in Azerbaijan, Belarus,<br />
Latvia, Serbia <strong>and</strong> Montenegro <strong>and</strong> Turkey.Warning the whole country makes sense in small countries<br />
with homogeneous weather conditions. Belarus <strong>and</strong> Latvia have relatively flat topography. However, a<br />
single warning may not be appropriate for Turkey, which has a heterogeneous climate. The Czech<br />
Republic, Israel, Kazakhstan, Slovenia <strong>and</strong> Spain provide subnational-scale warnings.The remaining heat<br />
warning systems (5 of 15) target the city level.<br />
4.4.3. Lead-times<br />
Table 10 shows the lead-time for the warning.The warning is transmitted to the public between 1 <strong>and</strong><br />
3 days in advance by mass media. Israel has a three-step warning procedure, with the first warning given<br />
2–3 days in advance, a second warning 1 day in advance <strong>and</strong> a third warning 12 hours before the<br />
expected event. In many countries the health or civil protection authorities are informed separately.<br />
4.4.4. Intervention plans<br />
In most countries, the heat health warning systems did not include any intervention apart from issuing<br />
a passive warning to the general public <strong>and</strong> to the local public health agencies. In four countries,<br />
warnings were issued solely through the mass media. In two countries only the health agencies were<br />
informed.<br />
44
TABLE 10. MAXIMUM LEAD-TIME FOR THE HEAT WARNING IN THE EUROPEAN COUNTRIES SURVEYED<br />
Lead-time for the warning<br />
1 day or less<br />
1–2 days<br />
2–3 days<br />
Countries<br />
Czech Republic, Kazakhstan, Latvia, Malta, Serbia <strong>and</strong><br />
Montenegro, Slovenia <strong>and</strong> Turkey<br />
Belarus, southwestern Germany <strong>and</strong> Spain<br />
Israel, Greece <strong>and</strong> Portugal (district of Lisbon)<br />
In Romania, the working day may be shortened or divided into two parts (until 11.00 <strong>and</strong> from 17.00<br />
on).The interventions in Romania focus on protecting workers. Serbia <strong>and</strong> Montenegro has no unique<br />
intervention plan but intervention options include supplying citizens with additional water <strong>and</strong> telling<br />
them to protect themselves from ultraviolet radiation, implemented by public <strong>and</strong> municipal services.<br />
4.4.5. Target groups <strong>and</strong> aim of the warnings<br />
The warnings target the general public in all countries that have heat health warning systems. In Belarus<br />
<strong>and</strong> Romania, warnings target workers <strong>and</strong> employers.<br />
About 20 health resorts in southwestern Germany are warned. Many people visiting these health resorts<br />
are recovering from a serious illness or have chronic cardiovascular disease.<br />
In Azerbaijan, Israel, Kazakhstan <strong>and</strong> Latvia, the warnings also target fire departments to prevent forest<br />
fires.The warning in Serbia <strong>and</strong> Montenegro, apart from its focus on human health, has another focus on<br />
agriculture. In Spain, the warnings aim to “prevent disasters related to very hot temperatures”<br />
4. HEAT HEALTH WARNING SYSTEMS<br />
45
4.5. Case studies<br />
4.5. Case studies<br />
4.5.1. <strong>Heat</strong> health warning system in Rome, Italy<br />
4.5.1.1. Introduction<br />
WHO,WMO <strong>and</strong> the United Nations Environment Programme have collaborated on a project to develop<br />
<strong>and</strong> implement a heat health warning system for Rome as part of a showcase project (Cegnar &<br />
Kalkstein, 2000; Kalkstein, 2000). The Rome system was developed at the University of Delaware in<br />
cooperation with the Lazio <strong>Health</strong> Authority <strong>and</strong> the Italian Meteorological Service.The Department of<br />
Epidemiology is responsible for running the system.The Italian Meteorological Service provides 72-hour<br />
forecasts for five meteorological variables.The system was run in experimental mode in the summers of<br />
2000 <strong>and</strong> 2001.The active phase of the Rome heat health warning system started in summer 2002.<br />
4.5.1.2. Methods<br />
The Rome heat health warning system is based on a synoptic heat stress indicator.The first step was to<br />
describe using recent historic data the current relationship between mortality <strong>and</strong> an extended set of<br />
meteorological parameters in the Rome population (Kalkstein,2000).Daily mortality data were obtained<br />
for a 10-year period from 1987 to 1996.Weather conditions were classified into eight types.The mean<br />
effect of each of these weather types on daily mortality (all causes) was estimated. The greatest effects<br />
on mortality were among people 65 years or older <strong>and</strong> among women (Cegnar & Kalkstein, 2000).Two<br />
types of weather had a statistically significantly higher mean daily mortality among people 65 years or<br />
older:<br />
• dry tropical (frequency 7.0%)<br />
• moist tropical plus (frequency 4.3%).<br />
Dry tropical <strong>and</strong> moist tropical plus are associated with 5–7 excess deaths per day. Box 2 shows the<br />
algorithms for excess mortality when the dry tropical or moist tropical plus air masses are forecast for<br />
the next day. For moist tropical plus air masses, the minimum temperatures are not important <strong>and</strong> the<br />
total heat load is a function of cooling degree hours.<br />
The Italian Meteorological Service provides 72-hour forecasts with all the meteorological variables<br />
necessary to identify whether a “dangerous” air mass is likely to occur within days.The forecast data is<br />
fed into a password-protected web site available to Lazio health officials.<br />
The warning procedure consists of three steps: attention, alarm <strong>and</strong> emergency.The attention warning<br />
is given if an offensive weather type is expected within the following 2 days.The alarm is given if the<br />
weather type is expected within the next 24–48 hours <strong>and</strong> the number of excess death is estimated at<br />
two or more. If the alarm situation persists for more than 2 days, an emergency is declared (Fig. 12).The<br />
risk levels are not based on the numbers of excess deaths predicted because the system tends to<br />
underestimate the negative health effects in terms of mortality.<br />
4.5.1.3. Interventions<br />
The Department of Epidemiology of the Lazio <strong>Health</strong> Authority releases a daily bulletin between May 15<br />
<strong>and</strong> September 15 (Fig. 13). In addition to the state of the warning, the bulletin recommends how to<br />
cope with heat.The bulletin is published daily on the web site of the Department for Social Policies <strong>and</strong><br />
46
Box 2. Algorithm for excess mortality in Rome for dry tropical (DT) <strong>and</strong> moist tropical plus (MT+) air masses<br />
DT air mass a<br />
<strong>No</strong>. of deaths = –45.92 – 0.08*TS + 2.05*DIR + 1.61*AT min+1 + 0.75*AT min+2<br />
R2 = 0.46<br />
TS time of season (days since 14 May)<br />
DIR consecutive days of oppressive air mass (DT or MT+)<br />
ATmin+1 minimum apparent temperature forecast for tomorrow<br />
ATmin+2 minimum apparent temperature forecast for the day after tomorrow<br />
AT apparent temperature derived from temperature, humidity <strong>and</strong> wind speed<br />
MT+ air mass a<br />
<strong>No</strong>. of deaths: –4.84 – 0.13*TS + 0.82*CH +1<br />
R2 = 0.26<br />
CH +1 : cooling hours (hours * degrees above 20 °C) forecast for tomorrow<br />
a Other variables included in the regression analysis were yesterday’s, today’s <strong>and</strong> tomorrow’s maximum temperatures, minimum<br />
temperature, cloud cover, afternoon dew point, cooling degree hours <strong>and</strong> maximum apparent temperature<br />
Fig. 12. Flow chart of the heat warning procedure in Rome<br />
72 hour forecast<br />
Risk situation within the next 3 days<br />
Next day: evalutation if risk situation is still forecast<br />
Excess deaths forecast for the next 2–3 days<br />
More than 2 days of alarm<br />
Sources: Comune di Roma http://www.comune.roma.it/dipsociale/comunicati_stampa/com_warning_system_2003.htm (accessed 29 October 2003) <strong>and</strong> PHEWE<br />
(2003).<br />
4. HEAT HEALTH WARNING SYSTEMS<br />
ATTENTION<br />
ALARM<br />
EMERGENCY<br />
47
4.5. Case studies<br />
<strong>Health</strong> Promotion.In case of an attention,alert or emergency,the bulletin is sent to the Operative Centre<br />
of the Municipality of Rome.The intervention plan is put into action through the local municipality.This<br />
plan consists of alerting the different subjects involved in the imminent risk <strong>and</strong> providing specific<br />
advice for reducing heat-related illnesses (PHEWE, 2003).<br />
48<br />
Fig. 13. Bulletin of the Rome heat health warning system<br />
Source: http://www.comune.roma.it/dipsociale/Downloads/Schede_estate_anziani/scheda%20heat%20warning%20system.pdf, (accessed 29 October 2003).
The target groups for this bulletin are general practitioners, local health care agencies, hospitals <strong>and</strong><br />
health resorts, homes for elderly people, social institutions that take care of elderly people, the mass<br />
media <strong>and</strong> registered individuals.<br />
The guidelines for behaviour in heat-waves were developed in collaboration with the Italian Association<br />
of General Practitioners.<br />
The heat health warning system is also connected with a system of tele-assistance that connects the<br />
homes of registered individuals with an operative centre (active 24 hours per day).This tele-assistance<br />
system provides various types of assistance such as counselling, food <strong>and</strong> drug deliveries, emergency<br />
calls, regular check-in calls <strong>and</strong> activation of assistance networks (social services <strong>and</strong> volunteers).The<br />
first step was to integrate the heat health warning system intervention activities with the tele-assistance<br />
programme, using already existing networks (PHEWE, 2003).<br />
The interventions are aimed at elderly people <strong>and</strong> other susceptible people, such as people suffering<br />
from chronic diseases. To reach these target groups, the following public <strong>and</strong> private institutions <strong>and</strong><br />
organizations were identified to act as mediators between the heat health warning system <strong>and</strong> the<br />
population:<br />
• Italian Association of General Practitioners<br />
• tele-assistance service<br />
• public <strong>and</strong> private nursing homes<br />
• local health authorities <strong>and</strong> public hospitals<br />
• public <strong>and</strong> private volunteer organizations<br />
• private hospitals.<br />
4.4.5.1. Evaluation of the system<br />
Fig. 14 compares the mortality predicted by the heat health warning system with that observed in 2001.<br />
Apart from the warnings made between July 25 <strong>and</strong> August 6, excess mortality was underestimated.One<br />
reason for this might be that the model is run with meteorological data from the airport, which is<br />
situated more than 20 km from the city centre <strong>and</strong> near the sea.The temperatures forecast for the airport<br />
are therefore expected to be lower than the temperatures in the city centre (urban heat isl<strong>and</strong>).<br />
However, the model was calibrated with meteorological data from the airport. So if there was no change<br />
in the relationship between urban temperatures <strong>and</strong> airport temperatures, this fact should not lead to<br />
an underestimation of excess mortality. However, for summer 2003 corrections were introduced to the<br />
raw forecast meteorological data to better represent the local weather conditions in Rome.Temperatures<br />
were corrected based on the differences between the observed <strong>and</strong> predicted values of the previous 24<br />
hours <strong>and</strong> in relation to the model’s predictive bias (PHEWE, 2003).<br />
Alarms were called on 10% of the days in 2000, 22% in 2001 <strong>and</strong> 19% in 2002.<br />
Evaluating the system requires an a priori definition of a heat-wave based on meteorological<br />
observations.The definition used in Rome is based on a combination of maximum apparent temperature<br />
threshold, duration, <strong>and</strong> change in the apparent temperature.<br />
Periods defined with oppressive air masses associated with excess deaths identified by the system<br />
correspond to the longest heat-waves observed, whereas the heat health warning system did not depict<br />
short-lived events, even those events produced excess deaths. Incorporating heat-waves <strong>and</strong> apparent<br />
temperatures into the heat health warning system in future years could help to increase the accuracy<br />
4. HEAT HEALTH WARNING SYSTEMS<br />
49
4.5. Case studies<br />
<strong>and</strong> the sensitivity of the model (PHEWE, 2003).<br />
To evaluate the performance of the system, the following indicators have been calculated:<br />
• sensitivity (ability to detect true alarms):number of days with true alarms/number of days with excess<br />
deaths;<br />
• specificity (ability to detect true non-alarms): number of days with true non-alarms/number of days<br />
without excess deaths; <strong>and</strong><br />
• positive predicted value: total days with true alarms/total days with alarms.<br />
50<br />
Fig. 14. Alarms called by the heat health warning system in Rome in 2001 (yellow bars) compared with<br />
observed mortality <strong>and</strong> maximum apparent temperature<br />
% of excess mortality<br />
50<br />
35<br />
20<br />
5<br />
–10<br />
Source: Michelozzi (2003).<br />
Excess mortality (predicted) Excess mortality (obs.) Max. app. temp.<br />
15/5 4/6 24/6 14/7 3/8 23/8 12/9<br />
Temperature 0 C<br />
Excess mortality was calculated by subtracting the 11-day running mean from the daily value of<br />
mortality. The system shows high specificity (true non-alarms) but low sensitivity (few true alarms<br />
predicted). Sensitivity increases as the observed mortality excess increases: at alarm level from a<br />
sensitivity of 32% to 68% when excess mortality increases from 20% to 50% (PHEWE, 2003).The positive<br />
predicted value is relatively high (0.86), which means few false positives were called between 2000 <strong>and</strong><br />
2002.<br />
The results highlight the need to improve the performance of the system to increase its sensitivity.The<br />
system performed more accurately for events characterized by long periods of oppressive air masses <strong>and</strong><br />
large numbers of excess deaths observed but generally underestimates the actual number of excess<br />
deaths. The system achieved a higher predictive level by including the days defined in the model as<br />
40<br />
35<br />
30<br />
25<br />
20<br />
15<br />
10<br />
5<br />
0
attention level, where an oppressive air mass was predicted for the third day, <strong>and</strong> not necessarily<br />
confirmed in the subsequent forecast. It also became apparent that the definition of alarm <strong>and</strong> attention<br />
levels used was not effective. For 2003, a new classification was developed based solely on predicting<br />
excess deaths <strong>and</strong> oppressive air masses. The highest level of warning (emergency) also takes into<br />
account the persistence of an offensive air mass.The emergency level is called only when an alarm is<br />
predicted for more than two consecutive days (PHEWE, 2003).<br />
In conclusion, a good heat health warning system can reduce mortality, but the effectiveness of the<br />
intervention measures must be formally evaluated. The effectiveness of the interventions will be<br />
evaluated when the system in Rome is in full operation.<br />
4.5.2. The Lisbon heat health warning system – the ÍCARO Project<br />
4.5.2.1. Introduction<br />
The ÍCARO Project was set up as a response to a severe heat-wave in 1981. On 15 June 1981 Lisbon was<br />
the hottest capital in the world.When maximum temperatures reached 43 °C,the number of heat-related<br />
deaths was 63 <strong>and</strong> the number of excess deaths 1906.<br />
4.5.2.2. Methods<br />
The ÍCARO Project defines a heat-wave by means of a temperature threshold of 32 °C combined with a<br />
minimum duration of 2 days.This definition is similar to a definition used in the United States:90 °F (32.2<br />
°C) <strong>and</strong> a minimum duration of 2 days (Paixão & <strong>No</strong>gueira, 2002). For the current implemented model,<br />
the temperature threshold is constant over the summer season (1 May – 30 September), although the<br />
awareness exists that sensitivity weakens in late summer (<strong>No</strong>gueira et al., 1999).A simplified statistical<br />
model is used for the surveillance system, reflecting the period in which the threshold is exceeded (Fig.<br />
15) (Nunes & Castro, 1997).<br />
Fig. 15. Algorithm of the Lisbon heat health warning system<br />
Forecasting model for excess deaths related to heat waves<br />
Y t = C + α ATO (32) t-1 + η t<br />
Y t<br />
Number of consecutive days that the maximum<br />
temperature is over τ until the day t.<br />
Source: <strong>No</strong>gueira & Paixão (2003).<br />
η t<br />
Number of deaths on day t Stationary process ARIMA (1,1)<br />
Accumulated Thermic Overcharge (over threshold τ) until the day t<br />
ATO (τ) t = C - OND (τ) t x Ex (τ) t<br />
Nunes e Canto e Castro (1997)<br />
Excess of the maximum temperature over τ,<br />
on the day t.<br />
4. HEAT HEALTH WARNING SYSTEMS<br />
51
4.5. Case studies<br />
The ÍCARO Index is calculated as follows:<br />
52<br />
(Number of expected deaths with the effect of heat (Yt)/number of expected deaths without the<br />
effect of heat) –1<br />
The “number of expected deaths without the effect of heat”is the average summer (here including from<br />
1 May to 31 August) mortality without heat-wave days (Paixão & <strong>No</strong>gueira, 2002).An ÍCARO Index of 0<br />
therefore means that heat has no effect on mortality <strong>and</strong> an ÍCARO Index of 1 that the mortality risk<br />
from heat is doubled.<br />
4.5.2.3. Interventions<br />
The partnership supporting the heat health surveillance system is an integrated functional set of<br />
institutions interested in health <strong>and</strong> saving lives: the Portuguese National Institute of <strong>Health</strong>, the<br />
Portuguese Meteorological Institute,the Portuguese General <strong>Health</strong> Directorate <strong>and</strong> the Portuguese Civil<br />
Protection Service (Fig. 16) (Garcia et al., 1999).<br />
The ÍCARO Index has four different levels with different effects on excess mortality (Table 11).The first<br />
<strong>and</strong> second levels of the ÍCARO Index (< 0.31) do not require any special intervention. If the ÍCARO<br />
Index reaches the third level, an announcement is made that a heat-wave may arrive within the next few<br />
days. The alert triggers intervention measures that are within the responsibility of the Portuguese<br />
General <strong>Health</strong> Directorate <strong>and</strong> the Portuguese Civil Protection Service. For instance, the public health<br />
emergency telephone line is used as a heatline <strong>and</strong> reinforced with nursing personnel when there is a<br />
heat-wave warning.<br />
Fig. 16. Flow chart of the Lisbon heat health surveillance system<br />
Source: <strong>No</strong>gueira (2003).<br />
PORTUGUESE METEOROLOGICAL INSTITUTE<br />
Centre for the Analysis <strong>and</strong> Forecasting of Weather<br />
3-day forecast of maximum air temperature<br />
PORTUGUESE NATIONAL INSTITUTE OF HEALTH<br />
Dr. Ricardo Jorge<br />
ONSA<br />
PORTUGUESE NATIONAL HEALTH OBSERVATORY<br />
Impact of the forecast maximum temperature is<br />
determined by a statistical model<br />
PORTUGUESE GENERAL HEALTH<br />
DIRECTORATE<br />
SARA<br />
ALERT AND ADEQUATE ANSWER SYSTEM<br />
ÍCARO<br />
Index report<br />
PORTUGUESE CIVIL<br />
PROTECTION SERVICE
4.5.2.4. Evaluation<br />
The surveillance system has been evaluated comparing predicted <strong>and</strong> observed mortality for the summers<br />
of 1999 <strong>and</strong> 2000 (<strong>No</strong>gueira, 2000a, b) (Fig. 17). Mortality was well predicted for the first heat-wave in<br />
summer 1999. However, some discrepancy still remains between observed <strong>and</strong> predicted values for the<br />
heat-waves. wich followed. Even when the threshold for the ÍCARO Project was not exceeded, relatively<br />
high indices were observed.This was especially the case in early summer, which leads to the conclusion<br />
that a moving threshold for the system might be more suitable than the fixed threshold of 32 °C.<br />
TABLE 11. THRESHOLDS OF THE LOWER LIMIT OF THE 95% INTERVAL OF THE ÍCARO INDEX<br />
Threshold<br />
< –0.31<br />
–0.31–0.31<br />
0.31–0.93<br />
> 0.93<br />
Source: <strong>No</strong>guiera et al. (1999).<br />
Effect on mortality<br />
<strong>No</strong> effect on mortality<br />
<strong>No</strong> significant effect on mortality<br />
Effect on mortality is probable<br />
<strong>Heat</strong>-wave alert<br />
Fig. 17. Comparison between the observed ÍCARO Index (red line) <strong>and</strong> predicted ÍCARO Index (blue line),<br />
summer 1999<br />
0.8<br />
0.6<br />
0.4<br />
0.2<br />
0<br />
–0.2<br />
–0.4<br />
–0.6<br />
20-04-1999<br />
30-04-1999<br />
Source: <strong>No</strong>gueira & Paixão (2003).<br />
10-05-1999<br />
20-05-1999<br />
30-05-1999<br />
09-06-1999<br />
19-06-1999<br />
29-06-1999<br />
09-07-1999<br />
19-07-1999<br />
29-07-1999<br />
08-08-1999<br />
18-08-1999<br />
28-08-1999<br />
07-09-1999<br />
17-09-1999<br />
27-09-1999<br />
4. HEAT HEALTH WARNING SYSTEMS<br />
07-10-1999<br />
17-10-1999<br />
53
4.5. Case studies<br />
4.5.3. Philadelphia Hot Weather <strong>Health</strong> Watch/Warning System<br />
4.5.3.1. Introduction<br />
Philadelphia has experienced several major heat-waves, most recently in 1995 <strong>and</strong> 1999. The<br />
Philadelphia Hot Weather <strong>Health</strong> Watch/Warning System was initiated in 1995 <strong>and</strong> was one of the first<br />
systems to be operational based on synoptic indices of heat stress (Kalkstein et al., 1996; Sheridan &<br />
Kalkstein, 1998).<br />
The method that identifies dangerous situations is the same as for the Rome system.The Philadelphia<br />
system uses the maximum apparent temperature to predict the number of excess deaths attributable to<br />
the hot weather on a given day.<br />
4.5.3.2. Methods<br />
The Philadelphia system is a three-tiered system (Fig.18).A watch,an alert <strong>and</strong> then a warning are issued<br />
depending on the weather conditions forecast. In the final tier, there are three levels of health warnings,<br />
<strong>and</strong> these depend on the number of excess deaths predicted by the model.<br />
Web-based forecast tools are employed within these systems for ease of communication across varied<br />
agencies. Initial forecasting, up to 48 to 60 hours in advance, proceeds automatically via electronically<br />
transmitted digital forecast information. Meteorologists may then update expected conditions at any<br />
time, leading to a re-evaluation of the oppressiveness of the forecast.<br />
4.5.3.3. Interventions<br />
Philadelphia has a very elaborated set of heat health intervention activities that become effective<br />
anytime the United States National Weather Service calls a heat warning.The Philadelphia intervention<br />
plan is unique because of its coordination between different agencies, both public <strong>and</strong> private. The<br />
Philadelphia Department of Public <strong>Health</strong> maintains very close relationships with the Philadelphia<br />
Corporation for Aging, a private organization that plays a major role when a warning is called (Kalkstein,<br />
2002).<br />
The following intervention activities are in place in Philadelphia.<br />
• The mass media publicize both the weather conditions <strong>and</strong> information on how to avoid heat-related<br />
illnesses.<br />
• The mass media encourage friends, relatives <strong>and</strong> neighbours to make daily visits to elderly people.<br />
• The city identifies block captains.They recruit citizens who have agreed to assist neighbours.The city<br />
trains block captains, who are sent information to assist them in dealing with heat problems in the<br />
neighbourhood.<br />
• A <strong>Heat</strong>line is operated in conjunction with the Philadelphia Corporation for Aging to provide<br />
information <strong>and</strong> counselling.The <strong>Heat</strong>line number is publicized by the mass media <strong>and</strong> also on a highvisibility<br />
display seen over a large area of the Philadelphia city centre.<br />
• Department of Public <strong>Health</strong> mobile field teams make home visits to people requiring more attention<br />
than can be provided over the <strong>Heat</strong>line but still not requiring emergency intervention.<br />
• The Department of Public <strong>Health</strong> contacts nursing homes <strong>and</strong> other facilities to inform them of the<br />
high-risk heat situation <strong>and</strong> to offer advice on protecting residents.<br />
54
Fig. 18. Schematic of the warning procedure of the three-tiered heat health warning system in Philadelphia<br />
<strong>No</strong> further action required<br />
Terminate watch<br />
<strong>No</strong> further action required<br />
Maintain alert<br />
Source: World Meteorological Organization (1999).<br />
DATA INPUT: 5 variables every 6 hours / 24-hour <strong>and</strong> 48-hour forecasts<br />
48-hour synoptic index category estimation<br />
Does day belong to offensive category?<br />
• The utility company <strong>and</strong> water department halt service suspensions during warning periods.<br />
• The Fire Department Emergency Medical Service increases staffing.<br />
• There is daytime outreach for homeless people.<br />
• The Department of Public <strong>Health</strong> has the capability to move people at high risk out of dangerous<br />
living situations to an air-conditioned (overnight) shelter facility.<br />
• Senior centres extend their hours of operation.<br />
<strong>No</strong><br />
<strong>No</strong><br />
<strong>No</strong><br />
<strong>Health</strong> Watch is issued<br />
24-hour synoptic index category estimation<br />
Does day belong to offensive category?<br />
Level 1<br />
1–4 excess<br />
deaths<br />
Level 2<br />
5–14 excess<br />
deaths<br />
During summer 2002, the <strong>Heat</strong>line was called over 2300 times. In about 25% of the cases, the person<br />
calling in was referred to a nurse, who gave the individual more specific information to lessen the<br />
caller’s stress. A few cases (64) were severe enough to dispatch a mobile team to the home of the<br />
distressed person (Kalkstein, 2002).<br />
Yes<br />
<strong>Health</strong> Alert is issued<br />
Yes<br />
Mortality predicted from offensive category algorithm<br />
Is elevated mortality predicted?<br />
Yes<br />
<strong>Health</strong> Warning is issued (three levels)<br />
4. HEAT HEALTH WARNING SYSTEMS<br />
Level 3<br />
>14 excess<br />
deaths<br />
55
4.5. Case studies<br />
4.5.3.4. Evaluation of the system<br />
Philadelphia’s system is probably the most advanced anywhere in the world. Most studies evaluating<br />
systems have therefore addressed the Philadelphia system.<br />
Kalkstein et al. (1996) described the first year the system was running (1995), which fortuitously was<br />
also the year of a major heat-wave. The algorithm predicted a total of 163 excess deaths due to<br />
oppressive air masses occurring on 15 days.According to the criteria,level 2 <strong>and</strong> level 3 warnings should<br />
have been issued on 12 <strong>and</strong> 3 days,respectively.The Department of Public <strong>Health</strong> issued actual warnings<br />
on only 9 of these days because the National Weather Service did not concur.<br />
The number of reported deaths caused by heat was 72 for the whole year, <strong>and</strong> 32 heat deaths occurred<br />
during the particular heat episodes of 13–15 July <strong>and</strong> 2–5 August when warnings were issued.Thus, the<br />
system did forecast deaths at times when they actually did occur (during the period of highest<br />
temperatures). These outcomes cannot be compared directly. The Philadelphia model predicts excess<br />
deaths (all ages <strong>and</strong> all causes) <strong>and</strong> not certified heat deaths. The excess deaths during a heat-wave<br />
always exceed the certified heat-related deaths.Deaths were predicted for the Greater Philadelphia area,<br />
<strong>and</strong> the certified heat deaths were only from the city of Philadelphia.Clearly,the systems did not prevent<br />
all the heat deaths that occurred.There is no way of estimating whether more heat deaths may have<br />
occurred in the absence of the warning.<br />
The Philadelphia system over-predicted excess mortality by a considerable margin in early <strong>and</strong> mid-<br />
August in 1995 (Kalkstein et al., 1996). One reason may be that the late-season episodes have fewer<br />
effects because of acclimatization or the loss of susceptible people.Alternatively, the system may have<br />
been effective in reducing mortality.<br />
4.5.3.5. Evaluation of the interventions<br />
Teisberg et al. (in press) evaluated the Philadelphia system in more detail.They calculated the costs of<br />
the Philadelphia system <strong>and</strong> the benefits in reducing mortality among people 65 years or older, the age<br />
group assumed to be at highest risk.The value of a statistical life was calculated as follows.First,the value<br />
to relevant individuals of small reductions in their individual mortality risk was estimated. Second, these<br />
values were summed over the affected population. Third, the mortality risk over the population was<br />
summed.The value of a statistical life is the sum the population is willing to pay divided by the expected<br />
number of deaths in the population. Its unit is money per life saved.<br />
One problem of this method is whether the value of a statistical life is lower for older people or for<br />
people with health problems. Both groups of people have a relatively high risk of dying during a heatwave.As<br />
cited in Teisberg et al. (in press), older people value reducing mortality less highly but not<br />
people with serious illness. For this reason, the authors estimate the value of a statistical life to be about<br />
US$ 4 million per life saved by the Philadelphia system (versus about US$ 6 million among people<br />
younger than 65 years).<br />
Excess mortality among people 65 years of age <strong>and</strong> older was defined as the reported mortality minus<br />
the mortality predicted by a historical trend line developed over the period 1964–1988. Based on linear<br />
regression analysis,Teisberg et al. (in press) found out that issuing a warning during a heat-wave saves<br />
about 2.6 lives for each warning day <strong>and</strong> for 3 days after the warning ended. Two variables were<br />
convincingly associated with mortality: the time of season when a particular heat-wave started <strong>and</strong> a<br />
warning variable indicating whether or not a heat-wave warning had been issued. An issue in this<br />
analysis is the small R 2 of 0.04 <strong>and</strong> the t of –1.43, which means that the probability of such a benefit by<br />
chance is about 8%, which is relatively high. However, the numbers were very small, so achieving<br />
statistical significance was not likely.The low R 2 implies that most of the variation in excess mortality is<br />
attributed to variables not included in the model, as would be expected.<br />
56
Between 1995 <strong>and</strong> 1998, warnings were issued on 21 days, <strong>and</strong> the 24 days following a warning were<br />
included in the regression model. Philadelphia’s system was therefore assumed to have saved the lives<br />
of 117 people.Assuming a value of US$ 4 million per life saved, the gross benefits of the Philadelphia<br />
heat health warning system were in the order of US$ 468 million, or US$ 117 million per year. As a<br />
reduction in morbidity was not included in the model, the heat health warning system had an additional<br />
benefit.<br />
Part of the monetary costs of the system are indirect costs.These indirect costs arise from actions taken<br />
by city employees as a normal part of their jobs <strong>and</strong> actions taken by volunteers.These indirect costs<br />
have not been estimated.<br />
The direct costs emerge from the <strong>Heat</strong>line <strong>and</strong> additional emergency medical service <strong>and</strong> are estimated<br />
to be about US$ 300 000 for the whole period of 1995–1998, or US$ 75 000 per year. Compared with<br />
the US$ 468 million dollars in benefits, these costs are very low. Nevertheless, estimating the indirect<br />
costs would be important in order to get a realistic estimate.<br />
In 2002 the costs of single intervention measures were estimated again (Table 12) (Kalkstein, 2002).The<br />
total costs per year amount to about US$ 115 000.In addition to the annual costs,the costs of developing<br />
the system are between US$ 50 000 <strong>and</strong> US$ 60 000.<br />
TABLE 12. COSTS OF SINGLE INTERVENTION MEASURES IN 2002 IN PHILADELPHIA<br />
Intervention measure<br />
<strong>Heat</strong>line<br />
Issuance of fans<br />
Extended hours of senior centres<br />
Mobile teams<br />
Extended hours of the emergency<br />
medical services of the Fire<br />
Department<br />
Total per year<br />
Source: adapted from Kalkstein (2002).<br />
Cost per unit<br />
(US$)<br />
2 950 (weekend)<br />
1 220 (weekdays)<br />
13 (per fan)<br />
357–476 (weekend)<br />
156 (weekday)<br />
4 000<br />
Total summer<br />
2002 (US$)<br />
25 000<br />
7 000<br />
3 000<br />
4 000<br />
76 000<br />
115 000<br />
Remarks<br />
Salaries: US$ 19 000<br />
Rest: meals, phone use, etc.<br />
4. HEAT HEALTH WARNING SYSTEMS<br />
57
4.6. Recommendations<br />
4.6. Recommendations<br />
4.6.1. Implementation of heat health warning systems<br />
Based on the experience of existing heat health warning systems,several recommendations can be made<br />
for the implementation of such systems.<br />
One of the key questions is where heat health warning systems should be set up.Although countries in<br />
southern Europe <strong>and</strong> the Balkans are more frequently subject to heat-waves,the populations of southern<br />
European countries have adapted to hot weather to some extent. However, countries in northern <strong>and</strong><br />
central Europe might be less well adapted <strong>and</strong> may thus be vulnerable when an extreme event occurs.<br />
In addition, current evidence suggests that heat health warning systems could be set up in major cities<br />
but also should cover rural areas.<br />
National meteorological services <strong>and</strong> health ministries should have joint responsibility for implementing<br />
heat health warning systems.This ensures rapid flow of information <strong>and</strong> combines the competencies of<br />
the meteorological <strong>and</strong> health staff involved in the warning system. Good coordination between the<br />
meteorological agency <strong>and</strong> health ministry is necessary. <strong>Heat</strong> health warning systems should speak with<br />
“one voice”.At the country <strong>and</strong> local level, it might be further discussed which other institutions should<br />
be involved to ensure proper intervention planning.<br />
In addition, a structure should be set up to ensure that all agencies involved have funding, with regular<br />
meetings between agencies to retain interest in the issue.The loss of funding for one of the involved<br />
agencies poses the danger of a loss of knowledge <strong>and</strong> interruption of the information flow if the agency<br />
has to leave the heat health warning system.<br />
Because climate <strong>and</strong> culture differ within Europe, heat health warning systems should be developed to<br />
fit the local setting. One very important aspect is to adjust information flow <strong>and</strong> intervention measures<br />
to the local needs <strong>and</strong> the available infrastructure. However, having some st<strong>and</strong>ardization across systems<br />
to facilitate comparison <strong>and</strong> knowledge transfer would be beneficial. Regional coherence is required so<br />
that warnings are consistent from one town to the next.<br />
4.6.2. Method of warning<br />
Another key question is when to issue a warning. This question is related to the identification of a<br />
warning indicator related to the health impact of the thermal environment.There are many possibilities<br />
for such indicators,but few reflect the physiological relevance of the thermal environment.The warning<br />
indicator must be based on data that is easily available for the region of interest.Independent of the heatwave<br />
indicator chosen,more than one level of warning is needed.A buffer zone should be placed around<br />
oppressive conditions, as a false-negative might influence severely the credibility of the system <strong>and</strong> be<br />
worse than a false-positive in some cases.<br />
The thresholds of the warning indicator should allow for adaptation to be included combining a relative<br />
(local) <strong>and</strong> an absolute component. This ensures that, even under nonstationary climatic conditions<br />
(climate change <strong>and</strong> climate variability), thresholds <strong>and</strong> warning indicators will not have to be changed.<br />
The thresholds should be based on a probability (risk) approach to avoid predicting the actual numbers<br />
of deaths.<br />
58
4.6.3. Advice during heat events<br />
<strong>No</strong>t only the heat health warning system as a whole but also the heat advice messages <strong>and</strong> the way they<br />
are delivered should be adapted to the social <strong>and</strong> behavioural context for the target population,<br />
especially with regard to northern, southern <strong>and</strong> eastern Europe. Different heat advice messages can be<br />
given to the different target groups.A message that is harmonized with the needs of the target group<br />
ensures that they underst<strong>and</strong> the message <strong>and</strong> can implement the advice given. Even if using new ways<br />
to deliver messages is advisable, such as the Berlin subway messaging system, information paths should<br />
be used that are appropriate to the various target groups. For example, e-mail or SMS may not reach as<br />
many elderly people as desired.<br />
As the advice given during a heat-wave should be contextual to place <strong>and</strong> include cultural<br />
considerations, more detailed advice will be needed for the populations in northern Europe that are not<br />
used to heat than in populations that are used to coping with heat.<br />
The warnings should be targeted to the whole population, with special emphasis on the groups which<br />
are more vulnerable <strong>and</strong> on the institutions <strong>and</strong> organization responsible for their welfare:<br />
• families with small children<br />
• elderly people<br />
• ill people<br />
• tourists (in several languages)<br />
• people who have to work outdoors.<br />
In addition, the warnings should be sent to institutions, such as health service providers, organizers of<br />
sport events <strong>and</strong> care workers. Warnings should be communicated to electricity providers to avoid<br />
power failure.<br />
During periods of severe heat, not only the heat itself affects human health but also ultraviolet radiation,<br />
ozone <strong>and</strong> other air pollutants that are directly or indirectly related to the weather conditions.To avoid<br />
many separate warnings <strong>and</strong> advice, the advice about heat should be linked to advice about protection<br />
against ultraviolet radiation <strong>and</strong>, if appropriate, air pollutants, such as ozone.<br />
4.6.4. Education <strong>and</strong> training<br />
Educational strategies are very important to raise the awareness of the hazard, so that the population is<br />
prepared when a heat-wave occurs. The following aspects should be considered for a long-term<br />
educational <strong>and</strong> health promotion strategy.<br />
• At the community level, develop <strong>and</strong> distribute guidelines for each target group, such as schools,<br />
residential care homes, tourist resorts, clinics <strong>and</strong> hospitals.<br />
• Provide information on such aspects as when fan use is appropriate, when to open windows <strong>and</strong><br />
when to use window shades (see also section 5.5 on the indoor environment).<br />
4. HEAT HEALTH WARNING SYSTEMS<br />
59
4.6. Recommendations<br />
4.6.5. Emergency planning<br />
Current evidence indicates that government services <strong>and</strong> health agencies are poorly prepared for severe<br />
heat-waves. <strong>Heat</strong> is not perceived as a problem at the government level. Since the measures required to<br />
mitigate heat effects are mostly simple, the government services sometimes underestimate the health<br />
risks. <strong>Heat</strong>-waves are often accompanied by power failures <strong>and</strong> failures in water supply. Severe heatwaves<br />
should therefore be included in emergency planning at the local <strong>and</strong> national level.<br />
4.6.6. Recommendations on the evaluation of heat health warning systems<br />
The review has shown that few evaluations of heat health warning systems have been undertaken.This<br />
information should be used for planning, implementing <strong>and</strong> ongoing evaluation. An evaluation should<br />
assess whether the system is serving a useful public health function <strong>and</strong> meeting the system objectives.<br />
First, the objectives of the system must be clearly described before the system is set up. Then the<br />
mechanisms for collecting the data needed for evaluating <strong>and</strong> monitoring the system also need to be<br />
established as the system is implemented.<br />
The following steps should be taken to be able to evaluate a heat health warning system.<br />
1. Describe the public health importance of “heat”.<br />
2. Describe the system to be evaluated:<br />
• objectives of the system<br />
• administrative structure of the system <strong>and</strong> agencies<br />
• scientific basis for the system<br />
• components <strong>and</strong> operation of the system<br />
• a flow chart of the system.<br />
3. Public health usefulness of the system:<br />
• what actions are initiated in response to the warning(s) <strong>and</strong> who is responsible for these<br />
• if actions are not implemented, give the reason(s)<br />
• list other anticipated responses to be linked to the warning.<br />
4. Describe the resources used to operate the system:<br />
• the costs of setting up the system (initial costs)<br />
• the annual cost of maintaining the system, including indirect costs<br />
• the estimated direct cost per warning or level of warning.<br />
5. Evaluate the system for each of the following attributes:<br />
• transparency<br />
• integrity<br />
• acceptability<br />
• communication<br />
• effectiveness<br />
• sensitivity <strong>and</strong> specificity<br />
• timeliness<br />
• sufficiency of the system.<br />
6. Evaluate the specific measures for each of the following attributes:<br />
• acceptability or credibility<br />
• timeliness<br />
• effectiveness.<br />
60
4.7. Research gaps<br />
Several research gaps were identified during the cCASHh Workshop on Vulnerability to Thermal Stresses.<br />
• The role of minimum, maximum or daily mean thermal conditions for heat-related mortality <strong>and</strong><br />
morbidity is still unclear <strong>and</strong> difficult to distinguish because the meteorological parameters are<br />
closely correlated.<br />
• The effectiveness of heat health warning system <strong>and</strong> associated interventions to be evaluated.<br />
• The responses of elderly people <strong>and</strong> other vulnerable groups to heat need to be better understood:<br />
– physiological effects<br />
– role of behaviour in responding to higher ambient temperatures<br />
– development of appropriate heat advice messages.<br />
• The use of appropriate risk reduction measures, such as cooling facilities in hospitals, needs to be<br />
assessed for their effectiveness.<br />
4. HEAT HEALTH WARNING SYSTEMS<br />
61
4.8. Current research into the development of heat health warning systems<br />
4.8. Current research into the development of heat<br />
health warning systems<br />
Two research projects are currently developing appropriate methods for heat warnings. One is the<br />
Assessment <strong>and</strong> Prevention of Acute <strong>Health</strong> Effects of Weather Conditions in Europe project funded by<br />
the European Union <strong>and</strong> the other is the World Meteorological Organization (WMO) Expert Team on<br />
Operational <strong>Heat</strong>/<strong>Health</strong> Warnings.<br />
4.8.1. Assessment <strong>and</strong> Prevention of Acute <strong>Health</strong> Effects of Weather Conditions in Europe<br />
As the climate criteria for issuing warnings are often arbitrary <strong>and</strong> not based on the actual relationships<br />
between climate <strong>and</strong> human health, heat stress warning systems need to be developed for European<br />
cities that are based on sound principles <strong>and</strong> well-defined relationships between heat stress <strong>and</strong><br />
mortality <strong>and</strong> morbidity. This is the aim of the Watch Warning System (WWS) work package of the<br />
European Union Fifth Framework Programme project entitled Assessment <strong>and</strong> Prevention of Acute<br />
<strong>Health</strong> Effects of Weather Conditions in Europe (PHEWE).<br />
The overall aim of the WWS work package is to develop air mass–based heat stress watch warning<br />
systems for five European cities (London, Paris, Barcelona, Rome <strong>and</strong> Budapest) that can be applied to<br />
mitigate heat-related death <strong>and</strong> illness.The related objectives are:<br />
• to develop a generic air mass classification system for the target cities <strong>and</strong> construct city-specific air<br />
masses based on statistical algorithms that will form the scientific basis of the WWS for the prediction<br />
of heat-related death <strong>and</strong> illness (the algorithms will describe the relationship between daily mortality<br />
(morbidity) <strong>and</strong> a range of st<strong>and</strong>ard <strong>and</strong> derived (rate of change <strong>and</strong> antecedent) daily meteorological<br />
<strong>and</strong> human energy balance-based heat stress index variables);<br />
• to design a set of generic <strong>and</strong> city-specific mitigation measures for the reduction of heat stress–related<br />
mortality <strong>and</strong> morbidity as an integral part of a WWS for each city;<br />
• to formulate protocols for implementing a WWS; <strong>and</strong><br />
• to install <strong>and</strong> undertake a ghost trial of the WWS for each target city <strong>and</strong> thus an evaluation of the<br />
potential effectiveness of the WWS <strong>and</strong> associated mitigation measures.<br />
In achieving the final WWS, four linked stages of work will be undertaken.<br />
62<br />
1. Statistical algorithm development. Analyses leading to algorithm development will be based on<br />
stratified <strong>and</strong> unstratified daily mortality (morbidity) data. Stratification, according to population<br />
characteristics <strong>and</strong> air mass types,represents an innovative aspect of the method,as it is believed that<br />
vulnerability to heat stress–related death <strong>and</strong> illness depends on the interaction between population<br />
characteristics <strong>and</strong> offensive air mass types. To develop scientifically transparent <strong>and</strong> user-friendly<br />
prediction algorithms, relationships between air masses, weather <strong>and</strong> health will be modelled using<br />
st<strong>and</strong>ard linear regression, although the utility of more advanced techniques such as cluster analysis<br />
<strong>and</strong> regression tree analysis will be assessed. A range of forecasts, including binary, continuous,<br />
multicategory <strong>and</strong> probability forecasts, will be produced.<br />
2. Algorithm predictability.Algorithm predictability <strong>and</strong> final model choice(s) will be established<br />
using a range of quantitative forecast skill scores <strong>and</strong> cross-validation.<br />
3. System operation protocols <strong>and</strong> mitigation measures. Visits will be made to the five target cities:<br />
(a) to assess the c<strong>and</strong>idature of potential WWS operators in the target cities, (b) to develop a set of<br />
generic <strong>and</strong> city-specific guidelines for WWS operation, (c) to identify WWS operator training needs,
(d) to design generic <strong>and</strong> city-specific intervention plans that can be operationalized for the<br />
mitigation of heat-related mortality <strong>and</strong> morbidity <strong>and</strong> (e) to develop WWS installation <strong>and</strong> testing<br />
guidelines. Workshop attendees are expected to be from stakeholder institutions such as health<br />
authorities <strong>and</strong> meteorological <strong>and</strong> emergency services in the target cities.<br />
4. System installation <strong>and</strong> testing. WWS will be installed on a web site to facilitate a single summer<br />
(2004) ghost trial of the WWS. <strong>Health</strong> outcomes will be predicted <strong>and</strong> virtual warnings issued to the<br />
agency identified as responsible for implementing the WWS. The WWS stakeholder agencies will<br />
evaluate their ability to respond to the warning <strong>and</strong> to implement the intervention plans by selfassessing<br />
their degree of preparedness.<br />
The cities developing the warning systems could use guidance on the evaluation of the system when<br />
developing them.<br />
4.8.2. WMO Expert Team on Operational <strong>Heat</strong>/<strong>Health</strong> Warnings<br />
A WMO Expert Team on Operational <strong>Heat</strong>/<strong>Health</strong> Warnings was established in 2001.The main tasks of<br />
the WMO Expert Team include the following.<br />
1. Two more operational heat health warning systems will be developed for vulnerable cities that<br />
have good meteorological <strong>and</strong> mortality databases.At the moment, Casablanca <strong>and</strong> Delhi have been<br />
identified as suitable c<strong>and</strong>idate cities.<br />
2. Guidance material will be developed that will permit technology transfer to all potential locales<br />
with interest in heat health warning systems.This material will allow cities to independently develop<br />
their own watch <strong>and</strong> warning systems. It will include:<br />
• the data necessary to develop a system;<br />
• actual system development;<br />
• software installation;<br />
• operation <strong>and</strong> collaboration among local agencies that are significant stakeholders;<br />
• intervention plans that have proven successful in other areas; <strong>and</strong><br />
• evaluation of the effectiveness of the system.<br />
3. Systems may be exp<strong>and</strong>ed to include seasonal forecasts.The systems are designed for 48–60 hours<br />
of advance notice of a heat event. Many countries are now developing longer-range forecasts (3 to 6<br />
months lead-time), but these are for seasonal weather, will still be experimental for years <strong>and</strong> cannot<br />
forecast individual weather systems.<br />
The WMO Expert Team will provide general guidance for any city in developing a heat health warning<br />
system.The guidance will address the epidemiological analysis of meteorological <strong>and</strong> health data, the<br />
implementation of a forecast procedure <strong>and</strong> a range of interventions.The guidelines are scheduled to be<br />
available in 2004.<br />
4. HEAT HEALTH WARNING SYSTEMS<br />
63
4.8. Current research into the development of heat health warning systems<br />
4.8.3. WMO Expert Team on <strong>Health</strong>-related Climate Indices <strong>and</strong> their Use in Early Warning<br />
Systems<br />
Parallel to the WMO Expert Team on Operational <strong>Heat</strong>/<strong>Health</strong> Warnings, the WMO Expert Team on<br />
<strong>Health</strong>-related Climate Indices <strong>and</strong> their Use in Early Warning Systems was established. The terms of<br />
reference of this Expert Team include:<br />
• to critically review <strong>and</strong> make recommendations on the efficacy <strong>and</strong> validity of universal thermal<br />
climate indices;<br />
• to review <strong>and</strong> make arrangements for the continued quantification of the relationship between health<br />
stressors such as ozone, other environmental pollutants, vector- <strong>and</strong> waterborne diseases, adverse<br />
radiative impact, heat <strong>and</strong> cold stress on the one h<strong>and</strong>, <strong>and</strong> meteorological factors including climate<br />
indices;<br />
• to identify or develop custom-built climate indices for vulnerability assessments, preparedness<br />
planning <strong>and</strong> alerts on particular health outcomes of climate variations; <strong>and</strong><br />
• to identify requirements for <strong>and</strong> make recommendations on the coordination of further research in<br />
the area of climate <strong>and</strong> human health.<br />
In addition, a universal thermal climate index is being developed <strong>and</strong> will be compared with existing<br />
procedures <strong>and</strong> tested <strong>and</strong> validated for operational use (Jendritzky et al., 2002). It will then be<br />
presented to WMO <strong>and</strong> WHO with recommendations <strong>and</strong> guidelines for implementation.<br />
64
5. URBAN BIOCLIMATOLOGY<br />
5.1. Introduction<br />
5.2. Urban climates <strong>and</strong> urban heat isl<strong>and</strong>s<br />
5.3. Urban bioclimates<br />
5.4. Urban planning, design <strong>and</strong> architecture<br />
5.5. Indoor environment<br />
5.6. Potential impact of climate change on urban climate<br />
5.7. Discussion <strong>and</strong> recommendations<br />
65
5.1. Introduction<br />
5.1. Introduction<br />
Only 0.2% of the earth’s surface is covered with urban areas (Matzarakis, 2001), but 47% of the world<br />
population <strong>and</strong> 73% of the population of Europe live in urban areas (Deutsche Stiftung Weltbevölkerung,<br />
2002).The number of people living in urban areas is rapidly growing in developing countries. By 2007,<br />
half the world population is projected to live in urban areas.If trends continue (Arnfield,2003), by 2025,<br />
the population living in cities will increase to 60% (Bitan, 2003). However, in western Europe <strong>and</strong> <strong>No</strong>rth<br />
America. there is a move out of the large cities into suburbs <strong>and</strong> smaller urban centres. Nevertheless, the<br />
urban population in Europe grew by about 0.4% between 1990 <strong>and</strong> 1995 (Bundesministerium für<br />
Wirtschaftliche Zusammenarbeit und Entwicklung, 2000).<br />
This trend leads to the expansion of cities <strong>and</strong> creates a conflict between urban areas <strong>and</strong> the open<br />
spaces within <strong>and</strong> around them (Fig. 19) (Bitan, 2003).<br />
Temperatures are higher in urban areas.This is caused by many factors, including less radiant heat loss<br />
in the urban canopy layer, lower wind velocities <strong>and</strong> increased exposure to radiation (Jendritzky &<br />
Grätz, 1999). Local <strong>and</strong> regional climates are modified significantly by urbanization <strong>and</strong> other l<strong>and</strong>-use<br />
changes. Urban climates are modified by changes in the water balance, the radiation <strong>and</strong> energy budget<br />
<strong>and</strong> changes in the wind-field (Gross, 1996). <strong>Global</strong> climate change will interact with other important<br />
factors (urban planning <strong>and</strong> construction of the built environment) to affect urban bioclimates in the<br />
future (Wagner, 1994).<br />
66<br />
Fig. 19. Percentage of the population living in urban areas in countries in the WHO European Region, latest<br />
available data for each country<br />
28–45%<br />
45–63%<br />
63–78%<br />
78–100%<br />
no data<br />
Source: <strong>Health</strong> for All Database of the WHO Regional Office for Europe
5.2. Urban climates <strong>and</strong> urban heat isl<strong>and</strong>s<br />
WMO (1983) defines urban climate as local climate that is modified by interactions between the builtup<br />
area (including waste heat <strong>and</strong> the emission of air pollutants) <strong>and</strong> regional climate.The climate of a<br />
city is a local mesoclimate (spatial extension about 250 km).The city affects both physical <strong>and</strong> chemical<br />
processes in the atmospheric boundary layer (the lowest 1000 m of the atmosphere) (Mayer,1992;Fezer,<br />
1995), including:<br />
• flow obstacles;<br />
• the area of an irregular elevated aerodynamic surface roughness;<br />
• heat isl<strong>and</strong>s; <strong>and</strong><br />
• sources of emissions, such as sulfate aerosols that affect cloud formation <strong>and</strong> albedo.<br />
Table 13 shows the modification of meteorological parameters in urban areas. One of the best known<br />
phenomena of the urban climate is the urban heat isl<strong>and</strong>. The term urban heat isl<strong>and</strong> denotes the<br />
increased temperature of a city compared with the temperature of the surrounding rural area. The<br />
temperature difference increases with an increase in the number of inhabitants <strong>and</strong> the building density.<br />
Fig. 20 shows a theoretical urban temperature cross-section. In the city itself, certain areas can be<br />
Fig. 20. Theoretical urban temperature cross-section<br />
Air temperature<br />
CBD (central business district)<br />
Source: Bitan (2003).<br />
Rural<br />
Cliff<br />
∆T u–r<br />
(temperature difference between urban centre <strong>and</strong> rural area)<br />
Plateau<br />
Residential areas<br />
Park<br />
Peak<br />
∆T u–r<br />
CBD<br />
Suburban Urban<br />
5. URBAN BIOCLIMATOLOGY<br />
67
5.2. Urban climates <strong>and</strong> urban heat isl<strong>and</strong>s<br />
identified that are warmer than other parts. Conversely, green spaces within the city cause urban cold<br />
isl<strong>and</strong>s, which are cooler than the rest of the city.<br />
Many kinds of urban heat isl<strong>and</strong>s can be identified depending on what kind of temperature is examined.<br />
The various urban heat isl<strong>and</strong>s display different characteristics <strong>and</strong> are controlled by different<br />
assemblages of energy exchange processes. For example, urban heat isl<strong>and</strong>s in the air temperature at<br />
different heights can be found. Another kind of urban heat isl<strong>and</strong> can be distinguished based on the<br />
temperatures of urban surfaces.Although surface temperatures show some similar spatial <strong>and</strong> temporal<br />
patterns to those for air temperatures, this correspondence is not exact (Arnfield, 2003). Depending on<br />
settlement structures, not only one urban heat isl<strong>and</strong> develops but an urban heat archipelago.<br />
Because of different surfaces <strong>and</strong> building structures, there are different microclimates (such as street<br />
canyons, courtyards <strong>and</strong> parks) within the urban climate.The factors that differentiate urban climates<br />
from the surrounding rural area are anthropogenic heat production, airflow <strong>and</strong> built form (Yannas,<br />
2001).<br />
68<br />
TABLE 13. COMPARISON OF CLIMATE VARIABLES BETWEEN URBAN AND RURAL AREAS<br />
Meteorological parameter Compared with rural areas<br />
Radiation<br />
Air temperature<br />
Humidity<br />
Fog<br />
Cloudiness<br />
Precipitation<br />
Wind<br />
Contaminants<br />
solar radiation<br />
ultraviolet radiation (winter)<br />
ultraviolet radiation (summer)<br />
sunshine duration<br />
annual mean<br />
radiation days<br />
minimum temperature<br />
maximum temperature<br />
relative<br />
absolute<br />
annual mean<br />
snow<br />
mean wind-speed<br />
calms<br />
gusts 4<br />
particles<br />
gases<br />
less<br />
less<br />
less<br />
less<br />
higher<br />
higher<br />
higher<br />
higher<br />
less<br />
no change<br />
4 A gust is defined by the fact that wind velocity during the gust is more than 5.1 m/s higher than the mean wind<br />
velocity.The minimum duration of a gust is 3 seconds.<br />
less<br />
more<br />
more<br />
less<br />
less<br />
more<br />
more<br />
more<br />
more
Buildings are permanent heating appliances discharging heat all year round from space heating <strong>and</strong><br />
cooling, artificial lighting <strong>and</strong> the use of domestic <strong>and</strong> office appliances. In northern Europe during<br />
winter, the amount of heat dissipated within the urban canopy layer by buildings <strong>and</strong> motorized<br />
transport can exceed that contributed from solar radiation. However, anthropogenic heat release<br />
depends on the role of building insulation (Arnfield, 2003).<br />
The wind velocity in cities is generally lower than that in the open country.This results in a reduced rate<br />
of heat dissipation by convective cooling.Nevertheless,tall buildings <strong>and</strong> the channelling effect of urban<br />
canyons lead to complex airflow patterns <strong>and</strong> produce turbulence.<br />
Built density <strong>and</strong> built form are composite variables combining parameters such as the area of exposed<br />
external surfaces,the thermal capacity <strong>and</strong> surface reflectance of built elements <strong>and</strong> the view of sun <strong>and</strong><br />
sky by surfaces.A cubical form can collect more than three times the annual amount of radiation that<br />
would have fallen on unbuilt ground.<br />
Under “ideal”(calm <strong>and</strong> cloudless) conditions at night,the effects of street canyon geometry on radiation<br />
<strong>and</strong> of thermal properties on heat storage release are the two main causes of the urban heat isl<strong>and</strong>. In<br />
very cold conditions, space heating of buildings can become a dominant cause depending on wall<br />
insulation (Ichinose et al., 1999).<br />
5.2.1. Urban climates <strong>and</strong> air quality<br />
Many cities have high levels of outdoor air pollution, especially carbon monoxide, nitrogen oxides,<br />
volatile organic compounds <strong>and</strong> particulate matter.The formation of photochemical smog may prevent<br />
solar radiation from reaching the ground <strong>and</strong> reduce the heat loss from long-wave radiation. Groundlevel<br />
ultraviolet radiation is therefore often reduced during severe pollution episodes.<br />
Air temperature, cloud cover <strong>and</strong> precipitation are higher in cities than in the surrounding areas.The<br />
mean wind speed is lower but gusts are more frequent. Insufficient air exchange in street canyons<br />
because of low wind speeds can decrease ground-level air quality.<br />
5.2.2. Intensity<br />
The urban heat isl<strong>and</strong> is relatively easy to measure, <strong>and</strong> several studies have identified factors that are<br />
associated with the magnitude of the effect.<br />
5.2.2.1.The size of the town<br />
The larger the urban area <strong>and</strong> the more people living in the city, the more pronounced is the urban heat<br />
isl<strong>and</strong> (Oke, 1973; Moreno-Garcia, 1994; Goldreich, 1995; Nichol, 1996; Yamashita, 1996; Chambers &<br />
Bazel, 2000 cited in Matzarakis, 2001).<br />
In <strong>No</strong>rth America, the magnitude of the urban heat isl<strong>and</strong> is related to population size. Under ideal<br />
conditions, the maximum urban-rural difference of 2.5 °C for towns of 1000 inhabitants increases to 12<br />
°C for cities of 1 million (Oke, 1973). European cities have lower per capita energy use <strong>and</strong> hence<br />
anthropogenic heat production than cities in <strong>No</strong>rth America <strong>and</strong> therefore smaller rural-urban<br />
differences. Other reasons for the smaller European heat isl<strong>and</strong>s may be the lower heat capacity of the<br />
urban environment <strong>and</strong> more evapotranspiration than in <strong>No</strong>rth American cities. However, this analysis<br />
did not include information about the relationship in cities in southern Europe.<br />
The regression equations in Table 14 describe the log-linear relationship between the urban heat isl<strong>and</strong><br />
(∆T u–r ) <strong>and</strong> population size (P) for <strong>No</strong>rth America <strong>and</strong> Europe (Oke, 1973).<br />
5. URBAN BIOCLIMATOLOGY<br />
69
5.2. Urban climates <strong>and</strong> urban heat isl<strong>and</strong>s<br />
70<br />
TABLE 14. RELATIONSHIPS BETWEEN THE URBAN HEAT ISLAND (∆T u–r ) AND POPULATION SIZE (P)<br />
Region<br />
<strong>No</strong>rth America<br />
Europe<br />
Source: Oke (1973).<br />
Association<br />
∆T u–r = 2.96 log P – 6.41<br />
∆T u-r = 2.01 log P – 4.06<br />
r 2 =0.96<br />
s ∆T 2 = ±0.7 °C<br />
r 2 = 0.74<br />
s ∆T 2 = ±0.9 °C<br />
5.2.2.2.Topographic <strong>and</strong> climatic position of the city<br />
Cities in study<br />
Montreal, Vancouver, San Francisco,<br />
Winnipeg, Edmonton, Hamilton, San Jose,<br />
Palo Alto <strong>and</strong> Corvallis<br />
London, Berlin, Vienna, Munich, Sheffield,<br />
Utrecht, Malmö, Karlsruhe, Reading,<br />
Uppsala <strong>and</strong> Lund<br />
Depending on the structure <strong>and</strong> direction of open rural areas near the city, nocturnal cold air<br />
penetration may be induced. This reduces the heat isl<strong>and</strong> intensity during the night. The urban heat<br />
isl<strong>and</strong> may also be reduced by regional wind systems such as sea breezes or wind systems in mountain<br />
valleys (Clarke, 1969; Böhm & Gabl, 1978; Bernhofer, 1984; Goldreich, 1984; Nasrallah et al., 1990;<br />
Adebayo, 1991; Jauregui et al., 1992; Kuttler et al., 1996; Tso, 1996; Baumbach & Vogt, 1999;<br />
Padmanabhamurty, 1999; Ali, 2000; Asaeda et al., 2000; Jonsson, 2000; King’uyu, 2000; Okpara, 2000;<br />
Saaroni et al., 2000 cited in Matzarakis, 2001).<br />
Wienert (2001) analysed the maximum urban heat isl<strong>and</strong> of 150 cities all over the world (46 European<br />
cities, Table 15). He found that the urban heat isl<strong>and</strong> depends on geographical latitude because of<br />
anthropogenic heat production, the radiation balance <strong>and</strong> its annual variability vary according to<br />
latitude. The maximum differences between urban <strong>and</strong> rural environments in the lower latitudes are<br />
smaller than in the higher latitudes. For example, the maximum urban-rural differences are 8.7 °C in<br />
Amsterdam <strong>and</strong> 3 °C in Parma.Wienert’s findings indicate that the relationships found by Oke (1973)<br />
are only valid in regions with more or less the same geographical latitude. Basically a fair variance must<br />
be considered <strong>and</strong> different authors have found different maximum heat isl<strong>and</strong>s. One study estimates<br />
the maximum urban heat isl<strong>and</strong> of Gothenburg to be 8.5 °C, nearly twice the estimate of Wienert.<br />
Another study (Santamouris, 1998 cited by Matzarakis, 2001) determined the maximum urban heat<br />
isl<strong>and</strong> for Athens during daytime in summer to be 18 °C.Wienert found only 7.5 °C.<br />
5.2.2.3. Distribution of the urban structures<br />
The hottest zones in the city are those with the tallest buildings <strong>and</strong> the highest density of buildings,<br />
without green spaces <strong>and</strong> with intense generation of anthropogenic heat (Eriksen, 1976; Roth et al.,<br />
1989; Asaeda et al., 1996; Eliasson, 1996; Upmanis et al., 1998; Goh & Chang, 1999; Santamouris et al.,<br />
1999; Unger, 1999; Eliasson & Upmanis, 2000; Pinho & Manso Orgaz, 2000 cited in Matzarakis, 2001).<br />
5.2.3. Trends over time<br />
Several studies have investigated changes in the urban heat isl<strong>and</strong> over time (Böhm, 1979, 1998; Cayan<br />
& Douglas 1984; Katsoulis & Theoharatos, 1985; Feng & Petzold, 1988; Karl et al., 1988; Kozuchowski et<br />
al., 1994; Karaca et al., 1995; Hughes & Balling, 1996; Nakamura, 1998; Magee et al., 1999; Phil<strong>and</strong>ras et<br />
al., 1999; Green et al., 2000 cited in Matzarakis, 2001).
TABLE 15. EUROPEAN CITIES AND MAXIMUM URBAN HEAT ISLANDS<br />
City<br />
Lund (Sweden)<br />
Parma (Italy)<br />
Reykjavík (Icel<strong>and</strong>)<br />
Lünen (Germany)<br />
Osnabrück (Germany)<br />
Valencia (Spain)<br />
Biel (Switzerl<strong>and</strong>)<br />
Reading (United Kingdom)<br />
Lisbon (Portugal)<br />
Annecy (France)<br />
Fribourg (Switzerl<strong>and</strong>)<br />
Gothenburg (Sweden)<br />
Giessen (Germany)<br />
Cologne (Germany)<br />
Freiburg (Germany)<br />
Graz (Austria)<br />
Rome (Italy)<br />
Stockholm (Sweden)<br />
Stolberg (Germany)<br />
Szeged (Hungary)<br />
Vienna (Austria)<br />
Bochum (Germany)<br />
Malmö (Sweden)<br />
Munich (Germany)<br />
Sheffield (United Kingdom)<br />
Uppsala (Sweden)<br />
Zagreb (Croatia)<br />
Athens (Greece)<br />
Aveiro (Portugal)<br />
Essen (Germany)<br />
Karlsruhe (Germany)<br />
Moscow (Russian Federation)<br />
Barcelona (Spain)<br />
Bucharest (Romania)<br />
Helsinki (Finl<strong>and</strong>)<br />
Lódz (Pol<strong>and</strong>)<br />
Sverdlovsk (Russian Federation)<br />
Utrecht (Netherl<strong>and</strong>s)<br />
Amsterdam (Netherl<strong>and</strong>s)<br />
Irkutsk (Russian Federation)<br />
Berlin (Germany)<br />
Birmingham (United Kingdom)<br />
Cita (Russian Federation)<br />
Dortmund (Germany)<br />
London (United Kingdom)<br />
Lipeck (Russian Federation)<br />
Source: adapted from Wienert (2001).<br />
Maximum urban heat isl<strong>and</strong> (°C)<br />
2<br />
3<br />
3<br />
3.5<br />
3.5<br />
3.6<br />
4<br />
4.4<br />
4.5<br />
5<br />
5<br />
5<br />
5.5<br />
5.7<br />
6<br />
6<br />
6<br />
6<br />
6<br />
6<br />
6<br />
6.6<br />
7<br />
7<br />
7<br />
7<br />
7<br />
7.5<br />
7.5<br />
7.5<br />
7.5<br />
7.8<br />
8<br />
8<br />
8<br />
8<br />
8<br />
8<br />
8.7<br />
9<br />
10<br />
10<br />
10<br />
10<br />
10<br />
12<br />
5. URBAN BIOCLIMATOLOGY<br />
71
5.2. Urban climates <strong>and</strong> urban heat isl<strong>and</strong>s<br />
A study of urbanization in Athens found that a rapid increase in population <strong>and</strong> in the number of motor<br />
vehicles with a decreasing trend in precipitation caused the maximum temperatures to increase from<br />
the 1940s until 1990 (Phil<strong>and</strong>ras et al., 1999). Bràzdil & Budiková (1999) analysed the development of<br />
the Prague urban heat isl<strong>and</strong> from 1922 onwards.They found an increase in the heat isl<strong>and</strong> of 0.06 °C<br />
per year in winter <strong>and</strong> spring <strong>and</strong> of 0.01 °C per year in summer until 1960. Since 1960, the trend in the<br />
urban heat isl<strong>and</strong> has stagnated.<br />
Wilby (2003) attributes the more rapid nocturnal warming in spring, summer <strong>and</strong> autumn in central<br />
London compared with a rural site between 1961 <strong>and</strong> 1990 to the presence of polluted air in the urban<br />
atmosphere, which absorbs <strong>and</strong> then re-emits outgoing terrestrial radiation at night, <strong>and</strong> to<br />
anthropogenic heat production in the form of increased air-conditioning in recent decades.<br />
The magnitude of the urban heat isl<strong>and</strong> is limited (Oke, 1973) because constructing new city structures<br />
requires demolishing old city structures once a given level of urban development has been reached, so<br />
that concrete replaces concrete. In addition, a large urban-rural temperature gradient induces a<br />
convergent thermal breeze circulation.<br />
5.2.4. Variability<br />
The processes <strong>and</strong> phenomenon of urban climate depend on weather conditions, the time of day, the<br />
time of year <strong>and</strong> the location of the city (the meso- <strong>and</strong> macroclimate of the city).The urban heat isl<strong>and</strong><br />
is most pronounced during calm, clear nights in winter.<br />
5.2.4.1.Weather<br />
The intensity of the urban heat isl<strong>and</strong> peaks under autochthonal (anticyclonic) weather conditions<br />
(Oke, 1976, 1998; Nkemdirim, 1980; Balling & Cerveny, 1987; Kidder & Essenwanger, 1995; Unger, 1996;<br />
Figuerola & Mazzeo, 1998; Pinho & Manso Orgaz, 2000 cited in Matzarakis 2001).<br />
5.2.4.2.Annual variability<br />
The urban heat isl<strong>and</strong> in cities at middle latitudes is more pronounced in summer than in winter.Wilby<br />
(2003) found that the nocturnal urban heat isl<strong>and</strong> in London is on average strongest in August (+2.2 °C)<br />
<strong>and</strong> weakest in January (+1.1 °C).Arnfield (2003) reviewed the literature on the intensity of the urban<br />
heat isl<strong>and</strong> <strong>and</strong> concluded that it is most pronounced during the summer or the warm half of the year.<br />
However, studies (Montávez et al., 2000) show that the urban heat isl<strong>and</strong> in lower geographical latitudes<br />
(such as southern Europe) is more pronounced in winter than in summer.<br />
5.2.4.3. Diurnal variability<br />
Because of nocturnal radiative cooling in rural areas, the urban heat isl<strong>and</strong> is more pronounced at night<br />
than during the day (Oke & Maxwell, 1975; Helbig, 1987; Johnson et al., 1991; Oke et al., 1992; Jauregui,<br />
1993; Runnals & Oke, 1998; Klysik & Fortuniak, 1999; Bai & Kubo, 2000; Barton & Oke, 2000; Boo & Oh,<br />
2000; Gallo & Owen, 2000; Montávez et al., 2000 cited in Matzarakis, 2001; Kim & Baik, 2002; Livada et<br />
al., 2002).<br />
The negative impact of the urban heat isl<strong>and</strong> appears mainly in the summer because the heat isl<strong>and</strong><br />
increases exposure to high summer temperatures. Further, the urban heat isl<strong>and</strong> maintains higher<br />
temperatures at night.This is thought to increase the impact on health of continuous hot days, as little<br />
relief is experienced at night (see also section 5.5).<br />
72
5.3. Urban bioclimates<br />
Traditional studies of heat isl<strong>and</strong>s usually do not include bioclimatic aspects <strong>and</strong> are therefore of limited<br />
use to urban planners.What is needed is an evaluation of the effects of anthropogenic changes in the<br />
thermal environment related to human health <strong>and</strong> wellbeing (Jendritzky & Nübler, 1981).<br />
Temperature, humidity, air movement <strong>and</strong> radiant energy exchange are important for maintaining the<br />
heat balance of the human body (Clarke, 1972; Jendritzky, 1983). Urban structures modify all these<br />
climate elements.<br />
During daytime in summer, higher air temperature, lower wind intensity <strong>and</strong> spatially varying radiation<br />
conditions can lead to heat stress. Behavioural adaptation is necessary during heat stress situations:<br />
wearing appropriate clothing <strong>and</strong> avoiding direct solar radiation. The degree of heat load is mainly<br />
determined by solar radiation.The heat load is very high in direct sunlight (Jendritzky & Sievers, 1989).<br />
People with poor circulation should avoid open-air activities during the hottest time of the day.<br />
<strong>Heat</strong>-waves present special problems in urban areas because buildings retain heat if ventilation for<br />
cooling at night is inadequate. During heat-waves, inhabitants of urban areas may experience sustained<br />
thermal stress both day <strong>and</strong> night, whereas inhabitants of rural environments often obtain some relief<br />
from thermal stress at night (Clarke, 1972; Jendritzky, 2000).<br />
Green spaces, especially those with broad-leafed trees, have an important effect on the bioclimate of an<br />
urban area by providing shade. Sun <strong>and</strong> shade lead to extreme differences in the thermal conditions in<br />
a very small space. These differences emphasize the great importance of a microscale view of the<br />
bioclimate in an urban area (Jendritzky & Sievers, 1989; Matzarakis, 2001).<br />
The following are two case studies on bioclimates in European cities: Szeged, Hungary <strong>and</strong> Berlin,<br />
Germany.<br />
5.3.1. Szeged<br />
Unger (1999) examined the influence of a medium-sized city (Szeged, Hungary) on the bioclimate<br />
conditions of humans. He used the following indices to assess the difference between urban <strong>and</strong> rural<br />
bioclimates:<br />
• thermo-hygrometric index (THI (°C)): air temperature, relative humidity (comfortable = 15.0–19.9 °C);<br />
• relative strain index (RSI): air temperature <strong>and</strong> vapour pressure (comfortable > 0.2); <strong>and</strong><br />
• the number of “beer garden days”: air temperature exceeding 20 °C at 21.00.<br />
Unger concluded that modifications of the main climatic elements in Szeged are mostly favourable for<br />
thermal comfort. In the urban environment, 30% of the days were in the comfort range, whereas in the<br />
rural environment only 20% of the days can be classified as comfortable. In contrast, in the city 6% of<br />
the days were classified as hot versus 1% in the surroundings.“Beer garden days” did not occur in rural<br />
environments.<br />
5. URBAN BIOCLIMATOLOGY<br />
73
5.3. Urban bioclimates<br />
5.3.2. Berlin<br />
Measuring meteorological fields in the urban canopy layer is very expensive. In addition, the<br />
meteorological components of a city cannot be measured in the detail required for bioclimatological<br />
assessment.The modelling of these fields should therefore be emphasized.This approach also enables<br />
the impact of different planning options on the urban bioclimate to be assessed. Modelling seems to be<br />
the appropriate method of generating the relevant data for urban planning purposes with the aim of<br />
creating <strong>and</strong> safeguarding healthy conditions.<br />
To meet the needs of urban planners,the Deutscher Wetterdienst developed the urban bioclimate model<br />
UBIKLIM as an expert system that utilizes available knowledge in urban climate science in an objective<br />
procedure for practical applications. Using geographical information system techniques, UBIKLIM<br />
simulates the thermal environment in the urban boundary layer that depends on the kind of l<strong>and</strong> use:<br />
the given or planned settlement structure (these are the planning variables to be transformed into<br />
boundary layer parameters). Interactions between neighbouring structures, the topography (local scale)<br />
<strong>and</strong> the meso- <strong>and</strong> macroclimate are taken into account (Jendritzky, 1988; Jendritzky & Grätz, 2003).As<br />
input data, UBIKLIM requires a digital height model with 10 metres of resolution <strong>and</strong> appropriate<br />
information on l<strong>and</strong> use. Dividing the urban area into a limited number of districts is sufficient, each<br />
characterized by its own l<strong>and</strong>-use type. The main types are water, forest, parks, meadows, paved <strong>and</strong><br />
unpaved open spaces <strong>and</strong> built-up areas.To differentiate the varying urban structure, the built-up area is<br />
divided up further considering the degree of pavement area,building density,building height <strong>and</strong> degree<br />
of green coverage.The result is a widespread <strong>and</strong> detailed bioclimate map on the horizontal heat load<br />
distribution with 10 metres of resolution that provides the necessary information for urban planners,<br />
health professionals <strong>and</strong> other decision-makers (Jendritzky & Grätz, 2003).<br />
UBIKLIM was used to assess the thermal situation of Berlin in 1996 (Piehl & Grätz, 1996). UBIKLIM<br />
enables the urban climate to be assessed <strong>and</strong> thus facilitates the consideration of urban climate issues<br />
in planning <strong>and</strong> decision-making (Jendritzky et al., 1994).The thermal component of the bioclimate is<br />
evaluated by determining the physiologically relevant meteorological quantities from l<strong>and</strong> use <strong>and</strong> the<br />
urban canopy layer <strong>and</strong> by analysing these quantities for a single cloudless summer day with the Klima<br />
Michel model. The result is a bioclimatic map (Fig.21) that enables a relative evaluation <strong>and</strong> comparison<br />
of the bioclimate of different urban areas (Grätz & Jendritzky, 1998).<br />
The bioclimate of a city depends on both regional factors (topographic situation <strong>and</strong> latitude) <strong>and</strong> local<br />
factors (urban structures). To assess the thermal situation, a mesoscale statistical bioclimatic model<br />
determines the regional part <strong>and</strong> UBIKLIM determines the local part. In contrast to UBIKLIM, which is<br />
calculated for one single day, the background situation was determined for a 30-year period<br />
(1951–1980). Based on these models, the annual number of days with heat stress can be determined.<br />
74
Fig. 21. Annual number of days with heat stress in Berlin<br />
Source: Grätz & Jendritzky (1998).<br />
4<br />
6<br />
8<br />
10<br />
12<br />
14<br />
16<br />
18<br />
20<br />
22<br />
24<br />
26<br />
5. URBAN BIOCLIMATOLOGY<br />
75
5.4. Urban planning, design <strong>and</strong> architecture<br />
5.4. Urban planning, design <strong>and</strong> architecture<br />
Appropriate urban planning <strong>and</strong> building design provide measures to reduce heat stress for individuals<br />
living in cities <strong>and</strong> can reduce the urban heat isl<strong>and</strong>.The heat load becomes more extreme if the human<br />
body is directly irradiated by solar radiation, <strong>and</strong> planning measures that provide shade for pedestrians<br />
(trees, arcades <strong>and</strong> narrow streets) can therefore reduce heat load (Jendritzky, 1988). Appropriate<br />
architecture can prevent buildings from warming up <strong>and</strong> thereby ensure a comfortable indoor<br />
environments without the use of artificial air-conditioning.Architecture considers individual buildings,<br />
whereas urban design deals with planning the structure of settlements.<br />
To maximize thermal comfort in urban areas, climatic aspects should be considered in all scales, from<br />
the design of the individual building to regional planning. Fig. 22 summarizes the impact of climatic<br />
elements on regional settlement planning (urban design) <strong>and</strong> building design.<br />
76<br />
Fig. 22. Impact of climatic elements on regional <strong>and</strong> settlement planning <strong>and</strong> building design<br />
Region<br />
Climatic impact on regional planning<br />
Geographical location<br />
Site selection<br />
Function, location <strong>and</strong> l<strong>and</strong> use<br />
Avoiding environmental hazards<br />
L<strong>and</strong>scape planning<br />
Source: Bitan (1988).<br />
Impact of climatic elements in planning on<br />
Settlement<br />
Climatic impact on settlement planning<br />
Settlement layout<br />
Function, location <strong>and</strong> l<strong>and</strong> use<br />
Density <strong>and</strong> distances optimization<br />
Settlement shading <strong>and</strong> radiation control<br />
Uses of open space<br />
Wind shelters<br />
L<strong>and</strong>scape planning<br />
Building<br />
Climatic impact on building design<br />
Type of housing<br />
Orientation<br />
Utilization of sun radiation<br />
Shading<br />
Ventilation<br />
Window <strong>and</strong> door design<br />
Form <strong>and</strong> direction of roofs<br />
Building <strong>and</strong> insulation materials<br />
Colour selection<br />
L<strong>and</strong>scape planning
5.4.1. Urban design<br />
Whereas research into indoor comfort is well developed, the impact of the outdoor thermal<br />
environment in urban spaces has received less attention. Although the outdoor thermal environment<br />
may not be comfortable all the time, the surrounding human-made <strong>and</strong> natural features can potentially<br />
create a multitude of microclimates through pockets of sun <strong>and</strong> shade, with varying degrees of<br />
protection or exposure to wind (Forwood et al., 2000).<br />
The following questions are of interest to urban planners in optimizing health, well-being <strong>and</strong><br />
performance (Grätz et al., 1994; Jendritzky, 1995).<br />
• Which urban settlement structures tend to be stressful to the bioclimate?<br />
• How can development plans be optimized with respect to human health?<br />
• Which arguments for development regulations can be derived?<br />
• Which areas are appropriate for new developments?<br />
• Where is action urgently needed?<br />
5.4.1.2. Problems in implementing climatic aspects in urban design<br />
Urban design has no dominant goal, <strong>and</strong> the designer must deal with all scales of decision-making from<br />
the regional scale to the individual building. Climate considerations often have little effect on urban<br />
planning.Although urban planners are interested in climatic aspects, the use of climate information has<br />
low priority. To facilitate the influence of climate into urban planning, Eliasson (2000) suggests<br />
incorporation of the following steps:<br />
• improve awareness of urban climate;<br />
• improve communication between planners; <strong>and</strong><br />
• develop tools <strong>and</strong> courses suitable for urban planners.<br />
Planning guidelines should take into account the following climatic aspects (Verein Deutscher<br />
Ingenieure, 1998; Scherer et al., 1999).<br />
• ventilation: maintain <strong>and</strong> improve ventilation paths, restore connection to ventilation paths <strong>and</strong><br />
reduce the risks of hazards caused by wind;<br />
• air quality:maintain transport of fresh air <strong>and</strong> reduce pollution in areas with sensitive populations;<strong>and</strong><br />
• thermal situation: reduce heat load <strong>and</strong> reduce the negative effects of frost or cold stress.<br />
De la Croix (1991) describes a more detailed way for implementing measures that reduce the urban heat isl<strong>and</strong>:<br />
• identifying a city’s current temperature trend;<br />
• identifying a city’s motivating factors that fit that city’s circumstances (reduction of energy costs, air<br />
quality <strong>and</strong> social impact);<br />
• developing an overall plan <strong>and</strong> strategy; <strong>and</strong><br />
• documenting the savings.<br />
5. URBAN BIOCLIMATOLOGY<br />
77
5.4. Urban planning, design <strong>and</strong> architecture<br />
5.4.1.3. Elements of urban design affecting urban climate<br />
The following elements of town design affect urban climate, comfort conditions <strong>and</strong> energy use<br />
(Givoni, 1986):<br />
1. size <strong>and</strong> density of the built-up area:<br />
• the microclimate in the immediate vicinity of green spaces differs from that prevalent in<br />
unplanted areas;<br />
• vegetation has lower heat capacity <strong>and</strong> thermal conductivity than building materials;<br />
• solar radiation is absorbed so that the reflected radiation is very small (low albedo);<br />
• green spaces have higher evapotranspiration rates than unplanted areas;<br />
• plant leaves can filter dust out of the air;<br />
• green spaces reduce wind speed <strong>and</strong> its fluctuation near the ground. In hot, dry climates,<br />
reducing wind speed during daytime may be desirable, whereas thermal stress is better<br />
reduced in humid regions by natural ventilation <strong>and</strong> planting trees with high <strong>and</strong> broad<br />
canopies that provide shade without impeding ventilation near the ground level (Nieuwolt, 1986);<br />
2. layout <strong>and</strong> width of streets, their orientation <strong>and</strong> relation to the prevailing winds;<br />
3. patterns of subdivision <strong>and</strong> the shape, size <strong>and</strong> orientation of building lots;<br />
4. the height, shape <strong>and</strong> relative location of buildings;<br />
5. shading conditions along streets <strong>and</strong> parking areas; <strong>and</strong><br />
6. ensuring short distances for walking.<br />
Cities can be planned to reverse the heat isl<strong>and</strong> phenomenon (Givoni, 1986). Increasing the albedo of a<br />
city (such as painting roofs white) may cause negative radiation balance so that long-wave heat loss will<br />
exceed the solar heat gain. Since city size <strong>and</strong> higher density render the urban area more independent<br />
of the regional climate, any such lowering of urban temperature would be more noticeable in larger <strong>and</strong><br />
denser urban areas.<br />
Several studies have analysed the impact of single urban structures on the thermal environment <strong>and</strong> on<br />
human comfort conditions (Table 16). These studies provide good evidence that reducing building<br />
density, planting trees <strong>and</strong> laying out green spaces reduces heat stress in urban environments.<br />
5.4.1.4. Case study: Stuttgart (Germany)<br />
In 1951, the Lord Mayor of Stuttgart ordered all municipal agencies whose actions can affect the city’s<br />
climate to consult climatologists. Since 1976, Germany’s Federal Building Code has stipulated that<br />
climate, air pollution <strong>and</strong> health must be important factors in urban planning. Stuttgart began to involve<br />
municipal climatologists in urban planning earlier than other cities. In 1938, the municipal council<br />
decided to employ a meteorologist to investigate the urban climate of Stuttgart <strong>and</strong> to develop<br />
collaboration with town planning. Since that time, urban climate has been a very important factor for<br />
town planning in Stuttgart.<br />
The activities of the Department of Urban Climate are limited to the boundaries of Stuttgart, where<br />
about 590 000 people live.The main fields of study are urban climate, air pollution <strong>and</strong> noise. Getting<br />
78
TABLE 16. STUDIES OF PLANNING OPTIONS AND THERMAL ENVIRONMENTS<br />
City<br />
Berlin<br />
Munich<br />
Berlin<br />
Bonn<br />
Waldkirch (Germany)<br />
Tel Aviv (Israel)<br />
Berlin<br />
Year<br />
<strong>Change</strong>s in l<strong>and</strong> use<br />
1994<br />
1985<br />
1985<br />
1974<br />
1994<br />
2000<br />
July 1999<br />
Results<br />
Effect of trees in street canyons<br />
Effect of green spaces<br />
Effect of water bodies<br />
Effect of courtyards<br />
Potsdammer Platz <strong>and</strong> Spreebogen: planned changes in building density will lead to an additional increase<br />
in air temperature by 1–2 °C <strong>and</strong> to a reduction of wind speed by 80%<br />
Comparison of street canyons (north–south) with <strong>and</strong> without trees<br />
Trees had little effect on air temperature at 1.10 m above ground level<br />
Trees greatly affected mean radiant temperature (maximum 28 °C)<br />
Trees reduced extreme heat stress (predicted mean vote 3.5) to moderate heat stress (predicted mean<br />
vote 1.5)<br />
The physiological equivalent temperature was reduced from 46 °C to 31 °C, reducing heat stress by 40%<br />
The mean radiant temperature is the meteorological parameter with the greatest effects on the predicted<br />
mean vote <strong>and</strong> physiological equivalent temperature<br />
Extremely wind-still days<br />
Green spaces of 30 ha: the air temperature fell in the immediate vicinity up to distances of 150 to 600 m<br />
In a green space of 212 ha, influence could be measured up to a distance of 900 m on its lee-side.<br />
The influence of green spaces on temperature extends up to distances of 250 m around the green space<br />
Planning options simulated using the urban bioclimate model UBIKLIM<br />
<strong>Heat</strong> stress reduction (predicted mean vote) resulting from lower building density (36% instead of 50%)<br />
Additional reduction in heat stress by planting trees<br />
Impact of a small lake on heat stress (within 40 m at the downwind side)<br />
(Discomfort index = 0.5 * (dry bulb temperature + wet bulb temperature)<br />
Compared with the upwind side, the downwind side of the pond had:<br />
• lower air temperature;<br />
• higher relative humidity;<br />
• lower heat stress index: the discomfort index declined at midday by 0.8–1.6; <strong>and</strong><br />
• no significant change in water vapour pressure.<br />
Bioclimatic situation in the centres of three courtyards in Berlin on a hot summer day during daytime<br />
Courtyard area (m 2 )<br />
12 600<br />
4 370<br />
180<br />
Predicted mean vote fast walking<br />
0.0–2.8<br />
0.2–2.0<br />
0.2–0.9<br />
Predicted mean vote sitting<br />
–3 to 2.8<br />
–3 to 1.2<br />
–3 to –1.7<br />
5. URBAN BIOCLIMATOLOGY<br />
79<br />
Reference<br />
Wagner (1994)<br />
Mayer (1996)<br />
Kuttler (1988)<br />
Grätz et al.<br />
(1994)<br />
Saaroni & Ziv<br />
(2003)<br />
Mertens<br />
(1999)
5.4. Urban planning, design <strong>and</strong> architecture<br />
detailed values for both air pollution conditions in Stuttgart <strong>and</strong> meteorological parameters has been<br />
increasingly necessary.This requires buying expensive instruments, including an automated station for<br />
air quality control <strong>and</strong> a mobile measuring station.The dem<strong>and</strong> for detailed data led to infrared pictures<br />
being taken by remote sensing in 1988 wich show the contrast between the countryside <strong>and</strong> the city.<br />
Although these pictures only show the surface temperature, the measurements were very helpful in<br />
preparing the new development plan of Stuttgart.<br />
The baseline investigation for the climate atlas in 1992 involved remote sensing by aeroplane (infrared<br />
heat), meteorological measurements, a digital orographic model <strong>and</strong> maps of the air-emmission<br />
structure.The results of the investigation were thermal maps of the ground, maps of air temperature, air<br />
humidity, wind velocity <strong>and</strong> thermal comfort, a climatic analysis map <strong>and</strong> a map with hints for planning.<br />
The number of days with heat stress, based on Klima Michel simulations, averages 27 days per year in<br />
the city versus only 6 days in the forest areas around the city (Fig. 23).The Department of Climatology<br />
tries to make all the results of its investigations available to the public.They therefore publish their own<br />
series of communications <strong>and</strong> CD-ROMs. Since 1976, Germany’s Federal Development Law has<br />
stipulated that climate, air pollution <strong>and</strong> health be important factors in urban planning.<br />
Stuttgart’s practices can very well serve as a model for other cities in Germany <strong>and</strong> elsewhere.This kind<br />
of awareness of climatic factors is the exception rather than the rule.<br />
80<br />
Fig. 23. Number of days with heat stress in Stuttgart / year<br />
Source: Baumüller (2003).
5.4.2. Cost <strong>and</strong> benefits of planning options<br />
Planting trees <strong>and</strong> increasing green spaces is one method of reducing heat stress within a city.The costs<br />
of tree-planting projects include planting, pruning <strong>and</strong> watering the trees <strong>and</strong> removing dead trees.The<br />
benefits include shading, cooling by evapotranspiration, dust control, runoff control, consumption of<br />
carbon dioxide <strong>and</strong> water conservation.A study in Munich compared street canyons with <strong>and</strong> without<br />
trees (Mayer, 1996). Trees had little effect on air temperature at the level of human height but were<br />
effective in reducing heat stress by reducing radiant temperature.<br />
An analysis in the United States of the potential of vegetation in reducing summer cooling loads in<br />
residential buildings in cities found that an additional 25% increase in urban tree coverage can save 40%<br />
of annual cooling energy in Sacramento, CA <strong>and</strong> 25% in Phoenix,AZ <strong>and</strong> Lake Charles, LA (Huang et al.,<br />
1987).The calculated savings were minimal in Los Angeles,which used little energy for cooling.The costs<br />
<strong>and</strong> benefits of urban trees in Tucson,Arizona, over 40 years of planting 50 000 trees were estimated at<br />
US$ 9.61 per tree versus total benefits of US$ 25.09 per tree (McPherson, 1991). An internal rate of<br />
return (which incorporates the time value of money in investment analysis) of 7.1% is projected for the<br />
entire tree planting project.A second project aimed to estimate the costs <strong>and</strong> benefits of planting trees<br />
for shading bus stops.Trees were compared with the construction of metal bus shelters.Again, the total<br />
costs for trees for a 40-year period were only half the costs for metal bus shelters.<br />
A study by the United States Department of Energy (McCulloch, 1991 cited by Bitan, 2003) found that<br />
the costs of the heat isl<strong>and</strong> effect on a summer afternoon in Los Angeles are about US$ 150 000 per hour.<br />
If there are about 500–1000 hours of annual residential cooling in the Los Angeles area, then the annual<br />
costs of the urban heat isl<strong>and</strong> effect increase to about US$ 100 million for cooling.The excess power<br />
dem<strong>and</strong> in the Los Angeles area was calculated to be about 300 MW per °F.This means that the 5 °F<br />
temperature increase caused by the urban heat isl<strong>and</strong> in Los Angeles increases the power dem<strong>and</strong> by<br />
about 1.5 GW.<br />
The impact of measures to reduce the magnitude of the urban heat isl<strong>and</strong> on ground-level ozone<br />
concentration were estimated in cities in the northeastern United States (Hudischewskyj et al., 2001) as<br />
part of the <strong>Heat</strong> Isl<strong>and</strong> Reduction Initiative of the United States <strong>Environmental</strong> Protection Agency.The<br />
effects of two measures (increasing the albedo <strong>and</strong> the vegetation cover) were analysed using the<br />
meteorological <strong>and</strong> photochemical modelling tool Systems Applications International Mesoscale Model.<br />
The Model was run for the heat episode period of 9–15 July 1995.The maximum decrease of the urban<br />
heat isl<strong>and</strong> was calculated for four simulations: full implementation of the measures, only increasing the<br />
TABLE 17. MAXIMUM DECREASE (°C) OF THE URBAN HEAT ISLAND FOR 14–15 JULY 1995 COMPARED WITH<br />
THE BASE CASE<br />
Measures implemented<br />
Albedo + vegetation 100%<br />
Only albedo<br />
Only vegetation<br />
Albedo + vegetation 50%<br />
Source: Hudischewskyj et al. (2001).<br />
14 July 1995<br />
1.2 °C<br />
1.1 °C<br />
0.4 °C<br />
0.7 °C<br />
15 July 1995<br />
0.9 °C<br />
0.6 °C<br />
0.2 °C<br />
0.4 °C<br />
5. URBAN BIOCLIMATOLOGY<br />
81
5.4. Urban planning, design <strong>and</strong> architecture<br />
albedo, only increasing the vegetation cover <strong>and</strong> partial implementation (50%) of both measures (Table<br />
17). Increasing only the albedo of a city is nearly as effective as implementing both measures. However,<br />
increasing the vegetation cover has more influence on radiant temperature than on air temperature.The<br />
mean radiant temperature is the meteorological parameter with the greatest effect on the sensation of<br />
thermal stress in humans (Jendritzky, 1988; Mayer, 1996).<br />
Good building design can provide effective measures to reduce the heat stress of individuals living in<br />
cities. A report on adaptation in the United Kingdom (<strong>Environmental</strong> Resources Management, 2000)<br />
concluded that many planning processes <strong>and</strong> systems had the capacity for integrating climate change<br />
considerations but required more robust <strong>and</strong> reliable information on the potential impact of climate<br />
change <strong>and</strong> better underst<strong>and</strong>ing of the importance of adaptation by stakeholders.<br />
In Athens, Santamouris et al. (2001) showed that the urban heat isl<strong>and</strong> may double the cooling load <strong>and</strong><br />
triple the peak electricity load for cooling purposes of urban low-energy buildings: those with many<br />
energy conservation features to decrease heating <strong>and</strong> cooling needs. During the winter, the urban heat<br />
isl<strong>and</strong> reduced the heating load of centrally located low-energy buildings by up to 30%.The authors do<br />
not provide information about the energy consumption of “normal” buildings.<br />
Unfortunately, few studies aim to assess the costs <strong>and</strong> benefits of the different options for reducing the<br />
urban heat isl<strong>and</strong> <strong>and</strong> the heat load in buildings in Europe. In 2001 the BUGS (Benefits of Urban Green<br />
Space, http://www.ruhr-uni-bochum.de/bugs/index.html, accessed 29 October 2003) project started.<br />
This project, funded by the European Union, aims to develop an integrated method for assessing the<br />
benefits of urban green space.<br />
82
5.5. Indoor environment<br />
5.5.1. Introduction<br />
One function of buildings is to provide shelter <strong>and</strong> protection from the elements <strong>and</strong> against outdoor<br />
climate. Providing safe, healthy environments <strong>and</strong> taking into account the prevailing climatic conditions<br />
are therefore important. Humans have considerable capacity to adapt to varied climates <strong>and</strong><br />
environments. Physiological <strong>and</strong> behavioural differences between cultures have developed over many<br />
millennia as a consequence of exposure to vastly different climatic regimes. Most homes have an indoor<br />
temperature between 17 °C <strong>and</strong> 31 °C. Humans cannot live comfortably in temperatures outside this<br />
range.The tolerance range of an individual is usually less than this <strong>and</strong> tends to get narrower with age<br />
or infirmity.<br />
In European countries, people spend the vast majority of their time indoors, at home <strong>and</strong> at work.The<br />
indoor environment has been investigated in relation to indices of thermal comfort. Perceptual scales<br />
have been developed to evaluate thermal comfort in an individual (such as the ASHRAE scale). In<br />
temperate climates, the optimum indoor temperature for health is between 18 °C <strong>and</strong> 24 °C (WHO<br />
Regional Office for Europe,1987).Warmer climates have a higher limit of comfortable temperature,such<br />
as 28 °C in Greece <strong>and</strong> 25 °C in France. Most recommendations have focused on maintaining minimum<br />
indoor temperatures <strong>and</strong> reducing the impact of cold on health rather the potential impact of heat<br />
(WHO, 1990).<br />
When conditions differ from comfort conditions, productivity <strong>and</strong> efficiency are likely to be adversely<br />
affected. Reduced mental concentration because of discomfort can lead to an increased risk of<br />
accidents. In addition, some people with existing health conditions such as heart problems, high or low<br />
blood pressure, respiratory conditions <strong>and</strong> kidney disease may be susceptible to adverse health effects<br />
from working in hot <strong>and</strong>/or humid conditions.Thermal comfort is determined by subjective judgement,<br />
<strong>and</strong> even in optimal conditions, some individuals may experience discomfort.<br />
The indoor comfort temperature depends on the outdoor temperature (Fig. 24). The comfort<br />
thermopreferendum is not constant but depends on levels of acclimatization, habituation <strong>and</strong><br />
expectation (psycho-physiological adaptation) (Humphreys, 1978;Auliciems 1981, 1983, 1992).A study<br />
in a variety of cities found a linear relationship between the comfort indoor temperature <strong>and</strong> the mean<br />
monthly outdoor air temperature, especially in buildings that were free-running or naturally ventilated<br />
(De Dear & Brager, 2001).This relationship was valid for an outdoor temperature range between 5 °C<br />
<strong>and</strong> 32 °C.The lower outdoor temperature was associated with an indoor comfort temperature of 19 °C<br />
<strong>and</strong> the upper with 32 °C. In buildings with air-conditioning, the indoor temperature is decoupled from<br />
the outdoor temperature <strong>and</strong> the relationship between outdoor temperature <strong>and</strong> indoor comfort<br />
temperature is much less strong.<br />
Various studies show that many people wear the same clothing in different seasons, regardless of the<br />
climatic conditions prevailing outdoors in that location. An inherent assumption involved in this<br />
procedure is that the subjective reactions of people who stay indoors to temperature, air speed <strong>and</strong><br />
other factors are independent of the conditions prevailing outdoors (Givoni et al., 2003). Others studies<br />
show, however, even in air-conditioned buildings, a negative relationship between clothing insulation<br />
<strong>and</strong> outdoor temperature.<br />
Indoor air temperature, air movement, humidity <strong>and</strong> the radiation temperature of indoor surfaces affect<br />
the indoor thermal comfort. Another factor affecting health indoors is indoor air quality, which is not<br />
discussed here. Bitan (1988) states that, in most cases, planning buildings according to climatological<br />
rules does not significantly increase the building costs, but it improves the quality of life <strong>and</strong> money is<br />
saved by using less conventional energy for air-conditioning <strong>and</strong> heating.<br />
5. URBAN BIOCLIMATOLOGY<br />
83
5.5. Indoor environment<br />
84<br />
Fig. 24. Relationship between monthly mean outdoor temperature <strong>and</strong> comfort temperature<br />
Neutral or comfort temperature °C (tn)<br />
Ta °C<br />
Air-conditioned buildings, line B<br />
32<br />
30<br />
28<br />
26<br />
24<br />
22<br />
20<br />
18<br />
16<br />
14<br />
12<br />
–24 –22 –20 –18 –16 –14 –12 –10 –8 –6 –4 –2 0 2 4 6 8 10 12 14 16 18 20 22 24 26 28 30 32 34<br />
Monthly mean outdoor temperature °C (tn)<br />
Source: Humphreys (1978).<br />
Free-running buildings, line A<br />
Fig. 25. Indoor temperature on the first floor (Ta 1st floor) <strong>and</strong> third floor (Ta 3rd floor) of a building<br />
compared with the outdoor temperature (Ta DWD) in Freiburg, Germany<br />
40<br />
35<br />
30<br />
25<br />
20<br />
15<br />
10<br />
5<br />
0<br />
–5<br />
Ta 1st floor<br />
Ta 3rd floor Ta 3rd floor<br />
August 1997<br />
12.30<br />
9.30<br />
6.30<br />
3.30<br />
3.0<br />
21.30<br />
18.30<br />
15.30<br />
12.30<br />
9.30<br />
6.30<br />
3.30<br />
3.0<br />
21.30<br />
18.30<br />
15.30<br />
12.30<br />
9.30<br />
6.30<br />
3.30<br />
3.0<br />
21.30<br />
18.30<br />
15.30<br />
12.30<br />
9.30<br />
6.30<br />
3.30<br />
3.0<br />
21.30<br />
18.30<br />
15.30<br />
12.30<br />
9.30<br />
6.30<br />
3.30<br />
Source: Andreas Matzarakis, Meteorologisches Institut, Universität Freiburg, Freiburg, Germany, personal communication, 2003.
Fig. 25 shows the relationship between indoor <strong>and</strong> outdoor temperatures in a free-running three-storey<br />
building in summer in Freiburg, Germany. At night <strong>and</strong> during most of the day, temperatures in the<br />
buildings (third floor) are higher than outside. Nevertheless, peak temperatures outside on warm days<br />
(Ta > 25 °C) are higher than inside on the third floor.Another important aspect is that the temperatures<br />
on the third floor are about 4 °C higher than the temperatures on the first floor, <strong>and</strong> temperatures there<br />
are often cooler than outside. Many well designed buildings have quite a different temperature profile<br />
<strong>and</strong> are consistently cooler than outdoors on summer days.<br />
5.5.2. Adaptive behaviour, energy <strong>and</strong> sustainable buildings<br />
Humans exhibit a physiological response to thermal conditions, but clothing, buildings <strong>and</strong> many other<br />
social, economic, contextual <strong>and</strong> behavioural factors contribute to heat balance. In addition, thermal<br />
comfort (described as a state of mind) is in fact a mental <strong>and</strong> not a physiological construct.<br />
In practice, people do not react passively to the conditions buildings provide but interact actively with<br />
the buildings they occupy.Two typical types of interaction are:<br />
• adapting themselves (by such means as clothing, activity, posture, shivering or sweating) to the<br />
conditions they experience; <strong>and</strong><br />
• adjusting the conditions provided (such as by means of windows, blinds, heating or air-conditioning)<br />
to suit the occupants.<br />
These actions have to be taken within a social, economic <strong>and</strong> cultural context, but they mean that, in<br />
most cases, people learn to be comfortable in their usual environment. Provided that the changes to that<br />
environment are sufficiently slow <strong>and</strong> the cultural <strong>and</strong> social constraints are not too restrictive, people<br />
can also make themselves comfortable in a wide variety of environments.<br />
In more extreme environments, the need to keep warm (or cool) may use large amounts of energy.<br />
Buildings that are poorly designed can add to this burden through poor insulation, poor planning, overglazing<br />
<strong>and</strong> other aspects.They can also cause occupants to use electric lighting <strong>and</strong> other equipment<br />
more than necessary.Buildings account for about 50% of the energy used in industrialized countries,<strong>and</strong><br />
much of this is used in building services, especially in air-conditioned buildings, where much of the<br />
energy is used as electricity.<br />
Using air-conditioning to overcome the heat stress caused by global warming constitutes a potentially<br />
dangerous positive feedback loop. Air-conditioning leads to more energy use, which results in more<br />
carbon dioxide being emitted (unless energy that does not cause carbon dioxide emission, such as solar<br />
or wind energy, is used), which causes more warming, which requires more air-conditioning. Being<br />
consistent <strong>and</strong> sustainable means that heat stress should be avoided without relying on high-energy<br />
solutions. With good design, buildings can provide conditions that occupants find acceptable or even<br />
positively enjoyable!<br />
This requires that buildings:<br />
• work with <strong>and</strong> not against climate <strong>and</strong> people’s natural ability to adapt;<br />
• enable occupants to exert control over their environment; <strong>and</strong><br />
• provide constant <strong>and</strong> consistent indoor conditions that occupants can learn to enjoy.<br />
In addition,people (or their managers) must not constrain people’s adaptive opportunities by restricting<br />
access to controls,variability in clothing <strong>and</strong> activity etc.<strong>and</strong> work with building managers to ensure the<br />
optimal working of the buildings.<br />
5. URBAN BIOCLIMATOLOGY<br />
85
5.5. Indoor environment<br />
Finally, replacing fossil fuels by renewable energy, especially building-integrated electricity generation,<br />
means that future buildings may be developed that are energy-neutral or even net contributors to the<br />
energy economy.<br />
5.5.3. Building design<br />
Buildings are designed to have a long lifetime. Climate change (such as the increasing numbers of<br />
extremely hot days), changing lifestyles <strong>and</strong> new technologies all have implications for building design.<br />
With respect to climate change, designing comfortable, energy-efficient <strong>and</strong> safe buildings is a priority.<br />
In particular, the design should aim to limit both the frequency of occurrence of high-temperature<br />
episodes inside the building <strong>and</strong> their indoor intensity <strong>and</strong> duration.Traditional building designs have<br />
evolved in harmony with the environment <strong>and</strong> usually provide adequate protection against the heat. In<br />
recent decades, rapid urbanization seems to have led to an increase in poor building design in many<br />
cities. Thus, populations in these dwellings are less adapted <strong>and</strong> perhaps more vulnerable to heat<br />
episodes.<br />
Technological advancements have permitted the design of structures that emphasize engineered<br />
approaches to interior climate control.As a result, modern structures often do not reflect local climates,<br />
needlessly consume large amounts of energy <strong>and</strong> assume a uniform level of comfort for the building<br />
occupants. Architectural design can prevent buildings from warming up <strong>and</strong> thereby ensure a<br />
comfortable indoor environment without using energy-intensive air-conditioning. Table 18 describes<br />
techniques that can reduce indoor heat stress in hot <strong>and</strong> dry environments. Natural cooling techniques<br />
should be favoured in all future building or retrofitting to old buildings. The effective use of simple<br />
natural cooling strategies in hot climate building design can reduce internal temperatures both day <strong>and</strong><br />
night (WHO, 1990).<br />
Inside the building, climate is controlled by (Givoni, 1986):<br />
• the geometrical configuration of the building;<br />
• the orientation of the building;<br />
• the size <strong>and</strong> location of windows;<br />
• the properties of the building materials; <strong>and</strong><br />
• the colours of external surfaces.<br />
The following building design objectives are suggested (Givoni, 1986):<br />
1. minimize solar heating of the building during the hot season;<br />
2. minimize the rate of indoor temperature elevation in summer during daytime;<br />
3. maximize the rate of cooling of the indoor temperature in summer during evening <strong>and</strong> ensure<br />
indoor comfort at night;<br />
4. utilize natural energy for passive cooling in summer;<br />
5. minimize the heat loss of the building in winter; <strong>and</strong><br />
6. utilize passive solar energy systems for heating in winter.<br />
These building objectives can be achieved by the architectural features listed in Table 18. For example,<br />
constructing more compact houses adversely affects objective 3 but positively affects objectives 1, 2 <strong>and</strong> 5.<br />
86
TABLE 18. ARCHITECTURAL FEATURES AFFECTING THE PERFORMANCE OF A BUILDING TO REDUCE THERMAL STRESS<br />
Architectural<br />
feature<br />
Building layout<br />
Building orientation<br />
<strong>and</strong> shading objectives<br />
Window size <strong>and</strong> location<br />
Colours of the building<br />
Thermal properties of<br />
building materials<br />
Building height<br />
(Nieuwolt, 1986)<br />
Kitchens, water heaters<br />
<strong>and</strong> bathrooms on the<br />
leeward side (Nieuwolt,<br />
1986)<br />
Effect or building strategies<br />
The more compact the house, the smaller the surface area of the walls for a given floor area.<br />
The more compact the house, the more electric lighting needed.<br />
Effects on energy use <strong>and</strong> heat release.<br />
A passive solar building may use its southern wall <strong>and</strong> windows as the solar collection elements.<br />
Buildings elongated along the east–west axis will be more energy efficient than a square<br />
building despite their larger wall surface area.<br />
Highest intensities of the impinging solar radiation:<br />
• summer: eastern <strong>and</strong> western walls<br />
• winter: southern wall.<br />
A north–south orientation for the main façades <strong>and</strong> windows.<br />
Natural ventilation: hot, dry regions require small windows.<br />
The difference in maximum surface temperature between a white <strong>and</strong> a black roof in a desert<br />
can be about 40 °C. The heat gain depends on the insulation.<br />
White roofs are best.<br />
High thermal insulation coupled with effective shading.<br />
High heat capacity.<br />
Only for humid regions: construction of tall buildings because wind speed increases with<br />
elevation while temperature <strong>and</strong> humidity tend to decrease.<br />
<strong>Heat</strong> can be rapidly removed by draught.<br />
Sources: adapted from Givoni (1986) <strong>and</strong> Nieuwolt (1986).<br />
5. URBAN BIOCLIMATOLOGY<br />
Negative<br />
effects on<br />
objectives<br />
3, 2 (lights)<br />
1, 2, 5<br />
3, 6<br />
6<br />
3<br />
3<br />
5<br />
5<br />
87<br />
Positive<br />
effects on<br />
objectives<br />
1, 2, 5<br />
3, 6<br />
1, 2, 5, 6<br />
1, 2, 5<br />
1, 2<br />
1, 2, 5<br />
1, 2, 5<br />
3, 4<br />
2, 3
5.5. Indoor environment<br />
5.5.4. Air-conditioning<br />
Air-conditioning (space cooling) in homes, at working places <strong>and</strong> in public <strong>and</strong> commercial buildings<br />
provides a cooled environment <strong>and</strong> reduces people’s exposure to high temperature. Evidence from the<br />
United States indicates that air-conditioning seems to be an effective intervention in preventing heat<br />
stroke <strong>and</strong> heat-related illness during a heat-wave (Marmor, 1975; Kiernan, 1996; Semenza et al., 1996).<br />
More than 80% of homes in the United States have air-conditioning. Air-conditioning has significantly<br />
reduced the death rate during hot weather: by 42% for those with central air-conditioning. Single-room<br />
air-conditioning did not confer a substantial benefit over no air-conditioning (Rogot et al., 1992), <strong>and</strong><br />
moving from unventilated, indoor locations to air-conditioning reduced the mortality risk of individuals<br />
by a factor of about 5–6 during the 1995 Chicago heat-wave (Chan et al., 2001; Semenza et al., 1996).A<br />
study the Energy Information Agency carried out in the United States in 2003 found that the mortality<br />
decline from the 1980s to the 1990s was linked with increased air-conditioning penetration. In addition,<br />
air-conditioning reduces the penetration of (polluted) outdoor air to indoor air <strong>and</strong> ventilation<br />
exchange. Associations between hospital admissions <strong>and</strong> airborne particles in 14 United States cities<br />
were significantly lower in cities with a higher prevalence of air-conditioning (Janssen et al., 2002).<br />
Nevertheless, air-conditioning has disadvantages, being associated with negative effects that directly or<br />
indirectly affect human health. Air-conditioning increases energy consumption, which increases<br />
greenhouse gas emissions if no carbon dioxide-neutral technology is used for energy production. Power<br />
plants may fail especially during heat-waves, when the energy dem<strong>and</strong> rises <strong>and</strong> they emit pollutants,<br />
which endangers air quality. Air-cooling devices spread microbes, such as that causing Legionnaire’s<br />
disease (Merz, 1993), <strong>and</strong> inadequate maintenance puts the indoor air quality at risk.The sick-building<br />
syndrome is more prevalent in air-conditioned buildings. Auliciems & De Dear (1986) conducted a<br />
survey about the perceived disadvantages of air-conditioning in offices in Darwin, Australia. The<br />
perceived disadvantages included health issues such as general health problems, excessively cold indoor<br />
environments <strong>and</strong> great thermal gradients between indoor <strong>and</strong> outdoors.The perceived advantages were<br />
coolness <strong>and</strong> comfort <strong>and</strong> productivity, concentration <strong>and</strong> ease of paperwork. It is not very surprising<br />
that the factors ranking highest in the perceived disadvantages of home air-conditioning were the costs<br />
followed by health issues.The perceived advantages were better sleep <strong>and</strong> comfort <strong>and</strong> relief.<br />
The energy use of air-conditioning can also be reduced by letting the indoor temperature drift with<br />
outdoor temperature, thus reducing the amount of cooling the air-conditioning system has to provide.<br />
Air-conditioning often counteracts good building design because architects can use air-conditioning to<br />
avoid responsibility for providing comfort for the building occupants in more natural ways.<br />
Anthropogenic heat production worsens the urban heat isl<strong>and</strong> effect: Wilby (2003) assumes that the<br />
increasing trend in the nocturnal urban heat isl<strong>and</strong> in London in spring, summer <strong>and</strong> autumn is caused<br />
in part by the greater use of air-conditioning in recent decades. The need to use extra energy to<br />
counteract the urban heat isl<strong>and</strong> disproportionally affects resource-constrained people, who often live<br />
in urban areas <strong>and</strong> thus face the heat isl<strong>and</strong> phenomenon even more.<br />
However, quantifying the role of air-conditioning in reducing mortality is difficult because of multiple<br />
confounding factors. Davis et al. (2003) pose interesting questions, such as whether air-conditioning is<br />
indeed the main cause of the observed declines. Once air-conditioning penetration approaches market<br />
saturation, will heat continue to significantly influence mortality in the United States? Will airconditioning<br />
be available to all socioeconomic classes? Will future changes in energy markets <strong>and</strong><br />
pricing inadvertently force some people to put their health at risk during heat-waves? Can poorer<br />
people afford to buy <strong>and</strong> operate air-conditioning? What is the role of energy efficiency st<strong>and</strong>ards <strong>and</strong><br />
changing policies?<br />
Providing air-conditioned public spaces (cooling centres) <strong>and</strong> offices <strong>and</strong> improving social conditions<br />
<strong>and</strong> assistance to the people at risk may reduce disparities in the effects of heat on mortality (O’Neill,<br />
2003).<br />
88
5.6. Potential impact of climate change on urban<br />
climate<br />
5.6.1. Introduction<br />
Increasing urbanization <strong>and</strong> associated changes in l<strong>and</strong> use significantly modify the local <strong>and</strong> regional<br />
climate. Large-scale atmospheric parameters that are relevant for energy budgets are likely to change as<br />
the climate warms. Such changes will affect the bioclimatic situation in urban areas (Wagner, 1994,<br />
1999).<br />
Climate change is anticipated to increase the frequency of days above a temperature threshold because<br />
even small increases in average temperature can result in large shifts in the frequency of extremes.<br />
However,whether climate change will be associated with an increase in the magnitude of the urban heat<br />
isl<strong>and</strong> effect is uncertain.An increase in baseline temperatures may increase the total thermal burden on<br />
the city but not necessarily alter the urban–rural difference (Oke, 1997). The magnitude of the heat<br />
isl<strong>and</strong> is modulated by the prevailing synoptic weather. If the regional climate of a city shifts to more<br />
anticyclonic conditions, the heat isl<strong>and</strong> may be enhanced; otherwise, if the shift is to more cyclonic<br />
conditions, the urban-rural temperature difference may decrease (Oke, 1997).<br />
Assessing the possible impact of future climate change on urban climate is difficult. Current projections<br />
of climate change using general circulation models do not provide output at a suitable spatial resolution.<br />
Further, information on extreme values is required as reliable input to any kind of local study (Dalfes,<br />
1991).The impact of global climate change on urban areas can be categorized in two sets (Farago,1991):<br />
• the impact on climatic features; <strong>and</strong><br />
• the impact on the chemical composition of the urban air.<br />
Assessing the impact of climate change on urban climate in the future requires the following<br />
investigations (Gross, 1996):<br />
• assessing the baseline climate;<br />
• determining the regional impact of global climate change;<br />
• taking into account the specific geographical situation of the city; <strong>and</strong><br />
• taking into account nonclimatic factors, such as technological innovations, motorized transport,<br />
behavioural aspects <strong>and</strong> cultural trends.<br />
5.6.2. Projections of the impact of climate change on European cities<br />
A few studies have been undertaken that have applied climate scenarios to specific cities to estimate<br />
future changes in bioclimatic indices (Annex 4).<br />
The output of general circulation models needs to be downscaled for the assessment of the urban<br />
climate.Wagner (1994) nested a regional climate model to get a resolution suitable for cities.The error<br />
in the output of general circulation models is often greater than 20%, which also increases the<br />
uncertainty of the urban heat isl<strong>and</strong> estimates. Further, these studies do not consider future changes in<br />
non-climatic factors (such as population growth, building density <strong>and</strong> energy consumption) <strong>and</strong> impact<br />
on the urban climate.<br />
5. URBAN BIOCLIMATOLOGY<br />
89
5.6. Potential impact of climate change on urban climate<br />
5.6.3. Case study: Tel Aviv<br />
A research project was carried out on the climate of Tel Aviv, Israel.The heat isl<strong>and</strong> of the city has been<br />
identified <strong>and</strong> the heat stress has been calculated. It was decided to examine what would happen if<br />
warming affects the urban area of Tel Aviv according to expected forecasts of global warming or because<br />
of increasing density, compactness <strong>and</strong> activities. A progressive change of 1 °C was taken into<br />
consideration. In July 1990, the heat stress in the core of the Tel Aviv heat isl<strong>and</strong> was in the upper<br />
“moderate” range <strong>and</strong> slightly lower close to the beach (Fig. 26). Raising the temperature each time by<br />
1 °C to the upper expected limit of 4 °C causes drastic changes in heat stress (Fig. 26). From the level<br />
of “moderate”, heat stress in Tel Aviv will increase <strong>and</strong> reach the level of “severe”, with high absolute<br />
values, like those of the harshest climatic zones of Israel (Bitan, 2003).<br />
<strong>Heat</strong> stress is defined based on the discomfort index (DI), which has the following formula (Bitan &<br />
Potcher, 1995).<br />
DI = ”0.5 * (dry bulb temperature + wet bulb temperature)<br />
The following classification is used for mild, moderate <strong>and</strong> severe heat stress:<br />
Less than 22.0 °C <strong>No</strong> heat stress<br />
22.0–23.9 °C Mild heat stress<br />
24.0–27.9 °C Moderate heat stress<br />
28.0 °C or more Severe heat stress<br />
As illustrated by the example of Tel Aviv, intensification of heat stress will result in an increase in airconditioning,<br />
which means the need for more energy, mainly produced by fossil resources. Beside the<br />
increased carbon dioxide emission <strong>and</strong> its impact on greenhouse effect, it will cause the addition of the<br />
direct surplus of sensible heat energy into the urban atmosphere (Bitan, 2003).<br />
90
Fig. 26. Hourly heat stress in Tel Aviv<br />
Hourly heat stress<br />
in Tel Aviv<br />
July 1990<br />
Marina<br />
City Centre<br />
Hourly heat stress<br />
in Tel Aviv<br />
July 1990 +1 °C<br />
Marina<br />
City Centre<br />
Hourly heat stress<br />
in Tel Aviv<br />
July 1990 +4 °C<br />
Marina<br />
City Centre<br />
Source: Bitan (2003).<br />
Hear stress units<br />
Hear stress units<br />
Hear stress units<br />
30<br />
29<br />
28<br />
27<br />
26<br />
25<br />
24<br />
23<br />
22<br />
21<br />
20<br />
30<br />
29<br />
28<br />
27<br />
26<br />
25<br />
24<br />
23<br />
22<br />
21<br />
20<br />
32<br />
31<br />
30<br />
29<br />
28<br />
27<br />
26<br />
25<br />
24<br />
23<br />
22<br />
severe<br />
moderate<br />
mild<br />
1 4 7 10 13<br />
Hours<br />
16 19 22<br />
severe<br />
moderate<br />
mild<br />
1 4 7 10 13<br />
Hours<br />
16 19 22<br />
severe<br />
moderate<br />
mild<br />
1 4 7 10 13 16 19 22<br />
Hours<br />
5. URBAN BIOCLIMATOLOGY<br />
91
5.7. Discussion <strong>and</strong> recommendations<br />
5.7. Discussion <strong>and</strong> recommendations<br />
Appropriate planning <strong>and</strong> building measures can reduce the impact of the urban heat isl<strong>and</strong> on human<br />
health. Green spaces can prevent cities from heating up so much, <strong>and</strong> adapted building design allows<br />
gains in thermal comfort conditions inside buildings without artificial air-conditioning.At night, indoor<br />
conditions are more relevant for thermal comfort <strong>and</strong> recreation <strong>and</strong> sleep depth. During the day,<br />
however, indoor as well as outdoor conditions affect thermal comfort.<br />
Assessing the contribution of individual planning measures in reducing outdoor heat stress is challenge.<br />
Although spatial bioclimatic information helps in assessing the different heat stress levels in different<br />
urban structures, assessing the heat load to which an individual is exposed during a specific period of<br />
time is difficult.<br />
Projecting the thermal stress in urban areas under changed climate conditions is very difficult. Climate<br />
scenarios must be downscaled to assess the regional climate changes, <strong>and</strong> then the impact of these<br />
regional changes must be linked to the urban climate.As the urban climate is not only influenced by the<br />
regional climate but also by changes in population, building density, energy use <strong>and</strong> other factors,<br />
changes in all these other factors have to be addressed to assess the future urban climate. <strong>Heat</strong>-waves<br />
will be more intense <strong>and</strong> more frequent. Studies modelling the urban thermal environment <strong>and</strong> climate<br />
change indicate that the heat load on individuals will increase.<br />
5.7.1. Discussion: urban heat isl<strong>and</strong>s<br />
<strong>Heat</strong> isl<strong>and</strong>s are the most well known phenomenon of the urban climate. During heat-waves, the urban<br />
heat isl<strong>and</strong> puts additional heat load on human beings. Urban heat isl<strong>and</strong>s affect human health, although<br />
the impact of any reduction of the heat isl<strong>and</strong> may be minimal. However, not all urban effects are<br />
negative. In winter, the urban heat isl<strong>and</strong> might be beneficial by saving heating energy. In addition, a city<br />
provides a variety of microclimates that allow individuals to choose their preferred environment.The<br />
thermal differences within the various urban microclimates might be greater than the difference<br />
between the (spatial means of the) urban climate <strong>and</strong> the rural climate. The larger a city, the more<br />
pronounced the urban heat isl<strong>and</strong> <strong>and</strong> the higher the risk of heat stress in summer.<br />
Urban planners should be aware of the health relevance of the urban climate <strong>and</strong> how urban planning<br />
affects urban climate.Appropriate urban planning should have the following objectives:<br />
• reducing the heat isl<strong>and</strong> in summer;<br />
• reducing the heat load on buildings;<br />
• diminishing the problem of high night-time indoor temperature; <strong>and</strong><br />
• taking climate change into account in planning new districts <strong>and</strong> buildings <strong>and</strong> in setting up new<br />
regulations on building <strong>and</strong> urban development.<br />
Several measures can be taken to reduce the heat load to which an individual is exposed in a city, such<br />
as planting trees or building houses with arcades that provide shade.At night, when solar radiation does<br />
not play a role, cities can cool down. Planners should therefore consider allowing cool air from the<br />
surroundings to penetrate the city by maintaining ventilation paths. However, redesigning the city on a<br />
larger scale is usually generally illusionary, <strong>and</strong> planning measures are usually restricted to a small part<br />
of the city.<br />
92
5.7.1.2. How can measures be implemented?<br />
European Union countries have different strategies for implementing measures to reduce the urban heat<br />
isl<strong>and</strong>. Climate design should be included in town planning <strong>and</strong> building code legislation, such as in<br />
Germany.For example,building regulations might include planning measures that reduce the urban heat<br />
isl<strong>and</strong>. Examples of planning aspects that are regulated in Germany are the height of the buildings, the<br />
building density <strong>and</strong> the kind of trees to be planted along the streets. However, this approach may not<br />
be able to be extended to other European countries.<br />
Building regulations should not only reduce thermal stress but also reduce air pollution <strong>and</strong> try to<br />
increase the quality of life in the city. Incorporating all these aspects makes planning a difficult <strong>and</strong><br />
complex problem. However, appropriate planning <strong>and</strong> ensuring green spaces provide additional<br />
benefits, including increasing a city’s attractiveness for business <strong>and</strong> tourism.<br />
Building regulations should not only be valid for new built-up areas but should also be incorporated<br />
when parts of the city undergo renovation. In addition, planners must be able to include the climaterelevant<br />
building regulations in the planning process.This, in turn, means that planners <strong>and</strong> architects<br />
must be trained in climate-relevant planning <strong>and</strong> building. Awareness must not only be increased for<br />
planners <strong>and</strong> architects but also for the local administration <strong>and</strong> the policy-makers who are in charge of<br />
establishing the regulations <strong>and</strong> ensuring compliance. Educational material must be written in the<br />
language of the different target groups (policy-makers, local administrators, planners <strong>and</strong> architects).<br />
Quantifying the climatic effects of different planning options requires models <strong>and</strong> experimental results.<br />
Modelling shows the benefits <strong>and</strong> costs of even small changes in the urban structure. Such models need<br />
a broad climatic data base to become an operational tool for urban planners.<br />
5.7.2. Discussion: indoor thermal comfort<br />
One adaptation option to reduce heat load in a changing climate is to maintain or increase indoor<br />
thermal comfort. Several points should be considered to maximize indoor thermal comfort. One is that<br />
climate-adapted building <strong>and</strong> energy-efficient design should be stressed over air-conditioning.This point<br />
gains importance in case of an energy crisis. Conversion from an active to a passive energy building will<br />
be difficult <strong>and</strong> costly if the price of energy increases markedly. Air-conditioning should therefore not<br />
be promoted before other options in building design are explored, including shading, glazing,<br />
orientation <strong>and</strong> thermally induced natural ventilation. Such options include (see also section 5.5.3):<br />
• shading of the building, which reduces the impact of solar radiation in summer;<br />
• trees <strong>and</strong> plants to shade walls <strong>and</strong> windows in summer <strong>and</strong> other shading devices for windows;<br />
• highly insulative building materials;<br />
• bright colours on all surfaces;<br />
• orientation <strong>and</strong> window size; <strong>and</strong><br />
• ventilation.<br />
Some of these building options that are beneficial in summer might detrimentally affect winter indoor<br />
climate <strong>and</strong> lead to higher energy consumption in winter (for example, brightly coloured buildings<br />
reduce energy gain in winter).Thus, summer benefits <strong>and</strong> winter costs should be carefully balanced, <strong>and</strong><br />
all these planning strategies should be well implemented. As climate characteristics differ in northern<br />
<strong>and</strong> southern Europe, the strategies that reduce indoor thermal stress should be related to climate.<br />
Strategies that are only beneficial in southern Europe because the winter is mild might be detrimental<br />
in winter in northern Europe.<br />
5. URBAN BIOCLIMATOLOGY<br />
93
5.7. Discussion <strong>and</strong> recommendations<br />
Architects must be educated so that they can assess what strategies to use to optimize thermal comfort<br />
with very little additional heating or cooling energy.<strong>No</strong>t only the architects must be educated.Education<br />
campaigns must also target the general public, telling them about the proper use of windows <strong>and</strong><br />
shading devices or that avoiding cooking during hot periods is beneficial. Both education campaigns<br />
(architects <strong>and</strong> the public) must focus on explaining that especially high night-time temperatures<br />
detrimentally affect health.<br />
5.7.3. Lessons learned<br />
Hot countries already have strategies to reduce the impact of heat indoors <strong>and</strong> outdoors in cities.Those<br />
strategies now have to be transferred <strong>and</strong> adapted to the countries of central <strong>and</strong> northern Europe.<br />
Including local requirements in these strategies is important. Other important lessons can be learned<br />
from poor urban design. Ensuring that urban planning <strong>and</strong> building designs take climatic aspects into<br />
account requires incorporating these climatic aspects in building codes in a more detailed way such is<br />
done in Germany.<br />
In the United States, the cities with the best urban planning strategies are those with the highest<br />
environmental pressure to protect the citizens from natural hazards. Unfortunately, heat-waves are often<br />
not seen as an environmental hazard that kills.Measures to reduce urban heat isl<strong>and</strong>s in some cities have<br />
been only side-effects of other measures or intentions. In Chicago, a tree-planting project was started<br />
because of the need to protect the power supply by reducing urban temperatures,not to protect human<br />
health.And in Italy a political party planted many trees during an election campaign.<br />
Green spaces can be promoted in cities by including them in building regulations or subsidizing the<br />
planting of trees <strong>and</strong> other plants. In Belgium, for example, people are given subsidies to build a green<br />
roof to retain water.Again, the purpose is not to reduce the urban heat isl<strong>and</strong> but to reduce flooding,<br />
but with a side-effect for the urban climate.<br />
94
6. CONCLUSIONS AND RECOMMENDATIONS<br />
The heat-wave of summer 2003 has shown that Europe is vulnerable to the effects of heat-waves on<br />
human health. A number of concomitant factors contributed to the high excess mortality in some<br />
countries, such as the unexpected length <strong>and</strong> intensity of the heat-wave, the lack of preparedness of<br />
health care <strong>and</strong> social systems for such an event, the lack of intervention plans <strong>and</strong> the lack of effective<br />
technical solutions.<br />
There are gaps in underst<strong>and</strong>ing the effectiveness of early warnings <strong>and</strong> alerts, but gathering better<br />
insight on how best to set up such systems <strong>and</strong> which effective intervention strategies to recommend<br />
at the European level will be difficult until more systems have been implemented <strong>and</strong> evaluated.<br />
The recommendations <strong>and</strong> conclusions of this report target the research community, public health<br />
agencies <strong>and</strong> meteorological services <strong>and</strong> sectors involved in housing <strong>and</strong> urban planning <strong>and</strong> design.<br />
6.1. The research community<br />
The following need to be better understood:<br />
• the role of minimum, maximum or daily mean thermal conditions on heat-related mortality <strong>and</strong><br />
morbidity,which is still unclear <strong>and</strong> difficult to distinguish because the meteorological parameters are<br />
closely correlated;<br />
• the effectiveness of public health measures <strong>and</strong> interventions in the European context; <strong>and</strong><br />
• the responses of elderly people <strong>and</strong> other vulnerable groups to heat:<br />
– physiological effects;<br />
– the role of behaviour in responding to higher ambient temperatures;<br />
– the development of appropriate heat advice messages.<br />
Although much research has been performed in urban climatology, future research needs to address<br />
some questions.<br />
• The potential of single planning measures <strong>and</strong> strategies in reducing the urban heat isl<strong>and</strong> <strong>and</strong> the<br />
heat load <strong>and</strong> benefiting individuals needs to be evaluated, including how this affects health <strong>and</strong> the<br />
costs <strong>and</strong> benefits.<br />
• More detailed methods <strong>and</strong> models need to be developed to assess indoor <strong>and</strong> outdoor thermal stress<br />
under changed climatic conditions.<br />
• How does outdoor climate affect thermal comfort indoors <strong>and</strong> thereby health?<br />
• Fig. 26 shows that indoor temperatures are higher on the upper floors than downstairs.An interesting<br />
research project would therefore be to investigate individual housing <strong>and</strong> exposure characteristics of<br />
people who get heat illnesses.The hypothesis is that a relatively high percentage of these people live<br />
on upper floors or under the roofs of poorly insulated houses.<br />
• The relationships between outdoor temperatures, urban heat isl<strong>and</strong>s <strong>and</strong> the individual risk of heatrelated<br />
mortality needs to be investigated further.<br />
95
• More research has to be done on how climate <strong>and</strong> global change will affect the thermal environment<br />
of cities:<br />
– more detailed regional <strong>and</strong> local climate models – downscaling to the urban level;<br />
96<br />
– including more detailed climate simulation in integrated assessment models; <strong>and</strong><br />
– developing special urban scenarios.<br />
6.2. Public health agencies <strong>and</strong> meteorological services<br />
Based on the experience of summer 2003,countries <strong>and</strong> cities need to start thinking about whether they<br />
should develop heat health warning systems <strong>and</strong> intervention plans. Several recommendations can be<br />
made for implementing such systems based on the experiences of existing heat health warning systems.<br />
<strong>Heat</strong> health warning systems can be set up in a range of European cities,once heat-waves are recognized<br />
as presenting a potential threat to human health <strong>and</strong> the necessary collaboration between<br />
meteorological services <strong>and</strong> public health agencies is started. Systems need to be shared under joint<br />
responsibility. The national <strong>and</strong> local levels might further discuss which other institutions should be<br />
involved to ensure proper intervention planning. Funding mechanisms need to be ensured throughout<br />
the whole process.<br />
Because climate <strong>and</strong> culture differ within Europe, heat health warning systems should be developed to<br />
fit the local setting. One very important aspect is to adjust information flow <strong>and</strong> intervention measures<br />
to the local needs <strong>and</strong> the available infrastructure. However, having some st<strong>and</strong>ardization across systems<br />
to facilitate comparison <strong>and</strong> knowledge transfer would be beneficial. Regional coherence is required so<br />
that warnings are consistent from one town to the next.<br />
The methods used for developing the warnings need to reflect the physiological relevance of the<br />
thermal environment. The warning indicator must be based on data that are easily available for the<br />
region of interest. Independent of the heat-wave indicator chosen, more than one level of warning is<br />
needed.The thresholds of the warning indicator should allow for adaptation to be included, combining<br />
a relative (local) <strong>and</strong> an absolute component. This ensures that, even under nonstationary climatic<br />
conditions (climate change <strong>and</strong> climate variability), thresholds <strong>and</strong> warning indicators will not have to<br />
be changed.<br />
Any heat advice message should be adapted to the social <strong>and</strong> behavioural context of the target<br />
population, especially for northern, southern <strong>and</strong> eastern Europe. Different heat advice messages should<br />
be given to different target groups.As the advice given during a heat-wave should be place specific <strong>and</strong><br />
include various cultural aspects, more detailed advice will be needed for the populations of northern<br />
Europe that are not used to heat than for populations that are used to coping with heat.<br />
The warnings should target the whole population <strong>and</strong> especially groups that are more vulnerable <strong>and</strong><br />
the institutions <strong>and</strong> organizations that are responsible for their welfare. In addition, the warnings should<br />
also be sent to institutions, such as health service providers, general practitioners, organizers of sport<br />
events <strong>and</strong> care workers.Warnings should also be communicated to electricity providers to avoid power<br />
failures.<br />
During periods of severe heat, not only heat itself affects human health but also ultraviolet radiation,<br />
ground-level ozone <strong>and</strong> other air pollutants that are directly or indirectly related to the weather<br />
conditions.To avoid many separate warnings <strong>and</strong> advisories, the advice about heat should be linked to<br />
advice about protection from ultraviolet radiation, <strong>and</strong>, if appropriate, air pollution. Educational<br />
strategies are very important in raising the awareness of the hazard so that the population is prepared<br />
when a heat-wave occurs.
Current evidence indicates that government services <strong>and</strong> health agencies are poorly prepared for severe<br />
heat-waves. Governments do not perceive heat as a problem. Because of the predominantly simple<br />
measures used to mitigate heat effects, the government services are underestimating the health risks.<br />
<strong>Heat</strong>-waves are often accompanied by power failures <strong>and</strong> failures in water supply. <strong>Heat</strong>-waves should<br />
therefore be included in emergency planning at the local <strong>and</strong> national level.<br />
6.3. Long-term intervention strategies<br />
These measures are short-term strategies to enable populations to cope with acute problems, but other<br />
strategies to cope with climate change might be necessary in the long term.These strategies are outside<br />
the scope of the public health services, but an accurate health impact assessment of these strategies<br />
might become necessary.<br />
Hot countries already have strategies to reduce the impact of heat indoors <strong>and</strong> outdoors in cities.Those<br />
strategies now have to be transferred <strong>and</strong> adapted to the countries of central <strong>and</strong> northern Europe.<br />
Including local requirements in these strategies is important. Other important lessons can be learned<br />
from poor urban design. Ensuring that urban planning <strong>and</strong> building designs take climatic aspects into<br />
account requires incorporating these climatic aspects in building codes in a more detailed way such is<br />
done in Germany.<br />
• Build <strong>and</strong> design for future climate. In Europe, new buildings are planned to last several decades.<br />
The future climate should therefore be taken into account in constructing new buildings <strong>and</strong><br />
planning new parts of the city to provide as much thermal comfort as possible today <strong>and</strong> in the future.<br />
• Emphasize conserving energy. Use renewable energy (solar energy does not affect the urban heat<br />
isl<strong>and</strong> in the short term) for heating <strong>and</strong> cooling purposes. Fossil fuels release carbon dioxide, thus<br />
increasing the greenhouse effect.<br />
• Reduce the number of motor vehicles. Every motor vehicle is a source of anthropogenic heat <strong>and</strong><br />
thus worsens the urban heat isl<strong>and</strong> <strong>and</strong> urban climate.<br />
• Develop information systems on the urban climate.<br />
• Maintain high natural levels of heat acclimatization. This can be achieved by an active lifestyle<br />
(fitness) with properly adjusted climatic exposure (behaviour <strong>and</strong> climate) (Havenith, 2001a).<br />
6. CONCLUSIONS AND RECOMMENDATIONS<br />
97
REFERENCES<br />
Adebayo YR (1991). <strong>Heat</strong> isl<strong>and</strong> development in a humid tropical city <strong>and</strong> its relationship with potential<br />
evaporation. Theoretical <strong>and</strong> Applied Climatology, 43:137–147.<br />
Alberdi JC et al. (1998). Daily mortality in Madrid Community (Spain) 1986–1991: relationship with<br />
atmospheric variables. European Journal of Epidemiology, 14:571–578.<br />
Ali SA (2000). Some peculiar features of the urban climate of Addis Abeba. In: de Dear RJ et al., ed.<br />
Biometeorology <strong>and</strong> urban climatology at the turn of the millennium: selected papers from the<br />
Conference ICB-ICUC’99 (Sydney, 8–12 <strong>No</strong>vember 1999). Geneva, World Meteorological<br />
Organization (WMO/TD <strong>No</strong>. 1026,WCASP-50).<br />
Anderson GS (1999). Human morphology <strong>and</strong> temperature regulation. International Journal of<br />
Biometeorology, 43:99–109.<br />
Armstrong LE (1998). <strong>Heat</strong> acclimatization. In: Fahey TD, ed. Encyclopedia of sports medicine <strong>and</strong><br />
science. Internet Society for Sport Science (http://www.sportsci.org/encyc/heataccl/heataccl.html,<br />
accessed 29 October 2003).<br />
Armstrong LE, Dziados JE (1986). Effects of heat exposure on the exercising adult. In: Bernhadt DB, ed.<br />
Sports physical therapy.New York,Churchill Livingstone.<br />
Arnfield AJ (2003).Two decades of urban climate research: a review of turbulence, exchanges of energy<br />
<strong>and</strong> water, <strong>and</strong> the urban heat isl<strong>and</strong>. International Journal of Climatology, 23:1–26.<br />
Asaeda T, Ca VT, Wake A (1996). <strong>Heat</strong> storage of pavement <strong>and</strong> its effect on the lower atmosphere.<br />
Atmospheric Environment, 30:413–427.<br />
Asaeda T, Fujino T,Arnfield SW (2000). Effects of a drainage flow from surrounding mountains on urban<br />
heat isl<strong>and</strong> of a city located at the bottom of a basin. In: Preprints of the Third Symposium on the<br />
Urban Environment, August 2000, Davis, CA, USA.Boston,American Meteorological Society:82–83<br />
(http://ams.confex.com/ams/AugDavis/techprogram/paper_15186.htm, accessed 29 October 2003).<br />
Auger N, Kosatsky T (2002). Chaleur accablante: Mise à jour de la littérature concernant les impacts<br />
de santé publique et proposition de mesures d’adaptation.Montréal, Régie régionale de la santé et<br />
des services sociaux de Québec, Direction de la santé publique.<br />
Auliciems A (1981).Towards a psycho-physiological model of thermal perception.International Journal<br />
of Biometeorology, 25:109–122.<br />
Auliciems A (1983). Psycho-physiological criteria for global thermal zones of building design.<br />
International Journal of Biometeorology, 26(Suppl. 2):69–86.<br />
Auliciems A (1992). Greenhouse warmed Europe: thermoregulatory criteria for future indoor climate<br />
management. International Journal of Biometeorology, 36:201–209.<br />
Auliciems A, De Dear R (1986).Air conditioning in a tropical climate: impacts upon European residents<br />
in Darwin,Australia. International Journal of Biometeorology, 30:259–282.<br />
Babayev AB (1986). Some aspects of man's acclimatization to hot climates. In: Proceedings of the<br />
Symposium on Climate <strong>and</strong> Human <strong>Health</strong>, Volume 2. Leningrad, World Meteorological<br />
Organization:125–126.<br />
98
Bai Y, Kubo S (2000). Measuring <strong>and</strong> monitoring urban heat isl<strong>and</strong>s in the developing countries: the case<br />
study of Shanghai <strong>and</strong> Bangkok. In: Preprints of the Third Symposium on the Urban Environment,<br />
August 2000, Davis, CA, USA.Boston,American Meteorological Society: 117–118<br />
(http://ams.confex.com/ams/AugDavis/techprogram/paper_15242.htm, accessed 29 October 2003).<br />
Ballester DF et al. (1997). Mortality as a function of temperature.A study in Valencia, Spain, 1991–1993.<br />
International Journal of Epidemiology, 26:551–561.<br />
Balling RC, Cerveny RS (1987). Long-term associations between wind speeds <strong>and</strong> urban heat isl<strong>and</strong> of<br />
Phoenix,Arizona. Journal of Climate <strong>and</strong> Applied Meteorology, 26:712–716.<br />
Barton M, Oke TR (2000).Tests of the performance of an algorithmic scheme of the hourly urban heat<br />
isl<strong>and</strong>. In: Preprints of the Third Symposium on the Urban Environment, August 2000, Davis, CA,<br />
USA.Boston,American Meteorological Society:80–81<br />
(http://ams.confex.com/ams/AugDavis/techprogram/paper_15184.htm, accessed 29 October 2003).<br />
Basu R, Samet J (2002). An exposure assessment study of ambient heat exposure in the elderly<br />
population in Baltimore, Maryl<strong>and</strong>. <strong>Environmental</strong> <strong>Health</strong> Perspectives, 110(12):1213–1224.<br />
Baumbach G, Vogt U (1999). Experimental determination of mountain-valley breeze circulation on air<br />
pollution in the vicinity of Freiburg. Atmospheric Environment, 33:4019–4027.<br />
Baumüller J (2003). Planning measures. cCASHh Workshop on Vulnerability to Thermal Stresses, 5–7<br />
May, Freiburg, Germany.<br />
Bernhofer C (1984). Jahreszeitliche und tägliche Variation einer städtischen Wärmeinsel auf Grund von<br />
Topographie und Windverhältnissen. Archiv für Meteorologie, Geophysik und Bioklimatologie,<br />
Series B, 34:121–139.<br />
Bitan A (1988). The methodology of applied climatology in planning <strong>and</strong> building. Energy <strong>and</strong><br />
Buildings, 11:1–10.<br />
Bitan A (2003).The urban heat isl<strong>and</strong> – its negative impact on human comfort <strong>and</strong> measures to be taken<br />
to reduce its effects. cCASHh Workshop on Vulnerability to Thermal Stresses, 5–7 May, Freiburg,<br />
Germany.<br />
Bitan A, Potcher O (1995).Theory <strong>and</strong> methodology of climatic planning <strong>and</strong> its application to the new<br />
city of Bet-Shemesh. Town Planning Review, 66:61–81.<br />
Böhm R (1979). Stadtentwicklung und Trend der Wärmeinselintensität. Archiv für Meteorologie,<br />
Geophysik und Bioklimatologie, Series B, 27:31–46.<br />
Böhm R (1998).Urban bias in temperature time series – a case study for the city Vienna,Austria.Climatic<br />
<strong>Change</strong>, 38:113–128.<br />
Böhm R, Gabl K (1978). Die Wärmeinsel einer Grossstadt in Abhängigkeit von verschiedenen<br />
meteorologischen Parametern. Archiv für Meteorologie, Geophysik und Bioklimatologie, Series B,<br />
26:219–237.<br />
Boo KO, Oh SN (2000). The characteristics of air temperature distribution in Seoul, Korea using<br />
automatic weather station data, 1999. In: Preprints of the Third Symposium on the Urban<br />
Environment, August 2000, Davis, CA, USA. Boston, American Meteorological Society:129–130<br />
(http://ams.confex.com/ams/AugDavis/techprogram/paper_16587.htm, accessed 29 October 2003).<br />
Brázdil R, Budiková M (1999).An urban bias in air temperature fluctuations at the Klementinum, Prague,<br />
the Czech Republic. Atmospheric Environment, 33: 4211–4217.<br />
99<br />
REFERENCES
Bull GM, Morton J (1975). Relationships of temperature with death rates from all cause <strong>and</strong> from certain<br />
respiratory <strong>and</strong> arteriosclerotic diseases in different age groups. Age Ageing,4:232–246.<br />
Bundesministerium für Wirtschaftliche Zusammenarbeit und Entwicklung (2000). Eine Zukunft für<br />
Städte schaffen – Entwicklungspolitik im urbanen Jahrhundert. Bonn, Bundesministerium für<br />
Wirtschaftliche Zusammenarbeit und Entwicklung.<br />
Cayan DR, Douglas AV (1984). Urban influences on surface temperatures in the southwestern United<br />
States during recent decades. Journal of Climate <strong>and</strong> Applied Meteorology, 23:1520–1530.<br />
Cegnar T, Kalkstein LS (2000). Development of heat watch/warning system in Rome. In: de Dear RJ et al.,<br />
ed. Biometeorology <strong>and</strong> urban climatology at the turn of the millennium: selected papers from the<br />
Conference ICB-ICUC’99 (Sydney, 8–12 <strong>No</strong>vember 1999). Geneva, World Meteorological<br />
Organization (WMO/TD <strong>No</strong>. 1026,WCASP-50).<br />
Centers for Disease Control <strong>and</strong> Prevention (2002). <strong>Heat</strong> related deaths – four states, July–August 2001<br />
<strong>and</strong> United States, 1979–1999. MMWR Mortality <strong>and</strong> Morbidity Weekly Report, 51:528–531.<br />
Chambers FB, Bazel AJ (2000). <strong>Heat</strong>ing <strong>and</strong> cooling in Colorado mining towns. In: Preprints of the Third<br />
Symposium on the Urban Environment, August 2000, Davis, CA, USA. Boston, American<br />
Meteorological Society:119–120<br />
(http://ams.confex.com/ams/AugDavis/techprogram/paper_15514.htm, accessed 29 October 2003).<br />
Chan NY et al. (2001). An empirical mechanistic framework for heat-related illness. Climate Research,<br />
16:133–143.<br />
Clarke JF (1969). <strong>No</strong>cturnal urban boundary layer over Cincinnati, Ohio. Monthly Weather Review,<br />
97:582–589.<br />
Clarke JF (1972). Some effects of the urban structure on heat mortality. <strong>Environmental</strong> Research,<br />
5:93–104.<br />
Conti S (2003). Indagine epidemiologica sulla mortalità estiva. Presentazione dei dati finali.<br />
[Epidemiological analysis of the summer heat-wave: presentation of final results]. Rome, Istituto<br />
Superiore di Sanità,Centro Nazionale di Epidemiologia,Sorveglianza e Promozione della Salute,Ufficio<br />
di Statistica<br />
http://www.epicentro.iss.it/mortalita/presentazione%20mortalità%20estiva2.pdf, accessed 29<br />
October 2003).<br />
Dalfes HN (1991). Climatic change <strong>and</strong> Istanbul: some preliminary results. In: McCulloch J, ed. Cities <strong>and</strong><br />
global change.Washington, DC, Climate Institute:92–107.<br />
Davis RE et al. (2003). Changing heat-related mortality in the United States. <strong>Environmental</strong> <strong>Health</strong><br />
Perspectives, 111(14):1712–1718.<br />
De Dear R, Brager GS (2001).The adaptive model of thermal comfort <strong>and</strong> energy conservation in the<br />
built environment. International Journal of Biometeorology, 45:100–108.<br />
De la Croix L (1991). Implementation of urban heat isl<strong>and</strong> reduction measures <strong>and</strong> examples of U.S.<br />
projects. In: McCulloch J, ed. Cities <strong>and</strong> global change.Washington, DC, Climate Institute:225–230.<br />
Dematte JE et al.(1998).Near fatal heat stroke during the 1995 heat wave in Chicago.Annals of Internal<br />
Medicine, 129:173–181.<br />
Deutsche Stiftung Weltbevölkerung (2002). Soziale und demografische Daten zur Weltbevölkerung.<br />
Hannover, Deutsche Stiftung Weltbevölkerung.<br />
100
Díaz J,López Santiago C (2003).<strong>Health</strong> impact of thermal extremes in Iberia:analysis <strong>and</strong> trends.cCASHh<br />
Workshop on Vulnerability to Thermal Stresses, 5–7 May, Freiburg, Germany.<br />
Díaz J et al. (2002a). <strong>Heat</strong> waves in Madrid, 1986–1997: effects on the health of the elderly.International<br />
Archives of Occupational <strong>and</strong> <strong>Environmental</strong> <strong>Health</strong>, 75:163–170.<br />
Díaz J et al. (2002b). Effects of extremely hot days on people older than 65 in Seville (Spain) from 1986<br />
to 1997. International Journal of Biometeorology, 46:145–149.<br />
Donoghue ER et al. (1997). Criteria for the diagnosis of heat-related deaths: National Association of<br />
Medical Examiners. Position Paper. National Association of Medical Examiners Ad Hoc Committee on<br />
the Definition of <strong>Heat</strong> Related Fatalities. American Journal of Forensic Pathology, 18:11–14.<br />
Drinkwater BL,Horvath SM (1979).<strong>Heat</strong> tolerance <strong>and</strong> ageing.Medical Science <strong>and</strong> Sports,11(1):49–55.<br />
Eliasson I (1996). Urban nocturnal temperatures, street geometry <strong>and</strong> l<strong>and</strong> use. Atmospheric<br />
Environment, 30:379–392.<br />
Eliasson I (2000).The use of climate knowledge in urban planning. L<strong>and</strong>scape <strong>and</strong> Urban Planning,<br />
48:31–44.<br />
Eliasson I, Upmanis H (2000). <strong>No</strong>cturnal airflow from urban parks – implications for city ventilation.<br />
Theoretical <strong>and</strong> Applied Climatology, 66:95–107.<br />
Ellis FP et al. (1980). Mortality <strong>and</strong> morbidity in Birmingham during the 1976 heatwave. Quarterly<br />
Journal of Medicine, 49:1–8.<br />
<strong>Environmental</strong> Resources Management (2000). Potential UK adaptation strategies for climate change.<br />
London, <strong>Environmental</strong> Resources Management.<br />
Eriksen W (1976). Die städtische Wärmeinsel. Geographische Rundschau, 28:368–373.<br />
Falcão JM et al. (2003). Projecto ÍCARO. Onda de calor de agosto de 2003: Repercussões sobre a saúde<br />
da população. Estimativas Provisorias (até 12.08.2003) [The ÍCARO Project. Effects of the heatwave<br />
in August 2003 on the health of the population. Preliminary estimates as of 12 August 2003].<br />
Lisbon, Onsa – Observatório Nacional de Saúde, Instituto Nacional de Saúde Dr Ricardo Jorge<br />
(http://www.onsa.pt/conteu/fontes/proj_icaro.html, accessed 29 October 2003).<br />
Fanger PO (1970). Thermal comfort. Analysis <strong>and</strong> application in environment engineering.<br />
Copenhagen, Danish Technical Press.<br />
Farago T (1991). Quality of urban air <strong>and</strong> climate change. In: McCulloch J, ed. Cities <strong>and</strong> global change.<br />
Washington, DC, Climate Institute:155–166.<br />
Faunt JD et al. (1995).The effete in the heat: heat related hospital presentations during a ten day heat<br />
wave. Australia <strong>and</strong> New Zeal<strong>and</strong> Journal of Medicine, 25:117–120.<br />
Feng JZ, Petzold DE (1988).Temperature trends through urbanization in metropolitan Washington, D.C.,<br />
1945–1979. Meteorology <strong>and</strong> Atmospheric Physics, 38:195–201.<br />
Fezer F (1995). Das Klima der Städt.Gotha,Justus Perthes Verlag.<br />
Figuerola PI, Mazzeo NA (1998). Urban-rural temperature differences in Buenos Aires. International<br />
Journal of Climatology, 18:1709–1723.<br />
101<br />
REFERENCES
Forwood B, Hayman S,Tadepalli S (2000).Thermal comfort in urban open spaces. In: de Dear RJ et al.,<br />
ed. Biometeorology <strong>and</strong> urban climatology at the turn of the millennium: selected papers from the<br />
Conference ICB-ICUC’99 (Sydney, 8–12 <strong>No</strong>vember 1999). Geneva, World Meteorological<br />
Organization (WMO/TD <strong>No</strong>. 1026,WCASP-50).<br />
Frisancho R (1991). Human adaptation: a functional interpretation.Ann Arbor, University of Michigan<br />
Press.<br />
Gagge AP,Fobelets AP,Berglund LG (1986).A st<strong>and</strong>ard predictive index of human response to the thermal<br />
environment. ASHRAE Transactions, 92:702–731.<br />
Gallo KP,Owen TW (2000).Seasonal trends in urban <strong>and</strong> rural temperatures of twenty-eight cities within<br />
the United States. In: Preprints of the Third Symposium on the Urban Environment, August 2000,<br />
Davis, CA.Boston,American Meteorological Society:78–79<br />
(http://ams.confex.com/ams/AugDavis/techprogram/paper_15498.htm, accessed 29 October 2003).<br />
Garcia AC, <strong>No</strong>gueira PJ, Falcão JM (1999). Onda de calor de 1981 em Portugal: efeitos na mortalidade<br />
[Effects of the heat-wave in June 1981 in Portugal on mortality]. Revista Nacional de Saúde Pública,<br />
volume temático 1:67–77.<br />
García R et al. (2002). Synoptic conditions leading to extremely high temperatures in Madrid (Spain).<br />
Annales Geophysicae, 20:237–245.<br />
García R et al. (submitted). Extreme summer temperatures in Iberia: health impacts <strong>and</strong> associated<br />
synoptic conditions.<br />
Givoni B (1986). Design for climate in hot, dry cities. In: Oke TR, ed. Urban Climatology <strong>and</strong> its<br />
Applications with Special Regard to Tropical Areas.Proceedings of the Technical Conference, Mexico<br />
D.F., 26–30 <strong>No</strong>vember 1984.Geneva,World Meteorological Organization:487–513 (WMO <strong>No</strong>. 652).<br />
Givoni B et al. (2003). Outdoor comfort research issues. Energy <strong>and</strong> Buildings, 35:77–86.<br />
Goh KC, Chang CH (1999).The relationship between height to width ratios <strong>and</strong> the heat isl<strong>and</strong> intensity<br />
at 22:00 h for Singapore. International Journal of Climatology, 19:1011–1023.<br />
Goldreich Y (1984). Urban topoclimatology. Progress in Physics <strong>and</strong> Geography,8:336–364.<br />
Goldreich Y (1995). Urban climate studies in Israel: a review. Atmospheric Environment, 29:467–478.<br />
Grätz A, Jendritzky G (1998). Bewertung des Klimas in städtischen Gebieten mit Hilfe von UBIKLIM.<br />
Hamm, UVP-Gesellschaft e.V. (UVP-report 1/98):17–19.<br />
Grätz A et al. (1994). Stadtökologie. Zur Berücksichtigung von Klima in der Stadtplanung. Die<br />
Bauverwaltung,3/94:122–126.<br />
Green GD, Skindlov JA, Butzke K (2000). Urbanization <strong>and</strong> its effect on temperature in Phoenix,Arizona.<br />
In: Preprints of the Third Symposium on the Urban Environment, August 2000, Davis, CA, USA.<br />
Boston,American Meteorological Society:121–122<br />
(http://ams.confex.com/ams/AugDavis/techprogram/paper_15440.htm, accessed 29 October 2003).<br />
Gross G (1996). Stadtklima und globale Erwärmung. Geowissenschaften, 14(6):245–248.<br />
Hajat S et al. (2002). Impact of hot temperatures on death in London: a time series approach. Journal of<br />
Epidemiology <strong>and</strong> Community <strong>Health</strong>, 56:367–372.<br />
Havenith G (2001a).Temperature regulation <strong>and</strong> technology. Gerontechnology,1:41–49.<br />
102
Havenith G (2001b). Individualized model of human thermoregulation for the simulation of heat stress<br />
response. Journal of Applied Physiology, 90:1943–1954.<br />
Havenith G (2002). Interaction of clothing <strong>and</strong> thermoregulation. Exogenous Dermatology,1:221–268.<br />
Havenith G (2003).The physiology of heat related illness/mortality. cCASHh Workshop on Vulnerability<br />
to Thermal Stresses, 5–7 May, Freiburg, Germany.<br />
Havenith G, Luttikholt VGM, Vrijkotte TGM (1995). The relative influence of body characteristics on<br />
humid heat stress response. European Journal of Applied Physiology, 70:270–279.<br />
Helbig A (1987). Beiträge zur Meteorologie der Stadtatmosphäre. Abh<strong>and</strong>lung der Meteorologische<br />
Dienst der DDR,Nr. 113.<br />
Hodgkinson B, Evans D,Wood J (2003). Maintaining oral hydration in older adults: a systematic review.<br />
International Journal of Nursing Practice,9(3):19–28.<br />
Hori S (1995).Adaptation to heat. Japanese Journal of Physiology, 45:921–946.<br />
Houghton JT et al., eds. (2001). Climate change 2001: the scientific basis. Contribution of Working<br />
Group I to the Third Assessment Report of the Intergovernmental Panel on Climate <strong>Change</strong>.<br />
Cambridge, Cambridge University Press.<br />
Huang YJ et al. (1987). The potential of vegetation in reducing summer cooling loads in residential<br />
buildings. Journal of Climate <strong>and</strong> Applied Meteorology, 26:1103–1116.<br />
Hudischewskyj AB, Douglas SG, Lundgren JR (2001). Meteorological <strong>and</strong> air quality modeling to<br />
further examine the effects of urban heat isl<strong>and</strong> mitigation measures on several cities in the<br />
northeastern U.S. San Rafael, CA, ICF Consulting – Systems Applications International (Final Report<br />
SYSAPP-01-001).<br />
Hughes WS, Balling RC Jr (1996). Urban influences on South African temperature trends. International<br />
Journal of Climatology, 16:935–940.<br />
Hulme M et al.(2002).Climate change scenarios for the United Kindom:the UKCIP02 scientific report.<br />
<strong>No</strong>rwich,Tyndall Centre for Climate <strong>Change</strong> Research, School of <strong>Environmental</strong> Sciences, University<br />
of East Anglia.<br />
Humphreys M (1978). Outdoor temperatures <strong>and</strong> comfort indoors. Building Research <strong>and</strong> Practice,6(2).<br />
Ichinose T, Shimodozono K, Hanaki K (1999). Impact of anthropogenic heat on urban climate in Tokyo.<br />
Atmospheric Environment, 33:3897–3909.<br />
Janssen NA et al. (2002).Air conditioning <strong>and</strong> source-specific particles as modifiers of the effect of PM10<br />
on hospital admissions for heart <strong>and</strong> lung disease. <strong>Environmental</strong> <strong>Health</strong> Perspectives, 110:43–49.<br />
Jauregui E (1993). Urban bioclimatology in developing countries. Experimentia, 49:964–968.<br />
Jauregui E, Godinez L, Cruz F (1992). Aspects of heat isl<strong>and</strong> development in Guadalajara, Mexico.<br />
Atmospheric Environment, 26B:391–396.<br />
Jendritzky G (1983). Die thermische Komponente im Bioklima einer Stadt. Annalen der Meteorologie,<br />
20:110–112.<br />
Jendritzky G (1988). Bioklima. In: VDI Kommission Reinhaltung der Luft, ed. Stadtklima und<br />
Luftreinhaltung. Berlin, Springer Verlag:411–426.<br />
103<br />
REFERENCES
Jendritzky G (1995). Urban ecological assessment procedures for urban areas in European climates<br />
based on MUKLIMO <strong>and</strong> UBIKLIM. In: Prospects for climate-orientated planning in European cities.<br />
The urban environment in Europe. Berlin, European Academy of the Urban Environment:34–37.<br />
Jendritzky G (2000). Impacts of extreme <strong>and</strong> persistent temperatures – cold waves <strong>and</strong> heat waves. In:<br />
Proceedings of the WMO/UNESCO Sub-Forum on Science <strong>and</strong> Technology in Support of Natural<br />
Disaster Reduction, Geneva, 6–8 July 1999. Geneva, World Meteorological Organization:43–53<br />
(WMO <strong>No</strong>. 914).<br />
Jendritzky G, Grätz A (1999). Das Bioklima des Menschen in der Stadt. In: Helbig A, Baumüller J,<br />
Kerschgens MJ, ed. Stadtklima und Luftreinhaltung.Heidelberg, Springer:126–158.<br />
Jendritzky G, Grätz A (2003). UBICLIM: Urban Bioclimate Model. cCASHh Workshop on Vulnerability to<br />
Thermal Stresses, 5–7 May, Freiburg, Germany.<br />
Jendritzky G, Nübler W (1981). A model analysing the urban thermal environment in physiologically<br />
significant terms. Archiv für Meteorologie, Geophysik und Bioklimatologie, Series B, 29(4):313–326.<br />
Jendritzky G, Sievers U (1989). Human biometeorological approaches with respect to urban planning.<br />
In: Driscoll D, Box EO, ed. Proceedings of the 11th International Congress on Biometeorology.<br />
Amsterdam, SPB Academic Publishing:25–39.<br />
Jendritzky G et al. (1994). Urban bioclimatology. In: Report of the Technical Conference on Tropical<br />
Urban Climates, March 1993, Dhaka, Bangladesh. Geneva, World Meteorological Organization<br />
(WCASP-30,WMO/TD-<strong>No</strong>. 647):245–264.<br />
Jendritzky G et al. (2000).The perceived temperature.The method of the Deutscher Wetterdienst for the<br />
assessment of cold stress <strong>and</strong> heat load for the human body. Internet Workshop on Windchill, April 3<br />
to 7, 2000, hosted by the Meteorological Service of Canada, Environment Canada.<br />
Jendritzky G et al. (2002). An update on the development of a universal thermal climate index. In:<br />
Proceedings of the 15th Conference on Aerobiololgy <strong>and</strong> 16th International Congress of<br />
Biometeorology, 27 Oct–1 <strong>No</strong>v 2002, Kansas City MO, USA. Boston, American Meteorological<br />
Society:129–133<br />
(http://ams.confex.com/ams/15BioAero/techprogram/paper_49599.htm,accessed 29 October 2003).<br />
Johnson GT et al. (1991). Simulation of surface urban heat isl<strong>and</strong> under “ideal” conditions at night. I.<br />
Theory <strong>and</strong> tests against file data. Boundary-Layer Meteorology, 56:275–294.<br />
Jonsson P (2000). The climate of a growing sub-tropical urban area – a field study of Gaborone,<br />
Botswana.Gothenburg, Earth Sciences Centre, Göteborg University, B237.<br />
Kalkstein LS (1991).A new approach to evaluate the impact of climate on human health.<strong>Environmental</strong><br />
<strong>Health</strong> Perspectives, 96:145–150.<br />
Kalkstein LS (2000). Climate–health showcase projects: international heat/health watch-warning<br />
systems. In: de Dear RJ et al., ed. Selected Papers from the Conference ICB-ICUC, Sydney, 1999.<br />
Geneva, World Meteorological Organization/United Nations Environment Programme (WCASP-<br />
50):127–129.<br />
Kalkstein LS (2001). Biometeorology – looking at the links between weather, climate <strong>and</strong> health. WMO<br />
Bulletin,2:136–142.<br />
Kalkstein LS (2002). Description of our heat/health watch–warning systems: their nature <strong>and</strong> extent,<br />
<strong>and</strong> required resources.Unpublished.<br />
104
Kalkstein LS, Davis RE (1989). Weather <strong>and</strong> human mortality: an evaluation of demographic <strong>and</strong><br />
interregional responses in the United States. Annals of the Association of American Geographers,<br />
79(1):44–64.<br />
Kalkstein LS, Jamason PF, Greene JS (1996). The Philadelphia Hot Weather–<strong>Health</strong> Watch/Warning<br />
System: development <strong>and</strong> application, summer 1995. Bulletin of the American Meteorological<br />
Society, 77(7):1519–1528.<br />
Karaca M, Tayanc M, Toros H (1995). Effects of urbanization on climate of Istanbul <strong>and</strong> Ankara.<br />
Atmospheric Environment, 29:3411–3421.<br />
Karl TR, Diaz HF, Kukla G (1988). Urbanization: its detection <strong>and</strong> effect in the United States climate<br />
record. Journal of Climate,1:1099–1123.<br />
Katsoulis BT,Theoharatos GA (1985). Indications of the urban heat isl<strong>and</strong> in Athens, Greece. Journal of<br />
Climate <strong>and</strong> Applied Meteorology, 24:1296–1302.<br />
Katsouyanni K et al. (1988).The 1987 Athens heatwave [letter]. Lancet,2(8610):573.<br />
Keatinge WR et al. (1986). Increased platelet <strong>and</strong> red cell counts, blood viscosity, <strong>and</strong> plasma cholesterol<br />
level during heat stress, <strong>and</strong> mortality from coronary <strong>and</strong> cerebral thrombosis. American Journal of<br />
Medicine, 81:795–800.<br />
Keatinge WR et al. (2000). <strong>Heat</strong> related mortality in warm <strong>and</strong> cold regions of Europe: observational<br />
study. British Medical Journal, 321:670–673.<br />
Kidder SQ, Essenwanger OM (1995). The effect of clouds <strong>and</strong> wind on the difference in nocturnal<br />
cooling rates between urban <strong>and</strong> rural areas. Journal of Applied Meteorology, 34:2440–2448.<br />
Kiernan V (1996). If you can’t st<strong>and</strong> the heat go shopping. New Scientist, 20 July:10.<br />
Kilbourne EM (1992). Illness due to thermal extremes. In: Last JM, Wallace RB, eds. Public health <strong>and</strong><br />
preventative medicine.<strong>No</strong>rwalk, CT,Appleton Lang:491–501.<br />
Kilbourne EM (1999). The spectrum of illness during heatwaves. American Journal of Preventive<br />
Medicine, 16:359–360.<br />
Kim Y-H, Baik J-J (2002). Maximum urban heat isl<strong>and</strong> intensity in Seoul. Journal of Applied Meteorology,<br />
41:651–659.<br />
King’uyu SM (2000). Urbanisation <strong>and</strong> the climate of Nairobi. In: de Dear RJ et al., ed. Biometeorology<br />
<strong>and</strong> urban climatology at the turn of the millennium: selected papers from the Conference ICB-<br />
ICUC’99 (Sydney, 8–12 <strong>No</strong>vember 1999).Geneva,World Meteorological Organization (WMO/TD <strong>No</strong>.<br />
1026,WCASP-50):1–6.<br />
Klein Tank A, Wijngaard J, van Engelen A (2002). Climate of Europe: assessment of observed daily<br />
temperature <strong>and</strong> precipitation extremes. De Bilt, the Netherl<strong>and</strong>s, Royal Dutch Meteorological<br />
Institute.<br />
Klinenberg E (2002).<strong>Heat</strong> wave: a social autopsy of disaster in Chicago.Chicago,University of Chicago<br />
Press.<br />
Klysik K, Fortuniak K (1999). Temporal <strong>and</strong> spatial characteristics of the urban heat isl<strong>and</strong> of Lódz,<br />
Pol<strong>and</strong>. Atmospheric Environment, 33:3885–3895.<br />
105<br />
REFERENCES
Koch E, Hammer N, Rudel E (1992). Long-term variations in thermal comfort in Vienna. Theoretical <strong>and</strong><br />
Applied Climatology, 45:257–264.<br />
Kovats S, Koppe C (forthcoming). <strong>Heat</strong> waves: past <strong>and</strong> future impacts. In: Ebi K, Burton I, Smith J, eds.<br />
Integration of public health with adaptation to climate change: lessons learned <strong>and</strong> new<br />
directions.Lisse, Swets & Zeitlinger.<br />
Kovats S, Wolf T, Menne B (2004). <strong>Heat</strong>hwave of August 2003 in Europe:provisional estimates of the<br />
impact on mortality. Eurosurveillance Weekly, forthcoming.<br />
Kozuchowski K, Trepinska J, Wibig J (1994). The air temperature in Cracow from 1826 to 1990:<br />
persistence, fluctuations <strong>and</strong> the urban effect. International Journal of Climatology, 14:1035–1049.<br />
Kunst AE,Looman CW,Mackenbach JP (1993).Outdoor air temperature <strong>and</strong> mortality in the Netherl<strong>and</strong>s:<br />
a time series analysis. American Journal of Epidemiology, 137:331–341.<br />
Kuttler W (1988). Spatial <strong>and</strong> temporal structures of the urban climate – a survey. In: Grefen K, Löbel J,<br />
eds. <strong>Environmental</strong> meteorology.Dordrecht, Kluwer:305–333.<br />
Kuttler W, Barlag A-B, Rossmann F (1996). Study of thermal structure of a town in a narrow valley.<br />
Atmospheric Environment, 30:365–378.<br />
L<strong>and</strong>sberg HE (1981). The urban climate.New York,Academic Press.<br />
Livada I et al. (2002). Determination of places in the great Athens area where the heat isl<strong>and</strong> effect is<br />
observed. Theoretical <strong>and</strong> Applied Climatology, 71:219–230.<br />
Lye M, Kamal A (1977). Effects of a heatwave on mortality-rates in elderly inpatients. Lancet,1:529–531.<br />
Magee N, Curtis J,Wendler G (1999).The urban heat isl<strong>and</strong> effect at Fairbanks,Alaska. Theoretical <strong>and</strong><br />
Applied Climatology, 64:39–47.<br />
Marmor M (1975). <strong>Heat</strong> wave mortality in New York City, 1949 to 1970. Archives of <strong>Environmental</strong><br />
<strong>Health</strong>, 30:130–136.<br />
Matzarakis A (2001). Die thermische Komponente des Stadtklimas. Berichte des Meteorologischen<br />
Institutes der Universität Freiburg,6:286 S.<br />
Mayer H (1992). Plannungsfaktor Stadtklima. Münchner Forum, Berichte und Protokolle, 107:167–205.<br />
Mayer H (1996). Human-biometeorologische Probleme des Stadtklimas. Geowissenschaften,<br />
14(6):233–239.<br />
McCulloch J, ed. (1991). Cities <strong>and</strong> global change.Washington, DC, Climate Institute.<br />
McPherson G (1991). <strong>Environmental</strong> benefits <strong>and</strong> costs of the urban forest: two examples from Tuscon,<br />
Arizona. In: McCulloch J, ed. (1991). Cities <strong>and</strong> global change. Washington, DC, Climate<br />
Institute:218–224.<br />
Mentes JC,Culp K (2003).Reducing hydration-linked events in nursing home residents.Clinical Nursing<br />
Research, 12: 210–225.<br />
Mertens E (1999). Bioclimate <strong>and</strong> city planning – open space planning. Atmospheric Environment,<br />
33:4115–4123.<br />
Merz M (1993). Machen Klimaanlagen krank? Bad Inform,2:1–3.<br />
106
Michelozzi P (2003). Evaluation of the Rome heat/health watch/warning system. cCASHh Workshop on<br />
Vulnerability to Thermal Stresses, 5–7 May, Freiburg, Germany.<br />
Ministry of <strong>Health</strong> <strong>and</strong> Consumer Affairs (2003).Informe sobre el potencial impacto sanitario de la ola<br />
de calor y la evolución reciente de la mortalidad general y por causas en España [Information on<br />
the potential health impact of heat-waves <strong>and</strong> the recent trends in all-cause <strong>and</strong> cause-specific<br />
morality in Spain]. Madrid, Ministry of <strong>Health</strong> <strong>and</strong> Consumer Affairs.<br />
Mirch<strong>and</strong>ani HG et al. (1996). <strong>Heat</strong> related deaths in Philadelphia – 1993. American Journal of Forensic<br />
Medicine <strong>and</strong> Pathology, 17(2):106–108.<br />
Montávez JP, Rodriguez A, Jiménez JI (2000).A study of the urban heat isl<strong>and</strong> of Granada. International<br />
Journal of Climatology, 20:899–911.<br />
Moreno-Garcia MC (1994). Intensity <strong>and</strong> form of the urban heat isl<strong>and</strong> in Barcelona. International<br />
Journal of Climatology, 14:705–710.<br />
Nafstad P, Skrondal A, Bjertness E (2001). Mortality <strong>and</strong> temperature in Oslo, <strong>No</strong>rway, 1990–1995.<br />
European Journal of Epidemiology, 17:621–627.<br />
Nakamura Y (1998). Characteristics of human mortality in Japan concerning global warming. <strong>Global</strong><br />
<strong>Environmental</strong> Research,2:121–131.<br />
Nasrallah HA, Brazel AJ, Balling RC Jr (1990).Analysis of the Kuwait City urban heat isl<strong>and</strong>. International<br />
Journal of Climatology, 10:401–405.<br />
National Academy of Sciences (2000).Toward the development of disease early warning systems. In: Under<br />
the weather: climate, ecosystems, <strong>and</strong> infectious disease.Washington, DC, National Academies Press<br />
(http://www.nap.edu/books/0309072786/html, accessed 29 October 2003).<br />
National Institute of Public <strong>Health</strong> Surveillance (2003). Impact sanitaire de la vague de chaleur en<br />
France survenue en août 2003. Rapport d’étape – 29 août 2003. Saint Maurice, France, National<br />
Institute of Public <strong>Health</strong> Surveillance<br />
(http://www.invs.sante.fr/publications/2003/chaleur_aout_2003, accessed 29 October 2003).<br />
Nichol J (1996). High-resolution surface temperature patterns related to urban morphology in a tropical<br />
city: a satellite-based study. Journal of Applied Meteorology, 35:135–146.<br />
Nieuwolt S (1986). Design for climate in hot, humid cities. In: Oke TR, ed. Urban Climatology <strong>and</strong> its<br />
Applications with Special Regard to Tropical Areas.Proceedings of the Technical Conference, Mexico<br />
D.F., 26–30 <strong>No</strong>vember 1984.Geneva,World Meteorological Organization (<strong>No</strong>. 652):514–534.<br />
Nkemdirim LC (1980).A test of a lapse rate/wind speed model for estimating heat isl<strong>and</strong> magnitude in<br />
an urban airshed. Journal of Applied Meteorology, 19:748–756.<br />
<strong>No</strong>gueira PJ (2000a).Acredit<strong>and</strong>o no ... ÍCARO [Believing ... ÍCARO]. Observações,12<br />
(http://www.onsa.pt/conteu/publicacoes/pub_observacoes-012_onsa.zip, accessed 29 October 2003).<br />
<strong>No</strong>gueira PJ (2000b). 4 x ÍCARO: um balanço [4 x ÍCARO: a balance]. Observações,17<br />
(http://www.onsa.pt/conteu/publicacoes/pub_observacoes-017_onsa.jpg, accessed 29 October 2003).<br />
<strong>No</strong>gueira P, Paixão E (2003). Evaluation of the Lisbon heat health warning system. cCASHh Workshop on<br />
Vulnerability to Thermal Stresses, 5–7 May, Freiburg, Germany.<br />
107<br />
REFERENCES
<strong>No</strong>gueira PJ et al.(1999).Um sistema de vigilância e alerta de ondas de calor com efeitos na mortalidade:<br />
o índice Ícaro [A heat-wave surveillance <strong>and</strong> warning system based on the effects on mortality: the<br />
ÍCARO index]. Revista Nacional de Saúde Pública,volume temático 1:79–84.<br />
Nunes B, Castro L (1997). Não morrer de calor!... Será uma questão de habituação? [<strong>No</strong>t dying from heat!<br />
... Is it a question of habituation?]. V Congresso Anual da Sociedade Portuguesa de Estatística 1997.<br />
Office for National Statistics. Summer mortality – deaths up in August heat wave. London, Office for<br />
National Statistics<br />
(http://www.statistics.gov.uk/cci/nugget.asp?id=480, accessed 29 October 2003).<br />
Oke TR (1973). City size <strong>and</strong> the urban heat isl<strong>and</strong>. Atmospheric Environment,7:769–779.<br />
Oke T (1976). The distinction between canopy <strong>and</strong> boundary layer urban heat isl<strong>and</strong>s. Atmosphere,<br />
14:268–277.<br />
Oke T (1987). Boundary layer climates. 2nd ed. London, Methuen.<br />
Oke TR (1997). Urban climates <strong>and</strong> global environmental change. In: Thompson RD, Parry AH, eds.<br />
Applied climatology: principles <strong>and</strong> practice. London: Routledge:273–287.<br />
Oke TR (1998). An algorithmic scheme to estimate hourly heat isl<strong>and</strong> magnitude. In: Preprints of the<br />
Second Urban Environment Symposium, <strong>No</strong>vember 1998, Albuquerque, NM, USA. Boston,<br />
American Meteorological Society:80–83.<br />
Oke TR, Maxwell GB (1975). Urban heat isl<strong>and</strong> dynamics in Montreal <strong>and</strong> Vancouver. Atmospheric<br />
Environment,9:191–200.<br />
Oke TR, Zeuner G, Jauregui E (1992). The surface energy balance in Mexico City. Atmospheric<br />
Environment, 33:3919–3930.<br />
Okpara JN (2000).A study of urban heat isl<strong>and</strong> over Akure in Nigeria during the end of 1997 wet season.<br />
In: de Dear RJ et al., ed. (2000). Biometeorology <strong>and</strong> urban climatology at the turn of the<br />
millennium: selected papers from the Conference ICB-ICUC’99 (Sydney, 8–12 <strong>No</strong>vember 1999).<br />
Geneva,World Meteorological Organization (WMO/TD <strong>No</strong>. 1026,WCASP-50):1–6.<br />
O’Neill M (2003).Air conditioning <strong>and</strong> heat-related health effects. Applied <strong>Environmental</strong> Science <strong>and</strong><br />
Public <strong>Health</strong>,1(1):9–12.<br />
Padmanabhamurty B (1999). Hot cities in a hot world. In: de Daer RJ et al., eds. Proceedings of the 15th<br />
International Congress of Biometeorology & International Conference on Urban Climate, Sydney,<br />
Australia.Geneva,World Meteorological Organization:ICUC4.1 (1–6) (WCASP-50;WMO/TD <strong>No</strong>. 1026).<br />
Paixão E, <strong>No</strong>gueira PJ (2002). Estudo da onda de calor de Julho de 1991 em Portugal: efeitos na<br />
mortalidade: relatório científico [A study of the July 1991 heat-wave in Portugal: effects on mortality<br />
– scientific report]. Lisbon, Observatório Nacional de Saúde<br />
(http://www.onsa.pt/conteu/fontes/proj_icaro_relat-cientifico-out02_onsa.zip, accessed 29 October 2003).<br />
Pajares Ortiz MS et al. (1997). Mortalidad diaria en la Comunidad de Madrid durante el periodo<br />
1986–1991 para el grupo de edad de 45 a 64 años: su relación con la temperatura del aire [Daily<br />
mortality in the Municipality of Madrid during 1986–1991 for the group between 45 <strong>and</strong> 64 years of<br />
age: relationship with air temperature]. Revista Española de Salud Pública, 71(2):149–160.<br />
PHEWE (2003). Implementation of the <strong>Heat</strong>/<strong>Health</strong> Watch Warning System in Rome.Unpublished.<br />
108
Phil<strong>and</strong>ras CM, Metaxas DA, Nastos PT (1999). Climate variability <strong>and</strong> urbanisation in Athens.Theoretical<br />
<strong>and</strong> Applied Climatology, 63:65–72.<br />
Piehl HD, Grätz A (1996). Klimakarten für das L<strong>and</strong> Berlin. 1. Bioklima Berlin.Potsdam, Deutscher<br />
Wetterdienst.<br />
Pinho OS, Manso Orgaz MD (2000). The urban heat isl<strong>and</strong> in a small city in coastal Portugal.<br />
International Journal of Biometeorology, 44:198–203.<br />
Rogot E, Sorlie PD, Backlund E (1992). Air-conditioning <strong>and</strong> mortality in hot weather. American<br />
Journal of Epidemiology, 136:106–116.<br />
Rooney C et al. (1998). Excess mortality in Engl<strong>and</strong> <strong>and</strong> Wales, <strong>and</strong> in Greater London, during the 1995<br />
heatwave. Journal of Epidemiology <strong>and</strong> Community <strong>Health</strong>, 52:482–486.<br />
Roth M, Oke TR, Emery WJ (1989). Satellite-derived urban heat isl<strong>and</strong> from three coastal cities <strong>and</strong> the<br />
utility of such data in urban climatology. International Journal of Remote Sensing, 10:1699–1720.<br />
Runnals KE, Oke TR (1998).The urban heat isl<strong>and</strong> of Vancouver, BC. In: Preprints of the Second Urban<br />
Environment Symposium. <strong>No</strong>vember 2–6, 1998, Albuquerque, NM, USA. Boston, American<br />
Meteorological Society:84–87.<br />
Saaroni H, Ziv B (2003).The impact of a small lake on heat stress in a Mediterranean urban park: the case<br />
of Tel Aviv, Israel. International Journal of Biometeorology, 47:156–165.<br />
Saaroni H et al. (2000). Spatial distribution <strong>and</strong> microscale characteristics of the urban heat isl<strong>and</strong> in Tel-<br />
Aviv, Israel. L<strong>and</strong>scape <strong>and</strong> Urban Planning, 48:1–18.<br />
Santamouris M et al. (1999).Thermal <strong>and</strong> air flow characteristics in a deep pedestrian canyon under hot<br />
weather conditions.Atmospheric Environment, 33:4503–4521.<br />
Santamouris M et al. (2001). On the impact of urban climate on the energy consumption of buildings.<br />
Solar Energy, 70(3):201–216.<br />
Scherer D et al.(1999).Improved concepts <strong>and</strong> methods in analysing <strong>and</strong> evaluation of the urban climate<br />
for optimizing urban planning processes. Atmospheric Environment, 33:4185–4193.<br />
Semenza JC et al. (1996). <strong>Heat</strong> related deaths during the July 1995 heat wave in Chicago. New Engl<strong>and</strong><br />
Journal of Medicine, 335(2):84–90.<br />
Sheridan SC, Kalkstein LS (1998). <strong>Heat</strong> watch–warning systems in urban areas. World Resource Review,<br />
10:375–383.<br />
Smoyer KE (1998a).A comparative analysis of heat waves <strong>and</strong> associated mortality in St. Louis, Missouri<br />
1980 <strong>and</strong> 1995. International Journal of Biometeorology, 42:44–50.<br />
Smoyer KE (1998b). Putting risk in its place: methodological considerations for investigating extreme<br />
event health risks. Social Science <strong>and</strong> Medicine, 47:1809–1824.<br />
Staiger H, Bucher K, Jendritzky G (1997). Gefühlte Temperatur. Die physiologisch gerechte Bewertung<br />
von Wärmebelastung und Kältestress beim Aufenthalt im Freien in der Maßzahl Grad Celsius.Annalen<br />
der Meteorologie, 33:100–107.<br />
Steadman RG (1979a).The assessment of sultriness. I. A temperature–humidity index based on human<br />
physiology <strong>and</strong> clothing science. Journal of Applied Meteorology, 18:861–873.<br />
109<br />
REFERENCES
Steadman RG (1979b).The assessment of sultriness. II. Effects of wind, extra radiation, <strong>and</strong> barometric<br />
pressure on apparent temperature. Journal of Applied Meteorology, 18:861–873.<br />
Teisberg TJ et al. (in press).The net benefits of the Philadelphia heat wave warning system. Bulletin of<br />
the American Meteorological Society.<br />
Todisco G (1987). Indagine biometeorologica sui colpi di calore verificatisi a Roma nell'estate del 1983<br />
[Biometeorological study of heat stroke in Rome during summer 1983]. Rivista di Meteorologica<br />
Aeronautica, 47:189–197.<br />
Tso CP (1996). A survey of urban heat isl<strong>and</strong> in two tropical cities. Atmospheric Environment,<br />
30:507–519.<br />
Unger J (1996). <strong>Heat</strong> isl<strong>and</strong> intensity with different meteorological conditions in a medium sized town:<br />
Szeged, Hungary. Theoretical <strong>and</strong> Applied Climatology, 54:147–151.<br />
Unger J (1999). Comparisons of urban <strong>and</strong> rural bioclimatological conditions in the case of a central<br />
European city. International Journal of Biometeorology, 43:139–144.<br />
Upmanis H, Eliasson I, Lindquist S (1998).The influence of green areas on nocturnal temperatures in a<br />
high latitude city (Göteborg, Sweden). International Journal of Climatology, 18:681–700.<br />
Verein Deutscher Ingenieure (1998). <strong>Environmental</strong> meteorology – methods for the human<br />
biometeorological evaluation of climate <strong>and</strong> air quality for urban <strong>and</strong> regional planning at<br />
regional level. I. Climate. Düsseldorf, Beuth Verlag (VDI Richtlinien. VDI 3787/Part 2. VDI/DIN-<br />
H<strong>and</strong>buch – Reinhaltung der Luft, B<strong>and</strong> 1b).<br />
Wagner D (1994).Wirkungen regionaler Klimaänderungen in urbanen Ballungsräumen. In: Hupfer P, ed.<br />
Spezialarbeiten aus der Arbeitsgruppe Klimaforschung des Meteorologischen Instituts der<br />
Humboldt-Universität zu Berlin. Berlin, Arbeitsgruppe Klimaforschung des Meteorologischen<br />
Instituts der Humboldt-Universität zu Berlin (Spezialarbeiten aus der Arbeitsgruppe Klimaforschung<br />
des Meteorologischen Instituts der Humboldt-Universität zu Berlin Nr. 7).<br />
Wagner D (1999).Assessment of the probability of extreme weather events <strong>and</strong> their potential effects in<br />
large conurbations. Atmospheric Environment, 33:4151–4155.<br />
Whitmann et al. (1997). Mortality in Chicago attributed to the July 1995 heat wave. American Journal<br />
of Public <strong>Health</strong>, 87(9):1515–1518.<br />
WHO (1990). Indoor environment: health aspects of air quality, thermal environment <strong>and</strong> noise.<br />
Geneva,World <strong>Health</strong> Organization<br />
(http://whqlibdoc.who.int/hq/1990/WHO_EHE_RUD_90.2.pdf, accessed 29 October 2003).<br />
WHO Regional Office for Europe (1987). <strong>Health</strong> impact of low indoor temperatures:report on a WHO<br />
meeting, Copenhagen, 11–14 <strong>No</strong>vember 1985. Copenhagen, WHO Regional Office for Europe<br />
(<strong>Environmental</strong> <strong>Health</strong> Series, <strong>No</strong>. 16).<br />
Wienert U (2001). Untersuchungen zur Breiten- und Klimazonenabhängigkeit der urbanen<br />
Wärmeinsel: Eine städtische Analyse. Essen, Fachbereichs Bio- und Geowissenschaften,<br />
L<strong>and</strong>schaftsarchitektur an der Universität Essen (dissertation).<br />
Wilby RL (2003). Past <strong>and</strong> projected trends in London’s urban heat isl<strong>and</strong>. Weather, 58:251–260.<br />
Williams CG, Heyns AJ (1969). Differential acclimatisation as a function of duration of exposure.<br />
Internationale Zeitschrift für Angew<strong>and</strong>te Physiologie, 27(2):198–211.<br />
110
Williams CG, Wyndham CH, Morrison JF (1967). Rate of loss of acclimatisation in summer <strong>and</strong> winter.<br />
Journal of Applied Physiology, 22:21–26.<br />
World Meteorological Organization (1983). Abridged final report, 8th session.Geneva, Commission for<br />
Climatology <strong>and</strong> Applications of Meteorology,World Meteorological Organization (WMO <strong>No</strong>. 600).<br />
World Meteorological Organization (1999). Weather, climate <strong>and</strong> health.Geneva,World Meteorological<br />
Organization (WMO <strong>No</strong>. 892).<br />
World Meteorological Organization (2003). According to the World Meteorological Organization,<br />
extreme weather events might increase.Geneva,World Meteorological Organization, 2 July<br />
(http://www.wmo.ch/web/Press/Press695.doc, accessed 29 October 2003).<br />
Yamashita S (1996). Detailed structure of heat isl<strong>and</strong> phenomena from moving observations from<br />
electric tram-cars in metropolitan Tokyo. Atmospheric Environment, 30:429–435.<br />
Yannas S (2001).Toward more sustainable cities. Solar Energy, 70(3):281–294.<br />
111<br />
REFERENCES
Annex 1.<br />
Programme of the cCASHh Workshop on Vulnerability to Thermal Stresses,<br />
5–7 May 2003, Freiburg, Germany<br />
MONDAY, 5 MAY 2003<br />
9:00–9:15 Welcome (Gerd Jendritzky & Bettina Menne)<br />
9:15–9:30 Short introduction of the participants<br />
9:30–10:00 Objectives of the research <strong>and</strong> the workshop (Bettina Menne)<br />
10:00–10:30 The physiology of heat-related illness <strong>and</strong> mortality (George Havenith)<br />
10:30–11:00 The epidemiology of heat-related illness <strong>and</strong> mortality (Sari Kovats)<br />
11:00–11:15 Coffee break<br />
SESSION I. <strong>Heat</strong> health warning systems – methods<br />
11:15–11:30 Survey of heat health warning systems in Europe (Christina Koppe)<br />
11:30–12:00 <strong>Heat</strong> health warning systems: overview (Scott Sheridan)<br />
12:00–12:20 Evaluation of the Rome heat health warning system (Paola Michelozzi)<br />
12:20–12:40 Evaluation of the Lisbon heat health warning system (Paulo Jorge <strong>No</strong>gueira)<br />
12:40–13:00 The Assessment <strong>and</strong> Prevention of Acute <strong>Health</strong> Effects of Weather Conditions<br />
in Europe (PHEWE) project (Paola Michelozzi & Glenn McGregor)<br />
13:00–14:00 Lunch<br />
SESSION II. <strong>Heat</strong> health warning systems - intervention measures <strong>and</strong> evaluation<br />
14:00–14:15 Madrid study (César López Santiago & Julio Díaz Jiménez)<br />
14:15–14:45 The Philadelphia system – value of information study (Kristie L. Ebi)<br />
14:45–17:30 Group work<br />
1. What are best methods for identifying “heat-waves”?<br />
2. When should a heat health warning system be set up?<br />
3. Who would be the target of the heat health warning system?<br />
4. How can a heat health warning system be best implemented?<br />
5. Which problems exist after a warning is issued?<br />
6. How can the system been best evaluated?<br />
112<br />
Coffee break during the group work<br />
Evening: Dinner at Restaurant Dattler
TUESDAY, 6 MAY 2003<br />
9:00–10:30 Presentations of the results of the group work<br />
10:30–10:45 Coffee Break<br />
SESSION III. Urban planning<br />
10:45–11:15 The urban heat isl<strong>and</strong> – its negative impact on human comfort <strong>and</strong> measures<br />
to be taken to reduce its effects (Arieh Bitan)<br />
11:15–11:45 Indoor climate: relationship between indoor thermal comfort <strong>and</strong> buildings<br />
from a multi-disciplinary point of view (Fergus Nicol)<br />
11:45–12:15 UBIKLIM urban bioclimate model (Gerd Jendritzky)<br />
12:15–12:45 Planning measures (Jürgen Baumüller)<br />
12:45–13:45 Lunch<br />
13:45–16.30 Group work<br />
1. Which intervention strategies are available <strong>and</strong> which are the most effective?<br />
2. Are there lessons learned from interventions that have been<br />
implemented elsewhere?<br />
3. If so, what can be recommended?<br />
Coffee break during the group work<br />
16:30–17:30 Presentation of the results of the group work<br />
19:00 Reception hosted by the City of Freiburg<br />
WEDNESDAY, 7 MAY 2003<br />
08:45–09:15 Integrated assessment model: thermal stress (Michael van Lieshout)<br />
09:15–09:45 Evaluation of adaptation measures – methods (Aline Chiabai)<br />
09:45–10:00 Adaptation to thermal stress – lessons learned for the conceptual framework<br />
(Hans-Martin Füssel)<br />
10:00–11:00 Final discussion on adaptation strategies<br />
11:00–11:15 Coffee break<br />
11:15–12:30 Development <strong>and</strong> review of the recommendations<br />
12:30–13:00 Next steps<br />
113<br />
ANNEX 1.
Annex 2.<br />
Questionnaire on extreme thermal events <strong>and</strong> health warning systems<br />
114<br />
This questionnaire was sent to 45 countries in the WHO European Region.<br />
PART 1: GENERAL INFORMATION<br />
1. Name <strong>and</strong> address of your institution:<br />
2. Who can we contact if we have further questions regarding this issue?<br />
3. Are you interested in the outcome of this survey<br />
(it will be sent to the contact person given above)?<br />
PART 2: EXTREME THERMAL EVENTS<br />
1. Does an official definition of a “heat-wave” exist in your country?<br />
a) If yes, would you please write down this definition:<br />
b) On which spatial scale is the heat-wave determined?<br />
“city-scale” regional scale national scale<br />
other:<br />
2. Does an official definition of a “cold-spell” exist in your country?<br />
a) If yes, can you please write down this definition:<br />
b) On which spatial scale is the cold-spell determined?<br />
“city-scale” regional scale national scale<br />
other:
PART 3: HEAT WARNING SYSTEMS<br />
1. Does any kind of warning system with respect to thermal extreme<br />
events exist in your country?<br />
a) If yes, does this system imply hot weather warnings?<br />
If yes,<br />
• What is the criterion for releasing a warning?<br />
• What is the criterion for closing the warning?<br />
• For which spatial scale is the warning released?<br />
“city-scale” regional scale national scale<br />
other:<br />
• Who is the target group for the warning<br />
(such as health authorities, public)?<br />
• What is the organizational procedure of the warning<br />
(such as which is the medium of the warning, how much time<br />
is the warning given in advance)?<br />
• What is the aim of the warning system?<br />
• Are there any intervention plans for when a warning is issued?<br />
• If yes, can you please describe this intervention plan in<br />
a few words:<br />
• Who implements the plan? Would you please tell us the name of<br />
a contact person at these “institutions”? (For example, in the US,<br />
the local fire departments are often involved in implementing<br />
heat-wave warnings.)<br />
b) Please try to estimate the costs of the implementation of the<br />
warning system:*<br />
(EUR)<br />
c) Please try to estimate the benefits of the implementation of the<br />
warning systems:*<br />
(EUR)<br />
(number of lives saved)<br />
* If you are not able to answer these questions, do you know someone<br />
we can contact with respect to this problem?<br />
d) If no heat-warnings exist, is your agency thinking about establishing<br />
a hot weather warning system?<br />
2. Which are other agencies to contact that may have useful information<br />
with respect to thermal extreme events <strong>and</strong> health warning systems?<br />
115<br />
ANNEX 2.
Annex 3.<br />
Current status of heat health warning systems in Europe<br />
The following countries responded to the survey on heat health warning systems (Annex 2) or were<br />
identified as having heat health warning systems.<br />
TABLE 1. COUNTRIES WITH HEAT HEALTH WARNING SYSTEMS<br />
Country Response Type of heat health warning system+<br />
116<br />
I II III<br />
Albania<br />
Armenia<br />
Austria X<br />
Azerbaijan X X*<br />
Belarus X X*<br />
Belgium X<br />
Bosnia <strong>and</strong> Herzegovina<br />
Bulgaria<br />
Croatia X<br />
Cyprus X<br />
Czech Republic X X<br />
Denmark X<br />
Estonia X X*<br />
Finl<strong>and</strong> X<br />
France X<br />
Georgia X<br />
Germany X<br />
Greece X X*<br />
Hungary X<br />
Icel<strong>and</strong> X<br />
Irel<strong>and</strong> X<br />
Israel X<br />
Italy (Rome) X<br />
Kazakhstan X X*<br />
Latvia X X*<br />
Lithuania X<br />
Luxembourg X<br />
Malta X X*<br />
Monaco<br />
Netherl<strong>and</strong>s X<br />
<strong>No</strong>rway X<br />
Pol<strong>and</strong><br />
Portugal (district of Lisbon) X X<br />
Republic of Moldova X<br />
Romania X X*<br />
Serbia <strong>and</strong> Montenegro X X*
TABLE 1. CONTD<br />
Country Response Type of heat health warning system+<br />
Slovakia X<br />
Slovenia X X*<br />
Spain X X*<br />
Sweden X<br />
Switzerl<strong>and</strong> X<br />
The former Yugoslav Republic<br />
of Macedonia X X*<br />
Turkey X X*<br />
Ukraine<br />
United Kingdom** X<br />
Thirty-seven of the forty-five countries surveyed responded to the questionnaire (82%).<br />
+ See Table A1 for definitions of types of heat health warning systems.<br />
* Situations that adversely affect human health are not explicitly identified.<br />
** The United Kingdom has a system that provides daily information for hospitals based on the<br />
weather situation but no specific heat health warning system.<br />
TABLE 2. DEFINITIONS OF TYPES OF HEAT HEALTH WARNING SYSTEMS<br />
I II III<br />
Type 1 Type 2 Type 3<br />
• Identification of weather situations that adversely affect health<br />
• Monitoring of the weather forecasts<br />
• Mechanisms by which general warnings are issued when an adverse weather<br />
situation is forecast<br />
• Communication of the warning either to the general<br />
public<br />
<strong>and</strong>/or<br />
• to health agencies<br />
• The warning triggers<br />
community-based public<br />
health interventions<br />
117<br />
ANNEX 3.
Annex 4.<br />
Projection of climate change in European cities<br />
City Scenario Methods Results Comments Reference<br />
Berlin<br />
Berlin<br />
ECHAM1<br />
simulation until<br />
2100<br />
Control run<br />
(carbon dioxide<br />
concentrations<br />
remain at 1985<br />
level)<br />
118<br />
Regional climate<br />
model FITNAH<br />
(high resolution<br />
(100 m by 100 m<br />
grid), threedimensional<br />
simulation<br />
of urban<br />
mesoclimate)<br />
was nested<br />
<strong>Change</strong>s in mean temperature<br />
Between 2040 <strong>and</strong> 2070, air<br />
temperature will increase by 2 °C<br />
without changes in the building<br />
structure <strong>and</strong> by 3 °C to 4 °C after<br />
Potsdammer Platz <strong>and</strong> Spreebogen<br />
are covered with buildings<br />
Further, wind speed will decrease<br />
by 80% based on the reference<br />
climate<br />
<strong>Change</strong>s in the probability of<br />
extreme events<br />
Increase in number, duration <strong>and</strong><br />
intensity of heat-waves<br />
<strong>Change</strong>s in the mean winter<br />
temperature<br />
Warming (2080) by 2.5 °C<br />
compared with reference run<br />
(without looking at changes in the<br />
city structure)<br />
<strong>Change</strong>s in the probability of<br />
extreme events<br />
Three times more hot days (Tmax ><br />
30 °C) in 2080 <strong>and</strong> nine times more<br />
very hot days (Tmax > 39 °C) than<br />
in 1985<br />
Wagner<br />
(1994)<br />
Gross<br />
(1996)
City Scenario Methods Results Comments Reference<br />
Berlin<br />
Vienna<br />
Model:<br />
ECHAM1/LSG;<br />
time horizon<br />
(2050–2079)<br />
Historical data<br />
from 1873 to<br />
1990 are used to<br />
generate<br />
scenarios of<br />
changing<br />
climate <strong>and</strong> to<br />
calculate the<br />
impact of this<br />
variation on<br />
thermal comfort<br />
General<br />
circulation<br />
model of the<br />
Goddard<br />
Institute for<br />
Space Studies<br />
for Europe<br />
(doubling of the<br />
CO2<br />
concentration)<br />
Monte Carlo<br />
simulations using<br />
a<br />
first-order<br />
autoregressive<br />
model<br />
1.7 °C increase in mean air<br />
temperature, 19% increase in<br />
st<strong>and</strong>ard deviation, slight increase<br />
in first-order autocorrelation<br />
coefficient<br />
<strong>Change</strong>s in the probability of<br />
extreme events in July<br />
An extreme event is defined as five<br />
consecutive daily maximum<br />
temperatures:<br />
• exceeding 30 °C: repetition rates<br />
will decrease from 8 years to<br />
3 years<br />
• exceeding 33 °C: repetition rates<br />
will decrease from 47 years to<br />
8 years<br />
Temperature increase of the general<br />
circulation model of the Goddard<br />
Institute for Space Studies is equal<br />
to the 10 warmest months between<br />
1873 <strong>and</strong> 1990<br />
<strong>Change</strong>s in the probability of<br />
extreme events<br />
Number of days with heat stress in<br />
July will increase from 1.8 to 5.2<br />
Number of days with cold stress in<br />
January will be reduced from 21<br />
to 7.5<br />
Limitations:<br />
temporal<br />
analogue only<br />
works if other<br />
meteorological<br />
parameters<br />
influencing heat<br />
stress remain<br />
the same<br />
119<br />
Wagner<br />
(1999)<br />
Koch<br />
et al.<br />
(1992)<br />
ANNEX 4.<br />
<strong>Heat</strong> stress is defined based on an human energy balance model. Discomfort occurs if one of the following criteria are<br />
fulfilled: mean skin temperature less than 29°C or higher than 35°C; heat gain caused by shivering > 0; sweat rate > 1.5<br />
times the mean sweat rate in case of comfort; skin wetness > 25%. Clothing is varied by ± 0.5 clo (baseline clothing in July<br />
1.0 clo). <strong>Heat</strong> (cold) stress occurs if the model shows discomfort after improving for clothing.
City Scenario Methods Results Comments Reference<br />
Istanbul<br />
London HadCM3<br />
(1961–2099)<br />
UKCIP02<br />
Medium-high<br />
emissions<br />
Medium-low<br />
emissions<br />
120<br />
Assumed change<br />
in temperature: 5<br />
°C (months July<br />
<strong>and</strong> August, shift<br />
in the mean <strong>and</strong><br />
not in the<br />
variance)<br />
Probability<br />
density function<br />
(15 years of data)<br />
was shifted by<br />
the 5 °C assumed<br />
change in<br />
temperature<br />
Regression model<br />
based on the<br />
period<br />
1961–1990<br />
Predictors:<br />
near surface wind<br />
strength<br />
westerly wind<br />
strength<br />
vorticity<br />
relative humidity<br />
850 hPa<br />
geopotential<br />
height<br />
<strong>Change</strong>s in the probability of<br />
extreme events<br />
Probability of getting daily mean<br />
temperatures over 30 °C:<br />
current climate: ~ 0<br />
future: 8 out of 61 (~ 8 per year)<br />
∆UHI ∆UKC ∆f<br />
(°C) IP02 (days)<br />
(°C)<br />
2020s 0.07 0.5–1.0 5<br />
2050s 0.16 2.0–2.5 9<br />
2080s 0.26 3.5–4.0 15<br />
2020s 0.03 0.5–1.0 3<br />
2050s 0.17 1.5–2.0 10<br />
2080s 0.19 2.5–3.0 11<br />
Limitations:<br />
<strong>No</strong> change in<br />
the variance was<br />
considered<br />
Coarse<br />
resolution of<br />
global<br />
circulation<br />
model<br />
Predicted<br />
population<br />
changes (1990:<br />
7.4 million to<br />
15.5 million in<br />
2040) were not<br />
considered<br />
∆UHI: changes<br />
in the annual<br />
nocturnal urban<br />
heat isl<strong>and</strong><br />
intensity;<br />
changes are in<br />
addition to<br />
regional<br />
warming<br />
∆UKCIP02:<br />
regional<br />
temperature<br />
changes<br />
projected by the<br />
UKCIP02<br />
∆f: changes in<br />
the frequency of<br />
intense (>4 °C)<br />
urban heat<br />
isl<strong>and</strong> days<br />
All changes with<br />
respect to<br />
1961–1990<br />
average (urban<br />
heat isl<strong>and</strong><br />
= 1.8 °C)<br />
Dalfes<br />
(1991)<br />
Wilby<br />
(2003)
Addresses of offices that contributed to the study<br />
World <strong>Health</strong> Organization<br />
Regional Office for Europe<br />
Scherfigsvej 8, DK-2100 Copenhagen Ø, Denmark<br />
Tel.: +45 39 17 17 17<br />
Fax: +45 39 17 18 18<br />
E-mail: postmaster@euro.who.int<br />
Web site: www.euro.who.int<br />
For climate change <strong>and</strong> adaptation strategies for human health:<br />
www.euro.who.int/ccashh<br />
Deutscher Wetterdienst<br />
Stefan-Meier-Str. 4-6<br />
D-79104 Freiburg<br />
Tel: +49 (0)761 28202-0<br />
Fax: +49 (0)761 2820277<br />
http://www.dwd.de<br />
London School of Hygiene <strong>and</strong> Tropical Medicine<br />
Keppel Street<br />
London WC1E 7HT<br />
United Kingdom<br />
Tel: +44 20 7636 8636<br />
Fax: +44 20 7436 5389<br />
http://www.lshtm.ac.uk<br />
European Commission<br />
Energy, Environment <strong>and</strong> Sustainable Development (EESD) (FP5)<br />
1049 Brussels<br />
Belgium<br />
http://www.cordis.lu/eesd/<br />
123
World <strong>Health</strong> Organization<br />
Regional Office for Europe<br />
Scherfigsvej 8, DK-2100 Copenhagen Ø, Denmark<br />
Tel.: +45 39 17 17 17<br />
Fax: +45 39 17 18 18<br />
E-mail: postmaster@euro.who.int<br />
Web site: www.euro.who.int<br />
ISBN 92 890 1094 0