Presentation - National Water Research Institute
Presentation - National Water Research Institute
Presentation - National Water Research Institute

You also want an ePaper? Increase the reach of your titles
YUMPU automatically turns print PDFs into web optimized ePapers that Google loves.
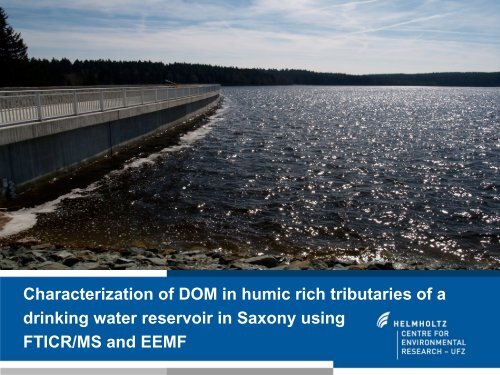
Characterization of DOM in humic rich tributaries of a<br />
drinking water reservoir in Saxony using<br />
FTICR/MS and EEMF
Helmholtz Centre<br />
For Environmental <strong>Research</strong> – UFZ<br />
Peter Herzsprung, W. v. Tümpling, J. Bravidor<br />
(peter.herzsprung@ufz.de)<br />
Helmholtz Zentrum München<br />
German <strong>Research</strong> Centre for Environmental Health<br />
N. Hertkorn, M. Harir, P. Schmitt-Kopplin<br />
Characterization of DOM in humic rich tributaries of a<br />
drinking water reservoir in Saxony using<br />
FTICR/MS and EEMF
Problem: In Saxony drinking water is supplied<br />
from Ore Mountains reservoirs influenced<br />
by increasing DOC concentration of raw water
Problem: In Saxony drinking water is supplied<br />
from Ore Mountains reservoirs influenced<br />
by increasing DOC concentration of raw water<br />
Consequence:<br />
Usability of reservoir water as raw water can be limited by:<br />
- unpleasant taste, odour, and colour<br />
- increase of flocculation costs<br />
- undesirable harmful disinfection byproducts
Questions to be answered.<br />
1. What can be said about the relation between<br />
fluorescence and DOC?<br />
2. Is there any seasonal influence on the fluorescence<br />
DOC relation?<br />
3. What can be said about the abundance of typical<br />
compound groups?<br />
4. How can the information be used for using best<br />
raw drinking water?
water sampling<br />
DOC<br />
UV<br />
EEMF<br />
FTICR/MS<br />
bulk<br />
concentration<br />
bulk<br />
optical<br />
properties<br />
group<br />
species<br />
elemental<br />
formulae<br />
data analysis<br />
biogeochemical evaluation
water sampling<br />
DOC<br />
UV<br />
EEMF<br />
FTICR/MS<br />
bulk<br />
concentration<br />
bulk<br />
optical<br />
properties<br />
group<br />
species<br />
elemental<br />
formulae<br />
data analysis<br />
biogeochemical evaluation
Catchment area of reservoir Muldenberg<br />
Effluent TSP<br />
Saubach<br />
SBA<br />
Red Mulde<br />
RMU<br />
White Mulde<br />
WMU<br />
Sauteich<br />
STE<br />
Germany<br />
Saxony<br />
Muldenberg<br />
1 km<br />
W<br />
N<br />
S<br />
E
Reservoir<br />
Effluent<br />
Coloured water
water sampling<br />
DOC<br />
UV<br />
EEMF<br />
FTICR/MS<br />
bulk<br />
concentration<br />
bulk<br />
optical<br />
properties<br />
group<br />
species<br />
elemental<br />
formulae<br />
data analysis<br />
biogeochemical evaluation
water sampling<br />
DOC<br />
UV<br />
EEMF<br />
FTICR/MS<br />
bulk<br />
concentration<br />
bulk<br />
optical<br />
properties<br />
group<br />
species<br />
elemental<br />
formulae<br />
data analysis<br />
biogeochemical evaluation
methods<br />
2 0 0 0<br />
1 8 0 0<br />
1 6 0 0<br />
1 4 0 0<br />
1 2 0 0<br />
1 0 0 0<br />
8 0 0<br />
6 0 0<br />
4 0 0<br />
2 0 0<br />
0<br />
3D fluorescence (EEMF)<br />
2 4 0<br />
2 5 0<br />
2 6 0<br />
2 7 0<br />
2 8 0<br />
2 9 0<br />
3 0 0<br />
3 1 0<br />
3 2 0<br />
3 3 0<br />
3 4 0<br />
3 5 0<br />
3 6 0<br />
intensity<br />
(A.U.)<br />
emission 260 – 585 nm<br />
excitation<br />
240 – 360 nm
methods<br />
humic-like<br />
Ligninphenol<br />
like<br />
HO<br />
H<br />
C<br />
R<br />
?<br />
protein-like<br />
Excitation (nm)<br />
360<br />
340<br />
320<br />
300<br />
0<br />
100<br />
200<br />
300<br />
400<br />
500<br />
Intensity<br />
(A.U.)<br />
HO<br />
OCH 3<br />
280<br />
According to Burdige et al,<br />
Marine Chem. 51, 325-346 (2004)<br />
260<br />
240<br />
Contour plot<br />
300 350 400 450 500 550<br />
Emission (nm)
methods<br />
Scaling of fluorescence diagrams<br />
Excitation (nm)<br />
Seite 14<br />
360<br />
340<br />
320<br />
300<br />
280<br />
260<br />
240<br />
Sampling site, date<br />
0<br />
200<br />
400<br />
600<br />
800<br />
Intensity (A.U.)<br />
300 350 400 450 500 550<br />
Emission (nm)<br />
Median values<br />
Excitation:<br />
320 – 345 nm<br />
Emission:<br />
410 – 440 nm<br />
Wave length area<br />
for evaluation of<br />
fluorescence intensity<br />
(Humic like fluorescence)
water sampling<br />
DOC<br />
UV<br />
EEMF<br />
FTICR/MS<br />
bulk<br />
concentration<br />
bulk<br />
optical<br />
properties<br />
group<br />
species<br />
elemental<br />
formulae<br />
data analysis<br />
biogeochemical evaluation
OH<br />
O<br />
H<br />
H<br />
O<br />
C<br />
OH<br />
H<br />
H<br />
HOOC<br />
OH<br />
H<br />
O<br />
C<br />
C<br />
COOH<br />
H<br />
HO<br />
H<br />
H<br />
C 17 H 14 O 11 - millions of isomeric solutions?<br />
HO<br />
HO<br />
OH<br />
O<br />
OH<br />
H<br />
HO<br />
HO<br />
OH<br />
OH<br />
OH<br />
O C C<br />
H<br />
H<br />
H<br />
H
methods<br />
FTICR/MS elemental formulae <br />
van Krevelen diagrams: geochemical pools of DOM<br />
2,5<br />
2.5<br />
Simplified illustration<br />
H/C ratio<br />
2.0 2<br />
1.5 1,5<br />
1.0<br />
1<br />
0.5<br />
0,5<br />
lipids<br />
lignins<br />
black carbon<br />
proteins<br />
carbohydrates<br />
tannins<br />
0 0 0.2 0.4 0.6 0.8 1.0<br />
0 0,2 0,4 0,6 0,8 1<br />
O/C ratio
Questions to be answered.<br />
1. What can be said about the relation between<br />
fluorescence and DOC?<br />
2. Is there any seasonal influence on the fluorescence<br />
DOC relation?<br />
3. What can be said about the abundance of typical<br />
compound groups?<br />
4. How can the information be used for using best<br />
raw drinking water?
esults<br />
Humic like fluorescence versus DOC<br />
March July August<br />
RMU 0309<br />
RMU 0709<br />
RMU 0809<br />
RMU<br />
WMU<br />
excitation<br />
Excitation (nm)<br />
Excitation (nm)<br />
360<br />
340<br />
320<br />
300<br />
280<br />
260<br />
240<br />
360<br />
340<br />
320<br />
Excitation (nm)<br />
300<br />
440 A.U. 280<br />
622 A.U.<br />
WMU 0309<br />
Excitation (nm)<br />
360<br />
340<br />
320<br />
260<br />
240<br />
260<br />
0<br />
200<br />
400<br />
600<br />
800<br />
Excitation (nm)<br />
360<br />
340<br />
320<br />
300<br />
280<br />
260<br />
11.7 mg/l 10.3 mg/l<br />
240<br />
300 350 400 450 500 550<br />
300 350 400 450 500 550<br />
Emission (nm)<br />
WMU 0709<br />
300<br />
300<br />
435 A.U.<br />
280<br />
280 453 A.U.<br />
260<br />
240<br />
0<br />
200<br />
400<br />
600<br />
800<br />
9.1 mg/l<br />
300 350 400 450 500 550<br />
0<br />
200<br />
400<br />
600<br />
800<br />
Emission (nm)<br />
10.8 mg/l<br />
300 350 400 450 500 550<br />
Emission (nm)<br />
360<br />
340<br />
320<br />
0<br />
200<br />
400<br />
600<br />
800<br />
8.2 mg/l<br />
240<br />
300 350 400 450 500 550<br />
Emission (nm)<br />
emission<br />
Excitation (nm)<br />
360<br />
340<br />
320<br />
300<br />
280<br />
260<br />
240<br />
0<br />
200<br />
400<br />
600<br />
800<br />
577 A.U.<br />
0<br />
200<br />
400<br />
600<br />
800<br />
Emission (nm)<br />
WMU 0809<br />
347 A.U.<br />
5.7 mg/l<br />
300 350 400 450 500 550<br />
Emission (nm)
Answer<br />
- No direct relation between the fluorescence<br />
and the DOC.<br />
- EEMF generates new information
Questions to be answered.<br />
1. What can be said about the relation between<br />
fluorescence and DOC?<br />
2. Is there any seasonal influence on the fluorescence<br />
DOC relation?<br />
3. What can be said about the abundance of typical<br />
compound groups?<br />
4. How can the information be used for using best<br />
raw drinking water?
esults Humic like fluorescence at different seasons<br />
excitation<br />
Excitation (nm)<br />
Excitation (nm)<br />
Excitation (nm)<br />
Excitation (nm)<br />
January March April July August<br />
RMU 0109<br />
360<br />
0<br />
200<br />
340 400<br />
600<br />
800<br />
320<br />
300<br />
280<br />
260<br />
240<br />
300 350 400 450 500 550<br />
360<br />
340<br />
320<br />
300<br />
280<br />
260<br />
240<br />
360<br />
340<br />
320<br />
300<br />
280<br />
260<br />
240<br />
360<br />
340<br />
320<br />
300<br />
280<br />
260<br />
240<br />
Excitation (nm)<br />
Excitation (nm)<br />
360<br />
340<br />
320<br />
300<br />
280<br />
260<br />
240<br />
Emission (nm)<br />
WMU 0109<br />
360<br />
0<br />
200<br />
400<br />
340<br />
600<br />
800<br />
320<br />
300<br />
280<br />
260<br />
240<br />
300 350 400 450 500 550<br />
Emission (nm)<br />
SBA 0109<br />
360<br />
0<br />
200<br />
400<br />
340<br />
600<br />
800<br />
320<br />
300<br />
Excitation (nm)<br />
280<br />
260<br />
240<br />
300 350 400 450 500 550<br />
Emission (nm)<br />
STE 0109<br />
360<br />
0<br />
200<br />
400<br />
340<br />
600<br />
800<br />
320<br />
300<br />
Excitation (nm)<br />
280<br />
260<br />
240<br />
300 350 400 450 500 550<br />
Emission (nm)<br />
TSP 0109<br />
RMU 0309<br />
RMU 0409<br />
360<br />
0<br />
0<br />
200<br />
200<br />
400<br />
340 400<br />
600<br />
600<br />
800<br />
800<br />
320<br />
Excitation (nm)<br />
Excitation (nm)<br />
Excitation (nm)<br />
Excitation (nm)<br />
300<br />
RMU<br />
280<br />
260<br />
240<br />
300 350 400 450 500 550<br />
300 350 400 450 500 550<br />
Emission (nm)<br />
Emission (nm)<br />
WMU 0309<br />
WMU 0409<br />
360<br />
0<br />
0<br />
200<br />
200<br />
400<br />
340 400<br />
600<br />
600<br />
800<br />
800<br />
320<br />
300<br />
WMU<br />
280<br />
260<br />
240<br />
300 350 400 450 500 550<br />
300 350 400 450 500 550<br />
Emission (nm)<br />
Emission (nm)<br />
SBA 0309<br />
SBA 0409<br />
360<br />
0<br />
0<br />
200<br />
200<br />
400<br />
340 400<br />
600<br />
600<br />
800<br />
800<br />
320<br />
300<br />
SBA<br />
280<br />
260<br />
240<br />
300 350 400 450 500 550<br />
300 350 400 450 500 550<br />
Emission (nm)<br />
Emission (nm)<br />
STE 0309<br />
STE 0409<br />
360<br />
0<br />
0<br />
200<br />
200<br />
400<br />
340 400<br />
600<br />
600<br />
800<br />
800<br />
320<br />
300<br />
STE<br />
280<br />
260<br />
240<br />
300 350 400 450 500 550<br />
300 350 400 450 500 550<br />
Emission (nm)<br />
Emission (nm)<br />
TSP 0309<br />
TSP 0409<br />
Excitation (nm)<br />
Excitation (nm)<br />
Excitation (nm)<br />
Excitation (nm)<br />
RMU 0709<br />
360<br />
0<br />
200<br />
340 400<br />
600<br />
800<br />
320<br />
300<br />
280<br />
260<br />
240<br />
300 350 400 450 500 550<br />
Emission (nm)<br />
WMU 0709<br />
360<br />
0<br />
200<br />
340 400<br />
600<br />
800<br />
320<br />
300<br />
280<br />
260<br />
240<br />
300 350 400 450 500 550<br />
Emission (nm)<br />
SBA 0709<br />
360<br />
0<br />
200<br />
340 400<br />
600<br />
800<br />
320<br />
300<br />
280<br />
260<br />
240<br />
300 350 400 450 500 550<br />
Emission (nm)<br />
STE 0709<br />
360<br />
0<br />
200<br />
340 400<br />
600<br />
800<br />
320<br />
300<br />
280<br />
260<br />
240<br />
300 350 400 450 500 550<br />
Emission (nm)<br />
TSP 0709<br />
Excitation (nm)<br />
Excitation (nm)<br />
Excitation (nm)<br />
Excitation (nm)<br />
RMU 0809<br />
360<br />
0<br />
200<br />
340 400<br />
600<br />
800<br />
320<br />
300<br />
280<br />
260<br />
240<br />
300 350 400 450 500 550<br />
Emission (nm)<br />
WMU 0809<br />
360<br />
0<br />
200<br />
340 400<br />
600<br />
800<br />
320<br />
300<br />
280<br />
260<br />
240<br />
300 350 400 450 500 550<br />
Emission (nm)<br />
SBA 0809<br />
360<br />
0<br />
200<br />
340 400<br />
600<br />
800<br />
320<br />
300<br />
280<br />
260<br />
240<br />
300 350 400 450 500 550<br />
Emission (nm)<br />
STE 0809<br />
360<br />
0<br />
200<br />
340 400<br />
600<br />
800<br />
320<br />
300<br />
280<br />
260<br />
240<br />
300 350 400 450 500 550<br />
Emission (nm)<br />
TSP 0809<br />
Excitation (nm)<br />
Excitation (nm)<br />
Excitation (nm)<br />
Sept.<br />
RMU 0909<br />
360<br />
0<br />
200<br />
340 400<br />
600<br />
800<br />
320<br />
300<br />
280<br />
260<br />
240<br />
300 350 400 450 500 550<br />
Emission (nm)<br />
WMU 0909<br />
360<br />
0<br />
200<br />
340 400<br />
600<br />
800<br />
320<br />
300<br />
280<br />
260<br />
240<br />
300 350 400 450 500 550<br />
Emission (nm)<br />
SBA 0909<br />
360<br />
0<br />
200<br />
340 400<br />
600<br />
800<br />
320<br />
300<br />
280<br />
260<br />
240<br />
300 350 400 450 500 550<br />
Emission (nm)<br />
TSP 0909<br />
Excitation (nm)<br />
Excitation (nm)<br />
Excitation (nm)<br />
Excitation (nm)<br />
October December<br />
RMU 1009<br />
360<br />
0<br />
200<br />
340 400<br />
600<br />
800<br />
320<br />
300<br />
280<br />
260<br />
240<br />
300 350 400 450 500 550<br />
Emission (nm)<br />
WMU 1009<br />
360<br />
0<br />
200<br />
340 400<br />
600<br />
800<br />
320<br />
300<br />
280<br />
260<br />
240<br />
300 350 400 450 500 550<br />
Emission (nm)<br />
SBA 1009<br />
360<br />
0<br />
200<br />
340 400<br />
600<br />
800<br />
320<br />
300<br />
280<br />
260<br />
240<br />
300 350 400 450 500 550<br />
Emission (nm)<br />
STE 1009<br />
360<br />
0<br />
200<br />
340 400<br />
600<br />
800<br />
320<br />
300<br />
280<br />
260<br />
240<br />
300 350 400 450 500 550<br />
Emission (nm)<br />
TSP 1009<br />
Excitation (nm)<br />
Excitation (nm)<br />
Excitation (nm)<br />
Excitation (nm)<br />
RMU 1209<br />
360<br />
0<br />
200<br />
340 400<br />
600<br />
800<br />
320<br />
300<br />
280<br />
260<br />
240<br />
300 350 400 450 500 550<br />
Emission (nm)<br />
WMU 1209<br />
360<br />
0<br />
200<br />
340 400<br />
600<br />
800<br />
320<br />
300<br />
280<br />
260<br />
240<br />
300 350 400 450 500 550<br />
Emission (nm)<br />
SBA 1209<br />
360<br />
0<br />
200<br />
340 400<br />
600<br />
800<br />
320<br />
300<br />
280<br />
260<br />
240<br />
300 350 400 450 500 550<br />
Emission (nm)<br />
STE 1209<br />
360<br />
0<br />
200<br />
340 400<br />
600<br />
800<br />
320<br />
300<br />
280<br />
260<br />
240<br />
300 350 400 450 500 550<br />
Emission (nm)<br />
TSP 1209<br />
pond tributaries<br />
Excitation (nm)<br />
360<br />
340<br />
320<br />
300<br />
280<br />
260<br />
240<br />
0<br />
200<br />
400<br />
600<br />
800<br />
300 350 400 450 500 550<br />
Emission (nm)<br />
Excitation (nm)<br />
360<br />
340<br />
320<br />
300<br />
280<br />
260<br />
240<br />
0<br />
200<br />
400<br />
600<br />
800<br />
300 350 400 450 500 550<br />
Emission (nm)<br />
Excitation (nm)<br />
360<br />
340<br />
320<br />
300<br />
280<br />
260<br />
240<br />
0<br />
200<br />
400<br />
600<br />
800<br />
TSP<br />
300 350 400 450 500 550<br />
Emission (nm)<br />
Excitation (nm)<br />
360<br />
340<br />
320<br />
300<br />
280<br />
260<br />
240<br />
360<br />
360<br />
0<br />
0<br />
200<br />
200<br />
400<br />
340 400<br />
340<br />
600<br />
600<br />
800<br />
800<br />
320<br />
320<br />
Excitation (nm)<br />
300<br />
300<br />
280<br />
280<br />
260<br />
260<br />
240<br />
240<br />
300 350 400 450 500 550<br />
300 350 400 450 500 550<br />
emission<br />
Emission (nm)<br />
Emission (nm)<br />
Excitation (nm)<br />
0<br />
200<br />
400<br />
600<br />
800<br />
300 350 400 450 500 550<br />
Emission (nm)<br />
Excitation (nm)<br />
360<br />
340<br />
320<br />
300<br />
280<br />
260<br />
240<br />
0<br />
200<br />
400<br />
600<br />
800<br />
300 350 400 450 500 550<br />
Emission (nm)<br />
Excitation (nm)<br />
360<br />
340<br />
320<br />
300<br />
280<br />
260<br />
240<br />
0<br />
200<br />
400<br />
600<br />
800<br />
300 350 400 450 500 550<br />
Emission (nm)<br />
effluent
esults<br />
Seasonal behaviour of DOC and fluorescence<br />
Quotient of<br />
median fluorescence intensity<br />
and DOC<br />
Seite 23
Answer<br />
- Specific fluorescence activity (of DOC) rise<br />
between March and September.<br />
- Specific fluorescence activity rise can not be explained<br />
by EEMF.
Question to be answered.<br />
1. What can be said about the relation between<br />
fluorescence and DOC?<br />
2. Is there any seasonal influence on the behaviour?<br />
3. What can be said about the abundance of typical<br />
compound groups?<br />
- seasonal effect<br />
- relation between fluorescence and<br />
biogeochemical pools<br />
4. How can the information be used for using best<br />
raw drinking water?
esults<br />
FTICR/MS data available<br />
Quotient of<br />
median fluorescence intensity<br />
and DOC<br />
Seite 26
esults<br />
Bulk van Krevelen diagrams<br />
2<br />
1.5<br />
1<br />
0.5<br />
0<br />
black carbon<br />
H/C<br />
O/C<br />
1<br />
lipids<br />
March<br />
0 0.2 0.4 0.6 0.8 1<br />
2<br />
1.5<br />
proteins carbohydrates<br />
lignins<br />
tannins<br />
Evaluation of CHO formulae;<br />
CHOS and CHON not considered<br />
0.5<br />
0<br />
July<br />
0 0.2 0.4 0.6 0.8 1
esults<br />
Excitation (nm)<br />
360<br />
340<br />
320<br />
300<br />
280<br />
260<br />
240<br />
2<br />
0<br />
200<br />
400<br />
600<br />
800<br />
DOC<br />
RMU3<br />
RMU 0309<br />
Difference in abundance of elemental formulae<br />
Excitation (nm)<br />
RMU 0709<br />
280<br />
260<br />
9.1 mg/l 11.7 mg/l<br />
300 350 400 450 500 550<br />
Emission (nm)<br />
360<br />
340<br />
320<br />
300<br />
240<br />
0<br />
200<br />
400<br />
600<br />
800<br />
DOC<br />
RMU7<br />
300 350 400 450 500 550<br />
Emission (nm)<br />
RMU3 + RMU7<br />
2<br />
1.5<br />
1<br />
0.5<br />
0<br />
2<br />
RMU3<br />
different abundance<br />
0 0.2 0.4 0.6 0.8 1<br />
RMU7<br />
1.5<br />
1.5<br />
1<br />
0.5<br />
0<br />
common abundance<br />
H/C<br />
0 0.2 0.4 0.6 0.8 1<br />
1<br />
0.5<br />
O/C<br />
0<br />
different abundance<br />
0 0.2 0.4 0.6 0.8 1
esults<br />
mass peaks<br />
biunique<br />
assignment<br />
intensity values<br />
Rank analysis (different seasons) FTICR/MS<br />
for 638 common elemental formulae in 4 samples<br />
C 17 H 14 O 11<br />
rank within<br />
638 el.<br />
formulas<br />
rank within<br />
4 samples<br />
RMU3 124 4<br />
March<br />
RMU4 86 3<br />
April<br />
RMU7 36 1<br />
July<br />
RMU8 52 2<br />
August
esults<br />
mass peaks<br />
Rank analysis (different seasons) FTICR/MS<br />
for 638 common elemental formulae in 4 samples<br />
2.5<br />
biunique<br />
assignment<br />
C 17 H 14 O 11<br />
rank within<br />
638 el.<br />
formulas<br />
rank within<br />
4 samples<br />
RMU3 124 4<br />
March<br />
RMU4 86 3<br />
April<br />
RMU7 36 1<br />
July<br />
RMU8 52 2<br />
August<br />
intensity values<br />
0 1<br />
Van Krevelen diagrams<br />
2<br />
1.5<br />
1<br />
0.5<br />
H/C<br />
0<br />
O/C<br />
0<br />
Rank 1<br />
Rank 2<br />
Rank 3<br />
Rank 4<br />
Red Mulde / July<br />
depiction of the ranked formulae<br />
0 0.2 0.4 0.6 0.8 1
esults<br />
2<br />
1.5<br />
1<br />
Rank analysis (different seasons) FTICR/MS<br />
Red Mulde<br />
2.5<br />
0<br />
Rank 1<br />
Rank 2<br />
Rank 3<br />
Rank 4<br />
0 1<br />
lignins<br />
tannins<br />
0.5<br />
0<br />
March<br />
H/C<br />
O/C<br />
0 0.2 0.4 0.6 0.8 1<br />
2<br />
1.5<br />
Red Mulde<br />
1<br />
0.5<br />
0<br />
July<br />
0 0.2 0.4 0.6 0.8 1
esults<br />
2<br />
1.5<br />
1<br />
Rank analysis (different seasons) FTICR/MS<br />
Saubach<br />
2.5<br />
0<br />
Rank 1<br />
Rank 2<br />
Rank 3<br />
Rank 4<br />
0 1<br />
lignins<br />
tannins<br />
0.5<br />
0<br />
March<br />
H/C<br />
O/C<br />
0 0.2 0.4 0.6 0.8 1<br />
2<br />
1.5<br />
Saubach<br />
1<br />
0.5<br />
0<br />
July<br />
0 0.2 0.4 0.6 0.8 1
Question to be answered.<br />
1. What can be said about the relation between<br />
fluorescence and DOC?<br />
2. Is there any seasonal influence on the behaviour?<br />
3. What can be said about the abundance of typical<br />
compound groups?<br />
- seasonal effect<br />
- relation between fluorescence and<br />
biogeochemical pools<br />
4. How can the information be used for using best<br />
raw drinking water?
Flößgrabenquelle<br />
Red Mulde<br />
Black<br />
pool<br />
DOC 0.37 mg/l<br />
DOC 10.3 mg/l<br />
DOC 83 mg/l<br />
2<br />
2<br />
2<br />
1.5<br />
1.5<br />
1.5<br />
H/C<br />
1<br />
H/C<br />
1<br />
H/C<br />
1<br />
0.5<br />
0<br />
0 0.2 0.4 0.6 0.8 1<br />
Pr4 SBA 0809 O/CFlöss Q unten<br />
0.5<br />
0<br />
0 0.2 0.4 0.6 0.8 1<br />
O/C RMU 0809<br />
0.5<br />
0<br />
1:5 diluted<br />
0 0.2 0.4 0.6 0.8 1<br />
O/C<br />
Rote Mulde Pr11<br />
excitation<br />
Excitation (nm)<br />
360<br />
340<br />
320<br />
300<br />
280<br />
260<br />
240<br />
0<br />
200<br />
400<br />
600<br />
800<br />
300 350 400 450 500 550<br />
emission<br />
Emission (nm)<br />
Excitation (nm)<br />
360<br />
340<br />
320<br />
300<br />
280<br />
260<br />
240<br />
0<br />
200<br />
400<br />
600<br />
800<br />
300 350 400 450 500 550<br />
Emission (nm)<br />
Excitation (nm)<br />
360<br />
340<br />
320<br />
300<br />
280<br />
260<br />
240<br />
0<br />
200<br />
400<br />
600<br />
800<br />
undiluted<br />
300 350 400 450 500 550<br />
Emission (nm)
360<br />
340<br />
320<br />
300<br />
280<br />
260<br />
240<br />
360<br />
340<br />
320<br />
300<br />
280<br />
260<br />
240<br />
360<br />
340<br />
320<br />
300<br />
280<br />
260<br />
240<br />
360<br />
340<br />
320<br />
300<br />
280<br />
260<br />
240<br />
360<br />
340<br />
320<br />
300<br />
280<br />
260<br />
240<br />
0<br />
200<br />
400<br />
600<br />
800<br />
300 350 400 450 500 550<br />
Emission (nm)<br />
0<br />
200<br />
400<br />
600<br />
800<br />
300 350 400 450 500 550<br />
0<br />
200<br />
400<br />
600<br />
800<br />
0<br />
200<br />
400<br />
600<br />
800<br />
Emission (nm)<br />
300 350 400 450 500 550<br />
0<br />
200<br />
400<br />
600<br />
800<br />
Emission (nm)<br />
300 350 400 450 500 550<br />
Emission (nm)<br />
300 350 400 450 500 550<br />
Emission (nm)<br />
results<br />
EEMF<br />
Comparison between fluorescence ranking<br />
and mass intensity inter samples ranking<br />
Sample EEMF FTICR/MS-Ranks (455 common compounds)<br />
Nr Name Ranks C 17 H 14 O 11 C 20 H 28 O 7<br />
Comp. …<br />
RMU 0709<br />
3<br />
Comp.<br />
455<br />
1 RMU7 1 1 17 … … …<br />
… WMU7 3 2 14 … … …<br />
… TSP7 8 10 16 … … …<br />
… STE7 15 15 19 … … …<br />
… SBA7 18 19 11 … … …<br />
… … … … … … … …<br />
20 … … … … … … …<br />
Excitation (nm)<br />
Excitation (nm)<br />
Excitation (nm)<br />
Excitation (nm)<br />
Excitation (nm)<br />
WMU 0709<br />
TSP 0709<br />
STE 0709<br />
SBA 0709<br />
Rank correlation<br />
(Spearman)<br />
FTICR/MS<br />
for each compound
360<br />
340<br />
320<br />
300<br />
280<br />
260<br />
240<br />
360<br />
340<br />
320<br />
300<br />
280<br />
260<br />
240<br />
360<br />
340<br />
320<br />
300<br />
280<br />
260<br />
240<br />
360<br />
340<br />
320<br />
300<br />
280<br />
260<br />
240<br />
360<br />
340<br />
320<br />
300<br />
280<br />
260<br />
240<br />
0<br />
200<br />
400<br />
600<br />
800<br />
300 350 400 450 500 550<br />
Emission (nm)<br />
0<br />
200<br />
400<br />
600<br />
800<br />
300 350 400 450 500 550<br />
0<br />
200<br />
400<br />
600<br />
800<br />
0<br />
200<br />
400<br />
600<br />
800<br />
Emission (nm)<br />
300 350 400 450 500 550<br />
0<br />
200<br />
400<br />
600<br />
800<br />
Emission (nm)<br />
300 350 400 450 500 550<br />
Emission (nm)<br />
300 350 400 450 500 550<br />
Emission (nm)<br />
results<br />
EEMF<br />
Comparison between fluorescence ranking<br />
and mass intensity inter samples ranking<br />
Sample EEMF FTICR/MS-Ranks (455 common compounds)<br />
Nr Name Ranks C 17 H 14 O 11 C 20 H 28 O 7<br />
Comp. …<br />
RMU 0709<br />
3<br />
Comp.<br />
455<br />
1 RMU7 1 1 17 … … …<br />
… WMU7 3 2 14 … … …<br />
… TSP7 8 10 16 … … …<br />
… STE7 15 15 19 … … …<br />
… SBA7 18 19 11 … … …<br />
… … … … … … … …<br />
20 … … … … … … …<br />
Excitation (nm)<br />
Excitation (nm)<br />
Excitation (nm)<br />
Excitation (nm)<br />
Excitation (nm)<br />
WMU 0709<br />
TSP 0709<br />
STE 0709<br />
SBA 0709<br />
Rank correlation<br />
(Spearman)<br />
Level of significance 0.001 non sign.<br />
FTICR/MS<br />
for each compound
esults<br />
H/C<br />
2<br />
1.5<br />
1<br />
0.5<br />
Elemental formulae and their corresponding levels of<br />
xxxsignificance for correlation with humic like fluorescence<br />
Level of significance<br />
for rank correlation<br />
0.001<br />
0.005<br />
0.01<br />
0.025<br />
0.05<br />
0.1<br />
non sig.<br />
C 20 H 28 O 7<br />
C 17 H 14 O 11<br />
0<br />
0 0.2 0.4 0.6 0.8 1<br />
O/C
Answers<br />
Typical compound groups:<br />
- No or minor proteins, carbohydrates, and lipids<br />
- Dominant lignins and tannins<br />
Seasonal behaviour<br />
- Elevated input of tannins during summer months,<br />
mainly in Red Mulde and White Mulde<br />
- Opposite behaviour of the Saubach<br />
Relation of fluorescence – compound groups<br />
- The origin of humic like fluorescence (in this area)<br />
can be allocated within the pool of tannic acids
Question to be answered.<br />
1. What can be said about the relation between<br />
fluorescence and DOC?<br />
2. Is there any seasonal influence on the behaviour?<br />
3. What can be said about the abundance of typical<br />
compound groups?<br />
4. How can the information be used for using best<br />
raw drinking water?
As an example: citation from the U.S. Geolical Survey<br />
tannins are more reactive with chlorine to produce<br />
undesirable disinfection by-products than are terpenoids<br />
the abundance of tannins correlates with humic like<br />
fluorescence<br />
low<br />
Raw water<br />
is appropriate<br />
Fluoresc./DOC<br />
quotient<br />
+<br />
DOC<br />
?<br />
quality<br />
quantity<br />
high<br />
tannins<br />
Raw water<br />
is unsuitable<br />
Drinking water abstraction
4. How can the information be used for using best raw drinking<br />
water?<br />
clear decision<br />
better quality<br />
worse quality<br />
?
Conclusion<br />
• In our study area tannins could be identified as an<br />
ximportant biogeochemical pool within the DOC cycle of<br />
xthe surface water<br />
• The inter samples ranking analysis is the key to connect<br />
xoptical properties of DOM with geochemical pools derived<br />
xfrom FTICR/MS<br />
• The humic like fluorescence is an easy and low cost<br />
xadditional criterion for raw water quality evaluation
Visions:<br />
• Investigation of different fluorescent compounds using<br />
xPARAFAC (statistical fluorescence analysis)<br />
• Correlation of fluorescence compounds derived from<br />
xPARAFAC with geochemical pools derived from van<br />
xKrevelen diagrams<br />
• Correlation of fluorescent compounds and elemental<br />
xformulae compounds with disinfection byproducts<br />
xformation potential or flocculation costs
0.51 1.52 2.50<br />
01<br />
2.5 2,5<br />
2.0 2<br />
1.5 1,5<br />
1.0 1<br />
0.5 0,5<br />
0<br />
0 0,2 0,4 0,6 0,8 1<br />
0,51 1,52 2,50<br />
0<br />
Opportunity to visit me at the posters<br />
NOM characterisation in highly acidic iron rich pore waters of<br />
mine pit lakes using ultra high – resolution mass spectrometry<br />
Peter Herzsprung 1 , Norbert Hertkorn 2 ,MouradHarir 2 , Kurt Friese 1 , Philippe Schmitt-Kopplin 2<br />
1 UFZ Centre for Environmental <strong>Research</strong> Leipzig-Halle, Department Lake <strong>Research</strong>, Brückstr. 3a, 39114 Magdeburg, Germany<br />
2 HelmholtzZentrum München, German <strong>Research</strong> Center for Environment and Health, <strong>Institute</strong> of Ecological Chemistry, Ingolstädter Landstrasse 1, 85764 Neuherberg, Germany<br />
Contact: samples & ecology; elemental formula evaluation: peter.herzsprung@ufz.de, FTICR/MS: schmitt-kopplin@helmholtz-muenchen.de<br />
Introduction<br />
Analysis of DOM<br />
The leakage of acidic mine drainage from abandoned mine tailings and High-resolution spectra were acquired (in the negative ion<br />
overburden dumps, as a result of chemical and microbial oxidation of sulphide mode) with a APEX Qe FTICR mass spectrometer (Bruker,<br />
minerals is of major environmental concern. While chemical parameters such Bremen, Germany) equipped with a 12 TESLA superconducting<br />
as the amount of dissolved inorganic ions and the concentration of bulk magnet and an Apollo II microelectrospray source. FTICR mass<br />
dissolved organic carbon (DOC) can be accurately determined, understanding spectral peaks with a signal-to-noise ratio (S/N) > 2 were<br />
of the molecular composition of DOM in such acidic iron-rich environments exported to peak lists. Feasable elemental formulae (C≤100,<br />
remains incomplete. The exceptional complexity of DOM requires highresolution<br />
structural spectroscopy such as electrospray ionisation (ESI) validation). The procedure for extraction of reliable formulae<br />
O≤80, N≤5, S≤1) were computed for each peak (after 13 C<br />
Fourier transform ion cyclotron resonance mass spectrometry (FTICR/MS).<br />
from the data set is described by Herzsrung et al. [1].<br />
Differences in DOM quality abundance of elemental formulae<br />
Lake 111 (2007) Lake Moritzteich (2007)<br />
Lake Waldsee (2007)<br />
Mixolimnion pH 2.6 + Monimolimnion pH 6.8<br />
Monimolimnion pH 6.6<br />
Mixolimnion pH 3.1<br />
Mixolimnion pH 7.0<br />
H/C<br />
0.5<br />
pore-water pH Fe SO 2-<br />
4<br />
DOC<br />
0 - 2.5 cm<br />
Lake 111 2.6 80 mg/l 1060 mg/l 19 mg/l<br />
Lake Moritzteich 6.8 450 mg/l 330 mg/l 220 mg/l<br />
acidic pore water neutral pore water<br />
0<br />
0 0.2 0.4 0.6 0.8 1<br />
O/C<br />
Further differentiation of elemental formulae with common abundance<br />
inter samples ranking analysis of mass intensities<br />
example pH rank within rank within<br />
C 15 H 12 O 9 420 comp. 7 samples<br />
0 – 2 cm 2.8 278 7<br />
2 – 4 cm 3.0 220 5<br />
4 – 6 cm 2.9 221 6<br />
6 – 8 cm 3.0 205 4<br />
10 – 15 cm 3.0 80 3<br />
15 – 20 cm 3.2 71 2<br />
> 20 cm 3.2 35 1<br />
Conclusions<br />
Differences in DOM quality can be demonstrated:<br />
exemplified:<br />
by C x H y O z S 1 and C x H y O z N 1 compounds for different lakes<br />
and 2 different sediment depths respectively<br />
by C x H y O z compounds for 7 sediment depths<br />
by C x H y O z compounds for pore waters from 4 different lakes<br />
• by different abundance diagrams<br />
• by ranking analysis of formulae with<br />
xcommon abundance<br />
• in pore waters from different lakes<br />
• as a function of sediment depth<br />
H/C<br />
2.5<br />
2<br />
C x y x H y O z z<br />
Lake 111 (2009)<br />
0-2 cm<br />
1.5<br />
2-4 cm<br />
4-6 cm<br />
6-8 cm<br />
1<br />
10-15 cm<br />
15-20 cm<br />
0.5<br />
> 20 cm<br />
rank 1<br />
C15H12O9 C 12O 9<br />
0<br />
0 0.2 0.4 0.6 0.8 1<br />
O/C<br />
Trends can be observed:<br />
Lake Waldsee pH Fe SO 2-<br />
4 DOC<br />
pore-water 0 - 2.5 cm 6.7 94 mg/l 68 mg/l 71 mg/l<br />
pore-water > 20 cm 12 < 1 mg/l < 20 mg/l 29 mg/l<br />
2.5<br />
2.5<br />
2.5<br />
C common abundance<br />
common abundance<br />
x H y O z S 1 C x H y O z S 1<br />
C x H y O z N 1<br />
acidic<br />
2<br />
2<br />
2<br />
alkaline<br />
1.5<br />
1.5<br />
1.5<br />
neutral<br />
1<br />
different<br />
1<br />
1<br />
abundance<br />
H/C<br />
0.5<br />
Neutral iron rich pore waters seem to contain<br />
more aromatic and oxygen rich NOM whereas<br />
acidic or even alkaline pore waters are<br />
dominated by more aliphatic and oxygen poor<br />
compounds<br />
H/C<br />
alkaline pore water neutral pore water<br />
0<br />
0 0.2 0.4 0.6 0.8 1<br />
O/C<br />
H/C<br />
2.5<br />
0.5<br />
alkaline pore water neutral pore water<br />
0<br />
0 0.2 0.4 0.6 0.8 1<br />
O/C<br />
Different pore waters<br />
> 20 cm sediment depth (2007)<br />
C x H y O z<br />
References:<br />
common abundance<br />
2<br />
Lake 111<br />
pH 3<br />
1.5<br />
Waldsee<br />
pH 12<br />
1<br />
Moritzteich<br />
pH 6.5<br />
0.5<br />
Lake<br />
rank 1<br />
Goitsche<br />
pH 5.8<br />
0<br />
0 0.2 0.4 0.6 0.8 1<br />
O/C<br />
[1] Herzsprung, P. et al. (2010)<br />
Rapid. Commun. Mass Spectrom. 24,<br />
2909-2924<br />
Photochemical degradation of NOM compounds – itemisation<br />
by single elemental formula evaluation received from ultrahigh-resolution<br />
mass spectrometry<br />
1.5<br />
H/C<br />
1<br />
2.5<br />
0.5<br />
1. Samples from acidic<br />
pit lake pore-waters<br />
Artificial experiment<br />
Sediment<br />
Fe 3+ solution<br />
pore-water<br />
pH 2.3<br />
rich in DOC and Fe 2+<br />
contains no Fe 3+<br />
Sunlight<br />
Artificial solution<br />
2<br />
1.5<br />
H/C<br />
1<br />
Dark<br />
Br control<br />
C x H y O z<br />
0<br />
0 0.2 0.4 0.6 0.8ND<br />
1<br />
O/C<br />
PD<br />
Lake Moritzteich<br />
MinP<br />
pore water (20 – 30 cm)<br />
TD<br />
NewP<br />
2.5<br />
2<br />
0.5<br />
FTICR / MS<br />
Irradiated<br />
sample Q<br />
Comparison of educts and<br />
products formula by formula<br />
Q = Quartz glass<br />
Br = Brown glass<br />
Data mining<br />
C x H y O z S 1<br />
0<br />
0 0.2 0.4 0.6 0.8 1<br />
O/C<br />
Examination of<br />
degradation status<br />
Peter Herzsprung 1a , Wolf von Tümpling 1b , Norbert Hertkorn 2 , Mourad Harir 2 , Kurt Friese 1a , Philippe Schmitt-Kopplin 2<br />
1 UFZ Centre for Environmental <strong>Research</strong> Leipzig-Halle, Department a Lake <strong>Research</strong> / b River Ecology, Brückstr. 3a, 39114 Magdeburg, Germany<br />
2 HelmholtzZentrum München, German <strong>Research</strong> Center for Environment and Health, <strong>Institute</strong> of Ecological Chemistry, Ingolstädter Landstrasse 1, 85764 Neuherberg, Germany<br />
Contact: samples & ecology; elemental formula evaluation: peter.herzsprung@ufz.de, ICR-FT/MS: schmitt-kopplin@helmholtz-muenchen.de<br />
Introduction<br />
Analysis of DOM<br />
Sunlight-induced photooxidation is an important removal pathway for DOM. ESI-<br />
High-resolution spectra were acquired (in the negative ion<br />
FTICR/MS as an high end analytical method becomes more and more important<br />
mode) with a APEX Qe FTICR mass spectrometer (Bruker,<br />
to explain sunlight-induced degradation processes [1,2]. For the assessment of<br />
Bremen, Germany) equipped with a 12 TESLA superconducting<br />
magnet and an Apollo II microelectrospray<br />
photochemical changes in DOM a comparison of mass reactants and products,<br />
which were received from FTICR/MS data tables, can be done formula by<br />
source. FTICR mass spectral peaks with a signal-to-noise<br />
formula [1,3]. In a rather simplified experiment, two different types of samples<br />
ratio (S/N) > 2 were exported to peak lists. Feasable<br />
(1. from acidic pit lake pore waters; 2. from a drinking water reservoir tributary)<br />
elemental formulae (C≤100, O≤80, N≤5, S≤1) were computed<br />
were exposed to sunlight. The spectra of the reactants were derived from<br />
for each peak (after 13 C validation). The procedure for<br />
measured dark control (brown glass flask) and the spectra of the products were<br />
extraction of reliable formulae from the data set is<br />
derived from investigated solution in the quartz glass flasks.<br />
described by Herzsrung et al. [3].<br />
Degradation<br />
mass<br />
Sample Calculated<br />
(Da)<br />
ND<br />
ND<br />
NewP<br />
TD<br />
PD<br />
PD<br />
MinP<br />
MinP<br />
H/C ratio<br />
Br<br />
Q<br />
Q<br />
Br<br />
Br<br />
Q<br />
Br<br />
Q<br />
Mass<br />
intensity<br />
206.130680 3487448 18 13 2<br />
206.130680 2700959 18 13 2<br />
207.053159 12215212 9 10 4<br />
207.071785 347281 13 11 1<br />
208.019416 7829639 8 10 3<br />
208.019416 2483020 8 10 3<br />
208.037175 11848488 8 10 5<br />
208.037175 177581290 8 10 5<br />
H<br />
C<br />
O N S<br />
ND: 50% (Br) < Int. (Q) < 200% (Br)<br />
not significantly degraded<br />
PD: Int. (Q) < 50% (Br)<br />
partially degraded<br />
MinP: Int. (Q) > 200% (Br)<br />
minor new photoproduct<br />
TD: Not found in Q, found in Br<br />
totally degraded<br />
NewP: Found in Q, not found in Br<br />
newly formed photoproduct<br />
Allocation of<br />
geochemical pools in<br />
van Krevelen diagrams<br />
Simplified illustration<br />
lipids proteins carbohydrates<br />
lignins<br />
tannins<br />
black carbon<br />
0<br />
0 0.2 0.4 0.6 0.8 1.0<br />
O/C ratio<br />
References:<br />
[1] Gonsior, M. et al. (2009)<br />
Environ. Sci. Technol. 43,<br />
698-703<br />
[2] Kujawinski, E.B. et al. (2004)<br />
Mar. Chem. 92, 23-37<br />
[3] Herzsprung, P. et al. (2010)<br />
Rapid. Commun. Mass Spectrom. 24,<br />
2909-2924<br />
0 0<br />
0 0<br />
1 0<br />
1 1<br />
0 1<br />
0 1<br />
0 0<br />
0 0<br />
2.5<br />
2<br />
1.5<br />
H/C<br />
1<br />
0.5<br />
2. Sample from a drinking<br />
water reservoir tributary<br />
Dark<br />
Br control<br />
Sample<br />
FTICR / MS<br />
Irradiated<br />
sample Q<br />
Comparison of educts and<br />
products formula by formula<br />
C x H y O z<br />
Sunlight<br />
Q = Quartz glass<br />
Br = Brown glass<br />
Data mining<br />
0<br />
0 0.2 0.4 0.6 0.8 1<br />
O/C<br />
Conclusions<br />
Color coded van Krevelen diagrams<br />
differentiation of the photo degradation behaviour of NOM<br />
xxxis possible<br />
Drinking water reservoir tributary<br />
< 10% DOC mineralisation<br />
total degradation mainly of tannic acid like compounds<br />
C x H y O z S 1 not relevant compared to C x H y O z<br />
ND<br />
PD<br />
MinP<br />
TD<br />
NewP<br />
Pore waters from acidic mine pits (+ ferric iron)<br />
> 40% DOC mineralisation on average<br />
degradation of compounds from different geochemical<br />
xxxpools<br />
Higher degradation rate of C x H y O z S 1 compared to C x H y O z
2 0 0 0<br />
1 8 0 0<br />
1 6 0 0<br />
1 4 0 0<br />
1 2 0 0<br />
1 0 0 0<br />
8 0 0<br />
6 0 0<br />
4 0 0<br />
2 0 0<br />
0<br />
2 4 0<br />
2 5 0<br />
2 6 0<br />
2 7 0<br />
2 8 0<br />
2 9 0<br />
3 0 0<br />
3 1 0<br />
3 2 0<br />
3 3 0<br />
3 4 0<br />
3 5 0<br />
3 6 0<br />
Thank you for your attention<br />
2<br />
1.5<br />
1<br />
0.5<br />
0<br />
0 0.2 0.4 0.6 0.8 1<br />
Questions?
Discussion
Discussion<br />
Fluo-Imager M153<br />
Used in the<br />
laboratory<br />
Excitation: 240 – 360 nm<br />
Emission: 260 – 575 nm
Discussion<br />
Excitation (nm)<br />
360<br />
340<br />
320<br />
300<br />
280<br />
irradiated sample<br />
irradiated sample (mean)<br />
0<br />
200<br />
400<br />
600<br />
800<br />
Red Mulde<br />
Excitation (nm)<br />
360<br />
340<br />
320<br />
300<br />
280<br />
dark control<br />
0<br />
200<br />
400<br />
600<br />
800<br />
dark control (mean)<br />
260<br />
9.1 mg/l DOC 260<br />
9.7 mg/l DOC<br />
240<br />
300 350 400 450 500 550<br />
Emission (nm)<br />
dark control - irradiated sample<br />
240<br />
300 350 400 450 500 550<br />
Emission (nm)<br />
dark control - irradiated sample<br />
Excitation (nm)<br />
360<br />
340<br />
320<br />
300<br />
280<br />
0<br />
10<br />
20<br />
30<br />
40<br />
50<br />
Excitation (nm)<br />
360<br />
340<br />
320<br />
300<br />
280<br />
0<br />
50<br />
100<br />
150<br />
200<br />
260<br />
240<br />
300 350 400 450 500 550<br />
Emission (nm)<br />
relative<br />
difference [%]<br />
260<br />
240<br />
300 350 400 450 500 550<br />
Emission (nm)<br />
absolute<br />
difference
Discussion
Discussion<br />
MacDonald, B.C., Lvin, S.J., Patterson, H.: Correction of fluorescence<br />
inner filter effects and the partitioning of pyrene to<br />
dissolved organic carbon. Anal. Chim. Acta 338, 155-162 (1997).
Discussion<br />
Intensity<br />
(humic like fluorescence)<br />
Median values<br />
Excitation:<br />
320 – 345 nm<br />
Emission:<br />
410 – 440 nm<br />
700<br />
600<br />
500<br />
400<br />
300<br />
200<br />
100<br />
0<br />
Humic like fluorescence at different seasons<br />
SBA<br />
RMU8<br />
STE<br />
WMU<br />
WMU7<br />
RMU WMU8<br />
TSP<br />
RMU3<br />
RMU1<br />
SBA1<br />
RMU4<br />
WMU4<br />
0 2 4 6 8 10 12 14<br />
DOC mg/l<br />
RMU7<br />
WMU3<br />
1= January<br />
3= March<br />
4= April<br />
7= July<br />
8= August
Discussion<br />
0,6<br />
RMU7<br />
0,5<br />
WMU3<br />
0,4<br />
RMU3<br />
WMU7<br />
RMU8<br />
SBA<br />
UV254<br />
0,3<br />
STE3<br />
SBA3<br />
TSP3<br />
TSP4<br />
STE<br />
WMU<br />
RMU<br />
TSP<br />
0,2<br />
0,1<br />
SBA8<br />
SBA7<br />
WMU8<br />
TSP7<br />
STE7<br />
RMU4<br />
WMU4<br />
TSP8<br />
STE8<br />
Alle<br />
Linear (Alle)<br />
STE4<br />
SBA4<br />
0<br />
0 2 4 6 8 10 12 14<br />
DOC mg/l
Discussion<br />
700<br />
RMU7<br />
600<br />
RMU8<br />
fluorescence intensity<br />
500<br />
400<br />
300<br />
200<br />
STE4<br />
TSP8<br />
STE8<br />
RMU4<br />
WMU4<br />
SBA7<br />
WMU7<br />
TSP4<br />
TSP7<br />
TSP3<br />
WMU8<br />
STE7 STE3<br />
SBA3<br />
RMU3<br />
WMU3<br />
SBA<br />
STE<br />
WMU<br />
RMU<br />
TSP<br />
Alle<br />
Polynomisch (Alle)<br />
100<br />
SBA4<br />
SBA8<br />
0<br />
0 0,1 0,2 0,3 0,4 0,5 0,6<br />
UV 254nm
Discussion<br />
Evaluation of spectra by PARAFAC<br />
Used: 52 Spectra, 11 sampling sites in 2009<br />
PARAFAC = parallele faktor analysis<br />
• based on a 3D-Matrix<br />
X<br />
( Ix JxK)<br />
I<br />
J<br />
K<br />
with<br />
I … sample<br />
J … excitation wave lengths<br />
K … emission wave lengths<br />
• aim: minimisation of error square sum<br />
• algorithm: alternating least squares (ALS)<br />
result: PARAFAC-model with 5 fluorescent compounds
Discussion<br />
evaluation of spectra by PARAFAC<br />
result: PARAFAC-model with 5 fluorescent compounds<br />
Compound 3<br />
Compound 1<br />
Compound 2<br />
Compound 4 Compound 5
intensity<br />
25<br />
20<br />
15<br />
10<br />
5<br />
0<br />
sample 1 sample 2<br />
sample 3<br />
f 1 f 2 f 3 f 4 f 5<br />
rank value<br />
6<br />
5<br />
4<br />
3<br />
2<br />
1<br />
0<br />
f 1 f 2 f 3 f 4 f 5<br />
scaling by<br />
rank calculation<br />
rank value =<br />
= 1 + number of formulae - rank<br />
rank of<br />
formula 1<br />
formula 2<br />
formula 3<br />
formula 4<br />
formula 5<br />
rank<br />
6<br />
5<br />
4<br />
3<br />
2<br />
1<br />
0<br />
f 1 f 2 f 3 f 4 f 5<br />
Discussion
ank value<br />
10<br />
8<br />
6<br />
4<br />
2<br />
0<br />
sample 1 sample 2 sample 3 sample 4 sample 5<br />
f 1 f 2 f 3 f 4 f 5 f 6 f 7 f 8<br />
Discussion<br />
Rank calculation between<br />
samples considering the<br />
specific rank values for<br />
all formulae which are<br />
abundant in each sample<br />
sample rank compound<br />
1 4 m1=300<br />
2 1 m1=300<br />
3 5 m1=300<br />
4 3 m1=300<br />
5 2 m1=300<br />
rank<br />
6<br />
5<br />
4<br />
3<br />
2<br />
1<br />
0<br />
sample 1 sample 2 sample 3 sample 4 sample 5<br />
f 1 f 2 f 3 f 4 f 5 f 6 f 7 f 8
Discussion<br />
2<br />
Red Mulde / March<br />
2<br />
Red Mulde / April<br />
1.5<br />
1.5<br />
1<br />
1<br />
RMU 0309<br />
RMU 0409<br />
0.5<br />
Excitation (nm)<br />
360<br />
340<br />
320<br />
300<br />
280<br />
0<br />
200<br />
400<br />
600<br />
800<br />
0.5<br />
Excitation (nm)<br />
360<br />
340<br />
320<br />
300<br />
280<br />
0<br />
200<br />
400<br />
600<br />
800<br />
0<br />
2<br />
1.5<br />
1<br />
0.5<br />
300 350 400 450 500 550<br />
Emission (nm)<br />
0 0.2 0.4 0.6 0.8 1<br />
Excitation (nm)<br />
360<br />
340<br />
320<br />
300<br />
280<br />
260<br />
240<br />
0<br />
200<br />
400<br />
600<br />
800<br />
RMU 0709<br />
Red Mulde / July<br />
H/C<br />
2,5<br />
0<br />
0<br />
2<br />
Rank 1<br />
Rank 2<br />
1.5<br />
Rank 3<br />
Rank 4<br />
1<br />
0.5<br />
O/C<br />
0 1<br />
260<br />
240<br />
300 350 400 450 500 550<br />
Emission (nm)<br />
0 0.2 0.4 0.6 0.8 1<br />
Excitation (nm)<br />
360<br />
340<br />
320<br />
300<br />
280<br />
260<br />
0<br />
200<br />
400<br />
600<br />
800<br />
RMU 0809<br />
Red Mulde / August<br />
260<br />
0<br />
240<br />
300 350 400 450 500 550<br />
Emission (nm)<br />
0<br />
240<br />
300 350 400 450 500 550<br />
Emission (nm)<br />
0 0.2 0.4 0.6 0.8 1<br />
0 0.2 0.4 0.6 0.8 1
Discussion<br />
2<br />
Red Mulde / March<br />
2<br />
Red Mulde / April<br />
1,5<br />
1,5<br />
1<br />
1<br />
0,5<br />
0,5<br />
0<br />
2<br />
1,5<br />
H/C<br />
0 0,2 0,4 0,6 0,8 1<br />
Red Mulde / July<br />
0<br />
O/C<br />
2<br />
1,5<br />
0 0,2 0,4 0,6 0,8 1<br />
Red Mulde / August<br />
1<br />
1<br />
2,5<br />
0,5<br />
0,5<br />
tannins<br />
0<br />
0<br />
Rank 1<br />
Rank 2<br />
0Rank 3 0,2<br />
Rank 4<br />
0,4 0,6 0,8 1<br />
0 1<br />
0<br />
0 0,2 0,4 0,6 0,8 1
Discussion<br />
2<br />
Saubach / March<br />
2<br />
Saubach / April<br />
1.5<br />
1.5<br />
1<br />
SBA 0309<br />
1<br />
SBA 0409<br />
0.5<br />
Excitation (nm)<br />
360<br />
340<br />
320<br />
300<br />
280<br />
0<br />
200<br />
400<br />
600<br />
800<br />
0.5<br />
Excitation (nm)<br />
360<br />
340<br />
320<br />
300<br />
280<br />
0<br />
200<br />
400<br />
600<br />
800<br />
260<br />
260<br />
0<br />
240<br />
300 350 400 450 500 550<br />
Emission (nm)<br />
0<br />
240<br />
300 350 400 450 500 550<br />
Emission (nm)<br />
0 0.2 0.4 0.6 0.8 1<br />
0 0.2 0.4 0.6 0.8 1<br />
2<br />
Saubach / July<br />
2<br />
Saubach / August<br />
1.5<br />
1.5<br />
1<br />
SBA 0709<br />
1<br />
SBA 0809<br />
0.5<br />
Excitation (nm)<br />
360<br />
340<br />
320<br />
300<br />
280<br />
0<br />
200<br />
400<br />
600<br />
800<br />
0.5<br />
Excitation (nm)<br />
360<br />
340<br />
320<br />
300<br />
280<br />
0<br />
200<br />
400<br />
600<br />
800<br />
260<br />
260<br />
0<br />
240<br />
300 350 400 450 500 550<br />
Emission (nm)<br />
0<br />
240<br />
300 350 400 450 500 550<br />
Emission (nm)<br />
0 0.2 0.4 0.6 0.8 1<br />
0 0.2 0.4 0.6 0.8 1
Discussion<br />
2<br />
White Mulde / March<br />
2<br />
White Mulde / April<br />
1.5<br />
1.5<br />
1<br />
1<br />
WMU 0309<br />
WMU 0409<br />
0.5<br />
Excitation (nm)<br />
360<br />
340<br />
320<br />
300<br />
280<br />
0<br />
200<br />
400<br />
600<br />
800<br />
0.5<br />
Excitation (nm)<br />
360<br />
340<br />
320<br />
300<br />
280<br />
0<br />
200<br />
400<br />
600<br />
800<br />
260<br />
260<br />
0<br />
240<br />
300 350 400 450 500 550<br />
Emission (nm)<br />
0<br />
240<br />
300 350 400 450 500 550<br />
Emission (nm)<br />
0 0.2 0.4 0.6 0.8 1<br />
0 0.2 0.4 0.6 0.8 1<br />
2<br />
White Mulde / July<br />
2<br />
White Mulde / August<br />
1.5<br />
1.5<br />
1<br />
WMU 0709<br />
1<br />
WMU 0809<br />
0.5<br />
Excitation (nm)<br />
360<br />
340<br />
320<br />
300<br />
280<br />
0<br />
200<br />
400<br />
600<br />
800<br />
0.5<br />
Excitation (nm)<br />
360<br />
340<br />
320<br />
300<br />
280<br />
0<br />
200<br />
400<br />
600<br />
800<br />
260<br />
260<br />
0<br />
240<br />
300 350 400 450 500 550<br />
Emission (nm)<br />
0<br />
240<br />
300 350 400 450 500 550<br />
Emission (nm)<br />
0 0.2 0.4 0.6 0.8 1<br />
0 0.2 0.4 0.6 0.8 1
Discussion<br />
2<br />
Sauteich Effluent // March<br />
2<br />
Sauteich Effluent // April<br />
1.5<br />
1.5<br />
1<br />
0.5<br />
Excitation (nm)<br />
360<br />
340<br />
Excitation (nm)<br />
320<br />
300<br />
280<br />
360<br />
340<br />
320<br />
300<br />
280<br />
0<br />
200<br />
0<br />
400<br />
200<br />
600<br />
400<br />
800<br />
600<br />
800<br />
TSP 0309<br />
STE 0309<br />
1<br />
0.5<br />
Excitation (nm)<br />
360<br />
340<br />
320<br />
300<br />
280<br />
0<br />
200<br />
400<br />
600<br />
800<br />
TSP STE 0409<br />
260<br />
260<br />
260<br />
0<br />
240<br />
300 350 400 450 500 550<br />
240<br />
300 350 400 Emission 450(nm)<br />
500 550<br />
Emission (nm)<br />
0<br />
240<br />
300 350 400 450 500 550<br />
Emission (nm)<br />
0 0.2 0.4 0.6 0.8 1<br />
0 0.2 0.4 0.6 0.8 1<br />
2<br />
Sauteich Effluent // July<br />
2<br />
Sauteich Effluent // August<br />
1.5<br />
1.5<br />
1<br />
STE TSP 0709 0709<br />
1<br />
STE TSP 0809 0809<br />
0.5<br />
Excitation (nm)<br />
360<br />
340<br />
320<br />
Excitation (nm)<br />
300<br />
280<br />
360<br />
340<br />
320<br />
300<br />
280<br />
0 0<br />
200 200<br />
400 400<br />
600 600<br />
800 800<br />
0.5<br />
Excitation (nm)<br />
360<br />
340<br />
320<br />
Excitation (nm)<br />
300<br />
280<br />
360<br />
340<br />
320<br />
300<br />
280<br />
0 0<br />
200 200<br />
400 400<br />
600 600<br />
800 800<br />
260<br />
260<br />
260<br />
260<br />
0<br />
240 240<br />
300 300350 350400 400450 450500 500550<br />
550<br />
Emission Emission (nm) (nm)<br />
0<br />
240 240<br />
300 300350 350400 400450 450500 500550<br />
550<br />
Emission Emission (nm) (nm)<br />
0 0.2 0.4 0.6 0.8 1<br />
0 0.2 0.4 0.6 0.8 1
2<br />
Effluent / March<br />
2<br />
Effluent / April<br />
1.5<br />
1.5<br />
1<br />
1<br />
TSP 0309<br />
TSP 0409<br />
0.5<br />
Excitation (nm)<br />
360<br />
340<br />
320<br />
300<br />
280<br />
0<br />
200<br />
400<br />
600<br />
800<br />
0.5<br />
Excitation (nm)<br />
360<br />
340<br />
320<br />
300<br />
280<br />
0<br />
200<br />
400<br />
600<br />
800<br />
260<br />
260<br />
0<br />
240<br />
300 350 400 450 500 550<br />
Emission (nm)<br />
0<br />
240<br />
300 350 400 450 500 550<br />
Emission (nm)<br />
0 0.2 0.4 0.6 0.8 1<br />
0 0.2 0.4 0.6 0.8 1<br />
2<br />
Effluent / July<br />
2<br />
Effluent / August<br />
1.5<br />
1.5<br />
1<br />
0.5<br />
Excitation (nm)<br />
360<br />
340<br />
320<br />
300<br />
280<br />
0<br />
200<br />
400<br />
600<br />
800<br />
TSP 0709<br />
1<br />
0.5<br />
Excitation (nm)<br />
360<br />
340<br />
320<br />
300<br />
280<br />
0<br />
200<br />
400<br />
600<br />
800<br />
TSP 0809<br />
260<br />
260<br />
0<br />
240<br />
300 350 400 450 500 550<br />
Emission (nm)<br />
0<br />
240<br />
300 350 400 450 500 550<br />
Emission (nm)<br />
0 0.2 0.4 0.6 0.8 1<br />
0 0.2 0.4 0.6 0.8 1
2<br />
Discussion<br />
March<br />
Rank 1<br />
2<br />
April<br />
Rank 1<br />
1.5<br />
1.5<br />
H/C<br />
1<br />
H/C<br />
1<br />
Red Mulde<br />
Red Mulde<br />
Saubach<br />
Saubach<br />
0.5<br />
Sauteich<br />
0.5<br />
Sauteich<br />
Effluent<br />
Effluent<br />
White Mulde<br />
White Mulde<br />
0<br />
0 0.1 0.2 0.3 0.4 0.5 0.6 0.7 0.8 0.9 1<br />
0<br />
0 0.1 0.2 0.3 0.4 0.5 0.6 0.7 0.8 0.9 1<br />
O/C<br />
O/C<br />
2<br />
2<br />
July<br />
Rank 1<br />
August<br />
Rank 1<br />
1.5<br />
1.5<br />
H/C<br />
1<br />
H/C<br />
1<br />
Red Mulde<br />
Red Mulde<br />
Saubach<br />
Saubach<br />
0.5<br />
Sauteich<br />
0.5<br />
Sauteich<br />
Effluent<br />
Effluent<br />
White Mulde<br />
White Mulde<br />
0<br />
0 0.1 0.2 0.3 0.4 0.5 0.6 0.7 0.8 0.9 1<br />
O/C<br />
0<br />
0 0.1 0.2 0.3 0.4 0.5 0.6 0.7 0.8 0.9 1<br />
O/C
Discussion<br />
2<br />
Red Mulde / March<br />
2<br />
Red Mulde / April<br />
1.5<br />
1.5<br />
1<br />
1<br />
0.5<br />
0<br />
2<br />
1.5<br />
0 0.2 0.4 0.6 0.8<br />
0<br />
1<br />
Red Mulde / July<br />
2.5<br />
Rank 1<br />
0.5<br />
Rank 2<br />
Rank 3<br />
Rank 04<br />
Rank 5<br />
0 1<br />
2<br />
1.5<br />
0 0.2 0.4 0.6 0.8 1<br />
Red Mulde / August<br />
1<br />
1<br />
0.5<br />
0.5<br />
0<br />
0<br />
0 0.2 0.4 0.6 0.8 1<br />
0 0.2 0.4 0.6 0.8 1
Discussion<br />
2,5<br />
Tannic acids<br />
compositions Tanninverbindungen reported in<br />
the aus literature der Literatur<br />
2<br />
CHO<br />
1,5<br />
H/C<br />
1<br />
0,5<br />
no<br />
Tannin 1<br />
Tannin 2<br />
Tannin 3<br />
Tannin 4<br />
0<br />
0 0,1 0,2 0,3 0,4 0,5 0,6 0,7 0,8 0,9 1<br />
O/C
Discussion<br />
Gallotannins (hydrolyzable)
Discussion<br />
Proanthocyanidins (condensed tannins) polymeric flavanoids
Discussion<br />
Pivot chart<br />
rank RMU<br />
Sample 1 2 3 4 total<br />
RMU3 207 97 97 237 638<br />
RMU4 96 191 228 123 638<br />
RMU7 138 199 195 106 638<br />
RMU8 217 144 115 162 638<br />
total 658 631 635 628 2552
Discussion<br />
0.4<br />
0.3<br />
AImod = (1 + C - 0.5·O - S - 0.5·H) / (C - 0.5·O - S - N)<br />
CHO<br />
SRFA<br />
TSP3<br />
TSP4<br />
TSP7<br />
TSP8<br />
number / total number<br />
0.2<br />
0.1<br />
0<br />
0 0.1 0.2 0.3 0.4 0.5 0.6 0.7 0.8 0.9<br />
AImod<br />
1000<br />
800<br />
AImod = (1 + C - 0.5·O - S - 0.5·H) / (C - 0.5·O - S - N)<br />
CHO<br />
SRFA<br />
TSP3<br />
TSP4<br />
TSP7<br />
TSP8<br />
total number<br />
600<br />
400<br />
200<br />
0<br />
0 0.1 0.2 0.3 0.4 0.5 0.6 0.7 0.8 0.9<br />
AImod
0.4<br />
Discussion<br />
AImod = (1 + C - 0.5·O - S - 0.5·H) / (C - 0.5·O - S - N)<br />
0.35<br />
0.3<br />
CHO<br />
RMU3<br />
WMU3<br />
SBA3<br />
STE3<br />
TSP3<br />
0.4<br />
0.35<br />
0.3<br />
AImod = (1 + C - 0.5·O - S - 0.5·H) / (C - 0.5·O - S - N)<br />
CHO<br />
RMU4<br />
WMU4<br />
SBA4<br />
STE4<br />
TSP4<br />
number / total number<br />
0.25<br />
0.2<br />
0.15<br />
number / total number<br />
0.25<br />
0.2<br />
0.15<br />
0.1<br />
0.1<br />
0.05<br />
0.05<br />
0<br />
0 0.1 0.2 0.3 0.4 0.5 0.6 0.7 0.8 0.9<br />
0<br />
0 0.1 0.2 0.3 0.4 0.5 0.6 0.7 0.8 0.9<br />
AImod<br />
AImod<br />
0.4<br />
0.35<br />
0.3<br />
AImod = (1 + C - 0.5·O - S - 0.5·H) / (C - 0.5·O - S - N)<br />
CHO<br />
RMU7<br />
WMU7<br />
SBA7<br />
STE7<br />
TSP7<br />
0.4<br />
0.35<br />
0.3<br />
AImod = (1 + C - 0.5·O - S - 0.5·H) / (C - 0.5·O - S - N)<br />
CHO<br />
RMU8<br />
WMU8<br />
SBA8<br />
STE8<br />
TSP8<br />
number / total number<br />
0.25<br />
0.2<br />
0.15<br />
number / total number<br />
0.25<br />
0.2<br />
0.15<br />
0.1<br />
0.1<br />
0.05<br />
0.05<br />
0<br />
0 0.1 0.2 0.3 0.4 0.5 0.6 0.7 0.8 0.9<br />
0<br />
0 0.1 0.2 0.3 0.4 0.5 0.6 0.7 0.8 0.9<br />
AImod<br />
AImod
2<br />
Discussion<br />
Rank 5<br />
CHO<br />
SRFA C < 21<br />
2<br />
Rank 5<br />
CHO<br />
SRFA C > 20<br />
1.5<br />
Rank 4<br />
1.5<br />
Rank 4<br />
Rank 3<br />
Rank 3<br />
Rank 2<br />
Rank 2<br />
H/C<br />
1<br />
Rank 1<br />
H/C<br />
1<br />
Rank 1<br />
H/C<br />
0.5<br />
Data from<br />
Koch, B.P. et al. (2007)<br />
0<br />
Anal. Chem. 79, 1758<br />
2<br />
1.5<br />
1<br />
0 0.2 0.4 0.6 0.8 1<br />
O/C<br />
Rank 5<br />
Rank 4<br />
Rank 3<br />
Rank 2<br />
Rank 1<br />
CHO<br />
RMU7 C < 21<br />
H/C<br />
0.5<br />
Suwannee River Fulvic Acid<br />
0<br />
2<br />
1.5<br />
1<br />
0 0.2 0.4 0.6 0.8 1<br />
Rank 5<br />
Rank 4<br />
Rank 3<br />
Rank 2<br />
Rank 1<br />
O/C<br />
CHO<br />
RMU7 C > 20<br />
0.5<br />
0<br />
0<br />
0 0.2 0.4 0.6 0.8 1<br />
0 0.2 0.4 0.6 0.8 1<br />
O/C<br />
O/C<br />
0.5<br />
Red Mulde / July
2.5<br />
2<br />
H/C<br />
1.5<br />
1<br />
0.5<br />
0<br />
CHON1 CHOS1 CHON2-6<br />
0 0.2 0.4 0.6 0.8 1<br />
O/C