Chapter 7 - Virginia Tech
Chapter 7 - Virginia Tech
Chapter 7 - Virginia Tech

Create successful ePaper yourself
Turn your PDF publications into a flip-book with our unique Google optimized e-Paper software.
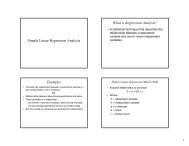
Sampling Distribution Basics<br />
Sampling and Sampling<br />
Distributions<br />
• Sample statistics (the mean and standard<br />
deviation are examples) vary from sample to<br />
sample.<br />
• Sample statistics are computed from random<br />
variables from a population and, as such are<br />
random variables themselves.<br />
• A sampling distribution is simply a probability<br />
distribution of a sample statistic.<br />
Sampling Distributions<br />
• Generally we do not know the mean or variance<br />
of a random variable; and<br />
• Often the purpose of sampling is to estimate<br />
parameters (mean, variance, etc.) of a<br />
population. We use samples because:<br />
– The population is too large for a census;<br />
– It is too expensive to conduct a census; and/or<br />
– The units must be destroyed in order to test the<br />
variable(s) of interest, i.e. destructive testing.<br />
Definitions<br />
•A parameter is a numerical descriptive<br />
measure of a population. It is calculated<br />
from the observations in the population.<br />
•A sample statistic is a numerical<br />
descriptive measure of a sample. It is<br />
calculated from the observations in the<br />
sample.<br />
1
Sample Statistics<br />
• Sample mean (used to estimate the population<br />
mean - a parameter);<br />
• Sample median;<br />
• Sample variance (used to estimate the<br />
population variance - another parameter);<br />
• Sample standard deviation (derived from the<br />
sample variance and used to estimate the<br />
population variance - another parameter).<br />
Example<br />
• We want to estimate the population mean:<br />
– Two possible sample statistics<br />
• Sample mean - x<br />
• Sample median - m<br />
– Which one should be used? For example, toss a die<br />
three times and let x be the number of dots showing<br />
on the up face. Suppose we have 2, 2, and 6 come<br />
up:<br />
• Expected value (of the population) is: μ = 35 .<br />
• Mean of x is: x =10 /3=<br />
3.33<br />
• While median is: m = 2<br />
• Which is closer to the true mean (expected value)?<br />
Example, cont.<br />
– What if we had sample measurements of 3, 4,<br />
and 6?<br />
• Expected value (of the population) is still:<br />
μ = 35 .<br />
• Mean of x is: x =13 /3=<br />
4.33 While median is: m = 4<br />
• Now which is closer to the true mean (expected<br />
value)?<br />
Sampling Statistics<br />
• Since sampling statistics are random<br />
variables, they must be compared on the<br />
basis of their probability distributions - the<br />
collection of values and associated<br />
probabilities of each statistic that would<br />
be obtained if the sampling experiment<br />
were repeated a very large number of<br />
times.<br />
2
Definitions<br />
• The sampling distribution for a sample<br />
statistic (calculated from a sample of n<br />
measurements) is the probability<br />
distribution for the statistic; or<br />
• The sampling distribution is a function that<br />
gives the probability of every possible<br />
value of a sample statistic for specified<br />
population and sample size.<br />
More Definitions<br />
• A point estimator of a population parameter is a<br />
rule or formula that tells us how to use the<br />
sample data to create a single number that can<br />
be used as an estimate of the population<br />
parameter.<br />
• If a sample statistic has a sampling distribution<br />
with a mean equal to the population parameter<br />
the statistic is intended to estimate, the statistic<br />
is said to be an unbiased estimator of the<br />
parameter.<br />
And More Definitions<br />
• If the mean of the sampling distribution is not<br />
equal to the parameter, the statistic is said to be<br />
a biased estimator of the parameter.<br />
Sampling Distribution of the<br />
Sample Mean<br />
• Often we are interested in making an<br />
inference about the mean of some<br />
population, μ . The sample mean is a<br />
good choice as the estimator for μ .<br />
3
The Mean and Standard Deviation of<br />
Sampling Distribution of x<br />
• Regardless of the shape of the population relative<br />
frequency distribution:<br />
– The mean of the sampling distribution of x will equal<br />
μ , the mean of the sampled population.<br />
– The standard deviation of the sampling distribution of x<br />
will equal σ , the standard deviation of the sampled<br />
population divided by the square root of the sample<br />
size n:<br />
σ<br />
σ =<br />
x<br />
n<br />
(often referred to as the standard error of the mean)<br />
Example<br />
• Let x be a normally distributed random<br />
variable with a mean of 89 and a standard<br />
deviation of 12:<br />
– What is the probability that the mean of a<br />
sample of size n=19 will be between 85 and<br />
93?<br />
– What is the probability that the mean of a<br />
sample of size n=40 will exceed 91?<br />
Answer to First Part<br />
Answer to Second Part<br />
σ<br />
σ<br />
x<br />
=<br />
n<br />
12<br />
So,<br />
σ<br />
x<br />
= = 2.753<br />
19<br />
x − μ<br />
z =<br />
σ<br />
x<br />
85 − 89<br />
So,<br />
z = = −1.45<br />
2.753<br />
93 − 89<br />
And,<br />
z = = 1.45<br />
2.753<br />
p(<br />
−1.45<br />
≤ z ≤ 1.45) = 0.4265 + 0.4265 = 0.8530<br />
n = 29, p(<br />
−1.8<br />
≤ z ≤ 1.8) = 0.9266<br />
σ<br />
σ<br />
x<br />
=<br />
n<br />
So,<br />
σ =<br />
x<br />
12<br />
40<br />
= 1.897<br />
91−<br />
89<br />
z = = 1.05<br />
1.897<br />
p(<br />
z ≥ 1.05) = 0.500 − 0.3531 = 0.1469<br />
4
Example<br />
• The population of orders for printing jobs at a<br />
print shop is approximately normal with a mean<br />
of 200 pages and a standard deviation of 40<br />
pages. The shop is almost out of paper and it<br />
has five orders that must be finished before a<br />
shipment of paper can be expected. If the shop<br />
has 1,200 sheets of paper left, what is the<br />
probability that the five orders will not exhaust<br />
the stock of paper?<br />
• Hint: Find P( x ≤ 240)<br />
Answer<br />
σ<br />
σ<br />
x<br />
=<br />
n<br />
40<br />
So,<br />
σ<br />
x<br />
= = 17.889<br />
5<br />
240−<br />
200<br />
z = = 2.236<br />
17.889<br />
p(<br />
z ≤ 2.236) = 0.500+<br />
0.4875=<br />
0.9875<br />
Example<br />
• Let x be a random variable with a mean of 1,200<br />
and a standard deviation of 20:<br />
– What is the probability that the mean of a sample of<br />
size 80 will exceed 1,202?<br />
– What is the probability that the mean of a sample of<br />
size 50 will be less than 1,202?<br />
– If the probability that the mean of a sample of size n<br />
will exceed 1,201 is 0.25, what must n equal?<br />
• Part 1 - 0.1867<br />
• Part 2 - 0.7611<br />
• Part 3 - 180<br />
Answers<br />
5
Central Limit Theorem<br />
• If a random sample of n observations is<br />
selected from a population, when n is<br />
sufficiently large, the sampling distribution<br />
of x will be approximately a normal<br />
distribution. Typically, a sample size of n ≥ 30<br />
is considered large enough. The larger the<br />
sample size n, the better the normal<br />
approximation.<br />
Sampling Distribution of the<br />
Proportion<br />
• We are often interested in making an inference<br />
about the proportion of some population, p.<br />
• Examples:<br />
– Proportion of freshman that graduate from <strong>Virginia</strong><br />
<strong>Tech</strong> in four years.<br />
– Proportion of defective items in a lot.<br />
– Proportion of a set of loans that will become<br />
nonperforming.<br />
The Sample Proportion and Standard<br />
Deviation of the Number of Successes<br />
• The sample proportion p is the value of the<br />
random variable x divided by the sample<br />
size. X<br />
p =<br />
n<br />
• The standard deviation of the sampling<br />
distribution is:<br />
σ =<br />
p ( 1 − p)<br />
n<br />
Normal Approximation to the Sampling<br />
Distribution of the Proportion<br />
• Rules:<br />
np ≥ 5<br />
n ( 1 − p ) ≥<br />
• Z-value for sampling distribution for p:<br />
Z<br />
=<br />
p<br />
−<br />
σ<br />
p<br />
5<br />
p<br />
6
Example<br />
Answers<br />
• If a sample of size 100 is taken from a<br />
population of size 1000 and the population<br />
contains 300 successes:<br />
– What is the probability that the sample<br />
proportion of successes will be 0.35 or more?<br />
– What is the probability that the sample<br />
proportion of successes will be between 0.25<br />
and 0.45?<br />
• Part a:<br />
p (1 − p ) 0 .3 (1 − 0 .3 )<br />
σ =<br />
=<br />
= 0 .0458<br />
n<br />
100<br />
0 .35 − 0 .30<br />
z =<br />
= 1 .09<br />
0 .0458<br />
p ( p > 0 .35 ) = p ( z > 1 .09 ) = 0 .5 − 0 .3621<br />
• Part b:<br />
=<br />
0 .1379<br />
p( 0.25 < p < 0.45 ) = p(<br />
−1.09<br />
< z < 3.28 ) = 0.3621 + 0.5 = 0.8621<br />
Example<br />
• An advertising campaign for a new perfume has<br />
a goal of reach 50% of the women in the target<br />
group. Suppose a national sample of 300<br />
women from the target group is drawn to see<br />
how the campaign in working. 129 women in<br />
the group can recall seeing an ad or commercial<br />
for the new perfume. If the population<br />
proportion was 0.50, what is the probability of<br />
observing a sample proportion of 0.40 or less in<br />
a sample of 300?<br />
Answer<br />
p(1<br />
− p)<br />
0.5(1 − 0.5)<br />
σ = =<br />
= 0.0289<br />
n 300<br />
p − p 0.43 − 0.5<br />
Z = = = −2.42<br />
0.0289<br />
σ p<br />
p(<br />
p < 0.40) = p(<br />
z < −2.42)<br />
= 0.5 − 0.4922 = 0.0078<br />
7