NON-ADDICTIVE SAMPLE BASED FACTS - Deetc
NON-ADDICTIVE SAMPLE BASED FACTS - Deetc
NON-ADDICTIVE SAMPLE BASED FACTS - Deetc

Create successful ePaper yourself
Turn your PDF publications into a flip-book with our unique Google optimized e-Paper software.
• Semi-additive, can be summed up only for a subset<br />
of the dimensions;<br />
• Non-additive, cannot be summed for any of the<br />
dimensions.<br />
Non-additive does not directly relates with the measure<br />
being numerical; it relates with the usefulness<br />
(and accuracy) of the summed value. It may simply<br />
not make sense to the business. Ratios are an example<br />
of a non-addictive fact.<br />
The audience analysis domain shared with OLAP and<br />
Datawarehouse, all of the characteristics listed above.<br />
The volume of data are too similar in size. However,<br />
audience analysis world tends to be closed and proprietary<br />
oriented, and it’s applications do not apply,<br />
directly, generic OLAP techniques. Programs like<br />
[10] and [13] use pivot tables like interfaces, typical<br />
in OLAP, but do not use more of the OLAP reporting<br />
facilities. The former, [13], is developed by one of the<br />
leading software houses in audience analysis; it uses<br />
a proprietary text file format to store information, not<br />
an OLAP engine. In this paper, the authors evaluate<br />
the feasibility of general OLAP techniques applied to<br />
audience analysis domain. The purpose is to determine<br />
if it’s possible to use general, non proprietary<br />
solutions to achieve the same degree of freedom in<br />
audience analysis, as the referred tools. Particularly,<br />
we discuss a dimension model that addresses the singularity<br />
of the audience analysis performance indicators,<br />
almost all of them quota sample based and nonaddictive.<br />
Some of the necessary values to compute<br />
these indicators, mainly related to representativeness,<br />
are only known at runtime, after the users finished the<br />
analysis’ restrictions.<br />
One couldn’t find any related work, regarding<br />
dimension model and sample quota based facts. The<br />
main datawarehouse and olap literature [6, 9] do not<br />
address this kind of facts. And being a relative closed<br />
world, audience analysis are not an ease domain to<br />
build a state of the art [14]. The few articles publicly<br />
available are related to datamining and audience<br />
patterns analysis and not to datawarehouse and olap<br />
techniques appliance.<br />
This paper is organised as follows: section 2 describes<br />
the data, the requirements and some performance<br />
indicators used in audience analysis; section 3<br />
present the dimensional model, using Kimball’s approach,<br />
for a generic TV content analysis datamart;<br />
finally, in section 4 the authors draw some conclusions<br />
of their work.<br />
2 PROBLEM DOMAIN<br />
2.1 The Data<br />
The meter system seldom produces the data for the<br />
entire viewers’ panel viewers, since several practical<br />
problems may occur which range from meter misuse,<br />
to data communication problems, which endanger<br />
the desired panel representativeness. In order to<br />
adjust the panel representativeness, a weighting procedure<br />
is used which attempts to correct undesirable<br />
non-representative data tendencies. This is the Rim<br />
Weighting algorithm [4] (also known as Iterative Proportional<br />
Fitting [1]), which provides a daily weight<br />
for each viewer trying to recover the panel sample<br />
representativeness.<br />
People meter data have three distinct components:<br />
(i) socio-demographic information; (ii) TV content<br />
data; (iii) visualisation data. The socio-demographic,<br />
which include characteristics such as age, occupation<br />
and social class, provide important information to determine<br />
the panel representativity, but may also be<br />
used for other purposes (mostly for advertisement).<br />
The TV content is characterized by their type of contents,<br />
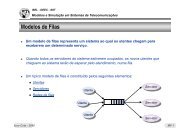
duration and corresponding TV channels. Finally,<br />
meter data measures the viewing behavior of<br />
each one of the viewers, represented by a sequence of<br />
watch/non watch indicators referred to each second of<br />
the day, as illustrated by figure 1. These indicators are<br />
registered independently for each channel.<br />
Figure 1: Representation of a daily viewing pattern for an<br />
individual.<br />
2.2 Requirements<br />
The requirements were gathered through the analysis<br />
of several audience reports, and for on site<br />
day by day usage of the audience analysis program<br />
Telereport[13]. The reports are sufficient broad to embrace<br />
a series of heterogeneous users, ranging from<br />
television to advertising. They cover the most important<br />
aspects of general TV content performance analysis.<br />
However, they do not address the singularities<br />
of advertising spots. The audience analyst are interested,<br />
mainly, to determine the audiences by channel