2008 - City of Lakeland
2008 - City of Lakeland
2008 - City of Lakeland

Create successful ePaper yourself
Turn your PDF publications into a flip-book with our unique Google optimized e-Paper software.
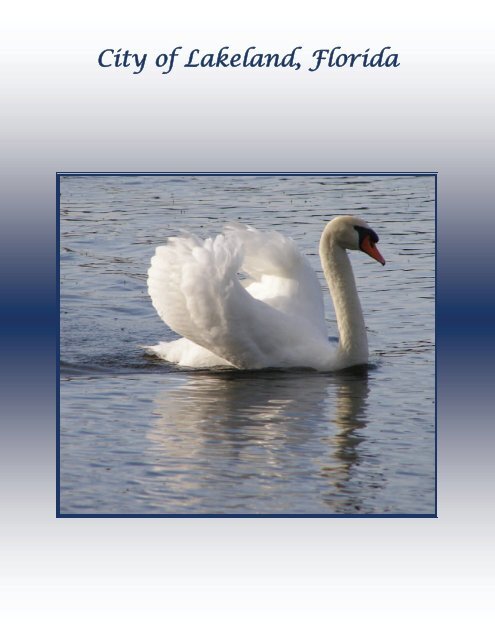
<strong>City</strong> <strong>of</strong> <strong>Lakeland</strong>, Florida
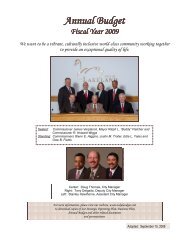
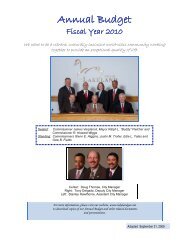
Annual Budget<br />
Fiscal Year <strong>2008</strong><br />
We want to be a vibrant, culturally inclusive world-class community<br />
working together to provide an exceptional quality <strong>of</strong> life.<br />
Seated: Commissioner James S. Verplanck, Mayor Ralph L. “Buddy” Fletcher<br />
and Commissioner R. Howard Wiggs<br />
Standing: Commissioners Glenn E. Higgins, Gow B. Fields, Edie L. Yates and<br />
A. Dean Boring<br />
Center: Doug Thomas, <strong>City</strong> Manager<br />
Right: Tony Delgado, Deputy <strong>City</strong> Manager<br />
Left: Stanley Hawthorne, Assistant <strong>City</strong> Manager<br />
For more information, please visit our website, www.lakelandgov.net<br />
to download copies <strong>of</strong> our Strategic Operating Plan, Business Plan,<br />
Annual Budget and other related documents<br />
and presentations.<br />
Adopted: September 17, 2007
How to Use This Book<br />
We’ve made every effort to make this book as<br />
easy as possible to read, but we understand<br />
just how difficult it can be to find what you’re<br />
looking for in such a complex document. To<br />
make your search easier, we’ve provided a<br />
number <strong>of</strong> tools to help you get what you need.<br />
Organization <strong>of</strong> This Book<br />
The <strong>City</strong> <strong>of</strong> <strong>Lakeland</strong>’s Annual Budget is made<br />
up <strong>of</strong> two separate books: The Annual Budget<br />
(this book) and the Business Plan.<br />
This Annual Budget volume is divided into<br />
seven sections:<br />
Introduction - This section contains the <strong>City</strong><br />
Manager’s Letter <strong>of</strong> Transmittal, Organization<br />
Chart, the <strong>City</strong>’s Vision, Mission and Values, a<br />
few brief statistics about the <strong>City</strong> and its<br />
history. A useful list <strong>of</strong> abbreviations and<br />
acronyms used in the book is also included in<br />
this section, along with a Glossary <strong>of</strong> the<br />
terminology used in this document that is either<br />
technical in nature or unique to the <strong>City</strong> <strong>of</strong><br />
<strong>Lakeland</strong>. Each term is given a short entry that<br />
defines it within the context that we use the<br />
term.<br />
Budget Overview - A discussion <strong>of</strong> the Budget<br />
Highlights for Fiscal Year <strong>2008</strong>, financial<br />
policies, the Truth in Millage notice and the<br />
Budget Process Overview.<br />
Long-Range Planning - The analysis and data<br />
that went into the development <strong>of</strong> the budget,<br />
specifically our planning and forecasting<br />
activities.<br />
Performance Budget - Data from the Business<br />
Plan and performance-based budgets for all <strong>of</strong><br />
the major departments.<br />
Line Item Budgeting - Detailed Fund<br />
Accounting and staffing information.<br />
Capital Improvement Plan (CIP) - This section<br />
provides the <strong>City</strong>’s 10-year CIP and projected<br />
funds.<br />
Supplementary - Miscellaneous information<br />
regarding largest taxpayers, property tax rates,<br />
revenues and <strong>City</strong> Departments Table <strong>of</strong><br />
Organization.<br />
Table <strong>of</strong> Contents<br />
The main Table <strong>of</strong> Contents starts on page two<br />
and provides an overview <strong>of</strong> the different<br />
sections <strong>of</strong> the book. Each section <strong>of</strong> the<br />
document also has a Table <strong>of</strong> Contents for<br />
easy page referencing.<br />
Key Tools<br />
Callout Text<br />
Interesting facts<br />
have been included<br />
in callout boxes<br />
located throughout<br />
the document.<br />
Organization Chart A-12<br />
Vision, Mission & Values A-14<br />
Budget Summary (Charts/Graphs) B-6<br />
Truth In Millage B-12<br />
Staffing Changes B-14<br />
Core Values C-3<br />
Outcomes C-4<br />
Financial Health & Strategy C-9<br />
Performance/Program Budget<br />
D<br />
FY 2007 KSI Summary D-5<br />
Measurement Process Map D-6<br />
Process Improvement Teams D-33<br />
Department Performance Levels D-34<br />
Line Item Budget<br />
E<br />
Capital Improvement Plan<br />
F<br />
Department Organization Charts G-9<br />
A-1 Fiscal Year <strong>2008</strong> Annual Budget
Table <strong>of</strong> Contents<br />
Introduction ...................................................................................................................Section—A<br />
How to Use This Book.................................................................................................. A-1<br />
<strong>City</strong> Manager’s Letter ................................................................................................... A-4<br />
<strong>City</strong> Organization Chart ............................................................................................. A-12<br />
Vision, Mission and Values........................................................................................ A-14<br />
<strong>Lakeland</strong> at a Glance .................................................................................................. A-16<br />
Service Statistics ........................................................................................................ A-17<br />
History <strong>of</strong> <strong>Lakeland</strong>..................................................................................................... A-18<br />
Glossary <strong>of</strong> Terms ...................................................................................................... A-22<br />
Abbreviations & Acronyms........................................................................................ A-26<br />
Budget Overview...........................................................................................................Section—B<br />
Budget Highlights ......................................................................................................... B-2<br />
Budget Summary (Graphs/Charts).............................................................................. B-6<br />
Truth in Millage (TRIM) Notification .......................................................................... B-12<br />
Ad Valorem Taxes....................................................................................................... B-13<br />
Staffing Changes ........................................................................................................ B-14<br />
Employee/Population Growth.................................................................................... B-15<br />
Overview and Financial Policies ............................................................................... B-16<br />
Budget Process Overview.......................................................................................... B-20<br />
Long-Range Planning...................................................................................................Section—C<br />
Introduction & Mission Statement .............................................................................. C-2<br />
Core Values ................................................................................................................... C-3<br />
Outcomes....................................................................................................................... C-4<br />
Environmental Scan ..................................................................................................... C-6<br />
Financial Health & Strategy ......................................................................................... C-9<br />
Revenue Sources........................................................................................................ C-16<br />
Debt Management Overview...................................................................................... C-21<br />
Performance Budget.....................................................................................................Section—D<br />
Performance Budget Overview ................................................................................... D-2<br />
Sample Performance Budget Page ............................................................................. D-3<br />
Measuring Results ........................................................................................................ D-4<br />
Key Success Indicators (KSI’s) ................................................................................... D-5<br />
Strategic Planning & Performance Measurement Process Map.............................. D-6<br />
Service & Operations Strategy .................................................................................... D-7<br />
Fiscal Year 2007 3rd Quarter Status <strong>of</strong> Actions ........................................................ D-8<br />
Fiscal Year <strong>2008</strong> New Actions Summary.................................................................. D-22<br />
Outcome Pages........................................................................................................... D-24<br />
Process Improvement Teams.................................................................................... D-33<br />
Department Performance Levels............................................................................... D-34<br />
Program Performance Levels<br />
Economic and Community Development.................................................... D-47<br />
Community Safety ......................................................................................... D-79<br />
Transportation Services.............................................................................. D-105<br />
Legislative Activities ................................................................................... D-125<br />
Environmental & Utility Services ............................................................... D-135<br />
Cultural & Community Services ................................................................. D-161<br />
Parks, Recreation and Properties .............................................................. D-175<br />
Internal Services .......................................................................................... D-189<br />
A-2 Fiscal Year <strong>2008</strong> Annual Budget
Table <strong>of</strong> Contents<br />
Line Item Budget ...........................................................................................................Section—E<br />
General Fund ................................................................................................................. E-7<br />
Community Development ........................................................................................... E-87<br />
Debt Service................................................................................................................. E-95<br />
Fleet Management ....................................................................................................... E-97<br />
Purchasing & Stores ................................................................................................. E-103<br />
Facilities Maintenance .............................................................................................. E-109<br />
Information Technology............................................................................................ E-115<br />
Wastewater Utility...................................................................................................... E-131<br />
Water Utility................................................................................................................ E-147<br />
Parking ....................................................................................................................... E-163<br />
<strong>Lakeland</strong> Center......................................................................................................... E-171<br />
Cleveland Heights Golf Course................................................................................ E-183<br />
<strong>Lakeland</strong> Linder Regional Airport............................................................................ E-191<br />
Solid Waste ................................................................................................................ E-203<br />
Stormwater................................................................................................................. E-211<br />
Electric Utility............................................................................................................. E-215<br />
Capital Improvement Plan ............................................................................................Section—F<br />
Introduction....................................................................................................................F-2<br />
Transportation ............................................................................................................... F-4<br />
Public Improvement .................................................................................................... F-10<br />
Downtown Community Redevelopment Area .......................................................... F-20<br />
Mid-Town Community Redevelopment Area............................................................ F-21<br />
Dixieland Community Redevelopment Area............................................................. F-23<br />
Parking ......................................................................................................................... F-24<br />
<strong>Lakeland</strong> Center........................................................................................................... F-25<br />
<strong>Lakeland</strong> Linder Regional Airport.............................................................................. F-26<br />
Solid Waste .................................................................................................................. F-29<br />
Stormwater................................................................................................................... F-30<br />
Oakhill Cemetery Fund ............................................................................................... F-33<br />
Wastewater Utility........................................................................................................ F-34<br />
Water Utility.................................................................................................................. F-41<br />
Electric Utility............................................................................................................... F-48<br />
Supplementary Information......................................................................................... Section—G<br />
Largest Taxpayers.........................................................................................................G-2<br />
Schedule <strong>of</strong> Property Tax Rates ..................................................................................G-3<br />
General Fund Property Tax Levies and Collections ..................................................G-4<br />
Governmental Activities Tax Revenues by Source ...................................................G-6<br />
Changes in Fund Balances <strong>of</strong> Governmental Funds.................................................G-7<br />
Department Tables <strong>of</strong> Organization.............................................................................G-9<br />
A-3 Fiscal Year <strong>2008</strong> Annual Budget
September 4, 2007<br />
Honorable Mayor and <strong>City</strong> Commissioners:<br />
Submitted herewith for your consideration are the <strong>City</strong> <strong>of</strong> <strong>Lakeland</strong> Proposed Fiscal<br />
Year <strong>2008</strong> Annual <strong>City</strong> Budget and the <strong>2008</strong>-2017 Capital Improvement Program<br />
Budgets. These documents represent the fourth financial and operational plans that<br />
I have prepared since my appointment as <strong>City</strong> Manager in December, 2003.<br />
A New Look<br />
As Commissioners and the reviewers <strong>of</strong> this document will quickly see, the FY <strong>2008</strong><br />
Annual Budget Book looks considerably different than in previous years as we<br />
continue the evolution <strong>of</strong> the historical line item and departmental budgets to the<br />
Program Budget, which has now been fully integrated with the <strong>City</strong>’s Strategic<br />
Operating Planning (SOP) initiative through the inclusion <strong>of</strong> the <strong>City</strong>’s Business<br />
Plan. Collectively, the Business Plan provides information regarding the operating<br />
environment in addition to a “roadmap” <strong>of</strong> how the organization monitors and reports<br />
on our progress with <strong>Lakeland</strong>’s Vision, Mission and Strategic Goals in the areas <strong>of</strong><br />
Economic Opportunity, Information Management, Revenue Enhancement, Growth<br />
Management and Quality <strong>of</strong> Life. Throughout the current year, <strong>City</strong> staff made<br />
noteworthy progress in the advancement <strong>of</strong> the SOP through the development <strong>of</strong><br />
specified Outcomes, Strategies, Actions, Key Success Indicators (KSI’s) and lastly,<br />
the rollout <strong>of</strong> Core Organizational Values, all <strong>of</strong> which are highlighted and elaborated<br />
in greater detail in the Budget Overview and Long Range Planning portions <strong>of</strong> this<br />
document.<br />
Furthermore, the Performance Management<br />
portion <strong>of</strong> the Budget has also been<br />
revamped in FY <strong>2008</strong> with expanded<br />
Program Narratives to provide the reader<br />
with a wealth <strong>of</strong> information regarding the<br />
Mission, Core Services, Table <strong>of</strong><br />
Organization, Operational and/or Public<br />
Service Levels, Performance Measurements<br />
(KSI’s) and new initiatives for each<br />
<strong>of</strong> the 52 reported Program Activities.<br />
Please keep in mind that FY <strong>2008</strong><br />
represents the inaugural year in which we<br />
will capture important baseline data for<br />
many <strong>of</strong> the measurements that will be<br />
Vision<br />
Goals<br />
Outcomes<br />
Strategies/Actions<br />
Key Success Indicators<br />
A-4 Fiscal Year <strong>2008</strong> Annual Budget
tracked in the future, therefore some qualitative information and data that has not<br />
historically been collected in Departmental reports is not presently available for<br />
comparison or performance target purposes. Repeated from previous year budgets are<br />
the Required Resources for each Program Activity including both historical and<br />
proposed expenditures, coupled with revenue sources that are attributable to the<br />
particular Activity to highlight its net cost. The presentation <strong>of</strong> information in this fashion<br />
provides the reader with a better opportunity to review the net cost <strong>of</strong> a particular<br />
Activity in the context <strong>of</strong> any fees or revenues that are generated as a result <strong>of</strong> the<br />
service.<br />
In reviewing the Program Budget, the concept <strong>of</strong> total operating expenditures versus<br />
traditional General Fund expenditures should be kept in mind. The property tax rate<br />
and other taxes and dividends primarily cover expenditures for the General Fund (which<br />
involve many <strong>of</strong> the day-to-day costs <strong>of</strong> running the <strong>City</strong>), except for those costs<br />
attributable to Enterprise Operations (e.g. <strong>Lakeland</strong> Electric, Water and Wastewater<br />
Funds, Solid Waste Fund, Airport Fund, The <strong>Lakeland</strong> Center and Cleveland Heights<br />
Golf Course), Special Revenue Funds (Community Development Fund) or Capital<br />
Project Funds (e.g. the Transportation Fund, Stormwater Fund and Public Improvement<br />
Fund). The General Fund pays for deficiencies in some funds such as The <strong>Lakeland</strong><br />
Center through a transfer <strong>of</strong> funds. All <strong>of</strong> the funds together, with the exception <strong>of</strong> the<br />
Internal Service Funds (e.g. Fleet Management, Purchasing & Stores, Information<br />
Technology and Facilities Maintenance Funds) and the allocation <strong>of</strong> Administrative<br />
Services expenses comprise the operational budget.<br />
The newly revamped FY <strong>2008</strong> Budget will be submitted to the Government Finance<br />
Officers Association (GFOA) in our effort to receive their “Distinguished Budget<br />
Presentation Award.” The GFOA award is in recognition <strong>of</strong> the layout, planning, content<br />
and overall presentation <strong>of</strong> the budget document and only a small percentage <strong>of</strong> public<br />
organizations are honored with the distinction. It is hoped that Commissioners will find<br />
the document to be user friendly and serve as a reference throughout the year as the<br />
<strong>City</strong> continues to align its financial, human resources and overall municipal operations<br />
to the SOP.<br />
Navigating an Ever-Changing Financial Landscape<br />
The development <strong>of</strong> the FY <strong>2008</strong> Budget in the era <strong>of</strong> Property Tax Reform initiatives<br />
currently underway in Florida represented an additional challenge to both the<br />
organization and community. The current environment has and will likely require<br />
continued focus into the future, the challenging <strong>of</strong> historical practices <strong>of</strong> financing local<br />
government services through traditional ad valorem or property tax revenues. In<br />
previous years, <strong>Lakeland</strong>’s most significant financial challenge clearly involved<br />
response strategies associated with the losses <strong>of</strong> the Florida Municipal Power Agency<br />
(FMPA) agreement. As has been widely reported, the FMPA Agreement that was<br />
originally executed in 2000 for a ten-year term for the provision <strong>of</strong> up to 100 megawatts<br />
<strong>of</strong> power is structurally flawed in that it does not afford <strong>Lakeland</strong> Electric to adjust fuel<br />
costs at levels sufficient to compensate the utility for its actual costs. As such, the utility<br />
loses money on the supply <strong>of</strong> electricity to FMPA on a daily basis. Although <strong>Lakeland</strong><br />
was successful in renegotiating the contract in 2004 to shorten its term by three years<br />
(thereby mitigating further future losses) and receiving an estimated schedule <strong>of</strong> energy<br />
A-5 Fiscal Year <strong>2008</strong> Annual Budget
takes by the FMPA, we were not able to achieve language modifications that would<br />
allow the utility to fully recover fuel costs associated with the transaction throughout the<br />
shortened term. The cumulative losses associated with the FMPA Agreement are<br />
approximately $82.4 million to date, with an additional $9.9 million projected through the<br />
end <strong>of</strong> shortened contract term.<br />
As you are aware, the <strong>City</strong> adopted a<br />
response strategy which involved<br />
considerable cost reductions and<br />
controls within the operating budget <strong>of</strong><br />
the electric utility coupled with a<br />
reduction <strong>of</strong> <strong>Lakeland</strong> Electric’s dividend<br />
to the General Fund. The reduced<br />
dividend approach was funded through<br />
capital project deferments in the Public<br />
Improvement, Transportation, and<br />
Stormwater Capital Improvement<br />
Programs.<br />
Additional losses not covered under the capital deferment approach were covered by<br />
the use <strong>of</strong> <strong>Lakeland</strong> Electric reserves. The strategy resulted in the identification <strong>of</strong> $10<br />
million <strong>of</strong> capital project deferments from FY 2005 – FY 2007 which was transferred to<br />
the General Fund to support operations. Through FY 2007, the <strong>City</strong> also provided a<br />
total <strong>of</strong> $14 million in dividend reductions, and FY <strong>2008</strong> will represent the closure <strong>of</strong> the<br />
strategy with <strong>Lakeland</strong> Electric fully covering the remaining projected losses through the<br />
expiration <strong>of</strong> the contract in the first quarter <strong>of</strong> the fiscal year without the need for<br />
additional dividend relief. The FY <strong>2008</strong> <strong>Lakeland</strong> Electric Budget was developed<br />
utilizing a dividend transfer <strong>of</strong> 6.3% <strong>of</strong> gross operating revenues, which was established<br />
in conjunction with the utility’s 2007 rate case based upon a nationwide municipal<br />
electric utility industry average <strong>of</strong> contributions to their host municipalities as reported by<br />
the American Public Power Association. I believe I speak on behalf <strong>of</strong> the entire<br />
municipal organization, our residents and electric utility customers that FY <strong>2008</strong> will<br />
represent the last budget in which the FMPA contract is mentioned as a contributing<br />
financial challenge to the organization!<br />
That said, municipalities across the state are responding to the current storm clouds<br />
associated with Property Tax Reform as well as those that are forming on the horizon.<br />
Property tax relief quickly became a legislative priority following the development boom<br />
experienced in Florida over the past three to four years, coupled with a dramatic rise in<br />
assessed valuation <strong>of</strong> properties and the resulting increase in property tax bills. The<br />
political pressure to revamp the property tax system was generally strongest along the<br />
state’s east and west shorelines which experienced the largest valuation increases in<br />
each <strong>of</strong> the boom years, although many central Florida communities such as <strong>Lakeland</strong><br />
only experienced significant market valuation adjustments in the past fiscal year.<br />
Following the failure to resolve significantly differing approaches between the Florida<br />
Senate and House <strong>of</strong> Representatives during the 2007 Regular Session, a Special<br />
Session was scheduled in mid-June to afford the respective chambers the opportunity<br />
to focus on a comprehensive plan to eliminate inequities associated with homestead v.<br />
non-homestead properties; the Save Our Homes (SOH) Constitutional Amendment<br />
A-6 Fiscal Year <strong>2008</strong> Annual Budget
including portability issues; the parameters in which property valuations are based<br />
upon, and the proportion <strong>of</strong> property tax receipts collected from Florida’s business and<br />
industries. Despite these l<strong>of</strong>ty goals, the Legislature ultimately only crafted what many<br />
believe to be a rushed 2-part strategy over three days that only dealt with a small<br />
portion <strong>of</strong> the complex issues associated with Florida’s Property Tax system.<br />
The first part <strong>of</strong> the Legislature’s adopted<br />
strategy involves a statutory rollback <strong>of</strong> existing<br />
millages <strong>of</strong> local taxing units by a factor based<br />
upon their respective tax revenue growth since<br />
2001, an exemption <strong>of</strong> $25,000 <strong>of</strong> tangible<br />
personal property for businesses, and<br />
advancement <strong>of</strong> a Constitutional Amendment on<br />
January 29, <strong>2008</strong>. The Constitutional<br />
Amendment if approved by 60% <strong>of</strong> the voters,<br />
would provide for a “Super Homestead”<br />
exemption in which homeowners would make a<br />
one-time choice to either maintain their existing<br />
SOH status on their homestead, or alternatively.<br />
choose the new Super Homestead classification that would result in a 75% exemption<br />
on the first $200,000 <strong>of</strong> assessed value, and an additional 15% exemption on assessed<br />
valuation on $200,001 up to $500,000. Initially, there would be no additional exemption<br />
on assessed valuations <strong>of</strong> $500,000 and above, however that threshold would be<br />
adjusted annually in future years by the percentage change in Per Capita Florida<br />
Personal Income. All new homesteads will be categorized under the Super Homestead<br />
Exemption, and existing homesteads receiving the benefit <strong>of</strong> the cumulative SOH<br />
assessed valuation caps that are sold would subsequently be classified under the Super<br />
Homestead category.<br />
As it relates to the <strong>City</strong> <strong>of</strong> <strong>Lakeland</strong>, the Statutory<br />
millage component impacted the current property<br />
tax rate <strong>of</strong> 3.545 mills which has been in effect since<br />
FY 2004 through a rollback to 2.9977 mills. This<br />
Statutory Roll-Back Rate would represent an 18.3%<br />
decrease in the millage rate and would result in an<br />
approximate 2.6% decrease in a typical property taxpayer’s bill. A component <strong>of</strong> the<br />
Property Tax Reform State Statute calculations also categorized every taxing unit in the<br />
state in one <strong>of</strong> four tiers which contributed to the reduction <strong>of</strong> the respective taxing unit’s<br />
millage rate by either 3%, 5%, 7% or 9% based upon the amount <strong>of</strong> revenues the local<br />
unit collected from property taxes dating back to 2001. <strong>Lakeland</strong> was categorized in the<br />
9% level, largely due to the .55 millage increase in FY 2004 adopted largely in response<br />
to community support to maintain historical levels <strong>of</strong> public safety services. In the<br />
absence <strong>of</strong> the FY 2004 millage increase, <strong>Lakeland</strong> would have been categorized at the<br />
5% reduction level. Financially, adoption <strong>of</strong> the Statutory Roll-Back Rate in <strong>Lakeland</strong><br />
would result in a reduction <strong>of</strong> approximately $2.8 million in the upcoming year.<br />
It should be noted that <strong>Lakeland</strong> has one <strong>of</strong> the lowest property tax rates for a full<br />
service <strong>City</strong> in the State largely due to the operation <strong>of</strong> multiple utilities, including<br />
electric, which provide financial support to the General Fund through dividend transfers.<br />
A-7 Fiscal Year <strong>2008</strong> Annual Budget
Despite such circumstances, <strong>Lakeland</strong> was nonetheless swept into the fray <strong>of</strong> property<br />
tax reform under the “one size fits all” approach utilized by the State Legislature last<br />
June. It is also strongly believed that regardless <strong>of</strong> the outcome <strong>of</strong> the January 29 th<br />
Referendum, the Legislature and voters will likely face additional property tax reform<br />
measures arising from the Constitutionally mandated appointment <strong>of</strong> the Florida<br />
Taxation & Budget Reform Commission which has already discussed additional<br />
structural changes to the State’s Property Tax System which may require consideration<br />
in future elections.<br />
This is in addition to the strong possibility <strong>of</strong> additional Legislative reform measures in<br />
the <strong>2008</strong> Regular Session should the January 29 th Constitutional Amendment be<br />
defeated in January. Although it is too early to predict passage or failure, the proposed<br />
Amendment is currently polling below the 60% threshold which is now required to<br />
change Florida’s Constitution.<br />
Recognizing the prospect <strong>of</strong> Legislative Property Tax Reform initiatives during the 2007<br />
Regular Session, I originally instructed <strong>City</strong> staff to develop their initial FY <strong>2008</strong> Budget<br />
requests with nominal increases in “controllable” expenses. Following the legislation<br />
arising from the June Special Session, Departments were subsequently directed to<br />
revise their original budget submissions to eliminate any increases in such expenses.<br />
Additionally, a “S<strong>of</strong>t Personnel Freeze” was implemented which required the <strong>City</strong><br />
Manager’s Office review and approval to fill all staff vacancies as they occur to limit<br />
future personnel expenses. This approach also afforded greater flexibility to address<br />
the prospect <strong>of</strong> reducing personnel expenses (which typically represent a municipality’s<br />
single largest expenditure category) without the need for lay<strong>of</strong>fs in response to Property<br />
Tax Reform initiatives. Additional budget cutting techniques implemented included<br />
extended vehicle and computer replacement schedules, deferment <strong>of</strong> the construction<br />
and related staffing <strong>of</strong> the planned Southwest <strong>Lakeland</strong> Fire Station #7; reduction <strong>of</strong><br />
internal service charges and a variety <strong>of</strong> more significant reductions <strong>of</strong> departmental<br />
budgets. Compounding the FY <strong>2008</strong> Budget pressures were reduced projections <strong>of</strong><br />
State Communications and Half-Cent Sales Tax revenues resulting in an additional $1.2<br />
million in lower tax receipts in the upcoming year. Therefore, even with the<br />
implementation <strong>of</strong> the above budget reduction steps, the <strong>City</strong> was facing an<br />
approximate $4 million shortfall in the General Fund due to reduced property tax<br />
revenues under the proposed Statutory Roll-Back millage rate coupled with reduced<br />
projections <strong>of</strong> State Communications and Half-Cent Sales Tax receipts.<br />
The Property Tax Reform State Statute provides some limited flexibility for local units to<br />
override the impacts <strong>of</strong> the Statutory millage rollbacks by allowing units to adopt<br />
millages up to 10% higher than the Statutory Roll-Back Rate with a supermajority vote<br />
<strong>of</strong> the governing body, and continuance <strong>of</strong> the current millage rate with a unanimous<br />
vote. The <strong>City</strong> Commission sought direct public input into the FY <strong>2008</strong> Budget<br />
development deliberations through the scheduling <strong>of</strong> two public Budget Workshops on<br />
July 25 and August 13, 2007. Following detailed presentations about the intricacies <strong>of</strong><br />
the Statutory Property Tax Reform requirements, staff outlined a number <strong>of</strong> alternatives<br />
involving a mixture <strong>of</strong> additional potential budget cuts coupled with various revenue<br />
enhancements that could close the $4 million General Fund shortfall. Proposed<br />
program cuts included additional payroll and benefit reductions, deeper reductions in<br />
Internal Service charges and <strong>City</strong> Commission travel expenses, in addition to the<br />
elimination <strong>of</strong> the following items: printing and distribution <strong>of</strong> the Annual <strong>City</strong> Calendar<br />
A-8 Fiscal Year <strong>2008</strong> Annual Budget
and Employee newsletter (Access <strong>Lakeland</strong>); the Employee Annual picnic; the refund<br />
<strong>of</strong> the Payment in Lieu <strong>of</strong> Taxes (PILOT) to the <strong>Lakeland</strong> Housing Commission; the<br />
<strong>Lakeland</strong> Police Department (LPD) Aviation Unit and DARE Program and future support<br />
<strong>of</strong> the Lemon Street Sculpture exhibits. Collectively the reductions and eliminations<br />
resulted in approximately $1.5 million <strong>of</strong> additional budget cuts.<br />
With respect to revenues, options included increases in Occupational License Tax<br />
rates; private sponsorships <strong>of</strong> historically <strong>City</strong>-funded programs such as the Lake Mirror<br />
Concert Series and Red, White & Kaboom; Tigertown parking rates; financial<br />
contributions for supplies from various Athletic Clubs/Leagues; Zoning and Site Plan<br />
Review fees and Parks and Recreation building rental and recreational fees.<br />
Collectively the proposed options were projected to generate approximately $425,000 <strong>of</strong><br />
additional revenues.<br />
Both <strong>of</strong> the Budget Workshops were well attended with various advocates speaking on<br />
behalf <strong>of</strong> maintaining a variety <strong>of</strong> programs, most notably the LPD Aviation Unit and<br />
DARE training in local schools. (Elimination <strong>of</strong> both programs would have helped<br />
address the Police Department’s desire to employ an additional 20-22 sworn Officers in<br />
response to manpower studies through the redeployment <strong>of</strong> 4 DARE Officers and 1.5<br />
Pilots.) Following the second Budget Workshop, the <strong>City</strong> Commission convened their<br />
own workshop on August 14 th to discuss their collective approach to the FY <strong>2008</strong><br />
Budget issues.<br />
Commission consensus supported the continuation <strong>of</strong> the LPD Aviation Unit and<br />
maintenance <strong>of</strong> the DARE program, and the balance <strong>of</strong> recommended revenue and<br />
expenditure options appeared to be supported as proposed. In reviewing the outcome<br />
<strong>of</strong> the FY <strong>2008</strong> Annual Retreat held in January, the Commission also generally<br />
supported the elimination <strong>of</strong> cross subsidies from the General Fund in the amount <strong>of</strong><br />
approximately $250,000 and the Transportation Fund in the amount <strong>of</strong> $1.4 million to<br />
the Stormwater Fund to allow it to become financially self-sufficient at current service<br />
and program levels. Additionally, the Commission expressed interest to consider a<br />
response to the <strong>City</strong> <strong>of</strong> <strong>Lakeland</strong> Association <strong>of</strong> Retirees (COLAR) recent proposal to<br />
provide $500,000 to the Pension Fund to finance a $450 check to all retirees to address<br />
the lack <strong>of</strong> a pension COLA over the last six years and to explore options to establish a<br />
formalized COLA in future years. With respect to proposed millage levels, the<br />
Commission reviewed the four options identified below, along with the prerequisite<br />
votes each would require to be in compliance with the Property Tax Reform State<br />
Statute and the resulting additional transfer from the <strong>City</strong>’s Public Improvement Fund<br />
(PIF) to balance the General Fund Budget. The Public Improvement Fund is largely<br />
supported through a land lease to the <strong>Lakeland</strong> Regional Medical Center which<br />
generates approximately $9.5 million per year:<br />
Option Description Tax Rate<br />
Votes Additional Total PIF<br />
Required Revenue Transfer 1<br />
1 Current Rate 3.5450 Mills 7 $2,800,000 $1,700,000<br />
2 Basic Roll-Back 3.2942 Mills 5 $1,500,000 $3,000,000<br />
3<br />
Eliminate impact <strong>of</strong><br />
2004 millage increase<br />
3.1295 Mills 5 $ 675,000 $3,850,000<br />
4 Statutory Rollback 2.9977 Mills 4 -0- $4,500,000<br />
1<br />
The FY <strong>2008</strong> Budget assumes the continuation <strong>of</strong> the current $1,925,000 transfer to the General Fund, plus and<br />
additional $1,075,000 in order to provide sufficient resources to balance the budget<br />
A-9 Fiscal Year <strong>2008</strong> Annual Budget
After considerable discussion, Commission consensus resulted in the direction to<br />
prepare the FY <strong>2008</strong> Budget based upon a millage rate <strong>of</strong> 3.2942, although the<br />
maximum rate <strong>of</strong> 3.5450 mills was advertised in the published TRIM notice to provide<br />
flexibility should the Commission ultimately desire to maintain the current rate in FY<br />
<strong>2008</strong>. The Commission also expressed interest in maintaining the LPD Aviation Unit<br />
and DARE/PAL Programs. In many ways, the essence <strong>of</strong> the Property Tax Reform<br />
efforts vis-à-vis the local millage rate is at the heart <strong>of</strong> what municipal <strong>of</strong>ficials call “local<br />
control” or put otherwise, who is in the best position to determine the priorities and<br />
desires <strong>of</strong> a given <strong>City</strong>: the State Legislature or local elected and appointed <strong>of</strong>ficials.<br />
The discussions that preceded the development <strong>of</strong> this document and which likely will<br />
continue through its review and final adoption, will no doubt also take place in city and<br />
county commission chambers throughout all <strong>of</strong> Florida in an effort to determine what<br />
services and programs are deemed important and desired by our respective<br />
constituents, and how to best finance such services and programs.<br />
Proposed FY <strong>2008</strong> Budget Basics<br />
Given the above background information, I am proposing a FY <strong>2008</strong> Total <strong>City</strong> Budget<br />
<strong>of</strong> $596,447,887 and a General Fund Budget <strong>of</strong> $56,258,933 which is net <strong>of</strong> intra-city<br />
transactions. The Proposed Budget also includes a 5% rate increase in Solid Waste<br />
Residential, Commercial and Recycling services; a 7.5% increase in Wastewater flow<br />
and High Strength surcharges; a $2.50 monthly increase in the Stormwater Residential<br />
Equivalent Unit (to help eliminate the cross subsidy <strong>of</strong> the Stormwater Fund as<br />
discussed above); a 41¢ projected increase in the <strong>Lakeland</strong> Electric Environmental<br />
Compliance surcharge; a $10.00 per month increase in downtown garage fees and a<br />
$5.00 per month increase in surface parking fees and the previously Park & Recreation<br />
operation building, parking and participation fees discussed during the previous Budget<br />
Workshops. Additional information regarding the various proposed rate and fee<br />
increases can be found in their respective narratives in the Performance Budget section<br />
<strong>of</strong> this document.<br />
Total <strong>City</strong> Budget<br />
(Less Intra-<strong>City</strong><br />
Transactions)<br />
General Fund<br />
Less Intra-<strong>City</strong><br />
Transactions)<br />
Conclusion<br />
FY 2006<br />
Actual<br />
FY 2007<br />
Budget<br />
FY <strong>2008</strong><br />
Proposed<br />
Budget<br />
% Change<br />
Budget/<br />
Proposed<br />
$566,218,979 $587,346,815 $596,447,887 1.5%<br />
$ 75,286,290 $87,198,792 $88,962,601 2.0%<br />
It is believed that the review <strong>of</strong> the revised FY <strong>2008</strong> Budget format, which fully<br />
incorporates the <strong>City</strong>’s Strategic Planning process with the annual allocation <strong>of</strong> financial<br />
resources, represents an excellent opportunity for the <strong>City</strong> Commission, staff and<br />
residents to review the delivery <strong>of</strong> municipal services vis-à-vis our effectiveness to<br />
accomplish the stated collective desires <strong>of</strong> the community.<br />
I would also like to take this opportunity to recognize the dedication <strong>of</strong> the <strong>City</strong> <strong>of</strong><br />
<strong>Lakeland</strong>’s municipal workforce as they provide an extensive array <strong>of</strong> services for<br />
A-10 Fiscal Year <strong>2008</strong> Annual Budget
esidents with enthusiasm and pride, especially under the trying times <strong>of</strong> Property Tax<br />
Reform. Many <strong>of</strong> these employees have contributed extensively in the analysis and<br />
preparation <strong>of</strong> this document, and I appreciate their demonstrated commitment to the<br />
significantly revamped and improved format <strong>of</strong> this document. Recognizing the<br />
enormous amount <strong>of</strong> time it takes to prepare this document for your review, the work <strong>of</strong><br />
the <strong>City</strong> continues and Department Heads and the budget team should be congratulated<br />
for their ability to juggle competing demands for their time. Without doubt, this<br />
document could not be completed in the absence <strong>of</strong> extraordinary work by our Finance<br />
Director Greg Finch, Assistant Finance Directors Mike Brossart and Don Eckert, Chief<br />
Accountants Deidra Joseph and Tory Bombard, Computer Application Specialist Patrick<br />
Bauman, Investment Management Assistant Rachel Taylor, Deputy <strong>City</strong> Manager Tony<br />
Delgado, Assistant <strong>City</strong> Manager Stanley Hawthorne, and last but certainly not least,<br />
the <strong>City</strong> Manager’s Office administrative support team comprised <strong>of</strong> Jennifer Stovall,<br />
Chris Chadwell, Cher Gill and Traci Terry. I would also like add my personal thanks to<br />
several individuals who contributed greatly over the past year with the integration <strong>of</strong> the<br />
Annual Budget with our Strategic Planning Process. As such, special thanks go to OMB<br />
Manager Kindle Bowden, Budget Analyst Lori Gordon, (who also is credited with the<br />
Budget cover design), Organization Development Supervisor, Ed Hacker, and the<br />
various employees who have contributed greatly <strong>of</strong> their time by serving on the<br />
Strategic Operating Advisory Team (SOAT) and the Organization Communication<br />
Advisory Team (OCAT). Together these individuals have assisted the municipal<br />
organization in the implementation <strong>of</strong> the <strong>City</strong>’s Strategic Plan at all levels. It is <strong>of</strong>ten<br />
said that strategic planning is more <strong>of</strong> a journey than a destination, and collectively their<br />
contributions have afforded the organization to begin to “walk the talk” <strong>of</strong> our Strategic<br />
Plan!<br />
On behalf <strong>of</strong> the entire municipal staff, we look forward to working with the Mayor and<br />
<strong>City</strong> Commission during your review <strong>of</strong> the Proposed FY <strong>2008</strong> Annual <strong>City</strong> Budget and<br />
Capital Improvement Program Budgets and stand ready to address any related<br />
questions or comments.<br />
Very truly yours,<br />
Douglas B. Thomas<br />
<strong>City</strong> Manager<br />
A-11 Fiscal Year <strong>2008</strong> Annual Budget
<strong>City</strong> <strong>of</strong> <strong>Lakeland</strong> <strong>2008</strong> Organization Chart<br />
Municipal Boards & Committees<br />
(see page A-13)<br />
CITIZENS OF THE CITY OF LAKELAND<br />
Operating Boards<br />
(see page A-13)<br />
CITY ATTORNEY<br />
Tim McCausland<br />
MAYOR AND CITY COMMISSION<br />
(see page A-13)<br />
DEPUTY CITY MANAGER<br />
Tony Delgado<br />
CITY MANAGER<br />
Doug Thomas<br />
ASSISTANT CITY MANAGER<br />
Stanley Hawthorne<br />
Strategic Planning &<br />
Organizational Excellence<br />
COMMUNICATIONS<br />
Kevin Cook<br />
POLICE<br />
Roger Boatner<br />
FINANCE<br />
Greg Finch<br />
ELECTRIC UTILITY<br />
Jim Stanfield<br />
Community<br />
Programs<br />
Juvenile<br />
Programs<br />
Patrol<br />
Investigative<br />
Aviation<br />
Distpatching<br />
Payroll<br />
Treasurers Office<br />
Central Accounting<br />
Customer Billing<br />
E&W Finance<br />
Accounts Payable<br />
<strong>City</strong> Clerk<br />
Utility Billing &<br />
Customer<br />
Service<br />
Production<br />
Transmission &<br />
Distribution<br />
WATER UTILITY<br />
Chuck Garing<br />
PUBLIC WORKS<br />
Rick Lilyquist<br />
FIRE<br />
Mike Mohler<br />
PARKS & RECREATION<br />
Bill Tinsley<br />
COMMUNITY DEVELOPMENT<br />
Jim Studiale<br />
AIRPORT<br />
John Dubose<br />
Water Production &<br />
Distribution<br />
Wastewater Collection<br />
& Treatment<br />
Transportation<br />
Facilities<br />
Maintenance<br />
Right <strong>of</strong> Way<br />
Construction<br />
Fleet<br />
Solid Waste<br />
Streets & Traffic<br />
Lighting<br />
Parking<br />
Facilities Maintenance<br />
Lakes & Stormwater<br />
Firefighting<br />
Rescue<br />
Parks<br />
Recreation &<br />
Facilities<br />
Cultural Support<br />
Aquatics<br />
Cemeteries<br />
Golf Course<br />
Library<br />
Affordable Housing<br />
Planning<br />
Development Review<br />
Neighborhood<br />
Programs<br />
Community<br />
Redevelopment Areas<br />
Building Inspection<br />
& Permitting<br />
Code Enforcement<br />
Business Tax<br />
Economic<br />
Development<br />
Operations<br />
Leasing<br />
Activities<br />
THE LAKELAND CENTER<br />
Mike LaPan<br />
RISK MANAGEMENT<br />
Karen Lukhaub<br />
INTERNAL AUDIT<br />
John Zuercher<br />
INFORMATION TECHNOLOGY<br />
(Vacant))<br />
A-12 Fiscal Year <strong>2008</strong> Annual Budget<br />
Human Resources<br />
Client Services<br />
Accounting &<br />
Information<br />
Technology<br />
Property Operations &<br />
Maintenance<br />
Marketing<br />
Sales<br />
Purchasing & Stores<br />
Safety<br />
Application Development<br />
& Support<br />
Network Administration &<br />
Support<br />
Technology Support<br />
Administrative<br />
Radio Communication<br />
GIS<br />
Public Safety<br />
Telecommunications<br />
Staffing &<br />
Compensation<br />
Workforce<br />
Development<br />
& Labor<br />
Relations<br />
*Department Organization Charts located in Supplementary Section
<strong>City</strong> <strong>of</strong> <strong>Lakeland</strong> <strong>2008</strong> Organization Chart<br />
CITIZENS OF THE CITY OF LAKELAND<br />
OPERATING BOARDS<br />
Central Florida Regional Planning Council<br />
<strong>Lakeland</strong> Area Mass Transit District<br />
<strong>Lakeland</strong> Downtown Development Authority<br />
Legislative/Intergovernmental Relations<br />
Polk County Joint Airport-Zoning<br />
Polk County Sports Marketing<br />
Polk County Visitors & Convention Bureau<br />
Transportation Planning Organization<br />
MAYOR AND CITY COMMISSION<br />
R. L. Buddy Fletcher (Mayor)<br />
A. Dean Boring James S. Verplanck<br />
Gow B. Fields R. Howard Wiggs<br />
Glenn E. Higgins Edie L. Yates<br />
MUNICIPAL BOARDS & COMMITTEES<br />
Affordable Housing Advisory<br />
Affordable Housing Review<br />
Airport Advisory Board<br />
Beautification<br />
Citizen’s Advisory<br />
Civil Service<br />
Code Enforcement<br />
Dixieland Community Redevelopment Area<br />
Drug-Related Nuisance Abatement<br />
Enterprise Zone Development Agency<br />
Firefighter’s Pension Trust<br />
Historic Preservation<br />
Housing Authority<br />
Midtown Community Redevelopment Area<br />
Planning and Zoning<br />
Police Officer’s Retirement<br />
Public Employee Relations<br />
Retirement Services<br />
Utility Committee<br />
Zoning Board <strong>of</strong> Adjustment and Appeals<br />
<strong>Lakeland</strong> is located<br />
midway between<br />
Tampa and Orlando<br />
along Interstate 4 in<br />
Polk County, Florida.<br />
A-13 Fiscal Year <strong>2008</strong> Annual Budget
Vision, Mission and Values...<br />
Vision<br />
<strong>Lakeland</strong> - a vibrant, culturally inclusive world-class community.<br />
Mission Statement<br />
A community working together to provide an exceptional quality <strong>of</strong> life.<br />
Core Values<br />
Leadership<br />
Commitment to Excellence<br />
Diversity<br />
Integrity<br />
Social Responsibility<br />
Empowered Workforce<br />
(see page C-3)<br />
Goals<br />
Economic Opportunity<br />
Communication<br />
Fiscal Management<br />
Growth Management<br />
Quality <strong>of</strong> Life<br />
Key Success Indicators<br />
(KSI’s)<br />
(see page D-5)<br />
Outcomes<br />
Enriched Organization Workforce<br />
Enriched Community Workforce<br />
Sustainable Business Environment<br />
Informed and Engaged Employees<br />
Informed and Engaged Community<br />
Optimal Management <strong>of</strong> Existing Financial Resources<br />
Develop New Financial Resources<br />
Quality Developments<br />
Safe, Attractive Neighborhoods<br />
Quality Public Spaces<br />
Superior Municipal Services<br />
Support the Arts and Wellness<br />
Support Education<br />
(see pages C-4)<br />
A-14 Fiscal Year <strong>2008</strong> Annual Budget
Vision, Mission and Values...<br />
Strategies<br />
Promote an organizational culture characterized by open communication and employee involvement<br />
Promote effective communication inclusive <strong>of</strong> all residents and stakeholders<br />
Encourage a shared sense <strong>of</strong> community and responsibility through citizen education and involvement<br />
Promote career development and educational opportunities<br />
Recruit, hire and retain highly skilled employees<br />
Establish area “Workforce Development Partnerships”<br />
Encourage the development <strong>of</strong> high-skilled labor sectors<br />
Promote diverse cultural opportunities<br />
Promote improving level <strong>of</strong> education<br />
Promote international relationships<br />
Support area economic development initiatives<br />
Promote high skilled-high wage employment opportunities<br />
Promote the establishment and sustainability <strong>of</strong> small businesses<br />
Enhance strategic and budgetary planning with performance measurement systems<br />
Operate physical assets according to “Best Practices”<br />
Optimize fiscal capacity <strong>of</strong> existing financial resources<br />
Leverage underutilized assets<br />
Establish public/private partnerships<br />
Establish perpetual care funds (or endowments) for public and private contributions<br />
Promote a comprehensive, integrated approach to all land use decisions<br />
Develop reliable and efficient infrastructure systems that support desired urban development<br />
Establish incentives to encourage high quality developments<br />
Promote public safety initiatives and projects that enhance property values<br />
Counteract the physical and economic decline <strong>of</strong> neighborhoods<br />
Empower residents to address neighborhood concerns<br />
Promote public/private partnerships to develop public recreation spaces<br />
Implement Parks and Trails Master Plan priorities<br />
Preserve and enhance unique natural and historic resources<br />
Establish “Best Practices” benchmarks<br />
Establish public/private partnerships and promote community events and culturally diverse programs<br />
Engage in partnerships with area education institutions<br />
Actions<br />
(see pages D-8 thru D-23)<br />
A-15 Fiscal Year <strong>2008</strong> Annual Budget
<strong>Lakeland</strong> at a Glance<br />
♦ Incorporated January 1, 1885<br />
♦ Commission - <strong>City</strong> Manager Form <strong>of</strong> Government<br />
♦ Mayor and six-member <strong>City</strong> Commission, nonpartisan, elected at large<br />
♦ <strong>City</strong> Manager appointed by the <strong>City</strong> Commission<br />
Demographics<br />
Population (As <strong>of</strong> April 1st <strong>of</strong> each year from Bureau <strong>of</strong><br />
Economic and Business Research-BEBR 2000)<br />
1998 77,113<br />
1999 77,483<br />
2000 78,452<br />
2001 82,706<br />
2002 85,517<br />
2003 88,741<br />
2004 89,731<br />
2005 90,851<br />
2006 91,623<br />
2007 (est.) 92,722<br />
<strong>2008</strong> (est.) 93,385<br />
Median Age 38.7<br />
Percentage <strong>of</strong> Households<br />
Single Family/Duplex 77%<br />
Multi-Family 23%<br />
Median Household Income (ESRI-2005) $35,574<br />
Racial Composition<br />
White 70.6%<br />
Black or African American 19.5%<br />
American Indian, Alaskan Native 0.1%<br />
Asian 2.0%<br />
Other Race 7.8%<br />
Education<br />
For School Year 2006 - 2007<br />
Number <strong>of</strong> Public Schools<br />
Elementary 28<br />
Middle 8<br />
High School 6<br />
Public/Private Colleges 5<br />
Land Use<br />
Land Area (sq. miles) 73.31<br />
Land Use:<br />
Residential 50%<br />
Commercial 24%<br />
Recreation/Open Space 17%<br />
Public/Institutional 1%<br />
Industrial 8%<br />
100%<br />
(Source: 2007Community Development Land Data Record System)<br />
Economics<br />
Office Space (sq. ft.) 190,472<br />
Retail Space (sq. ft.) 443,846<br />
Industrial Space (sq. ft.) 1,047,852<br />
Assessed Taxable Property Valuation 5,287,388,491<br />
(2006 Tax Year)<br />
% <strong>of</strong> Total<br />
Principal Taxpayers:<br />
Assessed Value<br />
Publix Super Markets, Inc. 6.32%<br />
Rooms To Go Furniture Corp 1.33%<br />
Watson Clinic 1.21%<br />
Verizon 1.19%<br />
H-D <strong>Lakeland</strong> Mall Joint Venture 0.95%<br />
Property Tax Millage Rate 3.2942<br />
Per Capita Debt:<br />
Total Debt Per Capita (less Electric system debt) $2,046<br />
(Fiscal Year End 2006)<br />
Fiscal Year <strong>2008</strong><br />
Net Adopted Budget: $596,447,887<br />
FCAT Results (2006) Polk County<br />
Reading Mean Math Mean<br />
Elementary<br />
Grade 3 306 313<br />
Grade 4 304 306<br />
Grade 5 293 320<br />
Middle<br />
Grade 6 299 294<br />
Grade 7 301 291<br />
Grade 8 288 302<br />
High School<br />
Grade 9 297 292<br />
Grade 10 282 311<br />
A-16 Fiscal Year <strong>2008</strong> Annual Budget
Service Statistics<br />
Police<br />
Police Officers 236<br />
Number <strong>of</strong> service calls 103,360<br />
Number <strong>of</strong> 911 calls 51,116<br />
Average emergency response time (min.) 6.8<br />
Fire/EMS<br />
Career Firefighters 140<br />
Number <strong>of</strong> fire stations 6<br />
Number <strong>of</strong> service calls:<br />
Fire 2,484<br />
EMS 16,929<br />
Parks & Recreation<br />
Number <strong>of</strong> parks & facilities 71<br />
Number <strong>of</strong> acres 1,232<br />
Cleveland Heights Golf Course:<br />
Holes 27<br />
Memberships 402<br />
Rounds 76,632<br />
Lake Mirror Complex:<br />
Auditorium<br />
Size (sq. ft.) 6,500<br />
Number <strong>of</strong> rentals 227<br />
Theatre<br />
Size (sq. ft.) 5,500<br />
Number <strong>of</strong> rentals 46<br />
Peggy Brown Building<br />
Size (sq. ft.) 4,000<br />
Number <strong>of</strong> rentals 199<br />
Magnolia Building<br />
Size (sq. ft.) 4,700<br />
Number <strong>of</strong> rentals 203<br />
Number <strong>of</strong> Libraries 3<br />
Number <strong>of</strong> Sports Complex 8<br />
Number <strong>of</strong> sports teams 355<br />
Number <strong>of</strong> Aquatic Complex visitors<br />
(Kelly and Simpson Pools) 83,200<br />
Number <strong>of</strong> swim classes 177<br />
Number <strong>of</strong> swim participants 868<br />
<strong>Lakeland</strong> Center<br />
George Jenkins Arena<br />
Size (sq. ft.) 24,380<br />
Capacity (reserved) 8,136<br />
Exhibit Hall:<br />
Size (sq. ft.) 28,262<br />
Youkey Theatre<br />
Size (sq. ft.) 39,000<br />
Capacity (reserved) 2,246<br />
Sikes Conference Center:<br />
Size (sq. ft.) 44,508<br />
Total Events 641<br />
Total Attendance 417,968<br />
Public Works<br />
Tons <strong>of</strong> waste recycled 4,533<br />
Streets / miles maintained 695<br />
<strong>City</strong> vehicles & equipment maintained 1,153<br />
Bike path / sidewalks (miles) 216<br />
Electric Utility<br />
Customer territory (sq. miles) 246<br />
Miles <strong>of</strong> transmission lines 145<br />
Residential accounts 97,969<br />
Commercial accounts 11,862<br />
Municipal accounts 532<br />
Private Area Lights accounts 9,534<br />
Average daily electric (kWh) 65.83<br />
Water/Wastewater Utilities<br />
Water customer territory (sq. miles) 135<br />
Water customer accounts 51,918<br />
Miles <strong>of</strong> water mains 959<br />
Fire hydrants 3,761<br />
Annual average water demand (mgd) 25.99<br />
Daily water treatment capacity (mgd) 51<br />
Wastewater customer accounts 41,123<br />
Wastewater lines / force mains 325/150<br />
Average daily wastewater treated (mgd) 10.43<br />
<strong>Lakeland</strong> Linder Airport<br />
Runway 9/27 (ft. long) 8,500<br />
Runway 5/23 (ft. long) 8,500<br />
A-17 Fiscal Year <strong>2008</strong> Annual Budget
History <strong>of</strong> <strong>Lakeland</strong><br />
<strong>Lakeland</strong> is the heart <strong>of</strong> Polk County and it is <strong>Lakeland</strong>’s charm that creates a beautiful blend <strong>of</strong> a small town<br />
feel with the convenience and amenities <strong>of</strong> much larger cities.<br />
In 1882, Abraham Munn <strong>of</strong> Louisville Kentucky bought, sight<br />
unseen, 80 acres <strong>of</strong> land in an area <strong>of</strong> small lakes in Polk<br />
County, Florida. Munn arrived in February 1884 to establish<br />
the <strong>Lakeland</strong> Improvement Company (LIC) with two business<br />
partners. The company platted Munn’s 80 acre purchase<br />
and began selling lots in the budding town <strong>of</strong> <strong>Lakeland</strong>. He<br />
helped to assure the success <strong>of</strong> his venture and the survival<br />
<strong>of</strong> <strong>Lakeland</strong> by persuading Henry Plant’s South Florida<br />
Railroad to locate its depot on LIC land just north <strong>of</strong> today’s<br />
Munn Park. The LIC lots constitute much <strong>of</strong> what is now<br />
<strong>Lakeland</strong>’s downtown business district.<br />
• 1883 - Lewis Ballard provided the first Post Office and General Store<br />
• 1884 - Herbert Drane opened the first drugstore<br />
• 1884 - Norman Riggins opened a dry goods store and saw mill<br />
• 1884 - Munn built the Tremont House (considered to be one <strong>of</strong> the finest hotels in Central Florida)<br />
• 1885 - Thirty-four citizens democratically decided to incorporate the town after a 22 to 12 vote<br />
• 1885 - John Torrence donated the site <strong>of</strong> Roselawn Cemetery to the <strong>City</strong><br />
• 1886 - First jail was named McDemerott House (after it’s first occupant)<br />
• 1891 - <strong>Lakeland</strong> Light and Power Company erected a light plant (3rd city in Florida to have electric lights)<br />
• 1902 - First telephone exchange was built<br />
• 1912 - First fire department was organized<br />
• 1913 - Mail delivery was established<br />
• 1916 - Cornerstone <strong>of</strong> the first hospital was laid<br />
• 1922 - Established a commission-manager form <strong>of</strong> government<br />
• 1922 - Florida Southern College moved here from Sutherland (Palm Harbor)<br />
• 1927 - Polk Theatre was built<br />
Did you know…<br />
The earliest dated canoe<br />
ever found in North or South<br />
America was uncovered near<br />
<strong>Lakeland</strong> and traced to 1100<br />
B.C.<br />
In 1883, members <strong>of</strong> the<br />
community gathered to select<br />
a name for their settlement<br />
among the names rejected<br />
were Rome <strong>City</strong>, Redbug and<br />
Munnville.<br />
A-18 Fiscal Year <strong>2008</strong> Annual Budget
History <strong>of</strong> <strong>Lakeland</strong><br />
The Spanish American War <strong>of</strong> 1898 was another<br />
important event that led to greater development in<br />
<strong>Lakeland</strong>. Among the six thousand U.S. soldiers<br />
encamped here during the war, many wrote letters<br />
about the attractiveness <strong>of</strong> the city. As a result <strong>of</strong> this<br />
favorable impression and free advertising, many<br />
soldiers retired here and <strong>Lakeland</strong> got its first influx <strong>of</strong><br />
tourist during the first winter after the war’s end.<br />
transportation was another factor. The 1930’s also<br />
featured the arrival <strong>of</strong> renowned architect Frank Lloyd<br />
Wright who designed 12 structures for Florida<br />
Southern College, the project was named “A Child <strong>of</strong><br />
the Sun.” It is the largest collection <strong>of</strong> Wright’s<br />
buildings in the world.<br />
Similar to other towns in the Southern U.S., “<strong>Lakeland</strong><br />
was agriculturally oriented from the first.” Citrus and<br />
strawberries were vital cash crops and/or industries to<br />
<strong>Lakeland</strong>. In the 1870’s, citrus started to become a<br />
greater activity in <strong>Lakeland</strong> when Archie McLeod<br />
moved down from Alabama<br />
to plant a grove where<br />
Florida Southern College<br />
now stands. In fact, it was<br />
in <strong>Lakeland</strong> that the<br />
seedless grapefruit was<br />
developed by Ed Tison in<br />
1887. Tison sold his<br />
nursery to C.M. Marsh who<br />
gave his name to the popular fruit.<br />
By May 26, 1891, the <strong>City</strong> became one <strong>of</strong><br />
the first three cities in Florida, besides<br />
Tampa and Jacksonville to have electric<br />
lights. Today, the city owns and operates<br />
it’s own electric company, <strong>Lakeland</strong><br />
Electric.<br />
The Florida boom resulted in the construction <strong>of</strong> many<br />
significant structures in <strong>Lakeland</strong>, a number <strong>of</strong> which<br />
are listed on the National Register <strong>of</strong> Historic Places.<br />
This list includes the Terrace Hotel (1924), Polk<br />
Theatre (1927),<br />
Park Trammell<br />
Building (1927-<br />
today known as<br />
the Chamber <strong>of</strong><br />
Commerce),<br />
Promenade <strong>of</strong><br />
Lake Mirror (1928)<br />
and others.<br />
The “boom” period went<br />
“bust” quickly and years<br />
passed before the city<br />
recovered. Part <strong>of</strong> the<br />
reemergence was due to the<br />
arrival <strong>of</strong> the Detroit Tigers in<br />
1934 for spring training. The<br />
development <strong>of</strong> the <strong>Lakeland</strong><br />
Municipal Airport as a major facility in Central Florida<br />
Swans have long been a part <strong>of</strong> the ambience <strong>of</strong><br />
<strong>Lakeland</strong>. Records and sightings indicate that swans<br />
have been on the city’s lakes since at least 1923. For<br />
different reasons the swan population dwindled to<br />
zero by 1945. Mrs. Robert Pickhardt wrote to Queen<br />
Elizabeth inquiring about purchasing a pair <strong>of</strong> swans<br />
for <strong>Lakeland</strong>. A royal representative replied that the<br />
Queen would donate a pair <strong>of</strong> swans if the city would<br />
pay the cost <strong>of</strong> capture, crating and<br />
shipping (estimated at $300). A pair <strong>of</strong><br />
white mute swans from England<br />
arrived in <strong>Lakeland</strong> and were released<br />
on Lake Morton on February 9, 1957.<br />
Today there are over 200 swans here<br />
including Coscorobas, Australian<br />
blacks, black-necks, Polish mutes and<br />
English mutes. They are found on Lakes Morton,<br />
Wire, Mirror, Parker and at Cleveland Heights Golf<br />
and Country Club. Quite a few are directly descended<br />
from the original pair from 1957.<br />
A-19 Fiscal Year <strong>2008</strong> Annual Budget
History <strong>of</strong> <strong>Lakeland</strong><br />
<strong>Lakeland</strong> is home to the nation’s second largest experimental aircraft<br />
convention, the Sun n Fun Fly-In (1973), which attracts aviation enthusiasts<br />
from around the world every April.<br />
Mayfaire-by-the-Lake (1970) art festival is another<br />
notable event held every Mother’s Day weekend<br />
and draws thousands <strong>of</strong> visitors each year.<br />
Hollis Garden (2000) is a<br />
formal 1.2 acre botanical<br />
garden located on historic Lake<br />
Mirror. The garden contains<br />
several water features and<br />
displays thousands <strong>of</strong> flowering<br />
plants, ornamental shrubs,<br />
historic trees, herbs and<br />
vegetables. Recently it was<br />
voted one <strong>of</strong> the “Best <strong>of</strong> Class Gardens” by the Gulfcoast Research and Education Center.<br />
The newest jewel in the <strong>City</strong>’s impressive array <strong>of</strong> parks is Barnett Family Park.<br />
Barnett Family Park is designed to attract children and families from throughout the<br />
community. The elaborate sculptures <strong>of</strong> native Florida animals and beautiful handcut<br />
Byzantine tiles make the park unique.<br />
Notable <strong>Lakeland</strong>ers (to list a few):<br />
Lawton Chiles<br />
George W. Jenkins<br />
Lawton Chiles, Senator & Governor <strong>of</strong> Florida<br />
George W. Jenkins, founder <strong>of</strong> Publix<br />
Lee Janzen, PGA Tour golfer (won U.S. Open)<br />
Joe Nemechek, NASCAR Nextel Cup driver<br />
Howard Marshall, NASA scientist<br />
Lindsey Alley, former Mouseketeer & actress<br />
Matt Diaz, Major League baseball player<br />
Forrest Sawyer, ABC and NBC news anchor<br />
John Daniel Sumner, American singer/songwriter<br />
Neva Jane Langley, Miss America<br />
Dr. John S. Jackson, 1st Black Mayor<br />
Neva Jane Langley<br />
Dr. John Jackson<br />
A-20 Fiscal Year <strong>2008</strong> Annual Budget
History <strong>of</strong> <strong>Lakeland</strong><br />
Arts and Entertainment:<br />
• Polk Theatre - built in 1927. It was restored in 1999 and is supported by revenue from films, its<br />
Performing Art Series, fundraising, rental income and memberships.<br />
• Imperial Symphony Orchestra - in 1965 a group <strong>of</strong> musicians, led by Florida<br />
Southern College pr<strong>of</strong>essor Dr. Ken Anderson and <strong>Lakeland</strong> businessman Jay<br />
Erwin, organized an orchestra to provide classical music for the community.<br />
Today that small effort has grown into a highly polished, regional orchestra that<br />
plays 15 concerts each season.<br />
• Polk Museum <strong>of</strong> Art - The Junior Welfare League founded the all-volunteer<br />
Imperial Youth Museum in 1966. In 1969, the museum was renamed Polk Public Museum to reflect<br />
the broadened emphasis on history and science. It functions as a cultural arts center for the general<br />
public.<br />
• Pied Piper Players - <strong>Lakeland</strong> Community Theatre is known for its high production values and<br />
variety <strong>of</strong> repertoire. Now in its 20th year, Pied Piper Players events each year include its Main<br />
Stage Series, Theatre For Youth Series, Alternative Stage Series and a<br />
number <strong>of</strong> special events throughout the year.<br />
In short, linking <strong>Lakeland</strong>’s past to present reveals that its natural resources,<br />
infrastructure development, favorable climate and location as a popular Florida<br />
destination will continue to attract the quality <strong>of</strong> people that have made it a<br />
historically rich and prosperous city.<br />
Music on the Promenade<br />
Interesting Facts…<br />
The <strong>Lakeland</strong> News was the first newspaper in <strong>Lakeland</strong> and<br />
second in the county.<br />
The first school in town was called ‘The Academy’ located on<br />
the corner <strong>of</strong> Tennessee and Lime.<br />
There are 13 named “natural” lakes in <strong>Lakeland</strong>.<br />
The first Red Lobster restaurant was opened in <strong>Lakeland</strong>.<br />
Elvis Presley performed at the Polk Theater on August 6,<br />
1956.<br />
<strong>Lakeland</strong> was recognized nationally by Money Magazine as<br />
the 10th “Best Place to Live in America” for 1998.<br />
Sources:<br />
Dunn, H.; <strong>Lakeland</strong>: A Pictorial History; The Donning Company, Norfolk Virginia; 1990.<br />
<strong>City</strong> <strong>of</strong> <strong>Lakeland</strong>; <strong>Lakeland</strong> Room Special Collections: A Brief History <strong>of</strong> <strong>Lakeland</strong> Florida; 2007<br />
Wikipedia; History <strong>of</strong> <strong>Lakeland</strong> Florida; 2007<br />
Flekke, M. M. and MacDonald, R.M.; <strong>Lakeland</strong>: Postcard History Series; 2005<br />
Publix History<br />
The Ledger<br />
Various <strong>City</strong> documents and memoranda<br />
Brooke Pottery; History <strong>of</strong> the <strong>Lakeland</strong> Swans<br />
A-21 Fiscal Year <strong>2008</strong> Annual Budget
Glossary <strong>of</strong> Terms<br />
The budget document uses many terms and words that have specific meaning in the context <strong>of</strong><br />
governmental finance or to the <strong>City</strong> <strong>of</strong> <strong>Lakeland</strong>. The glossary defines words and terms that may have very<br />
specific meaning or may not be in common usage.<br />
Accrual basis: A basis <strong>of</strong> accounting using the economic resources measurement focus. Revenues are<br />
recorded when earned. Expenses are recorded when a liability is incurred. Fixed assets are capitalized<br />
(i.e. recorded on the balance sheet, not the income statement). Depreciation is recorded on fixed assets.<br />
Ad Valorem Taxes: Taxes levied on both real and personal property according to the property’s valuation<br />
and the tax rate.<br />
Activity: A specific and distinguishable service performed by one or more organizational components <strong>of</strong><br />
the <strong>City</strong> to accomplish a function for which the <strong>City</strong> is responsible.<br />
Adoption: The formal action taken by the <strong>City</strong> Commission to authorize or approve the budget.<br />
American Public Power Association (APPA): A service organization for the nation's more than<br />
2,000 community-owned electric utilities that serve more than 43 million Americans.<br />
Appropriation: The spending limit adopted or authorized by the <strong>City</strong> Commission.<br />
Available (Undesignated) Fund Balance: Refers to the funds remaining from the prior year, which are<br />
available for appropriation and expenditure in the current year.<br />
Bad Debt: The estimated amount <strong>of</strong> accounts owed to the <strong>City</strong> (receivables) that will not be collected<br />
during the year. This includes utility accounts, accident damage repair accounts and other miscellaneous<br />
account receivables, which are deemed uncollectible.<br />
Budget: A financial plan approved by the <strong>City</strong> Commission that includes estimates for revenues and limits<br />
on expenditures.<br />
Budget Calendar: The schedule <strong>of</strong> key dates that the <strong>City</strong> follows in the preparation and adoption <strong>of</strong> the<br />
budget.<br />
Bond: A long term promissory not or IOU. The note includes a specific principal amount and stated<br />
interest rate. Bonds are used to finance capital projects.<br />
General Obligation (G.O.) Bond: A type <strong>of</strong> bond that is backed by the full faith, credit and taxing<br />
power <strong>of</strong> the <strong>City</strong>.<br />
Revenue Bond: A bond that is backed by a particular revenue source such as water user fees.<br />
Capital Assets: Assets <strong>of</strong> significant value and having a useful life <strong>of</strong> several years. Capital assets are<br />
also called fixed assets.<br />
Capital Improvement Plan: A financial plan for the improvement <strong>of</strong> streets, parks, utilities and other major<br />
infrastructure items. The capital budget includes revenue sources and expenditure limits.<br />
Capital Outlay: Fixed assets which have a value <strong>of</strong> $1,000 or more and have a useful economic lifetime <strong>of</strong><br />
more than one year or assets <strong>of</strong> any value if the nature <strong>of</strong> the item is such that it must be controlled for<br />
custody purposes as a fixed asset.<br />
Central Business District (CBD): The core area <strong>of</strong> <strong>Lakeland</strong>’s downtown.<br />
Charges for Services: A user fee or rate levied against a person or entity that has received an identifiable<br />
benefit in exchange. Examples would include bus fare, water usage charges or grave openings.<br />
Collective Bargaining Agreement: A legal contract between the <strong>City</strong> and representative <strong>of</strong> a recognized<br />
bargaining unit for specific terms and conditions <strong>of</strong> employment (e.g. hours, working conditions, salary,<br />
fringe benefits, and matters affecting health and safety <strong>of</strong> employees).<br />
A-22 Fiscal Year <strong>2008</strong> Annual Budget
Glossary <strong>of</strong> Terms<br />
Component Unit: A legally separate organization for which the elected <strong>of</strong>ficials <strong>of</strong> the <strong>City</strong> are financially<br />
accountable. A component unit can be another organization for which the nature and significance <strong>of</strong> its<br />
relationship with the <strong>City</strong> is such that exclusion would cause the reporting entity’s financial statements to be<br />
misleading or incomplete.<br />
Contractual Services: Services rendered to the <strong>City</strong> by private firms, individuals, or other governmental<br />
agencies (e.g. maintenance agreements and pr<strong>of</strong>essional consulting services).<br />
Contingency: A budgetary reserve for emergencies or unanticipated expenditures/opportunities.<br />
Debt Service: Principal and interest payments for outstanding debt such as bonds or notes payable.<br />
Dedicated Tax: A tax levied to support a specific government program or purpose.<br />
Deficit: The excess <strong>of</strong> an entity’s liabilities over its assets or the excess <strong>of</strong> expenditures or expenses over<br />
revenues during a single accounting period.<br />
Department: Organizational unit <strong>of</strong> government, which is functionally unique in its delivery <strong>of</strong> services.<br />
Depreciation: The portion <strong>of</strong> the cost <strong>of</strong> a fixed asset (i.e. a car or treatment plant) charged as an expense<br />
during the fiscal year. Eventually the entire cost <strong>of</strong> the fixed asset will be charged <strong>of</strong>f as an expense. Only<br />
Enterprise and Internal Service funds have depreciation.<br />
Employee Benefits: Costs incurred by the <strong>City</strong> for pension, health insurance, and other benefits provided<br />
to employees.<br />
Encumbrance: Recognition in the accounting system that the <strong>City</strong> has committed to buy or pay for goods<br />
or services.<br />
Expenditure: The payment <strong>of</strong> cash or the transfer <strong>of</strong> property or services for the purpose <strong>of</strong> acquiring<br />
goods and/or services or settling a loss.<br />
Expense: Charges incurred (whether paid immediately or to be paid at a later date) for operations,<br />
maintenance, interest or other charges.<br />
Fiscal Year: The time period for which the budget is authorized and measured by the accounting records.<br />
The <strong>City</strong> <strong>of</strong> <strong>Lakeland</strong>’s fiscal year begins on October 1 st and ends on September 30 th .<br />
Florida Municipal Power Agency (FMPA): A wholesale power company owned by municipal electric<br />
utilities. FMPA provides economies <strong>of</strong> scale in power generation and related services to support<br />
community-owned electric utilities.<br />
Full-Time Equivalent (FTE): The number <strong>of</strong> employee hours (2080) needed to be equal to one full-time<br />
employee. Several part-time employees may be combined to make one full-time equivalent.<br />
Fund: A fiscal and accounting entity with a self-balancing set <strong>of</strong> accounts recording cash and other<br />
financial resources.<br />
Enterprise Fund: Certain activities are treated as self-supporting businesses (e.g. water and<br />
sewer utilities). The accounting for these activities is accounted for in separate funds called<br />
enterprise funds.<br />
Debt Service Fund: Funds used to record the payment <strong>of</strong> general debt.<br />
General Fund: General purpose fund supported by taxes, fees and other revenues. The funds<br />
may be used for any lawful purpose.<br />
Internal Service Fund: Centralized services that serve all or many established in separate funds.<br />
The other funds are charged a fee for the services provided by the Internal Service Fund.<br />
Special Revenue Fund: A fund used to account for the revenues and expenditures <strong>of</strong> special<br />
earmarked or legally restricted monies.<br />
Stormwater Fund: Revenues, received primarily through the collection <strong>of</strong> residential and<br />
commercial fees as well as transfers from the Transportation Fund for drainage and lake projects,<br />
are used for projects approved by the <strong>City</strong> Commission for stormwater capital activities.<br />
A-23 Fiscal Year <strong>2008</strong> Annual Budget
Glossary <strong>of</strong> Terms<br />
Fund Balance: The difference between a fund’s assets and liabilities, sometimes referred to as the<br />
amount carried over from one year to the next year.<br />
Generally Accepted Accounting Principles (GAAP): Uniform minimum standards for financial<br />
accounting and recording, encompassing the conventions, rules and procedures that define accepted<br />
accounting principles.<br />
Goal: A broad statement <strong>of</strong> direction or purpose. A goal is general and <strong>of</strong>ten timeless in nature.<br />
Indirect Cost: A cost necessary for the functioning <strong>of</strong> the organization as a whole that can not be directly<br />
assigned to one service.<br />
Infrastructure: Vital facilities such as roads, sewers, bridges, water lines, public buildings, parks and<br />
airports that are fixed in location.<br />
Inter-Fund Transfer: Legally authorized transfers from a fund receiving revenue to a fund through which<br />
resources are to be expected.<br />
Intergovernmental: Revenue from another governmental agency such as the State <strong>of</strong> Florida or the<br />
United States Federal Government. Some revenues from local units are treated as Charges for Service.<br />
<strong>Lakeland</strong> Area Mass Transit District: A component unit <strong>of</strong> the <strong>City</strong> that accounts for all activities<br />
necessary to provide modern bus transportation in the <strong>Lakeland</strong> area. The <strong>City</strong> does not have any<br />
ownership claim against the assets <strong>of</strong> this entity; however, the <strong>City</strong> does maintain some control over<br />
operations in that the majority <strong>of</strong> its governing board is composed <strong>of</strong> members <strong>of</strong> the <strong>City</strong> Commission.<br />
<strong>Lakeland</strong> Downtown Development Authority: A Component Unit <strong>of</strong> the <strong>City</strong> that has the responsibility <strong>of</strong><br />
improving the economic condition in the Central Business District.<br />
Mill: One one-thousandth <strong>of</strong> a dollar <strong>of</strong> assessed value.<br />
Millage: Rate used in calculating taxes based upon the value <strong>of</strong> the property, expressed in mills per dollar<br />
<strong>of</strong> property value.<br />
Mission: A description <strong>of</strong> the purpose, values, strategies, and behavior standards that guide an<br />
organization and move it toward its vision. A mission states what the organization is, what it does, for<br />
whom and why.<br />
Modified Accrual: A basis <strong>of</strong> accounting using the current financial resources as a measurement focus.<br />
Revenues are recognized when both measurable and available. Expenditures are recorded when a liability<br />
is incurred. Fixed assets are recorded as an expenditure in the period the asset is acquired.<br />
Objective: A specific/quantifiable statement <strong>of</strong> what the <strong>City</strong>, a department or a unit expects to accomplish<br />
in a fiscal year.<br />
Outcome: Desired output oriented accomplishments, which can be measured and achieved within a set<br />
time-period. Achievement <strong>of</strong> the outcome advances the organization toward a goal.<br />
Operating Budget: The day-to-day cost <strong>of</strong> providing <strong>City</strong> services. The operating budget does not include<br />
capital purchases, for items <strong>of</strong> $1,000 or greater.<br />
Peace River Water Basin: The Peace River Basin is the region <strong>of</strong> land in Central and Southwest Florida<br />
that includes portions <strong>of</strong> Charlotte, Hardee, Desoto, Highlands and Polk Counties from which water drains<br />
into the lakes and streams that ultimately supplies water to the Peace River.<br />
Program: Group activities, operations or organizational units directed to attaining specific purposes or<br />
objectives.<br />
Property Tax: A tax levied on real estate as well as commercial and industrial personal property based on<br />
the value <strong>of</strong> the property.<br />
A-24 Fiscal Year <strong>2008</strong> Annual Budget
Glossary <strong>of</strong> Terms<br />
Repurchase Agreements: An agreement where the <strong>City</strong> transfers cash to a broker-dealer or bank; the<br />
broker-dealer or bank transfers the securities to the <strong>City</strong> and promises to repay the cash plus interest in<br />
exchange for the same securities.<br />
Retreat: <strong>City</strong> Commission goal setting meeting held around January <strong>of</strong> each year. <strong>City</strong> Manager<br />
communicates <strong>City</strong> Commission goals and sets parameters for budget preparation with Department heads.<br />
Revenue: Money coming into a fund (other than a transfer) such as taxes, user fees, grants, fines and any<br />
other source <strong>of</strong> money.<br />
Southwest Florida Water Management District (SWFMD): Responsible for water resources in sixteen<br />
west central Florida counties: Charlotte, Citrus, DeSoto, Hardee, Hernando, Highlands, Hillsborough, Lake,<br />
Levy, Manatee, Marion, Pasco, Pinellas, Polk, Sarasota and Sumter.<br />
Special Assessment: A compulsory levy made against certain properties to defray all or part <strong>of</strong> the cost <strong>of</strong><br />
a specific capital improvement or service deemed to benefit primarily those properties.<br />
Tax Levy: The total amount <strong>of</strong> revenue raised from general property taxes.<br />
Tax Rate: The amount <strong>of</strong> tax levied for each $1,000 <strong>of</strong> assessed valuation. Often called millage rate.<br />
Transfer: A transfer is movement <strong>of</strong> money or assets from one fund to another that is not a payment for<br />
service. Sometimes a transfer is one fund subsidizing another fund.<br />
User Fee: Revenue paid by a party directly benefiting from the use <strong>of</strong> receipt <strong>of</strong> a public service.<br />
Did you know…<br />
In 1990 <strong>Lakeland</strong> made its Hollywood debut<br />
when the Southgate Shopping Center was<br />
featured in the hit movie Edward Scissorhands<br />
starring Johnny Depp and Winona Ryder.<br />
A-25 Fiscal Year <strong>2008</strong> Annual Budget
Abbreviations & Acronyms<br />
AADF Annual Average Daily Flow<br />
ACH Automated Clearing House<br />
AD&D Accidental Death & Dismemberment<br />
AP Accounts Payable<br />
ADA Americans with Disabilities Act<br />
ALS Advance Life Support<br />
AMI Average Median Income<br />
AOA Airport Operating Area<br />
APPA American Public Power Association<br />
ARA Aramark Food Services<br />
ARFF Aircraft Rescue & Fire Fighting<br />
ATC Airport Traffic Control<br />
BCE Business Cooperative Education<br />
BICEP Building Inspection Code Enforcement Program<br />
BITS Building Inspection Transportable System<br />
BEBR Bureau <strong>of</strong> Economic & Business Research<br />
BJA Bureau <strong>of</strong> Justice Assistance<br />
BLS Basic Life Support<br />
BMP Best Management Practices<br />
BOD Biological Oxygen Demand<br />
CACO3 Calcium Carbonate<br />
CADD Computer Assisted Design and Drafting<br />
CAFR Comprehensive Annual Financial Report<br />
CAIR Clean Air Interstate Rule<br />
CBD Commercial Business District<br />
CBE Cooperative Business Education<br />
CBIR Community Budget Issue Request<br />
CDBG Community Development Block Grant<br />
CDC Community Development Corporation<br />
CIP Capital Improvement Plan<br />
CPI Consumer Price Index<br />
CIS Criminal Investigations<br />
CLMP Comprehensive Lakes Management Plan<br />
CM <strong>City</strong> Manager<br />
COLA Cost <strong>of</strong> Living Allowance<br />
CPR Cardiopulmonary Resuscitation<br />
CRA Community Redevelopment Agency<br />
CROW Contracts Right <strong>of</strong> Way<br />
CSU Community Services Unit<br />
DARE Drug Abuse Resistance Education<br />
DART Domestic Abuse Response Team<br />
DCA Department <strong>of</strong> Community Affairs<br />
DEP Department <strong>of</strong> Environmental Protection<br />
DOT Department <strong>of</strong> Transportation<br />
DNA Dinoclaustic Neuclic Acid<br />
DoIt Department <strong>of</strong> Information Technology<br />
DOJ Department <strong>of</strong> Justice<br />
DRI Development <strong>of</strong> Regional Impact<br />
DRT Design Review Team<br />
DUI Driving Under the Influence<br />
DV Digital Video<br />
EAA Experimental Aircraft Association<br />
ECS Emergency Communications Specialists<br />
EMS Energy Management System<br />
EMT Emergency Medical Technicians<br />
ED WMIS Energy Delivery Work Order Management<br />
Information System<br />
EPA Environmental Protection Agency<br />
EVDO Evolution Data Optimized<br />
EZ Enterprise Zone<br />
FAA Federal Aviation Authority<br />
FAR Federal Aviation Regulation<br />
FDLE Federal Department <strong>of</strong> Law Enforcement<br />
FDOT Florida Department <strong>of</strong> Transportation<br />
FEMA Federal Emergency Management Agency<br />
FHFC Florida Housing Finance Corporation<br />
FHSAA Florida High School Athletic Association<br />
FLC Florida League <strong>of</strong> Cities<br />
FMPA Florida Municipal Power Agency<br />
FMPP Florida Municipal Power Pool<br />
FOAG Florida Office <strong>of</strong> the Attorney General<br />
FRCC Florida Reliability Coordinating Council<br />
FRDAP Florida Recreation Development Assistance Program<br />
FT Full-Time<br />
FTE Full-Time Equivalent<br />
FWC Florida Water Conservation<br />
FY Fiscal Year<br />
GAAP Generally Accepted Accounting Principles<br />
GASB Governmental Accounting Standards Board<br />
GFOA Government Finance Officers Association<br />
GIS/CAD Geographic Information System/Computer Aided<br />
Design<br />
GKS General Knowledge Study<br />
GM General Manager<br />
GPS Global Positioning System<br />
gWh Giga-watt Hour<br />
HHR Hurricane Housing Relief<br />
HOME HOME Investment Partnership Program<br />
HR Human Resources<br />
HVAC Heating, Ventilation & Air Condition<br />
HRMS Human Resources Management System<br />
IDS Intrusion Detection System<br />
ILS Instrument Landing System<br />
IRP Integrated Resource Plan<br />
IT Information Technology<br />
JSS Juvenile Services<br />
KIO Key Intended Outcome<br />
KSI Key Success Indicator<br />
kWh Kilowatt Hour<br />
LAC <strong>Lakeland</strong> Airside Center<br />
LDDA <strong>Lakeland</strong> Downtown Development Authority<br />
A-26 Fiscal Year <strong>2008</strong> Annual Budget
Abbreviations & Acronyms<br />
LDR<br />
LEAD<br />
LEDC<br />
LFD<br />
LGN<br />
LLC<br />
LLRA<br />
LPD<br />
LTC<br />
LTMA<br />
M/WBE<br />
MDT<br />
MGD<br />
MLK<br />
MSG<br />
MSTU<br />
MSW<br />
MWA<br />
NAMI<br />
NCAN<br />
NERC<br />
NET<br />
NLC<br />
NPDES<br />
O&M<br />
OCAT<br />
OH<br />
OMB<br />
OMS<br />
OSG<br />
OUC<br />
P&R<br />
PAL<br />
PCC<br />
PCCVB<br />
PCD<br />
PDA<br />
PIAT<br />
PIF<br />
PM<br />
PSC<br />
PW<br />
PSN<br />
PT<br />
PUD<br />
QTI<br />
R&R<br />
ROI<br />
SAIDI<br />
SANS<br />
Land Development Regulation<br />
Lakes Education Action Drive<br />
<strong>Lakeland</strong> Economic Development Council<br />
<strong>Lakeland</strong> Fire Department<br />
<strong>Lakeland</strong> Government Network<br />
Limited Liability Corporation<br />
<strong>Lakeland</strong> Linder Regional Airport<br />
<strong>Lakeland</strong> Police Department<br />
Long Term Capital<br />
Long Term Maintenance Agreement<br />
Minority/Women-Owned Business Enterprises<br />
Mobile Data Terminal<br />
Million Gallons per Day<br />
Martin Luther King<br />
Main Street Garage<br />
Municipal Service Taxing Unit<br />
Municipal Solid Waste<br />
Maintenance Water Administration<br />
National Alliance for the Mentally Ill <strong>of</strong> Polk County<br />
National College Access Network<br />
N. American Reliability Corporation<br />
Neighborhood Enforcement Team<br />
National League <strong>of</strong> Cities<br />
National Pollution Discharge Elimination System<br />
Operating & Maintenance<br />
Organizational Communications Advisory Team<br />
Overhead<br />
Office <strong>of</strong> Management & Budget<br />
Outage Management System<br />
Orange Street Garage<br />
Orlando Utility Commission<br />
Parks and Recreation<br />
Police Athletic League<br />
Polk Community College<br />
Polk County Convention & Visitors Bureau<br />
Pollution Control Device<br />
Personal Digital Assistants<br />
Process Improvement Advisory Team<br />
Public Improvement Fund<br />
Preventative Maintenance<br />
Public Service Commission<br />
Public Works<br />
Project Safe Neighborhood<br />
Part-Time<br />
Planned Unit Development<br />
Qualified Target Industry<br />
Repair and Replace<br />
Return on Investment<br />
System Average Interruption Duration Index<br />
Storage Area Network<br />
SCADA System Control Data Acquisition<br />
SEOC State Emergency Operation Center<br />
SHIP State Housing Initiative Program<br />
SIS Special Investigations<br />
SOAT Strategic Operating Activity Team<br />
SOP Strategic Operating Plan<br />
SOS Special Operations Section<br />
SPCC Simpson Park Community Center<br />
SRO School Resource Officer<br />
SWFWMD Southwest Florida Water Management<br />
District<br />
SWAT Special Weapons and Tactics<br />
SWOT Strengths-Weaknesses-Opportunities<br />
Threats<br />
TBD To Be Determined<br />
T&D Transmission & Delivery<br />
TAC Targeted Areas <strong>of</strong> Concentration<br />
TD Tourist Development<br />
TDT Tourist Development Tax<br />
TEA-LU Transportation Efficiency Act-A Legacy for<br />
Users<br />
TECO Tampa Electric Company<br />
TIP Truancy Interdiction Program<br />
TMDL Total Maximum Daily Load<br />
TO Table <strong>of</strong> Organization<br />
TPO Transportation Planning Organization<br />
U&CF Urban & Community Forestry<br />
UCM United Conference <strong>of</strong> Mayors<br />
UG Underground<br />
UMS Utility Management System<br />
USEPA United States Environmental Protection<br />
Agency<br />
USF University <strong>of</strong> South Florida<br />
UT Utility Tax<br />
VISTE Volunteers in Service to the Elderly<br />
VOCA Victims <strong>of</strong> Crime Act<br />
VTR Video Tape Recorder<br />
WA Water<br />
WC Workers Comp<br />
WTP Water Treatment Plant<br />
WW Wastewater<br />
WWTP Wastewater Treatment Plant<br />
YTD Year to Date<br />
Did you know….<br />
<strong>Lakeland</strong> has over 8.5 million<br />
people within a 100-mile radius.<br />
A-27 Fiscal Year <strong>2008</strong> Annual Budget
THIS PAGE IS INTENTIONALLY BLANK
Table <strong>of</strong> Contents<br />
Budget Overview............................................................................... Section—B<br />
Budget Highlights.................................................................................B-2<br />
Budget Summary (Graphs/Charts)......................................................B-6<br />
Truth in Millage (TRIM) Notification ..................................................B-12<br />
Ad Valorem Taxes ..............................................................................B-13<br />
Staffing Changes ................................................................................B-14<br />
Employee/Population Growth............................................................B-15<br />
Overview and Financial Policies .......................................................B-16<br />
Budget Process Overview .................................................................B-20<br />
B-1 Fiscal Year <strong>2008</strong> Annual Budget
Budget Highlights<br />
Introduction<br />
The Fiscal Year <strong>2008</strong> Annual<br />
Budget, which was adopted on<br />
September 17, 2007, is a numerical<br />
reflection <strong>of</strong> the Fiscal Year <strong>2008</strong><br />
Business Plan. By allocating our<br />
resources through a balanced<br />
combination <strong>of</strong> strategic alignment<br />
with the Commissioner’s thirteen<br />
Outcomes and departmental<br />
performance Key Success<br />
Indicators, we believe this budget<br />
will successfully meet the challenges<br />
we have before us and set the stage<br />
for our continued success in the<br />
future.<br />
Budget in Brief<br />
The adopted net operating budget<br />
for Fiscal Year <strong>2008</strong> for all funds<br />
totals $596,447,887. This<br />
represents an increase <strong>of</strong><br />
$9,101,072 or 1.5% over the Fiscal<br />
Year 2007 budget. The Fiscal Year<br />
<strong>2008</strong> budget is balanced, prudent,<br />
and responsive to community needs<br />
as identified in the <strong>2008</strong> Strategic<br />
Plan.<br />
Budget Highlights<br />
Some factors that contributed to the<br />
changes in the budget are:<br />
• Adoption <strong>of</strong> the rolled-back<br />
property tax millage rate <strong>of</strong><br />
3.2942 - this represents a 7%<br />
reduction from the prior year<br />
millage rate <strong>of</strong> 3.545 mills and<br />
reduces property tax revenues<br />
by approximately $1.4 million for<br />
FY <strong>2008</strong>.<br />
• Increased subsidy <strong>of</strong> general<br />
governmental operating costs<br />
from <strong>Lakeland</strong> Regional Medical<br />
Center (LRMC) lease revenue<br />
from $1.9 to $3 million from FY<br />
2007 to <strong>2008</strong>.<br />
• Freezing spending for non-payroll<br />
operating and maintenance costs<br />
at 2007 levels.<br />
• S<strong>of</strong>t freeze on hiring<br />
replacements for positions that<br />
become vacant during <strong>2008</strong>.<br />
• Elimination <strong>of</strong> the $1.6 million<br />
subsidy <strong>of</strong> Lakes and Stormwater<br />
expenses from gas tax revenues<br />
and general fund revenues. This<br />
change in strategy required an<br />
increase in the stormwater fee<br />
from $2.00 to $4.50 per ERU in<br />
order to make that fund selfsufficient.<br />
This change provided<br />
funding for an increased level <strong>of</strong><br />
effort for street resurfacing,<br />
sidewalk programs and funding<br />
for a portion <strong>of</strong> the debt service<br />
costs associated with<br />
construction <strong>of</strong> the East-West<br />
roadway extension.<br />
B-2 Fiscal Year <strong>2008</strong> Annual Budget
Budget Highlights<br />
• A 2.5% across-the-board increase in<br />
salaries for those employees not in a<br />
collective bargaining unit.<br />
• Additional borrowing <strong>of</strong> approximately<br />
$45 million to finance capital<br />
improvements within <strong>Lakeland</strong><br />
Electric.<br />
• Expiration <strong>of</strong> a wholesale sales<br />
power sales contract between <strong>Lakeland</strong><br />
Electric and FMPA in December<br />
2007, eliminating losses thereafter in<br />
conjunction with the arrangement.<br />
Did you know…<br />
In the winter <strong>of</strong> 1888,<br />
H.S. Galloway demonstrated the<br />
pr<strong>of</strong>itable character <strong>of</strong> the<br />
strawberry crop and its adaptation<br />
to this area by netting over $600<br />
from a single acre <strong>of</strong> strawberries.<br />
• Progress on a variety <strong>of</strong> capital projects within the Wastewater System,<br />
which were financed from the proceeds <strong>of</strong> a low interest loan from the<br />
Florida Department <strong>of</strong> Environmental Protection:<br />
− Projects Completed:<br />
* Class A Sludge Stabilization - $10.1 million<br />
* Northside Plant Chlorine Contact Chamber - $2.2 million<br />
* Initial phase <strong>of</strong> West <strong>Lakeland</strong> Forcemain Expansion - $2.3 million<br />
− Projects Commencing in FY <strong>2008</strong>:<br />
* West <strong>Lakeland</strong> Pretreatment Facility - $16 million<br />
* Second phase <strong>of</strong> West <strong>Lakeland</strong> collection system expansion - $9.6<br />
million<br />
Funding for the additional annual debt service for these projects required a<br />
7.5% increase in flow and high strength surcharge rates effective October 1,<br />
2007.<br />
Capital Improvements<br />
The Capital Improvement Program (CIP) elements for Fiscal Year <strong>2008</strong> is programmed<br />
at $99,289,931. This amount consists <strong>of</strong> $38,834,425 in General<br />
Governmental capital and $60,905,506 in Proprietary Fund capital.<br />
The <strong>Lakeland</strong> Electric Fund budget also includes another $25 million to be financed<br />
from a portion <strong>of</strong> the proceeds <strong>of</strong> a new revenue bond issue to be sold<br />
in the Spring <strong>of</strong> <strong>2008</strong>.<br />
B-3 Fiscal Year <strong>2008</strong> Annual Budget
Budget Highlights<br />
Major Policy Considerations<br />
Outcomes<br />
The Outcomes support our Business Plan and Operational<br />
Budget by tightly linking programs to Key Success Indicators<br />
and their performance measures. The present Strategic Plan<br />
is on an annual cycle.<br />
The Commission’s Annual Retreat in January 2007 produced<br />
three changes to the <strong>City</strong>’s Outcomes and Strategic Priorities.<br />
First, in the Economic Opportunity Goal a strategy was<br />
added to the Enriched Community Workforce Outcome,<br />
“Promote Improving Level <strong>of</strong> Education” to better reflect the<br />
<strong>City</strong>’s overall Economic Opportunity Goal. Second, the name<br />
<strong>of</strong> the outcome “Support Community Arts, Wellness & Recreation”<br />
was changed to “Support the Arts and Wellness” and<br />
recreation was then added to the strategy “Promote public/<br />
private partnerships to develop public recreation paces”.<br />
This change allowed for a better focused set <strong>of</strong> Actions.<br />
These changes, along with the new Key Success Indicators<br />
(KSI’s) that resulted, helped to provide vision and direction for<br />
the <strong>City</strong> in the form <strong>of</strong> this year’s Business Plan. With the 13<br />
Outcomes set, and appropriate strategies identified, the<br />
operations <strong>of</strong> the <strong>City</strong> are reviewed and redeployed to bring<br />
the strategic vision to life. While the strategic priorities have<br />
evolved over the last couple years, true to the spirit <strong>of</strong><br />
continuous improvement, they still link our day-to-day<br />
activities with the mission that we aspire to achieve.<br />
Financial Forecasting<br />
One <strong>of</strong> the most effective tools we use to manage future<br />
financial risk and protect ourselves from the unintended<br />
consequences <strong>of</strong> short-term decisions is our Forecasting<br />
Model. Revenues are projected at conservative levels and<br />
compared to estimated cost increases in payroll, operating<br />
expenditures, and capital outlay. The purpose <strong>of</strong> this<br />
financial exercise is to adequately prepare for future<br />
challenges, so it is always conservative in outlook. Using this<br />
tool helps keep us focused on long-term solutions, rather<br />
than short-term “fixes”, which could lead to negative financial<br />
impacts in future years. It is important to note that the <strong>City</strong>’s<br />
budget has always been balanced.<br />
<strong>2008</strong> Outcomes<br />
Enriched Organization Workforce<br />
Enriched Community Workforce<br />
Sustainable Business Environment<br />
Informed and Engaged Employees<br />
Informed and Engaged Community<br />
Optimal Management <strong>of</strong> Existing<br />
Financial Resources<br />
Develop New Financial Resources<br />
Quality Developments<br />
Safe, Attractive Neighborhoods<br />
Quality Public Spaces<br />
Superior Municipal Services<br />
Support the Arts and Wellness<br />
Support Education<br />
B-4 Fiscal Year <strong>2008</strong> Annual Budget
THIS PAGE IS INTENTIONALLY BLANK
Budget Summary<br />
Fiscal Year <strong>2008</strong><br />
Revenue Sources<br />
Charges for Services $ 483,475,291<br />
Miscellaneous 38,799,187<br />
Public Service, Communications and Gasoline Taxes 22,682,442<br />
Intergovernmental 23,917,593<br />
Property Taxes 17,378,088<br />
Licenses and Permits 4,177,458<br />
Fines and Forfeits 976,500<br />
Prior Years Surplus 5,041,328<br />
Total Revenues $ 596,447,887<br />
Miscellaneous<br />
7%<br />
Public Service,<br />
Communications and<br />
Gasoline Taxes<br />
4%<br />
Intergovernmental<br />
4%<br />
Property Taxes<br />
3%<br />
Licenses and<br />
Permits<br />
1%<br />
Fines and Forfeits<br />
1%<br />
Prior Years Surplus<br />
1%<br />
Charges for Services<br />
76%<br />
B-6 Fiscal Year <strong>2008</strong> Annual Budget
Budget Summary<br />
Fiscal Year <strong>2008</strong><br />
Expenditures by Area<br />
Environmental and Utility Services $ 459,972,203<br />
Community Safety 54,622,124<br />
Parks, Recreation and Properties 26,409,609<br />
Transportation Services 23,280,154<br />
Cultural and Community Services 14,749,719<br />
Economic and Community Development 16,502,382<br />
Legislative Activities 911,696<br />
Total Expenditures $ 596,447,887<br />
Community Safety<br />
9%<br />
Parks, Recreation<br />
and Properties<br />
4%<br />
Transportation<br />
Services<br />
4%<br />
Cultural and<br />
Community<br />
Services<br />
2%<br />
Economic and<br />
Community<br />
Development<br />
3%<br />
Legislative Activities<br />
1%<br />
Environmental and<br />
Utility Services<br />
76%<br />
B-7 Fiscal Year <strong>2008</strong> Annual Budget
Budget Summary<br />
Fiscal Year <strong>2008</strong><br />
Expenses by Account<br />
Fuel and Purchased Power $ 226,738,440<br />
Personnel 114,819,203<br />
Capital Outlay 80,461,202<br />
Debt Service 61,091,370<br />
All Other Operations and Maintenance 45,117,647<br />
Internal Service Charges 33,288,067<br />
Pr<strong>of</strong>essional and Contractual 14,903,377<br />
Utilities 13,639,409<br />
Insurance and Fixed Charges 6,389,172<br />
$ 596,447,887<br />
Internal Service<br />
Charges<br />
6%<br />
Pr<strong>of</strong>essional and<br />
Contractual<br />
2%<br />
Utilities<br />
2%<br />
Insurance and Fixed<br />
Charges<br />
1%<br />
All Other Operations<br />
and Maintenance<br />
8%<br />
Fuel and Purchased<br />
Power<br />
41%<br />
Debt Service<br />
10%<br />
Capital Outlay<br />
13%<br />
Personnel<br />
19%<br />
B-8 Fiscal Year <strong>2008</strong> Annual Budget
Budget Summary by Fund<br />
Fiscal Year <strong>2008</strong><br />
General<br />
Fund<br />
Special<br />
Revenue<br />
Funds<br />
Debt Service<br />
Fund<br />
Capital<br />
Project<br />
Funds<br />
Enterprise<br />
Funds Total<br />
Revenue<br />
Property Taxes 18,686,678 18,686,678<br />
Public Service, Communications and<br />
Gasoline Taxes 15,587,852 10,236,000 25,823,852<br />
Licenses and Permits 4,177,458 4,177,458<br />
Intergovernmental 10,372,061 1,891,622 6,401,070 1,769,840 20,434,593<br />
Charges for Services 3,044,162 3,867,407 476,441,469 483,353,038<br />
Fines and Forfiets 791,500 68,000 859,500<br />
Miscellaneous 1,907,106 153,000 15,884,623 20,126,713 38,071,442<br />
Total Revenue 54,566,817 2,044,622 36,389,100 498,406,022 591,406,561<br />
Expenditures<br />
Economic and Community Development<br />
8,925,255 1,992,549 5,389,578 195,000 16,502,382<br />
Community Safety 51,796,366 - 280,001 2,545,757 54,622,124<br />
Transportation Services 7,153,062 220,000 79,897 9,330,000 6,497,194 23,280,154<br />
Legislative Activities 876,696 35,000 911,696<br />
Environmental and Utility Services - 5,920,299 454,051,904 459,972,203<br />
Cultural and Community Services 5,516,167 132,073 387,161 8,899,203 14,934,604<br />
Parks, Recreation and Properties 14,695,055 - 8,449,365 3,080,304 26,224,724<br />
Total Expenditures 88,962,601 2,344,622 359,898 32,057,160 472,723,606 596,447,887<br />
Transfers In 34,884,637 359,898 420,000 3,761,302 39,425,837<br />
Transfers Out (2,180,969) (5,992,265) (31,252,603) (39,425,837)<br />
32,703,668 359,898 (5,572,265) (27,491,301)<br />
Addition to/(Reduction <strong>of</strong>) Fund Balance (1,692,116) (300,000) - (1,240,325) (1,808,885) (5,041,326)<br />
B-9 Fiscal Year <strong>2008</strong> Annual Budget
Summary <strong>of</strong> All Funds<br />
Fiscal Year <strong>2008</strong><br />
PROPOSED<br />
BUDGET<br />
LESS<br />
INTRACITY<br />
TRANSACTIONS<br />
NET<br />
BUDGET<br />
Revenues<br />
General $ 91,143,570 $ 34,884,637 $ 56,258,933<br />
Transportation 10,421,261 10,421,261<br />
Stormwater Utility 5,920,299 5,920,299<br />
Public Improvement 16,296,543 350,000 15,946,543<br />
Community Redevelopment Areas 5,411,322 70,000 5,341,322<br />
Community Development 2,344,622 2,344,622<br />
Debt Service 359,898 359,898<br />
Fleet Management 11,881,151 11,881,151<br />
Purchasing and Stores 2,972,491 2,972,491<br />
Facilities Maintenance 4,098,269 4,098,269<br />
Information Technology 12,645,043 12,645,043<br />
Wastewater System 40,195,969 3,703,474 36,492,495<br />
Water Utilities 31,287,926 3,300,000 27,987,926<br />
Parking System 1,273,061 555,333 717,728<br />
The <strong>Lakeland</strong> Center 8,929,254 3,186,020 5,743,234<br />
Cleveland Heights Golf Course 3,080,304 50,000 3,030,304<br />
<strong>Lakeland</strong> Linder Regional Airport 5,294,772 5,294,772<br />
Solid Waste Management 13,819,708 13,819,708<br />
<strong>Lakeland</strong> Electric Utilities 439,744,740 32,616,000 407,128,740<br />
TOTAL $ 707,120,203 $ 110,672,316 $ 596,447,887<br />
All Other<br />
Enterprise Funds<br />
5%<br />
General Fund<br />
9%<br />
All Other<br />
Governmental<br />
Funds<br />
7%<br />
Water /<br />
Wastew ater<br />
Utilities<br />
11%<br />
Electric Utility<br />
68%<br />
B-10 Fiscal Year <strong>2008</strong> Annual Budget
Summary <strong>of</strong> All Funds<br />
Fiscal Year <strong>2008</strong><br />
PROPOSED<br />
BUDGET<br />
LESS<br />
INTRACITY<br />
TRANSACTIONS<br />
NET<br />
BUDGET<br />
Expenditures<br />
General $ 91,143,570 $ 2,180,969 $ 88,962,601<br />
Transportation 10,421,261 1,141,261 9,280,000<br />
Stormwater Utility 5,920,299 5,920,299<br />
Public Improvement 16,296,543 4,414,260 11,882,283<br />
Community Redevelopment Areas 5,411,322 436,744 4,974,578<br />
Community Development 2,344,622 2,344,622<br />
Debt Service 359,898 359,898<br />
Fleet Management 11,881,151 11,881,151<br />
Purchasing and Stores 2,972,491 2,972,491<br />
Facilities Maintenance 4,098,269 4,098,269<br />
Information Technology 12,645,043 12,645,043<br />
Wastewater System 40,195,969 5,668,576 34,527,393<br />
Water Utilities 31,287,926 7,202,143 24,085,783<br />
Parking System 1,273,061 1,273,061<br />
The <strong>Lakeland</strong> Center 8,929,254 30,051 8,899,203<br />
Cleveland Heights Golf Course 3,080,304 3,080,304<br />
<strong>Lakeland</strong> Linder Regional Airport 5,294,772 70,638 5,224,134<br />
Solid Waste Management 13,819,708 1,314,720 12,504,988<br />
<strong>Lakeland</strong> Electric Utilities 439,744,740 56,616,000 383,128,740<br />
TOTAL $ 707,120,203 $ 110,672,316 $ 596,447,887<br />
All Other Enterprise<br />
Funds<br />
5%<br />
General Fund<br />
15%<br />
All Other<br />
Governmental Funds<br />
6%<br />
Water / Wastew ater<br />
Utilities<br />
10%<br />
Electric Utility<br />
64%<br />
B-11 Fiscal Year <strong>2008</strong> Annual Budget
Truth in Millage (TRIM) Notification<br />
Budget Summary<br />
BUDGET SUMMARY<br />
CITY OF LAKELAND - FISCAL YEAR <strong>2008</strong><br />
*THE PROPOSED OPERATING BUDGET EXPENDITURES OF THE CITY OF LAKELAND<br />
ARE 1.55% MORE THAN LAST YEAR'S TOTAL OPERATING EXPENDITURES.<br />
Millage Per $1,000<br />
General Fund 3.2942<br />
GENERAL SPECIAL DEBT ENTERPRISE TOTAL<br />
ESTIMATED REVENUES FUND REVENUE SERVICE FUND BUDGET<br />
Taxes Millage per $1,000<br />
Ad Valorem Taxes 3.2942 16,755,565 - - - 16,755,565<br />
Sales and Use Taxes 17,518,965 5,786,000 - - 23,304,965<br />
Licenses and Permits 4,177,458 - - - 4,177,458<br />
Intergovernmental Revenues 10,372,061 12,742,692 - 1,769,840 24,884,593<br />
Charges for Services 3,044,162 3,867,407 - 476,441,469 483,353,038<br />
Fines & Forfeits 791,500 - - 68,000 859,500<br />
Miscellaneous Revenue 1,907,106 16,037,623 - 20,126,713 38,071,442<br />
TOTAL SOURCES 54,566,817 38,433,722 - 498,406,022 591,406,561<br />
Transfers In 34,884,637 420,000 359,898 43,410,827 79,075,362<br />
Fund Balances/Reserves 1,692,116 1,711,169 2,653,471 6,056,756<br />
TOTAL REVENUES, TRANSFERS AND<br />
BALANCES 91,143,570 40,564,891 359,898 544,470,319 676,538,679<br />
EXPENDITURES<br />
General Government Services 18,936,141 1,364,492 - - 20,300,633<br />
Public Safety 46,327,961 2,249,050 289,260 - 48,866,271<br />
Physical Environment 781,932 5,920,299 - 454,246,903 460,949,134<br />
Transportation 6,455,247 9,280,000 70,638 6,497,195 22,303,080<br />
Economic Environment - 6,801,251 - - 6,801,251<br />
Human Services - 375,164 - - 375,164<br />
Culture/Recreation 16,461,321 8,411,526 - 11,979,507 36,852,354<br />
TOTAL EXPENDITURES 88,962,601 34,401,782 359,898 472,723,605 596,447,887<br />
Transfers Out 2,180,969 5,992,265 - 70,902,128 79,075,362<br />
Fund Balances/Reserves - 170,844 - 844,586 1,015,430<br />
TOTAL APPROPRIATED EXPENDITURES<br />
TRANSFERS, RESERVES AND BALANCES 91,143,570 40,564,891 359,898 544,470,319 676,538,679<br />
THE TENTATIVE, ADOPTED, AND/OR FINAL BUDGETS ARE ON FILE IN THE OFFICE OF<br />
THE ABOVE MENTIONED TAXING AUTHORITY AS A PUBLIC RECORD.<br />
B-12 Fiscal Year <strong>2008</strong> Annual Budget
Ad Valorem Taxes<br />
Fiscal Year <strong>2008</strong><br />
The Operating Millage Rate for<br />
Fiscal Year <strong>2008</strong> will be rolled<br />
back to the rate <strong>of</strong> $3.2942<br />
<strong>City</strong> Hall, 1927<br />
Mills<br />
5.000<br />
CITY OF LAKELAND<br />
Property Tax Millage<br />
4.500<br />
4.000<br />
3.500<br />
3.000<br />
2.500<br />
2.000<br />
1.500<br />
1.000<br />
0.500<br />
0.000<br />
97 98 99 00 01 02 03 04 05 06 07 08<br />
Year<br />
B-13 Fiscal Year <strong>2008</strong> Annual Budget
Staffing Changes<br />
FY 07 FY 08 07 - 08<br />
Actual Budget Change<br />
<strong>City</strong> Manager 5 10 5 *<br />
Communications 7 6 (1)<br />
Human Resources 23 27 4<br />
Planning 25 24 (1) *<br />
Building Inspection 23 24 1 *<br />
Central Accounting 25 23 (2) *<br />
Utilities Billing 12 11 (1)<br />
Police Department 360 361 1<br />
Public Works-C & M 62 64 2<br />
Total General Fund 993 1,000 8<br />
Community Development 10 11 1<br />
Facilities Maintenance 53 55 2<br />
Wastewater 81 83 2<br />
Water 118 120 2<br />
Parking Services 6 7 1<br />
Cleveland Heights 23 22 (1)<br />
Airport 20 21 1<br />
Solid Waste 80 85 5<br />
Electric 664 628 (36) **<br />
1,226 1,203 (23)<br />
Total <strong>City</strong> 2,219 2,203 (15)<br />
Total eliminated positions (36)<br />
Total additional positions 21<br />
Total <strong>City</strong> changes (15)<br />
*Positions were transferred between departments<br />
**3 positions were transferred and 33 vacant positions were eliminated<br />
100<br />
80<br />
60<br />
40<br />
20<br />
-<br />
(20)<br />
Change in Headcount by<br />
Year<br />
'97 '98 '99 '00 '01 '02 '03 '04 '05 '06 '07 '08<br />
4 33 6 84 71 35 22 6 35 8 52 (15)<br />
Note:<br />
Chart shows a material increase in Fiscal Years 2000 and 2001 primarily due to the <strong>City</strong> acquiring the<br />
Cleveland Heights Golf Club and the addition <strong>of</strong> Firefighters, Policemen and Utility workers.<br />
B-14 Fiscal Year <strong>2008</strong> Annual Budget
Employee/Population Growth<br />
Full-Time Employees Per 1,000 Population<br />
26<br />
25<br />
24<br />
23<br />
22<br />
1998 1999 2000 2001 2002 2003 2004 2005 2006 2007 <strong>2008</strong> *<br />
Year<br />
*<strong>2008</strong> based on estimated population <strong>of</strong> 93,385.<br />
B-15 Fiscal Year <strong>2008</strong> Annual Budget
Overview and Financial Policies<br />
Overview:<br />
This section contains a summary <strong>of</strong> the Fiscal Year <strong>2008</strong> Annual Operating Budget and Capital<br />
Improvement Program, along with a discussion <strong>of</strong> the process that goes into developing the budget.<br />
The first section details the Financial Policies <strong>of</strong> the <strong>City</strong> upon which all budgeting decisions are made.<br />
The policies provide guidance to the <strong>City</strong> Commission and staff in making financial decisions on a daily<br />
basis. Good policies help ensure that the <strong>City</strong>’s financial health is maintained and the community<br />
remains financially stable. Sound stewardship <strong>of</strong> public funds requires the establishment <strong>of</strong> written<br />
standards <strong>of</strong> fiscal responsibility. The State <strong>of</strong> Florida prescribes certain standards that apply to<br />
municipal government; however, The <strong>City</strong> <strong>of</strong> <strong>Lakeland</strong> has financial policies that, in many cases, expand<br />
upon the standards required by the State <strong>of</strong> Florida.<br />
Following that is a discussion <strong>of</strong> the budget process and how we create the Business Plan and budget<br />
documents.<br />
The next section provides a current look at the <strong>City</strong>’s finances with tables and charts detailing the<br />
current Fund Balances carried in the <strong>City</strong>’s main operating funds.<br />
The Net Combined Budget is the summary <strong>of</strong> all funds for Fiscal Year <strong>2008</strong>. We also include a copy <strong>of</strong><br />
the “Truth in Millage” Notification that we publish in the newspaper prior to adopting the budget. This<br />
format varies slightly from the net budget, because State law requires showing some interfund transfers,<br />
which, in effect, double count some revenues and expenditures.<br />
Information on our Ad Valorem Taxes, a summary <strong>of</strong> Net Staffing Changes, and a diagram <strong>of</strong> our Fund<br />
Structure all precede the Fund Budget Overview, which summarizes the budget by individual fund.<br />
The last section is the Capital Improvement Program Overview. This section provides the impact on<br />
operating budget, major capital projects and capital project funding by department and funding source.<br />
Operating Budget Policies:<br />
• The budget shall be balanced by fund. Balance by fund is defined as revenues plus Fund<br />
Balance being equal to or greater than expenditures. Fund Balance is normally reserved for<br />
capital projects/outlay or one-time expenditures and is not to be used for operational<br />
expenditures.<br />
• The budget will provide for adequate maintenance <strong>of</strong> capital plant and equipment and for their<br />
orderly replacement.<br />
• The <strong>City</strong> will maintain a budgetary control system to insure it adheres to the budget.<br />
• Appropriations requests will be made by departments (i.e. <strong>City</strong> Manager, Police,...) in the<br />
General Fund and on a fund level in all other funds. These requests are approved by the <strong>City</strong><br />
Commission.<br />
• Unreserved fund balance should be between 5% - 15% <strong>of</strong> the operating revenues <strong>of</strong> the<br />
General Fund to balance unforeseen items and events that occur during the course <strong>of</strong> a fiscal<br />
year. This fund balance will act as a cushion or “budget stabilization fund” for the expenditures<br />
financed within that fund.<br />
• The <strong>City</strong> will protect itself against catastrophic losses through a combination <strong>of</strong> good risk<br />
management, traditional insurance and where prudent actuarially fund self-insurance programs.<br />
• Recovery <strong>of</strong> the specific costs <strong>of</strong> municipal services will be allocated to the appropriate users<br />
wherever possible and practical and shall be accounted for within enterprise funds maintained<br />
by the <strong>City</strong> on a full accrual basis..<br />
• Internal Service Funds shall be self-supporting, and shall recover the cost <strong>of</strong> the services they<br />
provide based on a rational allocation <strong>of</strong> cost to the benefiting <strong>City</strong> departments.<br />
B-16 Fiscal Year <strong>2008</strong> Annual Budget
Overview and Financial Policies<br />
Operating Budget Policies (Cont’d):<br />
• The <strong>City</strong> will strive to have all Enterprise Funds be self-supporting to the extent practical,<br />
including debt service and capital improvements. Any subsidies required for these operations<br />
shall be documented by written guidelines defining the scope, funding source and limitations on<br />
those subsidies.<br />
• Although not required by State Law, internal service and enterprise funds will be governed by<br />
legally adopted annual budgets for cost control and administrative purposes.<br />
• In no cases will any fund operate in a manner that results in an annual deficit in operating fund<br />
balance (defined as current assets excluding inventories less current liabilities including the<br />
long- term portion <strong>of</strong> accrued payroll liabilities).<br />
• Operating budgets are prepared on a modified accrual basis, insuring that budgeted<br />
expenditures within an annual planning period can be financed from available, spendable<br />
resources.<br />
Revenue Policies:<br />
• As much as possible subject to State Law and voter approval, the <strong>City</strong> will seek to maintain a<br />
diversified and stable mix <strong>of</strong> revenue sources.<br />
• The <strong>City</strong> will pursue collection <strong>of</strong> revenues levied against the users <strong>of</strong> public services.<br />
• User fees and charges will be established with consideration <strong>of</strong> the recovery <strong>of</strong> the full cost <strong>of</strong><br />
providing the related service, to the extent practical.<br />
• In preparing the budget, the <strong>City</strong> Manager will estimate revenues using a conservative, objective<br />
and analytical process.<br />
• Non-recurring revenues and one-time revenues will not be relied upon to finance the cost <strong>of</strong><br />
recurring expenditures. Non-recurring revenues and one-time revenues should be used for nonrecurring<br />
expenditures.<br />
• All grant applications will be prepared with full consideration matching costs and on-going<br />
recurring costs to be financed from local revenue sources. All grant applications shall be<br />
authorized by the <strong>City</strong> Commission.<br />
Capital Improvement Policies:<br />
• The <strong>City</strong> develops a ten-year capital improvement plan.<br />
• Capital project budgets will be adopted on a project basis at the inception <strong>of</strong> the project.<br />
• The <strong>City</strong> will coordinate development <strong>of</strong> the capital improvement/replacement budget with the<br />
development <strong>of</strong> the annual operating budget. Each capital project is reviewed for its ongoing<br />
future impact on the operating budget.<br />
• The <strong>City</strong> will use the following criteria to evaluate the relative merit <strong>of</strong> each capital project being<br />
considered for funding within its capital plan:<br />
− Projects specifically included in an approved capital asset replacement schedule will<br />
receive priority consideration; and<br />
− Capital Projects that will reduce recurring operating costs will receive priority<br />
consideration.<br />
B-17 Fiscal Year <strong>2008</strong> Annual Budget
Overview and Financial Policies<br />
Accounting, Auditing and Financial Reporting Policies:<br />
• An independent audit will be performed annually.<br />
• The <strong>City</strong> will produce an audited Comprehensive Annual Financial Report (CAFR) following<br />
Generally Accepted Accounting Principles (GAAP) as defined by the Governmental Accounting<br />
Standards Board (GASB) and the Financial Accounting Standards Board (FASB).<br />
• All Automated Clearing House (ACH) and wire transfers shall follow guidelines as drafted in the<br />
adopted policy including:<br />
− Compliance with established internal controls governing authorization and transaction<br />
processing<br />
− Prompt recording and reporting <strong>of</strong> all ACH and wire transactions; and<br />
− Compliance with all other purchasing requirements.<br />
• The <strong>City</strong> will maintain a system <strong>of</strong> strong internal controls governing all financial transactions,<br />
and shall promptly implement any changes to those controls recommended to the <strong>City</strong> in<br />
conjunction with the review <strong>of</strong> internal controls conducted with the annual independent audit <strong>of</strong><br />
the <strong>City</strong>.<br />
Investment Policies:<br />
• As required by State Law, the <strong>City</strong> Commission shall establish an investment policy.<br />
• The <strong>City</strong>’s investment objectives, as established in this policy, focus on Safety, Liquidity and<br />
Yield.<br />
• Investments shall be commingled into a single, <strong>City</strong>-wide investment portfolio in order to provide<br />
for economies <strong>of</strong> scale with respect to liquidity requirements and maintaining the ability to<br />
purchase larger blocks <strong>of</strong> investments. The exception to this will be funds that are invested<br />
within the various pensions and selected other trust funds, which are governed by investment<br />
policies for longer term instruments.<br />
• The portion <strong>of</strong> the investment portfolio that consists <strong>of</strong> fixed rate investments shall be structured<br />
so that investments mature in approximately equal amounts each quarter.<br />
• Disbursement, collection and deposit <strong>of</strong> all funds will be managed to insure that cash is invested<br />
promptly until needed.<br />
• All depositories shall meet the collateral requirements specified within state statute.<br />
Debt Policies:<br />
• Debt may be issued only for the purposes <strong>of</strong> financing the cost <strong>of</strong> capital improvements. The<br />
proceeds <strong>of</strong> debt issuance can not be used for operations.<br />
• The projected useful life <strong>of</strong> capital assets financed from debt issuance must equal or exceed the<br />
terms <strong>of</strong> the financing.<br />
• The revenue stream used to finance the debt must be sufficient to cover all debt costs over the<br />
term <strong>of</strong> the financing and shall, to the extent practical, represent revenues to be generated by<br />
the same capital assets financed from the debt issuance<br />
• The <strong>City</strong> shall not pledge ad valorem revenues to the repayment <strong>of</strong> debt without the express,<br />
voted approval <strong>of</strong> the citizens <strong>of</strong> <strong>Lakeland</strong>.<br />
• The <strong>City</strong> shall adopt a written policy governing the use <strong>of</strong> derivative financial instruments within<br />
its debt portfolio.<br />
• The <strong>City</strong> follows all State and Federal regulations and requirements regarding debt issuance,<br />
B-18 Fiscal Year <strong>2008</strong> Annual Budget
Overview and Financial Policies<br />
Purchasing Policies:<br />
• Purchases will follow all required Federal, State and Municipal requirements.<br />
• Purchases will be made in an impartial, economical, competitive and efficient manner.<br />
− Purchases under $500: Each department is responsible for obtaining the best price<br />
possible.<br />
− Purchases $501 - $1,500: Each department is responsible for obtaining the best price<br />
possible using a departmental purchase order to solicit vendors for competitive pricing.<br />
− Purchases over $1,500: Each department is responsible for obtaining the best price<br />
possible, requires a purchase order including solicitation <strong>of</strong> multiple quotations <strong>of</strong> price,<br />
prior to <strong>City</strong> Manager authorization and prior <strong>City</strong> Commission authorization.<br />
− Purchases over $10,000: Require formal sealed bids. All invitations for bids must be<br />
advertised in a newspaper in general circulation at least 5 days prior to the bid opening.<br />
Written contracts are required. All bid openings will be public. All bids must be awarded<br />
by the <strong>City</strong> Commission. Performance bids and/or bid bonds and insurance may be<br />
required on some projects and purchases.<br />
• The <strong>City</strong> shall maintain a written policy regarding the use <strong>of</strong> procurement cards (credit cards) to<br />
enter into purchase transactions. All other purchasing requirements also apply to credit card<br />
purchases.<br />
Performance Measurement Policies:<br />
• Annually the <strong>City</strong> shall review and update the Strategic Plan identifying the Strategic Priorities<br />
and Key Success Indicators (KSI’s) that measure appropriate results for each priority.<br />
• Annually each department shall develop departmental performance measures that support<br />
achieving successful results in the KSI’s with the <strong>City</strong> Manager’s Office. Goals should be<br />
related to core services <strong>of</strong> the department and should reflect customer needs. The measures<br />
should be a mix <strong>of</strong> different types, including effectiveness, efficiency, demand and workload.<br />
Measures should be similar to other cities for benchmarking purposed but also have sufficiently<br />
aggressive goals to ensure continuous improvement.<br />
• Department Directors shall establish performance measures for each division or program within<br />
their department to monitor and project program performance. Annual summaries <strong>of</strong> progress<br />
on KSI’s and departmental performance measures will be published and distributed.<br />
Did you know…<br />
<strong>Lakeland</strong> was ranked #7 nationally by Bizjournals for<br />
“10 Hottest Labor Markets in America”, October 2006.<br />
B-19 Fiscal Year <strong>2008</strong> Annual Budget
Budget Process Overview<br />
How the Budget Was Created<br />
Annually the <strong>City</strong> Commission begins a process <strong>of</strong> strategic planning designed to identify the issues that<br />
must be addressed to achieve our Mission and that will persist throughout the Strategic Plan. Reviewed and<br />
updated annually, the strategic plan creates a shared vision for the future <strong>of</strong> the community. These longrange<br />
Outcomes developed by the <strong>City</strong> Commission and reaffirmed during the years Strategic Plan,<br />
emphasize the values <strong>of</strong> our customers:<br />
Enriched Organization Workforce<br />
Enriched Community Workforce<br />
Sustainable Business Environment<br />
Informed and Engaged Employees<br />
Informed and Engaged Community<br />
Optimal Management <strong>of</strong> Existing Financial Resources<br />
Develop New Financial Resources<br />
Quality Developments<br />
Safe, Attractive Neighborhoods<br />
Quality Public Spaces<br />
Superior Municipal Services<br />
Support the Arts and Wellness<br />
Support Education<br />
For each Outcome, Strategies and Actions were developed for implementing policy and operating<br />
measures. Through this process, Key Success Indicators (KSI’s) and the Business Plan were also<br />
developed.<br />
Business Plan<br />
With the Outcomes and KSI’s set, the operations <strong>of</strong> the <strong>City</strong> are reviewed and redirected to bring the<br />
strategic vision to life. Specific actions, programs, capital purchases, staffing requirements and funding<br />
levels are developed in response to the needs identified in the strategic plan. The plan is an outgrowth <strong>of</strong><br />
the Outcomes, capturing the <strong>City</strong>’s Vision in a quantifiable form, improving decision making and resource<br />
allocation.<br />
A benefit <strong>of</strong> using a Business Plan is the direct link between costs, activities and key drivers. We will begin<br />
to use this model to monitor our performance by developing process maps that link budget items to activities<br />
and identify value-added and non-value-added activities.<br />
In developing the Fiscal Year <strong>2008</strong> operating budget, departments analyze existing services and potential<br />
services keeping in mind the Strategic Plan Outcomes, departmental Actions and KSI’s. The Business Plan<br />
identifies added and removed services, which are then quantified in the line item budget. They reflect not<br />
only the Outcomes as set by the <strong>City</strong> Commission, but also incorporate feedback from customer surveys<br />
and policy initiatives that contribute to the long-term financial health <strong>of</strong> the <strong>City</strong>.<br />
Departments set goals to meet the needs identified by the Outcomes. To meet these goals, programs within<br />
the departments have specific Actions that are measured. Future enhancements to further this process will<br />
ensure each employee knows what the end result should be and how it contributes to the <strong>City</strong>’s Strategic<br />
Plan. In this way the budget becomes a tool for monitoring, rather than controlling operating performance.<br />
B-20 Fiscal Year <strong>2008</strong> Annual Budget
Budget Process Overview<br />
Budget Methodology<br />
The budget for the <strong>City</strong> <strong>of</strong> <strong>Lakeland</strong> is a performance based budgeting system. This type <strong>of</strong> budgeting<br />
system identifies a particular level <strong>of</strong> service performance for each type <strong>of</strong> service (program) and the<br />
resources needed to operate it, as well as describes the structure <strong>of</strong> the departments and the programs<br />
into which they are divided. The programs budget is separated into activities which are then broken<br />
down into the following components:<br />
COMPONENT<br />
Mission<br />
Core Services<br />
Organization Charts<br />
DESCRIPTION<br />
The statement must identify the particular purpose for the activity and<br />
how it relates to the <strong>City</strong>’s overall mission.<br />
A listing <strong>of</strong> the fundamental services that the activity is designed to<br />
provide.<br />
Outline <strong>of</strong> structure within the department.<br />
Operational and/or Public<br />
Service Levels<br />
Performance Measures<br />
Those key measurements defined by the services provided.<br />
The performance measures focus on particular accomplishments that<br />
will be attained within the current year. All are measurable by the<br />
performance indicator’s supplied. Each performance measure<br />
includes explicit links showing how objectives and their indicators are<br />
directly related to the KSI’s and Outcomes they support.<br />
New Initiatives<br />
New services or removal <strong>of</strong> existing services as they relate to the<br />
Strategic Plan.<br />
Program/Expenditure Summary The budget for the department, summarized by Program and by major<br />
category <strong>of</strong> expenditure:<br />
• Personal Services—Salaries, Overtime and other pay including<br />
Vacation, Holiday and Fringe Benefits.<br />
• Non-Personnel—Internal Service Charges, Pr<strong>of</strong>essional &<br />
Contractual, Utilities, Insurance and Fixed Charges, All Other<br />
Operations & Maintenance, Capital and Debt Service.<br />
• Transfers to/from other programs.<br />
• Revenue Sources—Taxes, Licenses & Permits,<br />
Intergovernmental, Charges for Services, Interest Income and All<br />
Other.<br />
B-21 Fiscal Year <strong>2008</strong> Annual Budget
Budget Process Overview<br />
Approach to Budget Review Process<br />
Start Up<br />
We begin by reviewing all current services in light <strong>of</strong> the Strategic Plan. Are current services sufficient or<br />
necessary? What new initiatives should be undertaken to meet constituent requirements? A budget<br />
calendar is then developed driven in large part by the Truth in Millage (TRIM) dates (see TRIM notice on<br />
page B-12). We then develop a list <strong>of</strong> recommended changes arising out <strong>of</strong> this analysis, forming the<br />
basis for the Business Plan.<br />
<strong>2008</strong> Budget Calendar<br />
01/25 & 01/26 <strong>City</strong> Commission Retreat<br />
03/06 Budget Kick-Off for Department Heads (DH)<br />
03/13 Submit 3-Year T/O worksheets and train DH. Submit Line Item Budget<br />
worksheets to Internal Service Fund DH<br />
04/02 Submit Program Allocation data worksheets to DH<br />
04/16 Return completed Line Item Budget worksheets to Finance.<br />
Submit 3-Year T/O worksheets and Program Allocations to <strong>City</strong> Manager<br />
04/30 Submit Program Narratives, Line Item Budget & CIP worksheets to DH.<br />
Citizens Advisory Committee comments on agency funding to <strong>City</strong><br />
Commission<br />
05/14 Return completed Program Narratives, Line Item Budget & CIP<br />
Worksheets to Finance<br />
05/21 - 06/22 Review departmental budgets and hold meetings with DH<br />
07/02 Receive Certification <strong>of</strong> Value from Property Appraiser<br />
07/16 - 07/30 Hold budget sessions with <strong>City</strong> Commission<br />
07/16 Adopt Property Tax Millage Rate, set dates for Public Hearings<br />
07/19 Deliver proposed millage rate to Property Appraiser<br />
08/17 Publish notice <strong>of</strong> public hearing on Commission salary<br />
08/20 Submit Budget Document to <strong>City</strong> Commission<br />
09/04 Hold first public hearing on tentative budget, proposed millage rate, adopt<br />
proposed millage rate<br />
09/13 Publish notice <strong>of</strong> Public Hearing on final budget<br />
09/17 Second Public Hearing to adopt final budget and millage rate<br />
09/28 File Certification <strong>of</strong> Compliance with Florida Law<br />
Beginning with each Activity’s Mission Statement, which is a driving force behind the Activity’s budget<br />
and should set the direction <strong>of</strong> the department, we develop a projected budget based on the previous<br />
year’s budget with any new initiatives appended and any discontinued services removed.<br />
From there, goals and Key Success Indicators are developed that relate to each other and to the<br />
Activity’s mission and the <strong>City</strong>’s Strategic Plan. Goals and objectives should be realistic and quantifiable<br />
and improvements should support the efficiency and effectiveness <strong>of</strong> the Activity.<br />
B-22 Fiscal Year <strong>2008</strong> Annual Budget
Budget Process Overview<br />
Current goals and objectives may be used to establish a starting point for the future.<br />
In March, the Finance Department distributes to departments a target budget for the coming year, which<br />
is based on projections <strong>of</strong> current year expenditures, as well as the two prior years actual expenditures.<br />
Operating costs are included in this target budget. At the same time, Capital Improvement Program and<br />
physical inventory worksheets are distributed for department input.<br />
Verification <strong>of</strong> all numbers and assumptions made in these categories is carried out by departmental<br />
staff. Personnel changes such as retirements, projected salary increases or changes in hours worked<br />
are then submitted.<br />
Operating Expenses<br />
The target budget will also contain operating expenses based on projections <strong>of</strong> the current year’s<br />
expenditures.<br />
The actual users <strong>of</strong> the supplies and services review their practices and habits involving daily<br />
expenditures for possible efficiencies. Departments review the line item account codes for accuracy <strong>of</strong><br />
description and determine if they reflect the actual types <strong>of</strong> expenditures.<br />
Lastly, they provide justification for any changes from the target budget with the use <strong>of</strong> information from<br />
current year expenditures or information obtained from other sources, such as trends in next year’s<br />
contracts or service costs provided by the Purchasing Division.<br />
Capital Expenses<br />
Departments also evaluate all existing equipment, facilities, and other capital items, to determine if<br />
useful life has been exceeded, or will be exceeded, in the coming budget year.<br />
They then identify all recommended capital expenditures from this evaluation <strong>of</strong> equipment. Vehicle life<br />
expectancy information is provided by the Public Works Department-Fleet Services Division.<br />
Each department maintains a ten-year Capital Improvement Program plan for its equipment needs and<br />
submits for review.<br />
Business Plan<br />
Taking into account the market environment, customer expectations and emerging issues, the changes<br />
to service structure (discontinued services, new initiatives, etc.) are outlined and cross-referenced to the<br />
Strategic Plan.<br />
<strong>City</strong>-wide financial strategies are identified to address the long-term needs <strong>of</strong> the <strong>City</strong> in<br />
relation to emerging issues that have been identified through the strategic planning<br />
process.<br />
Anticipated results are identified and linked to Key Success Indicators for inclusion in<br />
the <strong>City</strong>’s performance measurement system.<br />
B-23 Fiscal Year <strong>2008</strong> Annual Budget
Budget Process Overview<br />
Budget Format<br />
A Municipal budget document should provide sufficient, meaningful and useful information to elected<br />
<strong>of</strong>ficials, <strong>City</strong> Staff and to the public. To that end, we have developed a budget document that serves<br />
four primary functions:<br />
Policy Document<br />
Financial Plan<br />
Operations Guide<br />
Communication Device<br />
Together, these budget elements define what the <strong>City</strong> <strong>of</strong> <strong>Lakeland</strong> has done, what it plans to do and<br />
how it will accomplish its objectives.<br />
The budget is a program/performance based plan that links prescribed organizational goals and<br />
objectives with the financial resources necessary to achieve them. Each <strong>of</strong> the budget’s programs<br />
represent a “product” <strong>of</strong> the <strong>City</strong>. Contained within each program are objectives and achievements. The<br />
program/performance budget is integrated with line item financial information to ensure optimal budget<br />
control.<br />
This program/performance budget enables the <strong>City</strong> Commission and the public to analyze the budget by<br />
priorities based on program goals and performance objectives rather than line item costs. In addition,<br />
this format provides information so that the <strong>City</strong> Commission and the public will have a better<br />
understanding <strong>of</strong> the allocation <strong>of</strong> resources among programs and the measurable work that each<br />
department will accomplish.<br />
The Fiscal Year <strong>2008</strong> budget includes an Introduction section followed by Budget Overview,<br />
Long-Range Planning, Performance Budget, Line Item Budget, Capital Improvement Planning (CIP) and<br />
Supplementary Information Sections.<br />
Approving The Process<br />
During the months <strong>of</strong> June - August, recommended operating and capital<br />
improvement program budget documents are prepared and presented to the <strong>City</strong><br />
Manager and to the <strong>City</strong> Commission for review.<br />
The <strong>City</strong> Commission either approves or makes changes in the recommended<br />
budget(s) and returns to staff for further study.<br />
Public hearings and final adoption <strong>of</strong> the budget occurs in mid-September.<br />
Did you know…<br />
<strong>Lakeland</strong> was ranked #8<br />
nationally by Inc.com for<br />
“Boomtowns 2006: Top 20<br />
Cities for Doing Business”.<br />
B-24 Fiscal Year <strong>2008</strong> Annual Budget
Budget Process Overview<br />
Monitoring The Budget<br />
The Finance Chief Accountants are authorized to transfer budget amounts within individual<br />
departments.<br />
Actual expenditures and operating transfers out may not exceed the adopted budget at the individual<br />
fund level.<br />
Appropriations which are neither expended, encumbered, nor specifically designated to be carried over<br />
lapse at the end <strong>of</strong> the fiscal year.<br />
Amending The Budget<br />
If, during the course <strong>of</strong> the fiscal year, it becomes evident that a particular fund is unable to provide the<br />
required level <strong>of</strong> services to the community due to unexpected higher costs <strong>of</strong> providing the service, the<br />
budget may be amended.<br />
The Director <strong>of</strong> Finance submits to the <strong>City</strong> Commission a request to amend the budget. The request<br />
contains explanations written by the Director(s) <strong>of</strong> the department(s) needing additional funds.<br />
The request also includes a proposal for financing the additional expenditures, usually either by<br />
appropriating from the fund balance or by submitting evidence <strong>of</strong> expected surplus current year<br />
revenues.<br />
<strong>City</strong> Commission approval is required for budget amendments which alter the budget <strong>of</strong> any fund.<br />
B-25 Fiscal Year <strong>2008</strong> Annual Budget
THIS PAGE IS INTENTIONALLY BLANK
Table <strong>of</strong> Contents<br />
Long-Range Planning ....................................................................... Section—C<br />
Introduction & Mission Statement ......................................................C-2<br />
Core Values...........................................................................................C-3<br />
Outcomes..............................................................................................C-4<br />
Environmental Scan .............................................................................C-6<br />
Financial Health & Strategy .................................................................C-9<br />
Revenue Sources ...............................................................................C-16<br />
Debt Overview.....................................................................................C-21<br />
C-1 Fiscal Year <strong>2008</strong> Annual Budget
Introduction<br />
This section outlines the elements <strong>of</strong> our long-range<br />
financial planning process.<br />
First, we recap the Strategic Plan for Fiscal Year<br />
<strong>2008</strong>. Our Mission Statement, Core Values and<br />
Outcomes are summarized over the next few pages.<br />
Following is the Fiscal Year <strong>2008</strong> Business Plan<br />
Environmental Scan, which is an overview <strong>of</strong> the<br />
economic and developmental forces at work in the<br />
community describing changes in the demographic,<br />
technological, legislative and service demand areas.<br />
We also look outside our organization at other cities<br />
and private sector competitors to see what levels <strong>of</strong><br />
service and operational strategies are being used<br />
throughout the world. We believe in using “best<br />
practices” to model our systems.<br />
Future enhancements to this document will provide<br />
reviews <strong>of</strong> the results from our Financial Trend<br />
Monitoring System, a tool that we use to monitor our<br />
relative performance in some key financial measures.<br />
All <strong>of</strong> the tools listed above are used in the<br />
development <strong>of</strong> the Forecast. This is where we<br />
attempt to anticipate the impact <strong>of</strong> our changing<br />
environment, as well as plan for future operational<br />
and capital expenditures. A brief overview <strong>of</strong> our<br />
significant Revenue Sources follows on page C-16.<br />
Based on our forecasts, we have created a financial<br />
strategy for the short-term that positions us to best<br />
plan for the long-term trends and conditions.<br />
Lastly, a Debt Management Overview is provided<br />
with brief explanations <strong>of</strong> debt purposes and debt<br />
trends.<br />
Mission Statement<br />
A community working together to<br />
provide an exceptional quality <strong>of</strong> life.<br />
C-2 Fiscal Year <strong>2008</strong> Annual Budget
Core Values<br />
Leadership<br />
We will lead by example, learn from the past, provide<br />
direction for the present and plan for the future.<br />
Commitment to Excellence<br />
We will achieve measurable success and continuous<br />
improvement through investment <strong>of</strong> resources,<br />
accountability and high expectations for quality.<br />
Diversity<br />
We will utilize our differences to encourage participation,<br />
opportunity, equality, respect and responsiveness to our<br />
community.<br />
Integrity<br />
We will conduct ourselves in an honest and ethical manner<br />
to earn the trust <strong>of</strong> employees and citizens.<br />
Empowered Workforce<br />
We will cultivate a work environment which <strong>of</strong>fers employees the<br />
authority to act through supportive leadership, mutual respect,<br />
trust, personal responsibility and open communication.<br />
Social Responsibility<br />
We will enhance the quality <strong>of</strong> life for all citizens<br />
through partnerships and programs that embrace<br />
cultural diversity, safety and community involvement.<br />
C-3 Fiscal Year <strong>2008</strong> Annual Budget
Outcomes<br />
Enriched Organization Workforce<br />
Promote career development and education<br />
opportunities by <strong>of</strong>fering leadership training classes<br />
and classes from the <strong>City</strong> University. Recruit, hire<br />
and retain highly skilled employees by developing a<br />
Benefits Summary Booklet, providing an Employee<br />
Wellness Clinic, revising the Employment<br />
Webpage, to provide helpful information for job<br />
applicants and<br />
structure a competitive<br />
retirement benefits<br />
package.<br />
Enriched Community Workforce<br />
Establish area “Workforce Development<br />
Partnerships” with area schools by developing a<br />
power academy to attain a skilled workforce for<br />
<strong>Lakeland</strong> Electric. Develop a Medical District<br />
Master Plan in partnership with stakeholders and to<br />
encourage the development <strong>of</strong> high-skilled labor<br />
sectors. Promote diverse cultural opportunities.<br />
Informed and Engaged Employees<br />
Promote an organizational culture characterized by<br />
open communication and employee involvement by<br />
implementing a 360 degree feedback process,<br />
conducting periodic surveys and providing feedback,<br />
promoting a Suggestion Box program and establishing<br />
monthly meetings between Department Heads/<br />
Directors and their respective workgroups.<br />
Informed and Engaged Community<br />
Promote effective communications with all residents<br />
and stakeholders by providing a website for citizens to<br />
provide feedback to <strong>City</strong> <strong>of</strong>ficials and develop <strong>Lakeland</strong><br />
Government Network (LGN)<br />
as a media brand that<br />
includes a stand alone cable<br />
television station and internet<br />
webcast channel to<br />
encourage community spirit,<br />
educational progress and<br />
local government support.<br />
Encourage a shared sense <strong>of</strong><br />
community and responsibility through citizen education<br />
and involvement by establishing a section on the <strong>City</strong><br />
website providing information on <strong>City</strong> Services and how<br />
the <strong>City</strong> compares to other benchmark organizations.<br />
Explore and develop citizen education and increased<br />
involvement in the process <strong>of</strong> local government through<br />
the efforts <strong>of</strong> the Citizens and Employee Boards and<br />
Committees program.<br />
Optimal Management <strong>of</strong> Existing<br />
Financial Resources<br />
Sustainable Business Environment<br />
Support area economic development initiatives by<br />
establishing the small aircraft transportation program<br />
with a goal <strong>of</strong> achieving an active and expanding role<br />
in this new aviation transportation system. Explore<br />
the potential <strong>of</strong> related research business/industry<br />
park development opportunities to expand<br />
employment and community tax base promoting high<br />
skilled high wage employment opportunities.<br />
Develop financial benchmarks for all municipal<br />
operations and services. Implement a process<br />
improvement program throughout the organization and<br />
develop key success indicators aligned to outcomes,<br />
integrating budgetary planning with performance<br />
management to enhance strategic and budgetary<br />
planning with performance measurement systems.<br />
Develop and implement a methodology to recover the<br />
cost <strong>of</strong> municipal services that are being financed from<br />
general tax revenues; providing an improved process<br />
for matching revenues to programs.<br />
Develop New Financial Resources<br />
Develop public/private initiatives to enhance the <strong>City</strong>’s<br />
revenue capacity. Establish perpetual care funds (or<br />
endowments) for public and private contributions.<br />
C-4 Fiscal Year <strong>2008</strong> Annual Budget
Outcomes<br />
Quality Developments<br />
Review planning development and design<br />
standards to ensure every new development is<br />
sustainable and enhances the <strong>City</strong>’s built<br />
environment. Implement a transition from the<br />
development <strong>of</strong> individual neighborhood plans to a<br />
more comprehensive sector planning approach.<br />
Develop reliable and efficient infrastructure<br />
systems that support desired urban development.<br />
Superior Municipal Services<br />
Establish “Best Practices” benchmarks by meeting<br />
necessary requirements for compliance to Clean<br />
Air Interstate Rules, conducting residential and<br />
commercial customer satisfaction surveys and<br />
establish performance measures that can be used<br />
to benchmark the <strong>City</strong> to other government<br />
agencies.<br />
Safe, Attractive Neighborhoods<br />
Promote public safety initiatives and projects that<br />
enhance property values such as implementing the<br />
city-wide sidewalk program, design and<br />
construction <strong>of</strong> new streetscape projects in the<br />
Downtown and expand fire rescue services in<br />
southwest <strong>Lakeland</strong>. Counteract the physical and<br />
economic decline <strong>of</strong> neighborhoods by pursuing<br />
the acquisition and<br />
recycling <strong>of</strong> vacant<br />
and abandoned<br />
lots into the private<br />
housing market.<br />
Empower<br />
residents to<br />
address<br />
neighborhood<br />
safety concerns<br />
through activities<br />
<strong>of</strong> the Neighborhood Association Coalition.<br />
Support the Arts and Wellness<br />
Work with the Imperial Symphony towards<br />
developing a joint grant application with the<br />
Community Foundation in order to develop a<br />
funding source that will provide additional arts<br />
programming for the <strong>Lakeland</strong> Center and<br />
Community. Develop a partnership with local<br />
artists in order to showcase local artist work on an<br />
on-going basis through public art displays.<br />
Quality Public Spaces<br />
Landscape and beautify neighborhoods in<br />
collaboration with neighborhood associations.<br />
Expand and improve Library facilities and services<br />
in response to community partnerships and<br />
identified needs. Expand Parks facilities and<br />
services pursuant to adoption <strong>of</strong> Parks and Trails<br />
Master Plan. Preserve and enhance unique<br />
natural and historic resources.<br />
Support Education<br />
Partnership with Polk County School Board to<br />
supply computer training to residents at<br />
community centers. Visit local schools promoting<br />
utility programs, electrical safety and conservation.<br />
Play an active role in master planning and<br />
development <strong>of</strong> the proposed USF campus to<br />
encourage meeting the educational and workforce<br />
development needs in concert with the High Skills<br />
Initiative.<br />
C-5 Fiscal Year <strong>2008</strong> Annual Budget
Environmental Scan<br />
Economic Analysis<br />
The U.S. economic expansion continues in 2007,<br />
though not as brisk as prior years, solid growth is<br />
forecasted to continue into <strong>2008</strong>. After growing more<br />
than 3% in 2006, the U.S. Gross Domestic Product<br />
(GDP) growth slowed to an annualized rate just over<br />
0.5% in the first half <strong>of</strong> 2007, representing a much<br />
slower pace than the prior four years. This decrease<br />
is in direct relation to the current housing struggles as<br />
they are associated with consumer lending and<br />
borrowing. Declined wealth through housing values<br />
has also had a variable affect on consumer<br />
confidence. Rising delinquency and foreclosure<br />
rates along with speculative investors continue to<br />
push property values down. Large quantities <strong>of</strong><br />
newly built and unsold homes have flooded the<br />
market, further enhancing the construction slowdown.<br />
Overall, the U.S. housing market continues to<br />
dampen 2007 economic expectations.<br />
The U.S. labor market remains strong with<br />
unemployment rates holding at 4.5%. Payroll job<br />
growth expansions through the first half <strong>of</strong> 2007<br />
averaged 145,000 new jobs per month. This number<br />
represented a 22% decline from the 187,000 average<br />
new jobs per month posted in 2006. Despite this<br />
slowed payroll growth, labor compensation continues<br />
to grow at a steeper pace than 2006.<br />
Consumer spending in the U.S. currently accounts<br />
for two thirds <strong>of</strong> all economic activity. After a<br />
booming 4.2% growth rate in the first quarter <strong>of</strong> 2007,<br />
consumer spending has declined slightly,<br />
representing a predicted stabilization. Accounting for<br />
this decline is the demand for automobiles, furniture<br />
and building supplies. Of these industries, furniture<br />
and building materials have taken the most direct<br />
impact from the currently slumping housing market.<br />
Though the downturn in the housing market has had<br />
a significant impact on the economy, it is expected to<br />
ease over time. Originally forecasted to ease in<br />
2007, the current decline is lagging with slow home<br />
sales and could last slightly longer than originally<br />
anticipated.<br />
As economic growth remains moderate, core inflation<br />
remains a noteworthy concern. The consumer price<br />
index (CPI) is expected to rise by 2.3% in 2007<br />
indicating a steady increase in the prices paid for<br />
consumer goods. With summertime oil prices<br />
approaching $77 per barrel and energy prices<br />
fluctuating, inflation indicators remain unclear <strong>of</strong> a<br />
projected pattern. Also affecting the CPI, are<br />
projected increases in unemployment figures.<br />
Though the increase should help compensation<br />
levels, it will also relate to a tighter job market.<br />
Despite a somewhat slow start to 2007, many<br />
economists believe the national economy is<br />
rebounding and will continue to grow at a moderate<br />
pace keeping track with prior years <strong>of</strong> expansion.<br />
Legislative News – Property Tax Reform<br />
As always, the <strong>City</strong> <strong>of</strong> <strong>Lakeland</strong> faces a number <strong>of</strong><br />
legislative issues in the year to come. Of these<br />
impending items, none has a greater potential impact<br />
on Florida’s residents than the much debated<br />
Property Tax Reform.<br />
Several years <strong>of</strong> exceptional appreciation in the value<br />
<strong>of</strong> real property have created a systematic divide<br />
among Florida’s property owners. Over the last five<br />
years, double digit appreciation has provided a<br />
considerable amount <strong>of</strong> wealth to property owners in<br />
many areas <strong>of</strong> the State. Conversely, these<br />
escalated property values have created a substantial<br />
property tax burden. Taxes on properties have<br />
outpaced many Floridians ability to pay and new<br />
residents to the state are finding home ownership<br />
simply unattainable. In <strong>Lakeland</strong>, property<br />
appreciation rates have been much lower than many<br />
larger metropolitan areas and especially in coastal<br />
communities. Cities <strong>of</strong> <strong>Lakeland</strong>’s size within the<br />
interior portion <strong>of</strong> the state experienced only two<br />
years <strong>of</strong> double-digit appreciation. The Save Our<br />
Homes Amendment, created to protect property<br />
owners from dramatic increases in taxable value has<br />
insulated many <strong>of</strong> Florida’s property owners, making<br />
it difficult to relocate within the state because <strong>of</strong> the<br />
substantial loss in tax benefits. The systematic<br />
inequities associated with increased valuations have<br />
created a number <strong>of</strong> issues with no simple solution.<br />
As a result <strong>of</strong> this growing concern, Governor Bush,<br />
in June <strong>of</strong> 2006, issued an executive order<br />
establishing the Property Tax Reform Committee. In<br />
the summer <strong>of</strong> 2007, Legislatures approved the first<br />
phase <strong>of</strong> what could be the largest tax cut in Florida<br />
history.<br />
Local governments will have to limit the growth in<br />
their tax collections to the range <strong>of</strong> personal income<br />
growth in Florida.<br />
C-6 Fiscal Year <strong>2008</strong> Annual Budget
Environmental Scan<br />
1200<br />
1000<br />
800<br />
600<br />
400<br />
200<br />
0<br />
Specifications regarding the Property Tax Reform are<br />
as follows:<br />
In many cities, property tax in Florida is the single largest<br />
tax source currently used to fund government. Reserved<br />
for local governments to use in funding a wide variety <strong>of</strong><br />
public goods and services, property taxes typically<br />
account for 25% to 50% <strong>of</strong> local governments revenues.<br />
In <strong>Lakeland</strong>’s case, approximately 19% <strong>of</strong> the General<br />
Fund is financed from property taxes.<br />
Phase I<br />
• Cities, counties and special taxing districts are<br />
required to freeze their tax collection revenues at this<br />
year’s level and then make additional cuts ranging<br />
from 3% to 9%.<br />
• Local governments will have to limit the growth in<br />
their tax collections to the rate <strong>of</strong> personal income<br />
growth in Florida, plus taxes on new construction.<br />
Phase II<br />
• On January 29, <strong>2008</strong> a constitutional amendment will<br />
be on the ballot allowing registered voters to decide<br />
on the so called “super-sized” homestead exemption.<br />
If approved by 60% <strong>of</strong> the voters, it would give<br />
homesteaded property owners a choice between<br />
keeping their existing exemptions and caps or<br />
moving to the super exemption.<br />
• If approved, voters that opt to utilize the super<br />
exemption will give up their Save Our Homes cap<br />
which limits the increase in a homes taxable value to<br />
3%, in exchange for a new exemption that shields<br />
75% <strong>of</strong> a homes value from taxation up to $200,000.<br />
It exempts an additional 15% in value between<br />
$200,000 and $300,000. Homeowners would be<br />
guaranteed a minimum exemption <strong>of</strong> at least<br />
$50,000.<br />
Residential Construction Units<br />
1997 1998 1999 2000 2001 2002 2003 2004 2005 2006<br />
Single Family<br />
Multi-Family<br />
Land Development Trends<br />
Residential<br />
In 2006, the <strong>City</strong> <strong>of</strong> <strong>Lakeland</strong> continued to expand upon<br />
the booming central Florida real estate market issuing<br />
544 single-family residential construction permits and<br />
issuing multi-family permits which accounted for<br />
additional 1,158 units. As most <strong>of</strong> the state slowed in<br />
2007, new residential construction in <strong>Lakeland</strong> remained<br />
on a steady pace as consistently demonstrated in the<br />
prior two years.<br />
Geographically, the city limits continue to expand through<br />
annexation. With an estimated size <strong>of</strong> 73.3 square miles<br />
and population at 91,623 <strong>Lakeland</strong> is the 22 nd largest city<br />
in Florida with densities much smaller than other cities <strong>of</strong><br />
this size. With the voluntary annexation <strong>of</strong> more than<br />
1,500 acres <strong>of</strong> vacant land in southwest <strong>Lakeland</strong>, the<br />
<strong>City</strong> is continuing to experience a great deal <strong>of</strong> new<br />
residential activity. Developers in southwest <strong>Lakeland</strong><br />
have plans for more than 4,000 single and multi-family<br />
units. Northeast <strong>Lakeland</strong> continues to gain momentum<br />
with the construction <strong>of</strong> the Bridgewater Development <strong>of</strong><br />
Regional Impact (DRI) and the future plans for the<br />
Williams DRI. Complementing the <strong>City</strong>’s well rounded<br />
growth in the southwest and northeast <strong>Lakeland</strong>,<br />
residential redevelopment activities in central <strong>Lakeland</strong><br />
have surfaced as an emerging trend. In-fill lots and<br />
consolidated building projects, though currently account<br />
for a small percentage <strong>of</strong> new activity, are gaining<br />
popularity with larger residential redevelopment activities<br />
on the horizon. As a whole, residential development<br />
continues to provide a solid economic foundation for the<br />
<strong>City</strong>’s local economy.<br />
As growth continues to follow the high-tech corridor <strong>of</strong><br />
I-4, the <strong>City</strong> <strong>of</strong> <strong>Lakeland</strong> has become the center<br />
<strong>of</strong> a mega-geographic area. At just over 30 miles<br />
from Tampa and 50 miles to Orlando, an<br />
estimated 8.5 million people live within a 100 mile<br />
radius <strong>of</strong> <strong>Lakeland</strong>. These numbers, along with a<br />
favorable economy, will result in the <strong>City</strong>’s<br />
continued expansion in residential development.<br />
Industrial<br />
Despite the apparent residential real estate slow<br />
down, <strong>Lakeland</strong>’s industrial market is thriving.<br />
With an increase <strong>of</strong> nearly 4,000 jobs in 2006<br />
and the in-migration <strong>of</strong> 10,000 people from the<br />
Tampa Bay and Orlando Metropolitan Statistical<br />
Areas (MSA’s) <strong>Lakeland</strong>’s economy continues to<br />
expand.<br />
C-7 Fiscal Year <strong>2008</strong> Annual Budget
Environmental Scan<br />
<strong>Lakeland</strong>’s ideal logistical location has made it a<br />
hub for industrial real estate. New company<br />
relocations and numerous expansions by existing<br />
companies have created a significant decrease in<br />
the vacancy rate <strong>of</strong> existing buildings. As vacancy<br />
rates decrease and demand increases, the rental<br />
rates for available industrial space continue to rise.<br />
Current rental rates for industrial property are<br />
averaging $4.97 per square foot (psf); this<br />
represents nearly a 4% increase from the summer<br />
<strong>of</strong> 2006. With increased demand, rental rates for<br />
<strong>Lakeland</strong>’s most abundant property type,<br />
warehouse/distribution space, are averaging $4.74<br />
psf mid-way through 2007.<br />
to collectively bargain, govern and regulate such<br />
issues as zoning and land usage is under constant<br />
threat. Second, unfunded mandates are a<br />
significant financial threat to the <strong>City</strong>. These<br />
mandates may appear in the form <strong>of</strong> requiring<br />
additional services or additional benefits to<br />
employees, without a corresponding funding<br />
source. Also, negative impacts occur when<br />
legislation and regulatory requirements are<br />
changed that reduce the <strong>City</strong>’s revenue sources<br />
with no provision for replacement funding.<br />
The <strong>City</strong> <strong>of</strong> <strong>Lakeland</strong> expects the industrial market<br />
conditions to continue to experience high levels <strong>of</strong><br />
leasing and demand activity, thus providing a<br />
continued increase in rental rates. With nearly 1.4<br />
million square feet <strong>of</strong> new industrial/warehouse<br />
space currently under construction, <strong>Lakeland</strong> can<br />
anticipate construction levels to surpass those<br />
experienced in 2006.<br />
Customer Expectations<br />
The most important element <strong>of</strong> the strategic<br />
planning process which precedes the Business<br />
Plan is identifying and understanding customer<br />
requirements. We use several sources <strong>of</strong> data,<br />
including:<br />
Comprehensive Citizen Surveys - Beginning in<br />
2001, we have used surveys to measure<br />
satisfaction and solicit opinions on a variety <strong>of</strong><br />
services and policy issues.<br />
Stakeholder Group Meetings - An intensive<br />
workshop for community stakeholders aimed at<br />
determining the critical long-term issues facing the<br />
<strong>City</strong>. In addition to facilitated meetings designed to<br />
solicit input from stakeholders and experts on<br />
narrow topics selected for their strategic value.<br />
Neighborhood Meetings - Meetings held<br />
throughout the <strong>City</strong> in an open forum.<br />
Emerging and Legislative Issues<br />
The <strong>City</strong>’s legislative concerns, especially in the<br />
long-term, fall into two basic categories. First, is<br />
the issue <strong>of</strong> “home rule”, where the authority <strong>of</strong> the<br />
<strong>City</strong>’s elected <strong>of</strong>ficials is being usurped by other,<br />
higher levels <strong>of</strong> government. The ability <strong>of</strong> the <strong>City</strong><br />
C-8 Fiscal Year <strong>2008</strong> Annual Budget
Financial Health & Strategy<br />
The <strong>City</strong> <strong>of</strong> <strong>Lakeland</strong> provides a wide variety <strong>of</strong> services to the citizens <strong>of</strong> <strong>Lakeland</strong>. In many cases, the nature<br />
<strong>of</strong> these services accommodates recovery <strong>of</strong> the operating and capital costs associated with those services in<br />
the form <strong>of</strong> a user charge levied against the users based on actual consumption. Examples <strong>of</strong> these are<br />
electric, water, wastewater and solid waste management services, stormwater management, a parking system<br />
and a public golf course. These are referred to as “enterprise” services. Other services, such as provision <strong>of</strong><br />
public safety, transportation systems and leisure activities do not lend themselves to recovery <strong>of</strong> the underlying<br />
costs directly from the users <strong>of</strong> those services. Accordingly, the day to day operating costs associated with<br />
these services are generally financed from generic revenue sources such as property and sales taxes. These<br />
are referred to as “general governmental” services.<br />
The <strong>City</strong> has a long-held strategy <strong>of</strong> establishing user fees for enterprise services that will attempt to recover<br />
the underlying costs directly from users whenever practical to do so. To the extent these services can be<br />
performed by the <strong>City</strong> at costs that are competitive with rates and charges for the same services <strong>of</strong>fered by<br />
other local governments in the state or by the private sector, the <strong>City</strong> has adopted the practice <strong>of</strong> marking up<br />
the prices levied for those services to accommodate a payment in lieu <strong>of</strong> taxes or a dividend from those<br />
enterprise operations to the General Fund. These “transfers” help to finance a portion <strong>of</strong> the operating costs <strong>of</strong><br />
those general governmental services that are financed from property and sales taxes. The percentage <strong>of</strong> the<br />
gross revenues earned by these utility operations that is transferred to the General Fund for FY <strong>2008</strong> is<br />
budgeted as follows:<br />
Electric 6.3%<br />
Water 15.9%<br />
Wastewater 8.4%<br />
Solid Waste 9.5%<br />
In the aggregate, this represents approximately 34 percent <strong>of</strong> the total General Fund budget for FY <strong>2008</strong>. This<br />
represents a decrease from an aggregate 41 percent for the 1998 fiscal year and 46 percent in fiscal year 1988.<br />
As with any enterprise, a major concern is cost control. The <strong>City</strong> <strong>of</strong> <strong>Lakeland</strong> is committed to providing quality<br />
services at a reasonable cost. One <strong>of</strong> the best measures <strong>of</strong> whether or not that goal is being attained is a<br />
comparison <strong>of</strong> fees charged by <strong>Lakeland</strong>, in the form <strong>of</strong> utility rates AND tax rates, compared to other<br />
municipalities. The following represents a comparison <strong>of</strong> the total amount paid in FY 2007 by a typical<br />
residential homeowner to their local governments, based on a typical “basket <strong>of</strong> services” <strong>of</strong>fered by those<br />
municipalities.<br />
Annual Cost<br />
7,000<br />
6,000<br />
Utilities<br />
Sales Tax<br />
County, School, District Property Tax<br />
<strong>City</strong> Property Taxes<br />
5,000<br />
4,000<br />
3,000<br />
2,000<br />
1,000<br />
-<br />
Bartow<br />
Jacksonville<br />
Gainesville<br />
<strong>Lakeland</strong><br />
Tallahassee<br />
Orlando<br />
Tampa<br />
West Palm Beach<br />
C-9 Fiscal Year <strong>2008</strong> Annual Budget
Financial Health & Strategy<br />
In each case, the category <strong>of</strong> “Utilities” represents the cost <strong>of</strong> electric, water, wastewater and solid waste<br />
service, based on consumption volumes typical for the average residential customer <strong>of</strong> <strong>Lakeland</strong>. In<br />
cases where the electric utility in a compared municipality is NOT owned by the local government, the<br />
rates charged by the private company that serves that municipality are used.<br />
In the aggregate, <strong>Lakeland</strong> compares favorably to the other cities in this survey. At a property tax<br />
millage rate <strong>of</strong> 3.545 mills (based on the FY 2007 property tax levy) and an average residential taxable<br />
value <strong>of</strong> approximately $91,000, <strong>Lakeland</strong>’s property tax burden is amongst the lowest in the state <strong>of</strong><br />
Florida. On the other hand, the price <strong>of</strong> electricity provided by <strong>Lakeland</strong>’s municipal electric utility is<br />
generally higher than many other utilities in Florida, given <strong>Lakeland</strong>’s relatively high reliance on natural<br />
gas as a fuel source used to generate electric power. For the municipalities in this sample, the<br />
combined annual cost <strong>of</strong> utility services in <strong>Lakeland</strong> is 3 % higher than the average for the group, while<br />
the combined annual tax burden (including utility and sales taxes) is 13% less than the average for the<br />
group.<br />
The capital cost <strong>of</strong> providing general governmental services are generally financed from a combination<br />
<strong>of</strong> impact fees, grants, gasoline taxes, and the proceeds from the lease <strong>of</strong> a <strong>City</strong>-owned hospital to a<br />
private, not-for-pr<strong>of</strong>it corporation. The latter revenue source has grown an average <strong>of</strong> 8% per anum <strong>of</strong><br />
the past 15 years – approximately double the growth rate <strong>of</strong> the other revenue sources. It represents<br />
approximately 50 percent <strong>of</strong> the total funds available to finance the capital cost <strong>of</strong> general governmental<br />
services.<br />
Starting in FY 2000, the <strong>City</strong> began transferring a portion <strong>of</strong> the lease revenues to the General Fund to<br />
help finance the ongoing operating costs associated with construction <strong>of</strong> new fire stations and funding<br />
for police <strong>of</strong>ficers under expiring Federal Grants. The ten year capital improvement program for fiscal<br />
years 2007 thru 2016 shows that 39% <strong>of</strong> that revenue source will be diverted to financing operating<br />
costs.<br />
During a strategic planning session held by the <strong>Lakeland</strong> <strong>City</strong> Commission in January 2007, a total <strong>of</strong><br />
over $100 million in unfunded capital projects <strong>of</strong> a general governmental nature were identified. It was<br />
concluded that a restructuring <strong>of</strong> the funding strategy to eliminate the payment <strong>of</strong> operating costs from<br />
the proceeds <strong>of</strong> the lease would provide sufficient funds to finance the deficit in capital projects. Various<br />
strategies were discussed, which involved replacing the lease proceeds used to finance operating costs<br />
with increases in more traditional revenue sources dedicated to that purpose, including property tax and<br />
utility dividends.<br />
Subsequent to that planning session, the Legislature for the State <strong>of</strong> Florida adopted property tax reform<br />
as a major initiative. In conjunction with that, legislation was passed at the state level which compelled<br />
local governments to reduce property tax rates as “phase one” in the tax reform process. A referendum<br />
will be placed before Florida voters in January <strong>of</strong> <strong>2008</strong> that, if passed, would further reduce property tax<br />
revenues available to local governments such as <strong>Lakeland</strong>.<br />
As a result <strong>of</strong> this legislation, there was very little opportunity to restructure the cross-subsidy <strong>of</strong><br />
operating versus capital costs associated with general governmental services. The long-range capital<br />
budget adopted for the <strong>2008</strong> thru 2017 timeframe showed a slight decrease in the percent <strong>of</strong> the annual<br />
lease revenues diverted to financing operating costs from 39% to 36%, however there still remains a<br />
significant shortage in funding for capital improvements needed over the remaining 10 years.<br />
The financing strategies to be adopted by <strong>Lakeland</strong> (as well as for all other local governments in Florida)<br />
will be impacted significantly by the continuing impact <strong>of</strong> property tax reform. One <strong>of</strong> the proposals<br />
mandated by the tax reform legislation imposed upon local governments in Florida is an annual cap on<br />
the increase in property tax revenues equal to the value <strong>of</strong> new construction during the year (the rolledback<br />
rate) plus a percentage factor equal to the change in state-wide per-capital personal income.<br />
C-10 Fiscal Year <strong>2008</strong> Annual Budget
Financial Health & Strategy<br />
The following chart demonstrates growth in general governmental operating expenses in the <strong>City</strong> <strong>of</strong><br />
<strong>Lakeland</strong> (total spending within the General Fund) since 1991, compared to an “index” based on<br />
historical increases in property values from new construction and the percentage growth in state-wide<br />
per capita income:<br />
General Fund Expenditures - Compared to increase<br />
new construction/growth in per capita income<br />
Annual Spending<br />
105,000,000<br />
100,000,000<br />
95,000,000<br />
90,000,000<br />
85,000,000<br />
80,000,000<br />
75,000,000<br />
70,000,000<br />
65,000,000<br />
60,000,000<br />
55,000,000<br />
50,000,000<br />
45,000,000<br />
40,000,000<br />
35,000,000<br />
30,000,000<br />
1991<br />
1992<br />
Annual Spending Index<br />
1993<br />
1994<br />
1995<br />
1996<br />
1997<br />
1998<br />
1999<br />
2000<br />
2001<br />
2002<br />
2003<br />
2004<br />
2005<br />
2006<br />
2007<br />
<strong>2008</strong><br />
Annual Spending-Actual<br />
This chart demonstrates that overall, the growth in the rate <strong>of</strong> spending within <strong>Lakeland</strong>’s General Fund<br />
has generally tracked below the index for the past ten years. This suggests that <strong>Lakeland</strong> has done a<br />
reasonable job in managing increases in spending rates, assuming the index adopted by the state<br />
legislature is a realistic benchmark <strong>of</strong> “acceptable” rates <strong>of</strong> spending growth.<br />
However, the<br />
primary revenue<br />
sources available<br />
to <strong>Lakeland</strong> to<br />
finance this growth<br />
in spending have<br />
(generally) not<br />
kept pace with this<br />
index:<br />
Annual Revenues<br />
45,000,000<br />
40,000,000<br />
35,000,000<br />
30,000,000<br />
25,000,000<br />
20,000,000<br />
15,000,000<br />
Combined Utility Transfers - Compared to<br />
increase new construction/growth in per capita<br />
income<br />
Annual Transfer Growth Index"<br />
1991<br />
1992<br />
1993<br />
1994<br />
1995<br />
1996<br />
1997<br />
1998<br />
1999<br />
2000<br />
2001<br />
2002<br />
2003<br />
2004<br />
2005<br />
2006<br />
2007<br />
<strong>2008</strong><br />
Annual Transfer - Actual<br />
C-11 Fiscal Year <strong>2008</strong> Annual Budget
Financial Health & Strategy<br />
This source <strong>of</strong> revenue has not kept pace with the growth index. The temporary decreases in fiscal<br />
years 2005 thru 2007 were the result <strong>of</strong> decreases in the annual transfer from the <strong>City</strong>-owned electric<br />
utility system to the General Fund, in response to significant reductions in net revenues <strong>of</strong> the electric<br />
system available to accommodate those transfers during that period <strong>of</strong> time. Overall, the inability <strong>of</strong><br />
these utility-based enterprise operations to generate pr<strong>of</strong>its necessary to keep pace with spending<br />
growth is due primarily to the need to keep the utility rates assessed within those operations reasonable<br />
in relation to the rates and charges levied for the same services within comparable city’s in the state.<br />
28,000,000<br />
Non-ad valorem taxes - Compared to increase<br />
new construction/growth in per capita income<br />
23,000,000<br />
Annual Revenue<br />
18,000,000<br />
13,000,000<br />
8,000,000<br />
Annual Growth Index<br />
1991<br />
1992<br />
1993<br />
1994<br />
1995<br />
1996<br />
1997<br />
1998<br />
1999<br />
2000<br />
2001<br />
2002<br />
2003<br />
2004<br />
2005<br />
2006<br />
2007<br />
<strong>2008</strong><br />
Non advalorem tax growth-Actual<br />
These revenues, which consist <strong>of</strong> taxes on electric and water utilities, taxes on communications<br />
services, and a portion <strong>of</strong> a one-half sales tax levied by Polk County, have not kept pace with the growth<br />
in the index – primarily since fiscal 2003. The period from 2001 thru 2003 was marked by significant<br />
increases in tax revenues from telecommunication services sold within <strong>Lakeland</strong>, mostly the result <strong>of</strong><br />
changes in the taxing methodology adopted state-wide during that period <strong>of</strong> time. Since that time, sales<br />
<strong>of</strong> those services have been relatively flat.<br />
Revenues from half cent sales taxes increased an average <strong>of</strong> 7 percent annually during the five year<br />
period 2002 thru 2006, however revenues have decreased state-wide since then, due to some extent by<br />
the much slower pace <strong>of</strong> new building construction.<br />
C-12 Fiscal Year <strong>2008</strong> Annual Budget
Financial Health & Strategy<br />
Property Taxes - Compared to increase new<br />
construction/growth in per capita income<br />
19,000,000<br />
17,000,000<br />
Annual Revenues<br />
15,000,000<br />
13,000,000<br />
11,000,000<br />
9,000,000<br />
7,000,000<br />
5,000,000<br />
2.995 mills<br />
1991<br />
1992<br />
1993<br />
1994<br />
1995<br />
1996<br />
Property Tax Growth Index<br />
3.545 mills<br />
1997<br />
1998<br />
1999<br />
2000<br />
2001<br />
2002<br />
2003<br />
2004<br />
2005<br />
2006<br />
2007<br />
Property taxes are the only significant source <strong>of</strong> revenue available to finance the cost <strong>of</strong> general governmental<br />
services that has kept pace with the growth index adopted by the State <strong>of</strong> Florida. In recent years, this revenue<br />
source has exceeded the index – primarily because <strong>of</strong> a .55 mill increase in the tax rate adopted in fiscal year<br />
2004 to finance significant increases in the cost <strong>of</strong> public safety that occurred during that year. Fiscal years<br />
2006 and 2007 saw further increases in that revenue source, resulting from double-digit percentage growth in<br />
property appreciation during those years. <strong>Lakeland</strong> experience property appreciation <strong>of</strong> approximately 9.5<br />
percent for fiscal year <strong>2008</strong>, however the impact <strong>of</strong> mandated roll-back <strong>of</strong> tax rates negated that increase.<br />
Strategically, the <strong>City</strong> <strong>of</strong> <strong>Lakeland</strong> is at a cross-road with respect to determining the best approach toward<br />
financing the operating costs <strong>of</strong> local government. <strong>Lakeland</strong> is relatively unique in that it owns pr<strong>of</strong>itable utility<br />
operations (electric, water, wastewater, solid waste) which have been able to provide dividend transfers to the<br />
General Fund. These transfers have historically enabled <strong>Lakeland</strong> to maintain low property tax rates. As<br />
demonstrated, this source <strong>of</strong> revenue is not growing at the pace necessary to sustain the level <strong>of</strong> subsidy<br />
necessary to maintain the lower than average ad valorem tax rate – absent increasing reliance on other<br />
revenue sources. In recent years, the relative slow growth rate from this source <strong>of</strong> revenue has been <strong>of</strong>fset by<br />
slower than indexed rates <strong>of</strong> spending growth, and higher than index rates <strong>of</strong> property tax growth. Given the<br />
impacts <strong>of</strong> property tax reform and the continued shortfall in financing available to pay for capital improvements,<br />
<strong>Lakeland</strong> will need to consider some fundamental changes in its approach.<br />
<strong>Lakeland</strong> has historically balanced its annual budget without reliance on formal, written policies that determine<br />
the dollar value <strong>of</strong> transfers to the General Fund from utility operations. Instead, <strong>Lakeland</strong> has simply<br />
performed an annual “balancing” <strong>of</strong> the need for revenues within the General Fund versus the financial ability <strong>of</strong><br />
these operations to make larger annual transfers while still maintaining competitive rates. <strong>Lakeland</strong> will most<br />
likely need to address the adoption <strong>of</strong> more formal policies regarding the dollar value <strong>of</strong> these transfers – not<br />
necessarily for the purpose <strong>of</strong> increasing the level <strong>of</strong> reliance on those sources <strong>of</strong> funds – but to better identify<br />
the extent to which changes in property tax rates will be needed to financed the continued cost <strong>of</strong> government<br />
at it’s current levels <strong>of</strong> service.<br />
<strong>2008</strong><br />
Property Taxes - Actual<br />
C-13 Fiscal Year <strong>2008</strong> Annual Budget
Financial Health & Strategy<br />
Cash Reserves<br />
The following chart shows the historical dollar value <strong>of</strong> cash reserves held by the <strong>City</strong> at the end <strong>of</strong><br />
each fiscal year since 1998. This represents the amount <strong>of</strong> working capital on hand within the<br />
General Fund (which finances general governmental operating costs) and the combined working<br />
capital balances in the Public Improvement, Transportation, Stormwater and Community<br />
Redevelopment Funds (which finance general governmental capital costs) at the start <strong>of</strong> each<br />
fiscal year.<br />
Cash Reserves - General Governmental Activities<br />
7,000,000<br />
6,000,000<br />
Operating<br />
Capital<br />
5,000,000<br />
4,000,000<br />
3,000,000<br />
2,000,000<br />
1,000,000<br />
0<br />
1998 1999 2000 2001 2002 2003 2004 2005 2006 2007 <strong>2008</strong><br />
The total value <strong>of</strong> working capital at the start <strong>of</strong> FY <strong>2008</strong> represents approximately 9 percent <strong>of</strong> the<br />
FY <strong>2008</strong> budgeted expenditures for these general governmental activities. By comparison the<br />
total value <strong>of</strong> working capital on hand at the start <strong>of</strong> FY 1998 represented approximately 10 percent<br />
<strong>of</strong> budgeted expenditures for general governmental activities<br />
C-14 Fiscal Year <strong>2008</strong> Annual Budget
Financial Health & Strategy<br />
The following chart shows similar information for the enterprise funds maintained by the <strong>City</strong> <strong>of</strong> <strong>Lakeland</strong>:<br />
Cash Reserves - Enterprise Funds<br />
80,000,000<br />
70,000,000<br />
<strong>Lakeland</strong> Electric<br />
All Other Enterprise Funds<br />
60,000,000<br />
50,000,000<br />
40,000,000<br />
30,000,000<br />
20,000,000<br />
10,000,000<br />
-<br />
1998 1999 2000 2001 2002 2003 2004 2005 2006 2007 <strong>2008</strong><br />
The dollar values shown above for <strong>Lakeland</strong> Electric represent unrestricted cash on hand. This number<br />
excludes approximately $25 million set aside in an unrestricted account to pay down debt obligations<br />
starting in FY 2009 and also excludes approximately $10 million in unrestricted cash set aside to fund<br />
capital projects that have already been appropriated and which will be expended over the course <strong>of</strong> the<br />
next two years. The dollar amount shown for the other enterprise funds represents total net working<br />
capital <strong>of</strong> those operations, combined.<br />
The dollar value <strong>of</strong> cash reserves within <strong>Lakeland</strong> Electric has fallen significantly since 2006 as a result<br />
<strong>of</strong> the impact <strong>of</strong> natural gas prices on a wholesale power sales contract between <strong>Lakeland</strong> Electric and<br />
the Florida Municipal Power Agency. Under the terms <strong>of</strong> that contract, <strong>Lakeland</strong> Electric is obligated to<br />
sell up to 100 MwH <strong>of</strong> electricity to FMPA at a contract price that was fixed back in 2000. As a result <strong>of</strong><br />
the recent escalation <strong>of</strong> prices in natural gas, the contract price is not sufficient to cover the underlying<br />
costs generating the power. As a result, the utility has experienced significant losses as a result <strong>of</strong> that<br />
contract. Over the seven year term <strong>of</strong> the contract (which ends December 15, 2007), the utility is<br />
expected to lose in excess <strong>of</strong> $92 million on this transaction. In response to that, the <strong>City</strong> reduced the<br />
annual dividend paid from <strong>Lakeland</strong> Electric to the General Fund starting in FY 2005 by an aggregate<br />
amount <strong>of</strong> approximately $14 million. <strong>Lakeland</strong> Electric also deferred certain capital projects in the last<br />
year. The remainder <strong>of</strong> the losses incurred in conjunction with the contract had the effect <strong>of</strong> reducing<br />
cash reserves, as indicated above. This contract expires during the first quarter <strong>of</strong> FY <strong>2008</strong>, and<br />
accordingly it’s impact on working capital is minimal going forward.<br />
Total cash-based liquidity <strong>of</strong> $43.5 million within <strong>Lakeland</strong> Electric is equivalent <strong>of</strong> 52 days <strong>of</strong> operating<br />
expenses. Inclusion <strong>of</strong> other unrestricted cash in this calculation increases that number to 94 days <strong>of</strong><br />
total unrestricted liquidity.<br />
Total working capital for all other enterprise funds combined represents approximately 10.5% <strong>of</strong> the FY<br />
<strong>2008</strong> budget for those funds.<br />
C-15 Fiscal Year <strong>2008</strong> Annual Budget
Revenue Sources<br />
The <strong>City</strong> <strong>of</strong> <strong>Lakeland</strong> relies on a variety <strong>of</strong> revenue sources in order to finance the cost <strong>of</strong> services<br />
provided to its citizens. Some <strong>of</strong> these revenues can be directly associated with the cost <strong>of</strong> specific services.<br />
Examples include the user fees charged for electricity, water, wastewater and solid waste collection services,<br />
use <strong>of</strong> parking facilities, and certain fees for recreational facilities including the city-owned golf course. The<br />
amount charged increases or decreases based on the volume <strong>of</strong> services provided (i.e. electric revenues are<br />
based on an amount per kWh). For these services, the intent is that 100 percent <strong>of</strong> the cost <strong>of</strong> providing that<br />
service is recovered thru the imposition <strong>of</strong> this user fee.<br />
Other governmental revenues sources can not be related directly to underlying services, primarily because<br />
the services do not lend themselves to cost recovery using a direct user charge. Examples are police and fire<br />
services, maintenance <strong>of</strong> roadways and parks, libraries, etc. These public services are financed through a<br />
variety <strong>of</strong> “generic” revenue sources including property, sales and utilities taxes, and state and local grants.<br />
The <strong>City</strong> <strong>of</strong> <strong>Lakeland</strong> also relies on the pr<strong>of</strong>its earned by the Electric, Water, Wastewater and Solid Waste utility<br />
operations as a source <strong>of</strong> revenue to finance these same general governmental functions.<br />
Property Tax Revenues<br />
Percent<br />
23%<br />
22%<br />
21%<br />
20%<br />
19%<br />
18%<br />
17%<br />
16%<br />
15%<br />
14%<br />
13%<br />
12%<br />
1997 1998 1999 2000 2001 2002 2003 2004 2005 2006 2007<br />
Year<br />
The State <strong>of</strong> Florida mandates that <strong>City</strong>’s include no more than 95 percent <strong>of</strong> the calculated tax proceeds in<br />
preparing the annual budget. This reduction is intended to compensate for discounts <strong>of</strong>fered to taxpayers, and a<br />
small percentage <strong>of</strong> tax bills that go unpaid each year. Because <strong>of</strong> the relatively large annual percent increases<br />
in taxable values, the significance <strong>of</strong> this revenue source as a percentage <strong>of</strong> the General Fund budget has been<br />
growing. The <strong>City</strong>’s property tax rate remained level at 2.995 mills from 1991 thru 2003. In FY2004, the millage<br />
was increased to the rate <strong>of</strong> 3.545 mills and remained the same until the <strong>2008</strong> Tax Reform where the rate was<br />
rolled back to 3.2942. The tax rate is adopted by the <strong>City</strong> Commission in conjunction with preparation <strong>of</strong> the<br />
annual budget. The property appraiser’s <strong>of</strong>fice certifies the taxable values <strong>of</strong> property in the <strong>City</strong> by July 1 <strong>of</strong><br />
each year.<br />
Public Service Taxes, Franchise Fees and<br />
Communications Services Tax<br />
The <strong>City</strong> levies:<br />
• A 10 percent Public Services Tax on the sale <strong>of</strong> electricity, water and natural gas (metered or bottled) within<br />
the city limits.<br />
• A tax on fossil fuel oil in the amount <strong>of</strong> 4 cents per gallon.<br />
• A Communications Services Tax on telephone service, (including local, long distance and mobile services),<br />
and on cable TV service. The <strong>City</strong>’s share <strong>of</strong> this tax is 6.43 percent. This rate was subsequently increased<br />
to 7.03 percent by the state <strong>of</strong> Florida representing the additional discretionary surtax <strong>of</strong> .60 percent that is<br />
remitted to the county school board.<br />
• The <strong>City</strong> has extended a franchise agreement to Peoples Gas System (a division <strong>of</strong> Tampa Electric<br />
Company) to distribute metered gas within the <strong>City</strong> limits. The franchise agreement calls for a payment to the<br />
<strong>City</strong> equal to 6 percent <strong>of</strong> monthly gross revenues.<br />
C-16 Fiscal Year <strong>2008</strong> Annual Budget
Revenue Sources<br />
Half Cent Sales Tax Revenues<br />
County and Municipal governments in Florida are entitled to a distribution equal to 9.653 percent <strong>of</strong> total sales<br />
tax proceeds attributable to sales within each county. Those revenues are shared between the County<br />
government and each <strong>of</strong> the Municipal governments within the County. Effective July 1, 2004, this revenue<br />
source decreased by approximately 8.7 percent, based on the State <strong>of</strong> Florida’s change in funding procedures<br />
related to the state-run court system. This decrease was intended to be <strong>of</strong>fset by increases in the amount <strong>of</strong><br />
State Revenue Sharing funds disbursed to cities and counties.<br />
State Revenue Sharing Revenues<br />
The State <strong>of</strong> Florida distributes revenues to each county and municipal government based on a Revenue Sharing<br />
act adopted in 1972. At one time, this distribution was based on the dollar value <strong>of</strong> cigarette taxes collected within<br />
each county, however the methodology was changed in FY 2000 to remove the cigarette taxes as the basis for<br />
the distribution, and now the basis for this distribution consists <strong>of</strong> a stated percentage <strong>of</strong> the general state-wide<br />
sales, use, and other taxes. This calculation is performed by the State Department <strong>of</strong> Revenue, based on<br />
population data provided by each county. This revenue source has been relatively flat over the past ten years.<br />
The portion <strong>of</strong> the general state-wide sales and use tax dedicated to the Revenue Sharing fund increased from<br />
1.0715 percent to 1.3409 percent in July 2004.<br />
Annual Revenues<br />
Business Tax (Formerly Occupational Licenses) Revenues<br />
The <strong>City</strong> issues receipts (licenses) to all commercial business enterprises located within the <strong>City</strong> limits. A fee is<br />
assessed to each user, based on a predefined fee schedule that considers the type <strong>of</strong> business conducted and<br />
the volume <strong>of</strong> business<br />
Business Tax Receipt Revenues<br />
conducted. By state law,<br />
the rates charged per the<br />
1,700<br />
adopted fee schedule may<br />
be increased every other<br />
1,600<br />
year, in an amount that<br />
1,500<br />
does not exceed 5 percent<br />
per receipt.<br />
1,400<br />
1,300<br />
1,200<br />
1,10 0<br />
The last change to the rate<br />
structure was a 5%<br />
increase adopted by the<br />
<strong>City</strong> in 2005.<br />
1,000<br />
900<br />
1997 1998 1999 2000 2001 2002 2003 2004 2005 2006<br />
Fiscal Year<br />
Building Permit Revenues<br />
Permit fees are issued for construction/renovation occurring within the <strong>City</strong> limits. Separate permit fees are<br />
levied for landscaping, building, plumbing, electrical, and other mechanical improvements. This fee is intended<br />
to cover the cost <strong>of</strong> inspections performed by building inspectors employed by the <strong>City</strong>. This fee structure was<br />
increased by 6 percent for fiscal 2006.<br />
C-17 Fiscal Year <strong>2008</strong> Annual Budget
Revenue Sources<br />
Federal, State and Local Grant Revenues<br />
The <strong>City</strong> applies for grants from various federal, state and local agencies to help finance specific operating<br />
costs. In recent history, the majority <strong>of</strong> these grants have been to hire additional police <strong>of</strong>ficers. These grant<br />
programs typically reimburse the <strong>City</strong> for a stated percentage <strong>of</strong> specific program costs. This revenue source<br />
has been declining rapidly as the federal government scales back it’s funding for law enforcement. This chart<br />
represents a comparative history <strong>of</strong> the revenues from these grants, along with the underlying program<br />
expenses over the last ten years.<br />
Fiscal # <strong>of</strong> Funded Total Grant %<br />
Year Postions Cost Revenues Funded<br />
1997 51 2,010,000 1,234,000 61%<br />
1998 69 2,927,000 1,744,000 60%<br />
1999 74 3,271,000 1,974,000 60%<br />
2000 77 3,278,000 2,202,000 67%<br />
2001 54 2,523,000 1,519,000 60%<br />
2002 37 1,935,000 1,379,000 71%<br />
2003 31 1,344,000 934,000 69%<br />
2004 23 1,233,000 799,000 65%<br />
2005 23 1,133,772 587,042 52%<br />
2006 13 1,009,853 768,342 76%<br />
Charges for Service Revenues<br />
Charges for Services represent user fees assessed directly against the users <strong>of</strong> municipal services. The most<br />
significant <strong>of</strong> these are parks and recreation fees, which generated approximately $1.5 million last year against<br />
total operating expenses <strong>of</strong> $11.2 million (excluding capital). These revenues consist <strong>of</strong> facility rental fees,<br />
recreational class/program fees, tennis and swimming fees, and parking and expense recovery fees related to<br />
the Detroit Tigers major and minor league activities at Marchant Stadium. This category <strong>of</strong> revenues also<br />
includes a variety <strong>of</strong> other fees, as follows:<br />
• Lot Clearing and Cleaning<br />
• Building Demolition<br />
• Sale <strong>of</strong> fire inspection permits<br />
• False alarm fees<br />
• Reimbursement for overtime services provided by the <strong>Lakeland</strong> Police Department, established in<br />
conjunction with the collective bargaining agreement with the police union<br />
• Wrecker Service permitting fees<br />
• Public Records Copying<br />
• Zoning fees<br />
• Cemetery fees<br />
Did you know...<br />
The Detroit Tigers began<br />
their pre-season training in<br />
<strong>Lakeland</strong> in 1934.<br />
C-18 Fiscal Year <strong>2008</strong> Annual Budget
Revenue Sources<br />
Fines and Forfeits Revenues<br />
This category consists primarily <strong>of</strong> the proceeds from fines issued for motor vehicle traffic infractions. Also<br />
included in this category:<br />
• Revenues that pass-thru the <strong>City</strong> and are paid to police <strong>of</strong>ficers who have achieved certain levels <strong>of</strong><br />
higher education as supplemental compensation.<br />
• Proceeds from confiscated cash and property seized by law enforcement agencies.<br />
• Collection <strong>of</strong> fines levied by the <strong>City</strong>’s Code Enforcement Board.<br />
Miscellaneous Revenues<br />
The majority <strong>of</strong> the revenue included in this category represents investment income earned on working capital<br />
held by the General Fund and the various restricted sub-funds maintained within the General Fund:<br />
• Hollis Gardens Maintenance Trust Fund<br />
• Law Enforcement Trust Fund (confiscated property)<br />
• Recreation Facilities<br />
• Cultural Activities Reserve<br />
This category also includes:<br />
• Approximately $100,000 in proceeds from leases <strong>of</strong> various city-owned buildings to private entities.<br />
The majority <strong>of</strong> these leases include some provisions for CPI increases<br />
• Proceeds from the sale <strong>of</strong> cemetery lots<br />
• Contributions and donations from private entities<br />
• Cost reimbursements collected from other city funds/departments for the use <strong>of</strong> radio equipment<br />
maintained by the Radio shop<br />
Gasoline Tax (1 Cent Municipal Fuel Tax) Revenues<br />
The amount <strong>of</strong> this tax is equal to 1 cent per gallon <strong>of</strong> gasoline sold within the municipal limits, less an<br />
administrative fee (retained by the state) not exceeding 2% <strong>of</strong> the gross proceeds <strong>of</strong> the tax.<br />
The proceeds <strong>of</strong> this tax shall be used for the purchase <strong>of</strong> transportation facilities, roads and street rights-<strong>of</strong>-way;<br />
construction, reconstruction, and maintenance <strong>of</strong> roads, streets, bicycle paths, and pedestrian pathways;<br />
adjustment <strong>of</strong> city-owned utilities as required by road and street construction; and construction, reconstruction,<br />
transportation-related public safety activities, maintenance, and operation <strong>of</strong> transportation facilities. Municipalities<br />
are authorized to expend the funds received under this section in conjunction with other cities, counties, the state<br />
or federal government in joint projects.<br />
Gasoline Tax (9th Cent Fuel Tax) Revenues<br />
This is an optional tax, levied by the county, and shared with municipalities within the county based on an<br />
interlocal agreement. Per that interlocal agreement the distribution formula is weighted 50% towards the ratio <strong>of</strong><br />
each municipality’s population to total county population, and 50% towards the ratio <strong>of</strong> each municipality’s lane<br />
miles to total county lane miles. For FY 2005, this calculated ration equaled 14.302% <strong>of</strong> the total county taxes<br />
(an increase from the FY 2004 percentage allocation <strong>of</strong> 14.006% and a decrease from the FY 2003 percentage<br />
allocation <strong>of</strong> 14.802%).<br />
C-19 Fiscal Year <strong>2008</strong> Annual Budget
Revenue Sources<br />
6 Cents Local Option Fuel Tax Revenues<br />
This is an optional tax, levied by the county, and shared with municipalities within the county based on an<br />
interlocal agreement. The distribution formula is identical to that used for the 9th cent fuel tax. The eligible uses <strong>of</strong><br />
these funds are also identical to those <strong>of</strong> the 9th cent fuel tax.<br />
5 Cents Additional Local Option Fuel Tax Revenues<br />
This is an optional tax, levied by the county, and shared with municipalities within the county based on an interlocal<br />
agreement. The distribution formula is identical to that used for the 9th cent fuel tax. The proceeds <strong>of</strong> this tax shall<br />
be used for “transportation expenditures” needed to meet the requirements <strong>of</strong> the capital improvements element <strong>of</strong><br />
an adopted comprehensive plan or for expenditures needed to meet immediate local transportation problems and<br />
for other transportation-related expenditures that are critical for building comprehensive roadway networks by local<br />
governments. Expenditures for the construction <strong>of</strong> new roads, the reconstruction or resurfacing <strong>of</strong> existing paved<br />
roads, or the paving <strong>of</strong> existing graded roads shall be deemed to increase capacity and such projects shall be<br />
included in the capital improvements element <strong>of</strong> an adopted comprehensive plan. Expenditures <strong>of</strong> this revenue<br />
source shall not include routine maintenance <strong>of</strong> roads.<br />
C-20 Fiscal Year <strong>2008</strong> Annual Budget
Debt Management Overview<br />
The <strong>City</strong> <strong>of</strong> <strong>Lakeland</strong> (the “<strong>City</strong>”) incurs long term<br />
debt – either in the form <strong>of</strong> bonds issued directly in<br />
the name <strong>of</strong> the <strong>City</strong> or other loans obtained from<br />
pooled debt programs managed by third parties – for<br />
the purpose <strong>of</strong> funding capital improvements to <strong>City</strong><br />
facilities and infrastructure. Although the <strong>City</strong> has<br />
established specific policies related to the issuance<br />
and structuring <strong>of</strong> debt (see page B-18), the overall<br />
level <strong>of</strong> outstanding debt is not constrained by a<br />
specific legal limit. However, because most <strong>of</strong> the<br />
<strong>City</strong>’s debt is revenue based, rating agency and<br />
market requirements effectively constrain bond<br />
issuance. The <strong>City</strong> also funds a significant amount <strong>of</strong><br />
capital improvements through “pay-as-you-go” cash<br />
financing. Pay-as-you-go financing comes from cash<br />
outlays <strong>of</strong> various revenues including state and<br />
federal grants, impact fees, certain lease payments,<br />
and other operating revenues. As <strong>of</strong> September 30,<br />
2006, the <strong>City</strong> had outstanding long-term debt <strong>of</strong><br />
$684.8 million.<br />
Purpose <strong>of</strong> Debt<br />
<strong>City</strong> <strong>of</strong> <strong>Lakeland</strong><br />
Outstanding Debt by Use<br />
FY2006<br />
Electric system improvements include: construction<br />
and conversion <strong>of</strong> generating assets; environmental<br />
projects; renewal, replacement and expansion <strong>of</strong> the<br />
transmission and distribution network; and numerous<br />
other projects. Water and wastewater improvements<br />
include construction and improvements to water and<br />
wastewater treatment systems and replacement and<br />
expansion <strong>of</strong> distribution and collection networks. All<br />
other projects encompass a variety <strong>of</strong> governmental<br />
and development projects, including improvements to<br />
and/or expansion <strong>of</strong> the <strong>Lakeland</strong> Linder Regional<br />
Airport, the <strong>Lakeland</strong> Center, the Cleveland Heights<br />
Golf Course, public safety facilities and parks and<br />
recreation facilities.<br />
As shown, the bulk <strong>of</strong> debt incurred by the <strong>City</strong> is for<br />
the provision <strong>of</strong> basic utilities, i.e., electricity, water<br />
and wastewater. The <strong>City</strong> operates a municipally<br />
owned electric system, including power generation,<br />
as well as transmission and distribution. In many<br />
communities, these services are provided through<br />
investor-owned (private) utility companies. In those<br />
communities, the debt (or equity) used to finance<br />
electric utilities would appear in the financial<br />
statements <strong>of</strong> the private corporations, not the city or<br />
town. Because the <strong>City</strong> <strong>of</strong> <strong>Lakeland</strong> owns and<br />
operates the electric utility, it incurs a much larger<br />
amount <strong>of</strong> debt than most other cities <strong>of</strong> comparable<br />
size.<br />
All Other Uses, $83.4M<br />
12%<br />
Water & Wastew ater<br />
System, $104.0M<br />
15%<br />
Electric System, $497.3M<br />
73%<br />
Debt issued by the <strong>City</strong> was incurred to fund capital<br />
improvements to three major categories <strong>of</strong> assets:<br />
the electric system, the water and wastewater<br />
system, and all other projects. Nearly threequarters<br />
(73%) <strong>of</strong> the <strong>City</strong>’s outstanding debt<br />
funded electric system improvements. Water and<br />
wastewater projects make up another 15%, while<br />
all other uses account for the remaining 12% <strong>of</strong><br />
outstanding debt.<br />
Debt Trends<br />
Overall Debt: Over the last decade the <strong>City</strong>’s<br />
outstanding debt has increased by about 14% ($85<br />
million). The increase is largely the result <strong>of</strong> the<br />
issuance <strong>of</strong> a significant amount <strong>of</strong> debt ($120<br />
million) in FY 2001, which was used to fund the<br />
conversion <strong>of</strong> one <strong>of</strong> the Electric Department’s major<br />
generating assets. Except for this major outlay, the<br />
Millions <strong>of</strong> $<br />
750<br />
700<br />
650<br />
600<br />
550<br />
<strong>City</strong> <strong>of</strong> <strong>Lakeland</strong><br />
Outstanding Debt<br />
500<br />
1997 1998 1999 2000 2001 2002 2003 2004 2005 2006<br />
Fiscal Year<br />
C-21 Fiscal Year <strong>2008</strong> Annual Budget
Debt Management Overview<br />
<strong>City</strong>’s overall debt would have remained relatively<br />
level or declined.<br />
During FY 2007, total outstanding debt will remain<br />
relatively constant. Scheduled repayments and<br />
new debt will roughly <strong>of</strong>fset one another. During<br />
FY <strong>2008</strong>, overall debt is expected to increase by at<br />
least $20 million, while borrowing for electric<br />
system environmental remediation projects is<br />
expected to exceed projected debt repayments.<br />
Other Measures <strong>of</strong> Debt: Over the last decade, the<br />
<strong>Lakeland</strong> area has experienced substantial<br />
development and population growth. Although the<br />
dollar volume <strong>of</strong> debt outstanding is important,<br />
other normative measures, such as debt per capita<br />
(per person) and debt as a percentage <strong>of</strong> personal<br />
income, provide a more accurate gauge <strong>of</strong> an<br />
area’s debt burden. Debt per capita measures<br />
debt against the size and growth <strong>of</strong> the population<br />
served, by projects being financed. While debt as<br />
a percentage <strong>of</strong> personal income measures<br />
outstanding debt against an area’s ability to pay for<br />
projects. As shown below, <strong>Lakeland</strong>’s debt per<br />
capita has remained relatively flat over the last ten<br />
years, reaching $7,474 per person in 2006. Debt<br />
as a percentage <strong>of</strong> the area’s annual personal<br />
income has declined, dropping to 29% as <strong>of</strong> 2005<br />
(the last year for which data is available). As<br />
noted, most <strong>of</strong> the <strong>City</strong>’s debt has been incurred to<br />
finance electric system improvements. In other<br />
communities, these type <strong>of</strong> projects are financed<br />
through investor-owned utility companies. As<br />
such, any debt incurred to finance projects would<br />
not appear on that city’s books. If <strong>Lakeland</strong>’s<br />
electric system related debt is excluded from the<br />
calculations, debt per capita would drop to $2,046<br />
and debt as a percentage <strong>of</strong> personal income<br />
would be under 8%.<br />
Types <strong>of</strong> Debt<br />
The <strong>City</strong>’s long-term debt consists primarily <strong>of</strong><br />
bonds ($652.1 million – 95%) along with certain<br />
loans ($32.7 million – 5%). Bonds are formal<br />
borrowings issued through Wall Street to investors<br />
under trust indentures that specify the security for<br />
and source <strong>of</strong> repayment for the debt. The <strong>City</strong><br />
has several different types <strong>of</strong> bond debt, which are<br />
detailed below. The <strong>City</strong>’s loans consist almost<br />
exclusively <strong>of</strong> monies borrowed through various<br />
State programs.<br />
Bonds: The <strong>City</strong> <strong>of</strong> <strong>Lakeland</strong> has four distinct<br />
revenue bond programs which are summarized in<br />
the table on page C-23. Revenue debt consists <strong>of</strong><br />
a promise to repay bonds from a specified revenue<br />
stream. In contrast, general obligation debt entails<br />
a promise <strong>of</strong> the “full faith and credit” <strong>of</strong> a<br />
governmental entity and a requirement to repay<br />
any such debt from all available revenues,<br />
including the use <strong>of</strong> the entity’s taxing power. In<br />
Florida, local general obligation debt requires voter<br />
45%<br />
43%<br />
41%<br />
39%<br />
<strong>City</strong> <strong>of</strong> <strong>Lakeland</strong><br />
Debt Trends<br />
$8,500<br />
$8,000<br />
Personal Income<br />
37%<br />
35%<br />
33%<br />
$7,474<br />
$7,500<br />
$7,000<br />
Per Capita<br />
31%<br />
29%<br />
29%<br />
$6,500<br />
27%<br />
25%<br />
1997 1998 1999 2000 2001 2002 2003 2004 2005 2006<br />
Fiscal Year<br />
$6,000<br />
C-22 Fiscal Year <strong>2008</strong> Annual Budget
Debt Management Overview<br />
<strong>City</strong> <strong>of</strong> <strong>Lakeland</strong><br />
Revenue Bond Programs<br />
9/30/2006<br />
Type<br />
Source <strong>of</strong> Repayment<br />
Amount<br />
Outstanding<br />
Outstanding<br />
Through<br />
Interest Rate<br />
Energy System<br />
Water and Wastewater<br />
System<br />
Dedicated Tax<br />
Capital Improvement<br />
Rates, fees, charges and other<br />
operating revenues <strong>of</strong> the<br />
electric system – primarily<br />
payments from electricity<br />
customers<br />
Rates, fees, charges (including<br />
impact fees) and other<br />
operating revenues <strong>of</strong> the<br />
electric system – primarily<br />
payments from water and<br />
wastewater users<br />
Specified taxes, including: (a)<br />
taxes imposed by the <strong>City</strong> on<br />
utility services (electricity,<br />
water, gas & local<br />
communications); and (b)<br />
certain tourism taxes collected<br />
by Polk County on behalf <strong>of</strong> the<br />
<strong>City</strong><br />
Non-ad valorem revenues from<br />
any source legally available<br />
(not including ad valorem taxes<br />
on real and personal property),<br />
subject to availability &<br />
appropriation<br />
* includes $139.5 million <strong>of</strong> variable rate debt<br />
$523.3 M 2037 3.05% to 6.05%*<br />
65.4 M 2033 3.50% to 5.00%<br />
31.3 M 2022 3.50% to 4.50%<br />
32.0 M 2017 3.85% to 5.00%<br />
approval through a referendum. The <strong>City</strong> has not<br />
had any general obligation debt outstanding since<br />
1971. As shown, the overwhelming portion <strong>of</strong> the<br />
<strong>City</strong>’s bonds ($588.7 million - 90%) are utility system<br />
revenue bonds. They are user based debt: the<br />
bonds are issued for utility system improvements and<br />
repaid from the fees charged to the users <strong>of</strong> those<br />
utilities.<br />
Utility revenue bonds effect the operations <strong>of</strong> the<br />
relevant systems in two ways. They fund necessary<br />
improvements to the systems in questions allowing<br />
them to continue operating and producing services.<br />
In addition, the debt service requirements <strong>of</strong> the<br />
bonds are a component <strong>of</strong> cost that helps determine<br />
the level <strong>of</strong> fees charged.<br />
Loans: As noted, the <strong>City</strong>’s debt includes loans,<br />
primarily from the State <strong>of</strong> Florida under two<br />
programs. These include $19.8 million in loans<br />
through the Sunshine State Government Financing<br />
Commission for various <strong>City</strong> projects and $12.4<br />
million through the State Revolving Loan Program for<br />
wastewater projects. The security for the Sunshine<br />
State loans consists <strong>of</strong> a pledge <strong>of</strong> non ad valorem<br />
revenues similar to the <strong>City</strong>’s Capital Improvement<br />
Bonds. The State Revolving Loans are repaid from<br />
excess revenues <strong>of</strong> the wastewater system, and are<br />
subsidized by the State at below market rates. The<br />
<strong>City</strong> also has a small amount ($0.6 million) <strong>of</strong> other<br />
miscellaneous loans.<br />
C-23 Fiscal Year <strong>2008</strong> Annual Budget
Debt Management Overview<br />
Recent Debt Management<br />
Activities<br />
During FY 2006, the <strong>City</strong> issued $44.9 million <strong>of</strong><br />
Energy System Revenue Bonds to fund capital<br />
improvements to the electric system. These<br />
included significant environmental remediation<br />
projects related to one <strong>of</strong> the <strong>City</strong>’s electric<br />
generating plants. In addition, the <strong>City</strong> entered into<br />
a hedging agreement to fix the interest rate on an<br />
additional $45 million <strong>of</strong> future Energy System<br />
Bonds Revenue. These bonds are expected to be<br />
issued during FY<strong>2008</strong>.<br />
In January 2007, the <strong>City</strong> entered into a Bond<br />
Warrant Agreement granting an irrevocable option<br />
to an underwriter which, if exercised, would cause<br />
the <strong>City</strong> to refund $158.6 million <strong>of</strong> its outstanding<br />
debt at a future date. This refunding would not<br />
increase the <strong>City</strong>’s related debt service payments.<br />
In exchange for granting this option, the <strong>City</strong><br />
received an upfront payment <strong>of</strong> $7.68 million.<br />
During FY 2006, the <strong>City</strong> increased its borrowings<br />
under the State’s Revolving Loan Program by $4.4<br />
million. Additional borrowing under this subsidized<br />
loan program is expected to occur during FY 2007<br />
and FY <strong>2008</strong>.<br />
Debt Service Requirements<br />
The debt service requirements for all <strong>of</strong> the <strong>City</strong>’s<br />
outstanding long-term debt - including both bonds<br />
and loans is shown on the table below.<br />
A more detailed explanation <strong>of</strong> the <strong>City</strong>’s debt and<br />
debt management activities can be found in the<br />
<strong>City</strong>’s Comprehensive Annual Financial Report and<br />
its Annual Report to Bondholders, both <strong>of</strong> which<br />
are available on the <strong>City</strong>’s website.<br />
<strong>City</strong> <strong>of</strong> <strong>Lakeland</strong><br />
Outstanding Debt Summary<br />
YEAR PRINCIPAL INTEREST<br />
2007 8,095,114 26,432,739<br />
<strong>2008</strong> 25,205,014 30,256,709<br />
2009 29,034,751 30,904,354<br />
2010 34,586,259 31,515,481<br />
2011 30,935,148 30,448,867<br />
2012 - 2016 158,748,293 126,573,664<br />
2017 - 2021 94,387,106 78,143,702<br />
2022 - 2026 70,288,920 62,223,534<br />
2027 - 2031 83,118,567 44,318,589<br />
2032 - 2036 109,930,000 21,963,102<br />
2037 - 2038 40,440,000 1,598,961<br />
TOTAL $684,769,172 $484,379,702<br />
TOTAL<br />
34,527,853<br />
55,461,723<br />
59,939,105<br />
66,101,740<br />
61,384,015<br />
285,321,957<br />
172,530,808<br />
132,512,454<br />
127,437,156<br />
131,893,102<br />
42,038,961<br />
1,169,148,874<br />
Did you know…<br />
In February 1884 the <strong>Lakeland</strong><br />
Improvement Company Inc. was<br />
created with a capitalization <strong>of</strong> $50,000<br />
so that streets and avenues could be<br />
laid out for the town’s people.<br />
C-24 Fiscal Year <strong>2008</strong> Annual Budget
Table <strong>of</strong> Contents<br />
Performance Budget ......................................................................... Section—D<br />
Performance Budget Overview ................................................................................... D-2<br />
Sample Performance Budget Page............................................................................. D-3<br />
Measuring Results........................................................................................................ D-4<br />
Key Success Indicators (KSI’s)................................................................................... D-5<br />
Strategic Planning & Performance Measurement Process Map.............................. D-6<br />
Service & Operations Strategy.................................................................................... D-7<br />
Fiscal Year 2007 3rd Quarter Status <strong>of</strong> Actions ........................................................ D-8<br />
Fiscal Year <strong>2008</strong> New Actions Summary.................................................................. D-22<br />
Outcome Pages........................................................................................................... D-24<br />
Process Improvement Teams.................................................................................... D-33<br />
Department Performance Levels............................................................................... D-34<br />
Program Performance Levels<br />
Economic and Community Development.................................................... D-47<br />
Community Safety ......................................................................................... D-79<br />
Transportation Services.............................................................................. D-105<br />
Legislative Activities ................................................................................... D-125<br />
Environmental & Utility Services ............................................................... D-135<br />
Cultural & Community Services................................................................. D-161<br />
Parks, Recreation and Properties .............................................................. D-175<br />
Internal Services .......................................................................................... D-189<br />
D-1 Fiscal Year <strong>2008</strong> Annual Budget
Performance Budget Overview<br />
Introduction<br />
This chapter details how we will allocate our<br />
resources. Based on the Strategic Plan and<br />
Business Plan, initiatives and programs are<br />
selected and assigned to departments.<br />
The Strategic Planning & Performance<br />
Measurement Process Map on page D-6 shows<br />
how this system is interrelated over time, and how<br />
the different elements work together.<br />
Fiscal Year 2007 Actions lists our current<br />
initiatives, the Outcome they support and their<br />
status. Fiscal Year <strong>2008</strong> Actions lists our new<br />
initiatives by Outcome and the supporting lead<br />
department.<br />
Measuring Results provides an overview <strong>of</strong> how<br />
the performance measurement system is reported<br />
and will be developed to provide results for the <strong>City</strong><br />
once benchmarking data has been compiled.<br />
Service and Operations Strategy describes our<br />
existing services, ongoing and new actions.<br />
Department Performance Levels consists <strong>of</strong><br />
significant accomplishments for each department in<br />
Fiscal Year 2007.<br />
Understanding Departmental<br />
Performance Budgets<br />
The Activity’s budget is separated into the following<br />
components:<br />
Mission Statement - the statement must identify the<br />
particular purpose for the activity and how it relates<br />
to the <strong>City</strong>’s overall mission.<br />
Core Services - a listing <strong>of</strong> the fundamental<br />
services that the activity is designed to provide.<br />
Organization Charts - Outline <strong>of</strong> program structure<br />
<strong>of</strong> the primary department and/or responsible<br />
division for the delivery <strong>of</strong> service within the subject<br />
Activity.<br />
The Operational and/or Public Service Levels<br />
indicate the volume, frequency or level <strong>of</strong> service<br />
provided.<br />
Performance Measures (KSI’s) - the <strong>City</strong>-wide<br />
objectives focused on program accomplishments<br />
that will be attained within the current year. All<br />
objectives are measurable by the performance<br />
indicators supplied.<br />
Each performance measure includes explicit links<br />
showing how objectives and their indicators are<br />
directly related, Outcomes and the <strong>City</strong>-wide Goals<br />
they support.<br />
New Initiatives - new services or the removal <strong>of</strong><br />
existing services as they relate to the Strategic<br />
Plan. See Program Performance pages for a list <strong>of</strong><br />
the new initiatives by Activity<br />
Did you know…..<br />
in May 1891, Harry P. Sloan, Plant<br />
Manager for the <strong>Lakeland</strong> Light and<br />
Power Company threw the switch,<br />
which turned on the current, and <strong>Lakeland</strong><br />
was lighted by electricity for the<br />
first time.<br />
Program/Expenditure Summary - the budget for the<br />
Activity, summarized by program, if applicable, and<br />
by major category <strong>of</strong> expenditure:<br />
• Personal Services - salaries, overtime<br />
and other pay including vacation<br />
payment incentive, holiday pay and<br />
temporary wages;<br />
• Benefits - FICA, retirement<br />
contributions, health and other<br />
benefits;<br />
• Other Expenses - supplies, repairs,<br />
utilities, services and other costs;<br />
• Capital - departmental machinery and<br />
equipment.<br />
D-2 Fiscal Year <strong>2008</strong> Annual Budget
Sample Performance Budget Page<br />
1<br />
Title<br />
5<br />
Operational and/or Public Service Levels<br />
Indicates the department.<br />
2<br />
Mission<br />
The statement must identify the particular purpose<br />
for the Activity and how it relates to the <strong>City</strong>’s<br />
overall mission.<br />
3<br />
Core Services<br />
A listing <strong>of</strong> the fundamental services that the<br />
Activity is designed to provide.<br />
4<br />
Organization Charts<br />
Outline <strong>of</strong> program structure <strong>of</strong> the primary<br />
department and/or responsible division for the<br />
delivery <strong>of</strong> service within the subject Activity.<br />
Indicates the volume, frequency or level <strong>of</strong> service<br />
provided.<br />
6<br />
Performance Measures<br />
The <strong>City</strong>-wide objectives focus on particular<br />
program accomplishments that will be attained<br />
within the current year.<br />
7<br />
New Initiatives<br />
New services or the removal <strong>of</strong> existing services as<br />
they relate to the Strategic Plan.<br />
8<br />
Program/Expenditure Summary<br />
The budget for the Activity, summarized by<br />
program, if applicable and by major category <strong>of</strong><br />
expenditure.<br />
1<br />
2<br />
6<br />
3<br />
7<br />
4<br />
8<br />
5<br />
D-3 Fiscal Year <strong>2008</strong> Annual Budget
Measuring Results<br />
Quarterly Performance Review<br />
Overview<br />
The <strong>City</strong> has developed a performance<br />
measurement and management system to align<br />
services and programs with the <strong>City</strong> Commission’s<br />
13 Outcomes identified in the Fiscal Year <strong>2008</strong><br />
Strategic Plan. The system will enable departments<br />
to systematically measure results and make timely<br />
adjustments when results fall short <strong>of</strong> expected<br />
performance levels. Three components make up the<br />
system:<br />
• Quarterly Actions Performance Reporting<br />
• Annual Key Success Indicator (KSI)<br />
Measurements<br />
• Annual Composite Index<br />
These elements play an important part in the <strong>City</strong>’s<br />
overall Business Plan, and help keep the<br />
organization on target.<br />
Future plans are underway for a Financial Trend<br />
Monitoring System.<br />
Quarterly Action Performance Reporting<br />
A total <strong>of</strong> 143 Actions were developed by the <strong>City</strong>’s<br />
operating and support departments for 2007. Each<br />
<strong>of</strong> the Actions are strategically aligned to the <strong>City</strong>’s<br />
Vision/Mission/Goals. Reporting data consisting <strong>of</strong><br />
progress updates, labor hours and non-labor costs<br />
was accumulated on a quarterly basis. 2007 was<br />
the first year this information was gathered; <strong>2008</strong> will<br />
see an adjustment to the data gathered ensuring the<br />
information is strategic in nature and not a day-to-day<br />
operational task.<br />
The 2007 Actions are summarized beginning on<br />
page D-8.<br />
KSI Measurements<br />
A total <strong>of</strong> 56 performance measures or key success<br />
indicators (KSI’s) have been established to measure<br />
results achieved through services and programs<br />
provided by the <strong>City</strong>’s operating and support<br />
departments. Each <strong>of</strong> the measurements support at<br />
least one <strong>of</strong> the thirteen Outcomes. <strong>2008</strong> will be the<br />
first year this data is gathered, resulting in<br />
performance measurements that will begin to drive<br />
the organization on its road to efficiency and<br />
performance excellence.<br />
Composite Index<br />
The Composite Index will be comprised <strong>of</strong><br />
indicators, carefully chosen to give an overall<br />
snapshot <strong>of</strong> our financial and operating results. The<br />
fiscal year index scores will provide data used for<br />
trend analysis and projections <strong>of</strong> future costs.<br />
Future Business Plan publications will provide<br />
descriptive charts for each indicator, along with<br />
summary information describing the current trends.<br />
Water Customer<br />
Accounts grew<br />
2.5% in 2006.<br />
New Residential<br />
Construction<br />
Permits were flat<br />
in 2006.<br />
The crime rate per 1,000 residents for<br />
Fiscal Year 2006 was 6% as<br />
compared to 6.3% in Fiscal Year 2005.<br />
Wastewater Customer<br />
Accounts grew 2.34%<br />
for Year. 2006.<br />
Warehouse/<br />
Industrial Square<br />
Footage Permitted<br />
increased 129% in<br />
2006.<br />
The <strong>2008</strong> KSI’s are summarized on page D-22.<br />
D-4 Fiscal Year <strong>2008</strong> Annual Budget
Key Success Indicators (KSI’s)<br />
Enriched Organization Workforce (4)<br />
1 Training Hours for all Departments<br />
2 Full-time (FT) Permanent Employees Who Left<br />
the <strong>City</strong><br />
3 Diversity <strong>of</strong> Applicant Pool<br />
4 Employee Job Satisfaction<br />
Enriched Community Workforce (2)<br />
1 Private & Public Average Annual Wage<br />
2 Educational Levels <strong>of</strong> the Community<br />
Sustainable Business Environment (9)<br />
1 Businesses Renewing Business Tax Licenses<br />
2 Cost <strong>of</strong> Living Index for <strong>Lakeland</strong><br />
3 New FT Jobs in <strong>Lakeland</strong><br />
4 Square Footage <strong>of</strong> Industrial Space/Permitting<br />
5 Square Footage <strong>of</strong> Office Space/Permitting<br />
6 Square Footage <strong>of</strong> Retail Space/Permitting<br />
7 Electric Utility Customer Accounts<br />
8 Water Utility Customer Accounts<br />
9 Wastewater Customer Accounts<br />
Informed and Engaged Employees (3)<br />
1 Website Hits on Internal Communication<br />
Mediums<br />
2 Participation Hours on Internal COL Advisory<br />
Teams & Committees<br />
3 Employee Satisfaction with Internal<br />
Communications<br />
Informed and Engaged Community (5)<br />
1 External Communication Mediums Viewed<br />
2 Citizen Communication Satisfaction<br />
3 Volunteer Hours donated to COL by Citizens<br />
4 Cases Logged through the Citizen Action Center<br />
5 Presentations to Citizen Groups<br />
Optimal Management <strong>of</strong> Existing Financial<br />
Resources (7)<br />
1 <strong>City</strong>’s Ability to Finance Debt<br />
2 Residents Perception <strong>of</strong> Economic Issues and<br />
Various <strong>City</strong> Services<br />
3 Millage Rate<br />
4 Wastewater Utility Rate<br />
5 Solid Waste Utility Rate<br />
6 Electric Utility Rate<br />
7 Water Utility Rate<br />
Develop New Financial Resources (3)<br />
1 Annual Grant Monies Received<br />
2 Annual Contributions & Donations to the COL<br />
3 Annual Contributions from New Income<br />
Streams<br />
Quality Developments (4)<br />
1 Median Home Price in <strong>Lakeland</strong><br />
2 Home Owner Satisfaction Regarding Growth<br />
3 Commercial Satisfaction Regarding Growth<br />
4 Public Green Space Ratio<br />
Safe, Attractive Neighborhoods (3)<br />
1 Participants in Neighborhood Partnerships<br />
2 <strong>City</strong> Crime Rate (Part I Crimes)<br />
3 Code Enforcement Cases Corrected<br />
Quality Public Spaces (5)<br />
1 Citizen Satisfaction with Quality <strong>of</strong> Life<br />
2 Lake Water Quality<br />
3 Traffic Rating<br />
4 Roads - Level <strong>of</strong> Service Standard<br />
5 Miles <strong>of</strong> Sidewalk within the COL<br />
Superior Municipal Services (2)<br />
1 Citizen Satisfaction with Municipal Services<br />
2 Electric Service Reliability<br />
Support the Arts and Wellness (4)<br />
1 <strong>City</strong> Monies Supporting the Arts<br />
2 Participants Using Recreation Facilities<br />
3 Acres <strong>of</strong> Active Parks<br />
4 Miles <strong>of</strong> Walking and Bicycle Paths<br />
Support Education (5)<br />
1 COL Employees Mentoring Hours<br />
2 Internships/Co-op Positions with the COL<br />
3 School Resource Officers Hours<br />
4 Usage <strong>of</strong> Library Resources<br />
5 Partnerships Established with Educational<br />
Agencies<br />
D-5 Fiscal Year <strong>2008</strong> Annual Budget
Legend<br />
Box Color Purpose<br />
Report to Commissioners<br />
Quarterly Action Process<br />
Environmental Scan<br />
Budget Process<br />
Words in red identify proposed items being added<br />
to the process in <strong>2008</strong>.<br />
D-6 Fiscal Year <strong>2008</strong> Annual Budget
Service & Operations Strategy<br />
This is the first year <strong>of</strong> publication <strong>of</strong> our Strategic<br />
Plan established for Fiscal Year <strong>2008</strong>. The<br />
Strategic Plan is updated in a workshop where the<br />
environmental issues impacting the <strong>City</strong>, customer<br />
requirements and past performance are explored.<br />
The resulting plan communicates the shared vision<br />
and direction for the <strong>City</strong>, which all subsequent<br />
tactical and financial planning supports. The<br />
thirteen outcomes identified by the <strong>City</strong><br />
Commission for this strategic planning cycle are as<br />
follows:<br />
Enriched Organization Workforce<br />
Enriched Community Workforce<br />
Sustainable Business Environment<br />
Informed and Engaged Employees<br />
Informed and Engaged Community<br />
Optimal Management <strong>of</strong> Existing Financial<br />
Resources<br />
Develop New Financial Resources<br />
Quality Development<br />
Safe, Attractive Neighborhoods<br />
Quality Public Spaces<br />
Superior Municipal Services<br />
Support the Arts and Wellness<br />
Support Education<br />
While the Strategic Plan sets out the Vision, the<br />
Business Plan outlines tangible plans for making<br />
the Vision a reality. In each <strong>of</strong> the Outcome areas,<br />
Department Directors have developed Actions that<br />
will change the way the <strong>City</strong> operates in order to<br />
address the thirteen Outcomes and implement the<br />
Vision expressed in the Strategic Plan.<br />
A Word About Existing Services and<br />
Actions<br />
In some sections, we have highlighted Actions that<br />
were implemented in Fiscal Year 2007. However,<br />
the emphasis is on multi-year implementation and<br />
the evolution <strong>of</strong> existing Actions. For a complete<br />
list <strong>of</strong> the 2007 Actions, see page D-8.<br />
Unless specifically identified as a reduction in<br />
service, all <strong>City</strong> services will continue to be<br />
provided in the same high quality and timely<br />
manner our customers have come to expect.<br />
New Actions<br />
New Actions are chosen that will in some way<br />
assist us in achieving our Vision, Mission and<br />
Goals. We include those that we feel are<br />
significant contributors to supporting our Outcomes<br />
or that put additional demand on our resources. In<br />
this way, we identify the most significant actions we<br />
plan to take next year. For a complete list <strong>of</strong> the<br />
<strong>2008</strong> Actions, see page D-22.<br />
For a complete list <strong>of</strong> Actions and KSI’s by<br />
Outcome, see pages D-24 thru D-32; and for more<br />
details about the services we provide and the<br />
performance measures we use to manage those<br />
services, please reference the program sections<br />
beginning on page D-47.<br />
Lake Mirror<br />
Lake Morton<br />
Fort Frasier Trail<br />
D-7 Fiscal Year <strong>2008</strong> Annual Budget
Fiscal Year 2007 3rd Qtr. Status <strong>of</strong> Actions<br />
Informed and Engaged Community<br />
Airport Communications Plan Continuing Establish methods to educate and inform<br />
both aviation and non-aviation residents <strong>of</strong><br />
the Airport's ongoing and changing role<br />
within the community.<br />
Adopting new community friendly flight<br />
routes. Annual Report in progress.<br />
Benchmark Web (OCAT)<br />
Completed Establish a section on <strong>City</strong> website that<br />
provides information on <strong>City</strong> Services and<br />
how the <strong>City</strong> compares to other benchmark<br />
organizations.<br />
Data to be linked is being gathered by<br />
various departments.<br />
Boards and Committees<br />
Programs<br />
Completed Explore and develop citizen education and Quarterly meetings held and annual dinner<br />
increased involvement in the process <strong>of</strong> local concluded.<br />
government through the efforts <strong>of</strong> the Boards<br />
and Committees program.<br />
Citizen Survey Feedback<br />
(OCAT)<br />
<strong>City</strong> Services Student<br />
Outreach<br />
Continuing<br />
Continuing<br />
Conduct annual evaluation <strong>of</strong> city operations<br />
by residents using qualitative and<br />
quantitative social science research<br />
techniques showcased on <strong>City</strong> and<br />
employee websites.<br />
Explore programs to make students aware <strong>of</strong><br />
<strong>City</strong> services and highlight the <strong>City</strong> as a<br />
possible employer.<br />
Citizen Survey being developed for FY08.<br />
Program will be initiated during the <strong>2008</strong><br />
school year.<br />
Customer Feedback<br />
Program (OCAT)<br />
Continuing<br />
Digital Divide Continuing Reduce the socio-economic differences in<br />
communication between those in the<br />
community with regular, effective access to<br />
digital technologies and those without.<br />
Provide customer survey cards at <strong>City</strong> Will incorporate OCAT's "How We Are Doing"<br />
Facilities and develop procedure to postcard.<br />
collect and respond to customer satisfaction/<br />
dissatisfaction feedback.<br />
The cable franchise agreement is due to be<br />
completed by late summer in 2007.<br />
<strong>Lakeland</strong> Branding<br />
Campaign<br />
Completed Develop <strong>City</strong> <strong>of</strong> <strong>Lakeland</strong> branding campaign<br />
incorporating "Close to Everything, Away<br />
From It All" slogan throughout the <strong>City</strong> using<br />
a variety <strong>of</strong> marketing techniques.<br />
Campaign complete, slogan to be used going<br />
forward.<br />
<strong>Lakeland</strong> Government<br />
Network (LGN)<br />
Continuing<br />
Develop <strong>Lakeland</strong> Government Network as a<br />
media brand that includes a stand alone<br />
cable television station and internet webcast<br />
channel to encourage community spirit,<br />
educational progress, and local government<br />
support.<br />
Currently partnering with Polk County<br />
Government (PGTV) to share air time on<br />
Brighthouse Channel 19. A 10-year plan for<br />
FY08 being reviewed.<br />
Public Inquiry and Complaint<br />
Process (OCAT)<br />
Abandoned Standardize the complaint process in order<br />
to allow tracking and facilitate a process to<br />
assist in routing <strong>of</strong> calls to the responsive<br />
<strong>City</strong> agency.<br />
Action abandoned...task transferred to the<br />
Information Technology Department.<br />
Out-<br />
Strategic Plan Public<br />
reach (OCAT)<br />
Continuing<br />
Inform the public on initiatives aimed at<br />
achieving strategic goals using annual<br />
calendar, <strong>Lakeland</strong>gov.net and other<br />
pro-active techniques.<br />
Continuing to publish on the Intranet and the<br />
Internet.<br />
Citizen Action Center Continuing Provide a website for citizens to provide<br />
feedback to <strong>City</strong> <strong>of</strong>ficials.<br />
90% Complete<br />
<strong>Lakeland</strong> Center Community<br />
Marketing<br />
Continuing<br />
Develop a marketing program to increase<br />
awareness <strong>of</strong> the local community with<br />
increased attention towards developing<br />
events that will attract the <strong>Lakeland</strong>/Polk<br />
County demography.<br />
Significant progress with the changes within<br />
our Marketing plan. Email list grown by over<br />
50%; Hits on web page have exceeded<br />
100,000 for the year. <strong>Lakeland</strong> Center My<br />
Space page continues to grow.<br />
<strong>Lakeland</strong> Electric Customer<br />
Workshops<br />
Continuing<br />
Conduct residential customer and<br />
commercial educational workshops.<br />
Planning a seminar on new lighting and energy<br />
saving ro<strong>of</strong> coating technologies for<br />
large commercial customers.<br />
D-8 Fiscal Year <strong>2008</strong> Annual Budget
Fiscal Year 2007 3rd Qtr. Status <strong>of</strong> Actions<br />
<strong>Lakeland</strong> Electric Open<br />
House<br />
Completed Increase public participation at Open House<br />
event at the McIntosh Plant to allow<br />
community to learn about the utility.<br />
Held on March 31, 2007. Completed on time<br />
and under budget.<br />
Diversity Education<br />
(<strong>Lakeland</strong> Vision)<br />
Continuing<br />
Develop a public educational effort engaging<br />
the citizenry on tolerance and diversity.<br />
Mini-conference executed in collaboration<br />
with USF <strong>Lakeland</strong>'s Diversity Office. Second<br />
Annual Multicultural Festival taking place on<br />
September 21st. Event will coincide with<br />
other multicultural-themed events from<br />
September 20th to 23rd. A steering<br />
committee is being formed.<br />
Diversity Education/Series<br />
(<strong>Lakeland</strong> Vision)<br />
Abandoned Develop active participation in Diversity Task<br />
Force to improve attitudes and respect for<br />
individuality through a series <strong>of</strong> events<br />
celebrating all cultures.<br />
The Communications Department has turned<br />
over the action item to <strong>Lakeland</strong> Vision<br />
(separate 2007 Action item) and all progress<br />
will be reported by <strong>Lakeland</strong> Vision.<br />
Law Enforcement Citizen<br />
Education<br />
Web Site Performance<br />
Measures<br />
Completed Educate citizens as to the Vision, Mission,<br />
Goals, Objectives, and operation <strong>of</strong> the<br />
department through citizen education<br />
programming.<br />
Continuing Promote effective communications with all<br />
residents and stakeholders <strong>of</strong> the <strong>City</strong> <strong>of</strong><br />
<strong>Lakeland</strong> by publishing law enforcement<br />
monthly performance measures.<br />
Open House held on March 17, 2007. The<br />
event was well attended.<br />
Monthly performance measures continue to<br />
be posted on the department's web site.<br />
Informed and Engaged Employees<br />
Emergency (Storm)<br />
Operations Plan (OCAT)<br />
Completed Add Emergency (Storm) Operations Plan<br />
area to website to allow employees to see<br />
contact and related information for<br />
emergency (storm) preparation.<br />
A section has been created on<br />
<strong>Lakeland</strong>gov.net so employees can access<br />
storm information from home and will be<br />
updated annually prior to June 1st.<br />
Employee Survey/Feedback<br />
Completed Conduct periodic surveys and provide<br />
feedback from surveys to employees via<br />
In-Site, Access and employee forums. First<br />
internal communications benchmark survey<br />
completed in June 2006.<br />
In-Site Tutorial (OCAT) Continuing Add tutorial area to InSite for common <strong>City</strong> <strong>of</strong><br />
<strong>Lakeland</strong> administrative tasks.<br />
Action completed. Employees will be<br />
surveyed annually every March.<br />
Compiling a list <strong>of</strong> tutorials for InSite and will<br />
submit that list to the Communications<br />
Department for appropriate action.<br />
Organizational<br />
Communication Initiatives<br />
Strategic Plan Employee<br />
Forums (OCAT)<br />
Abandoned Explore and develop internal organization Action abandoned.<br />
communication methods by incorporating<br />
new initiatives as well as those suggested by<br />
the Organization Communication Advisory<br />
Team (OCAT) using a variety <strong>of</strong> internal<br />
communication techniques.<br />
Continuing<br />
Establish monthly meetings between <strong>City</strong> <strong>of</strong><br />
<strong>Lakeland</strong> Department Heads/Directors and<br />
their respective workgroups, e.g., brown-bag<br />
lunches, to discuss how their department<br />
aligns to the <strong>City</strong> Strategic Plan (<strong>City</strong><br />
Manager's <strong>of</strong>fice representative will attend<br />
one meeting annually.<br />
The annual employee meetings in addition to<br />
the coordination <strong>of</strong> the monthly employee<br />
meetings for <strong>City</strong> Management (i.e. “field<br />
meetings” where <strong>City</strong> Management talks to<br />
employees on their job sites) are the<br />
responsibility <strong>of</strong> the Communications<br />
Department.<br />
Suggestion Box (OCAT)<br />
Continuing Develop a campaign promoting the<br />
Suggestion-Box program using intranet<br />
InSite, Access newsletter and other<br />
proactive tools <strong>of</strong> communication.<br />
Monthly values are highlighted in ACCESS<br />
newsletter. Nominations for employees who<br />
are exemplifying values are received on<br />
InSite and entered in a random drawing for a<br />
gift card.<br />
Values Campaign (OCAT) Continuing Develop campaign to promote values<br />
throughout <strong>City</strong> organizations; (i.e., badges,<br />
posters, employee meetings, etc).<br />
Campaign <strong>of</strong>ficially kicked <strong>of</strong>f in April. Videos<br />
posted on InSite.<br />
D-9 Fiscal Year <strong>2008</strong> Annual Budget
Fiscal Year 2007 3rd Qtr. Status <strong>of</strong> Actions<br />
360 Degree Performance<br />
Reviews (OCAT)<br />
Continuing Implement a 360 degree feedback process<br />
and enforce the mandatory, annual review/<br />
Personnel Performance Review (PPR)<br />
process for all employees.<br />
Awaiting settlement <strong>of</strong> Human Resources<br />
Functions to determine where this Action will<br />
be housed.<br />
Organizational Values<br />
(OCAT)<br />
Employee Information Kiosks<br />
(OCAT)<br />
Completed Develop organizational values to connect<br />
Vision and Mission to the Strategic<br />
Operating Plan.<br />
Completed Facilitate placement <strong>of</strong> information kiosks in<br />
each department for employees to access.<br />
Values developed and highlighted monthly.<br />
Installed kiosks in various locations.<br />
Voice-Over-Internet Protocol<br />
(VOIP)<br />
Enriched Community Workforce<br />
Medical Corridor Plan<br />
Work Education and<br />
Internship Partnerships<br />
Abandoned Implement Voice-Over-Internet Protocol Abandoned due to lack <strong>of</strong> funding.<br />
System for <strong>City</strong> operational departments<br />
providing open platform for multiple end-user<br />
equipment, voice mail replacement, and<br />
network consolidation and efficiency <strong>of</strong><br />
capital and operational expenses.<br />
Continuing Develop Medical District Master Plan in partnership<br />
with stakeholders including Watson<br />
Clinic and <strong>Lakeland</strong> Regional Medical<br />
Center; this is a real estate master plan to<br />
address uses, buildout and creation <strong>of</strong> a<br />
larger more dense medical district.<br />
Continuing Conduct activities with educational and<br />
business partners to target increased<br />
participation from employees in educational<br />
and internship opportunities to increase the<br />
number <strong>of</strong> technical and highly-skilled<br />
individuals available in the workforce.<br />
Through the Acquisition and Relocation<br />
Assistance Pilot Program, the Mid Town CRA<br />
has been able to commit to providing three<br />
homeowners with assistance.<br />
Point <strong>of</strong> Delivery Agreement established<br />
enabling Barry Univeristy to provide courses<br />
toward a Bachelor's <strong>of</strong> Public Administration<br />
using our Police Department community<br />
room. In exchange, our employees can<br />
receive a 20% discount in tuition and can use<br />
<strong>City</strong>U training toward college credit.<br />
<strong>Lakeland</strong> Electric Power<br />
Academy<br />
Continuing Develop power academy with area schools<br />
to attain a skilled workforce.<br />
Interviews <strong>of</strong> Power Academy Coordinator<br />
currently underway. Recommendation to<br />
relocate the site <strong>of</strong> the academy closer to the<br />
academic facilities was accomplished. Hosted<br />
Tenorac High School principal, facility planner<br />
and curriculum coordinator on three tours <strong>of</strong><br />
<strong>Lakeland</strong> Electric's work area.<br />
Enriched Organization Workforce<br />
Airport Training Program<br />
Continuing Establish an ongoing training program in<br />
Airport operational areas to promote and<br />
ensure the safety <strong>of</strong> airport personnel and<br />
airport users.<br />
Met with other airport operators to determine<br />
best practices at the lowest cost for<br />
continuing operational education.<br />
Advanced Life Support (ALS)<br />
Service<br />
Continuing<br />
Provide Advanced Life Support (ALS) level<br />
service from all fire stations requiring<br />
paramedic training and certification status<br />
and necessary equipment.<br />
Six firefighter paramedic students are<br />
scheduled to graduate in September.<br />
Following ambulance ride time they will be on<br />
the street in November. A priority dispatch<br />
system has been identified and we are<br />
working with the <strong>Lakeland</strong> Police Department<br />
(LPD) to implement.<br />
Technical Rescue Team<br />
Continuing Upgrade Technical Rescue Team to Urban<br />
Search and Rescue Team Standards by<br />
9/30/<strong>2008</strong> through procuring equipment and<br />
conducting requisite training.<br />
672 hours <strong>of</strong> training in confined space<br />
operations, vehicle machinery rescue, and<br />
rope rescue were completed during the 3rd<br />
quarter.<br />
Career Development<br />
Opportunities (OCAT)<br />
Continuing<br />
Educate employees about positions'<br />
qualifications, eligibility and certification in<br />
concert with employment needs where there<br />
will be high turnover and therefore career<br />
and promotional opportunities.<br />
Continued participation in Career Caravan<br />
days. Sharing <strong>of</strong> the Retirement Eligibility<br />
results with the Civil Service and Pension<br />
Board.<br />
D-10 Fiscal Year <strong>2008</strong> Annual Budget
Fiscal Year 2007 3rd Qtr. Status <strong>of</strong> Actions<br />
College Partnerships<br />
Continuing Work closely with area schools and colleges<br />
to develop special class <strong>of</strong>ferings for <strong>City</strong> <strong>of</strong><br />
<strong>Lakeland</strong> Employees.<br />
Completed discussions with Barry University<br />
about having special classes utilizing the<br />
COL Training Center and other COL<br />
resources. New Bachelors in Public<br />
Administration courses to begin soon.<br />
Employee Recognition/<br />
Reward Programs<br />
Abandoned Facilitate and promote inter-departmental<br />
development and utilization <strong>of</strong> employee<br />
recognition/reward programs.<br />
In the planning stage.<br />
Employment Manual<br />
Employment Webpage<br />
Completed Implement uniform method to provide new Efforts were coordinated between Civil<br />
employees information beyond orientation; Service and Benefits. Employee packets<br />
i.e., benefits package, <strong>City</strong> University, were expanded to provide employees with<br />
Employee Assistance Program, Retirement more information in their orientation packets.<br />
Planning and also including the <strong>City</strong>'s Vision,<br />
Mission, Strategic Goals and Values.<br />
Continuing Revise the assessment services webpage to<br />
provide more helpful information for job<br />
applicants, current employees, and<br />
interested citizens.<br />
Ready to present to Director for review and<br />
then make appropriate changes to current<br />
website. This item should be accomplished<br />
before the next quarterly update.<br />
Exit Interviews and<br />
Strategies (OCAT)<br />
Continuing Conduct exit interviews, consolidate<br />
information and provide information to <strong>City</strong><br />
management on a quarterly basis.<br />
Converted pen and paper questionnaire to<br />
online survey s<strong>of</strong>tware. In process <strong>of</strong> piloting.<br />
Questionnaire will begin to be<br />
administered immediately and report issued<br />
at the end <strong>of</strong> this quarter.<br />
Hiring Toolkit<br />
Leadership Training (OCAT)<br />
Continuing Develop toolkit for assisting hiring authorities<br />
with recruitment process<br />
Survey for Department Heads (DH), Senior<br />
Management and other hiring authorities has<br />
been prepared. Will be administered during<br />
third quarter. This survey will identify the<br />
areas needing to be addressed with toolkit.<br />
Continuing Establish a requirement that Department All supervisory job descriptions were<br />
Head incumbents complete at least 15 hours reviewed and minimal supervisory/leadership<br />
<strong>of</strong> Leadership/Management Education per training requirements, via the appropriate<br />
year.<br />
<strong>City</strong>U training Level, were added. Tools to<br />
assist individuals in identifying and tracking<br />
their training needs were enhanced.<br />
Pension Benefit Structure<br />
Performance Evaluation<br />
Process<br />
Completed Structure a competitive retirement benefits<br />
package to attract and retain specific highly<br />
skilled market segments.<br />
Continuing Pilot a new performance evaluation model<br />
incorporating pay for performance and 360<br />
degree evaluation principles and<br />
implementation <strong>of</strong> employee performance<br />
goals and measurements.<br />
Tthe Retirement System as a whole has<br />
completed an entire valuation cycle with the<br />
newly hired actuaries. The Employees'<br />
Pension Board adopted new actuarial<br />
assumptions, including an update <strong>of</strong> the<br />
mortality tables.<br />
Meetings were held with the Police and Fire<br />
performance evaluation monitoring<br />
committees and/or representatives to<br />
address needs and problems during the 2nd<br />
quarter <strong>of</strong> the pilot. Feedback on the process<br />
lead to several process improvements.<br />
Promotional Certification<br />
(OCAT)<br />
Completed Establish a requirement that candidates<br />
selected for promotions witin the <strong>City</strong> <strong>of</strong><br />
<strong>Lakeland</strong> possess the requisite <strong>City</strong>U<br />
certification level, or obtain same within a<br />
twelve-month period.<br />
Added <strong>City</strong>U to specific job descriptions as a<br />
requirement.<br />
D-11 Fiscal Year <strong>2008</strong> Annual Budget
Fiscal Year 2007 3rd Qtr. Status <strong>of</strong> Actions<br />
Recruitment/Hiring Process<br />
Review (OCAT)<br />
Continuing Conduct process analysis and development Process review completed for Civil Service/<br />
project in an effort to improve the recruitment Recruitment portion. Areas left for review<br />
and hiring process as well as a checklist/ include Employee Relations and Timekeeper<br />
process to coordinate system information portions. Six areas identified for significant<br />
when employees are hired or change improvement in Civil Service Sections.<br />
positions, departments, divisions, etc.<br />
Retention Strategies<br />
Continuing Focus efforts on retainment strategies for<br />
new and longer term employees, as well as<br />
for highly competitive jobs in the market.<br />
Updated Civil Service information with new<br />
pay-study data, reviewing parameters<br />
relating to Deferred Retirement Option Plan<br />
(DROP) impact and possible changes to<br />
DROP plan (in progress), generating new<br />
employee section on InSite for FAQ's.<br />
Time Management<br />
Curriculum (OCAT)<br />
Continuing Add mandatory Time Management Class First class was held on June 7th, 20 students<br />
into <strong>City</strong> University curriculum for Levels I, II, enrolled and attended the class. Two<br />
and III.<br />
sessions scheduled in the first quarter <strong>of</strong><br />
FY08. Classes will be <strong>of</strong>fered in the months<br />
<strong>of</strong> January, March, May and July <strong>of</strong> FY08.<br />
Workforce Diversity<br />
Campaign<br />
<strong>Lakeland</strong> Electric Leadership<br />
Development Plan<br />
Law Enforcement Annual<br />
Awards Ceremony<br />
Benefits Summary Booklet<br />
Continuing Launch a comprehensive multi-faceted<br />
approach to sensitizing and educating<br />
workforce on diversity issues with cultural<br />
diversity class becoming mandatory for all<br />
employees by FY08.<br />
Continuing Develop and implement plan to address<br />
aging workforce issues.<br />
Completed Conduct a department-wide annual awards<br />
program in recognition <strong>of</strong> the achievements<br />
<strong>of</strong> law enforcement personnel.<br />
Completed Develop a booklet <strong>of</strong> benefits that would<br />
provide a brief summary <strong>of</strong> coverages<br />
available to <strong>City</strong> employees.<br />
Beginning in August the first <strong>of</strong> a series <strong>of</strong><br />
articles about diversity and diversity issues<br />
will be placed in ACCESS. The goal is to<br />
have an article addressing a Diversity issue<br />
every other month.<br />
<strong>City</strong> Manager approved actions to address<br />
many "At Risk" positions. Progressive pay<br />
plans are being developed for several key<br />
positions. Work Force Planning &<br />
Development Team Leads are working<br />
through positions for knowledge capture and<br />
transfer.<br />
Awards ceremony held in February.<br />
1) The pension, employee relations and<br />
health/life benefits information prepared for<br />
newly hired employees was consolidated to<br />
streamline the orientation process, with the<br />
goal <strong>of</strong> reducing confusion experienced by<br />
new employees.<br />
Employee Wellness Clinic<br />
Continuing First year's implementation cost to provide<br />
an on-site alternative for <strong>City</strong> employees to<br />
handle minor emergencies and injuries, as<br />
well as preventive health maintenance.<br />
Wellness Clinic's Grand Opening will be<br />
August 3, 2007<br />
Safety Training Records<br />
Sustainable Business Environment<br />
Small Aircraft Transportation<br />
System (SATS)<br />
Completed Maintain Safety training records in a central All training scorecards from both Safety Fairs<br />
location so that each employee can access conducted this year have been added to the<br />
their own training history and determine what centralized database.<br />
classes they need in order to be in<br />
compliance with their department's<br />
requirements.<br />
Continuing Establish the small aircraft transportation<br />
program with a goal <strong>of</strong> achieving an active<br />
and expanding role in this new aviation<br />
transportation system.<br />
We renegotiated and executed the final<br />
contract with DayJet for on-demand<br />
pay-per-seat transportation services from<br />
<strong>Lakeland</strong> Linder Regional Airport.<br />
D-12 Fiscal Year <strong>2008</strong> Annual Budget
Fiscal Year 2007 3rd Qtr. Status <strong>of</strong> Actions<br />
USF <strong>Lakeland</strong> Research/<br />
Commerce Park<br />
Continuing<br />
Explore potential <strong>of</strong> related research<br />
business/industry park development<br />
opportunities to expand employment and<br />
community tax base.<br />
One obstacle to on time development <strong>of</strong> the<br />
USF Campus at Williams DRI was funding for<br />
Pace Road and this was addressed by the<br />
legislature but unfortunately no appropriation<br />
was made by Florida Dept <strong>of</strong> Transportation.<br />
However, additional options may be<br />
considered.<br />
Develop New Financial Resources<br />
Revenue Expansion<br />
Abandoned Develop public/private initiatives to enhance<br />
<strong>City</strong>'s revenue capacity.<br />
Abandoned in 2nd quarter, will be redefined<br />
in <strong>2008</strong>.<br />
Optimal Management <strong>of</strong> Existing Financial Resources<br />
Aircraft Rescue and Fire<br />
Fighting (ARFF) Vehicle<br />
Continuing Acquire an Aircraft Rescue and Fire Fighting<br />
(ARFF) vehicle to help increase the level <strong>of</strong><br />
aviation safety and to promote new business<br />
development.<br />
Took delivery <strong>of</strong> the Aircraft Rescue and Fire<br />
Fighting vehicle. Held discussions with Police<br />
and Fire and began revision <strong>of</strong> operational<br />
and emergency operations manuals.<br />
Auxiliary Air Services<br />
Aviation Marketing Plan<br />
Impact Fee Study<br />
Continuing Investigate the costs and benefits <strong>of</strong><br />
establishing scheduled charter air taxi<br />
service for passenger and/or cargo service.<br />
Continuing Implement a three-year contract for<br />
consultant-based marketing plan to expand<br />
aviation and aviation-related industries and<br />
operations.<br />
Continuing Complete and implement the results <strong>of</strong> new<br />
Impact Fee Study to be undertaken by a<br />
consultant to evaluate fire protection, law<br />
enforcement and parks.<br />
Prepared for and conducted an initial meeting<br />
with other airports to discuss charter<br />
proposal.<br />
Continued the ongoing process coordination<br />
with the Economic Development Consultant;<br />
continued pursuit <strong>of</strong> other developments.<br />
The <strong>City</strong> Commission has not taken action on<br />
the recommended impact fees for fire, law or<br />
parks per the completed fee studies. Some<br />
delay was due to the need for the <strong>City</strong> to<br />
ascertain what type <strong>of</strong> property tax revenue<br />
cuts would be passed by the legislature.<br />
Defined Contribution<br />
Retirement Program<br />
Continuing<br />
Analyze retirement plans for possible<br />
expansion <strong>of</strong> defined contribution form <strong>of</strong><br />
benefits.<br />
Consideration should be directed towards the<br />
retirement health insurance issue. Costs for<br />
maintaining have been identified.<br />
Financial Benchmarks<br />
GFOA "Distinguished Budget<br />
Award"<br />
Not Started Develop financial benchmarks for all<br />
municipal operations and services.<br />
Continuing Attain Government Finance Officers<br />
Association Distinguished Budget Award<br />
through adaptation <strong>of</strong> <strong>City</strong> budget as an effective<br />
policy-making, communications,<br />
financial, and operational tool.<br />
No progress made in 3rd quarter due to<br />
budget planning priorities as a result <strong>of</strong><br />
proposed property tax cuts.<br />
Modeling budget format using Coral Springs<br />
Budget as a template. FY08 Budget will be<br />
submitted for award.<br />
Procedural Documentation<br />
(OCAT)<br />
Process Improvement<br />
Program (OCAT)<br />
Program-Based Revenues<br />
Continuing Establish and facilitate inter-departmental Procedural documentation has been included<br />
process to develop written documentation for in the Process Improvement Advisory Team<br />
distinct or unique positions and operational (PIAT) proposed methodology. The<br />
functions.<br />
methodology is being presented to <strong>City</strong> Management<br />
on July 23, 2007.<br />
Continuing Implement a process improvement program<br />
throughout the organization.<br />
The PIAT has developed a <strong>City</strong>-wide process<br />
improvement methodology. The<br />
methodology includes a department<br />
consisting <strong>of</strong> internal resources and includes<br />
employee mentoring and training, project<br />
team management, department-team and<br />
employee assistance, communications,<br />
reporting and recognitions.<br />
Abandoned Develop and implement a methodology to Abandoned in 2nd quarter, no update<br />
recover the cost <strong>of</strong> municipal services that required.<br />
are being financed from general tax<br />
revenues; providing an improved process for<br />
matching revenues to programs.<br />
D-13 Fiscal Year <strong>2008</strong> Annual Budget
Fiscal Year 2007 3rd Qtr. Status <strong>of</strong> Actions<br />
Proprietary Funds Efficiency<br />
Study<br />
Not Started Evaluate historic subsidies across funds and<br />
develop an action plan with the goal <strong>of</strong><br />
minimizing any subsidies.<br />
A policy will be written to identify those funds<br />
that will be subsidized by the end <strong>of</strong> the 4th<br />
quarter.<br />
Revenue Policies<br />
Strategic Planning Execution<br />
Client Services Incentive<br />
Program<br />
Continuing Establish written policies defining <strong>City</strong> Revenue Sources document designed.<br />
revenue sources and adapting administrative<br />
guidelines to National and State benchmark<br />
standards where appropriate.<br />
Continuing Develop key success indicators (KSI's)<br />
aligned to Outcomes <strong>of</strong> <strong>City</strong>'s Vision and<br />
Strategic Goals and execution through a<br />
system and structure to integrate budgetary<br />
planning with performance management.<br />
Continuing Develop an incentive program in order to<br />
increase sales and financial return on facility<br />
and equipment rentals.<br />
Key Success Indicators identified and<br />
presented to <strong>City</strong> Manager and Department<br />
Heads. 3 Performance Management System<br />
Vendors made presentations to the SOAT.<br />
Based on budget constraints, will continue to<br />
develop the program but hold <strong>of</strong>f on initial roll<br />
out until later in <strong>2008</strong>.<br />
<strong>Lakeland</strong> Center Renovation<br />
Continuing Improve the aesthetic appearance and<br />
readiness <strong>of</strong> the <strong>Lakeland</strong> Center.<br />
Arena renovation is 85% completed.<br />
Distribution Reliability<br />
Improvement<br />
Continuing<br />
Install additional distribution line switches to<br />
improve power restoration flexibility.<br />
Four switches have been installed in<br />
association with distribution circuit upgrades.<br />
Electric Cost <strong>of</strong> Service Rate<br />
Study<br />
Completed Evaluate existing tariffs and contracts for<br />
<strong>of</strong>fering equitably allocated and competitive<br />
rate structures for all customer classes.<br />
Phase III <strong>of</strong> the project completed.<br />
Electric Production<br />
Benchmarks<br />
Street Lights Inventory<br />
Continuing Implement and develop strategies for Production formed a Process Improvement<br />
continuous improvement in energy<br />
team to reduce the high number <strong>of</strong> pending<br />
production as recommended by the Navigant work orders. To date, the work order backlog<br />
Study.<br />
has been reduced from over 2,000 in May,<br />
2006 to 800 as <strong>of</strong> June, 2007.<br />
Continuing Develop an inventory <strong>of</strong> street lights within No progress was made as a student intern<br />
the Electric Service territory, including an was not available until July. Very little<br />
assessment <strong>of</strong> the un-recovered capital costs progress is expected the fouth quarter with<br />
for each unit.<br />
the resource's limited availability.<br />
Parks and Recreation<br />
Operation Streamline<br />
Continuing Reduce third party and internal expenses<br />
while streamlining operational process.<br />
The Food and Beverage Operations have<br />
been completely reviewed during the third<br />
quarter. We are in the process <strong>of</strong> updating<br />
the final procedural changes that we will be<br />
implementing during the fourth quarter.<br />
Energy Efficiency Program<br />
<strong>City</strong> Property Value<br />
Database<br />
Continuing Implement enhanced energy efficient The Trane Company has developed the<br />
equipment including Heating Ventilation and computer model <strong>of</strong> the <strong>Lakeland</strong> Electric<br />
Air Conditioning, plumbing, lighting and other Administration Building and has been running<br />
electrical components for <strong>City</strong> <strong>of</strong> <strong>Lakeland</strong> time <strong>of</strong> day and season schedules on the<br />
facilities by studying one major facility each HVAC, Electrical and Plumbing components<br />
year.<br />
within the building. Trane is in the final<br />
analysis stage <strong>of</strong> study.<br />
Completed Implement database to keep track <strong>of</strong> new Property Appraisal report now available<br />
<strong>City</strong> buildings, expansions and demolitions to online utilizing Assetmaxx s<strong>of</strong>tware. Provides<br />
ensure no lapse in insurance coverage by numerous reports including insurance,<br />
adding, revising or deleting values as accounting transactions, system building and<br />
needed.<br />
adhoc.<br />
Disaster Response Training<br />
Continuing Expand focus <strong>of</strong> disaster response plan to<br />
include all disasters, either natural or<br />
man-made.<br />
Hurricane Plan has been completed and<br />
distributed to various departments. Plans'<br />
name changed to Emergency Operations<br />
Plan (EOP).<br />
D-14 Fiscal Year <strong>2008</strong> Annual Budget
Fiscal Year 2007 3rd Qtr. Status <strong>of</strong> Actions<br />
Quality Developments<br />
Airport Infrastructure<br />
Development Plan<br />
Continuing Develop an implementation plan for<br />
proposed infrastructure development<br />
projects.<br />
Issued contract, held initial meetings on<br />
preliminary cost estimates and the impact on<br />
sub-task priorities.<br />
Airport Master Plan<br />
Airport Security Access<br />
Systems<br />
Runway 5-23 Rehabilitation<br />
project<br />
Continuing Revise the master plan and airport layout<br />
plan to reflect the timing <strong>of</strong> capital projects.<br />
Continuing Install and implement additional measures <strong>of</strong><br />
security required by current regulations.<br />
Continuing Complete the reconstruction <strong>of</strong> Runway 5-23<br />
to include new Precision Approach Path<br />
Indicators (PAPIs) on runways 5 and 23.<br />
Continued meetings with the Airport advisor/<br />
consultant, awaiting notification from the<br />
Federal Aviation Administration on future<br />
grant funding.<br />
The contractor installed additional door<br />
access controls on the temporary fire station/<br />
tower building.<br />
The FAA allowed grant budget underruns to<br />
be utilized for mandated revisions in airfield<br />
markings and runway striping. Completed the<br />
engineering agreement and bid package.<br />
Annexation Impact Analysis<br />
Continuing Evaluate future annexations to incorporate<br />
the goal <strong>of</strong> achieving enhanced community<br />
development and municipal services for<br />
affected residents within the subject area.<br />
The process for developing an Annexation<br />
Impact Analysis has slowed with the<br />
uncertainties created by this year’s heavily<br />
debated property tax reform. The tax reform<br />
may reshape <strong>Lakeland</strong>’s annexation outlook.<br />
<strong>City</strong> staff continues to evaluate the cost<br />
impact and feasibility.<br />
Built Environment<br />
Sustainability<br />
Development Review<br />
Process<br />
Abandoned Review planning development and design<br />
standards to ensure every new development<br />
is sustainable and enhances the <strong>City</strong>'s built<br />
environment.<br />
Continuing Complete fully automated development<br />
submission and review process for<br />
commercial site plans and subdivision plats.<br />
This Action being merged with the Planning,<br />
Development and Design Standard action<br />
item.<br />
Pending the Subdivision Review Team's<br />
proposed changes.<br />
Fiscal Impact Analysis Model<br />
Garden District Plan<br />
Continuing Develop a computerized fiscal impact<br />
analysis model that will allow financial and<br />
operational analysis to be conducted for<br />
selected development proposals.<br />
Continuing Continue to implement the Garden District<br />
Plan and publicize related zoning<br />
amendments to encourage high-value<br />
residential reinvestment in this central city<br />
neighborhood.<br />
The Florida Legislature has delayed required<br />
financial feasibility analyses until Dec. <strong>2008</strong><br />
per House Bill (HB) 7203. The State<br />
continues to work on a revised computerized<br />
fiscal impact model spreadsheet program.<br />
Lime Street two-way project completed.<br />
Orange Street and Lake Avenue four-way<br />
stop completed. Work continues on private<br />
structures including rehabilitation <strong>of</strong> former<br />
Garden Club building and the conversion <strong>of</strong> a<br />
residence into an <strong>of</strong>fice.<br />
Municipal Sign Ordinance<br />
Review<br />
Continuing Submit recommendations to the <strong>City</strong> Discussions occurring between LDDA, <strong>City</strong><br />
Commission regarding changes to sign ordinance<br />
that are being proposed by the Cham-<br />
owners with the intent <strong>of</strong> resolving before<br />
staff, the Chamber and downtown business<br />
ber <strong>of</strong> Commerce.<br />
year end.<br />
Planning, Development and<br />
Design Standards<br />
Continuing<br />
Review planning, development and design<br />
standards to ensure non-traditional housing<br />
development can be pursued to<br />
accommodate international, transnational<br />
and creative class residential interests.<br />
A consultant’s proposed scope <strong>of</strong> work was<br />
prepared for the Commercial Design Review<br />
Guidelines project.<br />
Sector Planning<br />
Continuing Implement a transition from the development<br />
<strong>of</strong> individual neighborhood plans to a more<br />
comprehensive sector planning approach.<br />
A public survey was developed; A plan was<br />
developed to get information regarding the<br />
sector planning effort in front <strong>of</strong> the public,<br />
including on the web. Staff-level meetings<br />
were held.<br />
D-15 Fiscal Year <strong>2008</strong> Annual Budget
Fiscal Year 2007 3rd Qtr. Status <strong>of</strong> Actions<br />
Site Plan Review<br />
Continuing Reorganize and automate the Site Plan<br />
Review and Subdivision Plat submission<br />
process.<br />
Incremental improvements continue to be<br />
made to the process. The new permit center<br />
conference room provides a much needed<br />
“home base” for the Development Review<br />
Team.<br />
Subdivision Plat Review<br />
Process<br />
Continuing<br />
Reorganize existing subdivision plat review<br />
process, update the Land Development<br />
Regulations relating to the review and<br />
approval <strong>of</strong> subdivision plats, then automate<br />
the review process.<br />
The Subdivision Review Team (SRT)<br />
continues to draft proposed revisions to the<br />
subdivision regulations. The revisions<br />
include redefining the preliminary and final<br />
plat stages and making major changes to<br />
sections regarding construction performance<br />
guarantees.<br />
Transportation Plan<br />
Continuing Update the Transportation Element in the Staff developed a detailed scope <strong>of</strong> work for<br />
Comprehensive Plan to identify priority the project with the help <strong>of</strong> Purchasing. This<br />
improvement projects encompassing scope was issued in May, 2007, and sent to<br />
traditional roadway, transit, aviation and rail five consultant firms on the <strong>City</strong>'s continuing<br />
projects, coupled with the development <strong>of</strong> an contract list. Three firms responded with<br />
exceptional system <strong>of</strong> non-vehicular written proposals and two firms short-listed.<br />
facilities.<br />
<strong>Lakeland</strong> Downtown<br />
Redevelopment (LDDA)<br />
Continuing<br />
Implement redevelopment plans for the<br />
<strong>Lakeland</strong> Downtown Development Authority<br />
(LDDA) expansion areas.<br />
The draft Disposition and Development<br />
Agreement between the <strong>City</strong> <strong>of</strong> <strong>Lakeland</strong>, the<br />
<strong>Lakeland</strong> Community Redevelopment Agency<br />
and Feltrim Developments has been<br />
submitted to the Feltrim Developments Team<br />
for their review. A total <strong>of</strong> $8,274,684 has<br />
been spent.<br />
Kelly Recreation Complex<br />
Expansion<br />
Landscape Projects Facility<br />
Regional Police Services<br />
Edgewood Drive Extension<br />
Lime Street Two-way<br />
Conversion<br />
North <strong>Lakeland</strong> Stormwater<br />
Improvements<br />
Continuing Design and construct additional recreational<br />
space to accommodate programming<br />
demands.<br />
Abandoned Expand beautification efforts by establishing<br />
a facility in south <strong>Lakeland</strong> in order to<br />
de-centralize and improve support for<br />
landscaping projects.<br />
Continuing Develop and implement a plan for regional<br />
distribution <strong>of</strong> police services to obtain<br />
optimal efficiency <strong>of</strong> police resources,<br />
personnel, and services in transition to<br />
regional sub-stations.<br />
Continuing Complete the extension <strong>of</strong> Edgewood Drive<br />
from South Florida Avenue to Harden<br />
Boulevard.<br />
Continuing Complete conversion <strong>of</strong> Lime Street<br />
between Florida Avenue and Ingraham<br />
Avenue into a two-way street.<br />
Continuing Complete the North <strong>Lakeland</strong> master plan<br />
stormwater improvements project.<br />
Straughn Trout was selected as the architect<br />
for this project. They are currently surveying<br />
the facility and completing a building<br />
analysis. Program/class study meetings are<br />
scheduled.<br />
This action has been abandoned.<br />
A meeting was held on May 17, 2007 to<br />
examine the detail proposals for department<br />
reorganization to support the regionalization<br />
plan. Further analysis <strong>of</strong> the alternatives<br />
continues at this time.<br />
The right-<strong>of</strong>-way maps have been modified to<br />
accommodate the phasing <strong>of</strong> this project.<br />
The Design/Build criteria package is close to<br />
completion and will be ready for advertising in<br />
August. It is still our goal to move forward<br />
with right-<strong>of</strong>-way acquisition.<br />
The Public Works Department completed the<br />
improvements <strong>of</strong> turning radii <strong>of</strong> Lime Street<br />
between Ingraham Ave. and Massachusetts<br />
Ave. and converted this Phase 1 segment<br />
into two-way traffic. We are in the process <strong>of</strong><br />
acquiring the last two pieces <strong>of</strong> right-<strong>of</strong>-way.<br />
Basin A - Design 95% complete. Application<br />
submitted to SWFWMD for a permit. Legal<br />
descriptions being prepared for needed<br />
easements. Construction specifications being<br />
prepared. Basin B - Design 90% complete.<br />
The consultant is inquiring for an exemption<br />
from SWFWMD.<br />
D-16 Fiscal Year <strong>2008</strong> Annual Budget
Fiscal Year 2007 3rd Qtr. Status <strong>of</strong> Actions<br />
Sleepy Hill Road Widening<br />
Continuing Complete the widening <strong>of</strong> Sleepy Hill Road<br />
from 2 lanes to 4 lanes.<br />
The project is substantially complete. The<br />
new roadway is fully operational and only a<br />
few items remain to be addressed by the<br />
contractor. Waiting on street lighting to be<br />
installed.<br />
Waring Road Extension<br />
Continuing Complete the extension <strong>of</strong> Waring Road from<br />
Old Medulla Road to West Pipkin Road.<br />
Right-<strong>of</strong>-way acquisition is moving forward.<br />
The eminent domain case will be filed late<br />
Summer.<br />
English Oaks Force Main<br />
Construction<br />
Continuing Expansion <strong>of</strong> the Southwest Wastewater<br />
Collection and Transmission Systems in a<br />
timeframe to address anticipated growth.<br />
The Parkway Authority has tentatively<br />
approved submittal. Staff is currently<br />
arranging meetings with the Florida<br />
Department <strong>of</strong> Transportation (FDOT), Polk<br />
County, and <strong>City</strong> <strong>of</strong> <strong>Lakeland</strong> Right-Of-Way<br />
(ROW) agents. Black & Veatch has<br />
submitted 90% <strong>of</strong> plans for review.<br />
Northeast Wellfield Permit<br />
Process<br />
Northside Chlorine Contact<br />
Chamber (NCCC) and<br />
AutoThermophilic Aerobic<br />
Digestion (A-TAD)<br />
Construction<br />
Continuing Complete the water use permitting process to<br />
obtain additional supply which in turn will<br />
allow continual growth in the greater<br />
<strong>Lakeland</strong> area.<br />
The administrative hearing has been delayed<br />
until August 2007.<br />
Completed Ensure treatment capacity is available for The Northside Chlorine Contact Chamber<br />
future development and increase the rating <strong>of</strong> construction has been completed. A<br />
the plant with construction to meet Florida purchase order has been issued for<br />
Department <strong>of</strong> Environmental Protection AutoThermophilic Aerobic Digestion (A-TAD)<br />
(FDEP) permit requirements.<br />
chamber. Construction is scheduled to begin<br />
in Fall 2007.<br />
Southwest Irrigation Utility<br />
Continuing Develop an alliance with Polk County Utilities<br />
and area municipalities to share information<br />
and develop alternative water resource and<br />
reuse strategies.<br />
Negotiations with Polk County continue.<br />
Water Balance Study<br />
Water Transmission Mains<br />
Not Started Complete Water Balance study to adequately<br />
prepare for projected near and long-term<br />
growth demands.<br />
This project is on hold pending approval <strong>of</strong><br />
our Water Use Permit.<br />
Continuing Expand the Southwest Water Transmission An outside engineering firm has been hired to<br />
System in a timeframe to address anticipated update the hydraulic model and size new<br />
growth.<br />
water mains.<br />
West <strong>Lakeland</strong> Wasteload<br />
Reduction Facility (WLWRF)<br />
Continuing Complete design, permitting, financing and<br />
construction <strong>of</strong> proposed Wastewater High<br />
Strength Pre-Treatment Plant.<br />
Bids have been received. Low bid was<br />
approximately $17 million. Staff is awaiting<br />
direction from <strong>City</strong> Administration.<br />
Safe, Attractive Neighborhoods<br />
Downtown Streetscape<br />
Program<br />
Continuing Design and construct new streetscape<br />
projects in the Downtown as funds are<br />
budgeted and projects are identified.<br />
Public Works (PW) Engineering obtained the<br />
FDOT permit for the construction <strong>of</strong> the Pilot<br />
Bank streetscape on Florida Avenue.<br />
Construction will be scheduled once<br />
easement agreement is received from the<br />
Pilot Bank property owners.<br />
In-Fill Housing<br />
Continuing Consider additional programs to incentivize<br />
the development <strong>of</strong> in-fill housing and<br />
expand the availability <strong>of</strong> varied housing<br />
types for new residents including streamlined<br />
approval; waivers <strong>of</strong> impact and other fees;<br />
changes in traditional zoning standards;<br />
The <strong>Lakeland</strong> Community Redevelopment<br />
Agency (LCRA) is in the process <strong>of</strong> initiating<br />
a master plan for the Parker Street Target<br />
Area. Model Block Homebuyer Assistance<br />
Program is being tested. The LCRA is also<br />
working on an in-fill housing incentive<br />
program to encourage builders.<br />
Lot Acquisition Program Continuing Pursue the acquisition and recycling <strong>of</strong><br />
vacant and abandoned lots into the private<br />
housing market.<br />
Outside attorney is finalizing quiet title<br />
lawsuits and will issue title insurance to the<br />
<strong>City</strong> on said lots.<br />
D-17 Fiscal Year <strong>2008</strong> Annual Budget
Fiscal Year 2007 3rd Qtr. Status <strong>of</strong> Actions<br />
Metro-<strong>Lakeland</strong> Housing<br />
Study<br />
Continuing Utilize the Metro-<strong>Lakeland</strong> Housing Study to<br />
directly influence housing initiatives in ways<br />
that enhance and implement Community<br />
Redevelopment Area (CRA) and<br />
Neighborhood Improvement Plans.<br />
The <strong>Lakeland</strong> Community Redevelopment<br />
Agency continues to move forward with the<br />
recommendations <strong>of</strong> the Metro <strong>Lakeland</strong><br />
Housing Study.<br />
Fire Services Expansion Continuing Expand fire rescue services in southwest<br />
<strong>Lakeland</strong> through the design and<br />
construction <strong>of</strong> a new fire station, and the<br />
hiring <strong>of</strong> new personnel also trained in<br />
aircraft rescue and firefighting.<br />
ARFF truck was delivered and driver training<br />
has been completed. Temporary Airport<br />
station was opened June 4th and is currently<br />
being staffed 24 hours a day, 7 days a week.<br />
Private Area Lighting<br />
Continuing Provide electric commercial and residential<br />
customers with a means to add lighting to<br />
premises.<br />
115 private area lights were installed the 3rd<br />
quarter.<br />
Neighborhood Association<br />
Coalition Meetings<br />
Brick Street Policy<br />
Continuing Empower residents to address neighborhood<br />
safety concerns through activities <strong>of</strong> the<br />
Neighborhood Association Coalition (NAC).<br />
Continuing Create a new <strong>City</strong> Brick Street Policy to<br />
allow property owners to petition for<br />
conversion <strong>of</strong> asphalt streets to brick streets<br />
and to share the cost for the upgrade.<br />
The third quarter Neighborhood Association<br />
Coalition (NAC) meeting was held. The<br />
discussion focused on the department's<br />
Hispanic Outreach Program and the recent<br />
classes conducted by the NAC involving<br />
human trafficking and the Neighborhood<br />
Emergency Action Team.<br />
The <strong>City</strong> Manager's <strong>of</strong>fice is reviewing the<br />
proposed Brick Street Policy.<br />
<strong>City</strong>-wide Sidewalk Program<br />
Continuing Implement the <strong>City</strong>-wide sidewalk program<br />
including planning, budgeting, designing,<br />
permitting, obtaining needed rights <strong>of</strong> way,<br />
construction and maintaining the existing<br />
sidewalks.<br />
The <strong>City</strong> received favorable support <strong>of</strong> the<br />
New Jersey Road sidewalk project and<br />
began the construction in June 2007. We<br />
received a Notice to proceed from Federal<br />
Department <strong>of</strong> Transportation (FDOT) for the<br />
construction <strong>of</strong> the sidewalk improvements<br />
project.<br />
Quality Public Spaces<br />
Cultural Assistance Trust<br />
Fund<br />
Completed Develop $2 million Trust Fund producing<br />
financial support for community programs.<br />
Annual transfer complete; next transfer in<br />
<strong>2008</strong> with final transfer in 2011.<br />
Art in Public Places<br />
Continuing Encourage continued placement <strong>of</strong> public art<br />
as recommended by the Public Art<br />
Committee.<br />
8th Annual Lemon Street Sculpture Show<br />
selected and installed in partnership with The<br />
Polk Museum <strong>of</strong> Art. Unveiling held in April.<br />
Lake Mirror Masterplan<br />
Construction<br />
Library Facilities Expansion<br />
Neighborhoods Beautification<br />
Continuing Construct Lake Mirror Park and facilities<br />
elements including North Promenade,<br />
Longreen, The Mirrors, pedestrian<br />
connection from the Iowa Street garage to<br />
the promenade, Main Street Overlook, and<br />
renovation <strong>of</strong> the Lake Mirror Center.<br />
Continuing Expand and improve Library facilities and<br />
services in response to community<br />
partnerships and identified needs.<br />
Continuing Landscape and beautify neighborhoods in<br />
collaboration with neighborhood<br />
associations.<br />
The remainder <strong>of</strong> the Lake Mirror project is<br />
out to bid. The Lake Mirror Renovation has<br />
been put on hold, due to costs, until the rest<br />
<strong>of</strong> the project bids come in.<br />
Build-out <strong>of</strong> E-library space at Lake Miriam<br />
Square continued during third quarter.<br />
Flooring issues and late arrival <strong>of</strong> lights for<br />
stack areas have held up opening. Staff<br />
trained and working at the Main Library until<br />
opening.<br />
The Martin Luther King Beautification Project<br />
has been completed. The Memorial<br />
Beautification project is pending irrigation well<br />
installation. Federal Department <strong>of</strong><br />
Transportation (FDOT) Beautification Grant<br />
for Memorial Blvd from Wabash to I-4<br />
Intersection received.<br />
D-18 Fiscal Year <strong>2008</strong> Annual Budget
Fiscal Year 2007 3rd Qtr. Status <strong>of</strong> Actions<br />
Parks and Trail Services<br />
Expansion<br />
Continuing Expand Parks facilities and services<br />
pursuant to adoption <strong>of</strong> Parks and Trails<br />
Master Plan.<br />
Parks Impact fee workshop held with <strong>City</strong><br />
Commission in April further action pending.<br />
Teneroc land swap pending state approval.<br />
Jackson Park Renovation is substantially<br />
complete.<br />
Lake Gibson Southwest<br />
Drainage Basin Project<br />
Continuing<br />
Complete construction <strong>of</strong> a series <strong>of</strong><br />
stormwater treatment facilities in the<br />
southwest drainage basin to Lake Gibson.<br />
Conceptual Design is complete and a<br />
meeting was held with Public Works, the<br />
consultant, and the Water Management<br />
District. 30% <strong>of</strong> plans are in progress. The<br />
<strong>City</strong> received a $113,666.88 reimbursement<br />
from the SWFWMD per the cooperative<br />
funding agreement for the Watershed<br />
Management Plan.<br />
Lake Hollingsworth Westside<br />
Treatment Strands Project<br />
Continuing Complete construction <strong>of</strong> stormwater Significant public feedback was received<br />
treatment retention strands between the path regarding the proposed project subsequent to<br />
and the lake on the western side <strong>of</strong> Lake staking the easements for appraisal services.<br />
Hollingsworth.<br />
An update presentation was given to the <strong>City</strong><br />
Commission. An alternatives analysis is<br />
underway, by Moduss Engineering, to<br />
investigate best management practices.<br />
Superior Municipal Services<br />
Fire Services Benchmarks<br />
Continuing Establish best practices benchmarks and<br />
report activity using those measures by<br />
participating in the Florida Benchmarking<br />
Consortium.<br />
Initial phase <strong>of</strong> benchmarking completed. The<br />
<strong>Lakeland</strong> Fire Department (LFD) is fully<br />
participating in the Florida Benchmarking<br />
Consortium.<br />
Clean Air Act Improvements<br />
Customer Satisfaction<br />
Surveys<br />
Continuing Meet necessary requirements for compliance Low NOx Burners/Overfire Air System:<br />
to Clean Air Interstate Rule.<br />
Installation <strong>of</strong> low NOx burners and overfire<br />
air system was completed on 5/18/07.<br />
Testing and tuning is currently underway.<br />
Selective Catalytic Reactor (SCR): Sargent &<br />
Lundy continues design work under<br />
Engineering Services Contract. Contract to<br />
supply catalyst for SCR awarded to Haldor<br />
Topsoe, Inc. Bids received to furnish ID Fan<br />
Modifications.<br />
Continuing Conduct residential customer satisfaction Conducted residential customer satisfaction<br />
surveys maintaining a rating <strong>of</strong> 85% or above survey during the month <strong>of</strong> April with a result<br />
and conduct commercial customer<br />
<strong>of</strong> 84%. Next survey is scheduled for month<br />
satisfaction surveys semi-annually maintaining<br />
a rating <strong>of</strong> 80% or above.<br />
satisfaction survey scheduled for<br />
<strong>of</strong> July. Next Commercial customer<br />
October.<br />
Fleet Program Benchmarks<br />
Road Repair and<br />
Stormwater/Drainage<br />
Maintenance Benchmarks<br />
Continuing Participate in the development <strong>of</strong> a Fleet<br />
repair performance measures benchmark<br />
tool that participating government agencies<br />
will be able to utilize.<br />
Continuing Participate in the development <strong>of</strong> a road<br />
repair and stormwater/drainage benchmark<br />
tool that can be used by all participating<br />
government agencies.<br />
Information meeting held in late April.<br />
Discussions started to determine what<br />
measurements will be used.<br />
The data is being cleaned up and will be<br />
ready next quarter for review. We will look at<br />
data submitted by Tallassee and Gainesville<br />
to benchmark with as these two cities are<br />
similar geographically and demographically.<br />
Purchasing & Central Stores<br />
Process Improvement<br />
Completed Work towards achievement <strong>of</strong> The Florida<br />
Association <strong>of</strong> Public Purchasing Officers<br />
(FAPPO) 2006-07 Award for Excellence &<br />
Best Practice in Public Procurement, which<br />
recognizes local agency contributions to the<br />
public purchasing pr<strong>of</strong>ession.<br />
"Award for Excellence & Best Practice in<br />
Public Procurement" for 2006-07 was earned<br />
by Purchasing in April 2007.<br />
D-19 Fiscal Year <strong>2008</strong> Annual Budget
Fiscal Year 2007 3rd Qtr. Status <strong>of</strong> Actions<br />
Support Education<br />
USF Campus Development<br />
Continuing Play active role in master planning and<br />
development <strong>of</strong> proposed USF campus to<br />
encourage meeting the educational and<br />
workforce development needs in concert with<br />
the High Skills Initiative.<br />
The <strong>City</strong> Attorney's <strong>of</strong>fice called a meeting on<br />
May 25th with various city <strong>of</strong>ficials and USF<br />
representatives. Utility, park, road, transit<br />
and other infrastructure and service issues<br />
(re: cost, maintenance authority etc) were<br />
discussed.<br />
<strong>Lakeland</strong> Electric School<br />
Programs<br />
Continuing Visit local schools promoting utility programs, Made presentations to 3 classes and<br />
electrical safety and conservation.<br />
attended 4 community events<br />
Community Center Computer<br />
Program<br />
Continuing Partnership with Polk County School Board<br />
to supply computer training to residents at<br />
community centers.<br />
Classes concluded in May with the end <strong>of</strong> the<br />
school year, and we are hoping to be able to<br />
replace the last 13 computers by the end <strong>of</strong><br />
the budget year. Summer Tutoring classes<br />
currently have access to this lab. Contracted<br />
instructors provide assistance to participants.<br />
Support the Arts, Wellness and Recreation<br />
Imperial Symphony<br />
Partnership<br />
Continuing Work with the Imperial Symphony towards<br />
developing a joint grant application with the<br />
Community Foundation in order to develop a<br />
funding source that will provide additional<br />
arts programming for the <strong>Lakeland</strong> Center<br />
and the Community.<br />
No action during the 3rd quarter. The<br />
Symphony is reviewing budget concerns for<br />
07/08.<br />
<strong>Lakeland</strong> Center Community<br />
Partnerships<br />
Continuing Develop a partnership with local artists We are evaluating the potential for<br />
(through Polk Cultural Arts Board) in order to Community grant support in order to develop<br />
showcase local artists work on an on-going the concept further. We hope to work with the<br />
basis through public art displays.<br />
Polk Museum in order to move this forward<br />
during the 4th Qtr.<br />
D-20 Fiscal Year <strong>2008</strong> Annual Budget
THIS PAGE IS INTENTIONALLY BLANK
Fiscal Year <strong>2008</strong> New Actions Summary<br />
Outcome Action Title Purpose <strong>of</strong> Action End Dept<br />
Enriched Organization Workforce<br />
<strong>Lakeland</strong> Electric Power<br />
Academy<br />
Develop a power academy with area schools<br />
to attain a skilled workforce.<br />
FY<strong>2008</strong><br />
<strong>Lakeland</strong> Electric<br />
Employee Appreciation<br />
Program<br />
Incorporate an employee appreciation<br />
program with annual <strong>City</strong> Manager<br />
meetings.<br />
FY<strong>2008</strong><br />
Communications<br />
Expand succession<br />
planning efforts by<br />
identifying departmental<br />
needs and internal<br />
plans, as well as<br />
developing plans for a<br />
second city-wide<br />
succession planning<br />
program group for<br />
FY10.<br />
Identify departments' succession planning<br />
needs citywide, and determine with them if<br />
their internal plans are sufficient to meet<br />
those needs. If not, work with them to<br />
improve their plans. Also, identify<br />
competencies to aid in developing plans for<br />
them.<br />
FY<strong>2008</strong><br />
Human<br />
Resources<br />
Informed and Engaged Community<br />
COL Website Upgrade Upgrade COL website with new features<br />
including ability to create electronic mailing<br />
list.<br />
FY<strong>2008</strong><br />
Communications<br />
Monthly News Show -<br />
LGN<br />
Produce a monthly segment that provides FY<strong>2008</strong><br />
newsworthy topics <strong>of</strong> interest to our residents<br />
including an in-depth look at how our <strong>City</strong><br />
departments operate as well as the latest<br />
events in the <strong>City</strong> <strong>of</strong> <strong>Lakeland</strong>.<br />
Communications<br />
Help the Homeless<br />
Develop and implement 10-year plan to end<br />
homelessness in <strong>Lakeland</strong>.<br />
FY<strong>2008</strong><br />
Communications<br />
Informed and Engaged Employees<br />
Provide Electronic<br />
Messaging Upgrade in<br />
Emergency Operations<br />
Center for Improved<br />
Overall Internal<br />
Communication<br />
Between All <strong>City</strong> EOC<br />
Stations<br />
Earn the 2007-08<br />
National Purchasing<br />
Institute for<br />
Achievement <strong>of</strong><br />
Excellence in<br />
Procurement Award for<br />
the <strong>City</strong>'s Purchasing<br />
Department.<br />
1) Finish upgrade <strong>of</strong> Emergency Operations<br />
Center with installation <strong>of</strong> electronic<br />
messaging system.<br />
2) Target noise-reduction strategies for the<br />
EOC room and apply to process/system.<br />
Building on the achievement <strong>of</strong> the Florida<br />
Association <strong>of</strong> Public Purchasing Officers<br />
2006-07 Award for Excellence & Best<br />
Practice in Public Procurement Award by the<br />
Purchasing Department, work toward<br />
attainment <strong>of</strong> the 2007-08 National<br />
Purchasing Institute Award <strong>of</strong> Excellence.<br />
FY<strong>2008</strong><br />
FY<strong>2008</strong><br />
Risk<br />
Management<br />
Risk<br />
Management<br />
D-22 Fiscal Year <strong>2008</strong> Annual Budget
Fiscal Year <strong>2008</strong> New Actions Summary<br />
Outcome Action Title Purpose <strong>of</strong> Action End Dept<br />
Optimal Management <strong>of</strong> Existing Financial Resources<br />
Comprehensive Review Develop questionnaire to distribute to <strong>City</strong><br />
<strong>of</strong> Current <strong>City</strong> Safety managerial staff for input regarding safety<br />
Operational Plan concerns and/or suggestions. Identify the<br />
main issues to be addressed and mitigate<br />
other issues before they become a concern.<br />
FY<strong>2008</strong><br />
Risk<br />
Management<br />
Reduction <strong>of</strong> Employee<br />
Health Care Plan's<br />
Large Loss Claim Costs<br />
Related to Emergency<br />
Room Visits & Hospital<br />
Admissions<br />
Identify high risk preventative medications for FY<strong>2008</strong><br />
diabetes, asthma & cardio-vascular<br />
conditions & place them on the first tier <strong>of</strong> the<br />
<strong>City</strong>'s prescription drug<br />
Risk<br />
Management<br />
North American Electric<br />
Reliability Corporation<br />
Meet necessary requirements for compliance<br />
to NERC.<br />
FY<strong>2008</strong><br />
<strong>Lakeland</strong> Electric<br />
Electric Generation<br />
Improvements<br />
Electric Production<br />
Organizational<br />
Improvements<br />
Unit 5 Reliability<br />
Improvements<br />
Prepare Airport Rates<br />
and Charges Document<br />
Financial Trend<br />
Monitoring System<br />
Provide reliable, cost effective and<br />
environmentally compliant electric<br />
generation.<br />
Develop and implement processes for<br />
continuous improvement.<br />
Install system improvements and upgrades to<br />
increase unit availability.<br />
FY<strong>2008</strong><br />
FY<strong>2008</strong><br />
FY<strong>2008</strong><br />
Perform a comprehensive review <strong>of</strong> regional FY<strong>2008</strong><br />
market rates and charges <strong>of</strong> airports <strong>of</strong><br />
similar size and infrastructure level and<br />
prepare a formal rates and charges<br />
document that will promote competitive rates.<br />
Research and move forward with the implementation<br />
<strong>of</strong> a Financial Monitoring System.<br />
<strong>Lakeland</strong> Electric<br />
<strong>Lakeland</strong> Electric<br />
<strong>Lakeland</strong> Electric<br />
Airport<br />
<strong>2008</strong> Performance<br />
Excellence<br />
Superior Municipal Services<br />
Clean Air Act<br />
Compliance<br />
Meet necessary requirements for compliance<br />
to Clean Air Interstate Rule (CAIR).<br />
FY2009<br />
<strong>Lakeland</strong> Electric<br />
Support Education<br />
Electric Customer<br />
Satisfaction Survey<br />
Advanced Metering<br />
Infrastructure (AMI)<br />
<strong>Lakeland</strong> Electric<br />
community programs<br />
Conduct residential satisfaction surveys<br />
quarterly; maintaining a rating <strong>of</strong> 85% or<br />
above. Conduct commercial customer<br />
satisfaction surveys semi-annually;<br />
maintaining a rating <strong>of</strong> 80% or above.<br />
FY<strong>2008</strong><br />
Conduct pilot project to demonstrate further FY<strong>2008</strong><br />
and investigate the implementation <strong>of</strong> AMI for<br />
automated electric power metering and<br />
remote electric service reporting and control.<br />
Visit local schools and attend community FY<strong>2008</strong><br />
events promoting utility programs, electrical<br />
safety, and conservation.<br />
D-23 Fiscal Year <strong>2008</strong> Annual Budget<br />
<strong>Lakeland</strong> Electric<br />
<strong>Lakeland</strong> Electric<br />
<strong>Lakeland</strong> Electric
Enriched Organization Workforce<br />
Ongoing Actions<br />
Technical Rescue Team<br />
(2007, <strong>2008</strong>)<br />
Lead Department: Fire Department<br />
Upgrade Technical Rescue Team to Urban Search and<br />
Rescue Team Standards through procuring equipment<br />
and conducting requisite training.<br />
Advanced Life Support (ALS) Services<br />
(2007, <strong>2008</strong>)<br />
Lead Department: Fire<br />
Provide Advanced Life Support (ALS) level service from<br />
all fire stations requiring paramedic training and<br />
certification status and necessary equipment.<br />
Employee Recognition/Reward Program<br />
(2007, <strong>2008</strong>)<br />
Lead Department: Human Resources<br />
Facilitate and promote inter-departmental development<br />
and utilization <strong>of</strong> employee recognition/reward programs.<br />
Performance Evaluation Process<br />
(2007, <strong>2008</strong>)<br />
Lead Department: Human Resources<br />
Implement the Performance Evaluation/Pay for<br />
Performance process to all <strong>City</strong> departments and<br />
prepare for a FY09 beta year rollout.<br />
Key Success Indicators<br />
<strong>2008</strong> Goal<br />
1 Training Hours for all Departments 23.69 hours per FTE<br />
2<br />
Full-Time Permanent Employees<br />
Who Left the <strong>City</strong><br />
3 Diversity <strong>of</strong> Applicant Pool<br />
65% <strong>of</strong> Certification display<br />
adequately diverse candidates<br />
4 Employee Job Satisfaction 134 total rating out <strong>of</strong> 216<br />
New Actions<br />
<strong>Lakeland</strong> Electric Power Academy<br />
Lead Department: <strong>Lakeland</strong> Electric<br />
Estimated Expenses: $110,000<br />
Develop a power academy with area schools to attain a<br />
skilled workforce.<br />
Employee Appreciation Program<br />
Lead Department: Communications<br />
Estimated Expenses: $2,500<br />
Incorporate an employee appreciation program with<br />
annual <strong>City</strong> Manager’s meetings.<br />
Succession Planning<br />
Lead Department: Human Resources<br />
Estimated Expenses: $500<br />
Identify departments’ succession planning needs <strong>City</strong>wide<br />
and determine with them if their internal plans are<br />
sufficient to meet those needs. Work with departments<br />
to improve their plans and identify competencies to aid in<br />
developing next steps.<br />
D-24 Fiscal Year <strong>2008</strong> Annual Budget
Enriched Community Workforce<br />
Key Success Indicators<br />
<strong>2008</strong> Goal<br />
1 Private & Public Average Annual Wage $33,914<br />
2 Educational Levels <strong>of</strong> the Community 85%<br />
Sustainable Business Environment<br />
Ongoing Actions<br />
USF <strong>Lakeland</strong> Research/Commerce Park<br />
(2007, <strong>2008</strong>)<br />
Lead Department: Community Development<br />
Explore potential for related research business/industry<br />
park development opportunities to expand employment<br />
and community tax base.<br />
Key Success Indicators<br />
<strong>2008</strong> Goal<br />
1 Businesses Renewing Business Tax License 80%<br />
2 Cost <strong>of</strong> Living Index for <strong>Lakeland</strong> 98<br />
3 New Full-Time Jobs in <strong>Lakeland</strong> 600<br />
4 Square Footage <strong>of</strong> Industrial Space/Permitting Retain 1,026,285 sq. feet<br />
5 Square Footage <strong>of</strong> Office Space/Permitting Retain 215,483 sq. feet<br />
6 Square Footage <strong>of</strong> Retail Space/Permitting Retain 457,159 sq. feet<br />
7 Electric Utility Customer Accounts 2.51%<br />
8 Water Utility Customer Accounts 1% Increase<br />
9 Wastewater Utility Customer Accounts 1% Increase<br />
D-25 Fiscal Year <strong>2008</strong> Annual Budget
Informed and Engaged Employees<br />
Key Success Indicators<br />
<strong>2008</strong> Goal<br />
1 Website Hits on Internal Communication Mediums<br />
2<br />
Participation Hours on Internal COL Advisory Teams<br />
& Committees<br />
>202k hits on Insite and >86k views<br />
on Ask <strong>City</strong> Management<br />
Increase employee participation in<br />
internal advisory teams and<br />
committees.<br />
3 Employee Satisfaction with Internal Communications ≥67% Very Satisfied/Satisfied<br />
New Actions<br />
Achievement <strong>of</strong> Excellence in Procurement<br />
Award<br />
Lead Department: Risk Management<br />
Estimated Expenses: $840<br />
Attain the 2007-08 National Purchasing Institute’s<br />
Achievement <strong>of</strong> Excellence in Procurement Award.<br />
Provide Electronic Messaging Upgrade in<br />
Emergency Operations Center (EOC)<br />
Lead Department: Risk Management<br />
Estimated Expenses: $2,500<br />
To finish the upgrade <strong>of</strong> the EOC and target noisereduction<br />
strategies.<br />
Develop New Financial Resources<br />
Key Success Indicators<br />
<strong>2008</strong> Goal<br />
1 Annual Grant Monies Received $14,381,145<br />
2<br />
Annual Contributions & Donations to <strong>City</strong> <strong>of</strong><br />
<strong>Lakeland</strong><br />
3 Annual Contributions from New Income Streams<br />
$275,655<br />
Implement a survey <strong>of</strong> services<br />
recovered through a user charge<br />
(versus taxes) by other cities and<br />
determine opportunities.<br />
D-26 Fiscal Year <strong>2008</strong> Annual Budget
Informed and Engaged Community<br />
Ongoing Actions<br />
Citizen Survey Feedback<br />
Lead Department: Communications Department<br />
Conduct annual evaluation <strong>of</strong> <strong>City</strong> operations by<br />
residents using qualitative and quantitative social science<br />
research techniques showcased on <strong>City</strong> and employee<br />
websites.<br />
Customer Feedback Program<br />
(2007, <strong>2008</strong>)<br />
Lead Department: Communications Department<br />
Provide customer survey cards at <strong>City</strong> facilities and<br />
develop procedures to collect and respond to customer<br />
satisfaction/dissatisfaction feedback.<br />
Key Success Indicators<br />
1 External Communication Mediums Viewed<br />
2 Citizen Communication Satisfaction<br />
3<br />
Volunteer Hours Donated to the <strong>City</strong> <strong>of</strong> <strong>Lakeland</strong> by<br />
Citizens<br />
4 Cases Logged through Citizen Action Center<br />
New Actions<br />
Community Diversity Inclusion<br />
Lead Department: <strong>Lakeland</strong> Vision<br />
Develop a public educational effort engaging the citizenry<br />
on diversity and inclusiveness.<br />
<strong>2008</strong> Goal<br />
>5,493 hits on Video on Demand and<br />
>12,783 hits on the <strong>City</strong> Commission<br />
Agenda/Calendar<br />
Develop a benchmark that<br />
measures the citizen satisfaction <strong>of</strong> communication<br />
methods used by the <strong>City</strong>.<br />
18,100 hours<br />
Implement a Citizen Action Center on the<br />
<strong>City</strong>’s website that will log and track<br />
citizen action items.<br />
5 Presentation to Citizen Groups ≥70 presentations<br />
Monthly News Show - LGN<br />
Lead Department: Communications Department<br />
Estimated Expenses: $500<br />
Produce a monthly segment that provides newsworthy topics<br />
<strong>of</strong> interests to our citizens.<br />
<strong>City</strong> <strong>of</strong> <strong>Lakeland</strong> Website Upgrade<br />
Lead Department: Communications Department<br />
Estimated Expenses: $500<br />
Upgrade COL website with new features.<br />
Help the Homeless<br />
Lead Department: Communications Department<br />
Estimated Expenses: $500<br />
Develop 10-year plan to end homelessness in<br />
<strong>Lakeland</strong>.<br />
D-27 Fiscal Year <strong>2008</strong> Annual Budget
Optimal Management <strong>of</strong> Existing<br />
Financial Resources<br />
Ongoing Actions<br />
Client Services Incentive Program<br />
(2007, <strong>2008</strong>)<br />
Lead Department: <strong>Lakeland</strong> Center<br />
Develop an incentive program in order to increase sales<br />
and financial return on facility and equipment rentals.<br />
GFOA “Distinguished Budget Award”<br />
(2007, <strong>2008</strong>)<br />
Lead Department: Finance<br />
Attain Government Finance Officers Association<br />
Distinguished Budget Award through adaptation <strong>of</strong> <strong>City</strong><br />
budget as an effective policy-making, communications,<br />
financial and operational tool.<br />
Aviation Marketing Plan<br />
(2007, <strong>2008</strong>)<br />
Lead Department: Airport<br />
Implement a three-year contract for a consultant-based<br />
marketing plan to expand aviation and aviation-related<br />
industries and operations.<br />
Auxiliary Air Services<br />
(2007, <strong>2008</strong>)<br />
Lead Department: Airport<br />
Investigate the costs and benefits <strong>of</strong> establishing<br />
scheduled charter air taxi service for passenger and/or<br />
cargo service.<br />
Procedural Documentation<br />
(2007, <strong>2008</strong>)<br />
Lead Department: Finance<br />
Establish and facilitate an inter-departmental process to<br />
develop written documentation for distinct or unique<br />
positions and operational functions.<br />
Process Improvement Program<br />
(2007, <strong>2008</strong>)<br />
Lead Department: Finance<br />
Implement a process improvement program throughout<br />
the organization.<br />
Key Success Indicators<br />
<strong>2008</strong> Goal<br />
1 <strong>City</strong>’s Ability to Finance Debt<br />
2<br />
Residents Perception <strong>of</strong> Economic Issues and<br />
Various <strong>City</strong> Services<br />
3 Millage Rate<br />
4 Wastewater Utility Rate<br />
5 Solid Waste Utility Rate<br />
6 Electric Utility Rate<br />
7 Water Utility Rate<br />
Achieve average underlying bond ratings<br />
<strong>of</strong> A+ within two years on electric utility<br />
bonds and maintain no less than AA–<br />
ratings on our water/wastewater bonds.<br />
Implement a benchmark that measures<br />
public perception <strong>of</strong> economic issues<br />
facing the <strong>City</strong>.<br />
Maintain millage rates below state-wide<br />
average.<br />
Reflect at or below comparable utility<br />
rates with other cities.<br />
Reflect at or below comparable utility<br />
rates with other cities.<br />
Reflect at or below comparable (non-fuel)<br />
utility rates with other cities.<br />
Reflect at or below comparable utility<br />
rates with other cities.<br />
D-28 Fiscal Year <strong>2008</strong> Annual Budget
Optimal Management <strong>of</strong> Existing<br />
Financial Resources (cont’d)<br />
New Actions<br />
Airport Rates and Charges Document<br />
Lead Department: Airport<br />
Estimated Expenses: $4,800<br />
Perform a comprehensive review <strong>of</strong> regional market<br />
rates and charges <strong>of</strong> airports <strong>of</strong> similar size and<br />
infrastructure level and prepare a formal rates and<br />
charges benchmark document that will promote<br />
competitive rates.<br />
Unit 5 Reliability Improvements<br />
Lead Department: <strong>Lakeland</strong> Electric<br />
Estimated Expenses: $6,847,000<br />
Install system improvements and upgrades to increase<br />
unit availability.<br />
Review <strong>City</strong> Safety Operational Plan<br />
Lead Department: Risk Management<br />
Estimated Expenses: $1,300<br />
Develop questionnaire for managerial staff regarding<br />
safety concerns and/or suggestions and develop plan to<br />
address issues.<br />
Electric Production Organizational<br />
Improvements<br />
Lead Department: <strong>Lakeland</strong> Electric<br />
Estimated Expenses: $50,000<br />
Develop and implement processes for continuous<br />
improvement.<br />
Reduction <strong>of</strong> Employee Health Care Plan’s<br />
Large Loss Claim Costs Related to ER Visits<br />
and Admissions<br />
Lead Department: Risk Management<br />
Estimated Expenses: $20,000<br />
Identify the most commonly used preventative medicines<br />
and work to place them on the first tier <strong>of</strong> the <strong>City</strong>’s<br />
prescription drug plan.<br />
North American Electric Reliability Corporation<br />
(NERC) Compliance<br />
Lead Department: <strong>Lakeland</strong> Electric<br />
Estimated Expenses: $125,000<br />
Meet necessary requirement for compliance.<br />
Electric Generation Improvements<br />
Lead Department: <strong>Lakeland</strong> Electric<br />
Estimated Expenses: $23,500,000<br />
Provide reliable, cost effective and environmentally<br />
compliant electric generation.<br />
Develop Financial Trend Monitoring System<br />
Lead Department: <strong>City</strong> Manager’s Office<br />
Estimated Expenses: $100,000<br />
Research and move forward with the implementation <strong>of</strong> a<br />
Financial Monitoring System.<br />
Support the Arts and Wellness<br />
Key Success Indicators<br />
1<br />
<strong>City</strong>/Dividend Contributions Supporting the<br />
Arts<br />
<strong>2008</strong> Goal<br />
Establish a trust fund equal to $2 million<br />
2 Participants Using Recreation Facilities 433,287 Participants<br />
3 Acres <strong>of</strong> Active Parks 430.9 total Acres<br />
4 Miles <strong>of</strong> Walking and Bicycle Paths Increase paved paths by 1 mile<br />
D-29 Fiscal Year <strong>2008</strong> Annual Budget
Quality Developments<br />
Ongoing Actions<br />
Southwest Irrigation Utility<br />
Lead Department: Water Department<br />
Develop an alliance with Polk County Utilities and area<br />
municipalities to share information and develop<br />
alternative water resource and reuse strategies.<br />
Key Success Indicators<br />
Regional Police Services<br />
(2007, <strong>2008</strong>)<br />
Lead Department: Police Department<br />
Develop and implement a plan for regional distribution <strong>of</strong><br />
police services to obtain optimal efficiency <strong>of</strong> police<br />
resources, personnel and services in transition to<br />
regional sub-stations.<br />
<strong>2008</strong> Goal<br />
1 Median Home Price in <strong>Lakeland</strong> $196,000<br />
2 Home Owner Satisfaction Regarding Growth<br />
3 Commercial Satisfaction Regarding Growth<br />
4 Public Green Space Ratio<br />
Establish a 50% satisfaction rating from<br />
homeowners regarding growth and<br />
infrastructure related issues.<br />
Implement a survey that measures<br />
business and commercial satisfaction<br />
regarding development, infrastructure and<br />
amenities.<br />
Maintain a public space ratio <strong>of</strong> .120<br />
acres/resident<br />
Safe, Attractive Neighborhoods<br />
Ongoing Actions<br />
Neighborhood Association Long-Term<br />
Strategic Alignment<br />
(2007, <strong>2008</strong>)<br />
Lead Department: Police Department<br />
Empower residents to address neighborhood safety<br />
concerns through activities <strong>of</strong> the Neighborhood<br />
Association Coalition (NAC).<br />
Downtown Streetscape Program<br />
(2007, <strong>2008</strong>)<br />
Lead Department: Community Development<br />
Design and construct new streetscape projects in<br />
downtown as funds are budgeted and projects are<br />
identified.<br />
Key Success Indicators<br />
<strong>2008</strong> Goal<br />
1 Participants in Neighborhood Partnerships 4,625<br />
2 <strong>City</strong> Crime Rate (Part I Crimes) Reduce <strong>City</strong> crime rate below prior year.<br />
3 Code Enforcement Cases Corrected 72.1% <strong>of</strong> all cases<br />
D-30 Fiscal Year <strong>2008</strong> Annual Budget
Quality Public Spaces<br />
Key Success Indicators<br />
<strong>2008</strong> Goal<br />
1 Citizen Satisfaction Rating with Quality <strong>of</strong> Life 85% Satisfaction Rating<br />
2 Lake Water Quality<br />
Implement a benchmark that measures<br />
public perception regarding lakes and<br />
quality <strong>of</strong> life in <strong>Lakeland</strong>.<br />
3 Traffic Rating Reduce crashes by 1%<br />
4 Roads - Level <strong>of</strong> Service Standard<br />
Local Streets ≥70<br />
Collector Roads ≥80<br />
5 Miles <strong>of</strong> Sidewalk within <strong>City</strong> <strong>of</strong> <strong>Lakeland</strong> 218.59 miles<br />
Support Education<br />
Ongoing Actions<br />
USF Campus Development<br />
(2007, <strong>2008</strong>)<br />
Lead Department: Community Development<br />
Play an active role in the master planning and<br />
development <strong>of</strong> the proposed USF campus to encourage<br />
meeting the educational and workforce development<br />
needs in concert with the High Skills Initiative.<br />
Key Success Indicators<br />
<strong>2008</strong> Goal<br />
1 <strong>City</strong> <strong>of</strong> <strong>Lakeland</strong> Employees Mentoring Hours 296 hours<br />
2<br />
Internships/Co-op Positions with the <strong>City</strong> <strong>of</strong><br />
<strong>Lakeland</strong><br />
15 interns at 7,200 hours<br />
3 School Resource Officer Hours 11,200 hours<br />
4 Usage <strong>of</strong> Library Resources Circulation: 685,000<br />
5<br />
Partnerships Established With Educational<br />
Agencies<br />
9 Partnerships<br />
D-31 Fiscal Year <strong>2008</strong> Annual Budget
Superior Municipal Services<br />
Ongoing Actions<br />
Road Repair and Stormwater/Drainage<br />
Maintenance Benchmarks<br />
(2007, <strong>2008</strong>)<br />
Lead Department: Public Works<br />
Participate in the development <strong>of</strong> a road repair and<br />
stormwater/drainage benchmark tool that all participating<br />
government agencies will be able to utilize.<br />
Fleet Program Benchmarks<br />
(2007, <strong>2008</strong>)<br />
Lead Department: Public Works<br />
Participate in the development <strong>of</strong> a fleet repair<br />
performance measurements benchmark tool that all participating<br />
government agencies will be able to utilize.<br />
Key Success Indicators<br />
1 Citizen Satisfaction with Municipal Services<br />
2 Electric Service Reliability<br />
<strong>2008</strong> Goal<br />
Implement a benchmark that will measure<br />
overall citizen satisfaction <strong>of</strong> municipal<br />
services.<br />
*SAIDI: 128<br />
*CAIDI: 78<br />
*System Average Interruption Duration Index (SAIDI): Measures the total annual power outage duration<br />
(in minutes) for the average customer. Customer Average Interruption Duration Index (CAIDI):<br />
Measures the average restoration time (in minutes) experienced by the customers who had service<br />
interruptions.<br />
New Actions<br />
Electric Customer Satisfaction Survey<br />
Lead Department: <strong>Lakeland</strong> Electric<br />
Estimated Expenses: $12,000<br />
Conduct quarterly residential satisfaction surveys with<br />
the goal <strong>of</strong> maintaining a satisfaction rating <strong>of</strong> 85% or<br />
above. Also conduct semi-annual commercial customer<br />
satisfaction surveys with the goal <strong>of</strong> maintaining a<br />
satisfaction rating <strong>of</strong> 80% or above.<br />
<strong>Lakeland</strong> Electric Community Programs<br />
Lead Department: <strong>Lakeland</strong> Electric<br />
Estimated Expenses: $2,000<br />
Visit local schools and attend community events promoting<br />
utility programs, electrical safety and conservation.<br />
Advanced Metering Infrastructure (AMI)<br />
Lead Department: <strong>Lakeland</strong> Electric<br />
Estimated Expenses: $5,000<br />
Conduct pilot project to demonstrate and investigate the<br />
implementation <strong>of</strong> AMI for automated electric power<br />
metering and remote electric service reporting and<br />
control.<br />
D-32 Fiscal Year <strong>2008</strong> Annual Budget
Process Improvement Teams<br />
Introduction<br />
Fiscal Year <strong>2008</strong> brings the implementation <strong>of</strong> a,<br />
new to the <strong>City</strong> <strong>of</strong> <strong>Lakeland</strong> (COL), process<br />
improvement methodology to be further refined and<br />
consistently trained throughout the <strong>City</strong>. This<br />
methodology will use the train-the-trainer approach<br />
to ensure each COL employee is subjected to and<br />
empowered by the process improvement culture.<br />
This methodology was developed by the Process<br />
Improvement Advisory Team (PIAT) and based on<br />
many improvement methodologies (Kaizen,<br />
Deming, DMAIC and several Corporate plans).<br />
Although the COL has taken part in projects<br />
involving process improvement, this will be the first<br />
formalized <strong>City</strong>-wide methodology.<br />
The new methodology will be used to identify those<br />
processes that define each department’s Core<br />
Services. Once those processes are identified, the<br />
methodology will be used to ensure cost<br />
effectiveness and efficiency. In addition to this<br />
top-down approach, when the annual<br />
Stakeholder’s Group Meetings or Citizen Surveys<br />
indicate that customer requirements have<br />
significantly changed or when performance<br />
measures show that a service or delivery system<br />
needs improvement, a process improvement team<br />
will be convened. If the issues warrant, the team<br />
will be a Cross Functional Process Improvement<br />
Team with representatives from the departments<br />
that own, support or are stakeholders in the<br />
process.<br />
All <strong>City</strong> teams will follow a defined process<br />
beginning with identifying and refining the problem<br />
statement based on initial research and data<br />
gathering. The problem is analyzed through<br />
flowcharting and reviewing more detailed data on<br />
the process. Additional data are collected as<br />
needed. The team uses the data to form a<br />
hypothesis on what component(s) <strong>of</strong> a process is<br />
underperforming and how customers react to the<br />
hypothesis. More data are gathered to explore the<br />
best ideas. When the team is clear on “what is<br />
broken,” solutions are generated. The best<br />
solutions are tested, refined and then implemented<br />
through an action plan. Stakeholders and<br />
customers are consulted in all phases. The team<br />
develops measures to monitor results and uses the<br />
results to develop further refinements.<br />
In addition to the high pr<strong>of</strong>ile Process Improvement<br />
Teams, cross functional teams and departmental<br />
teams do research to improve performance.<br />
These team efforts may be part <strong>of</strong> a routine cycle<br />
<strong>of</strong> review, in reaction to stakeholder or customer<br />
input (complaint data), or because <strong>of</strong> Key Success<br />
Indicator (KSI) performance data that suggests an<br />
improvement is needed.<br />
D-33 Fiscal Year <strong>2008</strong> Annual Budget
Department Performance Levels<br />
Each <strong>of</strong> the <strong>City</strong>’s departments develop a work plan<br />
and new initiatives based on the current Strategic<br />
Plan. The Business Plan then summarizes the new<br />
initiatives and the Performance Budget summarizes<br />
the resources allocated to each Activity and the<br />
performance measures negotiated to define<br />
acceptable results. The Program section <strong>of</strong> this book<br />
(beginning on page D-46) gives a brief overview <strong>of</strong> the<br />
Program Area summaries. It’s accompanied by a<br />
sample performance budget page with numbered<br />
explanations.<br />
Significant Accomplishments<br />
for Fiscal Year 2007<br />
<strong>City</strong> Manager’s Office<br />
The Fiscal Year 2007 Budget was funded without an<br />
increase in the current 3.545 ad valorem tax rate<br />
supporting a General Fund Budget <strong>of</strong> $87,198,792. An<br />
estimated actual comparison <strong>of</strong> revenues to<br />
expenditures projects a net surplus (deficit) for the<br />
year <strong>of</strong> $5.75 million. For the balance <strong>of</strong> the Total <strong>City</strong><br />
Budget <strong>of</strong> $587,346,815, various rate increases in<br />
electric, water, wastewater, solid waste, recreation<br />
fees, golf fees, and impact fees were considered over<br />
the course <strong>of</strong> the fiscal year to provide sufficient funds<br />
to support operations, staffing and other resource<br />
requirements. We will end Fiscal Year 2007 within<br />
budget across all funds.<br />
In Fiscal Year 2007, a number <strong>of</strong> significant financial<br />
and organizational issues impacted the <strong>City</strong>, notably<br />
the Wholesale Power Supply Agreement with the<br />
Florida Municipal Power Agency (FMPA). The FMPA<br />
agreement that was originally executed in 2000 for a<br />
10-year term for the provision <strong>of</strong> up to 100 megawatts<br />
<strong>of</strong> power was structurally flawed by not affording<br />
<strong>Lakeland</strong> Electric the ability to adjust fuel costs at<br />
levels sufficient to compensate the utility for its actual<br />
costs. The FY 2007 FMPA projected losses, through<br />
July, are $82.4 million coupled with an additional $9.9<br />
million for the remaining term <strong>of</strong> the contract. In<br />
response to the projected losses over the term <strong>of</strong> the<br />
agreement, the <strong>City</strong> Commission adopted a strategy<br />
which involved considerable cost reductions and<br />
controls within the operating budget <strong>of</strong> the <strong>Lakeland</strong><br />
Electric Enterprise Fund including a reduction <strong>of</strong> the<br />
utility’s dividend to the General Fund. The reduced<br />
dividend approach was funded through capital project<br />
deferments and the use <strong>of</strong> reserves. Additionally,<br />
5.5% <strong>of</strong> <strong>Lakeland</strong> Electric’s authorized positions were<br />
targeted as personnel freezes estimated at $2.3 million<br />
in annual savings.<br />
Fiscal Year 2007 also reflected the organization’s<br />
response to the unprecedented rate <strong>of</strong> growth. The<br />
2000 Census reported <strong>Lakeland</strong>’s population at 78,452<br />
while <strong>Lakeland</strong>’s 2007 population is estimated to be<br />
93,428, according to the University <strong>of</strong> Florida’s Bureau<br />
<strong>of</strong> Economic and Business Research, a 19.1 %<br />
increase from the last Census. The Community<br />
Development Department indicates over 8,850 new<br />
residential units are in various permitting stages that<br />
are expected to be completed over the next five years.<br />
As such, it is expected that the <strong>City</strong> will attain a<br />
population <strong>of</strong> over 100,000 well before the original<br />
target <strong>of</strong> 2010. The record growth continues to place<br />
strains throughout the organization as employees<br />
strive to respond to site plan reviews, building permit<br />
applications and inspections, maintain an expanding<br />
system <strong>of</strong> utilities and roadways, and provide service<br />
for expanded facilities and programs in response to the<br />
growing population.<br />
The organization completed and implemented a<br />
Classification & Compensation Study for general<br />
employees during Fiscal Year 2007. The Study was<br />
designed to position the <strong>City</strong> <strong>of</strong> <strong>Lakeland</strong>’s<br />
compensation practices at levels consistent with<br />
markets in which we compete for retention <strong>of</strong><br />
personnel and for attraction <strong>of</strong> new employees. The<br />
<strong>City</strong> previously addressed competitive compensation<br />
issues with unionized personnel in the Police and Fire<br />
Departments through the negotiation <strong>of</strong> multi-year<br />
Collective Bargaining Agreements with the Police<br />
Benevolent Association and the International<br />
Association <strong>of</strong> Fire Fighters.<br />
We continued the <strong>City</strong>’s Strategic Planning Initiative to<br />
attain the <strong>City</strong> Commission’s adopted Vision, Mission<br />
and Goal Statements aligned to outcomes, strategies,<br />
action items and the annual budget. In 2007, we<br />
developed <strong>City</strong> Values and kicked <strong>of</strong>f the Values<br />
Campaign connecting employee performance<br />
expectations to organizational activities as well as<br />
developed Outcomes, Strategies and Key Success<br />
Indicators (KSI’s) measuring the overall success <strong>of</strong> our<br />
organization in addressing our customer’s needs.<br />
Values and KSI’s will conscientiously assist us in<br />
making improvements to ensure those needs are met.<br />
D-34 Fiscal Year <strong>2008</strong> Annual Budget
Department Performance Levels<br />
<strong>City</strong> Manager’s Office (cont’d)<br />
Based on the KSI’s, departments will begin to capture<br />
data and measure these indicators in <strong>2008</strong>. Using that<br />
<strong>2008</strong> KSI data, the citizens will begin to see the<br />
dissemination <strong>of</strong> this information and benchmarking<br />
against comparable cities. This is a significant<br />
accomplishment and will continue in the forthcoming<br />
years with greater enhancements and connectivity. In<br />
addition to the KSI’s, the Strategic Plan document and<br />
Business Plan document have been formalized and<br />
prepared for distribution. Through the 3 rd quarter, <strong>of</strong><br />
the 143 strategic actions reported, 20 were completed,<br />
111 were in progress and only 12 were not started or<br />
abandoned.<br />
Based on Property Tax Reform, the total tax rate for<br />
Fiscal Year <strong>2008</strong> will decrease by $0.2508 mills.<br />
We’ve been able to accomplish this and balance the<br />
Budget by placing a s<strong>of</strong>t-freeze on hiring; freezing the<br />
spending levels on operating and maintenance costs<br />
at 2007 amounts; and deferring the funding for some<br />
major capital improvement projects to later years.<br />
Police<br />
The <strong>Lakeland</strong> Police Department (LPD) reduced a<br />
shortage <strong>of</strong> sworn <strong>of</strong>ficers in the uniform patrol<br />
divisions by hiring civilians to take the place <strong>of</strong> <strong>of</strong>ficers<br />
currently assigned to administrative duties and<br />
redeploying those <strong>of</strong>ficers to the field.<br />
The department continued studying the concept <strong>of</strong> a<br />
regional command structure to meet the challenges<br />
posed by increases in both population and land area <strong>of</strong><br />
the <strong>City</strong> as well as achieving greater effectiveness,<br />
efficiency, and accountability in the command<br />
structure.<br />
Continued to nurture our partnership with various<br />
neighborhoods in <strong>Lakeland</strong> through the Neighborhood<br />
Association Coalition (NAC). Emphasis shifted from<br />
tactical issues, better handled by the Neighborhood<br />
Liaison Officers, to more strategic issues encouraging<br />
and empowering the neighborhoods to work with us<br />
and take a more active role in their safety and security.<br />
Refocused the Targeted Areas <strong>of</strong> Concentration (TAC)<br />
process, <strong>Lakeland</strong> Police Department’s version <strong>of</strong><br />
COMPSTAT, through more frequent meetings to<br />
respond even more quickly to the rapidly-changing<br />
crime trends in the <strong>City</strong>.<br />
Continued to serve our citizens through the<br />
Community-Oriented Policing (COP) philosophy.<br />
Utilized the concept <strong>of</strong> Problem-Oriented Policing<br />
(POP) to focus on and more effectively respond to<br />
specific issues in the <strong>City</strong>.<br />
Continued support <strong>of</strong> the athletic, mentoring and<br />
tutoring activities <strong>of</strong> the Police Athletic League (PAL).<br />
Through both support from the <strong>City</strong> and private<br />
donations, a bus and a van were acquired and being<br />
used to support all three parts <strong>of</strong> the league.<br />
For the second year in a row the K-9 Unit claimed the<br />
4-man Team Trophy at the United States Police<br />
Canine Association (USPCA) Trials in Marion County.<br />
Three LPD <strong>of</strong>ficers placed in the top ten scores for<br />
individual handlers in the patrol dog competition.<br />
Developed and implemented a strategic roadway<br />
safety plan to proactively respond to the significant<br />
increase in traffic fatalities within the <strong>City</strong> in 2005 and<br />
2006.<br />
Continued the process <strong>of</strong> recruiting qualified minority<br />
and protected class employees to ensure the<br />
department’s diversity reflects that <strong>of</strong> the <strong>City</strong> it serves.<br />
Did you know…..<br />
In 1885 the <strong>City</strong> fulfilled one <strong>of</strong> its first<br />
priorities <strong>of</strong> instilling law and order when<br />
the town built its first jail. Named for its<br />
first occupant the jail was promptly called<br />
the “McDemerott House.”<br />
Our latest class <strong>of</strong> recruits reflects the following efforts:<br />
1 Black male, 1 Hispanic male, 1 Hispanic female, and<br />
1 White male. Overall department levels are 82%<br />
White, 12% Black, 5% Hispanic, and 1% Other.<br />
D-35 Fiscal Year <strong>2008</strong> Annual Budget
Department Performance Levels<br />
Airport<br />
Airport Fire Station (#7) opened with a 24 hour<br />
Airport presence operating a new Aircraft Rescue<br />
and Firefighting Vehicle. Air Traffic Operations at<br />
the Airport were up 33% in FY07. The Airport<br />
Minimum Standards for Commercial Operators<br />
document was completed and approved by the <strong>City</strong><br />
Commission and we have updated and published a<br />
Federal Aviation Administration (FAA) approved<br />
Airport Emergency Operations Plan.<br />
Several FDOT/FAA Grant projects have been<br />
completed or are nearing completion. Including the<br />
installation <strong>of</strong> new security fencing and access<br />
control systems on the Airport and the re-striping <strong>of</strong><br />
Runway 9/27, taxiways G, F and associated ramp<br />
areas. The striping and fencing projects will open<br />
up a taxiway and provide heightened security on<br />
the field.<br />
The Airport hosted the following successful onairport<br />
events: The annual Sun ‘n Fun Fly-in, the<br />
Florida Jets and Top Gun international Radio<br />
Controlled aircraft events, Wings ‘n Things, the<br />
Beechcraft Pilot Pr<strong>of</strong>iciency Program and the RV<br />
Aircraft Fly-in.<br />
Our maintenance/operations staff installed PAPI<br />
(Precision Approach Path Indicator) Systems on<br />
Runways 5 and 23 and two additional lighted<br />
windsocks. These light units and wind indicators<br />
will enhance safety for landing aircraft.<br />
Polk Community College (PCC) has signed a lease<br />
to operate out <strong>of</strong> the former Keiser College<br />
building. The Airport, PCC and Sun ‘n Fun have<br />
engaged in a joint effort to bring aviation related<br />
training to the airport and the community. Other<br />
new leases include an <strong>of</strong>fice lease with Publix that<br />
will initially add an additional 17,000 square feet;<br />
and a 105-room Hilton Garden Inn with full service<br />
restaurant and conference center. Land lease was<br />
negotiated to be constructed on the front out parcel<br />
<strong>of</strong> the LLRA Terminal Building. The new hotel is<br />
projected to be open in the last quarter <strong>of</strong> 2007.<br />
Electric Utility<br />
• Filled the remainder <strong>of</strong> senior management<br />
team positions.<br />
• Completed an Integrated Resource Plan (IRP)<br />
revision and initiated a detailed risk analysis.<br />
• Completed and implemented a full revenue<br />
requirements rate change.<br />
• Successfully modified our gas hedging<br />
program without disruption. Engaged The<br />
Energy Authority (TEA) to serve as both<br />
consultant and financial hedge fund<br />
implementation agent.<br />
• Initiated a workforce plan and established a<br />
Power Academy with the Polk County School<br />
Board. (Opens August ’08).<br />
• Unit 5 improved operation to a 90% plus<br />
availability.<br />
• Completed a major outage <strong>of</strong> Unit 3 on-time<br />
and within budget.<br />
• Initiated changes in plant performance to meet<br />
Clean Air Interstate Rule (CAIR) requirements.<br />
• Completed a business continuity plan.<br />
• Conducted a review and prepared to meet new<br />
North American Electric Reliability Corporation<br />
(NERC) compliance rules. Florida Reliability<br />
Coordinating Council (FRCC) Audit will be<br />
December, 2007.<br />
• Initiated a new conservation program for FY08<br />
implementation.<br />
• Reduced permanent Table <strong>of</strong> Organization to<br />
628 full-time equivalents (FTE’s).<br />
Retirement Services<br />
Completed the first experience study <strong>of</strong> the<br />
Retirement Plans, resulting in installing and testing<br />
new actuarial assumptions with a go-live date <strong>of</strong><br />
October 1, 2007. Renegotiated the Deferred<br />
Compensation Plan Agreement to eliminate the<br />
two-tier interest formula to the Fixed Account that<br />
was causing the members significant concerns.<br />
Initiated an educational investment program for the<br />
Municipal Employee Pension Board in preparation<br />
<strong>of</strong> redesigning its portfolio in hopes <strong>of</strong> improving<br />
investment returns to the System. Replaced the<br />
Investment Consultant for the Police Supplement<br />
Pension Fund and currently reviewing a redesign<br />
<strong>of</strong> the Plans Asset Allocation and Investment Policy<br />
to improve investment returns on the portfolio.<br />
Implementing a security lending program for the<br />
<strong>City</strong> Pension Plan that should bring in $100,000 to<br />
$150,000 in extra revenue to the Fund.<br />
D-36 Fiscal Year <strong>2008</strong> Annual Budget
Department Performance Levels<br />
Parks & Recreation<br />
Parks<br />
The following capital improvement projects were<br />
completed: Jackson Park Renovation, Martin Luther<br />
King Jr. Boulevard Beautification, US 98 Memorial to<br />
8 th St Beautification, Allen Kryger Park, Lake Bonny<br />
Boardwalk/Fishing Pier, and Hanger II Kitchen<br />
Renovation.<br />
Current projects in design, development or<br />
construction are: Lake Mirror Master Plan elements<br />
including The Mirrors, Long Green, North Promenade,<br />
Main St Overlook Park and the Railroad Pavilion,<br />
Freedom Park, Common Ground and Cypress Youth<br />
Sports Complex, Memorial Blvd Phase III & IV<br />
Beautification, I-4 & 98 Interchange Beautification, I-4<br />
Memorial Blvd Interchange Beautification and I-4<br />
Kathleen Interchange Beautification.<br />
Spring training with the Detroit Tigers was a record<br />
year. Parking proceeds increased 40% and<br />
attendance increased 16%.<br />
Public/private partnerships prospered in 2007 resulting<br />
in private donations equating to $4,668,000 for park<br />
land and park development. The Kaleidoscope Public<br />
Art project raised $585,000 for Common Ground<br />
Inclusive Playground, exceeding the projected financial<br />
goal by 67%. A Donation <strong>of</strong> 33.33 acres <strong>of</strong> park land<br />
provides the opportunity to reduce the sports field<br />
deficit identified in the Parks, Recreation & Trails<br />
Master Plan.<br />
Recreation<br />
The projected 14% increase in recreation patron usage<br />
is on target for 2007. Implementation <strong>of</strong> a computer<br />
facilities rental program for the Lake Mirror Center has<br />
been successful and will be expanded to include most<br />
park and recreation rental facilities providing a central<br />
point <strong>of</strong> service to facilitate customer rentals. The<br />
parks and recreation website continues to provide<br />
improved community outreach, usage increased by<br />
39% in 2007.<br />
Current design development for expansion <strong>of</strong> the Kelly<br />
Recreation Center will provide additional space to<br />
accommodate increased customer usage and program<br />
opportunities.<br />
Libraries<br />
Library services continued to strive to maintain the<br />
highest customer survey satisfaction rating <strong>of</strong> all city<br />
services.<br />
Capital improvement projects this year expanded<br />
library facilities size by 14%. The renovated and<br />
expanded youth services rooms contributed to an all<br />
time monthly high <strong>of</strong> circulation materials in June.<br />
E-Library construction and opening (July) with<br />
assistance from Polk County Library Co-op in Lake<br />
Miriam Shopping Plaza improves customer access and<br />
is anticipated to push circulation <strong>of</strong> library resources<br />
beyond the projected 3% increase.<br />
Library services expanded <strong>of</strong>ferings in 2007 with<br />
inclusion <strong>of</strong> free online video download service<br />
available to library card holders.<br />
Cemeteries<br />
Tree canopy improvements were made to the<br />
cemeteries this year with the award <strong>of</strong> an Urban<br />
Forestry Grant provided through Florida’s Division <strong>of</strong><br />
Forestry’s Urban & Community forestry Grant<br />
Program. This grant enabled removal <strong>of</strong> failing trees,<br />
trimming <strong>of</strong> hurricane damage and planting <strong>of</strong> 309 new<br />
trees in Oak Hill, Roselawn, Lakeview & Tiger Flowers<br />
cemeteries.<br />
Cleveland Heights Golf Club<br />
Capital improvements to the golf club include<br />
renovation <strong>of</strong> golf course restroom facilities, clubhouse<br />
bar renovations and new carts.<br />
Golf fees increased 3.5% over prior year even with<br />
2.1% reduction in rounds due to increased<br />
competition, merchandise sales increased 6% over<br />
prior year and sales per round golf fees increased 8%.<br />
Food and beverage service was revamped; menu<br />
changes were made to maximize kitchen operation<br />
and food delivery. Prior year revenues were sustained<br />
with the addition <strong>of</strong> Traps, a small seafood restaurant,<br />
which operates in the lounge.<br />
D-37 Fiscal Year <strong>2008</strong> Annual Budget
Department Performance Levels<br />
Employee Relations<br />
We graduated 140 employees through <strong>City</strong> University<br />
in FY07; 137 <strong>City</strong>U classes were <strong>of</strong>fered, to which<br />
1,864 employees attended. We established 4 college<br />
partnerships (Keiser, University <strong>of</strong> Phoenix, Barry<br />
University and Polk Community College) enabling our<br />
employees to use their <strong>City</strong>U credits toward college<br />
credit hours. We initiated the 3 rd Certified Public<br />
Manager class, the 2 nd all COL class, in May <strong>of</strong> 2007<br />
with the Police Department as sponsors. We launched<br />
the Pay for Performance pilots in Police and Fire on<br />
1/1/07 for their union positions, using the Fire Dept.<br />
model as the example for the rest <strong>of</strong> the <strong>City</strong> to follow.<br />
We placed 7 Municipal Interns within FY 07. Two <strong>of</strong><br />
our staff were Sterling Examiners during FY07. Two<br />
teams <strong>of</strong> employees have reviewed and rewritten<br />
seven policies and have submitted them to<br />
management for approval. Support has been provided<br />
for every major <strong>City</strong> department during the year. The<br />
support has included: internal communication, testing,<br />
and training. Addition <strong>of</strong> Stakeholder Group input to<br />
Strategic Planning Process & Development <strong>of</strong> Key<br />
Success Indicators for the organization. COL Values<br />
rollout to employees using posters, videos, Access, &<br />
InSite. Submittal <strong>of</strong> FY06 data to the Florida<br />
Benchmarking Consortium for all eight service<br />
categories (Code Enforcement, Fire/Rescue, Human<br />
Resources, Planning/Growth Management, Policing,<br />
Parks and Recreation, Road Repair, & Stormwater/<br />
Drainage Maintenance). Initial selection <strong>of</strong> COL<br />
measures for these same service categories plus<br />
selection <strong>of</strong> benchmark jurisdictions (Gainesville, Palm<br />
Bay, Tallahassee, Coral Springs, Cape Coral, Sanford,<br />
Palm Coast, & Polk County).<br />
Civil Service<br />
Civil Service has continued with efforts to update and<br />
standardize tasks while engaging in reform measures<br />
through fresh interpretations <strong>of</strong> our responsibilities per<br />
the <strong>City</strong> Charter. Our internal goals are to reduce the<br />
average number <strong>of</strong> days it takes to fill positions while<br />
making the interface easier for internal customers. We<br />
have continued to work with IT to develop an updated<br />
version <strong>of</strong> our application importer tool. This tool<br />
relieves staff <strong>of</strong> data input tasks for applications<br />
submitted electronically; electronically submitted<br />
applications make up approximately 70% <strong>of</strong> all<br />
applications we receive. Additionally, we have<br />
participated in the Human Resources consolidation<br />
study; a final report was released in mid August.<br />
Lastly we have revamped several portions <strong>of</strong> our<br />
website and are currently in the process <strong>of</strong> reviewing<br />
how to best service our internal customers with a<br />
recruiting “toolkit”.<br />
Information Technology<br />
The Network Administration team met all system<br />
performance measures for network and server<br />
availability. All core network switches were upgraded<br />
to further improve system availability and Phase I <strong>of</strong><br />
the Business Continuity Plan was completed. The<br />
team was able to purchase refurbished replacement<br />
network communications equipment providing a<br />
savings <strong>of</strong> over $50,000 to the <strong>City</strong>.<br />
Telecommunications improved and diversified the<br />
network system path to the Macintosh plant. This<br />
resulted in improved reliability and protection against<br />
possible system outages. This was accomplished in<br />
conjunction with the Network Support group in an effort<br />
to further improve our overall network reliability.<br />
Without the need for additional funding, the wireless<br />
network has been upgraded to broadband<br />
performance. In addition to higher performance<br />
access to criminal justice systems, this has allowed for<br />
timely virus protection. Virus protection has allowed<br />
for email and internet access for <strong>of</strong>ficers in the field.<br />
Email access reduces a significant amount <strong>of</strong> <strong>of</strong>ficers’<br />
time spent daily coming in to the station to deal with<br />
email, which is important communication for teams that<br />
work different shifts and days <strong>of</strong>f. The internet<br />
continues to grow as a prime method to research<br />
information and for agencies to collaborate on public<br />
safety needs.<br />
Internal Audit<br />
During fiscal year 2007, the Internal Audit Department<br />
completed its substantial commitment to the external<br />
auditors in the completion <strong>of</strong> the <strong>City</strong> <strong>of</strong> <strong>Lakeland</strong>’s<br />
annual CAFR audit. The department performed an<br />
extensive review <strong>of</strong> GPS application utilized by Public<br />
Work’s Solid Waste Division. The department is<br />
assisting in the establishment <strong>of</strong> the supplies and<br />
materials inventory for Pubic Work’s Construction and<br />
Maintenance Division as well as the controls and<br />
procedures surrounding the inventory. The<br />
department is also assisting the Electric Department’s<br />
T & D Division in a review <strong>of</strong> their controls, procedures<br />
and reconciliation processes surrounding the<br />
inventory. The Internal Audit Department completed<br />
all <strong>of</strong> the preliminary work, compliance testing and the<br />
preparation <strong>of</strong> the permanent files for the upcoming<br />
audit <strong>of</strong> the <strong>City</strong> <strong>of</strong> <strong>Lakeland</strong>’s four CRAs.<br />
D-38 Fiscal Year <strong>2008</strong> Annual Budget
Department Performance Levels<br />
The <strong>Lakeland</strong> Center<br />
Over the past year the <strong>Lakeland</strong> Center has<br />
increased revenue by $516,000. This increase<br />
continues a trend over the past three years that<br />
results from an effort to develop quality events as well<br />
as ensure we are recouping costs at a level sufficient<br />
to cover expenses. This was accomplished while<br />
actually experiencing a decrease in total events as<br />
well as total event days for the three <strong>Lakeland</strong> Center<br />
facilities.<br />
The relationship with the Florida High School Athletic<br />
Association continues to expand with the renewal <strong>of</strong><br />
the Girls Volleyball Championship through 2009.<br />
The first phase <strong>of</strong> the overhaul <strong>of</strong> Jenkins Arena was<br />
completed with a refinished look for the backstage<br />
area, including the locker rooms, the <strong>of</strong>fices, function<br />
rooms and the main arena. The Basketball floor was<br />
refinished with new colors as well as inclusion <strong>of</strong> the<br />
Publix logo (our major sponsor).<br />
We renegotiated marketing agreements between the<br />
<strong>Lakeland</strong> Center and Publix, Coca-Cola and <strong>Lakeland</strong><br />
Electric. We established several new entertainment<br />
opportunities including; The <strong>Lakeland</strong> Comedy Series<br />
and Classic Albums live.<br />
Completed the audit requirements associated with<br />
state and federal assistance awarded to the <strong>City</strong> by<br />
the state <strong>of</strong> Florida and FEMA with respect to the<br />
2004 hurricane season. There were no findings or<br />
disallowed costs.<br />
Locked in the reinvestment rate on approximately<br />
$148 million <strong>of</strong> federal securities that will mature in<br />
large increments thru January <strong>of</strong> 2009 using a series<br />
<strong>of</strong> forward starting, fixed receiver investment<br />
swaps. This will result in a more laddered<br />
reinvestment <strong>of</strong> the working capital portfolio <strong>of</strong> the<br />
<strong>City</strong> at approximately 5 percent yield for average<br />
maturities <strong>of</strong> less than 5 years.<br />
Converted the accounting for code enforcement and<br />
special assessment liens from paper-based records<br />
to the <strong>City</strong>’s enterprise-wide utility billing system. To<br />
date the <strong>City</strong> has collected in excess <strong>of</strong> $1.5 million in<br />
overdue code enforcement liens from prior<br />
years. The ten year average annual dollar value <strong>of</strong><br />
special assessment lien collections has increased<br />
from approximately $25,000 to $140,000 since the<br />
change.<br />
Public Works<br />
The <strong>Lakeland</strong> Center received 5 ADDY awards<br />
recognizing their superior Marketing programs. One<br />
was a Benny award for Best in Class for the Comedy<br />
Idols promotion.<br />
Finance<br />
Assisted <strong>Lakeland</strong> Electric staff in preparation <strong>of</strong> cost<br />
<strong>of</strong> service analysis and rate case for electric rates that<br />
went into effect in May 2007.<br />
Completed a transaction involving the sale <strong>of</strong> a<br />
warrant to Goldman Sachs that locked in $7.7 million<br />
in up front cash savings associated with the possible<br />
refunding <strong>of</strong> series 1999A revenue bonds in October<br />
<strong>of</strong> 2009.<br />
Completed the conversion <strong>of</strong> natural gas future<br />
contracts purchased on the NYMEX exchange to<br />
natural gas commodity swaps. This transaction<br />
involved approximately 12.5 million mmbtu’s <strong>of</strong><br />
natural gas hedged thru February <strong>of</strong> 2009 having a<br />
negative mark-to-market value <strong>of</strong> approximately $27<br />
million. This exchange released approximately $41<br />
million in liquidity back to <strong>Lakeland</strong> Electric that was<br />
held by the NYMEX exchange in margin accounts.<br />
Directors Office<br />
• Completed construction <strong>of</strong>:<br />
− Sleepy Hill Road Widening project.<br />
− Fort Fraser Trail and the Highland <strong>City</strong><br />
Intermodal Transfer Center project.<br />
− Main Street Realignment and Intown<br />
Bypass Park ‘N Ride project.<br />
• Commenced construction on the Beacon/Lincoln<br />
Intersection project.<br />
• Completed right <strong>of</strong> way acquisition for:<br />
−<br />
−<br />
−<br />
−<br />
−<br />
−<br />
−<br />
The Beacon/Lincoln Intersection project.<br />
The North <strong>Lakeland</strong> Stormwater Master<br />
Plan (Basin C) project.<br />
The Lime Street two-way conversion<br />
Phase 1 project.<br />
The New York Avenue two-way<br />
conversion project.<br />
The Brunnell Parkway/George Jenkins<br />
Boulevard Intersection project.<br />
The Cleveland Heights Boulevard<br />
Drainage Modification project.<br />
The Fairbanks Street Extension project.<br />
D-39 Fiscal Year <strong>2008</strong> Annual Budget
Department Performance Levels<br />
Public Works (cont’d)<br />
Directors Office (cont’d)<br />
• Completed property acquisition <strong>of</strong> the Carl Hall<br />
parcel for the Lake Gibson SW Drainage Basin<br />
project.<br />
• Completed Solid Waste Business Case for<br />
RouteSmart s<strong>of</strong>tware.<br />
Engineering<br />
• Completed the Phase 1 scope <strong>of</strong> the FEMA<br />
Hazard Mitigation Grant Program for the North<br />
<strong>Lakeland</strong> Stormwater Master Plan Basin C<br />
project including design, permitting and<br />
construction bid selection.<br />
• Completed design <strong>of</strong> brick crosswalks - Kentucky<br />
Avenue at Main and Pine Street and Tennessee<br />
Avenue at Main and Pine Street.<br />
• Completed design and permitting <strong>of</strong> streetscape -<br />
West side <strong>of</strong> S. Florida Avenue between Walnut<br />
and Olive Street.<br />
• Processed and issued 289 right <strong>of</strong> way use<br />
permits.<br />
• Reviewed 75 conceptual site plans for the DRT<br />
(Development Review Committee).<br />
• Reviewed 221 commercial site plan submittals<br />
and 36 subdivision plats and site construction<br />
plan submittals.<br />
• Performed a total <strong>of</strong> 35 survey projects for Water<br />
Utilities and <strong>Lakeland</strong> Electric Departments.<br />
• Inspected and recertified 21 SWFWMD permits<br />
for 21 <strong>City</strong> stormwater retention facilities.<br />
• Completed neighborhood coordination, design,<br />
public meetings and surveys <strong>of</strong> the following<br />
traffic calming projects: Carleton St. from Polk<br />
Ave. to Florida Ave., South Blvd. from McDonald<br />
St. to Belmar St. and Cresap St. from Lake<br />
Hunter Dr. to Florida Ave.<br />
• Completed design and permitting <strong>of</strong> the turn lane<br />
and median improvements on N. Socrum Loop<br />
Road.<br />
Construction and Maintenance<br />
• Brick crosswalk construction:<br />
− Kentucky Avenue at Main<br />
−<br />
Pine Street and Tennessee Avenue at<br />
Main and Pine Street.<br />
• Completed construction improvements at<br />
Commerce Point Drive (drainage), Cleveland<br />
Heights Boulevard (drainage), N. Socrum Loop<br />
Road (turn lane and median), Shore Acres (Fern<br />
Road) (drainage), Hull Street (drainage).<br />
• Completed construction <strong>of</strong> the following FDOT<br />
LAP intersection improvement projects:<br />
− Granada Street at <strong>Lakeland</strong> Hills<br />
Boulevard<br />
− East Edgewood Drive at <strong>Lakeland</strong><br />
Highlands Road<br />
− Imperial Boulevard at South Florida<br />
Avenue.<br />
• New sidewalk construction (3,355 linear feet):<br />
− New Jersey Road (Bartow Road to<br />
Crystal Lake Drive)<br />
− Lake Hollingsworth Drive (Buckingham<br />
Road to Cleveland Heights Boulevard)<br />
− New York Avenue (Memorial Blvd. to<br />
Pear Street)<br />
− Hull Street (Baird Ave. to N. Florida Ave.)<br />
− Kennedy Boulevard (Williamstown Blvd.<br />
and south)<br />
− Main Street (Lake Beulah Drive to Central<br />
Ave; Central Ave to Olive Street).<br />
• Paving <strong>of</strong> dirt alleys (5,809 sq. yards)<br />
• Resurfacing (440,971 sq. yards)<br />
• Street sweeping (14,393 lane miles)<br />
• Sidewalk repairs (37,543 sq. feet)<br />
• Stormsewer pipe cleaning (38,009 linear feet)<br />
Traffic Operations<br />
• Upgraded 232 intersections with ground-mounted<br />
street name signs to meet ADA standards.<br />
• Installed solar powered school zones on Hallam<br />
Drive at Live Oak Drive and on Edgewood Drive<br />
South at McKeel Academy.<br />
• Installed solar powered ground-mounted flashing<br />
beacons at three intersections.<br />
• Rebuilt traffic signal at Edgewood Drive and New<br />
Jersey Road to steel mast arms.<br />
• Installed new traffic signal at Sleepy Hill Road<br />
and Mall Hill Drive in conjunction with Sleepy Hill<br />
Road Widening project.<br />
• Completed two-way conversion <strong>of</strong> Lime Street<br />
from Massachusetts to Ingraham Avenue..<br />
• Completed two-way conversion <strong>of</strong> New York<br />
Avenue from Lake Wire Drive to Lime Street.<br />
Facilities Maintenance<br />
• Construction Management services on the Main<br />
Library Children’s Room Expansion.<br />
• Repainted the T&D /Purchasing Complex on<br />
Parker Street.<br />
• Re-ro<strong>of</strong>ed Airport Hangers 3, 4 & 5.<br />
• Completed structural repairs and coatings at Main<br />
& Orange Street Garages.<br />
D-40 Fiscal Year <strong>2008</strong> Annual Budget
Department Performance Levels<br />
Public Works (cont’d)<br />
Facilities Maintenance (cont’d)<br />
• Replaced the Chiller unit at 3131 Flightline Drive.<br />
• Repaired and installed new sensors and alarms<br />
in Hollis Gardens.<br />
• Renovated the old Terminal Building at the<br />
Airport into a Temporary Fire Station to house the<br />
AARF Truck.<br />
• Constructed new Health Stat facility at Civil<br />
Service.<br />
• Remodeled the 1 st floor <strong>City</strong> Hall Building<br />
Inspections Area.<br />
• Construction Management services on the E-<br />
Library build out.<br />
• Removed the First Scaffolding structures on Main<br />
Street.<br />
• Completed the relocation <strong>of</strong> Telecommunications,<br />
Code Enforcement, Field Services and<br />
Environmental Permitting from the Airside Facility<br />
to various other locations throughout the <strong>City</strong>.<br />
• Completed below grade waterpro<strong>of</strong>ing at the<br />
Chamber <strong>of</strong> Commerce.<br />
Lakes and Stormwater<br />
• Completed the Lake Gibson Southwest Drainage<br />
Basin Watershed Management Plan.<br />
• Completed Lake Parker Park and Sertoma Park<br />
Shoreline Restoration project.<br />
• Initiated Flood Control Automation Feasibility<br />
study.<br />
• Submitted annual NPDES MS4 report which<br />
yielded no deficiencies per FDEP review.<br />
• Conducted 15 environmental presentations for<br />
over 400 students within <strong>City</strong> schools.<br />
• Secured grant funding in the amount <strong>of</strong> $850,941<br />
for Lakes & Stormwater projects.<br />
• Initiated Lakes Hollingsworth and Parker<br />
Stormwater Treatment Alternatives Analysis<br />
studies.<br />
• Collected a total <strong>of</strong> 112 samples from the 17<br />
lakes monitored by Lakes & Stormwater.<br />
Solid Waste<br />
• Adopted FY 07 Solid Waste budget anticipated<br />
contribution <strong>of</strong> $115,570 to the fund surplus. Final<br />
FY 07 Solid Waste budget projects an excess in<br />
contribution <strong>of</strong> more than $1.0M over that<br />
anticipated to the fund surplus.<br />
Fleet Management<br />
• Implemented a keyless automated fueling<br />
procedure for the Public Works Solid Waste<br />
Division vehicles.<br />
• Completed installation <strong>of</strong> additional fencing and<br />
gates, including a new entry/exit pattern at the<br />
fueling facility, thereby enhancing safety and<br />
security and improving traffic circulation at the<br />
facility.<br />
• Streamlined internal monthly billing process,<br />
implementing a paperless electronic version.<br />
Risk Management<br />
Risk Management implemented the first on-line<br />
appraisal report for <strong>City</strong> owned property. This<br />
includes photographs and insurance values <strong>of</strong> insured<br />
property and allows the <strong>City</strong> to track any additions,<br />
upgrades, or deletions <strong>of</strong> such.<br />
Risk Management/Safety reached out to the<br />
community and provided safety training opportunities<br />
to local businesses, as well as Emergency Operations<br />
seminars and displays including hurricane<br />
preparedness.<br />
A Safety Fair is held annually to keep employees in<br />
compliance with their safety training requirements. A<br />
Health Fair is held annually to educate employees/<br />
retirees regarding their benefits and to meet the<br />
providers. Health screenings are <strong>of</strong>fered at this time.<br />
Risk Management implemented the <strong>City</strong>’s first<br />
Employee Worksite Wellness and Health Services<br />
Clinic which should reflect a reduction in absenteeism<br />
and reduce the Health Insurance claims. This <strong>of</strong>fers<br />
free medical services to the employees and without<br />
the use <strong>of</strong> their personal sick time.<br />
Did you know….<br />
In 1916 the cornerstone <strong>of</strong> the first<br />
hospital in <strong>Lakeland</strong> was laid.<br />
D-41 Fiscal Year <strong>2008</strong> Annual Budget
Department Performance Levels<br />
Communications<br />
Created, developed and launched the <strong>City</strong>’s intranet.<br />
This internal communications tool has been well<br />
received by employees. The site has been<br />
operational for less than a year and has received over<br />
180,000 distinct visits. One <strong>of</strong> the more popular<br />
areas <strong>of</strong> the site allows employees to ask <strong>City</strong><br />
Administration a question. This area alone has<br />
received almost 90,000 hits.<br />
Ask <strong>City</strong> Management – 85,767 visits<br />
Job Postings – 36,487 visits<br />
<strong>City</strong> Announcements – 15,841 visits<br />
<strong>City</strong> University – 7,265 visits<br />
Policy Manual – 4,614 visits<br />
SOP – 1,089 visits<br />
The Communications Department developed and<br />
created a series <strong>of</strong> five videos that give an overview<br />
for Florida Friendly landscaping. These videos were<br />
developed in conjunction with the Parks and<br />
Recreation Department. The video series covers the<br />
nine principles <strong>of</strong> Florida Friendly landscaping and<br />
each video segment features a resident expert from<br />
<strong>City</strong> <strong>of</strong> <strong>Lakeland</strong> staff.<br />
The Communications Department completed 202<br />
projects that included graphics or design layout during<br />
FY2007. Many <strong>of</strong> these projects included multiple<br />
elements <strong>of</strong> design including copywriting,<br />
photography, page layout and computer generated<br />
graphics.<br />
LGN, the <strong>City</strong> <strong>of</strong> <strong>Lakeland</strong>’s government access<br />
television station produced and broadcast 74 live<br />
meetings on the Bright House Networks cable system<br />
during FY2007. These live meetings include <strong>City</strong><br />
Commission, Utility Committee, Planning & Zoning,<br />
Code Enforcement and budget hearings.<br />
The Communications Department produced and<br />
posted 20 video segments specifically for webcast on<br />
the internet. These web oriented videos specifically<br />
highlight a <strong>City</strong> service or event and can be viewed by<br />
visiting the video on demand feature on the <strong>City</strong>’s<br />
website (www.lakelandgov.net).<br />
Developed and created a series <strong>of</strong> public service<br />
announcements for the <strong>Lakeland</strong> Police Department.<br />
These PSA’s were used during an educational<br />
television campaign for “Lock it or Loose it”.<br />
The Communications Department completed<br />
research, design, purchase and installation <strong>of</strong> the new<br />
public address system for the <strong>City</strong> Commission<br />
Chambers.<br />
D-42 Fiscal Year <strong>2008</strong> Annual Budget<br />
Fire<br />
The Fire Department took delivery <strong>of</strong> an Oshkosh<br />
Striker 1500 Aircraft Rescue Fire Fighting (ARFF)<br />
truck. Twenty eight firefighters were trained and<br />
certified by Texas A&M University as airport<br />
firefighters.<br />
June 9, 2007 Fire Station #7 was opened at <strong>Lakeland</strong><br />
Linder Regional Airport. The station is staffed with two<br />
firefighters to facilitate and meet FAA Part 139<br />
requirements.<br />
Six Firefighters were certified and licensed as<br />
Paramedics. <strong>Lakeland</strong> Fire Department’s (LFD) 3 rd<br />
Advanced Life Support (ALS) fire station is scheduled<br />
to open in November 2007.<br />
The LFD Technical Rescue Team completed training<br />
in Urban Search and Rescue (USAR) techniques to<br />
become one <strong>of</strong> fifty-three teams in the State known as<br />
Light Technical Rescue Teams (LTRT). <strong>Lakeland</strong> is<br />
identified as LTRT 421.<br />
Two grants were applied for and received. $10,000<br />
was awarded to purchase fire prevention materials<br />
and $2,500 was awarded for training equipment.<br />
Fire Safety Management began a new fire inspection<br />
process titled “One Step”. This process improvement<br />
program computerized the fire inspection process.<br />
The program allows fire inspectors to gain greater<br />
efficiency and access data for fire inspections.<br />
The Fire Department started two new initiatives this<br />
year. The first Annual Open House and<br />
demonstration during Fire Prevention Week attracted<br />
over 1,000 participants. A new internal educational<br />
program titled “Tour <strong>of</strong> Duty” was conducted in<br />
August. This program was designed to show children<br />
<strong>of</strong> fire department personnel some <strong>of</strong> what their<br />
parents do at work.<br />
Initiated “Pre/Post Hurricane Target Hazard Program”<br />
to assist mobile home parks, nursing homes etc<br />
during hurricane season.
Department Performance Levels<br />
Water Utility<br />
Water Operations completed the installation <strong>of</strong> a<br />
water production well at the Combee Water<br />
Treatment Plant to complement the existing wells<br />
located at its Northeast Wellfield. The Williams<br />
Water Treatment Plant replaced one-half <strong>of</strong> its<br />
electrical switchgear originally installed in 1982.<br />
The second half will be changed out in the<br />
beginning <strong>of</strong> FY <strong>2008</strong>; both measures will enhance<br />
system reliability.<br />
Wastewater Operations completed the installation<br />
<strong>of</strong> a contact chamber at the Northside Wastewater<br />
Treatment Plant to better apply chlorine to its<br />
effluent before it is used at the power plant.<br />
Glendale Wastewater Treatment plant completed<br />
several small capital improvement projects to<br />
enhance operations and reduce odor. A new<br />
digester system is nearing completion that will<br />
control costs and further reduce odors.<br />
Water Utility Engineering completed the design and<br />
issued a purchase order to construct the West<br />
<strong>Lakeland</strong> Waste Load Reduction Facility in an<br />
effort to provide future treatment capacity for a<br />
growing customer base. Design is well underway to<br />
increase the collection capabilities in the southwest<br />
growth area, near the airport.<br />
An expanded water conservation program was<br />
developed and the initial step was adoption <strong>of</strong><br />
water rates intended to reduce “excess” water<br />
usage above the normal amount used for family<br />
and efficient lawn needs. Partial funding grants<br />
were secured through the South West Florida<br />
Water Management District to provide customer<br />
based programs in FY 2007 – <strong>2008</strong> to further<br />
reduce consumption.<br />
Community Development<br />
Planning (Current and Long-range)<br />
While <strong>Lakeland</strong> did experience an overall slow<br />
down in development activity in FY2007 the city<br />
continued to grow through annexation <strong>of</strong> 743<br />
acres, expanding <strong>Lakeland</strong>’s corporate limits by<br />
1.6% to a total area <strong>of</strong> 73.31 square miles. The<br />
<strong>City</strong>’s population also grew to 93,428 people, an<br />
increase <strong>of</strong> 2% since FY2006.<br />
Future Land Use changes and Rezoning requests<br />
continued at a steady pace. Major changes to three<br />
Developments <strong>of</strong> Regional Impact were reviewed<br />
including Oakbridge, Williams (including initiation <strong>of</strong><br />
negotiations for a USF Campus Development<br />
Agreement), and Bridgewater.<br />
A fourth review was initiated on the Flagler<br />
property in west <strong>Lakeland</strong>, north <strong>of</strong> the Airport. A<br />
Developers Agreement was also completed for a<br />
major <strong>of</strong>fice employment center to be located on<br />
Mall Hill Drive just north <strong>of</strong> I-4.<br />
Six large-scale and 3 small-scale Comprehensive<br />
Plan Land Use Map Amendments were processed<br />
totaling approximately 700 acres. The entire<br />
Recreation Open Space Element was updated to<br />
conform to a new Parks Master Plan. A new<br />
School Facility Element was drafted and presented<br />
in partnership with the Polk County School Board<br />
at the annual Schools Summit. The Transportation<br />
Element will be updated next with a consultant<br />
contract expected to be executed before the end <strong>of</strong><br />
FY2007. Additionally, three Impact Fee Studies<br />
were completed with adoption <strong>of</strong> new fee<br />
ordinances anticipated in September.<br />
Twenty-seven (27) zoning cases were approved for<br />
a variety <strong>of</strong> proposed developments including<br />
Lakeside Village Villas and Apartments (150 villas<br />
& 264 apartments), an Aldi Grocery Store on US<br />
98 North, 20 acres <strong>of</strong> multi-family development at<br />
the Southwest corner <strong>of</strong> US 98 North and Griffin<br />
Road, 48 acres for <strong>of</strong>fice, warehouse and retail<br />
space on Mall Hill Drive, 42 acres for warehouse,<br />
<strong>of</strong>fice and a truck maintenance facility on Airport<br />
Road, 142 acres <strong>of</strong> medium industrial development<br />
on Gateway Boulevard, and 167 acres <strong>of</strong> medium<br />
industrial development on State Road 33.<br />
A new planning effort was initiated with work on the<br />
Southwest Sector Plan, the first <strong>of</strong> nine such plans<br />
intended to bridge the gap between the <strong>City</strong>’s<br />
broad comprehensive plan and detailed<br />
neighborhood-specific plans. Neighborhood<br />
planning finalized a draft <strong>of</strong> a Neighborhood<br />
Coaching Manual. This training manual is a key<br />
part <strong>of</strong> an overall strategy to provide more effective<br />
technical assistance and training to local<br />
neighborhood associations.<br />
D-43 Fiscal Year <strong>2008</strong> Annual Budget
Department Performance Levels<br />
Community Development (cont’d)<br />
Historic Preservation<br />
A notification process was developed in<br />
partnership with <strong>Lakeland</strong> Electric to inform and<br />
educate new electric customers that move into any<br />
<strong>of</strong> <strong>Lakeland</strong>’s 7 historic districts.<br />
The notice provides information on the unique<br />
benefits and responsibilities <strong>of</strong> property ownership<br />
with reference to our historic design review<br />
guidelines and special permitting procedures.<br />
Subdivision Regulations<br />
Current Planning coordinated an interdepartmental<br />
effort to adopt new “typical” street<br />
cross sections to ensure that street trees are<br />
adequately provided for in the design and<br />
construction <strong>of</strong> new public streets. The new cross<br />
sections were adopted in mid-FY07. Out <strong>of</strong> this<br />
effort evolved a Subdivision Review Team that<br />
examined the existing regulations and procedures<br />
governing the creation <strong>of</strong> new subdivisions.<br />
Revisions to the subdivision regulations have been<br />
drafted that include a concept review process<br />
similar to that now used for commercial site plans.<br />
Final review and adoption <strong>of</strong> revised regulations<br />
and review procedures is anticipated in early FY08.<br />
Economic Development<br />
Since receiving Florida Enterprise Zone<br />
designation in January 2006 the <strong>City</strong>’s Economic<br />
Development Coordinator has been busy<br />
promoting this new program. In FY07<br />
approximately $30,000 worth <strong>of</strong> sales tax refund<br />
applications were submitted to the Florida<br />
Department <strong>of</strong> Revenue on behalf <strong>of</strong> local<br />
businesses utilizing various incentives <strong>of</strong>fered<br />
through this State-funded initiative.<br />
Community Redevelopment Areas (CRA’s)<br />
A new Project Manager position was filled to<br />
administer a growing number <strong>of</strong> special projects<br />
and programs in each <strong>of</strong> the three CRA districts.<br />
MidTown: Several new housing-related initiatives<br />
were implemented during the past year including<br />
an Acquisition and Relocation Pilot Program in the<br />
medical area near the hospital. A conceptual<br />
development plan for the Parker Street<br />
neighborhood resulted in the creation <strong>of</strong> a Home<br />
Buyer Assistance Program and Exterior<br />
Improvement Program designed to attract new<br />
home buyers into that area and encourage<br />
property owners to make needed improvements to<br />
existing structures. Additionally, a consultant was<br />
retained to conduct a residential use market study<br />
<strong>of</strong> the entire MidTown district to determine the<br />
demand for new residential units, the demand for<br />
various types <strong>of</strong> units, the absorption rate <strong>of</strong> that<br />
demand, and recommend locations for each<br />
residential type.<br />
Dixieland: Primary focus during FY2007 has been<br />
on the resurfacing <strong>of</strong> S. Florida Avenue through the<br />
Dixieland corridor. This Florida Department <strong>of</strong><br />
Transportation (FDOT) project is scheduled to<br />
begin in the spring <strong>of</strong> <strong>2008</strong> and last 6-8 months.<br />
The CRA has approached FDOT about expanding<br />
their scope <strong>of</strong> work to include much needed<br />
drainage improvements along certain segments <strong>of</strong><br />
this roadway. It is expected that the final project will<br />
involve a partnership between the FDOT, the <strong>City</strong><br />
and the CRA.<br />
The CRA also focused attention on a branding<br />
enhancement initiative to include a logo, distinctive<br />
street signs and district gateway features. These<br />
district-wide enhancements are designed to<br />
encourage continued private reinvestments in<br />
addition to financial incentives available through<br />
Design Assistance and Façade Improvement<br />
grants.<br />
Planning studies were initiated in FY2007 to<br />
explore the viability <strong>of</strong> mixed-use development with<br />
residential units located above retail/<strong>of</strong>fice on the<br />
first floor and to analyze the current parking<br />
availability throughout the district and develop<br />
strategies to provide additional parking in areas <strong>of</strong><br />
highest demand.<br />
Downtown: The most noteworthy accomplishment<br />
during FY2007 was completion <strong>of</strong> land acquisition<br />
on the redevelopment site located north <strong>of</strong> the<br />
Police station. This milestone sets the stage for<br />
that area to be transformed to a high-density,<br />
mixed-income residential neighborhood designed<br />
to provide residents with urban amenities within<br />
walking distance <strong>of</strong> the heart <strong>of</strong> downtown.<br />
Negotiations will proceed with prospective<br />
developers in the coming year to bring this critical<br />
component <strong>of</strong> downtown’s future growth to reality.<br />
D-44 Fiscal Year <strong>2008</strong> Annual Budget
Department Performance Levels<br />
Community Development (cont’d)<br />
Building Permitting and Inspection<br />
Across the board new building activity declined<br />
from the prior record-setting year in FY06. At the<br />
same time inspections for the expansion or<br />
remodeling <strong>of</strong> existing buildings increased. Based<br />
on the first 10 months <strong>of</strong> FY07 it is estimated that<br />
the number <strong>of</strong> building permits will be down 13%<br />
and the valuation <strong>of</strong> permits issued 43% less than<br />
last year. During that same timeframe 437 new<br />
single-family permits have been issued, a decline<br />
<strong>of</strong> approximately 14% from FY06. The net result is<br />
anticipated to be a 17% decrease in total fees<br />
collected for permits and inspections.<br />
One <strong>of</strong> the most notable permits in FY07 was for<br />
the remodeling <strong>of</strong> the Permit Center located on the<br />
first floor <strong>of</strong> <strong>City</strong> Hall. This more efficient use <strong>of</strong><br />
space allows a wider array <strong>of</strong> customer services to<br />
be provided in this centralized location. This 6-<br />
month remodeling project was completed on time<br />
and under budget with minimal interruption <strong>of</strong><br />
customer services.<br />
Housing<br />
For the first time since December 2003 the<br />
Housing Division accepted new applications for its<br />
housing rehabilitation assistance program. Under a<br />
newly established procedure all applications were<br />
received during the month <strong>of</strong> July and will be<br />
reviewed at the same time. Applicants will be<br />
notified as to their eligibility and prioritized on the<br />
basis <strong>of</strong> specific criteria, community needs and<br />
funding availability. Applicants that do not qualify<br />
based on income or other Federal or State<br />
mandated criteria will be informed in writing and<br />
referred to other agencies for assistance. A new<br />
enrollment period will be announced when the list<br />
<strong>of</strong> approved applicants drops below a 12-month<br />
waiting period.<br />
Two new grants were administered in 2007, $2.3<br />
million <strong>of</strong> Hurricane Housing Recovery (HHR)<br />
funds and $500,000 <strong>of</strong> HOME Again money.<br />
Additionally the <strong>City</strong> received $350,000 for the My<br />
Safe Florida Home program. In total, 40 singlefamily<br />
residences were rehabilitated or repaired<br />
and down-payments assistance was provided to 51<br />
new home owners during the prior year.<br />
Through a partnership with Polk County and Winter<br />
Haven $4.4 million <strong>of</strong> HHR funds were made<br />
available for the construction <strong>of</strong> multi-family/<br />
homeless units. Joint efforts with Polk County and<br />
the Mayor’s Task Force on Homelessness were<br />
also initiated to begin development <strong>of</strong> a Ten-Year<br />
Plan to End Chronic Homelessness.<br />
Code Enforcement<br />
Several significant projects and goals were<br />
completed including the continued leveraging <strong>of</strong><br />
technology to improve daily workflow and<br />
productivity. New violations totaled 12,415, a<br />
28.9% increase over FY06, the result <strong>of</strong> the first full<br />
year <strong>of</strong> Evolution Data Optimized (EVDO)<br />
broadband deployment in the field. This technology<br />
also improved the Division’s response rate by<br />
16.3% over the prior year, taking on average 1.34<br />
days (including weekends) to respond to<br />
complaints with an initial site visit and inspection.<br />
Sweeps <strong>of</strong> the Webster Park, Jewel Avenue,<br />
Gladys Leggett, Orangewood, and Robson<br />
neighborhoods resulted in action against 1,451<br />
violations. Subsequent cleanups in those same<br />
neighborhoods, coordinated with Neighborhood<br />
Planning, Solid Waste, and Construction and<br />
Maintenance, resulted in the removal <strong>of</strong> over 148<br />
tons <strong>of</strong> debris.<br />
In May, Code Enforcement partnered with Finance<br />
Customer Billing to increase efficiency by<br />
consolidating the administrative and pay<strong>of</strong>f<br />
functions associated with the <strong>City</strong>’s Code<br />
Enforcement Board and Hearing Officer. In July the<br />
Division’s <strong>of</strong>fices were relocated from <strong>Lakeland</strong><br />
Electric Airside to 3610 Drane Field Road. The new<br />
broadband technology allowed the mobile field staff<br />
to forego much needed <strong>of</strong>fice space, resulting in an<br />
all but transparent move completed in just one day.<br />
D-45 Fiscal Year <strong>2008</strong> Annual Budget
THIS PAGE IS INTENTIONALLY BLANK
CITY OF LAKELAND<br />
<strong>2008</strong><br />
Economic and Community Development<br />
Program<br />
Activity<br />
Page<br />
Planning Services D-50<br />
Development Review Services D-53<br />
Code Enforcement D-55<br />
Building Inspection and Permitting Services D-58<br />
Local Business Taxes D-61<br />
Affordable Housing Programs D-64<br />
Neighborhood Programs D-67<br />
Economic Development D-69<br />
Downtown Community Redevelopment Area D-72<br />
Mid-Town Community Redevelopment Area D-74<br />
Dixieland Community Redevelopment Area D-76<br />
D-47 Fiscal Year <strong>2008</strong> Annual Budget
Economic and Community Development<br />
Dixieland Community<br />
Redevelopment Area<br />
3%<br />
Planning Services<br />
4%<br />
Development Review<br />
Services<br />
10%<br />
Mid-Town Community<br />
Redevelopment Area<br />
21%<br />
Code Enforcement<br />
8%<br />
Downtown<br />
Community<br />
Redevelopment Area<br />
10%<br />
Building Inspection<br />
and Permitting<br />
Services<br />
14%<br />
Economic<br />
Development<br />
15%<br />
Neighborhood<br />
Programs<br />
2%<br />
Affordable Housing<br />
Programs<br />
12%<br />
Local Business<br />
Licenses<br />
1%<br />
D-48 Fiscal Year <strong>2008</strong> Annual Budget
Economic and Community Development<br />
Experience Budget Experience FY 2007-08<br />
For Year For Year 2006-07 Proposed By<br />
EXPENSES 2005-06 2006-07 Estimated <strong>City</strong> Manager<br />
Personnel<br />
Salaries and Wages 3,734,818 4,658,943 4,169,799 4,619,896<br />
Fringe Benefits 872,355 1,092,788 967,742 1,140,879<br />
Total Personnel 4,607,174 5,751,731 5,137,541 5,760,775<br />
Non-Personnel<br />
Internal Service Charges 924,079 870,758 849,945 844,195<br />
Pr<strong>of</strong>essional and Contractual 66,161 428,996 369,237 353,213<br />
Utilities 131,850 144,589 126,174 135,754<br />
Insurance and Fixed Charges 164,878 207,796 204,450 207,849<br />
All Other Operations and<br />
Maintenance 5,219,204 8,055,413 8,190,604 6,436,353<br />
Capital Outlay 1,730,983 5,394,125 5,188,364 1,927,710<br />
Debt Service 1,062,864 2,610,387 2,610,387 836,532<br />
Total Non-Personnel 9,300,018 17,712,064 17,539,161 10,741,607<br />
Total Expenditures 13,907,192 23,463,795 22,676,702 16,502,382<br />
Net Transfers<br />
Revenue Sources<br />
Taxes<br />
Licenses and Permits 4,409,051 5,041,547 4,052,127 4,177,458<br />
Intergovernmental 5,909,532 7,355,929 9,050,015 6,137,549<br />
Charges for Services 1,097,021 1,032,800 1,090,939 1,043,517<br />
Interest Income 194,958 67,014 379,918 57,352<br />
All Other Revenue 1,716,731 1,285,613 1,539,378 961,359<br />
Total Revenue 13,327,293 14,782,903 16,112,378 12,377,235<br />
Funding to be Provided 579,899 8,680,892 6,564,324 4,125,146<br />
D-49 Fiscal Year <strong>2008</strong> Annual Budget
Planning Services<br />
MISSION<br />
To provide excellent long-range and current planning services used to guide future development <strong>of</strong><br />
the <strong>City</strong> as a quality urban environment.<br />
CORE SERVICES<br />
Planning Services includes three Core Service areas:<br />
• Long Range Planning service area includes establishing long range land use plans and making<br />
periodic amendments to those plans. The most important <strong>of</strong> which is the <strong>City</strong> <strong>of</strong> <strong>Lakeland</strong><br />
Comprehensive Plan which incorporates Goals, Objectives and Policies and the Future Land Use<br />
Map. This service area also includes assisting with multi-jurisdiction plans such as the Polk County<br />
Transportation Planning Organization’s Long Range Transportation Plan and reviewing large projects<br />
with a build out <strong>of</strong> 15-20 years called Developments <strong>of</strong> Regional Impact.<br />
• Current Planning service area includes the establishment and maintenance <strong>of</strong> supporting codes,<br />
especially the Land Development Regulations (LDRs) which incorporate zoning, subdivisions,<br />
parking, landscaping and other regulations. This service area also includes evaluating requests for<br />
the rezoning <strong>of</strong> property, including conditional use requests and maintaining the Official Zoning Map.<br />
• Property Information Office which assigns new street addresses in newly developed areas, reassigns<br />
addresses when needed in existing areas, and provides a wide variety <strong>of</strong> property information to the<br />
public such as legal descriptions.<br />
Other miscellaneous planning service activities include planning for and coordinating annexations;<br />
updating impact fee studies; the collection, analysis and publication <strong>of</strong> planning data and maps; the<br />
dissemination <strong>of</strong> planning information to the public; and planning-related studies and research.<br />
TABLE OF ORGANIZATION<br />
See support staff and entire<br />
Community Development Table<br />
<strong>of</strong> Organization on page G-16.<br />
Legend<br />
Left number= 2007 FTE<br />
Right number= <strong>2008</strong> FTE<br />
D-50 Fiscal Year <strong>2008</strong> Annual Budget
Planning Services<br />
OPERATIONAL AND/OR PUBLIC SERVICE LEVELS<br />
Item Measured<br />
2004<br />
Actual<br />
2005<br />
Actual<br />
2006<br />
Actual<br />
2007<br />
Projected<br />
<strong>2008</strong><br />
Proposed<br />
Rezonings, including Planned Unit<br />
Developments<br />
47 48 50 45 45<br />
Conditional Use applications 22 24 13 15 15<br />
Text amendments to LDRs 5 20 16 15 15<br />
Acres Annexed 8 910 524 800 700<br />
Future Land Use Map Amendments 8 19 12 16 16<br />
Acres <strong>of</strong> Land Use Changed 1,078 2,315 781 4,048 1,500<br />
PERFORMANCE MEASURES (KSI’S)<br />
GOAL: Growth Management<br />
OUTCOME: Quality Developments<br />
KSI: Public green space ratio (<strong>2008</strong> Goal: Maintain a public space ratio <strong>of</strong> .120 acres/resident)<br />
Objective: Ensure compliance with Parks Master Plan by measuring the public green<br />
space ratio per resident<br />
GOAL: Quality <strong>of</strong> Life<br />
OUTCOME: Support the Arts and Wellness<br />
KSI: Miles <strong>of</strong> Walking and bicycle paths (<strong>2008</strong> Goal: Increase paved paths by 1 mile)<br />
Objective: Ensure compliance with Parks Master Plan by measuring the Number <strong>of</strong><br />
miles <strong>of</strong> walking and bicycle paths<br />
OUTCOME: Quality Public Spaces<br />
KSI: Traffic Rating (<strong>2008</strong> Goal: Reduce crashes by 1%)<br />
Objective: Traffic rating (number <strong>of</strong> traffic crashes, including pedestrians and bicycles).<br />
NEW INITIATIVES<br />
Growth Management<br />
• Sector Plan for Southwest <strong>Lakeland</strong> has been initiated. This is the first <strong>of</strong> nine proposed plans<br />
intended to allow the <strong>City</strong> to better understand anticipated land uses in the area and through<br />
that effort, develop an estimate <strong>of</strong> future public infrastructure needs to serve the anticipated land<br />
uses and update the <strong>City</strong>’s Comprehensive Plan.<br />
• Commencement <strong>of</strong> a major study and update project to review the <strong>City</strong>’s future road, bus, trail,<br />
bikeway and sidewalk needs over the next 10 or more years.<br />
D-51 Fiscal Year <strong>2008</strong> Annual Budget
Planning Services<br />
2007-08<br />
Experience Budget Experience Proposed<br />
For Year For Year 2006-07 by<br />
EXPENSES 2005-06 2006-07 Estimated <strong>City</strong> Manager<br />
Personnel<br />
Salaries & Wages 182,094 292,858 215,779 299,763<br />
Fringe Benefits 41,536 55,360 50,044 69,742<br />
Total Personnel 223,631 348,218 265,822 369,505<br />
Non-Personnel<br />
Internal Service Charges 38,362 40,366 40,562 46,828<br />
Pr<strong>of</strong>essional & Contractual 6,035 9,224 9,419 8,727<br />
Utilities 5,689 5,885 5,736 7,508<br />
Insurance and Fixed Charges 7,017 36,877 37,054 38,753<br />
All Other Operations and Maintenance 40,197 87,953 86,964 44,716<br />
Capital Outlay 40,495 1,000 1,000 70,041<br />
Debt Service<br />
Total Non-Personnel 137,794 181,306 180,736 216,574<br />
Total Expenditures 361,425 529,524 446,558 586,079<br />
Net Transfers<br />
Revenue Sources<br />
Taxes<br />
Licenses & Permits<br />
Intergovernmental<br />
Charges for Services 93,159 80,000 48,000 45,169<br />
Interest Income<br />
All Other Revenue 34,580 30,000 43,060 30,000<br />
Total Revenue 127,739 110,000 91,060 75,169<br />
Funding to be Provided 233,686 419,524 355,498 510,910<br />
D-52 Fiscal Year <strong>2008</strong> Annual Budget
Development Review Services<br />
MISSION<br />
To ensure that proposed development adheres to all requirements and conditions including zoning,<br />
concurrency, and engineering standards.<br />
CORE SERVICES<br />
Core Services include commercial site plan review, subdivision plat and construction plan review, Fire<br />
Department construction plan review, administration <strong>of</strong> impact fees, administration <strong>of</strong> the concurrency<br />
management system, and evaluation <strong>of</strong> requests for zoning variances. Trend development data on<br />
total permitted development can be accessed at http://www.lakelandgov.net/commdev/planning/<br />
index.html<br />
OPERATIONAL AND/OR PUBLIC SERVICE LEVELS<br />
Item Measured<br />
2004<br />
Actual<br />
2005<br />
Actual<br />
2006<br />
Actual<br />
2007<br />
Projected<br />
<strong>2008</strong><br />
Proposed<br />
Commercial site plans reviewed 157 200 255 280 300<br />
Subdivision plats/construction plans<br />
reviewed<br />
6 21 17 19 17<br />
Fire Dept. construction plans<br />
reviewed<br />
815 962 1,155 1,160 1,200<br />
Major traffic study reviews 14 18 14 16 17<br />
Zoning variance requests 60 78 94 110 90<br />
Total Residential Units Permitted 420 935 1851 1,000 1,300<br />
Total Square Feet Permitted:<br />
Industrial 934,774 1,082,666 1,026,285 1,000,000 1,000,000<br />
Office 113,306 117,212 215,483 75,000 150,000<br />
Retail 321,910 597,947 457,159 350,000 350,000<br />
NEW INITIATIVES<br />
Growth Management:<br />
• In FY 2007 an inter-departmental Subdivision Review Team was formed to revise the <strong>City</strong>’s<br />
Subdivision Regulations and procedures for the review and approval <strong>of</strong> subdivision plats and<br />
construction plans. A review <strong>of</strong> the total process used to administer impact fees is also planned for<br />
<strong>2008</strong>.<br />
D-53 Fiscal Year <strong>2008</strong> Annual Budget
Development Review Services<br />
TABLE OF ORGANIZATION<br />
Portions <strong>of</strong> the Community Development Department support this activity and many others.<br />
See page G-16.<br />
2007-08<br />
Experience Budget Experience Proposed<br />
For Year For Year 2006-07 by<br />
EXPENSES 2005-06 2006-07 Estimated <strong>City</strong> Manager<br />
Personnel<br />
Salaries & Wages 846,497 1,123,827 1,007,270 1,105,332<br />
Fringe Benefits 186,173 248,347 220,835 260,758<br />
Total Personnel 1,032,670 1,372,174 1,228,105 1,366,090<br />
Non-Personnel<br />
Internal Service Charges 150,521 174,035 166,726 167,243<br />
Pr<strong>of</strong>essional & Contractual 5,102 14,843 13,198 13,107<br />
Utilities 23,027 24,350 23,973 27,422<br />
Insurance and Fixed Charges 14,020 14 11 12<br />
All Other Operations and Maintenance 116,461 267,729 267,108 103,093<br />
Capital Outlay 6,031 3,703 3,703 438<br />
Debt Service<br />
Total Non-Personnel 315,163 484,674 474,720 311,315<br />
Total Expenditures 1,347,832 1,856,848 1,702,825 1,677,405<br />
Net Transfers<br />
Revenue Sources<br />
Taxes<br />
Licenses & Permits<br />
Intergovernmental<br />
Charges for Services 455,092 457,600 516,508 525,938<br />
Interest Income<br />
All Other Revenue<br />
Total Revenue 455,092 457,600 516,508 525,938<br />
Funding to be Provided 892,740 1,399,248 1,186,317 1,151,467<br />
D-54 Fiscal Year <strong>2008</strong> Annual Budget
Code Enforcement<br />
MISSION<br />
To maintain safe, attractive neighborhoods and commercial/industrial districts by ensuring compliance<br />
with the <strong>City</strong>’s codes and ordinances.<br />
CORE SERVICES<br />
Assures physical conditions related to health, safety and general welfare are maintained throughout<br />
the <strong>City</strong>. Includes the enforcement <strong>of</strong> the housing code, codes prohibiting nuisances (overgrowth,<br />
trash, open storage and abandoned vehicles), and various zoning and land development regulations.<br />
Code Enforcement is responsible for the administration <strong>of</strong> sign and news rack regulations,<br />
administering contracts for regular maintenance <strong>of</strong> <strong>City</strong>-owned vacant infill properties and performs<br />
private property lot clearing and demolition activities through the special assessment process. Code<br />
Enforcement also manages the Community Clean-Up Fund by performing periodic neighborhood<br />
cleanups in conjunction with the Neighborhood Planning area <strong>of</strong> the Community Development<br />
Department and the Public Works Department including the <strong>Lakeland</strong> Clean and Beautiful volunteer<br />
group.<br />
TABLE OF ORGANIZATION<br />
See support staff and entire<br />
Community Development Table<br />
<strong>of</strong> Organization on page G-16.<br />
Legend<br />
Left number= 2007 FTE<br />
Right number= <strong>2008</strong> FTE<br />
D-55 Fiscal Year <strong>2008</strong> Annual Budget
Code Enforcement<br />
OPERATIONAL AND/OR PUBLIC SERVICE LEVELS<br />
Item Measured<br />
2004<br />
Actual<br />
2005<br />
Actual<br />
2006<br />
Actual<br />
2007<br />
Projected<br />
<strong>2008</strong><br />
Proposed<br />
Inspections 35,264 36,974 39,683 48,338 45,710<br />
Violations Worked (New and Carried<br />
Over)<br />
7,998 12,424 13,763 17,230 15,268<br />
Avg. Days from Complaint to Initial<br />
Inspection<br />
2.63 2.18 1.60 1.40 1.23<br />
Population Served per Full-Time<br />
Equivalent (FTE) Officer<br />
12,819 13,131 13,138 13,447 13,716<br />
PERFORMANCE MEASURES (KSI’S)<br />
GOAL: Growth Management<br />
OUTCOME: Safe, Attractive Neighborhoods<br />
KSI: Code Enforcement cases corrected (<strong>2008</strong> Goal: 72.1% <strong>of</strong> all cases)<br />
Objective: Percentage <strong>of</strong> Code Enforcement cases corrected<br />
NEW INITIATIVES<br />
Growth Management<br />
• In May 2007, the administrative functions related to the <strong>City</strong>’s Code Enforcement Board and Hearing<br />
Officer was transferred from the <strong>City</strong>’s Clerk’s Office to the Code Enforcement and Finance<br />
Customer Billing Divisions. This organizational change will result in improved customer service<br />
along with an increase in the number <strong>of</strong> fines collected.<br />
D-56 Fiscal Year <strong>2008</strong> Annual Budget
Code Enforcement<br />
2007-08<br />
Experience Budget Experience Proposed<br />
For Year For Year 2006-07 by<br />
EXPENSES 2005-06 2006-07 Estimated <strong>City</strong> Manager<br />
Personnel<br />
Salaries & Wages 581,307 752,205 692,653 752,312<br />
Fringe Benefits 153,434 190,824 181,139 200,521<br />
Total Personnel 734,741 943,029 873,792 952,832<br />
Non-Personnel<br />
Internal Service Charges 262,053 242,333 231,991 184,983<br />
Pr<strong>of</strong>essional & Contractual 25,799 38,923 39,681 29,410<br />
Utilities 45,136 55,410 35,504 28,959<br />
Insurance and Fixed Charges 27,584 36,771 36,830 37,533<br />
All Other Operations and Maintenance 255,850 435,595 434,050 109,404<br />
Capital Outlay 28,429 6,733 6,733 329<br />
Debt Service<br />
Total Non-Personnel 644,850 815,764 784,789 390,618<br />
Total Expenditures 1,379,591 1,758,793 1,658,581 1,343,450<br />
Net Transfers<br />
Revenue Sources<br />
Taxes<br />
Licenses & Permits<br />
Intergovernmental 214,440 415,291 389,727 208,307<br />
Charges for Services 220,753 254,200 293,979 266,910<br />
Interest Income 0 0 0 0<br />
All Other Revenue 306,208 210,000 275,000 210,000<br />
Total Revenue 741,401 879,491 958,706 685,217<br />
Funding to be Provided 638,190 879,302 699,874 658,233<br />
D-57 Fiscal Year <strong>2008</strong> Annual Budget
Building Inspection and Permitting Services<br />
MISSION<br />
To ensure that the health, safety, and welfare <strong>of</strong> the community is maintained within the construction or<br />
use <strong>of</strong> every public and private building by adhering to requirements established by law.<br />
CORE SERVICES<br />
Building Plans Review and Permitting<br />
Reviews permit applications and plans for adherence to applicable Federal, State and local building<br />
codes that are designed to protect the health, safety, and welfare <strong>of</strong> the public during and after the<br />
construction <strong>of</strong> residential and commercial structures. Design safety is evaluated by certified plans<br />
examiners to ensure adherence to minimum building design performance and structural standards.<br />
Administrative efforts are coordinated by qualified permit technicians and include contractor licensing,<br />
registration, and permit processing. Additionally, preliminary zoning and construction plan reviews are<br />
conducted to expedite the construction and variance application process.<br />
Building Inspection Services<br />
Monitors building construction activity to ensure conformance with applicable codes and compliance with<br />
approved construction plans. Administrative efforts include taking enforcement action against unlicensed<br />
contractors and un-permitted construction activity.<br />
TABLE OF ORGANIZATION<br />
See support staff and entire<br />
Community Development Table <strong>of</strong><br />
Organization on page G-16.<br />
Legend<br />
Left number= 2007 FTE<br />
Right number= <strong>2008</strong> FTE<br />
D-58 Fiscal Year <strong>2008</strong> Annual Budget
Building Inspection and Permitting Services<br />
OPERATIONAL AND/OR PUBLIC SERVICE LEVELS<br />
2004 2005 2006 2007 <strong>2008</strong><br />
Item Measured<br />
Actual Actual Actual Projected Proposed<br />
Total Permits (all types) 9,453 11,438 12,410 13,403 14,743<br />
Commercial building permits issued 1,243 1,722 1,668 1,801 1,981<br />
Residential building permits issued 3,584 4,631 2,479 2,677 2,945<br />
All other trade permits 4,626 5,085 8,263 8,924 9,816<br />
Building Inspections performed 24,430 28,752 30,592 33,039 36,344<br />
PERFORMANCE MEASURES (KSI’S)<br />
GOAL: Economic Opportunity<br />
OUTCOME: Sustainable Business Environment<br />
KSI: Square footing <strong>of</strong> industrial space/permitting (<strong>2008</strong> Goal: Retain 1,026,285 sq. feet)<br />
Objective: Internal and External benchmark.<br />
KSI: Square footing <strong>of</strong> <strong>of</strong>fice space/permitting (<strong>2008</strong> Goal: Retain 215,483 sq. feet)<br />
Objective: Internal and External benchmark.<br />
KSI: Square footing <strong>of</strong> retail space/permitting (<strong>2008</strong> Goal: Retain 457,159 sq. feet)<br />
Objective: Internal and External benchmark.<br />
D-59 Fiscal Year <strong>2008</strong> Annual Budget
Building Inspection and Permitting Services<br />
2007-08<br />
Experience Budget Experience Proposed<br />
For Year For Year 2006-07 by<br />
EXPENSES 2005-06 2006-07 Estimated <strong>City</strong> Manager<br />
Personnel<br />
Salaries & Wages 1,336,724 1,471,431 1,402,011 1,390,310<br />
Fringe Benefits 285,414 344,872 301,893 336,192<br />
Total Personnel 1,622,139 1,816,303 1,703,904 1,726,502<br />
Non-Personnel<br />
Internal Service Charges 312,540 244,067 251,635 263,979<br />
Pr<strong>of</strong>essional & Contractual 6,667 103,185 49,981 49,930<br />
Utilities 38,281 38,569 41,492 48,531<br />
Insurance and Fixed Charges 73,770 101,557 101,750 103,678<br />
All Other Operations and Maintenance 70,638 160,757 161,316 91,690<br />
Capital Outlay 40,901 716,392 531,242 71,170<br />
Debt Service<br />
Total Non-Personnel 542,797 1,364,527 1,137,415 628,977<br />
Total Expenditures 2,164,936 3,180,830 2,841,319 2,355,480<br />
Net Transfers<br />
Revenue Sources<br />
Taxes<br />
Licenses & Permits 2,923,255 3,487,163 2,497,668 2,497,668<br />
Intergovernmental<br />
Charges for Services 119,114 146,000 138,152 110,500<br />
Interest Income<br />
All Other Revenue (66)<br />
Total Revenue 3,042,303 3,633,163 2,635,820 2,608,168<br />
Funding to be Provided (877,367) (452,333) 205,499 (252,688)<br />
D-60 Fiscal Year <strong>2008</strong> Annual Budget
Local Business Taxes<br />
MISSION<br />
To collect revenue through a Local Business Tax in the form <strong>of</strong> a yearly receipt which certifies an<br />
individual or business to engage in commercial activities in conformance with applicable zoning, building and<br />
development codes.<br />
CORE SERVICES<br />
Processes business tax applications for individuals doing business within the <strong>City</strong> limits and assures<br />
conformance with all requirements and regulations to obtain a business tax receipt. Also monitors<br />
unlicensed businesses, solicitors, peddlers, and transient merchants and conducts on-site investigations to<br />
insure compliance with the <strong>City</strong> Code. Business taxes and delinquent fee revenues are collected as<br />
required. The rate structure for these revenues is regulated by State statute with allowances to increase<br />
rates every two years; however, the revenues have increased with the steady growth <strong>of</strong> the <strong>City</strong>.<br />
OPERATIONAL AND/OR PUBLIC SERVICE LEVELS<br />
Item Measured<br />
Business tax receipts<br />
issued to new and<br />
existing businesses<br />
within the <strong>City</strong><br />
Taxes and Fees<br />
Collected<br />
2004<br />
Actual<br />
2005<br />
Actual<br />
2006<br />
Actual<br />
2007<br />
Projected<br />
<strong>2008</strong><br />
Proposed<br />
6,751 6,342 6,849 7,200 7,600<br />
$1,176,617 $1,062,964 $1,485,796 $1,554,459 $1,679,790<br />
PERFORMANCE MEASURES (KSI’S)<br />
GOAL: Economic Opportunity<br />
OUTCOME: Sustainable Business Environment<br />
KSI: Businesses Renewing Business Taxes (<strong>2008</strong> Goal: 80%)<br />
Objective: Total percentage <strong>of</strong> businesses renewing business tax license from previous<br />
year<br />
NEW INITIATIVES<br />
Communication<br />
• Effective January 2007, the Florida Legislature required that all Occupational Licenses throughout the<br />
State be changed to Business Tax Receipts. This change is reflected in the title <strong>of</strong> this program activity<br />
to Local Business Taxes. The effect <strong>of</strong> this legislation was a change in name only. The rate structure<br />
and method <strong>of</strong> collection remains the same. FY <strong>2008</strong> Budget reflects a 5% increase in the local<br />
business tax rate.<br />
D-61 Fiscal Year <strong>2008</strong> Annual Budget
Local Business Taxes<br />
TABLE OF ORGANIZATION<br />
See support staff and entire<br />
Community Development Table <strong>of</strong><br />
Organization on page G-16.<br />
Legend<br />
Left number= 2007 FTE<br />
Right number= <strong>2008</strong> FTE<br />
D-62 Fiscal Year <strong>2008</strong> Annual Budget
Local Business Taxes<br />
2007-08<br />
Experience Budget Experience Proposed<br />
For Year For Year 2006-07 by<br />
EXPENSES 2005-06 2006-07 Estimated <strong>City</strong> Manager<br />
Personnel<br />
Salaries & Wages 116,792 126,807 123,855 114,411<br />
Fringe Benefits 23,956 29,183 25,878 27,050<br />
Total Personnel 140,748 155,990 149,733 141,461<br />
Non-Personnel<br />
Internal Service Charges 31,924 24,594 25,333 25,748<br />
Pr<strong>of</strong>essional & Contractual 538 11,089 5,181 5,190<br />
Utilities 3,382 3,522 3,878 3,831<br />
Insurance and Fixed Charges 51 51 51<br />
All Other Operations and Maintenance 4,380 12,945 13,009 6,663<br />
Capital Outlay 10 79,449 58,877 7<br />
Debt Service<br />
Total Non-Personnel 40,234 131,650 106,329 41,490<br />
Total Expenditures 180,982 287,639 256,062 182,951<br />
Net Transfers<br />
Revenue Sources<br />
Taxes<br />
Licenses & Permits 1,485,796 1,554,384 1,554,459 1,679,790<br />
Intergovernmental 48,966 56,000 56,000 56,000<br />
Charges for Services<br />
Interest Income<br />
All Other Revenue<br />
Total Revenue 1,534,762 1,610,384 1,610,459 1,735,790<br />
Funding to be Provided (1,353,780) (1,322,745) (1,354,397) (1,552,839)<br />
D-63 Fiscal Year <strong>2008</strong> Annual Budget
Affordable Housing Program<br />
MISSION<br />
To provide adequate, safe and affordable housing to very low and low to moderate income homeowners<br />
while supporting the <strong>City</strong>’s redevelopment efforts and promoting self-sufficiency.<br />
CORE SERVICES<br />
Administer the <strong>City</strong>’s federally funded Community Development Block Grant (CDBG), HOME Investment<br />
Partnership Program (HOME), State Housing Initiatives Partnership Program (SHIP), State HOME Again,<br />
and State Hurricane Housing Relief (HHR). Provides the <strong>City</strong>’s low to moderate income residents with<br />
housing rehabilitation, home purchase assistance, public facilities, code enforcement, sidewalk and street<br />
paving, and countless public service grants.<br />
Services are primarily provided through two programs:<br />
• The Owner-Occupied Housing Rehabilitation Program addresses health and safety issues, code<br />
violations, and handicap accessibility needs through rehabilitation. This includes reconstruction<br />
on the same lot and new construction on a different lot. Rehabilitation may be concentrated in<br />
target neighborhoods to help facilitate a larger redevelopment effort. Recipients execute a 5, 10,<br />
15 or 30-year deferred payment lien.<br />
• The Home Purchase Assistance Program provides assistance through a non-pr<strong>of</strong>it loan<br />
processor, Keystone Challenge Fund, Inc. Homeownership class attendance is required and<br />
recipients execute a 30-year deferred payment lien.<br />
TABLE OF ORGANIZATION<br />
See support staff and entire<br />
Community Development Table <strong>of</strong><br />
Organization on page G-16.<br />
Legend<br />
Left number= 2007 FTE<br />
Right number= <strong>2008</strong> FTE<br />
D-64 Fiscal Year <strong>2008</strong> Annual Budget
Affordable Housing Program<br />
OPERATIONAL AND/OR PUBLIC SERVICE LEVELS<br />
Item Measured<br />
(Funding)<br />
Major Rehabilitation<br />
(CDBG, HOME, SHIP, HHR)<br />
Reconstruction<br />
(CDBG, HOME, SHIP, HHR)<br />
New Construction<br />
(CDBG, HOME, SHIP, HHR)<br />
SHIP, HHR & Dixieland Repairs:<br />
Emergency<br />
Handicap Accessibility<br />
Hurricane Disaster Assistance<br />
(SHIP, HHR, HOME Again)<br />
Total <strong>of</strong> units rehabbed:<br />
Households Assisted<br />
Persons in Households<br />
HOME, SHIP, HHR Home Purchase<br />
Assistance:<br />
Households<br />
Persons in Households<br />
2004<br />
Actual<br />
2005<br />
Actual<br />
2006<br />
Actual<br />
2007<br />
Projected<br />
<strong>2008</strong><br />
Proposed<br />
17 10 6 10 10<br />
6 6 8 9 15<br />
1 1 0 4 2<br />
5<br />
5<br />
1<br />
2<br />
4<br />
5<br />
N/A 11 17 10 0<br />
34<br />
79<br />
51<br />
118<br />
31<br />
70<br />
44<br />
111<br />
40<br />
85<br />
51<br />
129<br />
3<br />
5<br />
41<br />
80<br />
55<br />
120<br />
3<br />
3<br />
33<br />
70<br />
50<br />
128<br />
NEW INITIATIVES<br />
Growth Management:<br />
My Safe Florida Home – Grants <strong>of</strong> up to $5,000 per household to upgrade doors, ro<strong>of</strong>s, and windows<br />
(including shutters) to provide hurricane protection, to be used in conjunction with rehabilitation.<br />
D-65 Fiscal Year <strong>2008</strong> Annual Budget
Affordable Housing Program<br />
2007-08<br />
Experience Budget Experience Proposed<br />
For Year For Year 2006-07 by<br />
EXPENSES 2005-06 2006-07 Estimated <strong>City</strong> Manager<br />
Personnel<br />
Salaries & Wages 260,937 352,702 271,282 410,435<br />
Fringe Benefits 88,855 108,687 83,376 117,582<br />
Total Personnel 349,792 461,390 354,659 528,017<br />
Non-Personnel<br />
Internal Service Charges 38,281 54,603 45,301 61,798<br />
Pr<strong>of</strong>essional & Contractual 4,545 6,443 7,304 6,569<br />
Utilities 2,409 3,420 3,003 3,831<br />
Insurance and Fixed Charges 34,559 31,104 27,800 26,420<br />
All Other Operations and Maintenance 2,447,211 3,449,380 3,590,139 1,416,976<br />
Capital Outlay 12,722 378 378 83<br />
Debt Service<br />
Total Non-Personnel 2,539,727 3,545,328 3,673,925 1,515,677<br />
Total Expenditures 2,889,518 4,006,718 4,028,584 2,043,694<br />
Net Transfers<br />
Revenue Sources<br />
Taxes<br />
Licenses & Permits<br />
Intergovernmental 2,555,914 3,659,638 3,657,274 1,423,242<br />
Charges for Services<br />
Interest Income 78,186 127,222<br />
All Other Revenue 413,977 95,000 311,924 153,000<br />
Total Revenue 3,048,077 3,754,638 4,096,420 1,576,242<br />
Funding to be Provided (158,559) 252,080 (67,836) 467,452<br />
D-66 Fiscal Year <strong>2008</strong> Annual Budget
Neighborhood Programs<br />
MISSION<br />
To plan for and support the revitalization <strong>of</strong> <strong>Lakeland</strong> neighborhoods which are recognized as the<br />
fundamental building blocks <strong>of</strong> a quality city.<br />
CORE SERVICES<br />
Includes the implementation <strong>of</strong> plans for specific neighborhoods or sectors; administration <strong>of</strong> the <strong>City</strong>’s<br />
historic preservation program in conjunction with the Historic Preservation Board including architectural<br />
design review and assistance to neighborhood associations including organization, communications,<br />
training, and resource referral. Work closely with the <strong>Lakeland</strong> Neighborhood Association Coalition, as<br />
well as both the Mid-town and Dixieland Community Redevelopment Agency (CRA) efforts. An annual<br />
Historic Home Workshop has been reinstated to provide support and education for residents in the<br />
historic districts and central-city neighborhoods.<br />
OPERATIONAL AND/OR PUBLIC SERVICE LEVELS<br />
Item Measured<br />
2004<br />
Actual<br />
2005<br />
Actual<br />
2006<br />
Actual<br />
2007<br />
Projected<br />
<strong>2008</strong><br />
Proposed<br />
Architectural plans reviewed<br />
within Historic districts<br />
139 190 225 225 225<br />
Association meetings 186 180 185 185 185<br />
Newsletters, flyers 112 124 130 130 130<br />
Grants assisted or administered 12 11 10 10 10<br />
Neighborhood cleanups 1 2 2 2 2<br />
Tons <strong>of</strong> debris removed 39 145 71 155 95<br />
PERFORMANCE MEASURES (KSI’S)<br />
GOAL: Growth Management<br />
OUTCOME: Safe, Attractive Neighborhoods<br />
KSI: Participants in Neighborhood Partnerships (<strong>2008</strong> Goal: 4,625)<br />
Objective: Number <strong>of</strong> participants in Neighborhood Partnerships<br />
D-67 Fiscal Year <strong>2008</strong> Annual Budget
Neighborhood Programs<br />
TABLE OF ORGANIZATION<br />
Portions <strong>of</strong> the Community Development Department support this activity and many others.<br />
See page G-16.<br />
2007-08<br />
Experience Budget Experience Proposed<br />
For Year For Year 2006-07 by<br />
EXPENSES 2005-06 2006-07 Estimated <strong>City</strong> Manager<br />
Personnel<br />
Salaries & Wages 159,089 166,578 139,498 157,867<br />
Fringe Benefits 36,530 35,432 31,976 36,724<br />
Total Personnel 195,620 202,010 171,474 194,591<br />
Non-Personnel<br />
Internal Service Charges 35,829 27,924 27,732 26,062<br />
Pr<strong>of</strong>essional & Contractual 704 2,569 1,845 2,137<br />
Utilities 5,175 3,848 3,728 4,112<br />
Insurance and Fixed Charges 7,017<br />
All Other Operations and Maintenance 139,745 225,504 225,601 163,594<br />
Capital Outlay 2,089 694 694 117<br />
Debt Service<br />
Total Non-Personnel 190,559 260,539 259,599 196,021<br />
Total Expenditures 386,178 462,549 431,073 390,612<br />
Net Transfers<br />
Revenue Sources<br />
Taxes<br />
Licenses & Permits<br />
Intergovernmental<br />
Charges for Services<br />
Interest Income<br />
All Other Revenue 32,350<br />
Total Revenue 32,350<br />
Funding to be Provided 353,828 462,549 431,073 390,612<br />
D-68 Fiscal Year <strong>2008</strong> Annual Budget
Economic Development<br />
MISSION<br />
To create self-sustaining environments in an effort to grow, attract and retain a creative, talented,<br />
educated and technically qualified workforce.<br />
CORE SERVICES<br />
Marketing <strong>of</strong> the <strong>City</strong> and facilities to both existing and prospective parties for quality economic growth<br />
in the areas <strong>of</strong> industrial, commercial, <strong>of</strong>fice and housing developments. In an effort to promote quality<br />
growth, the <strong>City</strong> supports the <strong>Lakeland</strong> Economic Development Council (LEDC), the <strong>Lakeland</strong> Area<br />
Chamber <strong>of</strong> Commerce and the Tampa Bay Partnership. The <strong>City</strong> is also a supporting member <strong>of</strong> the<br />
LEDC’s “High Skills Initiative” which was established in 2002 for the express purpose <strong>of</strong> bringing and<br />
retaining high-skill jobs in the <strong>Lakeland</strong> area and to increase the average household income in the<br />
<strong>Lakeland</strong> urban area. As part <strong>of</strong> the High Skills Initiative, the <strong>City</strong> <strong>of</strong> <strong>Lakeland</strong> also supports the State<br />
<strong>of</strong> Florida’s Qualified Target Industry (QTI) program that provides a tax refund for high-skilled jobs<br />
created by new or existing Florida businesses.<br />
<strong>City</strong> staff supports this activity through the preliminary meetings and planning efforts associated with<br />
development proposals and inquiries. The <strong>City</strong> works collaboratively with personnel from the LEDC<br />
and the Chamber <strong>of</strong> Commerce on projects that involve a multi-discipline approach in order to provide<br />
a full array <strong>of</strong> services to interested investors in the community. Other efforts include targeted<br />
communication activities with numerous existing large industrial customers regarding municipal<br />
services and programs, and assistance with retention and expansion projects.<br />
TABLE OF ORGANIZATION<br />
Legend<br />
Left number= 2007 FTE<br />
Right number= <strong>2008</strong> FTE<br />
Portions <strong>of</strong> the Community Development Department and the <strong>City</strong> Manager’s Office support this<br />
activity. See entire Community Development Table <strong>of</strong> Organization on page G-16 and the <strong>City</strong><br />
Managers Table <strong>of</strong> Organization on page G-13.<br />
D-69 Fiscal Year <strong>2008</strong> Annual Budget
Economic Development<br />
OPERATIONAL AND/OR PUBLIC SERVICE LEVELS<br />
Item Measured<br />
2004<br />
Actual<br />
2005<br />
Actual<br />
2006<br />
Actual<br />
2007<br />
Projected<br />
<strong>2008</strong><br />
Proposed<br />
LEDC $5,000 $10,000 $10,000 $10,000 $10,000<br />
LEDC High Skills Initiative $10,000 $10,000 $10,000 $10,000 $10,000<br />
<strong>Lakeland</strong> Area Chamber <strong>of</strong><br />
Commerce<br />
$94,300 $94,300 $106,543 $106,543 $106,543<br />
Tampa Bay Partnership $25,000 $50,000 $25,000 $25,000 $25,000<br />
Florida Qualified Target Industry<br />
Tax Refund Program<br />
N/A N/A $16,000 $16,000 $16,000<br />
In-Kind Contribution:<br />
• <strong>Lakeland</strong> Vision<br />
• <strong>Lakeland</strong> Downtown<br />
Development Authority<br />
• Shared space<br />
• Chamber <strong>of</strong> Commerce<br />
$1,920<br />
$6,285<br />
$4,000<br />
$86,928<br />
$1,920<br />
$6,285<br />
$4,000<br />
$89,928<br />
$1,920<br />
$6,285<br />
$4,000<br />
$89,928<br />
$2,241<br />
$7,333<br />
$4,666<br />
$101,416<br />
$2,242<br />
$7,333<br />
$4,666<br />
$101,416<br />
*The 2007 In-Kind Contributions include a $2 increase per square foot. Office space contribution<br />
now equals $14/sq.ft. The Chamber Building also receives an additional special project for 2007 that<br />
equates to $130,000 and the Chamber receives an additional $27,000 in-kind contribution per year<br />
PERFORMANCE MEASURES (KSI’S)<br />
GOAL: Economic Opportunity<br />
OUTCOME: Enriched Community Workforce<br />
KSI: Private & Public Average Annual Wage (<strong>2008</strong> Goal: $33,914)<br />
Objective: Private and public average annual wage<br />
KSI: Educational levels <strong>of</strong> the community (<strong>2008</strong> Goal: 85%)<br />
Objective: Educational Levels <strong>of</strong> the Community<br />
OUTCOME: Sustainable Business Environment<br />
KSI: Cost <strong>of</strong> living index (<strong>2008</strong> Goal: 98)<br />
Objective: <strong>Lakeland</strong> index number as compared to state index = 100<br />
KSI: New FT jobs created (<strong>2008</strong> Goal: 600)<br />
Objective: Total number <strong>of</strong> new full time jobs created in the defined fiscal year<br />
GOAL: Growth Management<br />
OUTCOME: Quality Developments<br />
KSI: Median Home Price (<strong>2008</strong> Goal: $196,000)<br />
Objective: Median Home Price in <strong>Lakeland</strong><br />
D-70 Fiscal Year <strong>2008</strong> Annual Budget
Economic Development<br />
2007-08<br />
Experience Budget Experience Proposed<br />
For Year For Year 2006-07 by<br />
EXPENSES 2005-06 2006-07 Estimated <strong>City</strong> Manager<br />
Personnel<br />
Salaries & Wages 56,309 101,588 80,389 84,946<br />
Fringe Benefits 12,464 21,445 18,071 19,634<br />
Total Personnel 68,772 123,033 98,460 104,580<br />
Non-Personnel<br />
Internal Service Charges 11,827 16,380 14,755 13,570<br />
Pr<strong>of</strong>essional & Contractual 157 8,417 7,951 7,940<br />
Utilities 1,906 2,529 2,304 2,375<br />
Insurance and Fixed Charges 907 1,419 951 1,403<br />
All Other Operations and Maintenance 1,128,000 1,879,789 1,877,372 2,189,537<br />
Capital Outlay 19,717 290,345 290,306 35,011<br />
Debt Service 100,000 100,000 100,000 100,000<br />
Total Non-Personnel 1,262,516 2,298,878 2,293,638 2,349,837<br />
Total Expenditures 1,331,288 2,421,911 2,392,098 2,454,416<br />
Net Transfers<br />
Revenue Sources<br />
Taxes<br />
Licenses & Permits<br />
Intergovernmental<br />
Charges for Services 94,300 95,000 94,300 95,000<br />
Interest Income<br />
All Other Revenue 172,132 150,599 109,380 68,359<br />
Total Revenue 266,432 245,599 203,680 163,359<br />
Funding to be Provided 1,064,856 2,176,312 2,188,418 2,291,057<br />
D-71 Fiscal Year <strong>2008</strong> Annual Budget
Downtown Community Redevelopment Area<br />
MISSION<br />
To improve the economic vitality and enhance the visual image <strong>of</strong> Downtown <strong>Lakeland</strong> by creating and<br />
implementing a redevelopment plan, promoting economic growth and encouraging the preservation <strong>of</strong><br />
the area’s historic character.<br />
CORE SERVICES<br />
Florida Statutes (Chapter 163, Part III) authorize local governments to designate specified Community<br />
Redevelopment Areas where certain slum and blighted conditions exist. The Downtown Community<br />
Redevelopment Area (CRA) is generally bounded by the north side <strong>of</strong> Lake Morton, Walnut Street, The<br />
Ledger property and The <strong>Lakeland</strong> Center on the south, Lake Beulah and Phase II <strong>of</strong> the In-Town<br />
Bypass (Bartow Road) to the west and north, and Bartow Road to Lime Street on the east.<br />
The <strong>Lakeland</strong> Downtown Development Authority Board (LDDA) is a group <strong>of</strong> seven elected Directors<br />
from within the downtown district, who have been granted the responsibility for making all downtown<br />
CRA budget, policy, and project recommendations to the <strong>City</strong> Commission/CRA Board. The LDDA’s<br />
mission is to improve and stimulate the environment for economic development in a people-oriented<br />
downtown community. The <strong>City</strong> Commission, acting as the Community Redevelopment Agency, is ultimately<br />
responsible for approving all actions.<br />
OPERATIONAL AND/OR PUBLIC SERVICE LEVELS<br />
2004 2005 2006 2007 <strong>2008</strong><br />
Item Measured<br />
Actual Actual Actual Projected Proposed<br />
Revitalized Streetscape blocks 3 6 4 4 5<br />
New container gardens 79 80 0 0 0<br />
Informational/promotional<br />
mailing<br />
3 3 3 3 3<br />
Tax Increment Financing<br />
Projects (TIF)<br />
12 12 12 14 15<br />
Maintenance <strong>of</strong> container<br />
gardens<br />
237 316 396 396 396<br />
Total Building Permit Value 4,787,261 6,468,899 5,561,307 6,500,000 8,000,000<br />
Downtown Permit Value as a<br />
Percent <strong>of</strong> All <strong>City</strong> Permits<br />
2.60% 2.66% 1.03% 2.67% 2.16%<br />
Percent Increase (Decrease) in<br />
Total Taxable Property Value<br />
7.86% 1.25% 30.44% 26.52% 27%<br />
D-72 Fiscal Year <strong>2008</strong> Annual Budget
Downtown Community Redevelopment Area<br />
TABLE OF ORGANIZATION<br />
Additionally the Community Development Department<br />
assists in this Activity as referenced in the Table <strong>of</strong><br />
Organization on page G-16.<br />
Legend<br />
Left number= 2007 FTE<br />
Right number= <strong>2008</strong> FTE<br />
2007-08<br />
Experience Budget Experience Proposed<br />
For Year For Year 2006-07 by<br />
EXPENSES 2005-06 2006-07 Estimated <strong>City</strong> Manager<br />
Personnel<br />
Salaries & Wages 73,822 103,881 94,929 117,545<br />
Fringe Benefits 16,456 22,778 21,751 28,747<br />
Total Personnel 90,278 126,659 116,681 146,292<br />
Non-Personnel<br />
Internal Service Charges 15,296 17,266 16,954 21,981<br />
Pr<strong>of</strong>essional & Contractual 3,660 105,906 106,797 63,695<br />
Utilities 2,660 2,833 2,616 4,231<br />
Insurance and Fixed Charges 1 3 3<br />
All Other Operations and Maintenance 366,665 372,460 371,797 419,980<br />
Capital Outlay 1,508,487 1,812,810 1,812,810 250,330<br />
Debt Service 652,358 586,925 586,925 736,532<br />
Total Non-Personnel 2,549,126 2,898,204 2,897,901 1,496,748<br />
Total Expenditures 2,639,405 3,024,863 3,014,582 1,643,040<br />
Revenue Sources<br />
Taxes<br />
Licenses & Permits<br />
Intergovernmental 1,170,419 1,227,000 1,696,760 1,500,000<br />
Charges for Services<br />
Interest Income 55,284 41,014 79,722 32,352<br />
All Other Revenue 757,550 500,014 500,014 500,000<br />
Total Revenue 1,983,253 1,768,028 2,276,496 2,032,352<br />
Funding to be Provided 656,152 1,256,835 738,086 (389,312)<br />
D-73 Fiscal Year <strong>2008</strong> Annual Budget
Mid-Town Community Redevelopment Area<br />
MISSION<br />
To improve the economic vitality and enhance the visual image <strong>of</strong> the entire Mid-Town district by creating<br />
and implementing a redevelopment plan, promoting economic growth and acting as a catalyst for change<br />
in some <strong>of</strong> <strong>Lakeland</strong>’s most distressed neighborhoods.<br />
CORE SERVICES<br />
The Florida Statutes (Chapter 163, Part III) authorize local governments to designate specified<br />
Community Redevelopment Areas where certain slum and blighted conditions exist. The Mid-Town<br />
Community Redevelopment Area (CRA) is north <strong>of</strong> Downtown, bounded by Main Street, the In-Town<br />
Bypass (Bartow Road), and George Jenkins Boulevard on the south, Brunnell Parkway and CSX<br />
Railroad to the west, I-4 to the north, and Lake Parker on the east. The Mid-Town CRA Advisory Board is<br />
a group <strong>of</strong> property and businesses owners within the District who are appointed by the <strong>City</strong> Commission.<br />
The Advisory Board is responsible for making all budget, policy and project recommendations to the <strong>City</strong><br />
Commission. The <strong>City</strong> Commission, acting as the Community Redevelopment Agency, is ultimately<br />
responsible for approving all actions.<br />
The guiding principles <strong>of</strong> the Mid-Town CRA Advisory Board are:<br />
1. A concern with facilitating private market real estate development forces in a manner consistent<br />
with the redevelopment plan.<br />
2. Public and private improvements that boost the “image” <strong>of</strong> the district.<br />
3. Encouraging networking and partnership opportunities; however, the Board will not fund social<br />
service programs.<br />
OPERATIONAL AND/OR PUBLIC SERVICE LEVELS<br />
Item Measured<br />
2005<br />
Actual<br />
2006<br />
Actual<br />
2007<br />
Projected<br />
<strong>2008</strong><br />
Proposed<br />
Percent Increase (Decrease) in<br />
Total Taxable Property Value<br />
8.26% 12.41% 22.64% 8.00%<br />
Building Permit Values $19,655,576 $58,105,921 $20,000,000 $20,000,000<br />
Mid Town Permit Value as a<br />
Percent <strong>of</strong> All <strong>City</strong> Permits<br />
8.07% 10.73% 9.00% 9.00%<br />
New Single-Family Units 37 40 25 25<br />
New Multi-Family Units N/A 356 100 50<br />
D-74 Fiscal Year <strong>2008</strong> Annual Budget
Mid-Town Community Redevelopment Area<br />
TABLE OF ORGANIZATION<br />
See support staff and entire<br />
Community Development Table <strong>of</strong><br />
Organization on page G-16.<br />
These positions support all 3 CRA’s.<br />
Legend<br />
Left number= 2007 FTE<br />
Right number= <strong>2008</strong> FTE<br />
2007-08<br />
Experience Budget Experience Proposed<br />
For Year For Year 2006-07 by<br />
EXPENSES 2005-06 2006-07 Estimated <strong>City</strong> Manager<br />
Personnel<br />
Salaries & Wages 95,920 114,615 97,807 125,326<br />
Fringe Benefits 21,827 24,721 22,651 29,501<br />
Total Personnel 117,747 139,336 120,458 154,827<br />
Non-Personnel<br />
Internal Service Charges 21,936 20,447 20,269 21,687<br />
Pr<strong>of</strong>essional & Contractual 6,676 106,386 106,087 135,656<br />
Utilities 3,351 2,991 2,739 3,351<br />
Insurance and Fixed Charges 2<br />
All Other Operations and Maintenance 619,744 955,630 955,562 1,477,134<br />
Capital Outlay 68,433 2,122,416 2,122,416 1,500,108<br />
Debt Service 310,506 1,923,462 1,923,462<br />
Total Non-Personnel 1,030,647 5,131,332 5,130,536 3,137,935<br />
Total Expenditures 1,148,393 5,270,667 5,250,994 3,292,762<br />
Revenue Sources<br />
Taxes<br />
Licenses & Permits<br />
Intergovernmental 1,792,033 1,864,000 2,966,803 2,700,000<br />
Charges for Services 114,603<br />
Interest Income 56,129 22,000 155,100 20,000<br />
All Other Revenue<br />
Total Revenue 1,962,765 1,886,000 3,121,903 2,720,000<br />
Funding to be Provided (814,372) 3,384,667 2,129,091 572,762<br />
D-75 Fiscal Year <strong>2008</strong> Annual Budget
Dixieland Community Redevelopment Area<br />
MISSION<br />
To improve the economic vitality and enhance the visual image <strong>of</strong> the Dixieland commercial corridor and<br />
surrounding neighborhoods by creating and implementing a redevelopment plan, promoting economic<br />
growth and encouraging preservation <strong>of</strong> the area’s historic character.<br />
CORE SERVICES<br />
Florida Statutes (Chapter 163, Part III) authorizes local governments to designate specified Community<br />
Redevelopment Areas where certain slum and blighted conditions exist. The Dixieland Community<br />
Redevelopment Area (CRA) is generally along S. Florida Avenue from Walnut Street and extending<br />
south to Lenox Street.<br />
The Dixieland CRA Advisory Board is a group <strong>of</strong> property and business owners from within the district<br />
who are appointed by the <strong>City</strong> Commission. The Advisory Board is responsible for making all budget,<br />
policy and project recommendations to the <strong>City</strong> Commission. The <strong>City</strong> Commission, acting as the<br />
Community Redevelopment Agency, is ultimately responsible for approving all actions.<br />
The guiding principles <strong>of</strong> the Dixieland CRA Advisory Board are:<br />
1. Encourage private improvements that enhance the image <strong>of</strong> the district;<br />
2. Commit to establishing long-term partnerships with the Florida Department <strong>of</strong> Transportation<br />
(FDOT) to beautify and improve all public infrastructure;<br />
3. Provide regular communication with business/property owners and adjacent residents to develop<br />
a common sense <strong>of</strong> purpose;<br />
4. Seek to balance the preservation <strong>of</strong> historic resources with the desire for redevelopment in a way<br />
that benefits the entire district.<br />
OPERATIONAL AND/OR PUBLIC SERVICE LEVELS<br />
Item Measured<br />
2005<br />
Actual<br />
2006<br />
Actual<br />
2007<br />
Projected<br />
<strong>2008</strong><br />
Proposed<br />
Percent Increase (Decrease) in<br />
Dixieland CRA Taxable Property 8.16% 11.87% 41.58% 8.00%<br />
Value<br />
Dixieland CRA Building Permit<br />
Value<br />
$585,000 $929,762 $500,000 $500,000<br />
Dixieland CRA Permit Value as a<br />
Percent <strong>of</strong> All <strong>City</strong> Permits<br />
0.24% 0.17% 0.15% 0.15%<br />
Awarded Design Assistance Grants 7 3 4 6<br />
Awarded Facade Improvement<br />
Matching Grants<br />
2 1 3 3<br />
D-76 Fiscal Year <strong>2008</strong> Annual Budget
Dixieland Community Redevelopment Area<br />
TABLE OF ORGANIZATION<br />
See support staff and entire<br />
Community Development Table <strong>of</strong><br />
Organization on page G-16.<br />
These positions support all 3 CRA’s.<br />
Legend<br />
Left number= 2007 FTE<br />
Right number= <strong>2008</strong> FTE<br />
2007-08<br />
Experience Budget Experience Proposed<br />
For Year For Year 2006-07 by<br />
EXPENSES 2005-06 2006-07 Estimated <strong>City</strong> Manager<br />
Personnel<br />
Salaries & Wages 25,327 52,452 44,325 61,651<br />
Fringe Benefits 5,710 11,139 10,128 14,427<br />
Total Personnel 31,037 63,591 54,453 76,078<br />
Non-Personnel<br />
Internal Service Charges 5,511 8,744 8,687 10,317<br />
Pr<strong>of</strong>essional & Contractual 6,278 22,012 21,793 30,852<br />
Utilities 833 1,231 1,201 1,603<br />
Insurance and Fixed Charges 1<br />
All Other Operations and Maintenance 30,313 207,671 207,687 413,566<br />
Capital Outlay 3,669 360,205 360,205 78<br />
Debt Service<br />
Total Non-Personnel 46,605 599,862 599,573 456,415<br />
Total Expenditures 77,642 663,453 654,026 532,493<br />
Revenue Sources<br />
Taxes<br />
Licenses & Permits<br />
Intergovernmental 127,760 134,000 283,452 250,000<br />
Charges for Services<br />
Interest Income 5,359 4,000 17,874 5,000<br />
All Other Revenue 300,000 300,000<br />
Total Revenue 133,119 438,000 601,326 255,000<br />
Funding to be Provided (55,477) 225,453 52,700 277,493<br />
D-77 Fiscal Year <strong>2008</strong> Annual Budget
THIS PAGE IS INTENTIONALLY BLANK
CITY OF LAKELAND<br />
<strong>2008</strong><br />
Community Safety<br />
Program<br />
Activity<br />
Page<br />
Firefighting Services D-82<br />
Rescue Services D-84<br />
Patrol Services D-86<br />
Investigative Services D-89<br />
Aviation Unit D-92<br />
Community Police Programs D-94<br />
Juvenile Police Programs D-96<br />
Dispatching Services D-99<br />
Street and Traffic Lighting D-102<br />
D-79 Fiscal Year <strong>2008</strong> Annual Budget
Community Safety<br />
Street and Traffic<br />
Lighting<br />
7%<br />
Juvenile Police<br />
Programs<br />
5%<br />
Dispatching Services<br />
8%<br />
Firefighting Services<br />
4%<br />
Community Police<br />
Programs<br />
2%<br />
Rescue Services<br />
21%<br />
Aviation Unit<br />
Community Safety<br />
Experience Budget Experience FY 2007-08<br />
For Year For Year 2006-07 Proposed By<br />
EXPENSES 2005-06 2006-07 Estimated <strong>City</strong> Manager<br />
Personnel<br />
Salaries and Wages 26,293,201 29,314,048 28,279,734 30,749,795<br />
Fringe Benefits 5,729,295 6,552,472 5,990,399 7,336,229<br />
Total Personnel 32,022,496 35,866,520 34,270,133 38,086,024<br />
Non-Personnel<br />
Internal Service Charges 4,771,113 5,342,220 5,445,903 5,730,824<br />
Pr<strong>of</strong>essional and Contractual 117,253 117,442 114,283 101,223<br />
Utilities 4,541,684 4,658,271 4,619,796 4,846,831<br />
Insurance and Fixed Charges 1,476,819 1,036,927 1,021,803 1,069,028<br />
All Other Operations and Maintenance 1,946,073 2,173,282 2,126,228 1,930,816<br />
Capital Outlay 1,711,399 2,218,571 1,803,727 1,938,620<br />
Debt Service 1,857,343 1,847,060 1,877,553 918,758<br />
Total Non-Personnel 16,421,684 17,393,772 17,009,293 16,536,100<br />
Total Expenditures 48,444,179 53,260,293 51,279,425 54,622,124<br />
Net Transfers<br />
Revenue Sources<br />
Taxes<br />
Licenses and Permits<br />
Intergovernmental 1,020,436 901,766 786,695 642,175<br />
Charges for Services 1,047,720 934,031 1,065,352 479,789<br />
Interest Income 18,103 20,681 34,981 28,927<br />
All Other Revenue 2,549,404 1,502,136 1,386,075 1,718,708<br />
Total Revenue 4,635,663 3,358,614 3,273,103 2,869,599<br />
Funding to be Provided 43,808,517 49,901,679 48,006,323 51,752,525<br />
D-81 Fiscal Year <strong>2008</strong> Annual Budget
Firefighting Services<br />
MISSION<br />
To prevent and extinguish fires within the <strong>City</strong> and the greater <strong>Lakeland</strong> area by administering<br />
inspections and safety programs while providing the highest service standards <strong>of</strong> safety, suppression<br />
and disaster response.<br />
CORE SERVICES<br />
Perform the management and administration <strong>of</strong> the <strong>Lakeland</strong> Fire Department (LFD) budget, policies<br />
and procedures providing department-wide leadership and direction. Respond to calls for service<br />
through the Emergency-911 Central Dispatch System as well as calls in the greater <strong>Lakeland</strong> area<br />
through a county-wide contractual agreement. Technical Rescue services are provided by trained LFD<br />
personnel on a county-wide basis through a reciprocal agreement with the Polk County Fire Department<br />
who in turn provides county-wide hazardous material response. Firefighting Services is uniquely joined<br />
with Rescue Services (pg. D-82) as the same personnel are required to perform both services.<br />
OPERATIONAL AND/OR PUBLIC SERVICE LEVELS<br />
2004 2005 2006 2007 <strong>2008</strong><br />
Item Measured<br />
Actual Actual Actual Projected Proposed<br />
Fire Runs 2,394 2,195 2,484 2,550 2,600<br />
Fire Inspections 3,166 3,155 2,308 3,100 3,150<br />
Fire Inspection Violations 235 300 80 125 100<br />
Fire Complaints<br />
(Unauthorized burning,<br />
36 51 48 50 30<br />
Blocked exits and Etc.)<br />
Fire Investigations 397 400 401 400 400<br />
Public Education Programs 758 935 1,003 975 1,000<br />
NEW INITIATIVES<br />
Quality <strong>of</strong> Life<br />
• A new Municipal/Airport Fire Station #7 was scheduled for construction in <strong>2008</strong>, however due to<br />
budget constraints the construction will be delayed until 2015 - 2016.<br />
D-82 Fiscal Year <strong>2008</strong> Annual Budget
Firefighting Services<br />
TABLE OF ORGANIZATION<br />
The entire Fire Department supports this activity. See Fire Department Table <strong>of</strong> Organization on<br />
page G-50.<br />
2007-08<br />
Experience Budget Experience Proposed<br />
For Year For Year 2006-07 by<br />
EXPENSES 2005-06 2006-07 Estimated <strong>City</strong> Manager<br />
Personnel<br />
Salaries & Wages 865,097 1,035,227 1,013,123 1,157,685<br />
Fringe Benefits 197,347 246,514 228,319 290,059<br />
Total Personnel 1,062,444 1,281,741 1,241,442 1,447,744<br />
Non-Personnel<br />
Internal Service Charges 38,449 54,916 57,653 59,323<br />
Pr<strong>of</strong>essional & Contractual 3,705 4,750 5,031 3,055<br />
Utilities 374,489 462,863 461,821 466,967<br />
Insurance and Fixed Charges 65,317 24,581 23,861 25,781<br />
All Other Operations and Maintenance 57,672 70,515 71,577 71,901<br />
Capital Outlay 122,018 118,694 115,034 76,438<br />
Debt Service 57,736 50,719 54,378 57,600<br />
Total Non-Personnel 719,385 787,039 789,356 761,065<br />
Total Expenditures 1,781,830 2,068,780 2,030,798 2,208,809<br />
Net Transfers<br />
Revenue Sources<br />
Taxes<br />
Licenses & Permits<br />
Intergovernmental 3,001 3,000 3,000 3,000<br />
Charges for Services 50,380 47,185 44,151 35,821<br />
Interest Income 498 576 569<br />
All Other Revenue 140,400 50,646 54,585 27,708<br />
Total Revenue 194,279 101,407 102,306 66,529<br />
Funding to be Provided 1,587,551 1,967,372 1,928,492 2,142,280<br />
D-83 Fiscal Year <strong>2008</strong> Annual Budget
Rescue Services<br />
MISSION<br />
To provide the most efficient and highest level emergency medical and rescue services to the citizens<br />
<strong>of</strong> <strong>Lakeland</strong>.<br />
CORE SERVICES<br />
Fire based Emergency Medical Services, provides dual response with Polk County for both basic and<br />
advanced life-support within the <strong>Lakeland</strong> <strong>City</strong> limits. Rescue Services is uniquely joined with<br />
Firefighting Services (pg. D-80) as the same personnel are required to perform both services.<br />
OPERATIONAL AND/OR PUBLIC SERVICE LEVELS<br />
Item Measured<br />
2004<br />
Actual<br />
2005<br />
Actual<br />
2006<br />
Actual<br />
2007<br />
Projected<br />
<strong>2008</strong><br />
Proposed<br />
Medical Runs 14,920 16,150 16,642 18,000 18,250<br />
Paramedics Graduated N/A 8 6 6 6<br />
Existing Personnel Trained<br />
as Paramedics<br />
Total Number <strong>of</strong> Advanced<br />
Life Support Fire Stations*<br />
9 12 21 27 33<br />
0 2 2 3 4<br />
*Station 4 will become ALS certified in November, 2007. Each year thereafter one additional Station will become<br />
ALS certified.<br />
TABLE OF ORGANIZATION<br />
The entire Fire Department supports this activity. See Fire Department Table <strong>of</strong> Organization on<br />
page G-50.<br />
D-84 Fiscal Year <strong>2008</strong> Annual Budget
Rescue Services<br />
2007-08<br />
Experience Budget Experience Proposed<br />
For Year For Year 2006-07 by<br />
EXPENSES 2005-06 2006-07 Estimated <strong>City</strong> Manager<br />
Personnel<br />
Salaries & Wages 6,237,763 7,081,997 6,925,596 7,526,977<br />
Fringe Benefits 1,423,609 1,683,823 1,555,995 1,893,240<br />
Total Personnel 7,661,371 8,765,821 8,481,591 9,420,216<br />
Non-Personnel<br />
Internal Service Charges 267,549 296,889 316,732 370,650<br />
Pr<strong>of</strong>essional & Contractual 21,481 11,805 11,555 11,298<br />
Utilities 167,531 169,832 162,300 172,480<br />
Insurance and Fixed Charges 479,697 180,641 175,561 189,395<br />
All Other Operations and Maintenance 410,957 476,130 486,477 454,957<br />
Capital Outlay 894,626 868,727 841,894 557,621<br />
Debt Service 365,095 371,941 398,775 422,401<br />
Total Non-Personnel 2,606,934 2,375,966 2,393,293 2,178,803<br />
Total Expenditures 10,268,306 11,141,786 10,874,883 11,599,020<br />
Net Transfers<br />
Revenue Sources<br />
Taxes<br />
Licenses & Permits<br />
Intergovernmental 23,577 22,000 22,000 22,000<br />
Charges for Services 270,774 230,158 230,158 230,158<br />
Interest Income 3,652 4,226 4,176<br />
All Other Revenue 1,029,600 370,040 370,040 176,000<br />
Total Revenue 1,327,603 626,424 626,374 428,158<br />
Funding to be Provided 8,940,703 10,515,362 10,248,509 11,170,862<br />
D-85 Fiscal Year <strong>2008</strong> Annual Budget
Patrol Services<br />
MISSION<br />
To provide pr<strong>of</strong>essional, high-quality, effective patrol services while reducing crime, ensuring public<br />
safety and providing responsive customer service.<br />
CORE SERVICES<br />
Focus on community policing which includes responding to emergency and non-emergency calls for<br />
service, the development and maintenance <strong>of</strong> collaborative community partnerships and pro-active<br />
neighborhood problem-solving. The Patrol Services’ Targeted Areas <strong>of</strong> Concentration (TAC)<br />
Crime-Control Program provides continuous crime reports and trends analysis that allows Commanders<br />
to target problematic areas with strategies and resources. There is also a focus on gun control crime<br />
analysis reports and pro-active patrols by the Neighborhood Enforcement Team (NET) in an effort to<br />
remove guns from high crime areas.<br />
OPERATIONAL AND/OR PUBLIC SERVICE LEVELS<br />
Item Measured<br />
2004<br />
Actual<br />
2005<br />
Actual<br />
2006<br />
Actual<br />
2007<br />
Projected<br />
<strong>2008</strong><br />
Proposed<br />
Calls for Service 108,070 102,301 103,360 106,640 110,000<br />
Total Uniform Crime<br />
Rate (UCR) Part I 5,758 5,482 5,751 5,751 5,751<br />
crimes<br />
Driving Under the<br />
Influence (DUI)<br />
564 556 693 700 700<br />
Arrests<br />
Traffic Citations 20,844 21,248 21,993 23,000 24,000<br />
PERFORMANCE MEASURES (KSI’S)<br />
GOAL: Growth Management<br />
OUTCOME: Safe, Attractive Neighborhoods<br />
KSI: <strong>City</strong> Crime Rate (<strong>2008</strong> Goal: Reduce <strong>City</strong> crime rate below prior year.)<br />
Objective: Measure <strong>of</strong> Part 1 crimes per 1,000 population<br />
NEW INITIATIVES<br />
Economic Opportunity<br />
• A three year implementation plan has been proposed to increase staffing levels by an additional 20-<br />
22 <strong>of</strong>ficers based upon a Manpower Allocation and Workload Study. The plan involves<br />
civilianization coupled with new hires.<br />
D-86 Fiscal Year <strong>2008</strong> Annual Budget
Patrol Services<br />
TABLE OF ORGANIZATION<br />
Legend<br />
Left number= 2007 FTE<br />
Right number= <strong>2008</strong> FTE<br />
Assistant Chief <strong>of</strong> Police<br />
1 / 1<br />
Police<br />
Uniform Patrol Division II<br />
FY ’08<br />
89 Budgeted FTE’s<br />
Captain<br />
1 / 1<br />
Office Associate I<br />
1 / 1<br />
Alpha Squad<br />
Lieutenant<br />
1 / 1<br />
Bravo Squad<br />
Lieutenant<br />
1 / 1<br />
NLO Squad<br />
Lieutenant<br />
1 / 1<br />
Sergeant<br />
4 / 4<br />
Sergeant<br />
4 / 4<br />
Community<br />
Services<br />
Sergeant<br />
Sergeant<br />
1 / 1<br />
3 / 3<br />
Officer<br />
14 / 14<br />
K-9 Officer<br />
1 / 1<br />
Public Safety Aides<br />
6 / 6<br />
Officer<br />
25 / 25<br />
K-9 Officer<br />
2 / 2<br />
Dart Unit<br />
Victims Assistance<br />
Coordinator<br />
Crime Prevention<br />
Practioner<br />
Officer<br />
15 / 15<br />
1 / 1<br />
6 / 6<br />
Victims Assistance<br />
Advocate<br />
1 / 1<br />
D-87 Fiscal Year <strong>2008</strong> Annual Budget
Patrol Services<br />
2007-08<br />
Experience Budget Experience Proposed<br />
For Year For Year 2006-07 by<br />
EXPENSES 2005-06 2006-07 Estimated <strong>City</strong> Manager<br />
Personnel<br />
Salaries & Wages 12,065,863 12,414,449 11,887,904 13,145,159<br />
Fringe Benefits 2,582,705 2,705,570 2,457,552 3,071,002<br />
Total Personnel 14,648,568 15,120,019 14,345,455 16,216,161<br />
Non-Personnel<br />
Internal Service Charges 2,769,850 2,871,983 2,916,933 3,113,769<br />
Pr<strong>of</strong>essional & Contractual 58,444 63,095 60,012 59,751<br />
Utilities 303,123 294,674 276,378 302,453<br />
Insurance and Fixed Charges 602,792 503,582 496,856 516,637<br />
All Other Operations and Maintenance 935,609 972,722 931,677 871,206<br />
Capital Outlay 520,478 770,403 543,518 1,285,367<br />
Debt Service 1,434,513 1,424,400 1,424,400 438,757<br />
Total Non-Personnel 6,624,810 6,900,859 6,649,774 6,587,940<br />
Total Expenditures 21,273,378 22,020,878 20,995,229 22,804,101<br />
Net Transfers<br />
Revenue Sources<br />
Taxes<br />
Licenses & Permits<br />
Intergovernmental 323,836 397,404 285,333 156,499<br />
Charges for Services 726,566 656,688 791,043 213,810<br />
Interest Income<br />
All Other Revenue 926,456 935,852 815,852 1,515,000<br />
Total Revenue 1,976,858 1,989,944 1,892,228 1,885,309<br />
Funding to be Provided 19,296,520 20,030,934 19,103,001 20,918,792<br />
D-88 Fiscal Year <strong>2008</strong> Annual Budget
Investigative Services<br />
MISSION<br />
To provide quality follow-up investigations <strong>of</strong> criminal incidents, occurring within the <strong>City</strong> <strong>of</strong> <strong>Lakeland</strong>.<br />
CORE SERVICES<br />
Criminal Investigations (CIS)<br />
CIS members conduct investigations related, but not limited to, crimes such as murder, sexual<br />
<strong>of</strong>fenses, robbery, burglary, larceny, fraud and auto theft.<br />
Juvenile Services (JSS)<br />
JSS members conduct investigations related to child abuse and molestation.<br />
Special Investigations (SIS)<br />
SIS members conduct investigations into violations <strong>of</strong> laws related to narcotics and vice.<br />
Crime Lab<br />
A part <strong>of</strong> CIS that provides crime scene services and forensic examinations.<br />
OPERATIONAL AND/OR PUBLIC SERVICE LEVELS<br />
Item Measured<br />
FY 2004<br />
Actual<br />
FY 2005<br />
Actual<br />
FY 2006<br />
Actual<br />
FY 2007<br />
Projected<br />
FY <strong>2008</strong><br />
Proposed<br />
Total Criminal Investigative Cases<br />
Worked<br />
2,853 3,265 3,533 3,600 3,708<br />
Percentage <strong>of</strong> Criminal Investigative<br />
Cases Cleared:<br />
Violent Crimes (rape, robbery,<br />
murder, etc.)<br />
32% 26% 31% 33% 34%<br />
Property Crimes (burglary/theft<br />
>$300)<br />
26% 16% 22% 20% 20%<br />
Auto Theft 47% 47% 55% 48% 51%<br />
Economic Crime (fraud/ID theft, etc.) 71% 63% 65% 75% 76%<br />
Juvenile Crime (molestations, etc.) 82% 85% 78% 85% 84%<br />
Total Lab Cases Worked 1,336 1,231 1,163 1,275 1,313<br />
Total Special Investigation Cases<br />
Worked<br />
1,629 1,857 2,051 2,075 2,137<br />
D-89 Fiscal Year <strong>2008</strong> Annual Budget
Investigative Services<br />
TABLE OF ORGANIZATION<br />
Legend<br />
Left number= 2007 FTE<br />
Right number= <strong>2008</strong> FTE<br />
D-90 Fiscal Year <strong>2008</strong> Annual Budget
Investigative Services<br />
2007-08<br />
Experience Budget Experience Proposed<br />
For Year For Year 2006-07 by<br />
EXPENSES 2005-06 2006-07 Estimated <strong>City</strong> Manager<br />
Personnel<br />
Salaries & Wages 3,006,580 3,877,933 3,734,732 3,285,928<br />
Fringe Benefits 644,599 847,306 773,129 769,385<br />
Total Personnel 3,651,179 4,725,239 4,507,861 4,055,313<br />
Non-Personnel<br />
Internal Service Charges 662,630 869,793 885,681 745,638<br />
Pr<strong>of</strong>essional & Contractual 17,089 17,197 17,147 11,749<br />
Utilities 75,367 91,915 86,839 74,511<br />
Insurance and Fixed Charges 137,342 145,804 143,616 149,675<br />
All Other Operations and Maintenance 231,188 291,214 283,816 203,349<br />
Capital Outlay 18,871 97,818 29,370 7,208<br />
Debt Service<br />
Total Non-Personnel 1,142,487 1,513,740 1,446,469 1,192,130<br />
Total Expenditures 4,793,666 6,238,979 5,954,330 5,247,444<br />
Net Transfers<br />
Revenue Sources<br />
Taxes<br />
Licenses & Permits<br />
Intergovernmental<br />
Charges for Services<br />
Interest Income 13,947 15,878 28,944 28,717<br />
All Other Revenue 452,948 145,598 145,598<br />
Total Revenue 466,895 161,476 174,542 28,717<br />
Funding to be Provided 4,326,771 6,077,503 5,779,788 5,218,727<br />
D-91 Fiscal Year <strong>2008</strong> Annual Budget
Aviation Unit<br />
MISSION<br />
To assist the <strong>Lakeland</strong> Police Department (LPD) Patrols Services by providing high-quality aerial<br />
support for surveillance and tactical operations<br />
CORE SERVICES<br />
Responsible for providing aerial support to the LPD, including responding to calls for service (assist),<br />
conducting requests for patrol (checking specific areas in relation to ongoing criminal activity such as<br />
vehicle burglaries, suspicious activities, thefts from construction sites, etc.), recovering property,<br />
assisting in drug seizes and providing back-up assistance in arrests.<br />
Assists other agencies such as the Polk County Sheriffs Office, DEA, FBI and local agencies with<br />
Law Enforcement searches. Also assists with Administrative/Photo/Reconnaissance missions for<br />
other government agencies.<br />
Assists with emergency response activities and aircraft crash investigations at the Airport during the<br />
Annual Sun ‘n Fun Experimental Aircraft Association (EAA) Fly-In. Also responsible for the<br />
maintenance <strong>of</strong> the Special Operating Section (SOS) equipment.<br />
OPERATIONAL AND/OR PUBLIC SERVICE LEVELS<br />
Item Measured<br />
2004<br />
Actual<br />
2005<br />
Actual<br />
2006<br />
Actual<br />
2007<br />
Projected<br />
<strong>2008</strong><br />
Proposed<br />
Flight Hours 362 264 428 400 400<br />
Back-up/Assists 752 752 500 600 650<br />
Recovered Property Value $50,054 $222,500 $20,000 $100,000 $125,000<br />
Arrests 52 47 36 50 60<br />
Calls for Service N/A 287 467 500 550<br />
Requests for Patrol N/A 3,900 4,856 5,000 5,500<br />
D-92 Fiscal Year <strong>2008</strong> Annual Budget
Aviation Unit<br />
2007-08<br />
Experience Budget Experience Proposed<br />
For Year For Year 2006-07 by<br />
EXPENSES 2005-06 2006-07 Estimated <strong>City</strong> Manager<br />
Personnel<br />
Salaries & Wages 93,128 197,895 190,235 148,530<br />
Fringe Benefits 19,906 43,088 39,298 34,679<br />
Total Personnel 113,034 240,983 229,532 183,209<br />
Non-Personnel<br />
Internal Service Charges 21,350 45,969 46,801 35,383<br />
Pr<strong>of</strong>essional & Contractual 279 787 785 357<br />
Utilities 2,335 4,657 4,391 3,357<br />
Insurance and Fixed Charges 4,458 7,544 7,527 7,754<br />
All Other Operations and Maintenance 6,921 14,407 13,982 8,526<br />
Capital Outlay 129,968 241,800 238,133 310<br />
Debt Service<br />
Total Non-Personnel 165,311 315,163 311,619 55,688<br />
Total Expenditures 278,345 556,146 541,152 238,897<br />
Net Transfers<br />
Revenue Sources<br />
Taxes<br />
Licenses & Permits<br />
Intergovernmental<br />
Charges for Services<br />
Interest Income<br />
All Other Revenue<br />
Total Revenue<br />
Funding to be Provided 278,345 556,146 541,152 238,897<br />
D-93 Fiscal Year <strong>2008</strong> Annual Budget
Community Police Programs<br />
MISSION<br />
To develop an informed and engaged community by providing education designed to help the public<br />
avoid becoming crime victims.<br />
CORE SERVICES<br />
Provides both commercial and residential security surveys, which assess the security strengths and<br />
weaknesses <strong>of</strong> a specific location and make appropriate recommendations for improvement. Works<br />
with the public in organizing and maintaining Neighborhood Watch and Business Watch programs<br />
throughout the <strong>City</strong>. Also coordinates a Domestic Abuse Response Team (DART) and plans special<br />
events, such as the Crime Prevention Expo, <strong>Lakeland</strong> Police Department Open House and the National<br />
Night Out Against Crime.<br />
OPERATIONAL AND/OR PUBLIC SERVICE LEVELS<br />
2004 2005 2006 2007 <strong>2008</strong><br />
Item Measured<br />
Actual Actual Actual Projected Proposed<br />
Crime Prevention Programs 335 270 490 500 550<br />
Home Security Surveys 15 36 23 50 60<br />
Business Security Surveys 94 63 30 50 60<br />
D-94 Fiscal Year <strong>2008</strong> Annual Budget
Community Police Programs<br />
2007-08<br />
Experience Budget Experience Proposed<br />
For Year For Year 2006-07 by<br />
EXPENSES 2005-06 2006-07 Estimated <strong>City</strong> Manager<br />
Personnel<br />
Salaries & Wages 1,372,235 737,426 712,388 785,235<br />
Fringe Benefits 293,849 161,604 148,079 183,964<br />
Total Personnel 1,666,084 899,029 860,467 969,199<br />
Non-Personnel<br />
Internal Service Charges 302,769 157,546 160,494 172,781<br />
Pr<strong>of</strong>essional & Contractual 4,085 2,866 2,862 2,422<br />
Utilities 34,589 17,558 16,609 17,927<br />
Insurance and Fixed Charges 62,404 24,997 24,939 25,708<br />
All Other Operations and Maintenance 101,578 54,146 52,877 47,488<br />
Capital Outlay 8,683 17,621 5,398 1,804<br />
Debt Service<br />
Total Non-Personnel 514,109 274,734 263,179 268,131<br />
Total Expenditures 2,180,193 1,173,763 1,123,646 1,237,330<br />
Net Transfers<br />
Revenue Sources<br />
Taxes<br />
Licenses & Permits<br />
Intergovernmental 52,502 4,432 1,432<br />
Charges for Services<br />
Interest Income<br />
All Other Revenue<br />
Total Revenue 52,502 4,432 1,432<br />
Funding to be Provided 2,127,691 1,169,331 1,122,214 1,237,330<br />
D-95 Fiscal Year <strong>2008</strong> Annual Budget
Juvenile Police Programs<br />
MISSION<br />
To support a vibrant, culturally diverse community by providing the youth <strong>of</strong> <strong>Lakeland</strong> with positive role<br />
models, mentors and educational lifestyle options, as alternatives to gang participation and drug use.<br />
CORE SERVICES<br />
Drug Abuse Resistance Education/Gang Resistance Education and Training (DARE/GREAT) Program<br />
Provides drug and gang resistance education and alternative lifestyle choices training to various grade<br />
levels.<br />
School Resource Officers (SRO’s)<br />
Provides schools with a safe environment for students.<br />
Truancy Intervention Program (TIP)<br />
Addresses issues <strong>of</strong> truancy and provides parents referrals to prevent truancy.<br />
Police Athletic/Activities League (PAL)<br />
Provides after school mentoring and tutoring programs and organized sports such as football,<br />
cheerleading, baseball, basketball and track and field.<br />
In addition, to the individual programs core service, the <strong>of</strong>ficers, civilians and volunteers serve not only<br />
as protectors but mentors through instructional sessions and as positive role models.<br />
TABLE OF ORGANIZATION<br />
These positions are part <strong>of</strong> the<br />
Investigative Services activity. To see the<br />
entire Investigative Services table <strong>of</strong><br />
organization, see page G-62.<br />
Legend<br />
Left number= 2007 FTE<br />
Right number= <strong>2008</strong> FTE<br />
D-96 Fiscal Year <strong>2008</strong> Annual Budget
Juvenile Police Programs<br />
OPERATIONAL AND/OR PUBLIC SERVICE LEVELS<br />
2004 2005 2006 2007 <strong>2008</strong><br />
Item Measured<br />
Actual Actual Actual Projected Proposed<br />
Children in PAL Programs 850 1,062 1,100 1,133 1,150<br />
PAL Tutoring Hours 669 573 512 527 540<br />
TIP Participants 77 680 502 517 520<br />
DARE/GREAT Students 2,250 2,476 8,947 9,215 9,220<br />
SRO Student Conferences 2,190 2,476 3,204 3,300 3,305<br />
PERFORMANCE MEASURES (KSI’S)<br />
GOAL: Quality <strong>of</strong> Life Goal<br />
OUTCOME: Support Education<br />
KSI: School Resource Officer Hours (<strong>2008</strong> Goal: 11,200 hours)<br />
Objective: Number <strong>of</strong> hours <strong>of</strong> School Resource Officers<br />
NEW INITIATIVES<br />
Quality <strong>of</strong> Life<br />
• The SRO Unit is reviewing and revising the Emergency Operations Plan for incidents at Schools in<br />
the <strong>City</strong> <strong>of</strong> <strong>Lakeland</strong>. Included in this plan is a new program with the Polk County Sheriff’s Office<br />
to provide a video view <strong>of</strong> each school (classrooms and <strong>of</strong>fice spaces) in the <strong>City</strong>. A video view<br />
access along with diagrams <strong>of</strong> school facilities would prove to be invaluable in the case <strong>of</strong> a major<br />
incident.<br />
• The LPD will investigate alternative Drug & Gang Resistance Education and Training programs in<br />
FY <strong>2008</strong> that would not require full-time sworn <strong>of</strong>ficers in an effort to respond to departmental employment<br />
shortcomings.<br />
D-97 Fiscal Year <strong>2008</strong> Annual Budget
Juvenile Police Programs<br />
2007-08<br />
Experience Budget Experience Proposed<br />
For Year For Year 2006-07 by<br />
EXPENSES 2005-06 2006-07 Estimated <strong>City</strong> Manager<br />
Personnel<br />
Salaries & Wages 1,309,626 1,782,282 1,713,562 1,886,767<br />
Fringe Benefits 279,962 388,048 353,971 439,293<br />
Total Personnel 1,589,588 2,170,331 2,067,534 2,326,060<br />
Non-Personnel<br />
Internal Service Charges 299,932 413,943 421,431 450,118<br />
Pr<strong>of</strong>essional & Contractual 4,304 7,087 7,066 4,261<br />
Utilities 32,838 41,959 39,564 42,725<br />
Insurance and Fixed Charges 62,404 67,581 67,430 69,502<br />
All Other Operations and Maintenance 97,737 129,709 125,891 106,877<br />
Capital Outlay 8,312 46,586 13,585 3,946<br />
Debt Service<br />
Total Non-Personnel 505,528 706,865 674,967 677,431<br />
Total Expenditures 2,095,115 2,877,196 2,742,500 3,003,491<br />
Net Transfers<br />
Revenue Sources<br />
Taxes<br />
Licenses & Permits<br />
Intergovernmental 194,512 474,930 474,930 460,676<br />
Charges for Services<br />
Interest Income 6 1,291 210<br />
All Other Revenue<br />
Total Revenue 194,518 474,930 476,221 460,886<br />
Funding to be Provided 1,900,597 2,402,266 2,266,279 2,542,605<br />
D-98 Fiscal Year <strong>2008</strong> Annual Budget
Dispatching Services<br />
MISSION<br />
To provide prompt, attentive and compassionate customer service in response to calls for<br />
emergency and non-emergency services from the residents and visitors <strong>of</strong> the <strong>City</strong> <strong>of</strong> <strong>Lakeland</strong>.<br />
CORE SERVICES<br />
The <strong>Lakeland</strong> Police Department (LPD) Communications Center is a 24-hour, 7-days per week<br />
operation. The Communications Center answers 911 calls and dispatches for both LPD and the<br />
<strong>Lakeland</strong> Fire Department (LFD).<br />
TABLE OF ORGANIZATION<br />
These positions are part <strong>of</strong> the Police Administrative<br />
Services division. To see the entire Administrative Services<br />
table <strong>of</strong> organization, see page G-61.<br />
Legend<br />
Left number= 2007 FTE<br />
Right number= <strong>2008</strong> FTE<br />
D-99 Fiscal Year <strong>2008</strong> Annual Budget
Dispatching Services<br />
OPERATIONAL AND/OR PUBLIC SERVICE LEVELS<br />
2004 2005 2006 2007 <strong>2008</strong><br />
Item Measured<br />
Actual Actual Actual Projected Proposed<br />
Telephone Calls Received 502,024 468,435 464,522 464,000 465,000<br />
Police Radio Transmissions 774,910 723,571 788,171 787,452 785,000<br />
Fire Radio Transmission 157,922 162,590 169,636 168,588 169,000<br />
NEW INITIATIVES<br />
Quality <strong>of</strong> Life<br />
• The <strong>Lakeland</strong> Police Department and Polk County Public Safety reached an agreement last year to<br />
route all wireless 911 calls originating in the <strong>City</strong> <strong>of</strong> <strong>Lakeland</strong> to the <strong>Lakeland</strong> Police Department 911<br />
Call Center. The process to implement the change has been underway for over 12 months. It<br />
involves a number <strong>of</strong> tasks including identifying the applicable cell sectors <strong>of</strong> all the Cellular Carriers<br />
serving Polk County; additional training for LPD dispatch personnel; changes in the infrastructure;<br />
changes in programming. Verizon will be the first Cellular Carrier to have calls routed to LPD and<br />
the additional cellular carriers will follow.<br />
D-100 Fiscal Year <strong>2008</strong> Annual Budget
Dispatching Services<br />
2007-08<br />
Experience Budget Experience Proposed<br />
For Year For Year 2006-07 by<br />
EXPENSES 2005-06 2006-07 Estimated <strong>City</strong> Manager<br />
Personnel<br />
Salaries & Wages 1,342,909 2,186,839 2,102,194 2,813,515<br />
Fringe Benefits 287,317 476,519 434,056 654,606<br />
Total Personnel 1,630,226 2,663,358 2,536,250 3,468,121<br />
Non-Personnel<br />
Internal Service Charges 306,088 505,902 514,999 667,385<br />
Pr<strong>of</strong>essional & Contractual 7,865 9,854 9,824 8,329<br />
Utilities 33,596 51,705 48,819 63,825<br />
Insurance and Fixed Charges 62,404 82,198 82,014 84,576<br />
All Other Operations and Maintenance 104,413 164,439 159,931 166,511<br />
Capital Outlay 8,443 56,922 16,794 5,924<br />
Debt Service<br />
Total Non-Personnel 522,810 871,019 832,381 996,549<br />
Total Expenditures 2,153,036 3,534,377 3,368,631 4,464,670<br />
Net Transfers<br />
Revenue Sources<br />
Taxes<br />
Licenses & Permits<br />
Intergovernmental<br />
Charges for Services<br />
Interest Income<br />
All Other Revenue<br />
Total Revenue<br />
Funding to be Provided 2,153,036 3,534,377 3,368,631 4,464,670<br />
D-101 Fiscal Year <strong>2008</strong> Annual Budget
Street and Traffic Lighting<br />
MISSION<br />
To provide motorists and pedestrians with appropriate illumination at night to improve safety and<br />
provide adequate visibility.<br />
CORE SERVICES<br />
<strong>Lakeland</strong> Electric’s Delivery Division is responsible for the design and installation <strong>of</strong> new lighting and<br />
the maintenance <strong>of</strong> existing lighting throughout the <strong>City</strong> <strong>of</strong> <strong>Lakeland</strong> within roadways, walkways, parks<br />
and parking lots.<br />
TABLE OF ORGANIZATION<br />
Most street lighting is done as part <strong>of</strong> the electric power system design and construction <strong>of</strong> a<br />
new development. See Electric’s Delivery Table <strong>of</strong> Organizations on page G-29.<br />
D-102 Fiscal Year <strong>2008</strong> Annual Budget
Street and Traffic Lighting<br />
2007-08<br />
Experience Budget Experience Proposed<br />
For Year For Year 2006-07 by<br />
EXPENSES 2005-06 2006-07 Estimated <strong>City</strong> Manager<br />
Personnel<br />
Salaries & Wages<br />
Fringe Benefits<br />
Total Personnel<br />
Non-Personnel<br />
Internal Service Charges 102,495 125,280 125,180 115,777<br />
Pr<strong>of</strong>essional & Contractual<br />
Utilities 3,517,815 3,523,108 3,523,075 3,702,586<br />
Insurance and Fixed Charges<br />
All Other Operations and Maintenance<br />
Capital Outlay<br />
Debt Service<br />
Total Non-Personnel 3,620,310 3,648,388 3,648,255 3,818,363<br />
Total Expenditures 3,620,310 3,648,388 3,648,255 3,818,363<br />
Net Transfers<br />
Revenue Sources<br />
Taxes<br />
Licenses & Permits<br />
Intergovernmental 423,008<br />
Charges for Services<br />
Interest Income<br />
All Other Revenue<br />
Total Revenue 423,008<br />
Funding to be Provided 3,197,302 3,648,388 3,648,255 3,818,363<br />
D-103 Fiscal Year <strong>2008</strong> Annual Budget
THIS PAGE IS INTENTIONALLY BLANK
CITY OF LAKELAND<br />
<strong>2008</strong><br />
Transportation Services<br />
Program<br />
Activity<br />
Page<br />
Transportation<br />
- Facilities Construction D-108<br />
- Facilities Maintenance D-111<br />
- Rights-<strong>of</strong>-Way D-114<br />
<strong>Lakeland</strong> Linder Regional Airport<br />
- Operations D-116<br />
- Leasing Activities D-119<br />
Parking Services D-122<br />
D-105 Fiscal Year <strong>2008</strong> Annual Budget
Transportation Services<br />
<strong>Lakeland</strong> Linder<br />
Regional Airport -<br />
Leasing Activities<br />
12%<br />
<strong>Lakeland</strong> Linder<br />
Regional Airport -<br />
Operations<br />
13%<br />
Transportation<br />
Facilities Rights-<strong>of</strong>-Way<br />
1%<br />
Parking Services<br />
5%<br />
Transportation<br />
Facilities Construction<br />
28%<br />
Transportation<br />
Facilities Maintenance<br />
41%<br />
D-106 Fiscal Year <strong>2008</strong> Annual Budget
Transportation Services<br />
Experience Budget Experience FY 2007-08<br />
For Year For Year 2006-07 Proposed By<br />
EXPENSES 2005-06 2006-07 Estimated <strong>City</strong> Manager<br />
Personnel<br />
Salaries and Wages 3,777,439 4,450,894 4,013,883 5,014,060<br />
Fringe Benefits 865,526 1,117,505 991,544 1,346,541<br />
Total Personnel 4,642,964 5,568,399 5,005,427 6,360,600<br />
Non-Personnel<br />
Internal Service Charges 1,899,361 2,124,576 2,133,413 1,856,428<br />
Pr<strong>of</strong>essional and Contractual 163,095 354,332 344,255 322,247<br />
Utilities 575,488 623,735 638,371 727,813<br />
Insurance and Fixed Charges 482,084 617,863 605,251 636,232<br />
All Other Operations and Maintenance 2,932,704 3,929,631 3,865,577 5,689,251<br />
Capital Outlay 9,619,483 37,930,712 37,746,385 3,504,055<br />
Debt Service 1,652,387 7,653,342 7,354,689 4,183,527<br />
Total Non-Personnel 17,324,603 53,234,191 52,687,941 16,919,553<br />
Total Expenditures 21,967,568 58,802,590 57,693,368 23,280,154<br />
Net Transfers<br />
Revenue Sources<br />
Taxes 5,599,243 5,213,000 5,756,000 5,786,000<br />
Licenses and Permits<br />
Intergovernmental 5,567,497 14,323,570 12,057,453 2,656,556<br />
Charges for Services 4,605,675 4,102,644 4,260,341 4,301,036<br />
Interest Income 368,645 265,604 265,263 253,438<br />
All Other Revenue 6,347,887 20,615,485 20,717,405 2,563,300<br />
Total Revenue 22,488,947 44,520,303 43,056,462 15,560,330<br />
Funding to be Provided (521,379) 14,282,287 14,636,906 7,719,824<br />
D-107 Fiscal Year <strong>2008</strong> Annual Budget
Transportation Facilities Construction<br />
MISSION<br />
To provide for the construction <strong>of</strong> transportation facilities throughout the <strong>City</strong> <strong>of</strong> <strong>Lakeland</strong>.<br />
CORE SERVICES<br />
Transportation facility projects are managed and constructed by the Public Works Department.<br />
Transportation Facilities Construction services include sidewalk construction, streetscape construction<br />
(enhanced sidewalk with pavers, landscaping and antique street lights), intersection improvements,<br />
traffic calming construction, traffic signalization, new road construction, street widening, preparation<br />
and management <strong>of</strong> contract documents for construction services, and construction management<br />
services associated with major transportation capital projects.<br />
OPERATIONAL AND/OR PUBLIC SERVICE LEVELS<br />
Item Measured<br />
Sidewalk Construction<br />
(linear feet)<br />
Streetscape Construction<br />
(square feet)<br />
New/Widened Roadway<br />
(lane miles)<br />
2004<br />
Actual<br />
2005<br />
Actual<br />
2006<br />
Actual<br />
2007<br />
Projected<br />
<strong>2008</strong><br />
Proposed<br />
9,915 5,075 6,050 3,500 7,650<br />
36,800 18,726 9,270 41,097 51,285<br />
2.62 1.31 2.45 2.66 1.34<br />
PERFORMANCE MEASURES (KSI’S)<br />
GOAL: Quality <strong>of</strong> Life<br />
OUTCOME: Quality Public Spaces<br />
KSI: Miles <strong>of</strong> sidewalk within COL (<strong>2008</strong> Goal: 218.59 miles)<br />
Objective: Determine total miles <strong>of</strong> sidewalks located within <strong>City</strong> <strong>of</strong> <strong>Lakeland</strong> boundaries.<br />
D-108 Fiscal Year <strong>2008</strong> Annual Budget
Transportation Facilities Construction<br />
TABLE OF ORGANIZATION<br />
This service also supported by Public Works Traffic<br />
Operations, Engineering and <strong>of</strong>fice staff. For a<br />
complete table <strong>of</strong> organization, please see page G-64<br />
Legend<br />
Left number= 2007 FTE<br />
Right number= <strong>2008</strong> FTE<br />
D-109 Fiscal Year <strong>2008</strong> Annual Budget
Transportation Facilities Construction<br />
2007-08<br />
Experience Budget Experience Proposed<br />
For Year For Year 2006-07 by<br />
EXPENSES 2005-06 2006-07 Estimated <strong>City</strong> Manager<br />
Personnel<br />
Salaries & Wages 657,827 618,381 543,221 716,909<br />
Fringe Benefits 140,905 138,511 117,728 172,600<br />
Total Personnel 798,732 756,892 660,948 889,509<br />
Non-Personnel<br />
Internal Service Charges 130,432 131,260 121,061 136,046<br />
Pr<strong>of</strong>essional & Contractual 13,533 11,416 11,151 9,348<br />
Utilities 18,249 14,982 14,562 16,610<br />
Insurance and Fixed Charges 4,951 43,465 41,074 44,452<br />
All Other Operations and Maintenance 137,312 128,469 124,802 320,989<br />
Capital Outlay 4,958,468 29,817,098 29,706,352 2,521,914<br />
Debt Service 291,335 5,947,469 5,947,469 2,565,000<br />
Total Non-Personnel 5,554,280 36,094,158 35,966,471 5,614,358<br />
Total Expenditures 6,353,012 36,851,051 36,627,420 6,503,867<br />
Net Transfers<br />
Revenue Sources<br />
Taxes 5,599,243 5,213,000 5,756,000 5,786,000<br />
Licenses & Permits<br />
Intergovernmental 1,246,229 9,399,301 9,302,280 1,720,000<br />
Charges for Services 11,615<br />
Interest Income 242,274 116,944 116,944 116,441<br />
All Other Revenue 5,583,148 20,002,820 20,033,761 2,490,000<br />
Total Revenue 12,682,509 34,732,065 35,208,985 10,112,441<br />
Funding to be Provided (6,329,497) 2,118,986 1,418,435 (3,608,574)<br />
D-110 Fiscal Year <strong>2008</strong> Annual Budget
Transportation Facilities Maintenance<br />
MISSION<br />
To support safe and attractive neighborhoods and public spaces through the continuous maintenance<br />
<strong>of</strong> all streets, sidewalks, drainage facilities and alleys within the <strong>City</strong>.<br />
CORE SERVICES<br />
The Transportation Facilities Maintenance Program includes street sweeping, mowing and trimming<br />
along streets and alleys, repairs <strong>of</strong> damaged road surfaces, upkeep <strong>of</strong> sidewalks and streetscape,<br />
maintenance <strong>of</strong> traffic signals and pavement markings, installation and repair <strong>of</strong> street signs,<br />
maintenance <strong>of</strong> storm drains, catch basins, ditches and retention ponds.<br />
TABLE OF ORGANIZATION<br />
Legend<br />
Left number= 2007 FTE<br />
Right number= <strong>2008</strong> FTE<br />
This service also supported by Traffic Operations and the<br />
Parks & Recreation Department. For complete table <strong>of</strong><br />
organizations, please see pages G-71 & G-54.<br />
D-111 Fiscal Year <strong>2008</strong> Annual Budget
Transportation Facilities Maintenance<br />
OPERATIONAL AND/OR PUBLIC SERVICE LEVELS<br />
Item Measured<br />
Resurfacing<br />
(sq. yards)<br />
Street Sweeping<br />
(lane miles)<br />
Sidewalk Repairs<br />
(sq. feet)<br />
2004<br />
Actual<br />
2005<br />
Actual<br />
2006<br />
Actual<br />
2007<br />
Projected<br />
<strong>2008</strong><br />
Proposed<br />
315,648 355,701 301,996 347,147 315,000<br />
14,998 12,827 14,096 14,400 14,000<br />
24,094 57,820 54,424 63,800 59,000<br />
PERFORMANCE MEASURES (KSI’S)<br />
GOAL: Quality <strong>of</strong> Life<br />
OUTCOME: Quality Public Spaces<br />
KSI: Pavement Condition Index (PCI) - Road Level <strong>of</strong> Service Standard<br />
<strong>2008</strong> Goal: Local Streets ≥70<br />
Collector Roads ≥80<br />
Objective: Measure Level <strong>of</strong> service standard.<br />
D-112 Fiscal Year <strong>2008</strong> Annual Budget
Transportation Facilities Maintenance<br />
2007-08<br />
Experience Budget Experience Proposed<br />
For Year For Year 2006-07 by<br />
EXPENSES 2005-06 2006-07 Estimated <strong>City</strong> Manager<br />
Personnel<br />
Salaries & Wages 2,000,916 2,425,207 2,125,718 2,626,099<br />
Fringe Benefits 466,468 634,568 549,498 741,545<br />
Total Personnel 2,467,384 3,059,776 2,675,217 3,367,644<br />
Non-Personnel<br />
Internal Service Charges 818,213 1,084,688 1,081,681 1,035,721<br />
Pr<strong>of</strong>essional & Contractual 11,426 13,235 13,401 12,364<br />
Utilities 118,517 105,909 140,337 152,522<br />
Insurance and Fixed Charges 297,860 296,941 296,856 301,035<br />
All Other Operations and Maintenance 2,326,559 2,637,926 2,607,667 3,935,240<br />
Capital Outlay 449,378 3,233,366 3,924,299 736,315<br />
Debt Service<br />
Total Non-Personnel 4,021,953 7,372,065 8,064,241 6,173,197<br />
Total Expenditures 6,489,338 10,431,841 10,739,457 9,540,841<br />
Net Transfers<br />
Revenue Sources<br />
Taxes<br />
Licenses & Permits<br />
Intergovernmental 49,499 190,648 190,648<br />
Charges for Services 4,268 9,032 9,077 3,000<br />
Interest Income<br />
All Other Revenue 41,481 354,797 449,754 5,000<br />
Total Revenue 95,248 554,477 649,479 8,000<br />
Funding to be Provided 6,394,090 9,877,364 10,089,978 9,532,841<br />
D-113 Fiscal Year <strong>2008</strong> Annual Budget
Transportation Facilities Rights-<strong>of</strong>-Way<br />
MISSION<br />
To acquire the necessary rights <strong>of</strong> way for transportation-related facilities proposed throughout the <strong>City</strong>.<br />
CORE SERVICES<br />
To provide the necessary services for right <strong>of</strong> way acquisition for transportation related capital projects<br />
including the preparation <strong>of</strong> acquisition documentation, management <strong>of</strong> contractual services for survey<br />
and appraisal services, acquisition negotiations and management <strong>of</strong> eminent domain litigation.<br />
OPERATIONAL AND/OR PUBLIC SERVICE LEVELS<br />
2004 2005 2006 2007 <strong>2008</strong><br />
Item Measured Actual Actual Actual Actual Projected<br />
Projects 1 2 6 7 8<br />
Parcels Acquired 14 6 6 42 85<br />
Parcels Condemned 8 0 0 28 52<br />
NEW INITIATIVES<br />
Quality <strong>of</strong> Life<br />
• The <strong>City</strong> will be progressing with right-<strong>of</strong>-way acquisition services for the East-West Connector and<br />
Waring Road Extension projects in FY <strong>2008</strong>.<br />
D-114 Fiscal Year <strong>2008</strong> Annual Budget
Transportation Facilities Rights-<strong>of</strong>-Way<br />
TABLE OF ORGANIZATION<br />
Portions <strong>of</strong> the Public Works Department support this activity and many others. See<br />
entire Public Works Tables <strong>of</strong> Organization beginning on page G-64.<br />
2007-08<br />
Experience Budget Experience Proposed<br />
For Year For Year 2006-07 by<br />
EXPENSES 2005-06 2006-07 Estimated <strong>City</strong> Manager<br />
Personnel<br />
Salaries & Wages 75,430 197,017 167,305 79,070<br />
Fringe Benefits 15,686 46,481 37,698 20,748<br />
Total Personnel 91,116 243,498 205,003 99,819<br />
Non-Personnel<br />
Internal Service Charges 14,186 39,012 36,745 13,481<br />
Pr<strong>of</strong>essional & Contractual 2,425 3,279 3,763 3,261<br />
Utilities 2,233 4,655 4,658 1,938<br />
Insurance and Fixed Charges 13 49,736 49,810 50,777<br />
All Other Operations and Maintenance 4,079 11,492 10,840 5,569<br />
Capital Outlay 75 1,250,188 1,250,188 390<br />
Debt Service 23,334 117,032 117,032 125,000<br />
Total Non-Personnel 46,346 1,475,395 1,473,036 200,416<br />
Total Expenditures 137,462 1,718,894 1,678,039 300,234<br />
Net Transfers<br />
Revenue Sources<br />
Taxes<br />
Licenses & Permits<br />
Intergovernmental 1,250,000 1,250,000<br />
Charges for Services<br />
Interest Income<br />
All Other Revenue<br />
Total Revenue 1,250,000 1,250,000<br />
Funding to be Provided 137,462 468,894 428,039 300,234<br />
D-115 Fiscal Year <strong>2008</strong> Annual Budget
<strong>Lakeland</strong> Linder Regional Airport—Operations<br />
MISSION<br />
To provide the <strong>Lakeland</strong> community with a safe, secure, self-sustaining and convenient airport that<br />
promotes compatible economic growth within a dynamic aviation market.<br />
CORE SERVICES<br />
Airport Operations maintains the Airport Operating Area (AOA). The AOA includes the airfield<br />
pavement, runways, taxiways, ramps, turf areas, drainage systems, airfield lighting, guidance signage<br />
systems, navigational aids, internal service roads, air traffic control services, access gates and security<br />
fencing. Airport Operations is also responsible for airport compliance with all federal and state aviation<br />
regulations including Federal Aviation Regulation (FAR) Part 139 certification. Airport Operations<br />
ensures security and safety compliance as the liaison for special events including the annual Sun ‘N Fun<br />
Fly-In.<br />
TABLE OF ORGANIZATION<br />
Legend<br />
Left number= 2007 FTE<br />
Right number= <strong>2008</strong> FTE<br />
D-116 Fiscal Year <strong>2008</strong> Annual Budget
<strong>Lakeland</strong> Linder Regional Airport—Operations<br />
OPERATIONAL AND/OR PUBLIC SERVICE LEVELS<br />
Item Measured<br />
Air Traffic Operations<br />
(take<strong>of</strong>fs and landings<br />
annually)<br />
Aircraft Fuel Flowage<br />
(gallons delivered to the<br />
Airport)<br />
2004<br />
Actual<br />
2005<br />
Actual<br />
2006<br />
Actual<br />
2007<br />
Projected<br />
<strong>2008</strong><br />
Proposed<br />
133,752 121,975 109,428 140,000 145,000<br />
1,262,500 1,196,375 1,220,590 1,225,000 1,250,000<br />
NEW INITIATIVES<br />
Quality <strong>of</strong> Life<br />
• A new Municipal/Airport Fire Station #7 was scheduled for construction in <strong>2008</strong>, however due to<br />
budget constraints the construction will be delayed until FY 2015 - 2016.<br />
Growth Management<br />
• The Transportation Security Administration (TSA) and the Federal Aviation Administration (FAA)<br />
have taken steps to enhance aviation security through regulation and guidance. In order to<br />
comply with current Federal and State regulations the Airport will install and implement additional<br />
measures <strong>of</strong> security.<br />
D-117 Fiscal Year <strong>2008</strong> Annual Budget
<strong>Lakeland</strong> Linder Regional Airport—Operations<br />
2007-08<br />
Experience Budget Experience Proposed<br />
For Year For Year 2006-07 by<br />
EXPENSES 2005-06 2006-07 Estimated <strong>City</strong> Manager<br />
Personnel<br />
Salaries & Wages 420,219 530,394 514,394 827,886<br />
Fringe Benefits 130,951 169,163 164,255 251,202<br />
Total Personnel 551,170 699,556 678,648 1,079,088<br />
Non-Personnel<br />
Internal Service Charges 746,880 705,462 731,722 487,959<br />
Pr<strong>of</strong>essional & Contractual 49,391 156,755 156,419 138,446<br />
Utilities 164,600 182,250 165,861 204,910<br />
Insurance and Fixed Charges 103,727 180,008 177,463 182,127<br />
All Other Operations and Maintenance 45,215 507,453 509,103 504,422<br />
Capital Outlay 4,074,901 3,024,097 2,283,583 124,036<br />
Debt Service 15,466 15,466 15,466 243,138<br />
Total Non-Personnel 5,200,180 4,771,491 4,039,617 1,885,039<br />
Total Expenditures 5,751,350 5,471,047 4,718,265 2,964,127<br />
Net Transfers<br />
Revenue Sources<br />
Taxes<br />
Licenses & Permits<br />
Intergovernmental 4,271,769 3,483,621 1,314,525 936,556<br />
Charges for Services 236,008 118,500 142,650 118,765<br />
Interest Income 114,717 135,856 137,307 127,574<br />
All Other Revenue 5,902 250 572 250<br />
Total Revenue 4,628,396 3,738,227 1,595,054 1,183,145<br />
Funding to be Provided 1,122,954 1,732,820 3,123,211 1,780,982<br />
D-118 Fiscal Year <strong>2008</strong> Annual Budget
<strong>Lakeland</strong> Linder Regional Airport—Leasing Activities<br />
MISSION<br />
To provide airport funding sources for both operational and capital needs by leasing and maintaining<br />
aviation and non-aviation facilities.<br />
CORE SERVICES<br />
Provide leasing opportunities for Airside/Landside properties consisting <strong>of</strong> aviation hangars, <strong>of</strong>fice<br />
buildings and facility rentals. Facility rentals include a large conference/meeting room and an airport<br />
terminal area available for special events (i.e.; weddings, receptions, art forums, meetings, etc.).<br />
OPERATIONAL AND/OR PUBLIC SERVICE LEVELS<br />
Item Measured<br />
2004<br />
Actual<br />
2005<br />
Actual<br />
2006<br />
Actual<br />
2007<br />
Projected<br />
<strong>2008</strong><br />
Proposed<br />
<strong>Lakeland</strong> Airside Center:<br />
Tenants 15 16 16 17 18<br />
Footage Leased 551,600 574,000 520,200 532,100 557,100<br />
Footage Vacant 138,400 116,000 169,800 161,400 136,400<br />
Other Airport:<br />
Tenants 10 9 10 9 10<br />
Footage Leased 302,100 307,400 307,400 307,200 307,400<br />
Footage Vacant 7,800 2,500 2,500 2,700 2,500<br />
T-Hangar Space:<br />
Number Leased 60 65 65 65 65<br />
Number Vacant 5 0 0 0 0<br />
D-119 Fiscal Year <strong>2008</strong> Annual Budget
<strong>Lakeland</strong> Linder Regional Airport—Leasing Activities<br />
TABLE OF ORGANIZATION<br />
These positions are part <strong>of</strong> the <strong>Lakeland</strong> Linder<br />
Regional Airport. To see the entire table <strong>of</strong><br />
organization, see page G-11.<br />
Legend<br />
Left number= 2007 FTE<br />
Right number= <strong>2008</strong> FTE<br />
D-120 Fiscal Year <strong>2008</strong> Annual Budget
<strong>Lakeland</strong> Linder Regional Airport—Leasing Activities<br />
2007-08<br />
Experience Budget Experience Proposed<br />
For Year For Year 2006-07 by<br />
EXPENSES 2005-06 2006-07 Estimated <strong>City</strong> Manager<br />
Personnel<br />
Salaries & Wages 415,717 466,409 466,409 524,304<br />
Fringe Benefits 58,866 66,549 66,549 82,075<br />
Total Personnel 474,583 532,957 532,957 606,378<br />
Non-Personnel<br />
Internal Service Charges 28,198 27,739 26,495 31,714<br />
Pr<strong>of</strong>essional & Contractual 76,685 152,247 152,247 152,680<br />
Utilities 165,483 194,650 199,370 231,089<br />
Insurance and Fixed Charges 48,237 17,449 14,903 15,141<br />
All Other Operations and Maintenance 321,682 361,759 367,759 415,300<br />
Capital Outlay 131,635 521,760 521,760 85,000<br />
Debt Service 1,232,584 1,238,907 1,185,054 1,160,721<br />
Total Non-Personnel 2,004,503 2,514,511 2,467,588 2,091,645<br />
Total Expenditures 2,479,086 3,047,468 3,000,545 2,698,023<br />
Net Transfers<br />
Revenue Sources<br />
Taxes<br />
Licenses & Permits<br />
Intergovernmental<br />
Charges for Services 3,860,856 3,454,644 3,607,629 3,617,768<br />
Interest Income 1,184 1,370 1,354<br />
All Other Revenue 619,775 78 103<br />
Total Revenue 4,481,815 3,456,092 3,609,086 3,617,768<br />
Funding to be Provided (2,002,729) (408,624) (608,541) (919,745)<br />
D-121 Fiscal Year <strong>2008</strong> Annual Budget
Parking Services<br />
MISSION<br />
To provide safe, convenient parking facilities and assist businesses within the Central Business District<br />
(CBD) by reducing parking issues through consistent enforcement.<br />
CORE SERVICES<br />
Parking Services maintains three parking garages and eight surface lots in addition to on-street parking<br />
within the <strong>City</strong>, thereby enhancing the downtown economic climate by ensuring turnover in customer<br />
parking spaces. The two hour free on-street parking, known as the “Yellow Zone,” continues to be<br />
received favorably by customers to the downtown area and is supported by the <strong>Lakeland</strong> Downtown<br />
Development Authority, the Downtown <strong>Lakeland</strong> Partnership and the many other businesses within the<br />
CBD.<br />
TABLE OF ORGANIZATION<br />
These positions are part <strong>of</strong> the Public Works<br />
Department. To see the entire table <strong>of</strong> organization,<br />
see page G-71.<br />
Legend<br />
Left number= 2007 FTE<br />
Right number= <strong>2008</strong> FTE<br />
OPERATIONAL AND/OR PUBLIC SERVICE LEVELS<br />
2004 2005 2006 2007 <strong>2008</strong><br />
Item Measured Actual Actual Actual Projected Proposed<br />
Citations Issued 5,342 3,993 3,797 3,500 4,000<br />
Leased Spaces:<br />
Surface Lots<br />
Garages<br />
544<br />
1,511<br />
544<br />
1,511<br />
548<br />
1,586<br />
548<br />
1,586<br />
548<br />
1,586<br />
D-122 Fiscal Year <strong>2008</strong> Annual Budget
Parking Services<br />
2007-08<br />
Experience Budget Experience Proposed<br />
For Year For Year 2006-07 by<br />
EXPENSES 2005-06 2006-07 Estimated <strong>City</strong> Manager<br />
Personnel<br />
Salaries & Wages 207,330 213,486 196,837 239,792<br />
Fringe Benefits 52,649 62,234 55,817 78,371<br />
Total Personnel 259,979 275,720 252,654 318,163<br />
Non-Personnel<br />
Internal Service Charges 161,452 136,415 135,710 151,507<br />
Pr<strong>of</strong>essional & Contractual 9,635 17,400 7,274 6,149<br />
Utilities 106,406 121,288 113,583 120,744<br />
Insurance and Fixed Charges 27,295 30,264 25,145 42,700<br />
All Other Operations and Maintenance 97,858 282,532 245,405 507,730<br />
Capital Outlay 5,026 84,203 60,203 36,400<br />
Debt Service 89,668 334,468 89,668 89,668<br />
Total Non-Personnel 497,340 1,006,570 676,988 954,898<br />
Total Expenditures 757,319 1,282,290 929,642 1,273,061<br />
Net Transfers<br />
Revenue Sources<br />
Taxes<br />
Licenses & Permits<br />
Intergovernmental<br />
Charges for Services 492,928 520,468 500,985 561,503<br />
Interest Income 10,470 11,434 9,658 9,423<br />
All Other Revenue 97,581 257,540 233,215 68,050<br />
Total Revenue 600,979 789,442 743,858 638,976<br />
Funding to be Provided 156,340 492,848 185,784 634,085<br />
D-123 Fiscal Year <strong>2008</strong> Annual Budget
THIS PAGE IS INTENTIONALLY BLANK
CITY OF LAKELAND<br />
<strong>2008</strong><br />
Legislative Activities<br />
Program<br />
Activity<br />
Page<br />
<strong>City</strong> Commission D-128<br />
<strong>City</strong> Clerk D-130<br />
Intergovernmental Relations D-133<br />
D-125 Fiscal Year <strong>2008</strong> Annual Budget
Legislative Activities<br />
Intergovernmental<br />
Relations<br />
30%<br />
<strong>City</strong> Commission<br />
41%<br />
<strong>City</strong> Clerk<br />
29%<br />
D-126 Fiscal Year <strong>2008</strong> Annual Budget
Legislative Activities<br />
Experience Budget Experience FY 2007-08<br />
For Year For Year 2006-07 Proposed By<br />
EXPENSES 2005-06 2006-07 Estimated <strong>City</strong> Manager<br />
Personnel<br />
Salaries and Wages 279,083 364,429 313,080 421,644<br />
Fringe Benefits 63,862 79,348 72,635 101,450<br />
Total Personnel 342,945 443,777 385,715 523,093<br />
Non-Personnel<br />
Internal Service Charges 89,873 78,992 75,759 109,762<br />
Pr<strong>of</strong>essional and Contractual 9,382 13,236 9,375 12,445<br />
Utilities 13,008 15,575 13,404 22,301<br />
Insurance and Fixed Charges 7,080 7,890 7,929 8,295<br />
All Other Operations and Maintenance 218,113 265,841 255,044 197,825<br />
Capital Outlay 22,122 22,844 18,340 37,974<br />
Debt Service<br />
Total Non-Personnel 359,578 404,376 379,851 388,603<br />
Total Expenditures 702,523 848,153 765,566 911,696<br />
Net Transfers<br />
Revenue Sources<br />
Taxes<br />
Licenses and Permits<br />
Intergovernmental<br />
Charges for Services<br />
Interest Income<br />
All Other Revenue 1,000<br />
Total Revenue 1,000<br />
Funding to be Provided 701,523 848,153 765,566 911,696<br />
D-127 Fiscal Year <strong>2008</strong> Annual Budget
<strong>City</strong> Commission<br />
MISSION<br />
To protect and promote a quality <strong>of</strong> life in <strong>Lakeland</strong> that includes the health, safety and general welfare<br />
<strong>of</strong> the citizenry.<br />
CORE SERVICES<br />
Responsible for the formulation and adoption <strong>of</strong> legislation that protects the health, safety and general<br />
welfare <strong>of</strong> the <strong>City</strong> as a whole and <strong>of</strong> its citizens. The <strong>City</strong> Commission meets regularly on the first and<br />
third Monday <strong>of</strong> each month at 9:00 a.m. and then again at 1:00 p.m. for the Utility Committee<br />
meetings. Special workshops and additional sessions are scheduled on an as needed basis. An<br />
agenda study session is held the Friday preceding a scheduled <strong>City</strong> Commission meeting, at which<br />
staff is available to provide additional background information and address questions regarding issues<br />
on the upcoming Commission agenda. <strong>City</strong> Commission meetings and Utility Committee meetings are<br />
aired live throughout the County and replayed on the same day starting at 6:00 p.m. on Bright House<br />
Networks Channel 19 and Comcast Cable Channel 33. Meetings are also available for viewing as<br />
streaming video on www.lakelandgov.net.<br />
TABLE OF ORGANIZATION<br />
The <strong>City</strong> Commission and the Mayor are elected to four year terms with next election scheduled for Tuesday,<br />
November 6, 2007. The Commission is comprised <strong>of</strong> four district seats and three at large seats including the Mayor.<br />
Although there are district seats, all registered voters within the <strong>City</strong> limits may vote on all candidates.<br />
Seated: Commissioner James S. Verplanck, Mayor Ralph L. “Buddy” Fletcher<br />
and Commissioner R. Howard Wiggs<br />
Standing: Commissioners Glenn E. Higgins, Gow B. Fields, Edie L. Yates and<br />
A. Dean Boring<br />
D-128 Fiscal Year <strong>2008</strong> Annual Budget
<strong>City</strong> Commission<br />
2007-08<br />
Experience Budget Experience Proposed<br />
For Year For Year 2006-07 by<br />
EXPENSES 2005-06 2006-07 Estimated <strong>City</strong> Manager<br />
Personnel<br />
Salaries & Wages 126,471 175,093 146,634 192,662<br />
Fringe Benefits 29,050 41,507 33,894 44,238<br />
Total Personnel 155,521 216,600 180,528 236,900<br />
Non-Personnel<br />
Internal Service Charges 28,747 31,318 28,479 45,941<br />
Pr<strong>of</strong>essional & Contractual 4,968 8,570 4,930 6,750<br />
Utilities 3,756 6,128 5,111 9,308<br />
Insurance and Fixed Charges 3,098 3,382 3,388 3,575<br />
All Other Operations and Maintenance 51,881 84,935 74,373 56,060<br />
Capital Outlay 11,819 22,482 17,978 19,020<br />
Debt Service<br />
Total Non-Personnel 104,268 156,814 134,259 140,654<br />
Total Expenditures 259,788 373,414 314,787 377,555<br />
Net Transfers<br />
Revenue Sources<br />
Taxes<br />
Licenses & Permits<br />
Intergovernmental<br />
Charges for Services<br />
Interest Income<br />
All Other Revenue 1,000<br />
Total Revenue 1,000<br />
Funding to be Provided 258,788 373,414 314,787 377,555<br />
D-129 Fiscal Year <strong>2008</strong> Annual Budget
<strong>City</strong> Clerk<br />
MISSION<br />
To be supportive <strong>of</strong> an informed and engaged citizenry by maintaining a timely and complete legislative<br />
record <strong>of</strong> the <strong>City</strong> Commission’s activities and those related documents accessible to staff and the<br />
public.<br />
CORE SERVICES<br />
Administers the <strong>Lakeland</strong> Municipal elections, the <strong>Lakeland</strong> Downtown Development Authority (LDDA)<br />
Board elections and the Civil Service/Pension Board elections. Maintains the legislative history <strong>of</strong> the<br />
<strong>City</strong> Commission, secures the <strong>City</strong> Seal and all <strong>City</strong> contracts, leases, deeds, easements and other legal<br />
documents while ensuring compliance with the State Statute for records storage and disposal. Process<br />
record requests from the public and city staff.<br />
TABLE OF ORGANIZATION<br />
Legend<br />
Left number= 2007 FTE<br />
Right number= <strong>2008</strong> FTE<br />
D-130 Fiscal Year <strong>2008</strong> Annual Budget
<strong>City</strong> Clerk<br />
OPERATIONAL AND/OR PUBLIC SERVICE LEVELS<br />
Item Measured<br />
Requests for Copies from Records<br />
Center<br />
2004<br />
Actual<br />
2005<br />
Actual<br />
2006<br />
Actual<br />
2007<br />
Projected<br />
1,926 2,437 2,136 2,000<br />
Records Placed in Storage (# <strong>of</strong> boxes) 1,360 1,022 1,155 1,100<br />
Records Destroyed (# <strong>of</strong> boxes) 1,800 1,506 692 907<br />
NEW INITIATIVES<br />
Communication<br />
• In support <strong>of</strong> on-going development <strong>of</strong> an informed and engaged citizenry working to make the <strong>City</strong><br />
Commission minutes available on the web for research.<br />
Fiscal Management<br />
• Effectively manage financial resources, by working on a Disaster Document Recovery Agreement<br />
and Plan to recover vital documents damaged in a natural or man made disaster.<br />
D-131 Fiscal Year <strong>2008</strong> Annual Budget
<strong>City</strong> Clerk<br />
2007-08<br />
Experience Budget Experience Proposed<br />
For Year For Year 2006-07 by<br />
EXPENSES 2005-06 2006-07 Estimated <strong>City</strong> Manager<br />
Personnel<br />
Salaries & Wages 65,176 94,731 80,639 123,159<br />
Fringe Benefits 15,822 17,917 20,015 33,771<br />
Total Personnel 80,998 112,648 100,654 156,930<br />
Non-Personnel<br />
Internal Service Charges 43,375 32,833 32,661 47,171<br />
Pr<strong>of</strong>essional & Contractual 3,946 3,637 3,571 4,567<br />
Utilities 6,254 6,887 5,699 9,724<br />
Insurance and Fixed Charges 3,982 4,507 4,541 4,720<br />
All Other Operations and Maintenance 53,242 53,427 53,301 20,799<br />
Capital Outlay 9,838 144 144 18,954<br />
Debt Service<br />
Total Non-Personnel 120,637 101,435 99,916 105,936<br />
Total Expenditures 201,635 214,083 200,570 262,866<br />
Net Transfers<br />
Revenue Sources<br />
Taxes<br />
Licenses & Permits<br />
Intergovernmental<br />
Charges for Services<br />
Interest Income<br />
All Other Revenue<br />
Total Revenue<br />
Funding to be Provided 201,635 214,083 200,570 262,866<br />
D-132 Fiscal Year <strong>2008</strong> Annual Budget
Intergovernmental Relations<br />
MISSION<br />
To develop and maintain an effective communications and networking system with representatives <strong>of</strong><br />
federal, state and municipal governments and other local government agencies in an effort to advance<br />
interests <strong>of</strong> importance to the <strong>City</strong> <strong>of</strong> <strong>Lakeland</strong>.<br />
CORE SERVICES<br />
As a local government, the <strong>City</strong> <strong>of</strong> <strong>Lakeland</strong>’s vast and diverse operations and services are subjected to<br />
a litany <strong>of</strong> federal and state statutes, regulations and policies. In an effort to provide the most cost effective<br />
and responsive array <strong>of</strong> services, the <strong>City</strong> monitors and evaluates the potential positive and<br />
negative implications associated with proposed amendments to federal and state laws, statutes and<br />
regulations related to local operations. To assist in this endeavor, the <strong>City</strong> holds memberships with the<br />
National League <strong>of</strong> Cities (NLC), the Florida League <strong>of</strong> Cities (FLC), the Ridge League <strong>of</strong> Cities and the<br />
United Conference <strong>of</strong> Mayors (UCM). Each organization employs staff that <strong>of</strong>fers research and advocacy<br />
assistance to member communities in order to provide timely information to local governments,<br />
which affords improved communications with key decision-makers as public policy issues are developed<br />
both in Washington D.C. and in Tallahassee, Florida. Currently, Commissioner Howard Wiggs<br />
serves on the FLC Legislative Committee and as President <strong>of</strong> the Ridge League board. Mayor Ralph<br />
“Buddy” Fletcher serves on the board <strong>of</strong> Directors for the Tampa Bay Partnership. Commissioner Gow<br />
Fields serves on the American Public Power Association (APPA) Public Policy Makers Council, which<br />
provides the <strong>City</strong> with an inside look at key legislative initiatives. <strong>City</strong> Manager Doug Thomas serves<br />
on the FLC Home Rule Administration Council. Other boards served by the <strong>Lakeland</strong> <strong>City</strong> Commission<br />
include the <strong>Lakeland</strong> Area Mass Transit District, Transportation Planning Organization and Regional<br />
Transportation Organization.<br />
TABLE OF ORGANIZATION<br />
Please refer to the <strong>City</strong> Commission table <strong>of</strong> Organization on page D-128.<br />
D-133 Fiscal Year <strong>2008</strong> Annual Budget
Intergovernmental Relations<br />
2007-08<br />
Experience Budget Experience Proposed<br />
For Year For Year 2006-07 by<br />
EXPENSES 2005-06 2006-07 Estimated <strong>City</strong> Manager<br />
Personnel<br />
Salaries & Wages 87,436 94,606 85,807 105,822<br />
Fringe Benefits 18,991 19,923 18,725 23,441<br />
Total Personnel 106,426 114,529 104,533 129,263<br />
Non-Personnel<br />
Internal Service Charges 17,751 14,841 14,620 16,651<br />
Pr<strong>of</strong>essional & Contractual 468 1,029 874 1,128<br />
Utilities 2,998 2,560 2,595 3,268<br />
Insurance and Fixed Charges<br />
All Other Operations and Maintenance 112,990 127,479 127,370 120,966<br />
Capital Outlay 466 218 218<br />
Debt Service<br />
Total Non-Personnel 134,673 146,127 145,676 142,013<br />
Total Expenditures 241,100 260,656 250,209 271,276<br />
Net Transfers<br />
Revenue Sources<br />
Taxes<br />
Licenses & Permits<br />
Intergovernmental<br />
Charges for Services<br />
Interest Income<br />
All Other Revenue<br />
Total Revenue<br />
Funding to be Provided 241,100 260,656 250,209 271,276<br />
D-134 Fiscal Year <strong>2008</strong> Annual Budget
CITY OF LAKELAND<br />
<strong>2008</strong><br />
Environmental & Utility<br />
Services<br />
Programs<br />
Activity<br />
Page<br />
Electric Utility<br />
− Energy Production D-138<br />
− Energy Transmission and Distribution D-140<br />
− Utility Billing and Customer Service D-142<br />
Water Treatment and Distribution D-145<br />
Wastewater Collection and Treatment D-148<br />
Solid Waste<br />
− Residential D-150<br />
− Commercial D-153<br />
− Recycling D-156<br />
Lakes and Stormwater Management D-159<br />
D-135 Fiscal Year <strong>2008</strong> Annual Budget
Environmental and Utility Services<br />
Wastewater Collection<br />
and Treatment<br />
8%<br />
Residential Solid<br />
Waste Management<br />
2%<br />
Commercial Solid<br />
Waste Management<br />
1%<br />
Recycling Services<br />
Environmental and Utility Services<br />
Experience Budget Experience FY 2007-08<br />
For Year For Year 2006-07 Proposed By<br />
EXPENSES 2005-06 2006-07 Estimated <strong>City</strong> Manager<br />
Personnel<br />
Salaries and Wages 32,429,499 37,889,297 34,233,823 39,446,620<br />
Fringe Benefits 7,190,935 8,856,760 7,500,653 9,142,637<br />
Total Personnel 39,620,434 46,746,057 41,734,476 48,589,257<br />
Non-Personnel<br />
Internal Service Charges 17,432,709 20,193,530 18,384,429 21,503,273<br />
Pr<strong>of</strong>essional and Contractual 10,637,861 12,656,020 10,817,424 12,086,058<br />
Utilities 4,769,905 4,804,693 4,784,194 4,954,358<br />
Insurance and Fixed Charges 2,845,751 3,698,601 2,953,232 3,463,854<br />
All Other Operations and Maintenance 276,594,995 271,283,142 272,720,566 252,402,478<br />
Capital Outlay 45,504,474 83,479,333 82,896,639 66,575,630<br />
Debt Service 44,419,018 47,627,950 47,618,837 50,397,295<br />
Total Non-Personnel 402,204,714 443,743,269 440,175,322 411,382,946<br />
Total Expenditures 441,825,148 490,489,326 481,909,798 459,972,203<br />
Net Transfers<br />
Revenue Sources<br />
Taxes<br />
Licenses and Permits<br />
Intergovernmental 446,530 1,346,562 1,096,562 3,008,217<br />
Charges for Services 444,241,644 449,649,492 450,132,819 467,427,962<br />
Interest Income 5,179,506 5,063,298 4,548,685 4,436,043<br />
All Other Revenue 7,659,444 36,738,690 46,891,671 15,338,846<br />
Total Revenue 457,527,123 492,798,042 502,669,737 490,211,068<br />
Funding to be Provided (15,701,976) (2,308,716) (20,759,940) (30,238,864)<br />
D-137 Fiscal Year <strong>2008</strong> Annual Budget
Energy Production<br />
MISSION<br />
To provide reliable, cost effective and environmentally compliant electric generation in a safe work<br />
environment to service the needs <strong>of</strong> our customers.<br />
CORE SERVICES<br />
To meet the electric needs <strong>of</strong> our customers, <strong>Lakeland</strong> Electric has a generation capacity <strong>of</strong><br />
approximately 1,000 megawatts (mw) <strong>of</strong> which 21% is coal-fired and 79% is gas and oil. The fuel mix<br />
<strong>of</strong> the energy generated for FY 2006 was 42% natural gas, 55% coal/petroleum coke and 3% oil.<br />
<strong>Lakeland</strong> Electric is a member <strong>of</strong> the Florida Municipal Power Pool (FMPP) with Orlando Utility<br />
Commission (OUC) and Florida Municipal Power Agency (FMPA). The purpose <strong>of</strong> the pool is to provide<br />
economic dispatch <strong>of</strong> the pooled generation power to meet the needs <strong>of</strong> the members. FMPP operates<br />
an hourly energy pool with all members’ capacity committed and dispatched jointly. To reduce the<br />
volatility <strong>of</strong> fuel prices and lower fuel costs, a fuel hedging program is utilized.<br />
Unit 3, the coal unit, is jointly owned with OUC holding a 40% undivided interest in the unit.<br />
OPERATIONAL AND/OR PUBLIC SERVICE LEVELS<br />
Item Measured<br />
Major Units Available for<br />
Generation (EAF)<br />
Major Units (EFOR) - Forced<br />
Outage (not planned) Time<br />
Safety – Lost Time Incidents<br />
(LTI)<br />
Byproduct Revenue<br />
(Gypsum and Ash)<br />
2004<br />
Actual<br />
2005<br />
Actual<br />
2006<br />
Actual<br />
2007<br />
Projected<br />
<strong>2008</strong><br />
Proposed<br />
80.29% 77.48% 83.02% 86.50% 86.97%<br />
6.42% 8.54% 12.91% 6.98% 8.92%<br />
7 7 7 ≤ 3 ≤ 3<br />
$0 $3,195 $230,918 $464,842 $1,062,946<br />
TABLE OF ORGANIZATION<br />
Please see the Energy Production Table <strong>of</strong> Organization and workgroup support on<br />
page G-35.<br />
D-138 Fiscal Year <strong>2008</strong> Annual Budget
Energy Production<br />
2007-08<br />
Experience Budget Experience Proposed<br />
For Year For Year 2006-07 by<br />
EXPENSES 2005-06 2006-07 Estimated <strong>City</strong> Manager<br />
Personnel<br />
Salaries & Wages 11,618,443 14,013,745 12,543,002 15,048,691<br />
Fringe Benefits 2,074,025 2,714,979 2,105,318 2,633,425<br />
Total Personnel 13,692,469 16,728,723 14,648,320 17,682,116<br />
Non-Personnel<br />
Internal Service Charges 6,376,639 6,779,622 6,291,400 7,845,518<br />
Pr<strong>of</strong>essional & Contractual 5,085,403 5,933,826 5,052,524 5,164,235<br />
Utilities 740,343 722,793 688,174 701,237<br />
Insurance and Fixed Charges 1,637,567 2,268,667 1,651,037 2,000,118<br />
All Other Operations and Maintenance 263,967,785 256,136,434 259,680,574 238,965,118<br />
Capital Outlay 9,783,278 7,305,037 7,305,037 21,928,235<br />
Debt Service 26,312,933 28,595,000 28,587,286 29,595,940<br />
Total Non-Personnel 313,903,948 307,741,378 309,256,031 306,200,402<br />
Total Expenditures 327,596,417 324,470,102 323,904,352 323,882,518<br />
Net Transfers<br />
Revenue Sources<br />
Taxes<br />
Licenses & Permits<br />
Intergovernmental<br />
Charges for Services 335,006,516 337,372,936 339,508,358 341,522,208<br />
Interest Income 3,027,352 3,126,925 2,460,044 2,388,320<br />
All Other Revenue<br />
Total Revenue 338,033,869 340,499,861 341,968,402 343,910,528<br />
Funding to be Provided (10,437,452) (16,029,760) (18,064,050) (20,028,010)<br />
D-139 Fiscal Year <strong>2008</strong> Annual Budget
Energy Transmission and Distribution<br />
MISSION<br />
To safely, reliably, and efficiently deliver electric power from <strong>Lakeland</strong> Electric’s generation facilities and<br />
interconnections with other utilities to our customers throughout the 258 square mile utility service area.<br />
CORE SERVICES<br />
Energy Transmission and Distribution is responsible for the short range planning, design, construction,<br />
operation and maintenance <strong>of</strong> all electric transmission and distribution lines, substations and electrical<br />
service connections to all residential, commercial and industrial customers. Additional services include<br />
providing private area lighting and roadway lighting services.<br />
OPERATIONAL AND/OR PUBLIC SERVICE LEVELS<br />
Item Measured<br />
Installations<br />
(Completed within 2 days)<br />
2005<br />
Actual<br />
2006<br />
Actual<br />
2007<br />
Projected<br />
<strong>2008</strong><br />
Proposed<br />
93% 98% 90% 95%<br />
Service Reliability (Availability) 99.971% 99.971% 99.976% 99.98%<br />
Accounts Served 117,430 119,897 122,083 124,041<br />
Energy Delivered to Customers<br />
(GWHr *)<br />
2,783 2,880 2,885 2,955<br />
Safety—Lost Time Incidents (LTI) 11 6 5 5<br />
PERFORMANCE MEASURES (KSI’S)<br />
GOAL: Quality <strong>of</strong> LIfe<br />
OUTCOME: Superior Municipal Services<br />
KSI: Electric Service Reliability<br />
Objective: Measure Electric Service Reliability<br />
Key Success Indicators<br />
2005 2006 2007 <strong>2008</strong><br />
Goal Actual Goal Actual Projected Proposed<br />
Service Reliability (SAIDI) 133 154 133 151 128 128<br />
Service Reliability (CAIDI) 80.8 74.9 80.6 78.8 77.6 78<br />
Service Reliability:<br />
System Average Interruption Duration Index (SAIDI): Measures the total annual power outage duration (in<br />
minutes) for the average customer. Customer Average Interruption Duration Index (CAIDI): Measures the<br />
average restoration time (in minutes) experienced by the customers who had service interruptions.<br />
D-140 Fiscal Year <strong>2008</strong> Annual Budget
Energy Transmission and Distribution<br />
TABLE OF ORGANIZATION<br />
Please see the Energy Delivery Table <strong>of</strong> Organization and workgroup support on<br />
page G-29.<br />
2007-08<br />
Experience Budget Experience Proposed<br />
For Year For Year 2006-07 by<br />
EXPENSES 2005-06 2006-07 Estimated <strong>City</strong> Manager<br />
Personnel<br />
Salaries & Wages 8,810,271 9,945,258 9,888,224 10,341,508<br />
Fringe Benefits 2,432,717 2,772,897 2,685,993 2,871,470<br />
Total Personnel 11,242,988 12,718,155 12,574,217 13,212,978<br />
Non-Personnel<br />
Internal Service Charges 1,638,186 2,438,359 1,572,229 2,345,916<br />
Pr<strong>of</strong>essional & Contractual 3,309,496 3,598,073 3,234,694 3,766,695<br />
Utilities 280,279 237,649 269,174 286,580<br />
Insurance and Fixed Charges 179,662 230,787 179,286 199,082<br />
All Other Operations and Maintenance 1,472,937 1,928,729 1,544,385 1,983,717<br />
Capital Outlay 11,125,071 9,135,999 9,227,753 13,370,933<br />
Debt Service 11,276,971 12,255,000 12,251,694 12,683,974<br />
Total Non-Personnel 29,282,601 29,824,596 28,279,215 34,636,897<br />
Total Expenditures 40,525,589 42,542,752 40,853,432 47,849,875<br />
Net Transfers<br />
Revenue Sources<br />
Taxes<br />
Licenses & Permits<br />
Intergovernmental<br />
Charges for Services 41,442,261 44,234,501 42,821,535 50,455,934<br />
Interest Income 412,821 426,399 335,461 325,680<br />
All Other Revenue<br />
Total Revenue 41,855,082 44,660,900 43,156,996 50,781,614<br />
Funding to be Provided (1,329,493) (2,118,148) (2,303,564) (2,931,739)<br />
D-141 Fiscal Year <strong>2008</strong> Annual Budget
Utility Billing and Customer Service<br />
MISSION<br />
To create and maintain quality utility billing and customer service in a customer focused and cost<br />
efficient environment which meets or exceeds customers needs and expectations while developing and<br />
managing resources vital to the <strong>City</strong> <strong>of</strong> <strong>Lakeland</strong>’s success and pursuit <strong>of</strong> excellence.<br />
CORE SERVICES<br />
Utility Billing and Customer Service responsibilities include activating and maintaining residential and<br />
commercial utility accounts; billing and collections <strong>of</strong> utility revenues; processing field services connect/<br />
disconnect work orders; reading customer meters; installing and maintaining residential surge<br />
protection; handling large commercial account customer inquiries; conducting residential and<br />
commercial audits; managing utility marketing products and programs and investigating utility<br />
consumption theft claims.<br />
OPERATIONAL AND/OR PUBLIC SERVICE LEVELS<br />
Item Measured<br />
2004<br />
Actual<br />
2005<br />
Actual<br />
2006<br />
Actual<br />
2007<br />
Projected<br />
<strong>2008</strong><br />
Proposed<br />
Uncollectible as % <strong>of</strong> Revenue .5% .5% .4% .5% .4%<br />
Annual Customer Service expense per<br />
customer<br />
$66.50 $62.27 $65.45 $77.96 $77.00<br />
Percent <strong>of</strong> revenue 60-90 days arrears 1.80% 1.55% 1.34% 0.88% 0.60%<br />
% <strong>of</strong> time CSR’s spend on in-bound<br />
customer calls<br />
78% 75% 73% 78% 80%<br />
Percent <strong>of</strong> eligible customer<br />
disconnects worked (to pay<br />
100% 100% 100% 100% 95%<br />
outstanding and reconnect)<br />
Average time to answer customer<br />
service call (seconds)<br />
91 158 80 82 72<br />
% <strong>of</strong> meters read accurately 99.96% 99.94% 99.90% 99.92% 99.95%<br />
Safety—Lost Time Incidents (LTI) 6 4 3 0 0<br />
D-142 Fiscal Year <strong>2008</strong> Annual Budget
Utility Billing and Customer Service<br />
PERFORMANCE MEASURES (KSI’S)<br />
GOAL: Economic Opportunity<br />
OUTCOME: Sustainable Business Environment<br />
KSI: Utility Customer Account Numbers (% change) (<strong>2008</strong> Goal: 2.51%)<br />
Objective: Percent change from previous year <strong>of</strong> number <strong>of</strong> residential and non-residential<br />
active locations<br />
GOAL: Fiscal Management<br />
OUTCOME: Optimal Management <strong>of</strong> Existing Financial Resources<br />
KSI: Electric Utility Rate (<strong>2008</strong> Goal: Maintain current non-fuel retail rates-no increase.)<br />
Objective: Electric Utility rates (predefined benchmark)<br />
NEW INITIATIVES<br />
Growth Management<br />
• Implement Technology Advances - Implement Meter Reading Route Management and Field Service<br />
Mobile Workforce tools to balance workload and improve accuracy.<br />
TABLE OF ORGANIZATION<br />
Please see the following Tables <strong>of</strong> Organization:<br />
• Customer Billing is part <strong>of</strong> the Finance Department. See Department Table <strong>of</strong><br />
Organization on page G-49.<br />
• <strong>Lakeland</strong> Electric Customer Service. See department Table <strong>of</strong> Organization on<br />
page G-22.<br />
D-143 Fiscal Year <strong>2008</strong> Annual Budget
Utility Billing and Customer Service<br />
2007-08<br />
Experience Budget Experience Proposed<br />
For Year For Year 2006-07 by<br />
EXPENSES 2005-06 2006-07 Estimated <strong>City</strong> Manager<br />
Personnel<br />
Salaries & Wages 2,355,288 3,168,057 2,540,464 3,076,207<br />
Fringe Benefits 490,508 742,145 512,943 687,214<br />
Total Personnel 2,845,796 3,910,202 3,053,407 3,763,421<br />
Non-Personnel<br />
Internal Service Charges 1,676,139 1,686,242 1,731,351 1,741,476<br />
Pr<strong>of</strong>essional & Contractual 480,314 943,989 391,673 746,833<br />
Utilities 65,651 71,299 62,004 53,554<br />
Insurance and Fixed Charges 217,445 251,466 224,989 201,040<br />
All Other Operations and Maintenance 3,147,706 3,303,759 2,646,006 3,045,167<br />
Capital Outlay 714,862 389,486 389,486 1,267,832<br />
Debt Service 382,024<br />
Total Non-Personnel 6,302,117 6,646,241 5,445,508 7,437,926<br />
Total Expenditures 9,147,913 10,556,444 8,498,915 11,201,347<br />
Net Transfers<br />
Revenue Sources<br />
Taxes<br />
Licenses & Permits<br />
Intergovernmental<br />
Charges for Services 9,354,835 10,976,230 8,908,347 11,811,409<br />
Interest Income 283,475 299,000 363,244 300,000<br />
All Other Revenue 1,125,625 142,633 10,324,468 139,300<br />
Total Revenue 10,763,935 11,417,863 19,596,060 12,250,709<br />
Funding to be Provided (1,616,022) (861,419) (11,097,145) (1,049,362)<br />
D-144 Fiscal Year <strong>2008</strong> Annual Budget
Water Treatment and Distribution<br />
MISSION<br />
To provide an adequate amount <strong>of</strong> potable water for domestic use and fire protection services while<br />
meeting or exceeding required governmental guidelines at a cost competitive with comparable communities<br />
throughout the state.<br />
CORE SERVICES<br />
Provide an excellent and reliable product, meeting public health standards by providing water plant<br />
maintenance and operations, water purification, cost effective treatment and related actions involving<br />
engineering and administration. Distribution facilities and associated equipment are maintained to provide<br />
reliable service at an established level <strong>of</strong> efficiency.<br />
OPERATIONAL AND/OR PUBLIC SERVICE LEVELS<br />
Item Measured<br />
Water Treated<br />
(Million Gallons)<br />
Water Pumped Average/Day<br />
(Million Gallons)<br />
Water Pumped Maximum/Day<br />
(Million Gallons)<br />
Treatment Cost<br />
(per 1,000 Gallons)<br />
Distribution Cost<br />
(per 1,000 Gallons)<br />
Cost <strong>of</strong> Service<br />
(per 1,000 Gallons)<br />
Water Losses<br />
(% <strong>of</strong> Pumped)<br />
2004<br />
Actual<br />
2005<br />
Actual<br />
2006<br />
Actual<br />
2007<br />
Projected<br />
<strong>2008</strong><br />
Projected<br />
8,604 8,846 9,486 9,300 10,468<br />
23.50 24.20 25.99 25.48 28.68<br />
39.10 39.15 40.07 33.00 32.57<br />
$0.37 $0.43 $.53 $.58 $.58<br />
$0.23 $0.24 $.27 $.29 $.29<br />
$0.91 $0.99 $1.11 $1.23 $1.27<br />
5.53% 9.29% 7.09% 7.00% 7.50%<br />
PERFORMANCE MEASURES (KSI’S)<br />
GOAL: Fiscal Management<br />
OUTCOME: Optimal Management <strong>of</strong> Existing Financial Resources<br />
KSI: Water Utility Rate (<strong>2008</strong> Goal: No Increase)<br />
Objective: Water Utility rate (predefined benchmark)<br />
GOAL: Economic Opportunity<br />
OUTCOME: Sustainable Business Environment<br />
KSI: Utility customer account numbers (<strong>2008</strong> Goal: 1% Increase)<br />
Objective: Percent change from previous year <strong>of</strong> number <strong>of</strong> residential and non-residential<br />
active locations<br />
D-145 Fiscal Year <strong>2008</strong> Annual Budget
Water Treatment and Distribution<br />
NEW INITIATIVES<br />
Quality <strong>of</strong> Life:<br />
• The department will unveil a comprehensive water conservation program jointly funded by the South<br />
West Florida Water Management District. This multi phase program will <strong>of</strong>fer opportunities for<br />
customers to reduce and control the amount <strong>of</strong> water they consume and will include education and<br />
enforcement.<br />
TABLE OF ORGANIZATION<br />
Please see the following Tables <strong>of</strong> Organization:<br />
• Water Distribution is part <strong>of</strong> Water Utilities. See Department Table <strong>of</strong><br />
Organization on page G-79.<br />
• Water Production is part <strong>of</strong> Water Utilities. See department Table <strong>of</strong> Organization<br />
on page G-81.<br />
D-146 Fiscal Year <strong>2008</strong> Annual Budget
Water Treatment and Distribution<br />
2007-08<br />
Experience Budget Experience Proposed<br />
For Year For Year 2006-07 by<br />
EXPENSES 2005-06 2006-07 Estimated <strong>City</strong> Manager<br />
Personnel<br />
Salaries & Wages 3,548,237 3,858,601 3,301,665 3,942,040<br />
Fringe Benefits 742,567 862,107 776,610 943,058<br />
Total Personnel 4,290,804 4,720,708 4,078,275 4,885,098<br />
Non-Personnel<br />
Internal Service Charges 2,355,277 2,972,701 2,896,126 3,249,802<br />
Pr<strong>of</strong>essional & Contractual 592,960 1,003,831 975,786 814,210<br />
Utilities 1,829,266 1,810,862 1,872,820 1,910,569<br />
Insurance and Fixed Charges 304,295 318,585 318,585 336,292<br />
All Other Operations and Maintenance 977,674 1,154,911 1,117,204 2,154,293<br />
Capital Outlay 10,237,755 13,398,889 13,398,889 6,297,689<br />
Debt Service 4,383,117 4,447,359 4,449,265 4,437,830<br />
Total Non-Personnel 20,680,344 25,107,138 25,028,676 19,200,685<br />
Total Expenditures 24,971,148 29,827,846 29,106,951 24,085,783<br />
Net Transfers<br />
Revenue Sources<br />
Taxes<br />
Licenses & Permits<br />
Intergovernmental 333,500<br />
Charges for Services 25,071,411 23,298,670 24,843,888 25,112,343<br />
Interest Income 801,953 869,698 989,247 998,767<br />
All Other Revenue 23,559 8,500 11,040 9,246<br />
Total Revenue 25,896,923 24,176,868 25,844,175 26,453,855<br />
Funding to be Provided (925,775) 5,650,978 3,262,776 (2,368,072)<br />
D-147 Fiscal Year <strong>2008</strong> Annual Budget
Wastewater Collection and Treatment<br />
MISSION<br />
To provide customers in the <strong>City</strong> <strong>of</strong> <strong>Lakeland</strong>’s service territory with a sufficient sewerage collection and<br />
treatment system to treat and dispose <strong>of</strong> all wastewater and residual products.<br />
CORE SERVICES<br />
Utilizing the two Wastewater Treatment Plants (WWTP), Glendale and Northside, services include the cost<br />
effective collection and treatment <strong>of</strong> wastewater products originating from household, commercial, and<br />
industrial establishments located within the <strong>City</strong>’s service territory. Included in the treatment process is the<br />
removal <strong>of</strong> solids which leads to the production <strong>of</strong> Class A / B sludge and reclaimed water meeting<br />
industrial reuse standards.<br />
OPERATIONAL AND/OR PUBLIC SERVICE LEVELS<br />
Item Measured<br />
Wastewater Treated<br />
(Million Gallons)<br />
Average/Day Wastewater Daily<br />
Average Treated (Million Gallons)<br />
Maximum/Day Wastewater<br />
Maximum Daily Treated<br />
(Million Gallons)<br />
Treatment Cost<br />
(per 1,000 Gallons)<br />
Collection Cost<br />
(per 1,000 Gallons)<br />
Cost <strong>of</strong> Service<br />
(per 1,000 Gallons)<br />
Number <strong>of</strong> Spills<br />
(per Year)<br />
2004<br />
Actual<br />
2005<br />
Actual<br />
2006<br />
Actual<br />
2007<br />
Projected<br />
<strong>2008</strong><br />
Projected<br />
4,263 4,380 3,801 4,015 4,200<br />
11.68 12.00 10.43 11.00 11.50<br />
21.07 25.00 17.60 17.00 18.00<br />
$1.22 $1.50 $1.78 $1.94 $1.70<br />
$.21 $.62 $.67 $.70 $.87<br />
$2.25 $2.64 $3.14 $3.56 $3.19<br />
6 2 2 2 2<br />
PERFORMANCE MEASURES (KSI’S)<br />
GOAL: Fiscal Management<br />
OUTCOME: Optimal Management <strong>of</strong> Existing Financial Resources<br />
KSI: Wastewater Rate (<strong>2008</strong> Goal: ≤7.5% Rate Increase)<br />
Objective: Wastewater Utility rates (predefined benchmark)<br />
GOAL: Economic Opportunity<br />
OUTCOME: Sustainable Business Environment<br />
KSI: Utility customer account numbers (<strong>2008</strong> Goal: 1% Increase)<br />
Objective: Active accounts residential and non-residential<br />
D-148 Fiscal Year <strong>2008</strong> Annual Budget
Wastewater Collection and Treatment<br />
TABLE OF ORGANIZATION<br />
Please see the following Tables <strong>of</strong> Organization beginning on page G-74:<br />
• Wastewater Administration<br />
• Wastewater Collection, and<br />
• Wastewater Treatment<br />
2007-08<br />
Experience Budget Experience Proposed<br />
For Year For Year 2006-07 by<br />
EXPENSES 2005-06 2006-07 Estimated <strong>City</strong> Manager<br />
Personnel<br />
Salaries & Wages 3,395,811 3,727,828 3,163,851 3,834,008<br />
Fringe Benefits 783,204 898,734 711,909 1,028,990<br />
Total Personnel 4,179,015 4,626,562 3,875,760 4,862,998<br />
Non-Personnel<br />
Internal Service Charges 1,809,065 2,286,487 2,217,098 2,437,530<br />
Pr<strong>of</strong>essional & Contractual 887,088 953,368 938,153 1,375,861<br />
Utilities 1,824,480 1,930,850 1,862,605 1,971,491<br />
Insurance and Fixed Charges 260,338 270,371 270,371 360,255<br />
All Other Operations and Maintenance 2,947,242 4,210,265 3,817,202 2,093,225<br />
Capital Outlay 11,392,032 46,736,628 46,736,628 18,284,484<br />
Debt Service 2,173,863 2,174,614 2,174,614 3,141,549<br />
Total Non-Personnel 21,294,108 58,562,583 58,016,672 29,664,395<br />
Total Expenditures 25,473,123 63,189,145 61,892,432 34,527,393<br />
Net Transfers<br />
Revenue Sources<br />
Taxes<br />
Licenses & Permits<br />
Intergovernmental<br />
Charges for Services 19,792,183 19,454,188 19,778,440 21,659,883<br />
Interest Income 523,175 232,042 242,077 238,594<br />
All Other Revenue 5,947,367 36,062,557 36,065,057 14,901,500<br />
Total Revenue 26,262,725 55,748,787 56,085,574 36,799,977<br />
Funding to be Provided (789,602) 7,440,358 5,806,858 (2,272,584)<br />
D-149 Fiscal Year <strong>2008</strong> Annual Budget
Residential Solid Waste Management<br />
MISSION<br />
To provide the citizens and businesses <strong>of</strong> <strong>Lakeland</strong> with efficient, reliable, cost effective and<br />
environmentally conscious residential solid waste collection services.<br />
CORE SERVICES<br />
The Solid Waste Management Division provides twice a week curbside collection service to residential<br />
customers for municipal solid waste Monday/Thursday or Tuesday/Friday, depending on neighborhood<br />
collection schedules, and regular yard trash collection on Wednesday. Also, bulk yard trash (limitation <strong>of</strong><br />
up to 20 cubic yards once a quarter), appliances, junk, and tires (customer must call for pick-up) are<br />
collected at no additional cost to the residential customer.<br />
TABLE OF ORGANIZATION<br />
This activity is supported by the Solid<br />
Waste Administrative staff. See the entire<br />
table <strong>of</strong> organization on page G-70.<br />
Legend<br />
Left number= 2007 FTE<br />
Right number= <strong>2008</strong> FTE<br />
D-150 Fiscal Year <strong>2008</strong> Annual Budget
Residential Solid Waste Management<br />
OPERATIONAL AND/OR PUBLIC SERVICE LEVELS<br />
2004 2005 2006 2007 FY <strong>2008</strong><br />
Item Measured Actual Actual Actual Projected Proposed<br />
Customers Serviced 32,840 37,400 41,200 42,800 43,490<br />
Garbage Tonnage 32,670 36,972 36,227 41,955 42,253<br />
Yard Waste Tonnage 22,250 19,319 15,128 16,032 20,250<br />
PERFORMANCE MEASURES (KSI’S)<br />
GOAL: Fiscal Management<br />
OUTCOME: Optimal Management <strong>of</strong> Existing Financial Resources<br />
KSI: Solid Waste Rate - Residential (<strong>2008</strong> Goal: Max. 5% fee increase.)<br />
Objective: Solid Waste Utility rates (predefined benchmark)<br />
D-151 Fiscal Year <strong>2008</strong> Annual Budget
Residential Solid Waste Management<br />
2007-08<br />
Experience Budget Experience Proposed<br />
For Year For Year 2006-07 by<br />
EXPENSES 2005-06 2006-07 Estimated <strong>City</strong> Manager<br />
Personnel<br />
Salaries & Wages 1,692,198 1,892,043 1,683,989 1,982,133<br />
Fringe Benefits 461,588 529,106 466,887 610,306<br />
Total Personnel 2,153,786 2,421,149 2,150,876 2,592,438<br />
Non-Personnel<br />
Internal Service Charges 1,984,044 2,152,018 2,070,310 1,969,095<br />
Pr<strong>of</strong>essional & Contractual 251,679 162,187 163,143 161,183<br />
Utilities 15,265 15,531 14,837 17,104<br />
Insurance and Fixed Charges 141,771 206,361 177,737 211,160<br />
All Other Operations and Maintenance 1,609,695 1,775,840 1,581,472 1,884,848<br />
Capital Outlay 65,505 65,505 215,724<br />
Debt Service<br />
Total Non-Personnel 4,002,455 4,377,442 4,073,004 4,459,114<br />
Total Expenditures 6,156,241 6,798,592 6,223,880 7,051,552<br />
Net Transfers<br />
Revenue Sources<br />
Taxes<br />
Licenses & Permits<br />
Intergovernmental 42,607<br />
Charges for Services 5,523,522 5,765,000 5,746,362 6,094,017<br />
Interest Income 22,179 27,276 55,682 48,237<br />
All Other Revenue 252,720 239,784 226,397 32,502<br />
Total Revenue 5,841,028 6,032,061 6,028,441 6,174,756<br />
Funding to be Provided 315,213 766,531 195,439 876,796<br />
D-152 Fiscal Year <strong>2008</strong> Annual Budget
Commercial Solid Waste Management<br />
MISSION<br />
To provide the citizens and businesses <strong>of</strong> <strong>Lakeland</strong> with efficient, reliable, cost effective, and<br />
environmentally conscious commercial solid waste collection services.<br />
CORE SERVICES<br />
The Solid Waste Management Division provides municipal solid waste collection for commercial<br />
customers one to six days per week by <strong>of</strong>fering Front-loader and Roll-Off service. Both services <strong>of</strong>fer<br />
various sizes <strong>of</strong> dumpster containers. Commercial yard trash collection and recycling collection are<br />
available on a fee based schedule. Growth <strong>of</strong> the Roll-<strong>of</strong>f program and its resources will occur as the<br />
market dictates its expansion.<br />
TABLE OF ORGANIZATION<br />
This activity is supported by the Solid<br />
Waste Administrative and Support<br />
Services staff. See the entire table <strong>of</strong><br />
organization on page G-70.<br />
Legend<br />
Left number= 2007 FTE<br />
Right number= <strong>2008</strong> FTE<br />
D-153 Fiscal Year <strong>2008</strong> Annual Budget
Commercial Solid Waste Management<br />
OPERATIONAL AND/OR PUBLIC SERVICE LEVELS<br />
2004 2005 2006 2007 FY <strong>2008</strong><br />
Item Measured Actual Actual Actual Projected Proposed<br />
Customers Serviced 4,133 4,800 4,920 5,052 5,182<br />
Garbage Tonnage 37,659 41,654 39,202 37,900 40,556<br />
Roll-Off Tonnage 2,017 4,395 5,435 5,200 6,522<br />
Yard Waste Tonnage 1,225 1,820 1,259 1,900 2,500<br />
PERFORMANCE MEASURES (KSI’S)<br />
GOAL: Fiscal Management<br />
OUTCOME: Optimal Management <strong>of</strong> Existing Financial Resources<br />
KSI: Solid Waste Rate - Commercial (<strong>2008</strong> Goal: Maximum 5% fee increase.)<br />
Objective: Solid Waste Utility rates (predefined benchmark)<br />
D-154 Fiscal Year <strong>2008</strong> Annual Budget
Commercial Solid Waste Management<br />
2007-08<br />
Experience Budget Experience Proposed<br />
For Year For Year 2006-07 by<br />
EXPENSES 2005-06 2006-07 Estimated <strong>City</strong> Manager<br />
Personnel<br />
Salaries & Wages 408,426 610,717 442,760 616,911<br />
Fringe Benefits 115,892 179,065 128,470 203,342<br />
Total Personnel 524,317 789,782 571,230 820,253<br />
Non-Personnel<br />
Internal Service Charges 961,527 1,072,515 989,281 1,088,783<br />
Pr<strong>of</strong>essional & Contractual 27,638 56,864 57,369 54,329<br />
Utilities 8,077 8,217 7,850 9,049<br />
Insurance and Fixed Charges 75,010 109,184 94,039 111,723<br />
All Other Operations and Maintenance 1,480,030 1,713,905 1,319,561 1,622,517<br />
Capital Outlay 18,416 27,671 21,133 114,138<br />
Debt Service<br />
Total Non-Personnel 2,570,698 2,988,356 2,489,234 3,000,541<br />
Total Expenditures 3,095,016 3,778,139 3,060,464 3,820,794<br />
Net Transfers<br />
Revenue Sources<br />
Taxes<br />
Licenses & Permits<br />
Intergovernmental<br />
Charges for Services 5,050,507 5,494,000 5,492,574 5,813,772<br />
Interest Income 11,735 14,432 29,461 25,522<br />
All Other Revenue 54,349 39,568 32,485 17,197<br />
Total Revenue 5,116,590 5,548,000 5,554,520 5,856,491<br />
Funding to be Provided (2,021,575) (1,769,861) (2,494,056) (2,035,697)<br />
D-155 Fiscal Year <strong>2008</strong> Annual Budget
Recycling Services<br />
MISSION<br />
To provide citizens and businesses <strong>of</strong> <strong>Lakeland</strong> with efficient, reliable, cost effective and<br />
environmentally conscious recycling collection services.<br />
CORE SERVICES<br />
The recycling program consists <strong>of</strong> 5 Residential Collection Drivers and 1 Multi-Family Collection Driver.<br />
Materials collected include aluminum and steel cans, clear and colored glass, newspapers, magazines,<br />
corrugated cardboard, #1 and #2 plastic bottles, and phonebooks. Seven drop-<strong>of</strong>f centers located<br />
throughout the <strong>City</strong> for collection <strong>of</strong> magazines, clear and colored glass with three <strong>of</strong> these collection<br />
sites that accept all recyclables. Phonebooks are collected annually at curbside and established drop-<strong>of</strong>f<br />
locations during January, February, and March. Educational programs and recycling presentations are<br />
available upon request.<br />
OPERATIONAL AND/OR PUBLIC SERVICE LEVELS<br />
Item Measured<br />
2004<br />
Actual<br />
2005<br />
Actual<br />
2006<br />
Actual<br />
2007<br />
Projected<br />
<strong>2008</strong><br />
Proposed<br />
Residential Program<br />
Participation<br />
30% 24% 26% 25% 26%<br />
Curbside Tonnage 2,496 2,490 2,678 2,900 2,982<br />
Commercial Tonnage 1,212 885 1,081 1,100 1,218<br />
Scrap Metal Tonnage 168 144 81 106 110<br />
Waste Tire Tonnage 687 682 693 690 722<br />
PERFORMANCE MEASURES (KSI’S)<br />
GOAL: Fiscal Management<br />
OUTCOME: Optimal Management <strong>of</strong> Existing Financial Resources<br />
KSI: Solid Waste Rate - Recycle (<strong>2008</strong> Goal: Remain revenue neutral with no fee increase.)<br />
Objective: Solid Waste Utility rates (predefined benchmark)<br />
D-156 Fiscal Year <strong>2008</strong> Annual Budget
Recycling Services<br />
TABLE OF ORGANIZATION<br />
This activity is supported by the Solid<br />
Waste Administrative and Support<br />
Services staff. See the entire table <strong>of</strong><br />
organization on page G-70.<br />
Legend<br />
Left number= 2007 FTE<br />
Right number= <strong>2008</strong> FTE<br />
D-157 Fiscal Year <strong>2008</strong> Annual Budget
Recycling Services<br />
2007-08<br />
Experience Budget Experience Proposed<br />
For Year For Year 2006-07 by<br />
EXPENSES 2005-06 2006-07 Estimated <strong>City</strong> Manager<br />
Personnel<br />
Salaries & Wages 194,113 225,785 263,213 232,780<br />
Fringe Benefits 44,732 65,943 66,367 64,478<br />
Total Personnel 238,844 291,728 329,580 297,258<br />
Non-Personnel<br />
Internal Service Charges 355,755 485,790 347,392 558,070<br />
Pr<strong>of</strong>essional & Contractual 2,132 2,791 2,923 2,130<br />
Utilities 2,250 2,494 2,049 2,362<br />
Insurance and Fixed Charges 19,575 28,493 24,541 29,156<br />
All Other Operations and Maintenance 32,605 46,128 46,078 47,046<br />
Capital Outlay 166,589 166,589 29,786<br />
Debt Service 272,134 155,977 155,978 155,978<br />
Total Non-Personnel 684,451 888,262 745,548 824,527<br />
Total Expenditures 923,295 1,179,990 1,075,129 1,121,785<br />
Net Transfers<br />
Revenue Sources<br />
Taxes<br />
Licenses & Permits<br />
Intergovernmental<br />
Charges for Services 702,214 722,000 722,800 732,800<br />
Interest Income 3,062 3,766 7,688 6,660<br />
All Other Revenue 226,566 240,326 227,855 236,788<br />
Total Revenue 931,842 966,092 958,344 976,248<br />
Funding to be Provided (8,547) 213,898 116,785 145,537<br />
D-158 Fiscal Year <strong>2008</strong> Annual Budget
Lakes and Stormwater Management<br />
MISSION<br />
To provide programs and services for the preservation and enhancement <strong>of</strong> surface water and other<br />
natural resources in the <strong>City</strong> including flood control and stormwater infrastructure.<br />
CORE SERVICES<br />
Includes planning, construction, operation and maintenance <strong>of</strong> facilities designed to enhance the quality<br />
and conveyance <strong>of</strong> surface waters and prevent flooding. Protection <strong>of</strong> lakes and streams, through<br />
watershed management principles, to develop projects and programs that enhance water quality and<br />
other natural resources in the <strong>City</strong>’s lakes, streams and wetlands.<br />
The retr<strong>of</strong>itting <strong>of</strong> stormwater infrastructure to provide treatment <strong>of</strong> run<strong>of</strong>f is a major component <strong>of</strong> this<br />
service as stormwater is a significant source <strong>of</strong> pollutant-loading to lakes and streams. Engineering<br />
studies and construction projects to address local flooding problems. Control <strong>of</strong> water levels in lakes<br />
and other water bodies through the development <strong>of</strong> fluctuation schedules and by operating water level<br />
control structures.<br />
Permitting and enforcement <strong>of</strong> <strong>City</strong> regulations pertaining to construction in lakes and discharges to the<br />
<strong>City</strong>’s stormwater system required under the <strong>City</strong>’s United States Environmental Protection Agency<br />
(USEPA) and Stormwater National Pollution Discharge Elimination System (NPDES) Municipal Separate<br />
Storm Sewer System permit.<br />
Participation in a variety <strong>of</strong> educational programs throughout the community to create awareness and<br />
cooperation in the protection <strong>of</strong> the <strong>City</strong>’s natural resources. Volunteers assist staff in implementing<br />
watershed projects through the Adopt-A-Lake program and the monitoring <strong>of</strong> water quality in the major<br />
lakes. Aquatic plant management involving both the planting <strong>of</strong> desirable vegetation and the removal <strong>of</strong><br />
exotic and nuisance plants.<br />
TABLE OF ORGANIZATION<br />
Legend<br />
Left number= 2007 FTE<br />
Right number= <strong>2008</strong> FTE<br />
D-159 Fiscal Year <strong>2008</strong> Annual Budget
Lakes and Stormwater Management<br />
2007-08<br />
Experience Budget Experience Proposed<br />
For Year For Year 2006-07 by<br />
EXPENSES 2005-06 2006-07 Estimated <strong>City</strong> Manager<br />
Personnel<br />
Salaries & Wages 315,604 350,210 308,181 268,209<br />
Fringe Benefits 25,194 64,051 25,799 70,319<br />
Total Personnel 340,798 414,261 333,979 338,528<br />
Non-Personnel<br />
Internal Service Charges 156,437 181,389 168,908 134,169<br />
Pr<strong>of</strong>essional & Contractual 567 168 168<br />
Utilities 3,208 3,892 3,624 1,195<br />
Insurance and Fixed Charges<br />
All Other Operations and Maintenance 748,802 785,590 783,728 394,950<br />
Capital Outlay 2,233,060 6,252,711 5,584,801 5,051,457<br />
Debt Service<br />
Total Non-Personnel 3,142,074 7,223,750 6,541,229 5,581,771<br />
Total Expenditures 3,482,871 7,638,011 6,875,208 5,920,299<br />
Net Transfers<br />
Revenue Sources<br />
Taxes<br />
Licenses & Permits<br />
Intergovernmental 403,923 1,346,562 1,096,562 2,674,717<br />
Charges for Services 1,395,400 1,413,067 1,413,067 3,315,596<br />
Interest Income 92,176 61,819 61,819 100,830<br />
All Other Revenue 21,947<br />
Total Revenue 1,913,447 2,821,448 2,571,448 6,091,143<br />
Funding to be Provided 1,569,425 4,816,563 4,303,760 (170,844)<br />
D-160 Fiscal Year <strong>2008</strong> Annual Budget
CITY OF LAKELAND<br />
<strong>2008</strong><br />
Cultural and Community<br />
Services<br />
Program<br />
Activity<br />
Page<br />
Library Services D-164<br />
Cultural Support Services D-166<br />
The <strong>Lakeland</strong> Center D-168<br />
Public Information Services D-171<br />
D-161 Fiscal Year <strong>2008</strong> Annual Budget
Cultural and Community Services<br />
Public Information<br />
Services<br />
1%<br />
Library Services<br />
26%<br />
Cultural Support Services<br />
12%<br />
The <strong>Lakeland</strong> Center<br />
61%<br />
D-162 Fiscal Year <strong>2008</strong> Annual Budget
Cultural and Community Services<br />
Experience Budget Experience FY 2007-08<br />
For Year For Year 2006-07 Proposed By<br />
EXPENSES 2005-06 2006-07 Estimated <strong>City</strong> Manager<br />
Personnel<br />
Salaries and Wages 3,862,451 4,464,736 4,535,372 4,641,518<br />
Fringe Benefits 696,167 690,244 811,903 941,690<br />
Total Personnel 4,558,618 5,154,980 5,347,274 5,583,208<br />
Non-Personnel<br />
Internal Service Charges 1,007,259 997,158 995,231 1,064,782<br />
Pr<strong>of</strong>essional and Contractual 1,438,167 1,460,239 1,458,615 1,599,951<br />
Utilities 1,059,807 879,789 1,117,397 1,149,349<br />
Insurance and Fixed Charges 170,237 202,837 168,230 213,095<br />
All Other Operations and Maintenance 2,609,336 3,019,365 2,817,056 2,754,763<br />
Capital Outlay 1,624,923 1,223,095 1,231,586 1,000,794<br />
Debt Service 1,592,861 1,584,662 1,584,662 1,568,662<br />
Total Non-Personnel 9,502,591 9,367,145 9,372,776 9,351,396<br />
Total Expenditures 14,061,209 14,522,125 14,720,050 14,934,604<br />
Net Transfers<br />
Revenue Sources<br />
Taxes<br />
Licenses and Permits<br />
Intergovernmental 1,841,809 2,028,196 2,188,110 1,886,250<br />
Charges for Services 4,533,161 4,463,093 4,964,995 5,211,147<br />
Interest Income 108,381 145,178 143,592 116,518<br />
All Other Revenue 324,142 319,497 268,497 345,883<br />
Total Revenue 6,807,493 6,955,964 7,565,194 7,559,798<br />
Funding to be Provided 7,253,716 7,566,161 7,154,856 7,374,806<br />
D-163 Fiscal Year <strong>2008</strong> Annual Budget
Library Services<br />
MISSION<br />
To provide high quality public library services in response to the pursuit <strong>of</strong> education, recreation and<br />
information.<br />
CORE SERVICES<br />
Delivery <strong>of</strong> traditional library services (material loans, reference and programming for children/adults<br />
etc.), local history resources, government documents, internet access and meeting rooms available for<br />
library patrons. Access to the Library’s collection and research databases is <strong>of</strong>fered through the<br />
<strong>Lakeland</strong>gov.net website or by visiting the Main Library, the Larry R. Jackson Branch Library or the new<br />
e-library South <strong>Lakeland</strong> at Lake Miriam Square. <strong>Lakeland</strong> is a member <strong>of</strong> the Polk County Library<br />
Cooperative (PCLC) and serves Polk County residents free <strong>of</strong> charge.<br />
OPERATIONAL AND/OR PUBLIC SERVICE LEVELS<br />
2004 2005 2006 2007 <strong>2008</strong><br />
Item Measured Actual Actual Actual Projected Proposed<br />
Circulation 639,169 660,205 632,896 650,000 667,100<br />
Visitors 520,715 552,526 553,150 575,276 578,000<br />
Reference Questions 166,869 178,485 188,400 182,000 185,000<br />
Revenue (fines/fees) $43,498 $36,991 $47,287 $50,000 $53,000<br />
Items in Collection 256,303 259,335 256,243 265,000 267,750<br />
PERFORMANCE MEASURES (KSI’S)<br />
GOAL: Quality <strong>of</strong> Life Goal<br />
OUTCOME: Support Education<br />
KSI: Library Circulation - Usage (<strong>2008</strong> Goal—685,000)<br />
Objective: Usage <strong>of</strong> library resources (media).<br />
D-164 Fiscal Year <strong>2008</strong> Annual Budget
Library Services<br />
TABLE OF ORGANIZATION<br />
Library Services are part <strong>of</strong> the Parks & Recreation Table <strong>of</strong> Organization, See page G-57.<br />
2007-08<br />
Experience Budget Experience Proposed<br />
For Year For Year 2006-07 by<br />
EXPENSES 2005-06 2006-07 Estimated <strong>City</strong> Manager<br />
Personnel<br />
Salaries & Wages 1,314,102 1,638,972 1,529,058 1,700,898<br />
Fringe Benefits 266,948 323,358 292,209 368,015<br />
Total Personnel 1,581,050 1,962,330 1,821,267 2,068,913<br />
Non-Personnel<br />
Internal Service Charges 301,871 270,295 267,940 310,607<br />
Pr<strong>of</strong>essional & Contractual 22,906 35,649 35,990 25,324<br />
Utilities 110,385 108,512 108,452 122,876<br />
Insurance and Fixed Charges 42,951 54,083 51,022 55,801<br />
All Other Operations and Maintenance 868,850 1,309,835 1,259,389 1,092,063<br />
Capital Outlay 1,437,198 456,185 456,185 202,421<br />
Debt Service<br />
Total Non-Personnel 2,784,161 2,234,559 2,178,978 1,809,091<br />
Total Expenditures 4,365,211 4,196,889 4,000,245 3,878,005<br />
Net Transfers<br />
Revenue Sources<br />
Taxes<br />
Licenses & Permits<br />
Intergovernmental 1,155,650 1,327,527 1,582,520 1,254,393<br />
Charges for Services 175 200 200<br />
Interest Income<br />
All Other Revenue 166,100 67,365 66,365 40,000<br />
Total Revenue 1,321,925 1,395,092 1,648,885 1,294,593<br />
Funding to be Provided 3,043,286 2,801,797 2,351,360 2,583,412<br />
D-165 Fiscal Year <strong>2008</strong> Annual Budget
Cultural Support Services<br />
MISSION<br />
To improve the quality <strong>of</strong> life for our citizens through cultural activities and community based programs<br />
that enrich <strong>Lakeland</strong> by providing a stimulus for education, culture, community service and<br />
entertainment.<br />
CORE SERVICES<br />
Financial and personnel support for a variety <strong>of</strong> local programs meeting specific criteria. Local events<br />
and programs include: The Sun ‘n Fun Fly In, Music on the Promenade, Lemon Street Outdoor<br />
Sculpture Competition, Mayfaire by the Lake, Orange Cup Regatta, Pied Piper Players, Holiday<br />
Decorations, <strong>Lakeland</strong> Vision, <strong>Lakeland</strong> Citizens Academy, and both public and community service<br />
programs targeting outreach agencies. Private sponsorships will be sought in FY <strong>2008</strong> to support<br />
several <strong>of</strong> these programs in FY <strong>2008</strong> due to reduced ad valorem revenues arising from Property Tax<br />
Reform.<br />
OPERATIONAL AND/OR PUBLIC SERVICE LEVELS<br />
2004 2005 2006 2007 <strong>2008</strong><br />
Item Measured<br />
Actual Actual Actual Projected Proposed<br />
Cultural Assistance Grants (1) $164,529 $187,808 $188,576 $194,409 $200,000<br />
Community Service Grants (2) $80,000 $80,000 $80,000 $80,000 $80,000<br />
Public Service Grants (3) $134,411 $132,638 $128,000 $119,573 $118,500<br />
Lemon Street Sculpture<br />
Competition/Outdoor Sculpture Displays<br />
$22,000 $34,683* $22,000 $22,000 $32,000*<br />
<strong>Lakeland</strong> Electric Promotions $50,025 $42,883 $43,266 $60,500 $60,000<br />
Music on the Promenade $15,000 $20,000 $24,000 $24,000 $24,000<br />
Cultural Activities Reserve (4) $100,000 $100,000 $100,000 $100,000 $100,000<br />
*Includes in-kind contribution for the installation <strong>of</strong> the J. Seward Johnson “Man on the Street”<br />
sculpture exhibit in 2005 and <strong>2008</strong>.<br />
(1) Cultural Assistance Grants assist public art and cultural programs for a three year period.<br />
Some <strong>of</strong> the current recipients include: Polk Museum <strong>of</strong> Art, Explorations V Children’s<br />
Museum, Polk Theatre and the Imperial Symphony Orchestra.<br />
(2) Community Service Grants are funded from the General Fund and some recipients include Catholic<br />
Social Charities, Central Florida Deaf Services, Family Fundamentals, Girls Inc., and <strong>Lakeland</strong><br />
Volunteers in Medicine.<br />
(3) Public Service Grants are funded through Community Development Block Grants. Some <strong>of</strong> the<br />
current recipients include the Homeless Coalition <strong>of</strong> Polk County, <strong>Lakeland</strong> Volunteers in Medicine,<br />
Salvation Army and Talbot House Ministries.<br />
(4) The <strong>City</strong> Commission has established a goal <strong>of</strong> $2 million reserve by FY 2011.<br />
D-166 Fiscal Year <strong>2008</strong> Annual Budget
Cultural Support Services<br />
TABLE OF ORGANIZATION<br />
This activity is supported by the Parks and Recreation Department. The Parks<br />
and Recreation tables <strong>of</strong> organization begin on page G-54.<br />
2007-08<br />
Experience Budget Experience Proposed<br />
For Year For Year 2006-07 by<br />
EXPENSES 2005-06 2006-07 Estimated <strong>City</strong> Manager<br />
Personnel<br />
Salaries & Wages 292,784 337,065 319,473 396,281<br />
Fringe Benefits 70,365 88,939 78,158 106,641<br />
Total Personnel 363,149 426,005 397,631 502,921<br />
Non-Personnel<br />
Internal Service Charges 75,354 80,765 80,297 87,409<br />
Pr<strong>of</strong>essional & Contractual 14,513 15,759 15,394 17,955<br />
Utilities 80,777 79,772 78,386 83,574<br />
Insurance and Fixed Charges 100 51 101 101<br />
All Other Operations and Maintenance 820,218 900,212 782,353 915,055<br />
Capital Outlay 3,104 2,576 2,576 2,765<br />
Debt Service<br />
Total Non-Personnel 994,066 1,079,135 959,108 1,106,860<br />
Total Expenditures 1,357,215 1,505,139 1,356,739 1,609,781<br />
Net Transfers<br />
Revenue Sources<br />
Taxes<br />
Licenses & Permits<br />
Intergovernmental 173,502 223,000 105,806 132,073<br />
Charges for Services<br />
Interest Income 43,612 63,032 64,529 62,889<br />
All Other Revenue 150,350 136,879 136,879 196,383<br />
Total Revenue 367,464 422,911 307,214 391,345<br />
Funding to be Provided 989,751 1,082,228 1,049,525 1,218,436<br />
D-167 Fiscal Year <strong>2008</strong> Annual Budget
The <strong>Lakeland</strong> Center<br />
MISSION<br />
To be considered the venue <strong>of</strong> choice for the greater <strong>Lakeland</strong> and Polk County area by providing<br />
superior facilities and outstanding events.<br />
CORE SERVICES<br />
Serving as an entertainment, sports, and convention hub for the <strong>City</strong> <strong>of</strong> <strong>Lakeland</strong>, Polk County and<br />
beyond. The <strong>Lakeland</strong> Center features four unique venues for both corporate and consumer use:<br />
The Jenkins Arena hosts a variety <strong>of</strong> events including concerts, sporting events, family shows,<br />
and other multi-purpose events.<br />
Sikes Hall & The Exhibit Hall and associated spaces <strong>of</strong>fer over 60,000 square feet <strong>of</strong> combined<br />
space for a variety <strong>of</strong> events as well as corporate trade shows and meetings.<br />
The Youkey Theatre seats 2,296 and is home to the <strong>City</strong>-sponsored Entertainment and<br />
Broadway series, the Imperial Symphony Orchestra and a number <strong>of</strong> special engagements.<br />
Smaller meeting rooms heavily utilized by community and non-pr<strong>of</strong>it groups.<br />
OPERATIONAL AND/OR PUBLIC SERVICE LEVELS<br />
2004 2005 2006 2007 <strong>2008</strong><br />
Item Measured<br />
Actual Actual Actual Projected Proposed<br />
# <strong>of</strong> Events 678 665 641 590 600<br />
Event Attendance 484,438 494,127 417,968 420,000 425,000<br />
Facility Utilization/<br />
Occupancy %<br />
33% 37% 38% 37% 37%<br />
Total Sales (in Millions) 3,423 3,533 4,532 4,821 5,210<br />
Income % Generated by<br />
TLC Operated<br />
45% 38% 43% 43% 46%<br />
Departments<br />
Gross Operating Pr<strong>of</strong>it<br />
(Loss) %<br />
(48%) (55%) (38%) (34%) (31%)<br />
Accounts Receivable<br />
Average Collection Period<br />
26 35 28 31 28<br />
D-168 Fiscal Year <strong>2008</strong> Annual Budget
The <strong>Lakeland</strong> Center<br />
TABLE OF ORGANIZATION<br />
Legend<br />
Left number= 2007 FTE<br />
Right number= <strong>2008</strong> FTE<br />
D-169 Fiscal Year <strong>2008</strong> Annual Budget
The <strong>Lakeland</strong> Center<br />
2007-08<br />
Experience Budget Experience Proposed<br />
For Year For Year 2006-07 by<br />
EXPENSES 2005-06 2006-07 Estimated <strong>City</strong> Manager<br />
Personnel<br />
Salaries & Wages 2,054,651 2,204,733 2,433,246 2,314,380<br />
Fringe Benefits 331,166 244,385 409,838 442,645<br />
Total Personnel 2,385,817 2,449,118 2,843,084 2,757,025<br />
Non-Personnel<br />
Internal Service Charges 594,263 604,928 605,510 634,121<br />
Pr<strong>of</strong>essional & Contractual 1,395,001 1,398,963 1,400,903 1,551,831<br />
Utilities 853,453 674,335 913,542 925,869<br />
Insurance and Fixed Charges 121,104 142,059 110,436 150,143<br />
All Other Operations and Maintenance 862,660 733,225 701,322 703,933<br />
Capital Outlay 150,558 732,829 744,680 759,780<br />
Debt Service 1,592,861 1,584,662 1,584,662 1,568,662<br />
Total Non-Personnel 5,569,900 5,871,001 6,061,055 6,294,339<br />
Total Expenditures 7,955,717 8,320,119 8,904,139 9,051,364<br />
Net Transfers<br />
Revenue Sources<br />
Taxes<br />
Licenses & Permits<br />
Intergovernmental 512,657 477,669 499,784 499,784<br />
Charges for Services 4,532,986 4,462,893 4,964,995 5,210,947<br />
Interest Income 64,769 82,146 79,063 53,629<br />
All Other Revenue 4,071 115,000 65,000 75,000<br />
Total Revenue 5,114,483 5,137,708 5,608,842 5,839,360<br />
Funding to be Provided 2,841,234 3,182,411 3,295,297 3,212,004<br />
D-170 Fiscal Year <strong>2008</strong> Annual Budget
Public Information Services<br />
MISSION<br />
To educate residents, employees and the media regarding the <strong>City</strong> <strong>of</strong> <strong>Lakeland</strong>’s functions, challenges<br />
and achievements by building and maintaining open channels <strong>of</strong> communication.<br />
CORE SERVICES<br />
Providing a centralized communications group servicing all <strong>City</strong> Departments in graphic design, public<br />
relations, marketing and advertising while overseeing internal and external communications.<br />
Communications also develops and produces government access television programming on <strong>Lakeland</strong><br />
Government Network (LGN), broadcasting throughout the County (Bright House Networks channel 19<br />
and Comcast Cable channel 33). Live broadcasts include: <strong>City</strong> Commission, Planning and Zoning,<br />
Code Enforcement and Utility Committee meetings. Special events and cultural programs taking place<br />
in <strong>Lakeland</strong> are also aired.<br />
TABLE OF ORGANIZATION<br />
Legend<br />
Left number= 2007 FTE<br />
Right number= <strong>2008</strong> FTE<br />
D-171 Fiscal Year <strong>2008</strong> Annual Budget
Public Information Services<br />
OPERATIONAL AND/OR PUBLIC SERVICE LEVELS<br />
Item Measured<br />
2004*<br />
Actual<br />
2005<br />
Actual<br />
2006<br />
Actual<br />
2007<br />
Projected<br />
<strong>2008</strong><br />
Proposed<br />
Public Records - Research<br />
Requests<br />
N/A 225 248 249 250<br />
Production Projects (Including<br />
Graphic Design)<br />
N/A 135 149 145 150<br />
Press Releases – Notices N/A 127 131 130 130<br />
Access <strong>Lakeland</strong> (Monthly<br />
Newsletter)<br />
N/A 12 12 12 12<br />
Live Meetings on LGN N/A 40 50 50 50<br />
Video Productions N/A 50 65 65 65<br />
*The Communications Department was established in 2005.<br />
PERFORMANCE MEASURES (KSI’S)<br />
GOAL: Communication<br />
OUTCOME: Informed and Engaged Employees<br />
KSI: Website Hits on Internal Communication (<strong>2008</strong> Goal: >202,000 hits on Insite and >86,000<br />
views on Ask <strong>City</strong> Management by using a variety <strong>of</strong> communication techniques.)<br />
Objective: Number <strong>of</strong> hits lasting more than 30 seconds to ask <strong>City</strong> Management, Policy<br />
Manual, SOP, <strong>City</strong> Announcements, Job Postings, <strong>City</strong> University.<br />
KSI: Employee Engagement Through Committees (<strong>2008</strong> Goal: To increase employee<br />
participation in internal advisory teams and committees. 2007 data: Not Available (NA))<br />
Objective: Participation on internal <strong>City</strong> <strong>of</strong> <strong>Lakeland</strong> Advisory Teams and Committees.<br />
KSI: Employee Satisfaction with Internal Communications (<strong>2008</strong> Goal: ≥67% Very Satisfied<br />
/Satisfied.)<br />
Objective: Measure <strong>of</strong> employee satisfaction with internal communications.<br />
OUTCOME: Informed and Engaged Community<br />
KSI: External Communication Mediums Viewed - Hits on the <strong>City</strong> <strong>of</strong> <strong>Lakeland</strong> Website<br />
(<strong>2008</strong> Goal: >5,493 hits on Video on Demand and >12,783 hits on the <strong>City</strong> Commission<br />
Agenda/Calendar)<br />
Objective: Number <strong>of</strong> hits lasting more than 30 seconds to PGTV, Commission Agendas<br />
and Calendar.<br />
KSI: Citizen Communication Satisfaction Rating (<strong>2008</strong> Goal: To develop a benchmark that<br />
measures the citizen satisfaction <strong>of</strong> communication methods used by the <strong>City</strong>. 2007 Data<br />
NA.)<br />
Objective: Measure <strong>of</strong> resident’s perception <strong>of</strong> communication methods <strong>of</strong> <strong>City</strong>.<br />
D-172 Fiscal Year <strong>2008</strong> Annual Budget
Public Information Services<br />
PERFORMANCE MEASURES (KSI’S) - CONTINUED<br />
KSI: Citizen Cases Logged on Website (<strong>2008</strong> Goal: To implement a Citizen Action Center<br />
on the <strong>City</strong>’s website that will log and track citizen action items. 2007 Data NA.)<br />
Objective: Number <strong>of</strong> cases logged through citizen action center web page.<br />
KSI: Presentations to Citizen Groups (<strong>2008</strong> Goal: ≥46 presentations)<br />
Objective: Number <strong>of</strong> presentations to citizen groups, such as: service organizations,<br />
neighborhood associations, schools, etc.<br />
GOAL: Fiscal Management<br />
OUTCOME: Optimal Management <strong>of</strong> Existing Financial Resources<br />
KSI: Residents Perception <strong>of</strong> Economic Issues and Various <strong>City</strong> Services Rating<br />
(<strong>2008</strong> Goal: To implement a benchmark that measures public perception <strong>of</strong> economic<br />
issues facing the <strong>City</strong>. 2007 Data: 34.5% Excellent/Good.)<br />
Objective: Measure <strong>of</strong> residents perception <strong>of</strong> economic issues and various <strong>City</strong> services<br />
GOAL: Growth Management<br />
OUTCOME: Quality Developments<br />
KSI: Home Owner Satisfaction Regarding Growth (<strong>2008</strong> Goal: To establish a 50% satisfaction<br />
rating from homeowners regarding growth and infrastructure related issues.<br />
2007 Data: 45% satisfaction rating.)<br />
Objective: Home owner satisfaction regarding development, infrastructure and amenities.<br />
KSI: Commercial satisfaction regarding growth (<strong>2008</strong> Goal: To implement a survey that<br />
measures business and commercial satisfaction regarding development, infrastructure and<br />
amenities. 2007 Data: Business/Retail Growth 67% Excellent/Good; Job Growth 52%.)<br />
Objective: Commercial satisfaction regarding development, infrastructure and amenities<br />
GOAL: Quality <strong>of</strong> Life<br />
OUTCOME: Quality Public Spaces<br />
KSI: Citizen Satisfaction Rating (<strong>2008</strong> Goal: 85% Satisfied; 2007 Data: 84% Satisfied)<br />
Objective: Citizen satisfaction with quality <strong>of</strong> life in <strong>Lakeland</strong><br />
KSI: Lake Water Quality (<strong>2008</strong> Goal: To implement a benchmark that measures public<br />
perception regarding lakes and quality <strong>of</strong> life. 2007 Data: N/A.)<br />
Objective: Citizen satisfaction with Lake water quality - composition <strong>of</strong> water.<br />
OUTCOME: Superior Municipal Services<br />
KSI: Citizen Satisfaction Rating (<strong>2008</strong> Goal: (<strong>2008</strong> Goal: To implement a benchmark that<br />
will measure overall citizen satisfaction <strong>of</strong> municipal services. 2007 Data: N/A)<br />
Objective: Citizen satisfaction <strong>of</strong> municipal services<br />
D-173 Fiscal Year <strong>2008</strong> Annual Budget
Public Information Services<br />
NEW INITIATIVES<br />
Communication<br />
• Improving <strong>Lakeland</strong> Government Network (LGN) to include live <strong>of</strong>f-site broadcasts, dedicated<br />
Department programming and total control <strong>of</strong> the <strong>City</strong> <strong>of</strong> <strong>Lakeland</strong>’s broadcast signal. This<br />
improvement will include a mobile editing/switching station for <strong>of</strong>f-site broadcasts.<br />
• Student Citizens Academy is a program that will be modeled after the highly successful Citizens<br />
Academy. It will introduce <strong>City</strong> services and programs to high school students through an interactive<br />
learning environment.<br />
• Annual Citizen Survey to establish benchmarks regarding <strong>City</strong> services. This project includes the<br />
development, implementation and tabulation <strong>of</strong> an annual survey instrument to evaluate <strong>City</strong><br />
operations.<br />
2007-08<br />
Experience Budget Experience Proposed<br />
For Year For Year 2006-07 by<br />
EXPENSES 2005-06 2006-07 Estimated <strong>City</strong> Manager<br />
Personnel<br />
Salaries & Wages 123,230 152,016 139,161 100,680<br />
Fringe Benefits 27,687 33,562 31,698 24,390<br />
Total Personnel 150,917 185,578 170,859 125,069<br />
Non-Personnel<br />
Internal Service Charges 22,934 25,766 25,527 15,123<br />
Pr<strong>of</strong>essional & Contractual 5,309 9,141 5,342 3,238<br />
Utilities 2,878 4,587 4,214 2,880<br />
Insurance and Fixed Charges 6,083 6,645 6,670 7,050<br />
All Other Operations and Maintenance 40,093 55,552 54,252 21,381<br />
Capital Outlay 31,551 30,354 26,994 35,827<br />
Debt Service<br />
Total Non-Personnel 108,848 132,044 122,999 85,499<br />
Total Expenditures 259,765 317,623 293,858 210,569<br />
Revenue Sources<br />
Taxes<br />
Licenses & Permits<br />
Intergovernmental<br />
Charges for Services<br />
Interest Income<br />
All Other Revenue 3,621 253 253 34,500<br />
Total Revenue 3,621 253 253 34,500<br />
Funding to be Provided 256,144 317,370 293,605 176,069<br />
D-174 Fiscal Year <strong>2008</strong> Annual Budget
CITY OF LAKELAND<br />
<strong>2008</strong><br />
Parks, Recreation<br />
and Properties<br />
Program<br />
Activity<br />
Page<br />
Parks D-178<br />
Recreation and Facilities Services D-180<br />
Aquatics D-182<br />
Cleveland Heights Golf Course D-184<br />
Cemeteries D-186<br />
D-175 Fiscal Year <strong>2008</strong> Annual Budget
Parks, Recreation and Properties<br />
Recreation and<br />
Facilities Services<br />
39%<br />
Aquatics<br />
Parks, Recreation and Properties<br />
Experience Budget Experience FY 2007-08<br />
For Year For Year 2006-07 Proposed By<br />
EXPENSES 2005-06 2006-07 Estimated <strong>City</strong> Manager<br />
Personnel<br />
Salaries and Wages 6,666,311 7,832,235 7,258,740 7,943,468<br />
Fringe Benefits 1,460,963 1,809,316 1,611,484 1,972,778<br />
Total Personnel 8,127,274 9,641,552 8,870,224 9,916,245<br />
Non-Personnel<br />
Internal Service Charges 1,847,997 1,952,687 1,965,467 2,178,801<br />
Pr<strong>of</strong>essional and Contractual 382,682 422,259 434,225 428,240<br />
Utilities 1,758,338 1,664,317 1,717,605 1,803,004<br />
Insurance and Fixed Charges 585,889 778,375 729,832 790,818<br />
All Other Operations and Maintenance 2,283,755 2,689,009 2,650,352 2,444,601<br />
Capital Outlay 7,491,808 11,451,123 11,457,098 5,476,418<br />
Debt Service 2,832,922 2,779,842 2,755,887 3,186,596<br />
Total Non-Personnel 17,183,390 21,737,612 21,710,465 16,308,478<br />
Total Expenditures 25,310,664 31,379,164 30,580,689 26,224,724<br />
Net Transfers<br />
Revenue Sources<br />
Taxes<br />
Licenses and Permits<br />
Intergovernmental 3,509,284 4,521,816 3,999,226 1,255,846<br />
Charges for Services 4,781,166 4,917,569 4,782,614 5,011,816<br />
Interest Income 33,520 51,878 59,345 59,348<br />
All Other Revenue 943,586 2,378,658 2,278,909 2,611,013<br />
Total Revenue 9,267,556 11,869,921 11,120,094 8,938,023<br />
Funding to be Provided 16,043,108 19,509,243 19,460,595 17,286,701<br />
D-177 Fiscal Year <strong>2008</strong> Annual Budget
Parks<br />
MISSION<br />
To provide citizens with safe, visually pleasing and enjoyable experiences utilizing public facilities<br />
parks, athletic complexes and public rights-<strong>of</strong>-ways.<br />
CORE SERVICES<br />
Maintenance <strong>of</strong> 1,134 acres <strong>of</strong> public open space including: parks, athletic playing surfaces,<br />
neighborhood cul-de-sacs, medians, rights-<strong>of</strong>-ways, parking, vacant lots, beautification gateways scenic<br />
areas and lake fronts, conservation sites, playgrounds and building facilities. A tree crew maintains<br />
the <strong>City</strong>’s urban forest <strong>of</strong> approximately 100,000 trees. The Parks Division also maintains and facilitates<br />
the year-round Detroit Tigers’ operation.<br />
OPERATIONAL AND/OR PUBLIC SERVICE LEVELS<br />
Item Measured<br />
2004<br />
Actual<br />
2005<br />
Actual<br />
2006<br />
Actual<br />
2007<br />
Projected<br />
<strong>2008</strong><br />
Proposed<br />
Field Rentals 3,852 3,800 4,297 4,300 4,100<br />
Facility Rentals 4,300 4,300 4,729 4,750 4,800<br />
Trees Planted 2,817 1,500 601 650 675<br />
Shrubs Planted 1,057 2,700 2,954 2,975 3,000<br />
Ground Cover Planted 2,401 1,850 678 700 750<br />
Annuals Planted 45,000 40,000 38,847 40,000 41,500<br />
Trees Trimmed 2,284 1,650 4,173 2,300 2,400<br />
Trees Removed 546 600 532 550 575<br />
Palms Trimmed 2,180 2,500 2,340 2,400 2,450<br />
Palms Removed 89 90 153 90 95<br />
PERFORMANCE MEASURES (KSI’S)<br />
GOAL: Quality <strong>of</strong> Life<br />
OUTCOME: Support the Arts and Wellness<br />
KSI: Acres <strong>of</strong> Active Parks (<strong>2008</strong> Goal: 430.9 total Acres)<br />
Objective: Number <strong>of</strong> acres <strong>of</strong> active parks<br />
D-178 Fiscal Year <strong>2008</strong> Annual Budget
Parks<br />
TABLE OF ORGANIZATION<br />
The Parks activity is supported by the Parks & Recreation Department, see Parks Table <strong>of</strong><br />
Organization on page G-58.<br />
2007-08<br />
Experience Budget Experience Proposed<br />
For Year For Year 2006-07 by<br />
EXPENSES 2005-06 2006-07 Estimated <strong>City</strong> Manager<br />
Personnel<br />
Salaries & Wages 3,774,668 4,279,531 4,003,952 4,326,084<br />
Fringe Benefits 844,816 1,043,355 938,129 1,141,472<br />
Total Personnel 4,619,484 5,322,886 4,942,081 5,467,556<br />
Non-Personnel<br />
Internal Service Charges 1,079,953 1,080,805 1,095,401 1,200,628<br />
Pr<strong>of</strong>essional & Contractual 146,739 189,419 189,052 182,024<br />
Utilities 1,192,366 1,094,121 1,145,069 1,183,666<br />
Insurance and Fixed Charges 348,380 471,956 441,642 478,420<br />
All Other Operations and Maintenance 641,432 998,989 1,011,431 616,057<br />
Capital Outlay 6,609,612 10,108,189 10,111,664 1,579,712<br />
Debt Service 1,239,683 828,543 828,543 1,089,485<br />
Total Non-Personnel 11,258,164 14,772,022 14,822,803 6,329,993<br />
Total Expenditures 15,877,648 20,094,908 19,764,884 11,797,548<br />
Net Transfers<br />
Revenue Sources<br />
Taxes<br />
Licenses & Permits<br />
Intergovernmental 2,787,070 3,862,463 3,339,873 596,493<br />
Charges for Services 468,265 463,477 484,327 443,274<br />
Interest Income 19,422 27,246 29,231 30,000<br />
All Other Revenue 394,923 715,815 564,074 1,020,514<br />
Total Revenue 3,669,680 5,069,001 4,417,505 2,090,281<br />
Funding to be Provided 12,207,967 15,025,907 15,347,379 9,707,267<br />
D-179 Fiscal Year <strong>2008</strong> Annual Budget
Recreation and Facilities Services<br />
MISSION<br />
To <strong>of</strong>fer and create a variety <strong>of</strong> activities, programs, athletic leagues, day camps and special events; To<br />
provide publicly funded space and to maintain and improve facilities and parks eligible for renting and<br />
reserving with the goal <strong>of</strong> improving the quality <strong>of</strong> life for <strong>Lakeland</strong> residents.<br />
CORE SERVICES<br />
The Recreation Division maintains eight recreational facilities; providing places for numerous social<br />
clubs to meet and which are available for public rental. The Division serves the needs <strong>of</strong> a diverse<br />
population by creating programming options to attract new customers and excite existing patrons.<br />
Programs and classes <strong>of</strong>fered at the recreational facilities include: quilting, art, martial arts, dance,<br />
music, educational, etiquette, fitness programs and sport leagues tailored for children and adults. A<br />
website is maintained by staff, identifying programming options and schedules. The Recreation<br />
Division also oversees special events celebrating Martin Luther King Day, Independence Day, Halloween<br />
and various other holidays.<br />
OPERATIONAL AND/OR PUBLIC SERVICE LEVELS<br />
Item Measured<br />
2004<br />
Actual<br />
2005<br />
Actual<br />
2006<br />
Actual<br />
2007<br />
Projected<br />
<strong>2008</strong><br />
Proposed<br />
Kelly Recreational Center Attendance 192,100 204,863 203,512 205,741 207,000<br />
Simpson Park Community Center<br />
Attendance<br />
212,584 137,001 177,771 223,257 224,000<br />
Number <strong>of</strong> Lake Mirror Complex Rentals 370 234 675 571 650<br />
PERFORMANCE MEASURES (KSI’S)<br />
GOAL: Quality <strong>of</strong> Life<br />
OUTCOME: Support the Arts & Wellness<br />
KSI: Participants at Recreation Facilities (<strong>2008</strong> Goal 433,287 Participants)<br />
Objective: Number <strong>of</strong> participants using recreation faculties (within buildings and pools).<br />
NEW INITIATIVES<br />
Quality <strong>of</strong> Life<br />
• Expansion <strong>of</strong> the Kelly Recreation Complex is scheduled to begin in late 2007 and continue into<br />
FY<strong>2008</strong>. Project consists <strong>of</strong> expanding facility in order to provide additional class and program<br />
needs.<br />
• Phase II <strong>of</strong> the 2007 computer initiative includes replacing the remainder <strong>of</strong> the outdated<br />
computers at the Coleman Bush Building providing an opportunity for computer skill set training<br />
and internet access.<br />
D-180 Fiscal Year <strong>2008</strong> Annual Budget
Recreation and Facilities Services<br />
TABLE OF ORGANIZATION<br />
The Recreation and Facility Services activity is supported by the Parks & Recreation Department,<br />
see the Reacreation Table <strong>of</strong> Organization on page G-59.<br />
2007-08<br />
Experience Budget Experience Proposed<br />
For Year For Year 2006-07 by<br />
EXPENSES 2005-06 2006-07 Estimated <strong>City</strong> Manager<br />
Personnel<br />
Salaries & Wages 1,325,841 1,592,747 1,455,914 1,692,657<br />
Fringe Benefits 320,613 425,541 357,509 461,222<br />
Total Personnel 1,646,454 2,018,288 1,813,423 2,153,879<br />
Non-Personnel<br />
Internal Service Charges 331,955 368,430 367,745 381,143<br />
Pr<strong>of</strong>essional & Contractual 68,022 73,762 73,267 77,944<br />
Utilities 326,616 319,357 313,717 332,077<br />
Insurance and Fixed Charges 137,120 224,053 209,623 227,720<br />
All Other Operations and Maintenance 685,115 703,813 700,067 897,304<br />
Capital Outlay 587,837 1,115,033 1,115,033 3,672,556<br />
Debt Service 1,230,300 1,642,632 1,642,632 1,792,632<br />
Total Non-Personnel 3,366,965 4,447,081 4,422,085 7,381,376<br />
Total Expenditures 5,013,418 6,465,369 6,235,508 9,535,255<br />
Net Transfers<br />
Revenue Sources<br />
Taxes<br />
Licenses & Permits<br />
Intergovernmental 637,683 659,353 659,353 659,353<br />
Charges for Services 1,293,050 1,325,692 1,343,815 1,501,192<br />
Interest Income 7,889 10,052 15,057 14,674<br />
All Other Revenue 58,450 1,033,005 1,033,649 1,056,308<br />
Total Revenue 1,997,073 3,028,102 3,051,874 3,231,527<br />
Funding to be Provided 3,016,346 3,437,267 3,183,634 6,303,728<br />
D-181 Fiscal Year <strong>2008</strong> Annual Budget
Aquatics<br />
MISSION<br />
To enhance our citizens’ quality <strong>of</strong> life by providing family oriented safe and secure aquatics facilities<br />
<strong>of</strong>fering instructional classes and specialized programs for both recreational and competitive<br />
participants.<br />
CORE SERVICES<br />
Aquatics <strong>of</strong>fers year-round swim lessons beginning with Parent/Toddler ranging up to Adult lessons.<br />
Junior Lifeguard classes help develop a valuable resource for future applicants. The <strong>City</strong> benefits from<br />
a heated pool with year-round programs such as Splashercise, Aqua Therapy and Aqua Massage. The<br />
facilities are also home to several local high school swim teams and one competitive swim team.<br />
Specialty classes consist <strong>of</strong> diving, scuba, Junior Lifeguard, Club Splash, and synchronized swimming.<br />
Aquatics also hosts the free annual Aquafest/Aquajam Event teaching water safety practices (attracts<br />
2,000 participants).<br />
TABLE OF ORGANIZATION<br />
This activity is supported by staff from the<br />
Parks and Recreation Department. See the<br />
entire Parks and Recreation Department tables<br />
<strong>of</strong> organization beginning on page G-54.<br />
Legend<br />
Left number= 2007 FTE<br />
Right number= <strong>2008</strong> FTE<br />
D-182 Fiscal Year <strong>2008</strong> Annual Budget
Aquatics<br />
2007-08<br />
Experience Budget Experience Proposed<br />
For Year For Year 2006-07 by<br />
EXPENSES 2005-06 2006-07 Estimated <strong>City</strong> Manager<br />
Personnel<br />
Salaries & Wages 401,330 704,045 614,987 672,695<br />
Fringe Benefits 4,551 12,129 9,627 8,111<br />
Total Personnel 405,881 716,174 624,614 680,806<br />
Non-Personnel<br />
Internal Service Charges 66,773 82,250 85,060 91,312<br />
Pr<strong>of</strong>essional & Contractual 3,210 4,546 6,758 8,905<br />
Utilities 61,935 63,441 64,524 70,995<br />
Insurance and Fixed Charges 26,616 1 1 2<br />
All Other Operations and Maintenance 91,053 109,242 105,596 117,337<br />
Capital Outlay 12,584 5,830 5,830 109<br />
Debt Service<br />
Total Non-Personnel 262,171 265,310 267,770 288,660<br />
Total Expenditures 668,051 981,484 892,385 969,466<br />
Net Transfers<br />
Revenue Sources<br />
Taxes<br />
Licenses & Permits<br />
Intergovernmental<br />
Charges for Services 123,559 86,400 102,537 85,400<br />
Interest Income<br />
All Other Revenue<br />
Total Revenue 123,559 86,400 102,537 85,400<br />
Funding to be Provided 544,492 895,084 789,848 884,066<br />
D-183 Fiscal Year <strong>2008</strong> Annual Budget
Cleveland Heights Golf Course<br />
MISSION<br />
To provide quality public space and programming designed to <strong>of</strong>fer superior golf-related recreation and<br />
leisure opportunities for quality family, individual and corporate experiences.<br />
CORE SERVICES<br />
Daily guest operations <strong>of</strong> pro-shop and clubhouse include managing tee times, directing golf lessons<br />
and clinics, tournament administration, merchandise sales and the stocking <strong>of</strong> golf apparel, supplies,<br />
bar and restaurant operations. Two restaurants are <strong>of</strong>fered at the clubhouse, with fixed menus that<br />
include breakfast and lunch entrees and an evening steam bar in the lounge. Staffing for special<br />
events and catering activities are also <strong>of</strong>fered. Maintenance <strong>of</strong> the 200-acre <strong>City</strong> facility, which includes<br />
a 27-hole golf course includes mowing, trimming, weeding, pesticide applications, and equipment<br />
maintenance.<br />
OPERATIONAL AND/OR PUBLIC SERVICE LEVELS<br />
2004 2005 2006 2007 <strong>2008</strong><br />
Item Measured<br />
Actual Actual Actual Projected Proposed<br />
Rounds <strong>of</strong> Golf 79,549 74,500 76,632 74,735 76,000<br />
Memberships 460 439 402 375 385<br />
Special Golf Outings/Tournaments 41 45 54 45 45<br />
Banquets/Meetings 475 450 465 425 375<br />
D-184 Fiscal Year <strong>2008</strong> Annual Budget
Cleveland Heights Golf Course<br />
TABLE OF ORGANIZATION<br />
The Cleveland Heights Golf Course activity is supported by the Parks & Recreation Department,<br />
see the Table <strong>of</strong> Organization on page G-56.<br />
2007-08<br />
Experience Budget Experience Proposed<br />
For Year For Year 2006-07 by<br />
EXPENSES 2005-06 2006-07 Estimated <strong>City</strong> Manager<br />
Personnel<br />
Salaries & Wages 864,130 948,982 901,111 928,446<br />
Fringe Benefits 194,583 212,190 208,889 235,017<br />
Total Personnel 1,058,713 1,161,172 1,109,999 1,163,462<br />
Non-Personnel<br />
Internal Service Charges 311,125 373,535 373,682 441,283<br />
Pr<strong>of</strong>essional & Contractual 94,713 81,901 95,493 89,392<br />
Utilities 149,203 161,321 143,673 166,357<br />
Insurance and Fixed Charges 45,595 45,228 41,392 46,796<br />
All Other Operations and Maintenance 712,284 808,861 764,919 749,535<br />
Capital Outlay 129,338 78,094 80,594 119,000<br />
Debt Service 362,939 308,667 284,712 304,479<br />
Total Non-Personnel 1,805,197 1,857,607 1,784,465 1,916,842<br />
Total Expenditures 2,863,910 3,018,779 2,894,464 3,080,304<br />
Net Transfers<br />
Revenue Sources<br />
Taxes<br />
Licenses & Permits<br />
Intergovernmental<br />
Charges for Services 2,659,753 2,783,500 2,578,500 2,717,350<br />
Interest Income 6,209 14,580 15,057 14,674<br />
All Other Revenue 125,727 189,000 209,900 79,800<br />
Total Revenue 2,791,689 2,987,080 2,803,457 2,811,824<br />
Funding to be Provided 72,221 31,699 91,007 268,480<br />
D-185 Fiscal Year <strong>2008</strong> Annual Budget
Cemeteries<br />
MISSION<br />
To provide <strong>Lakeland</strong> citizens with respectful, attractive and well maintained burial parks.<br />
CORE SERVICES<br />
The Cemetery Division operates and maintains 170 acres at two locations:<br />
• 50 acres at Roselawn; and<br />
• 120 acres <strong>of</strong> developed cemetery at Oak Hill Burial Park with 20 acres <strong>of</strong> open area (eight acres<br />
are reserved for future development).<br />
Services include burials, memorial installations, required grass maintenance and individual markers<br />
being trimmed and sprayed with herbicides four times annually.<br />
TABLE OF ORGANIZATION<br />
The Cemeteries activity is supported by the Parks & Recreation Department, see the Table <strong>of</strong> Organization on<br />
page G-55.<br />
D-186 Fiscal Year <strong>2008</strong> Annual Budget
Cemeteries<br />
2007-08<br />
Experience Budget Experience Proposed<br />
For Year For Year 2006-07 by<br />
EXPENSES 2005-06 2006-07 Estimated <strong>City</strong> Manager<br />
Personnel<br />
Salaries & Wages 378,027 438,880 397,209 452,865<br />
Fringe Benefits 96,401 116,101 97,330 126,956<br />
Total Personnel 474,427 554,981 494,540 579,821<br />
Non-Personnel<br />
Internal Service Charges 71,030 63,070 59,534 81,956<br />
Pr<strong>of</strong>essional & Contractual 70,435 73,359 70,640 71,577<br />
Utilities 40,532 38,660 63,424 64,060<br />
Insurance and Fixed Charges 28,177 37,137 37,173 37,880<br />
All Other Operations and Maintenance 171,386 88,645 88,078 86,700<br />
Capital Outlay 154,949 145,127 145,127 105,041<br />
Debt Service<br />
Total Non-Personnel 536,510 445,998 463,978 447,214<br />
Total Expenditures 1,010,937 1,000,979 958,517 1,027,036<br />
Net Transfers<br />
Revenue Sources<br />
Taxes<br />
Licenses & Permits<br />
Intergovernmental 84,530<br />
Charges for Services 236,539 258,500 273,435 264,600<br />
Interest Income<br />
All Other Revenue 364,486 440,838 471,286 454,391<br />
Total Revenue 685,555 699,338 744,721 718,991<br />
Funding to be Provided 325,382 301,641 213,796 308,045<br />
D-187 Fiscal Year <strong>2008</strong> Annual Budget
THIS PAGE IS INTENTIONALLY BLANK
CITY OF LAKELAND<br />
<strong>2008</strong><br />
Internal Service<br />
Program<br />
Activity<br />
Page<br />
Facilities Maintenance D-192<br />
Fleet Management D-195<br />
Purchasing and Stores D-197<br />
Information Technology D-199<br />
Administrative Services D-201<br />
D-189 Fiscal Year <strong>2008</strong> Annual Budget
Internal Services<br />
Information Technology<br />
32%<br />
Administrative Services<br />
22%<br />
Facilities Maintenance<br />
10%<br />
Purchasing and Stores<br />
7%<br />
Fleet Management<br />
29%<br />
D-190 Fiscal Year <strong>2008</strong> Annual Budget
Internal Services<br />
Experience Budget Experience FY 2007-08<br />
For Year For Year 2006-07 Proposed By<br />
EXPENSES 2005-06 2006-07 Estimated <strong>City</strong> Manager<br />
Personnel<br />
Salaries and Wages 11,732,927 13,712,395 12,138,159 13,431,677<br />
Fringe Benefits 2,745,934 3,331,313 2,788,064 3,262,355<br />
Total Personnel 14,478,860 17,043,708 14,926,223 16,694,032<br />
Non-Personnel<br />
Internal Service Charges 3,027,365 3,262,748 3,154,868 3,378,844<br />
Pr<strong>of</strong>essional and Contractual 1,361,595 1,202,299 1,239,661 946,942<br />
Utilities 479,940 433,988 407,376 533,877<br />
Insurance and Fixed Charges 367,590 409,941 384,255 399,271<br />
All Other Operations and Maintenance 8,296,728 8,655,533 8,882,818 9,780,763<br />
Capital Outlay 6,350,738 9,441,593 8,731,342 7,805,913<br />
Debt Service<br />
Total Non-Personnel 19,883,954 23,406,102 22,800,320 22,845,611<br />
Total Expenditures 34,362,815 40,449,810 37,726,543 39,539,643<br />
Net Transfers<br />
Revenue Sources<br />
Taxes<br />
Licenses and Permits<br />
Intergovernmental 149,861 148,000 140,790 147,000<br />
Charges for Services 34,084,520 35,670,057 35,600,344 36,542,332<br />
Interest Income 885,499 664,950 821,397 1,207,229<br />
All Other Revenue 1,966,712 1,604,149 1,603,026 1,305,223<br />
Total Revenue 37,086,592 38,087,156 38,165,557 39,201,784<br />
Funding to be Provided (2,723,777) 2,362,654 (439,015) 337,859<br />
D-191 Fiscal Year <strong>2008</strong> Annual Budget
Facilities Maintenance<br />
MISSION<br />
To maintain and construct safe, clean and secure <strong>City</strong> facilities for visitors and <strong>City</strong> employees in a cost<br />
effective and efficient manner.<br />
CORE SERVICES<br />
Provide maintenance, janitorial, safety and construction support services for the <strong>City</strong>’s 186 facilities to<br />
include: structural, heating, ventilation, air-conditioning (HVAC), plumbing, electrical, carpentry,<br />
painting, ro<strong>of</strong>ing, physical security and fire suppression systems.<br />
TABLE OF ORGANIZATION<br />
The Facilities Maintenance activity is supported by the Public Works Department, see the Table <strong>of</strong> Organization on<br />
page G-67.<br />
OPERATIONAL AND/OR PUBLIC SERVICE LEVELS<br />
Item Measured<br />
2004<br />
Actual<br />
2005<br />
Actual<br />
2006<br />
Actual<br />
2007<br />
Projected<br />
<strong>2008</strong><br />
Proposed<br />
Work Orders Completed 3,140 4,316 3,950 4,100 4,000<br />
Capital Projects Completed 67 48 45 48 45<br />
Janitorial Service (cost/sq. ft.) $1.35 $1.68 $1.64 $1.70 $1.72<br />
Facility Maintenance (cost/sq. ft.) $1.10 $1.14 $1.32 $1.35 $1.95<br />
D-192 Fiscal Year <strong>2008</strong> Annual Budget
Facilities Maintenance<br />
NEW INITIATIVES<br />
Economic Opportunity<br />
• During the beginning <strong>of</strong> fiscal year <strong>2008</strong>, the <strong>City</strong> <strong>of</strong> <strong>Lakeland</strong> (COL) will be hiring Facilities<br />
Maintenance employees to form a COL Fire Protection Section which will be independent from<br />
<strong>Lakeland</strong> Electric’s (LE's) Fire Section. The need to have a COL Fire Group, responsible for all<br />
COL facilities, with the exception <strong>of</strong> LE’s power plants, came as a result <strong>of</strong> the growth that <strong>City</strong><br />
entities have experienced in the last 10 years and the fact that the scope <strong>of</strong> work is quite different<br />
between LE (mostly industrial environment, hot work permits, etc.) and other <strong>City</strong> entities which<br />
generally involve a commercial environment, sprinkler systems, extinguishers, etc. It is expected<br />
that during the last quarter <strong>of</strong> calendar year 2007, LE's Team will be training/supervising the new<br />
group and by January 1, <strong>2008</strong> the groups will be totally independent.<br />
D-193 Fiscal Year <strong>2008</strong> Annual Budget
Facilities Maintenance<br />
2007-08<br />
Experience Budget Experience Proposed<br />
For Year For Year 2006-07 by<br />
EXPENSES 2005-06 2006-07 Estimated <strong>City</strong> Manager<br />
Personnel<br />
Salaries & Wages 1,418,645 1,698,163 1,588,804 1,895,785<br />
Fringe Benefits 368,857 461,969 419,059 547,435<br />
Total Personnel 1,787,502 2,160,132 2,007,862 2,443,220<br />
Non-Personnel<br />
Internal Service Charges 365,506 363,807 413,304 479,462<br />
Pr<strong>of</strong>essional & Contractual 105,114 100,345 101,087 139,106<br />
Utilities 31,004 33,351 31,552 33,639<br />
Insurance and Fixed Charges 76,606 73,411 65,509 95,471<br />
All Other Operations and Maintenance 653,803 725,788 748,808 810,371<br />
Capital Outlay 15,914 38,500 37,969 97,000<br />
Debt Service<br />
Total Non-Personnel 1,247,947 1,335,202 1,398,229 1,655,049<br />
Total Expenditures 3,035,449 3,495,334 3,406,091 4,098,269<br />
Net Transfers<br />
Revenue Sources<br />
Taxes<br />
Licenses & Permits<br />
Intergovernmental<br />
Charges for Services 3,004,231 3,376,707 3,369,789 4,082,633<br />
Interest Income 16,326 17,565 21,510 20,963<br />
All Other Revenue 115,430 25,000 25,000<br />
Total Revenue 3,135,987 3,419,272 3,416,299 4,103,596<br />
Funding to be Provided (100,538) 76,062 (10,208) (5,327)<br />
D-194 Fiscal Year <strong>2008</strong> Annual Budget
Fleet Management<br />
MISSION<br />
To acquire and maintain safe, reliable, cost effective vehicles and equipment which meet the specific<br />
needs <strong>of</strong> <strong>City</strong> Departments.<br />
CORE SERVICES<br />
Fleet Management provides acquisition, maintenance, fueling and disposition for all <strong>City</strong> vehicles with<br />
the exception <strong>of</strong> <strong>Lakeland</strong> Fire Department equipment, <strong>Lakeland</strong> Electric’s coal-handling equipment at<br />
the McIntosh power plant and certain smaller pieces <strong>of</strong> mowing equipment. Comprehensive<br />
preventative maintenance is mandatory for all <strong>City</strong> vehicles. Most repairs are accomplished in-house<br />
with specialized work such as major accident repairs, transmission repair, frame and axle work, glass<br />
and upholstery repairs, etc. contracted out to local vendors. Fleet Management also fabricates custom<br />
accessories for equipment such as tool boxes, pipe racks, step bumpers, etc.<br />
OPERATIONAL AND/OR PUBLIC SERVICE LEVELS<br />
2004 2005 2006 2007 <strong>2008</strong><br />
Item Measured<br />
Actual Actual Actual Projected Proposed<br />
Vehicle Availability 97% 97% 97% 97% 97%<br />
Equipment Maintained 1,137 1,139 1,143 1,153 1,183<br />
Passenger Cars (Cost/Mile) $0.24 $0.28 $0.29 $0.35 $0.36<br />
Light Trucks (Cost/Mile) $0.26 $0.26 $0.27 $0.32 $0.34<br />
Police Cars (Cost/Mile) $0.27 $0.31 $0.33 $0.39 $0.40<br />
Number <strong>of</strong> Work Orders<br />
Written<br />
9,507 10,810 11,110 11,500 11,875<br />
Fuel Cost $1,719,507 $2,162,716 $2,564,727 $2,900,000 $3,000,000<br />
NEW INITIATIVES<br />
Quality <strong>of</strong> Life<br />
• Leading the development <strong>of</strong> a fleet repair performance measurement benchmark tool through the<br />
Florida Benchmarking Consortium (FBC). Participating government agencies will be able to utilize<br />
the data gathered.<br />
D-195 Fiscal Year <strong>2008</strong> Annual Budget
Fleet Management<br />
TABLE OF ORGANIZATION<br />
The Fleet Management activity is supported by the Public Works Department, see the Table <strong>of</strong> Organization on<br />
page G-68.<br />
2007-08<br />
Experience Budget Experience Proposed<br />
For Year For Year 2006-07 by<br />
EXPENSES 2005-06 2006-07 Estimated <strong>City</strong> Manager<br />
Personnel<br />
Salaries & Wages 1,369,313 1,565,611 1,483,739 1,679,101<br />
Fringe Benefits 335,400 403,968 365,154 463,192<br />
Total Personnel 1,704,713 1,969,579 1,848,893 2,142,293<br />
Non-Personnel<br />
Internal Service Charges 395,261 500,562 463,243 583,734<br />
Pr<strong>of</strong>essional & Contractual 570,758 276,463 612,072 493,793<br />
Utilities 72,714 75,526 67,623 81,373<br />
Insurance and Fixed Charges 98,198 103,567 94,128 97,539<br />
All Other Operations and Maintenance 4,263,306 5,096,643 4,636,362 4,727,041<br />
Capital Outlay 3,956,704 7,271,974 7,094,462 3,755,378<br />
Debt Service<br />
Total Non-Personnel 9,356,941 13,324,735 12,967,890 9,738,858<br />
Total Expenditures 11,061,654 15,294,314 14,816,783 11,881,151<br />
Net Transfers<br />
Revenue Sources<br />
Taxes<br />
Licenses & Permits<br />
Intergovernmental 149,861 147,000 147,000 148,000<br />
Charges for Services 10,472,002 11,145,488 10,834,786 11,465,071<br />
Interest Income 747,356 1,093,404 903,412 880,451<br />
All Other Revenue 653,017 988,914 1,027,914 349,059<br />
Total Revenue 12,022,236 13,374,806 12,913,112 12,842,581<br />
Funding to be Provided (960,582) 1,919,508 1,903,671 (961,430)<br />
D-196 Fiscal Year <strong>2008</strong> Annual Budget
Purchasing and Stores<br />
MISSION<br />
To ensure the acquisition <strong>of</strong> quality goods and services at the best value for the <strong>City</strong> in addition to<br />
providing a readily available supply <strong>of</strong> required items for immediate pick-up by the <strong>City</strong> Departments as<br />
a support for their respective services.<br />
CORE SERVICES<br />
Purchasing<br />
Responsible for preparing all competitive solicitation for sealed bids and quotes for all <strong>City</strong><br />
Departments. Purchasing administers a purchasing card (credit card) program which allows authorized<br />
<strong>City</strong> employees to make small purchases for their Department’s regular needs with minimal paperwork.<br />
Staff maintains an interactive website allowing vendors to register and select the solicitations they wish<br />
to receive and facilitates the placement <strong>of</strong> on-line quotations. Purchasing is responsible for soliciting<br />
quotations for the restocking <strong>of</strong> the <strong>City</strong> warehouse (Central Stores).<br />
Central Stores<br />
Maintains supervision and distribution <strong>of</strong> 3,700+ separate stock items. Central Stores stages and<br />
palletizes supplies and system components for the Electric and Water Utilities crew trucks daily.<br />
Inventory is carefully monitored and re-orders are established based upon historical usage patterns.<br />
Central Stores maintains safety and emergency stock for out <strong>of</strong> the ordinary situations (e.g. hurricanes,<br />
tornados, etc.).<br />
TABLE OF ORGANIZATION<br />
Legend<br />
Left number= 2007 FTE<br />
Right number= <strong>2008</strong> FTE<br />
D-197 Fiscal Year <strong>2008</strong> Annual Budget
Purchasing and Stores<br />
2007-08<br />
Experience Budget Experience Proposed<br />
For Year For Year 2006-07 by<br />
EXPENSES 2005-06 2006-07 Estimated <strong>City</strong> Manager<br />
Personnel<br />
Salaries & Wages 794,068 843,438 840,937 894,677<br />
Fringe Benefits 198,785 211,356 213,118 241,369<br />
Total Personnel 992,853 1,054,794 1,054,055 1,136,046<br />
Non-Personnel<br />
Internal Service Charges 465,724 463,058 464,835 484,688<br />
Pr<strong>of</strong>essional & Contractual 13,793 30,287 30,042 30,356<br />
Utilities 72,586 66,521 49,638 77,476<br />
Insurance and Fixed Charges 52,769 62,027 47,822 49,678<br />
All Other Operations and Maintenance 935,470 1,107,417 1,108,020 1,182,939<br />
Capital Outlay 12,308 83,638 83,638 11,308<br />
Debt Service<br />
Total Non-Personnel 1,552,650 1,812,948 1,783,995 1,836,445<br />
Total Expenditures 2,545,503 2,867,742 2,838,050 2,972,491<br />
Net Transfers<br />
Revenue Sources<br />
Taxes<br />
Licenses & Permits<br />
Intergovernmental<br />
Charges for Services 2,571,795 2,748,501 2,749,899 2,916,184<br />
Interest Income 47,052 46,260 30,114 29,348<br />
All Other Revenue 20,371 13,000 12,444 13,000<br />
Total Revenue 2,639,218 2,807,761 2,792,457 2,958,532<br />
Funding to be Provided (93,715) 59,981 45,593 13,959<br />
D-198 Fiscal Year <strong>2008</strong> Annual Budget
Information Technology<br />
MISSION<br />
To provide business automation and communication services that improve <strong>City</strong> operations and public<br />
services, optimize the availability and usefulness <strong>of</strong> information technology for employees and<br />
constituents, and effectively leverage technology to support the overall vision and goals <strong>of</strong> the <strong>City</strong>.<br />
CORE SERVICES<br />
Information Technology (IT) is responsible for providing application development and support, network<br />
administration, personal computer (PC) support, radio communications, telephone service, and fiber<br />
and wireless transport for all <strong>City</strong> departments. Customers also include citizen and business users <strong>of</strong><br />
<strong>City</strong> web services, Wi-Fi hotspots and fiber transport services.<br />
OPERATIONAL AND/OR PUBLIC SERVICE LEVELS<br />
Item Measured<br />
2004 2005 2006 2007 <strong>2008</strong><br />
Actual Actual Actual Projected Proposed<br />
Network:<br />
Number <strong>of</strong> Devices 1,617 1,728 1,728 1,792 1,981<br />
Availability <strong>of</strong> Service 99.99% 99.60% 99.99% 99.99% 99.99%<br />
Average Cost/Port $643 $643 $876 $420** $668<br />
Telephone:<br />
Number <strong>of</strong> Devices 1,078 976 1,079 1,100 1,133<br />
Number <strong>of</strong> Switch Ports ---- ---- 2,917 3,017 3,107<br />
Availability <strong>of</strong> Service 98.0% 98.0% 99.96% 99.99% 99.99%<br />
Telephone Average Cost/Port ---- ---- ---- $21.93 $20.72<br />
Radio:<br />
Number <strong>of</strong> Devices 1,322 1,332 1,359 1,493 1,498<br />
Availability <strong>of</strong> Service 99.7% 99.7% 99.8% 99.8% 99.9%<br />
Radio Average Cost/Device $198 $225 $335* $337 $332<br />
Technology Support:<br />
Number <strong>of</strong> Calls 8,581 5,193 7,156 8,861 9,500<br />
Complete Help Desk Service<br />
Request (average number <strong>of</strong> days) 0.39 0.50 0.30 0.50 0.50<br />
Number <strong>of</strong> Devices 1,310 1,350 1,480 1,508 1,733<br />
Technology Support Avg Cost/<br />
Device $563 $563 $684 $725 $710<br />
* System out <strong>of</strong> warranty – increased cost reflects Motorola maintenance contract costs.<br />
** Using IT Fund surplus, Average Cost/Port ($825) was reduced; refunding surplus to users.<br />
D-199 Fiscal Year <strong>2008</strong> Annual Budget
Information Technology<br />
TABLE OF ORGANIZATION<br />
See Information Technology Table <strong>of</strong> Organization on page G-51.<br />
2007-08<br />
Experience Budget Experience Proposed<br />
For Year For Year 2006-07 by<br />
EXPENSES 2005-06 2006-07 Estimated <strong>City</strong> Manager<br />
Personnel<br />
Salaries & Wages 3,594,024 4,528,785 4,138,150 4,680,329<br />
Fringe Benefits 809,223 1,039,071 909,933 1,161,947<br />
Total Personnel 4,403,247 5,567,856 5,048,083 5,842,276<br />
Non-Personnel<br />
Internal Service Charges 868,869 1,153,177 1,138,007 1,185,408<br />
Pr<strong>of</strong>essional & Contractual 371,659 339,177 465,183 565,594<br />
Utilities 146,223 185,692 177,345 187,180<br />
Insurance and Fixed Charges 139,870 159,592 124,457 153,218<br />
All Other Operations and Maintenance 1,772,380 2,254,761 2,057,367 2,532,199<br />
Capital Outlay 2,349,606 3,136,338 2,839,935 2,179,168<br />
Debt Service<br />
Total Non-Personnel 5,648,607 7,228,737 6,802,294 6,802,767<br />
Total Expenditures 10,051,854 12,796,593 11,850,377 12,645,043<br />
Net Transfers<br />
Revenue Sources<br />
Taxes<br />
Licenses & Permits<br />
Intergovernmental<br />
Charges for Services 10,368,137 10,936,500 10,961,733 10,548,852<br />
Interest Income 74,765 50,000 141,965 83,852<br />
All Other Revenue 1,177,894 950,477 950,477 875,479<br />
Total Revenue 11,620,796 11,936,977 12,054,175 11,508,183<br />
Funding to be Provided (1,568,942) 859,616 (203,798) 1,136,860<br />
D-200 Fiscal Year <strong>2008</strong> Annual Budget
Administrative Services<br />
MISSION<br />
To provide the administrative overhead and structure to enable the <strong>City</strong> <strong>of</strong> <strong>Lakeland</strong>’s Departments and<br />
operational Divisions to effectively carry out their respective missions.<br />
CORE SERVICES<br />
The Program Budget format is intended to identify the significant cost and revenue centers associated with<br />
the delivery <strong>of</strong> a wide range <strong>of</strong> municipal services desired by the <strong>Lakeland</strong> residents. The structure <strong>of</strong> the<br />
budget is non-departmentally based by design in order to capture the expenses and revenues attributable<br />
to a given Activity, regardless <strong>of</strong> which or how many departments may be assisting in the delivery <strong>of</strong><br />
service. As such, a number <strong>of</strong> Departments, including the <strong>City</strong> Manager, Risk Management, Human<br />
Resources, Finance, Treasurer, Internal Auditor, <strong>City</strong> Attorney and Retirement Services do not provide end<br />
services to the general public in and <strong>of</strong> themselves, but rather play a supporting administrative role in the<br />
delivery <strong>of</strong> the identified Activities. These Departments have not been established as Internal Service<br />
Funds although their respective costs have been consolidated in this Activity and have been spread<br />
throughout the Program Budget’s Activities. The allocation <strong>of</strong> costs based upon a number <strong>of</strong> factors such<br />
as personnel counts, fixed percentages <strong>of</strong> both personnel and non-personnel costs, which have been<br />
developed by the Department derived upon estimated allocation <strong>of</strong> hours and/or through direct<br />
departmental allocations to the extent that particular departmental costs can be attributed to a given activity.<br />
PERFORMANCE MEASURES (KSI’S)<br />
HUMAN RESOURCES<br />
GOAL: Economic Opportunity<br />
OUTCOME: Enriched Organization Workforce<br />
KSI: Organizational Training Hours (<strong>2008</strong> Goal: 23.69 hours per FTE)<br />
Objective: Total training hours for all departments.<br />
KSI: Turnover/Retention (<strong>2008</strong> Goal: 65% <strong>of</strong> Certification display adequately diverse<br />
candidates)<br />
Objective: Measurement <strong>of</strong> job applicant diversity being achieved.<br />
KSI: Measure <strong>of</strong> Employee Job Satisfaction (<strong>2008</strong> Goal: 134 total rating out <strong>of</strong> 216)<br />
Objective: <strong>City</strong> <strong>of</strong> <strong>Lakeland</strong> Employee Job Satisfaction survey.<br />
D-201 Fiscal Year <strong>2008</strong> Annual Budget
Administrative Services<br />
PERFORMANCE MEASURES (KSI’S) - CONTINUED<br />
HUMAN RESOURCES (Continued):<br />
GOAL: Communication<br />
OUTCOME: Informed and Engaged Community<br />
KSI: Citizen Volunteer Hours (<strong>2008</strong> Goal: 18,100 hours)<br />
GOAL: Quality <strong>of</strong> Life<br />
OUTCOME: Support Education<br />
KSI: Partnerships With Education (<strong>2008</strong> Goal: 9 partnerships)<br />
Objective: Number <strong>of</strong> partnerships established with educational agencies<br />
KSI: Mentoring Hours (<strong>2008</strong> Goal: 296 hours)<br />
Objective: Number <strong>of</strong> mentoring hours contributed by <strong>City</strong> <strong>of</strong> <strong>Lakeland</strong> employees<br />
KSI: Internships/Co-op Positions (<strong>2008</strong> Goal: 15 interns at 7,200 hours)<br />
Objective: Track the number <strong>of</strong> interns and co-ops employed by the <strong>City</strong>.<br />
FINANCE<br />
GOAL: Fiscal Management Goal<br />
OUTCOME: Optimal Management <strong>of</strong> Existing Financial Resources<br />
KSI: <strong>City</strong> Bond Ratings - ability to finance debt (<strong>2008</strong> Goal: Achieve average underlying<br />
bond ratings <strong>of</strong> A+ within two years on electric utility bonds and maintain no less than<br />
AA – ratings on our water/wastewater bonds.)<br />
Objective: Measure <strong>of</strong> <strong>City</strong>’s ability to finance debt<br />
KSI: Millage Rate (<strong>2008</strong> Goal: Maintain millage rates below state-wide average.)<br />
Objective: Millage rate<br />
OUTCOME: Develop New Financial Resources<br />
KSI: Annual Grant Dollars (<strong>2008</strong> Goal: $14,381,145)<br />
Objective: Total annual grant dollars received<br />
KSI: Annual Contributions and Donations to the <strong>City</strong> <strong>of</strong> <strong>Lakeland</strong> (<strong>2008</strong> Goal: $275,655)<br />
Objective: Net annual contributions and donations to the <strong>City</strong> <strong>of</strong> <strong>Lakeland</strong><br />
KSI: New Net Income Sources (<strong>2008</strong> Goal: To implement a survey <strong>of</strong> services recovered<br />
through a user charge (versus taxes) by other cities and determine opportunities.<br />
2007 Data: N/A)<br />
Objective: Net annual contributions from new (5 years per source) income streams<br />
GOAL: Quality <strong>of</strong> Life<br />
OUTCOME: Support the Arts and Wellness<br />
KSI: <strong>City</strong> Monies Supporting the Arts (<strong>2008</strong> Goal: Establish a trust fund equal to $2 million.)<br />
Objective: Dollars spent to support: theatre, dance, music and entertainment<br />
D-202 Fiscal Year <strong>2008</strong> Annual Budget
Administrative Services<br />
2007-08<br />
Experience Budget Experience Proposed<br />
For Year For Year 2006-07 by<br />
EXPENSES 2005-06 2006-07 Estimated <strong>City</strong> Manager<br />
Personnel<br />
Salaries & Wages 4,556,877 4,723,351 4,737,722 5,370,329<br />
Fringe Benefits 1,033,669 1,121,487 1,078,403 1,318,332<br />
Total Personnel 5,590,545 5,844,838 5,816,125 6,688,662<br />
Non-Personnel<br />
Internal Service Charges 932,005 833,120 849,505 996,173<br />
Pr<strong>of</strong>essional & Contractual 300,271 298,196 303,541 271,098<br />
Utilities 157,413 152,203 156,056 168,316<br />
Insurance and Fixed Charges 147 883 893 882<br />
All Other Operations and Maintenance 671,769 803,586 810,248 763,301<br />
Capital Outlay 16,206 78,583 75,042 10,108<br />
Debt Service<br />
Total Non-Personnel 2,077,809 2,166,572 2,195,285 2,209,877<br />
Total Expenditures 7,668,355 8,011,410 8,011,410 8,898,539<br />
Net Transfers 1,427,197 1,205,000 1,205,000<br />
Revenue Sources<br />
Taxes<br />
Licenses & Permits<br />
Intergovernmental<br />
Charges for Services 7,668,355 8,011,410 8,011,410 8,898,539<br />
Interest Income<br />
All Other Revenue<br />
Total Revenue 7,668,355 8,011,410 8,011,410 8,898,539<br />
Funding to be Provided (1,427,197) (1,205,000) (1,205,000)<br />
D-203 Fiscal Year <strong>2008</strong> Annual Budget
Administrative Services<br />
TABLE OF ORGANIZATION<br />
Please refer to the Supplementary Information section for complete Table <strong>of</strong> Organizations for the following<br />
departments:<br />
• <strong>City</strong> Attorney. page G-12<br />
• <strong>City</strong> Manager, page G-13<br />
• Finance, page G-47. Finance includes the Treasurer’s table <strong>of</strong> organization.<br />
• Human Resources, pages G-49 - 50<br />
• Internal Audit, page G-52<br />
• Risk Management, page G-72<br />
• Retirement Services, page G-73<br />
D-204 Fiscal Year <strong>2008</strong> Annual Budget
Table <strong>of</strong> Contents<br />
Line Item Budget ...........................................................................................................Section—E<br />
General Fund ................................................................................................................. E-7<br />
Community Development ........................................................................................... E-87<br />
Debt Service................................................................................................................. E-95<br />
Fleet Management ....................................................................................................... E-97<br />
Purchasing & Stores ................................................................................................. E-103<br />
Facilities Maintenance .............................................................................................. E-109<br />
Information Technology............................................................................................ E-115<br />
Wastewater Utility...................................................................................................... E-131<br />
Water Utility................................................................................................................ E-147<br />
Parking ....................................................................................................................... E-163<br />
<strong>Lakeland</strong> Center......................................................................................................... E-171<br />
Cleveland Heights Golf Course................................................................................ E-183<br />
<strong>Lakeland</strong> Linder Regional Airport............................................................................ E-191<br />
Solid Waste ................................................................................................................ E-203<br />
Stormwater................................................................................................................. E-211<br />
Electric Utility............................................................................................................. E-215<br />
E-1 Fiscal Year <strong>2008</strong> Annual Budget
Funds Overview<br />
The financial transactions <strong>of</strong> the <strong>City</strong> are reported in individual funds within the <strong>City</strong>’s accounting system.<br />
Each fund is accounted for by providing a separate, self-balancing set <strong>of</strong> accounts comprised <strong>of</strong> the<br />
assets, liabilities, reserves, fund equity, revenues and expenditures/expenses <strong>of</strong> each fund. GASB 34 sets<br />
forth the minimum criteria used to determine whether the individual funds are considered major<br />
versus non-major. The criteria are based on the value <strong>of</strong> assets, liabilities, revenues and expenditures/<br />
expenses <strong>of</strong> each fund in relation to all funds taken as a whole. Based on these criteria, the <strong>City</strong>’s major<br />
funds are the General Fund, Electric Utility Fund, and Water/Wastewater Utility Funds. Detailed<br />
information on these funds is provided in the basic financial statements.<br />
Within the fund financial statements, funds are also classified into fund types. A different basis <strong>of</strong><br />
accounting is applied to the various fund types, based on the nature <strong>of</strong> the financial information needed to<br />
sustain the types <strong>of</strong> services provided.<br />
Enterprise Funds: Used to account for operations that are financed and operated in a manner<br />
similar to private business enterprises. The primary customer <strong>of</strong> enterprise funds is the general<br />
public and the intent is that the costs relating to providing certain goods or services are primarily<br />
recovered through user fees and charges.<br />
• The Parking System Fund accounts for operating and maintaining parking facilities throughout the<br />
<strong>City</strong>, including three municipal parking garages.<br />
• The <strong>Lakeland</strong> Center Fund accounts for operating and maintaining the <strong>Lakeland</strong> Center for public<br />
shows, civic and cultural events, entertainment and other activities.<br />
• The Cleveland Heights Golf Course Fund accounts for operating and maintaining the <strong>City</strong>-owned<br />
golf course.<br />
• The <strong>Lakeland</strong> Linder Regional Airport Fund accounts for revenues and leases <strong>of</strong> buildings and<br />
land, commissions on the sale <strong>of</strong> gasoline, related operating expenses, and capital outlays<br />
necessary for maintaining a general aviation facility and an industrial park.<br />
• The Solid Waste Management Fund accounts for all activities necessary to provide refuse<br />
collection, disposal services and recycling to residents <strong>of</strong> the <strong>City</strong>.<br />
Internal Service Funds: Used to account for the financing <strong>of</strong> goods or services provided by one<br />
department to other departments <strong>of</strong> the <strong>City</strong> on a cost reimbursement basis.<br />
• The Purchasing and Stores Fund accounts for the cost <strong>of</strong> purchasing and maintaining custody <strong>of</strong><br />
supplies and materials. Services provided are billed based on an estimate <strong>of</strong> actual cost, including<br />
operating expenses and overhead.<br />
• The Fleet Management Fund accounts for renting and maintaining automotive equipment used by<br />
other <strong>City</strong> departments. User charges are assessed to cover actual costs, including operating<br />
expenses, overhead and depreciation.<br />
• The Self Insurance Fund accounts for the cost <strong>of</strong> claims and management fees incurred in<br />
providing employee health insurance, workers’ compensation, general liability, public <strong>of</strong>ficials’<br />
liability, airport general liability, automobile liability and trustee and fiduciary liability for the <strong>City</strong>.<br />
• The Internal Loan Fund accounts for internal loans that are made to other funds <strong>of</strong> the <strong>City</strong> for the<br />
purpose <strong>of</strong> financing operating deficits and capital acquisition costs that the <strong>City</strong> has determined<br />
should not be financed through the traditional tax-free debt market. All loans are interest bearing<br />
with defined repayment terms.<br />
E-2 Fiscal Year <strong>2008</strong> Annual Budget
Funds Overview<br />
Internal Service Funds (Cont’d):<br />
• The Information Technology Fund accounts for the cost <strong>of</strong> the information services incurred in<br />
providing network services, telephone, radio communications and general computer services and<br />
supplies. User charges are assessed to cover actual costs including operating expenses,<br />
overhead and depreciation.<br />
• The Facilities Maintenance Fund accounts for the cost <strong>of</strong> maintenance and janitorial services for all<br />
<strong>City</strong>-owned buildings. User charges are assessed to cover the actual costs, including operating<br />
expenses and overhead.<br />
Fiduciary Funds: Used to report assets held in a trustee or agency capacity for others and<br />
therefore can not be used to support the government’s own programs. Fiduciary funds include<br />
both pension trust funds and agency funds. Fiduciary Funds are measured by the Finance<br />
Department but not included in the budgeting process.<br />
• The Employees’ Pension and Retirement Fund accounts for the accumulation <strong>of</strong> resources used<br />
for retirement payments for <strong>City</strong> employees.<br />
• The Police Officers’ Supplemental Pension and Retirement System Fund accounts for the<br />
accumulation <strong>of</strong> resources used for retirement annuity payments to police <strong>of</strong>ficers. Resources are<br />
contributed by police <strong>of</strong>ficers at a rate <strong>of</strong> 1% <strong>of</strong> their salary and by the State <strong>of</strong> Florida from the<br />
proceeds <strong>of</strong> an excise tax imposed by the <strong>City</strong> on casualty insurance companies.<br />
• The Firefighters’ Supplemental Pension Plan Fund accounts for the accumulation <strong>of</strong> resources<br />
used for retirement annuity and death benefit payments for firefighters. Resources are contributed<br />
by firefighters at a rate <strong>of</strong> 3% <strong>of</strong> their salary and by the State <strong>of</strong> Florida from proceeds <strong>of</strong> an excise<br />
tax imposed by the <strong>City</strong> on fire insurance companies. The tax is collected by the State <strong>of</strong> Florida<br />
and remitted to the fund.<br />
• The Alternate Employee Pension Plan Fund accounts for the accumulation <strong>of</strong> assets designated<br />
for providing post-employment benefits for certain eligible employees enrolled in the plan. The<br />
assets <strong>of</strong> the <strong>City</strong>’s Alternate Pension Plan were transferred to a third part administrator in the<br />
name <strong>of</strong> the participants. The <strong>City</strong> no longer has any fiduciary responsibilities concerning the plan.<br />
The <strong>City</strong>’s involvement in the plan is limited to remitting the amounts paid by the participants to a<br />
third party.<br />
• The Death Benefit Fund accounts for the accumulation <strong>of</strong> resources used to provide continued life<br />
insurance to certain <strong>City</strong> employees after retirement. The maximum liability at year-end is<br />
completely funded.<br />
• The Survivor’s Benefit Trust Fund accounts for the accumulation <strong>of</strong> resources used for payment <strong>of</strong><br />
a death benefit to surviving spouses <strong>of</strong> certain retired employees.<br />
• The Impact Fee Agency Fund accounts for the deposits <strong>of</strong> transportation, emergency medical and<br />
jail construction impact fees collected on behalf <strong>of</strong> the County.<br />
Special Revenue Funds: Used to account for proceeds from certain specific revenue sources.<br />
These funds are recorded separately as directed by legal requirements, regulatory provisions, or<br />
administrative action. As with the General Fund, the primary accounting focus is on the sources <strong>of</strong><br />
available funds and the financial activity is reported using the modified accrual basis accounting.<br />
• The Transportation Funds’ major sources <strong>of</strong> revenues include taxes levied on motor fuels and<br />
impact fees. These revenues are used for projects approved by the <strong>City</strong> Commission, such as<br />
street improvements.<br />
E-3 Fiscal Year <strong>2008</strong> Annual Budget
Funds Overview<br />
Special Revenue Funds (cont’d):<br />
• The Public Improvement Fund consists <strong>of</strong> revenues primarily received from an agreement to lease<br />
a <strong>City</strong>-owned hospital facility to a not-for-pr<strong>of</strong>it corporation. The revenues are used to finance a<br />
variety <strong>of</strong> capital improvement projects not assignable to an enterprise operation and to pay debt<br />
service on long-term debt issued for the same purpose.<br />
• The Community Development Fund accounts for the funds provided by the Federal Department <strong>of</strong><br />
Housing and Urban Development for improvement projects and economic development assistance<br />
in low to moderate-income areas.<br />
• The State Housing Initiatives Partnership Program via the Florida Housing Finance Corporation<br />
through the local housing assistance trust fund provides funds for emergency repairs, new<br />
construction, rehabilitation, and other assistance in very low to moderate-income areas.<br />
• The Disaster Relief Home Assistance Program via the Florida Housing Finance Corporation<br />
provides funds for rehabilitation or reconstruction <strong>of</strong> residential homes due to damage from a<br />
disaster.<br />
• The Hurricane Housing Recovery Program via the Florida Housing Finance Corporation through<br />
the local housing assistance trust fund provides funds for emergency repairs, new construction,<br />
rehabilitation and disaster assistance in very low to moderate-income areas.<br />
• The Stormwater Fund accounts for revenues received primarily through the collection <strong>of</strong> residential<br />
and commercial fees as well as transfers from the Transportation Fund for drainage and lake<br />
projects and are used for projects approved by the <strong>City</strong> Commission for stormwater capital<br />
activities.<br />
• The <strong>Lakeland</strong> Community Redevelopment Agency accounts for revenues received primarily from<br />
the tax increment <strong>of</strong> the special taxing district established for the purpose <strong>of</strong> revitalizing the<br />
downtown <strong>Lakeland</strong> area.<br />
• The Impact Fee Fund accounts for impact fees collected for transportation, law enforcement, fire<br />
protection and parks and recreation. The Impact Fee Fund is measured by the Finance<br />
Department but not included in the budgeting process.<br />
• The Disaster Fund accounts for expenditures and revenues related to hurricane relief and recovery<br />
efforts. The Disaster Fund is measured by the Finance Department but not included in the<br />
budgeting process.<br />
Debt Service Fund: Used to account for the accumulation <strong>of</strong> resources for, and the payment <strong>of</strong>,<br />
general long-term debt principal and interest. The Debt Service Fund is measured by the Finance<br />
Department but not included in the budgeting process.<br />
Permanent Funds: Used to report resources that are legally restricted to the extent that only<br />
earnings, not principal, may be used for purposes that support the reporting government’s<br />
programs. The Permanent Funds are measured by the Finance Department but not included in<br />
the budgeting process.<br />
• The Oak Hill Burial Park Fund accounts for the accumulation <strong>of</strong> resources used to finance<br />
improvements to the Oak Hill Burial Park.<br />
• The Cemetery Perpetual Care Fund, when the corpus <strong>of</strong> this fund is sufficient, it will be used to<br />
account for the accumulation <strong>of</strong> resources used to maintain all <strong>City</strong>-owned cemeteries.<br />
• The Scott Morris Mausoleum Fund accounts for a contribution to provide maintenance <strong>of</strong> the Scott<br />
Morris Mausoleum.<br />
E-4 Fiscal Year <strong>2008</strong> Annual Budget
Funds Overview<br />
Permanent Funds (Cont’d):<br />
• The Webster Book Fund accounts for a bequest received by the <strong>City</strong> to purchase nonfiction<br />
books and periodicals for the <strong>City</strong> <strong>of</strong> <strong>Lakeland</strong> Public Library.<br />
• The Baldwin Book Fund accounts for a bequest received by the <strong>City</strong> to purchase general<br />
science and wholesome fiction books for the <strong>City</strong> <strong>of</strong> <strong>Lakeland</strong> Public Library.<br />
The combined Fiscal Year <strong>2008</strong> net budgeted expenditures for all funds are $596,447,887 This<br />
represents an increase <strong>of</strong> $9,101,072 or 2% over the Fiscal Year 2007 net budget. The Fiscal Year <strong>2008</strong><br />
budget is balanced, prudent and responsive to community needs. Projected revenues will be sufficient to<br />
support programmed expenditures.<br />
In 1987 a Polk County promotional<br />
booklet revealed that “this<br />
prosperous and wide awake<br />
town...has justly earned the name<br />
<strong>of</strong> the Magic <strong>City</strong> <strong>of</strong> South Florida.<br />
<strong>Lakeland</strong>’s three year old birthday<br />
will be celebrated in February,<br />
1887, when its population will<br />
number nearly one thousand<br />
souls.”<br />
E-5 Fiscal Year <strong>2008</strong> Annual Budget
<strong>City</strong>-Wide Fund Totals<br />
Experience Budget Experience FY 2006-07<br />
For Year For Year 2005-06 Proposed by<br />
EXPENSES 2004-05 2005-06 Estimated <strong>City</strong> Manager<br />
Personnel<br />
Salaries & Wages 77,042,802 88,974,583 82,804,430 92,837,001<br />
Fringe Benefits 16,879,103 20,198,434 17,946,360 21,982,203<br />
Total Personnel 93,921,904 109,173,017 100,750,789 114,819,203<br />
Non-Personnel<br />
Internal Service Charges 27,972,391 31,559,921 29,850,148 33,288,067<br />
Pr<strong>of</strong>essional & Contractual 12,814,601 15,452,525 13,547,414 14,903,377<br />
Utilities 12,850,079 12,790,968 13,016,939 13,639,410<br />
Insurance and Fixed Charges 5,732,738 6,550,289 5,690,727 6,389,172<br />
All Other Operations and Maintenance 291,804,182 291,415,682 292,625,428 271,856,087<br />
Capital Outlay 67,705,193 141,719,802 140,342,138 80,461,202<br />
Debt Service 53,417,396 64,103,243 63,802,015 61,091,370<br />
Total Non-Personnel 472,296,578 563,592,429 558,874,808 481,628,684<br />
Total Expenditures 566,218,483 672,765,445 659,625,597 596,447,887<br />
Transfers<br />
Transfers In 35,571,555 33,212,055 33,159,180 39,425,837<br />
Transfers Out (35,571,555) (33,212,055) (33,159,180) (39,425,837)<br />
Net Transfers<br />
Revenue Sources<br />
Taxes 34,836,790 38,029,844 38,674,525 40,060,530<br />
Licenses & Permits 4,409,051 5,041,547 4,052,127 4,177,458<br />
Intergovernmental 26,890,995 39,383,120 37,477,309 23,917,593<br />
Charges for Services 460,306,701 465,099,629 466,297,060 483,475,291<br />
Interest Income 6,810,274 6,855,903 6,742,167 6,067,417<br />
All Other Revenue 29,726,583 72,888,052 84,145,296 33,708,271<br />
Total Revenue 562,980,395 627,298,095 637,388,485 591,406,560<br />
Funding to be Provided 3,238,088 45,467,350 22,237,113 5,041,328<br />
E-6 Fiscal Year <strong>2008</strong> Annual Budget
REVENUE AND EXPENDITURE SUMMARY<br />
GENERAL FUND<br />
Experience Budget Experience 2007-08<br />
For Year For Year 2006-07 Proposed by<br />
EXPENSES 2005-06 2006-07 Estimated <strong>City</strong> Manager<br />
Personnel<br />
Salaries and Wages 44,978,363 51,214,203 48,637,389 53,709,460<br />
Fringe Benefits 9,842,501 11,614,163 10,535,206 12,999,019<br />
Total Personnel 54,820,864 62,828,366 59,172,596 66,708,479<br />
Non-Personnel<br />
Internal Service Charges 9,644,812 10,365,876 10,464,410 10,996,911<br />
Pr<strong>of</strong>essional and Contractual 838,632 1,061,168 994,460 929,440<br />
Utilities 6,799,312 6,806,094 6,854,379 7,209,379<br />
Insurance and Fixed Charges 2,506,616 2,406,467 2,341,256 2,462,898<br />
All Other Operations and Maintenance 7,948,689 10,540,132 10,490,909 9,393,781<br />
Capital Outlay 395,720 1,832,342 1,230,825 160,252<br />
Debt Service<br />
Total Non-Personnel 28,133,781 33,012,079 32,376,238 31,152,660<br />
Total Expenditures 82,954,645 95,840,445 91,548,834 97,861,140<br />
Transfers<br />
Allocations to Other Funds 7,668,355 8,011,410 8,011,410 8,898,539<br />
Transfers In 30,355,406 28,163,917 28,163,917 34,884,637<br />
Transfers Out (2,276,202) (2,305,438) (2,305,438) (2,180,969)<br />
Net Transfers 35,747,559 33,869,889 33,869,889 41,602,207<br />
Revenue Sources<br />
Taxes 29,237,547 32,816,844 32,918,525 34,274,530<br />
Licenses and Permits 4,409,051 5,041,547 4,052,127 4,177,458<br />
Intergovernmental 10,735,434 11,618,418 10,886,050 10,372,061<br />
Charges for Services 3,290,810 3,327,290 3,594,945 3,044,162<br />
Interest Income 640,720 930,958 1,069,434 952,281<br />
All Other Revenue 2,904,375 2,333,033 2,395,391 1,746,325<br />
Total Revenue 51,217,937 56,068,090 54,916,472 54,566,817<br />
Funding to be Provided (4,010,851) 5,902,466 2,762,473 1,692,116<br />
E – 7
GENERAL FUND REVENUES<br />
BUDGET FOR YEAR 2007-08<br />
Experience Budget Experience Proposed Adjustments<br />
For Year For Year 2006-07 by by<br />
REVENUES 2005-06 2006-07 Estimated <strong>City</strong> Manager Commission<br />
TAXES<br />
Ad Valorem Taxes 14,754,894 17,378,088 17,878,800 18,686,678 ___________<br />
Communications / Utility Tax 14,161,873 15,091,156 14,733,668 15,266,492 ___________<br />
Franchise Taxes 320,780 347,600 306,057 321,360 ___________<br />
LICENSES & PERMITS<br />
Occupational Licenses 1,485,796 1,554,384 1,554,459 1,679,790 ___________<br />
Building Permits 2,923,255 3,487,163 2,497,668 2,497,668 ___________<br />
INTERGOVERNMENTAL REVENUES<br />
Federal Grants 116,729 281,168 191,857 66,874 ___________<br />
State Grants 977,672 728,160 681,100 352,992 ___________<br />
Local Grants 290,919 703,793 703,793 468,802 ___________<br />
State Shared Revenues 8,617,169 8,927,031 8,320,998 8,356,000 ___________<br />
County Shared Revenues 701,782 933,527 943,563 1,110,393 ___________<br />
Payments in Lieu <strong>of</strong> Taxes 31,163 44,739 44,739 17,000 ___________<br />
CHARGES FOR SERVICES<br />
General Government 264,688 265,410 271,669 269,667 ___________<br />
Public Safety 582,097 1,112,207 1,570,038 530,186 ___________<br />
Cemetery Fees 138,867 249,890 273,435 264,600 ___________<br />
Lot Mowing/Demolition 170,378 242,130 293,979 266,910 ___________<br />
Transportation 1,425 2,816 3,150 3,000 ___________<br />
Library 70 200 ___________<br />
Parks & Recreation Activities 384,429 1,057,083 1,088,845 1,066,250 ___________<br />
Stadiums 189,201 247,916 270,182 300,324 ___________<br />
Auditoriums 113,743 222,278 232,217 319,075 ___________<br />
Other Parks & Recreation 12,232 26,636 26,668 23,950 ___________<br />
FINES & FORFEITS<br />
Court Cases 356,858 947,787 665,598 540,000 ___________<br />
Library Fines 17,550 37,563 39,000 40,000 ___________<br />
Local Ordinance Violation 4,340,579 4,545,140 275,000 210,000 ___________<br />
Other 762 1,725 1,500 1,500 ___________<br />
MISCELLANEOUS REVENUE<br />
Interest Earnings 513,747 855,220 1,069,434 952,281 ___________<br />
Rents and Royalties 172,942 216,844 177,802 136,589 ___________<br />
Sales for Loss <strong>of</strong> Fixed Assets 163,999 303,836 338,368 316,300 ___________<br />
Contributions & Donations 73,747 203,802 108,698 5,000 ___________<br />
Refund <strong>of</strong> Prior Year Expense<br />
Reimbursements 34,500 34,500 34,500 34,500 ___________<br />
Other 48,000 48,000 48,000 48,000 ___________<br />
NON-OPERATING REVENUES<br />
Interfund Transfers 5,888,026 5,224,026 5,135,941 4,117,108 ___________<br />
Dividend from Enterprise<br />
Operations 24,722,133 23,344,563 23,344,563 31,181,965 ___________<br />
Contributed Utility Service<br />
SURPLUS - PRIOR YEARS (4,899,782) 1,761,868 2,911,221 1,692,116 ___________<br />
TOTAL REVENUES 77,672,153 90,428,119 86,036,510 91,143,570<br />
E – 8
GENERAL FUND EXPENSES<br />
BUDGET FOR YEAR 2007-08<br />
Experience Budget Experience Proposed Adjustments<br />
For Year For Year 2006-07 by by<br />
EXPENSES 2005-06 2006-07 Estimated <strong>City</strong> Manager Commission<br />
CITY COMMISSION 65,962 87,887 66,700 88,133 ___________<br />
CITY MANAGER 309,750 273,387 271,454 298,994 ___________<br />
COMMUNICATIONS 301,570 394,203 362,560 310,532 ___________<br />
LEGAL 155,606 233,924 245,290 236,426 ___________<br />
RETIREMENT SERVICES 275,220 261,661 162,544 ___________<br />
HUMAN RESOURCES 727,130 851,225 737,132 1,039,364 ___________<br />
COMMUNITY DEVELOPMENT<br />
Planning 1,882,976 2,757,569 2,444,154 2,416,784 ___________<br />
Code Enforcement 792,206 1,047,028 1,004,692 799,325 ___________<br />
Building Inspection 1,747,196 2,821,821 2,507,380 1,760,928 ___________<br />
RISK MANAGEMENT 421,078 535,390 514,292 590,767 ___________<br />
INTERNAL AUDIT 44,196 52,077 52,064 53,290 ___________<br />
FINANCE DEPARTMENT<br />
Central Accounting 755,073 902,313 885,288 1,050,822 ___________<br />
<strong>City</strong> Clerk 463,232 484,366 462,455 423,152 ___________<br />
<strong>City</strong> Treasurer 87,919 65,934 66,217 26,537 ___________<br />
Electric & Water Finance 10,300 10,300<br />
Utilities Billing 927 70,175 69,546 143,663 ___________<br />
FIRE DEPARTMENT 10,121,658 11,302,119 11,328,022 12,789,974 ___________<br />
POLICE DEPARTMENT 28,777,211 31,488,361 30,567,731 32,738,663 ___________<br />
PUBLIC WORKS<br />
Director 474,275 505,727 460,562 561,282 ___________<br />
Engineering 943,787 1,156,765 1,064,362 1,311,839 ___________<br />
Construction and Maintenance 2,768,210 3,495,989 3,290,442 3,486,717 ___________<br />
Lakes and Stormwater 209,213 244,020 198,550<br />
Traffic Engineering 985,920 1,041,055 1,014,528 1,095,408 ___________<br />
Facilities Maintenance<br />
PARKS AND RECREATION<br />
Director 372,698 354,309 341,435 356,884 ___________<br />
Parks 7,134,619 7,756,632 7,628,294 7,882,846 ___________<br />
Recreation 3,790,779 4,525,533 4,285,766 4,829,911 ___________<br />
Library 2,330,326 2,990,462 2,857,211 2,907,783 ___________<br />
Branch Library 353,304 393,777 380,381 433,917 ___________<br />
Cemeteries 742,079 710,352 685,245 781,932 ___________<br />
NON-DEPARTMENTAL 10,913,253 13,600,199 11,972,796 12,565,153 ___________<br />
TOTAL EXPENSES 77,672,153 90,428,119 86,036,510 91,143,570<br />
E – 9
GENERAL FUND<br />
REVENUES<br />
BUDGET FOR YEAR 2007-08<br />
Experience Budget Experience Proposed Adjustments<br />
For Year For Year 2006-07 by by<br />
REVENUES 2005-06 2006-07 Estimated <strong>City</strong> Manager <strong>City</strong> Commission<br />
TAXES<br />
Ad Valorem Taxes<br />
Current Ad Valorem Taxes 15,205,810 18,219,040 18,743,158 19,593,556 ___________<br />
Ad Valorem Tax Discounts & Costs (529,151) (910,952) (937,158) (979,678) ___________<br />
Delinquent Ad ValoremTaxes 54,401 45,000 46,800 46,800 ___________<br />
Interest On Delinquent Ad Valorem Taxes 23,834 25,000 26,000 26,000 ___________<br />
SUB-TOTAL 14,754,894 17,378,088 17,878,800 18,686,678<br />
Utility Taxes<br />
Utility Tax-Misc<br />
Utility Tax-Propane 273,051 282,435 331,596 351,492 ___________<br />
Utility Tax-Electric 6,598,518 6,675,500 6,880,000 7,150,000 ___________<br />
Utility Tax-Water 1,155,269 1,383,221 1,287,072 1,365,000 ___________<br />
Telecommunication Revenues 6,135,035 6,750,000 6,235,000 6,400,000 ___________<br />
SUB-TOTAL 14,161,873 15,091,156 14,733,668 15,266,492<br />
Franchise Fees<br />
Gas Companies - Franchise 320,780 347,600 306,057 321,360 ___________<br />
SUB-TOTAL 320,780 347,600 306,057 321,360<br />
TOTAL TAXES & FEES 29,237,547 32,816,844 32,918,525 34,274,530<br />
LICENSES & PERMITS<br />
Local Business Licenses<br />
Local Business Licenses 1,471,847 1,537,684 1,537,684 1,663,005 ___________<br />
Penalties 12,725 15,000 15,000 15,000 ___________<br />
Transfer & Dup Fees 886 1,500 1,500 1,500 ___________<br />
Collection Fees 188 200 200 210 ___________<br />
All Other 150 75 75 ___________<br />
SUB-TOTAL 1,485,796 1,554,384 1,554,459 1,679,790<br />
Building Permits<br />
Building Inspection Fees 1,680,378 2,164,290 1,401,639 1,401,639 ___________<br />
Plumbing Inspection Fees 226,325 220,561 170,115 170,115 ___________<br />
Mechanical Inspection Fees 165,745 158,706 129,397 129,397 ___________<br />
Electrical Inspection Fees 178,365 155,945 133,682 133,682 ___________<br />
Landscape Inspection Fees 2,090 2,948 2,220 2,220 ___________<br />
Other Building Inspection Fees 668,325 780,254 656,156 656,156 ___________<br />
Building Permit Surcharge Admin. Fees 2,027 4,459 4,459 4,459 ___________<br />
SUB-TOTAL 2,923,255 3,487,163 2,497,668 2,497,668<br />
TOTAL LICENSES & PERMITS 4,409,051 5,041,547 4,052,127 4,177,458<br />
E – 10
GENERAL FUND<br />
REVENUES<br />
BUDGET FOR YEAR 2007-08<br />
Experience Budget Experience Proposed Adjustments<br />
For Year For Year 2006-07 by by<br />
REVENUES 2005-06 2006-07 Estimated <strong>City</strong> Manager <strong>City</strong> Commission<br />
INTERGOVERNMENTAL REVENUE<br />
Federal Grants<br />
DOJ - Justic Assistance 92,597 92,597 44,704 ___________<br />
DOJ Bullet Pro<strong>of</strong> Vests 9,587 52,395 12,364 22,170 ___________<br />
BJA - Safe Neighborhoods 107,142 86,896 86,896<br />
Forensic Science 49,280<br />
SUB-TOTAL 116,729 281,168 191,857 66,874<br />
State Grants<br />
FDLE - Neighborhood Enforcement Team 52,502 4,432 1,432<br />
FOAG - Victim Assistance Program 92,504 99,496 104,157 115,275 ___________<br />
Stop Violence Against Women (DART) 63,273 68,645 41,224 41,224 ___________<br />
Wilma SEOC Mutual Aid 1,567<br />
Mutual Aid Hurricane Wilma #792 27,569<br />
FDOT-Hwy Lighting & Traffic Signal Maint. 423,008<br />
FDOT-Parks R/W Maintenance 168,400 196,493 196,493 196,493 ___________<br />
FDOT-DUI Enforcement Equipment 22,100 22,100<br />
DCA - Mutual Aid - Katrina Mission 65 8,353<br />
U&CF-Tree Inventory - Northside 15,233 117,258 101,000<br />
U&CF-Tree Inventory - Southside 9,359 117,042 112,000<br />
U&CF-Tree Remediation - SE Quadrant 31,374 102,694 102,694<br />
U&CF-Cemetery Tree Planting 84,530<br />
SUB-TOTAL 977,672 728,160 681,100 352,992<br />
Local Grants<br />
Polk County School Board-SRO 194,512 382,333 382,333 393,802 ___________<br />
High Intensity Drug Trafficking Area 15,408 18,592 18,592<br />
PCCVB-Reimbursable Expenses 3,750 3,250 3,250<br />
Neighborhood Clean Up Project 77,249 299,618 299,618 75,000 ___________<br />
SUB-TOTAL 290,919 703,793 703,793 468,802<br />
E – 11
GENERAL FUND<br />
REVENUES<br />
BUDGET FOR YEAR 2007-08<br />
Experience Budget Experience Proposed Adjustments<br />
For Year For Year 2006-07 by by<br />
REVENUES 2005-06 2006-07 Estimated <strong>City</strong> Manager <strong>City</strong> Commission<br />
State Shared Revenues<br />
Alcoholic Beverage License Tax 60,222 60,000 70,998 71,000 ___________<br />
Local Government Half-Cent Sales Tax 6,004,380 6,195,000 5,700,000 5,725,000 ___________<br />
State Revenue Sharing 2,330,366 2,437,031 2,325,000 2,325,000 ___________<br />
Mobile Home License Fees 197,190 210,000 200,000 210,000 ___________<br />
Firefighters Compensation Tax 25,011 25,000 25,000 25,000 ___________<br />
SUB-TOTAL 8,617,169 8,927,031 8,320,998 8,356,000<br />
Shared Revenues From Other Local Units<br />
County Local Business Licenses 48,966 56,000 56,000 56,000 ___________<br />
County-wide Bookmobile Program 101,316 101,316 101,316 98,321 ___________<br />
County-Wide Library Cooperative 551,500 583,906 593,942 675,181 ___________<br />
County-Wide Library Coop. - eLibrary 192,305 192,305 280,891 ___________<br />
SUB-TOTAL 701,782 933,527 943,563 1,110,393<br />
Payments From Other Local units in Lieu <strong>of</strong> Taxes<br />
<strong>Lakeland</strong> Housing Authority 31,163 44,739 44,739 17,000 ___________<br />
SUB-TOTAL 31,163 44,739 44,739 17,000<br />
TOTAL INTERGOVERNMENTAL 10,735,434 11,618,418 10,886,050 10,372,061<br />
CHARGES FOR SERVICES<br />
General Government<br />
Zoning & Subdivision Fees 155,101 120,000 150,101 150,500 ___________<br />
Zoning Verification Letters 2,150 3,900 3,450 ___________<br />
Site Plan Review Fees 51,000 51,000 51,000 ___________<br />
Sales- Maps & Publication 7,833 9,000 5,044 6,169 ___________<br />
Certification Copying, Research Fees 1,411 1,600 838 838 ___________<br />
Sales-Yesterday's <strong>Lakeland</strong> 28<br />
County Impact Fees-Administration 17,044 11,000 10,809 11,000 ___________<br />
School Impact Fees Admin. Charges 68,254 60,000 32,147 28,000 ___________<br />
Special Assessment/Application Fees 1,050 7,470 5,900 ___________<br />
Court Witness Fees 5<br />
Fire Union Dues Administrative Fee 821 800 707 800 ___________<br />
LPD Union Dues Administrative Fee 1,521 1,510 1,302 1,510 ___________<br />
Garnishment Fees 9,130 9,000 8,307 9,000 ___________<br />
Other General Government Charges 340 1,500 44 1,500 ___________<br />
SUB-TOTAL 264,688 265,410 271,669 269,667<br />
E – 12
GENERAL FUND<br />
REVENUES<br />
BUDGET FOR YEAR 2007-08<br />
Experience Budget Experience Proposed Adjustments<br />
For Year For Year 2006-07 by by<br />
REVENUES 2005-06 2006-07 Estimated <strong>City</strong> Manager <strong>City</strong> Commission<br />
Public Safety<br />
Police Services Reimbursement 524,546 442,878 572,000<br />
Polk Community College IPS Coordinator 79,832 80,000 80,000 80,000 ___________<br />
Chauffeurs Permits 625 800 750 800 ___________<br />
Court Witness Fees - Police 3,042 3,000 3,000 3,000 ___________<br />
Other Public Safety Charges - Police 107,525 118,000 118,000 118,000 ___________<br />
Fire-Site Plan Review Fee 195,380 185,000 203,199 214,250 ___________<br />
Fire Inspection Permits 30,259 26,000 57,317 50,500 ___________<br />
Fire Inspection Permits - Other 88,855 120,000 80,835 60,000 ___________<br />
Fire Inspection Permits 119,114 146,000 138,152 110,500 ___________<br />
Training Project 10,829<br />
Other Public Safety Charges - Fire 12,635 15,000 1,230 3,636 ___________<br />
SUB-TOTAL 1,042,699 990,678 1,570,038 530,186<br />
Physical Environment/Cemetery Fees<br />
Opening Graves 203,683 228,000 235,894 233,230 ___________<br />
All Other Revenues 32,856 30,500 37,541 31,370 ___________<br />
SUB-TOTAL 236,539 258,500 273,435 264,600<br />
Other Physical Environment Revenue<br />
Lot Mowing & Clearing Assessments 165,965 170,200 203,906 178,710 ___________<br />
Demolition Of Bldgs-Assessments 54,788 84,000 90,073 88,200 ___________<br />
SUB-TOTAL 220,753 254,200 293,979 266,910<br />
Transportation<br />
Other Transportation Receipts 4,268 3,000 3,150 3,000 ___________<br />
Culture-Recreation/Libraries<br />
Library Non-Resident Fees 175 200 200 ___________<br />
Parks & Recreation<br />
Tournament Fees 18,526 22,000 22,545 22,000 ___________<br />
Swimming Pools 85,517 60,400 85,182 60,400 ___________<br />
Swimming Classes 21,616 25,000 17,355 25,000 ___________<br />
Weight Room Fees 89,840 101,750 101,750 101,750 ___________<br />
Recreation Fees - Reserve for<br />
New Recreational Facilities 105,047 104,000 131,778 104,000 ___________<br />
Parade Entry Fee 1,250 3,600 3,235 3,600 ___________<br />
Overtime Charges 125,618 89,203 89,203<br />
Hollis Gardens Rentals 38,267 40,500 49,175 75,500 ___________<br />
All Other Revenue 42,814 47,000 55,109 47,000 ___________<br />
SUB-TOTAL 1,010,962 1,010,453 1,088,845 1,066,250<br />
E – 13
GENERAL FUND<br />
REVENUES<br />
BUDGET FOR YEAR 2007-08<br />
Experience Budget Experience Proposed Adjustments<br />
For Year For Year 2006-07 by by<br />
REVENUES 2005-06 2006-07 Estimated <strong>City</strong> Manager <strong>City</strong> Commission<br />
Special Recreation Facilities - Stadiums<br />
Marchant Stadium 138<br />
Marchant Stadium-Training 118,703 132,000 101,679 132,000 ___________<br />
Marchant Stadium Parking 109,231 118,000 153,179 153,000 ___________<br />
Tigertown Dorm Rental 15,252 15,324 15,324 15,324 ___________<br />
SUB-TOTAL 243,324 265,324 270,182 300,324<br />
Special Recreation Facilities - Auditoriums<br />
Lake Mirror Center 68,770 84,000 40,000 101,000 ___________<br />
Lake Mirror Theater 4,425 4,400 207 4,400 ___________<br />
Lake Mirror Loggia 400 600 600 ___________<br />
Lake Mirror Glass Lounge 2,087 2,900 2,900 2,900 ___________<br />
Lake Mirror Center 75,682 91,900 43,107 108,900 ___________<br />
Magnolia Building 96,661 86,000 100,209 112,000 ___________<br />
Peggy Brown Building - Downstairs 188 375 234 375 ___________<br />
Peggy Brown Building - Upstairs 40,000 43,000 48,848 53,000 ___________<br />
Tigertown Hanger Rental 5,088 6,000 9,010 6,000 ___________<br />
Coleman-Bush Building 25,575 27,300 30,809 38,800 ___________<br />
SUB-TOTAL 243,194 254,575 232,217 319,075<br />
Special Recreation Facilities - Other<br />
Bowling Greens 2,771 4,000 2,771 3,000 ___________<br />
Lake Mirror Park Fees 8,867 7,500 12,694 7,500 ___________<br />
Lake Parker Park-Pavilions 11,645 12,500 10,468 12,500 ___________<br />
Shuffleboard Club 925 950 735 950 ___________<br />
SUB-TOTAL 24,208 24,950 26,668 23,950<br />
TOTAL CHARGES FOR SERVICES 3,290,810 3,327,290 4,030,183 3,044,162<br />
FINES & FORFEITS<br />
Court Cases<br />
Court Cases 515,239 600,000 480,000 500,000 ___________<br />
Police Education 40,090 40,000 40,000 40,000 ___________<br />
Confiscated Property-Statute 932 57,246 26,829 26,829<br />
Confiscated Cash-Statute 932 395,702 118,769 118,769<br />
SUB-TOTAL 1,008,277 785,598 665,598 540,000<br />
E – 14
GENERAL FUND<br />
REVENUES<br />
BUDGET FOR YEAR 2007-08<br />
Experience Budget Experience Proposed Adjustments<br />
For Year For Year 2006-07 by by<br />
REVENUES 2005-06 2006-07 Estimated <strong>City</strong> Manager <strong>City</strong> Commission<br />
Library Fines 42,493 40,000 39,000 40,000 ___________<br />
Violation <strong>of</strong> Local Ordinances<br />
Code Enforcement Board 306,208 210,000 275,000 210,000 ___________<br />
Other Fines and/or Forfeits<br />
Bad Check Charges 1,560 1,500 1,500 1,500 ___________<br />
TOTAL FINES & FORFEITS 1,358,538 1,037,098 981,098 791,500<br />
MISCELLANEOUS REVENUE<br />
Interest Earnings<br />
Interest on Investments<br />
Interest on Pooled Investments -<br />
General Fund 525,996 799,750 891,635 800,791 ___________<br />
Law Enforcement Trust Fund 5,165 4,868 8,944 8,717 ___________<br />
Federally Forfeited Property 8,782 11,010 20,000 20,000 ___________<br />
Hollis Gardens Maintenance Trust 19,422 27,246 29,231 30,000 ___________<br />
New Recreation Facilities 7,889 10,052 15,057 14,674 ___________<br />
Cultural Activities Reserve 43,612 63,032 64,529 62,889 ___________<br />
DOJ Grant 6 1,291 210 ___________<br />
Interest from County 26,236 13,000 34,373 13,000 ___________<br />
Interest from Registry <strong>of</strong> Court 3,355 2,000 3,674 2,000 ___________<br />
Other Interest 257 700<br />
SUB-TOTAL 640,720 930,958 1,069,434 952,281<br />
Rents and Royalties<br />
Buildings-Amtrak Lease 33,501 33,501 31,889 33,501 ___________<br />
Federal Building 117,331 95,798 56,191 13,558 ___________<br />
Nextel-Antenna Tower Rent 31,740 31,740 31,740 ___________<br />
Tower Space Rental 3,900 3,708 ___________<br />
PCC Lease Of Police Vehicles 1,250<br />
Parking Garage - Sun Trust - Leased 21,300 21,300 21,300 21,300 ___________<br />
Buildings-Lake Wire Church <strong>of</strong> God 6,300 8,400<br />
Magnolia Building - Garden Bistro 19,308 19,308 19,308 19,308 ___________<br />
Sprintcom.Inc - Bryant Stadium 12,000 12,000 12,000 12,000 ___________<br />
Sprintcom.Inc - N Socrum Loop (Hemp Hill) (2,500) 30,000<br />
Church <strong>of</strong> God Gospel Tabernacle 1,105 1,474 1,474 1,474 ___________<br />
Building Leases - Other 32,788<br />
SUB-TOTAL 242,383 253,521 177,802 136,589<br />
E – 15
GENERAL FUND<br />
REVENUES<br />
BUDGET FOR YEAR 2007-08<br />
Experience Budget Experience Proposed Adjustments<br />
For Year For Year 2006-07 by by<br />
REVENUES 2005-06 2006-07 Estimated <strong>City</strong> Manager <strong>City</strong> Commission<br />
Sales & Compensation for Loss <strong>of</strong> Fixed Assets<br />
Cemetery Lots 333,203 300,000 330,448 311,300 ___________<br />
Scrap Sales 5,814 4,920 4,920 5,000 ___________<br />
Surplus Furniture & Equipment Sales 63,056 3,000 3,000<br />
SUB-TOTAL 402,073 307,920 338,368 316,300<br />
Contributions & Donations from Private Sources<br />
Contributions & Donations 266,364 108,198 108,698 5,000 ___________<br />
SUB-TOTAL 266,364 108,198 108,698 5,000<br />
Refund <strong>of</strong> Prior Year Expenditures<br />
Refund <strong>of</strong> Prior Year Expenses 1,309 2,191<br />
Reimbursements<br />
Reimbursements 117,514 72,946 87,566 34,500 ___________<br />
SUB-TOTAL 117,514 72,946 87,566 34,500<br />
Other<br />
Concessions-Contractual 3,006 627<br />
Investigative Cost Reimb. - Police 134,983 100,678 100,678<br />
Ins. Proceeds - Workers Comp Claims 24,869 9,390<br />
Cash Over And Short (66) 333<br />
All Other Miscellaneous Revenue 98,649 48,000 172,053 48,000 ___________<br />
SUB-TOTAL 261,441 148,678 283,081 48,000<br />
TOTAL MISCELLANEOUS<br />
REVENUE 1,931,804 1,822,221 2,067,140 1,492,670<br />
NON-REVENUES<br />
Interfund Transfers<br />
Cemetery Perpetual Care Fund 25,469 135,918 135,918 138,091 ___________<br />
Hollis Gardens Maintenance Trust 53,514 53,514 53,514 ___________<br />
General Fund-Cultural Activities 150,350 131,879 131,879 137,869 ___________<br />
Employee Pension 51,930 53,361 53,361 54,962 ___________<br />
Public Improvement Fund:<br />
Cultural Activities 100,000 100,000 100,000 ___________<br />
All Other 5,040,000 4,075,000 4,075,000 3,000,000 ___________<br />
Uninsured Loss Fund 3,346<br />
Impact Fee - Administration 23,658 30,000 41,915 30,000 ___________<br />
Transportation Fund 409,273 412,551 412,551 415,928 ___________<br />
CRA 84,000 231,803 231,803 186,744 ___________<br />
SUB-TOTAL 5,888,026 5,224,026 5,135,941 4,117,108<br />
E – 16
GENERAL FUND<br />
REVENUES<br />
BUDGET FOR YEAR 2007-08<br />
Experience Budget Experience Proposed Adjustments<br />
For Year For Year 2006-07 by by<br />
REVENUES 2005-06 2006-07 Estimated <strong>City</strong> Manager <strong>City</strong> Commission<br />
Contributions from Enterprise Operations<br />
Wastewater 1,770,821 1,754,555 1,754,555 1,965,102 ___________<br />
Water Utilities 3,664,114 3,734,108 3,734,108 3,902,143 ___________<br />
<strong>Lakeland</strong> Electric Utilities 18,000,000 16,600,000 16,600,000 24,000,000 ___________<br />
Solid Waste 1,287,198 1,255,900 1,255,900 1,314,720 ___________<br />
SUB-TOTAL 24,722,133 23,344,563 23,344,563 31,181,965<br />
TOTAL NON-REVENUES 30,610,159 28,568,589 28,480,504 35,299,073<br />
TOTAL REVENUES 81,573,343 84,232,007 83,415,627 89,451,454<br />
SURPLUS - PRIOR YEARS (3,901,200) 6,155,312 2,414,941 1,692,116<br />
GRAND TOTAL 77,672,143 90,387,319 85,830,568 91,143,570<br />
E – 17
GENERAL FUND<br />
CITY COMMISSION<br />
BUDGET FOR YEAR 2007-08<br />
Experience Budget Experience Proposed Adjustments<br />
For Year For Year 2006-07 by by<br />
EXPENSES 2005-06 2006-07 Estimated <strong>City</strong> Manager <strong>City</strong> Commission<br />
PERSONAL SERVICES 196,511 197,556 180,492 180,865<br />
OPERATING EXPENSES<br />
Pensions 13,316 13,316 13,320 13,316 ___________<br />
Water Utility Service 167 206 159 158 ___________<br />
Electric Utility Service 7,834 7,669 7,550 8,787 ___________<br />
Wastewater Utility Service 166 223 176 189 ___________<br />
Solid Waste Service 332 375 344 395 ___________<br />
Purchasing & Stores Service 510 542 542 585 ___________<br />
Intra-Dept Charges - Computer Rental 6,498 4,596 4,596 19,749 ___________<br />
Intra-Dept Charges - Telephone 4,313 4,273 4,304 4,957 ___________<br />
Intra-Dept Charges - Facilities 4,347 4,932 4,932 6,114 ___________<br />
Intra-Dept Charges - Janitorial 4,438 5,025 5,024 4,719 ___________<br />
Intra-Dept Charges - IT 32,673 7,567 7,566 1,039 ___________<br />
Intra-Dept Charges - Training<br />
49 ___________<br />
Contractual Services 2,500 3,000 3,750 3,000 ___________<br />
Advertising 300 1,030 450 1,030 ___________<br />
Office Supplies 3,468 4,120 1,022 4,120 ___________<br />
Equipment - Noncapital 1,838 2,369 1,130 2,369 ___________<br />
Repair <strong>of</strong> Equipment 812 1,000 193 1,000 ___________<br />
Printing & Photography 146 1,545 898 1,545 ___________<br />
Postage 93 360 174 360 ___________<br />
Subscriptions & Memberships 17,433 20,460 20,387 18,760 ___________<br />
Telephone, Communications 32 45 14 45 ___________<br />
Travel 13,494 20,300 20,300 13,000 ___________<br />
Training 158 350 350 350 ___________<br />
All Other Sundry Charges 8,419 5,490 4,679 8,240 ___________<br />
Expense Allowance 9,679 9,600 13,100 13,800 ___________<br />
Ridge League Meeting 5,780 9,920 9,396 7,000 ___________<br />
Gift Certificates 750 585 750 ___________<br />
SUB-TOTAL 138,746 129,063 124,940 135,426<br />
CAPITAL EQUIPMENT<br />
Equipment 9,177<br />
SPECIAL PROJECTS<br />
<strong>City</strong> Commission Retreat 11,730 24,000 24,000 24,000 ___________<br />
SUB-TOTAL 11,730 24,000 24,000 24,000<br />
TOTAL 356,164 350,619 329,432 340,291<br />
E – 18
GENERAL FUND<br />
CITY COMMISSION<br />
BUDGET FOR YEAR 2007-08<br />
Experience Budget Experience Proposed Adjustments<br />
For Year For Year 2006-07 by by<br />
EXPENSES 2005-06 2006-07 Estimated <strong>City</strong> Manager <strong>City</strong> Commission<br />
COST ALLOCATED TO<br />
Fleet Management Fund (3,818) (3,457) (3,457) (3,403) ___________<br />
Purchasing & Stores Fund (3,818) (3,457) (3,457) (3,403) ___________<br />
Facilities Maintenance Fund (3,818) (3,457) (3,457) (3,403) ___________<br />
Wastewater Fund (19,092) (17,285) (17,285) (17,015) ___________<br />
Parking Fund (3,818) (3,457) (3,457) (3,403) ___________<br />
<strong>Lakeland</strong> Center Fund (19,092) (17,285) (17,285) (10,209) ___________<br />
<strong>Lakeland</strong> Linder Regional Airport Fund (19,092) (17,285) (17,285) (13,612) ___________<br />
Solid Waste Fund (7,637) (6,914) (6,914) (6,806) ___________<br />
Water Utility Fund (19,092) (17,285) (17,285) (20,758) ___________<br />
Electric Utility Fund (190,925) (172,850) (172,850) (170,146) ___________<br />
(290,202) (262,732) (262,732) (252,158)<br />
GRAND TOTAL 65,962 87,887 66,700 88,133<br />
PERSONNEL<br />
Current Proposed Pay Salary<br />
POSITION TITLE Budget Budget Grade Range<br />
Administrative Assistant 1 1 33 28,246 - 42,765<br />
ELECTED OFFICIALS<br />
Mayor 1 1<br />
<strong>City</strong> Commissioner 6 6<br />
TOTAL PART-TIME EMPLOYEES 7 7<br />
E – 19
GENERAL FUND<br />
CITY MANAGER<br />
BUDGET FOR YEAR 2007-08<br />
Experience Budget Experience Proposed Adjustments<br />
For Year For Year 2006-07 by by<br />
EXPENSES 2005-06 2006-07 Estimated <strong>City</strong> Manager <strong>City</strong> Commission<br />
PERSONAL SERVICES 538,312 575,566 573,766 615,558<br />
OPERATING EXPENSES<br />
Auto Allowance 14,443 14,400 16,200 16,200 ___________<br />
Water Utility Service 240 297 251 253 ___________<br />
Electric Utility Service 11,282 11,043 11,334 12,653 ___________<br />
Wastewater Utility Service 239 321 264 285 ___________<br />
Solid Waste Service 478 540 516 569 ___________<br />
Purchasing & Stores Service 1,515 1,609 1,609 1,738 ___________<br />
Intra-Dept Charges - Computer Rental 21,630 17,208 17,592 19,231 ___________<br />
Intra-Dept Charges - Telephone 4,481 4,588 4,390 5,050 ___________<br />
Intra-Dept Charges - Radios 334 337 337 322 ___________<br />
Intra-Dept Charges - Facilities 6,259 7,101 7,101 8,803 ___________<br />
Intra-Dept Charges - Janitorial 6,391 7,235 7,235 6,795 ___________<br />
Intra-Dept Charges - IT Operating 43,379 24,801 24,801 21,029 ___________<br />
Intra-Dept Charges - IT Projects 47 138 81<br />
Intra-Dept Charges - Training<br />
246 ___________<br />
Office Supplies 5,558 6,100 3,559 6,000 ___________<br />
Equipment - Noncapital 1,238 1,200 95 1,200 ___________<br />
Printing & Photography 1,111 1,030 555 1,000 ___________<br />
Postage 419 500 404 500 ___________<br />
Subscriptions & Memberships 6,512 8,094 7,812 17,057 ___________<br />
Telephone, Communications 3,760 3,650 4,311 3,000 ___________<br />
Travel 11,228 7,500 9,795 7,000 ___________<br />
Training 2,413 1,000 1,000 2,000 ___________<br />
All Other Sundry Charges 876 1,993 1,809 1,000 ___________<br />
Car Washing 7 7<br />
Gift Certificates 500<br />
SUB-TOTAL 143,833 121,192 121,059 131,932<br />
SPECIAL PROJECTS<br />
Economic Development 4,066<br />
SUB-TOTAL 4,066<br />
TOTAL 686,211 696,758 694,825 747,490<br />
E – 20
GENERAL FUND<br />
CITY MANAGER<br />
BUDGET FOR YEAR 2007-08<br />
Experience Budget Experience Proposed Adjustments<br />
For Year For Year 2006-07 by by<br />
EXPENSES 2005-06 2006-07 Estimated <strong>City</strong> Manager <strong>City</strong> Commission<br />
COST ALLOCATED TO<br />
Fleet Management Fund (6,605) (6,829) (6,829) (7,475) ___________<br />
Purchasing & Stores Fund (19,814) (20,486) (20,486) (22,425) ___________<br />
Facilities Maintenance Fund (13,209) (13,657) (13,657) (14,950) ___________<br />
Information Technology Fund (19,814) (20,486) (20,486) (22,425) ___________<br />
Cleveland Heights Golf Course Fund (6,605) (6,829) (6,829) (7,475) ___________<br />
<strong>Lakeland</strong> Center Fund (26,418) (27,314) (27,314) (14,950) ___________<br />
Solid Waste Fund (19,814) (20,486) (20,486) (22,425) ___________<br />
<strong>Lakeland</strong> Linder Regional Airport Fund (52,836) (54,628) (54,628) (22,425) ___________<br />
Parking Fund (13,209) (13,657) (13,657) (14,950) ___________<br />
Wastewater Utility Fund (33,023) (68,285) (68,285) (74,749) ___________<br />
Electric Utility Fund (132,091) (136,571) (136,571) (149,498) ___________<br />
Water Utility Fund (33,023) (34,143) (34,143) (74,749) ___________<br />
(376,461) (423,371) (423,371) (448,496)<br />
GRAND TOTAL 309,750 273,387 271,454 298,994<br />
PERSONNEL<br />
Current Proposed Pay Salary<br />
Budget Budget Grade Range<br />
<strong>City</strong> Manager 1 1 PB1 *<br />
Deputy <strong>City</strong> Manager 1 1 PB2 *<br />
Assistant <strong>City</strong> Manager 1 1 PB2 *<br />
OMB Manager 1 1 63 58,718 - 88,899<br />
Organizational Dev Supervisor 1 56 49,504 - 74,922<br />
Budget Analyst 1 49 41,725 - 63,190<br />
Secretary to the <strong>City</strong> Manager 1 1 42 35,173 - 53,248<br />
Process Analyst 1 40 33,509 - 50,710<br />
Administrative Assistant 1 1 33 28,246 - 42,765<br />
Office Associate II 1 29 25,605 - 38,771<br />
TOTAL FULL-TIME EMPLOYEES 5 10<br />
PART-TIME<br />
Office Associate I 1 1<br />
TOTAL PART-TIME EMPLOYEES 1 1<br />
E – 21
GENERAL FUND<br />
COMMUNICATIONS<br />
BUDGET FOR YEAR 2007-08<br />
Experience Budget Experience Proposed Adjustments<br />
For Year For Year 2006-07 by by<br />
EXPENSES 2005-06 2006-07 Estimated <strong>City</strong> Manager <strong>City</strong> Commission<br />
PERSONAL SERVICES 397,127 415,650 415,588 423,421<br />
OPERATING EXPENSES<br />
Auto Allowance 4,814 4,800 5,400 5,400 ___________<br />
Rental / Fleet Equipment 3,056 1,764 1,764 1,864 ___________<br />
Gasoline / Fleet Equipment 165 490 347 313 ___________<br />
Maintenance / Fleet Equipment 188 902<br />
Water Utility Service 63 219 146 141 ___________<br />
Electric Utility Service 2,951 8,139 7,550 9,326 ___________<br />
Wastewater Utility Service 65 237 176 189 ___________<br />
Solid Waste Service 148 398 344 420 ___________<br />
Purchasing & Stores Service 1,759 1,868 1,868 2,018 ___________<br />
Intra-Dept Charges - Computer Rental 42,892 34,463 34,931 25,211 ___________<br />
Intra-Dept Charges - Telephone 4,602 4,707 4,784 5,526 ___________<br />
Intra-Dept Charges - Facilities 267 5,235 5,236 6,490 ___________<br />
Intra-Dept Charges - Janitorial 273 5,334 5,334 5,009 ___________<br />
Intra-Dept Charges - IT 8,375 12,499 12,498 10,750 ___________<br />
Intra-Dept Charges - Training<br />
345 ___________<br />
Contractual Services 10,519 25,000 11,647 22,500 ___________<br />
Legal Fees 700 700<br />
Advertising 5,311 3,000 3,000 2,450 ___________<br />
Talent Fees - Promotions 2,000 1,000 1,000 1,000 ___________<br />
Office Supplies 8,176 6,000 6,000 6,000 ___________<br />
Equipment - Noncapital 11,393 8,500 8,500 8,500 ___________<br />
Food Purchases 599 1,000 1,000 600 ___________<br />
Leases 2,000 4,000 4,025 4,000 ___________<br />
Rentals 100<br />
Repair <strong>of</strong> Equipment 500 500 500 ___________<br />
Printing & Photography 898 1,300 675 1,450 ___________<br />
Postage 486 500 241 500 ___________<br />
Subscriptions & Memberships 1,798 1,560 2,115 2,060 ___________<br />
Telephone, Communications 3,326 3,000 2,426 3,000 ___________<br />
Travel 16 2,711 2,711 2,438 ___________<br />
Training 450 1,000 1,000 1,000 ___________<br />
All Other Sundry Charges 2,111 2,253 2,253 2,250 ___________<br />
Gift Certificates 25<br />
Recoveries-From Outside (444) (1,006)<br />
Recoveries-Other Funds (305) (852)<br />
SUB-TOTAL 118,052 143,079 126,337 131,249<br />
E – 22
GENERAL FUND<br />
COMMUNICATIONS<br />
BUDGET FOR YEAR 2007-08<br />
Experience Budget Experience Proposed Adjustments<br />
For Year For Year 2006-07 by by<br />
EXPENSES 2005-06 2006-07 Estimated <strong>City</strong> Manager <strong>City</strong> Commission<br />
CAPITAL EQUIPMENT<br />
Equipment 1,299 55,901 55,901 5,500 ___________<br />
SPECIAL PROJECTS<br />
Commission Chamber Improvements 45,000 33,000<br />
Speaker's Bureau 1,500 1,500<br />
Music on the Promenade 26,298 18,600 18,600 26,000 ___________<br />
Department Service Directory 7,500 7,500<br />
<strong>City</strong> Manager Annual Employee Meetings 1,319 3,500 3,500 5,400 ___________<br />
Citizens Academy 1,000 1,000 1,000 ___________<br />
Boards & Committees Annual Dinner 10,214 14,500 14,500 14,500 ___________<br />
Employee Newsletter 22,176 25,000 25,000<br />
Annual <strong>City</strong> Calendar 41,555 50,000 47,161<br />
Web Redesign 2,429<br />
Red, White & Kaboom 6,500 6,500 8,500 ___________<br />
Student Academy 500 ___________<br />
SUB-TOTAL 103,991 173,100 158,261 60,900<br />
TOTAL 620,469 787,730 756,087 621,070<br />
COST ALLOCATED TO<br />
<strong>Lakeland</strong> Center Fund (6,378) (7,568) (7,568) (6,211) ___________<br />
Fleet Management Fund (6,378) (7,568) (7,568) (6,211) ___________<br />
Purchasing & Stores Fund (6,378) (7,568) (7,568) (6,211) ___________<br />
Facilities Maintenance Fund (6,378) (7,568) (7,568) (6,211) ___________<br />
Information Technology Fund (12,756) (15,136) (15,136) (6,211) ___________<br />
Solid Waste Fund (12,756) (15,136) (15,136) (12,421) ___________<br />
<strong>Lakeland</strong> Linder Regional Airport Fund (19,134) (15,136) (15,136) (6,211) ___________<br />
Cleveland Heights Golf Course Fund (12,756) (7,568) (7,568) (6,211) ___________<br />
Parking Fund (6,378) (7,568) (7,568) (6,211) ___________<br />
Wastewater Utility Fund (31,890) (37,839) (37,839) (31,054) ___________<br />
Electric Utility Fund (165,827) (227,033) (227,033) (186,321) ___________<br />
Water Utility Fund (31,890) (37,839) (37,839) (31,054) ___________<br />
(318,899) (393,527) (393,527) (310,538)<br />
GRAND TOTAL 301,570 394,203 362,560 310,532<br />
Equipment<br />
1 - Video and Wedstream Encoder New 5,500<br />
5,500<br />
PERSONNEL<br />
Current Proposed Pay Salary<br />
POSITION TITLE Budget Budget Grade Range<br />
Communications Director 1 1 PB3 *<br />
Communications Marketing Manager 1 1 58 51,979 - 78,666<br />
Cablecast Producer 1 1 49 41,725 - 63,190<br />
Communications Officer 1 1 49 41,725 - 63,190<br />
Marketing Associate 1 1 38 31,907 - 48,298<br />
<strong>City</strong> Hall Receptionist/Switchboard Operator 2 1 22 21,590 - 32,677<br />
TOTAL FULL-TIME EMPLOYEES 7 6<br />
E – 23
GENERAL FUND<br />
LEGAL<br />
BUDGET FOR YEAR 2007-08<br />
Experience Budget Experience Proposed Adjustments<br />
For Year For Year 2006-07 by by<br />
EXPENSES 2005-06 2006-07 Estimated <strong>City</strong> Manager <strong>City</strong> Commission<br />
PERSONAL SERVICES 554,600 594,534 596,859 652,457<br />
OPERATING EXPENSES<br />
Auto Allowance 14,443 19,200 16,875 21,600 ___________<br />
Water Utility Service 292 361 278 276 ___________<br />
Electric Utility Service 13,726 13,436 13,227 15,395 ___________<br />
Wastewater Utility Service 291 391 308 332 ___________<br />
Solid Waste Service 581 657 603 693 ___________<br />
Purchasing & Stores Service 220 234 234 252 ___________<br />
Intra-Dept Charges - Computer Rental 17,753 14,561 14,327 16,396 ___________<br />
Intra-Dept Charges - Telephone 4,942 4,903 4,960 5,641 ___________<br />
Intra-Dept Charges - Facilities 7,616 8,641 8,640 10,712 ___________<br />
Intra-Dept Charges - Janitorial 7,777 8,804 8,804 8,268 ___________<br />
Intra-Dept Charges - IT 4,533 5,895 5,896 3,094 ___________<br />
Intra-Dept Charges - Training<br />
296 ___________<br />
Special Services 350 3,500 600 3,500 ___________<br />
Legal Fees 100,749 75,000 100,756 100,000 ___________<br />
Pr<strong>of</strong>essional Services 3,322 5,000 3,168 5,000 ___________<br />
Office Supplies 3,803 4,604 4,284 4,604 ___________<br />
Non-Capital Equipment 2,725 1,200 433 1,200 ___________<br />
Repair <strong>of</strong> Equipment 497 508 648 508 ___________<br />
Printing & Photography 34 450 493 450 ___________<br />
Postage 1,582 850 1,039 1,200 ___________<br />
Subscriptions & Memberships 20,461 21,239 17,583 19,186 ___________<br />
Telephone, Communications 1,592 1,020 1,326 1,020 ___________<br />
Travel 3,823 8,500 3,572 6,675 ___________<br />
All Other Sundry Charges 63 150 92 150 ___________<br />
SUB-TOTAL 211,175 199,104 208,146 226,447<br />
SPECIAL PROJECTS<br />
Office Renovation 4,558 1,000 1,000<br />
SUB-TOTAL 4,558 1,000 1,000<br />
TOTAL 770,333 794,638 806,004 878,904<br />
E – 24
GENERAL FUND<br />
LEGAL<br />
BUDGET FOR YEAR 2007-08<br />
Experience Budget Experience Proposed Adjustments<br />
For Year For Year 2006-07 by by<br />
EXPENSES 2005-06 2006-07 Estimated <strong>City</strong> Manager <strong>City</strong> Commission<br />
COST ALLOCATED TO<br />
Purchasing & Stores Fund (33,638) (30,682) (30,682) (35,156) ___________<br />
<strong>Lakeland</strong> Center Fund (16,819) (15,341) (15,341) (17,578) ___________<br />
Solid Waste Fund (19,342) (17,642) (17,642) (20,215) ___________<br />
<strong>Lakeland</strong> Linder Regional Airport Fund (134,550) (122,728) (122,728) (140,625) ___________<br />
Parking Fund (8,409) (7,671) (7,671) (8,789) ___________<br />
Wastewater Utility Fund (84,094) (76,705) (76,705) (87,890) ___________<br />
Electric Utility Fund (269,100) (245,456) (245,456) (281,249) ___________<br />
Cleveland Heights Golf Course Fund (16,819) (15,341) (15,341) (17,578) ___________<br />
Water Utility Fund (31,956) (29,148) (29,148) (33,398) ___________<br />
(614,727) (560,714) (560,714) (642,478)<br />
GRAND TOTAL 155,606 233,924 245,290 236,426<br />
PERSONNEL<br />
Current Proposed Pay Salary<br />
POSITION TITLE Budget Budget Grade Range<br />
<strong>City</strong> Attorney 1 1 PB1 *<br />
Assistant <strong>City</strong> Attorney 2 2 PB4 *<br />
Legal Assistant 3 3 40 33,509 - 50,710<br />
TOTAL FULL-TIME EMPLOYEES 6 6<br />
E – 25
GENERAL FUND<br />
RETIREMENT SERVICES<br />
BUDGET FOR YEAR 2007-08<br />
Experience Budget Experience Proposed Adjustments<br />
For Year For Year 2006-07 by by<br />
EXPENSES 2005-06 2006-07 Estimated <strong>City</strong> Manager <strong>City</strong> Commission<br />
PERSONAL SERVICES 238,332 216,418 314,650<br />
OPERATING EXPENSES<br />
Auto Allowance 2,925 2,925 5,400 ___________<br />
Water Utility Service 141 141 133 ___________<br />
Electric Utility Service 2,130 2,130 2,308 ___________<br />
Wastewater Utility Service 87 87 84 ___________<br />
Solid Waste Service 495 495 520 ___________<br />
Intra-Dept Charges - Computer Rental 7,300 7,300 8,574 ___________<br />
Intra-Dept Charges - Telephone 1,050 1,050 1,174 ___________<br />
Intra-Dept Charges - Facilities 4,574 4,574 3,189 ___________<br />
Intra-Dept Charges - Janitorial 4,670 4,670 2,447 ___________<br />
Intra-Dept Charges - IT 2,860 ___________<br />
Intra-Dept Charges - Training<br />
246 ___________<br />
Special Services 85 85<br />
Legal Fees 4,725 1,000 ___________<br />
Pr<strong>of</strong>essional Services 1,000 2,900 3,000 ___________<br />
Legal Advertising 355 355 350 ___________<br />
Office Supplies 1,991 2,066 2,000 ___________<br />
Non-Capital Equipment 111 1,500 1,500 ___________<br />
Leases 645 645<br />
Repair <strong>of</strong> Equipment 324 360<br />
Printing & Photography 110 110 150 ___________<br />
Postage 970 1,200 1,200 ___________<br />
Subscriptions & Memberships 1,225 1,225 1,320 ___________<br />
Telephone, Communications 500 ___________<br />
Travel 6,300 6,300 7,350 ___________<br />
Training 165 165 150 ___________<br />
All Other Sundry Charges 235 235 300 ___________<br />
SUB-TOTAL 36,888 45,243 45,756<br />
TOTAL 275,220 261,661 360,406<br />
E – 26
GENERAL FUND<br />
RETIREMENT SERVICES<br />
BUDGET FOR YEAR 2007-08<br />
Experience Budget Experience Proposed Adjustments<br />
For Year For Year 2006-07 by by<br />
EXPENSES 2005-06 2006-07 Estimated <strong>City</strong> Manager <strong>City</strong> Commission<br />
COST ALLOCATED TO<br />
Fleet Management Fund (6,487) ___________<br />
Purchasing & Stores Fund (2,162) ___________<br />
Facilities Maintenance Fund (8,650) ___________<br />
Information Technology Fund (11,893) ___________<br />
Wastewater Utility Fund (12,614) ___________<br />
Parking Fund (1,081) ___________<br />
Cleveland Heights Golf Course Fund (3,244) ___________<br />
<strong>Lakeland</strong> Center Fund (7,569) ___________<br />
Solid Waste Fund (14,416) ___________<br />
Water Utility Fund (18,381) ___________<br />
Electric Utility Fund (111,365) ___________<br />
(197,862)<br />
GRAND TOTAL 275,220 261,661 162,544<br />
PERSONNEL<br />
Current Proposed Pay Salary<br />
POSITION TITLE Budget Budget Grade Range<br />
Retirement System Director 1 1 PB4 *<br />
Pension Benefits Manager 1 1 56 49,504 - 74,922<br />
Pension Benefits Administrator 1 1 42 35,173 - 53,248<br />
Pension Benefits Assistant 1 1 38 31,907 - 48,298<br />
TOTAL FULL-TIME EMPLOYEES 4 4<br />
PART-TIME<br />
Co-Op Student 1 1<br />
Office Assistant I 1 1<br />
TOTAL PART-TIME EMPLOYEES 2 2<br />
E – 27
GENERALFUND<br />
HUMAN RESOURCES<br />
BUDGET FOR YEAR 2007-08<br />
Experience Budget Experience Proposed Adjustments<br />
ForYear ForYear 2006-07 by by<br />
EXPENSES 2005-06 2006-07 Estimated <strong>City</strong> Manager <strong>City</strong> Commission<br />
EMPLOYEE RELATIONS<br />
PERSONAL SERVICES 763,270 972,583 882,361 1,120,335<br />
OPERATING EXPENSES<br />
Tuition Refund Program 86,720 83,568 90,000 100,000 ___________<br />
Auto Allowance 4,814 4,800 5,400 5,400 ___________<br />
Water Utility Service 301 372 287 284 ___________<br />
Electric Utility Service 14,144 26,673 26,673 29,592 ___________<br />
Wastewater Utility Service 300 403 317 343 ___________<br />
Solid Waste Service 599 1,840 1,447 1,581 ___________<br />
Purchasing & Stores Service 1,523 1,617 1,617 1,747 ___________<br />
Intra-Dept Charges - Computer Rental 25,534 18,301 18,301 21,429 ___________<br />
Intra-Dept Charges - Telephone 6,401 6,556 6,556 7,542 ___________<br />
Intra-Dept Charges - Facilities 13,943 15,817 15,817 11,038 ___________<br />
Intra-Dept Charges - Janitorial 14,236 16,116 16,116 15,136 ___________<br />
Intra-Dept Charges - IT 21,126 28,708 28,708 38,202 ___________<br />
Intra-Dept Charges - Training<br />
887 ___________<br />
Special Services 61,123 8,600 8,600 8,600 ___________<br />
Legal Fees 1,268 7,125 7,125 5,000 ___________<br />
Advertising 250<br />
Office Supplies 5,612 7,500 7,500 7,500 ___________<br />
Non-Capital Equipment 2,068 2,883 2,883 2,900 ___________<br />
Service Awards and Plaques 13,683 16,025 16,025 16,100 ___________<br />
Repair <strong>of</strong> Equipment 1,192 3,150 2,350 2,200 ___________<br />
Printing & Photography 7,773 5,500 5,500 5,700 ___________<br />
Postage 739 515 515 530 ___________<br />
Subscriptions & Memberships 5,617 4,453 4,453 5,043 ___________<br />
Telephone, Communications 4,097 2,638 4,000 4,000 ___________<br />
Travel 11,335 18,572 18,572 9,486 ___________<br />
All Other Sundry Charges 1,537 2,060 2,060 2,100 ___________<br />
Gift Certificates 2,000 2,000 2,000 ___________<br />
SUB-TOTAL 305,935 285,792 292,822 304,341<br />
CAPITAL EQUIPMENT<br />
Equipment 5,500 11,300 11,300 5,800 ___________<br />
E – 28
GENERALFUND<br />
HUMAN RESOURCES<br />
BUDGET FOR YEAR 2007-08<br />
Experience Budget Experience Proposed Adjustments<br />
ForYear ForYear 2006-07 by by<br />
EXPENSES 2005-06 2006-07 Estimated <strong>City</strong> Manager <strong>City</strong> Commission<br />
SPECIAL PROJECTS<br />
Mini-PERC 80 10,000 10,000 10,000 ___________<br />
Employee Picnic 50,898 58,000 58,000 24,000 ___________<br />
Employee Programs 3,376 8,000 8,000 8,000 ___________<br />
Training Program 16,487 26,280 26,280 27,000 ___________<br />
Internship Program 3,713 50,537 50,537 50,500 ___________<br />
CPM Training 10,820 10,820 11,000 ___________<br />
Strategic Planning and Implementation 1,000 3,000 3,000 105,000 ___________<br />
Computer Laboratory 56,905 47,953 47,953 34,956 ___________<br />
SUB-TOTAL 132,459 214,590 214,590 270,456<br />
TOTAL 1,207,164 1,484,265 1,401,073 1,700,932<br />
CIVIL SERVICE, STAFFING & COMPENSATION<br />
PERSONAL SERVICES 588,044 468,083 435,109 608,490<br />
OPERATING EXPENSES<br />
Auto Allowance 2,014<br />
Rental <strong>of</strong> Motor Pool Equipment 2,179 1,095 1,095 1,158 ___________<br />
Gasoline/Motor Pool Equipment 234 1,029 388 284 ___________<br />
Maintenance/Motor Pool Equipment 223 1,036 1,036 366 ___________<br />
Water Utility Service 340 250 308 249 ___________<br />
Electric Utility Service 6,441 6,667 6,666 4,103 ___________<br />
Wastewater Utility Service 213 154 226 160 ___________<br />
Solid Waste Service 1,279 1,379 1,379 925 ___________<br />
Purchasing & Stores Service 348 370 370 399 ___________<br />
Intra-Dept Charges - Computer Rental 37,995 21,074 21,074 24,870 ___________<br />
Intra-Dept Charges - Telephone 5,347 4,584 4,584 4,556 ___________<br />
Intra-Dept Charges - Facilities 6,298 2,575 2,575 5,669 ___________<br />
Intra-Dept Charges - Janitorial 6,431 2,623 2,623 4,376 ___________<br />
Intra-Dept Charges - IT 52,042 30,851 30,851 6,435 ___________<br />
Intra-Dept Charges - Training<br />
493 ___________<br />
Special Services 51,895 505 505 8,250 ___________<br />
Legal Fees 3,281 1,500 ___________<br />
Pr<strong>of</strong>essional Services 18,000 18,000 5,000 ___________<br />
Advertising 32,028 35,001 35,000 35,000 ___________<br />
Office Supplies 7,172 4,964 6,754 6,000 ___________<br />
Non-Capital Equipment 241 730 730 500 ___________<br />
Leases 4,613 6,296 6,287 5,750 ___________<br />
Repair <strong>of</strong> Equipment 3,056 1,794 1,794 3,500 ___________<br />
Printing & Photography 96 290 290 150 ___________<br />
E – 29
GENERALFUND<br />
HUMAN RESOURCES<br />
BUDGET FOR YEAR 2007-08<br />
Experience Budget Experience Proposed Adjustments<br />
ForYear ForYear 2006-07 by by<br />
EXPENSES 2005-06 2006-07 Estimated <strong>City</strong> Manager <strong>City</strong> Commission<br />
Postage 2,941 5,560 5,560 6,000 ___________<br />
Subscriptions & Memberships 903 1,948 1,948 1,500 ___________<br />
Telephone, Communications 353 355 903 1,000 ___________<br />
Travel 7,771 4,300 4,557 6,000 ___________<br />
Training 210 435 435 500 ___________<br />
All Other Sundry Charges 356 507 507 450 ___________<br />
Car Washing 13 13<br />
SUB-TOTAL 236,300 154,385 156,458 135,143<br />
CAPITAL EQUIPMENT<br />
Equipment 5,000 5,000 1,000 ___________<br />
TOTAL 824,344 627,468 596,567 744,633<br />
COST ALLOCATED TO<br />
Fleet Management Fund (42,040) (33,132) (33,132) (39,129) ___________<br />
Purchasing & Stores Fund (13,905) (18,086) (18,086) (19,564) ___________<br />
Facilities Maintenance Fund (64,903) (54,712) (54,712) (56,248) ___________<br />
Information Technology Fund (80,771) (79,485) (79,485) (78,258) ___________<br />
Wastewater Utility Fund (81,577) (69,454) (69,454) (95,377) ___________<br />
Parking Fund (5,675) (6,535) (6,535) (7,337) ___________<br />
<strong>Lakeland</strong> Center Fund (50,620) (88,751) (88,751) (80,704) ___________<br />
<strong>Lakeland</strong> Linder Regional Airport Fund (24,046) (19,606) (19,606)<br />
Solid Waste Fund (129,753) (87,539) (87,539) (83,150) ___________<br />
Cleveland Heights Golf Course Fund (22,889) (47,415) (47,415) (46,466) ___________<br />
Water Utility Fund (111,486) (99,243) (99,243) (107,605) ___________<br />
Electric Utility Fund (676,713) (656,550) (656,550) (792,363) ___________<br />
(1,304,378) (1,260,508) (1,260,508) (1,406,201)<br />
GRAND TOTAL 727,130 851,225 737,132 1,039,364<br />
Equipment<br />
Editing Suite Furniture Replacement 4,800<br />
Editing System S<strong>of</strong>tware Replacement 1,000<br />
1 - Digital Camcorder Replacement 1,000<br />
6,800<br />
E – 30
GENERALFUND<br />
HUMAN RESOURCES<br />
BUDGET FOR YEAR 2007-08<br />
Experience Budget Experience Proposed Adjustments<br />
ForYear ForYear 2006-07 by by<br />
EXPENSES 2005-06 2006-07 Estimated <strong>City</strong> Manager <strong>City</strong> Commission<br />
PERSONNEL<br />
Current Proposed Pay Salary<br />
POSITION TITLE Budget Budget Grade Range<br />
WORKFORCE DEVELOPMENT & LABOR RELATIONS<br />
Employee Relations Director 1 1 PB3 *<br />
Policy & Labor Relations Manager 1 1 64 60,174 - 91,083<br />
Organizational Development Supervisor 1 1 56 49,504 - 74,922<br />
Employee Relations Specialist III 1 1 54 47,133 - 71,365<br />
Organizational Development Specialist 1 1 54 47,133 - 71,365<br />
HR Specialist 1 54 47,133 - 71,365<br />
Training Instructor 1 1 49 41,725 - 63,190<br />
HR Generalist 1 1 47 39,749 - 60,174<br />
HR Assistant II 1 40 33,509 - 50,710<br />
Employee Relations Assistant III 1 1 40 33,509 - 50,710<br />
Administrative Assistant 1 1 33 28,246 - 42,765<br />
CIVIL SERVICE, STAFFING & COMPENSATION<br />
Director <strong>of</strong> Civil Service, Staffing & Compensation 1 1 PB3 *<br />
Manager <strong>of</strong> Staffing & Compensation 1 64 60,174 - 91,083<br />
HR Specialist 1 1 54 47,133 - 71,365<br />
Computer Applications Specialist 1 54 47,133 - 71,365<br />
Testing Services Manager 1 1 54 47,133 - 71,365<br />
Employment Services Specialist III 1 1 51 43,805 - 64,730<br />
Testing Services Specialist 2 1 49 41,725 - 63,190<br />
Employee Relations Specialist II 1 1 49 41,725 - 63,190<br />
HR Generalist 1 2 47 39,749 - 60,174<br />
Administrative Assistant 1 1 33 28,246 - 42,765<br />
Office Associate II 1 1 29 25,605 - 38,771<br />
Office Associate I 3 3 24 22,693 - 34,320<br />
Office Assistant II 1 1 22 21,590 - 32,677<br />
TOTAL FULL-TIME EMPLOYEES 23 27<br />
PART-TIME<br />
Office Assistant II 1 1<br />
College Intern 1 0<br />
Personnel Assistant 1 1<br />
TOTAL PART-TIME EMPLOYEES 3 2<br />
E – 31
GENERAL FUND<br />
COMMUNITY DEVELOPMENT - PLANNING<br />
BUDGET FOR YEAR 2007-08<br />
Experience Budget Experience Proposed Adjustments<br />
For Year For Year 2006-07 by by<br />
EXPENSES 2005-06 2006-07 Estimated <strong>City</strong> Manager <strong>City</strong> Commission<br />
OPERATING EXPENSES<br />
Auto Allowance 4,814 4,800 5,400 5,400 ___________<br />
Rental / Fleet Equipment 6,263 3,583 3,583 3,783 ___________<br />
Gasoline / Fleet Equipment 1,405 1,891 1,592 1,948 ___________<br />
Maintenance / Fleet Equipment 468 2,065 2,327 3,083 ___________<br />
Water Utility Service 668 826 637 649 ___________<br />
Electric Utility Service 31,421 30,757 30,279 35,241 ___________<br />
Wastewater Utility Service 666 895 705 784 ___________<br />
Solid Waste Service 1,330 1,505 1,380 1,585 ___________<br />
Purchasing & Stores Service 170 181 181 195 ___________<br />
Intra-Dept Charges - Computer Rental 62,153 53,758 52,076 57,684 ___________<br />
Intra-Dept Charges - Telephone 9,348 9,787 9,539 11,098 ___________<br />
Intra-Dept Charges - Facilities 15,799 17,925 17,924 22,221 ___________<br />
Intra-Dept Charges - Janitorial 16,131 18,263 18,264 17,151 ___________<br />
Intra-Dept Charges - IT 136,653 159,961 159,961 145,997 ___________<br />
Intra-Dept Charges - Training<br />
739 ___________<br />
Special Services 2,000 14,000 14,000 10,000 ___________<br />
Advertising 2,937 11,000 3,754 9,000 ___________<br />
Office Supplies 30,013 24,620 24,998 24,000 ___________<br />
Non-Capital Equipment 6,411 6,400 6,400 6,000 ___________<br />
Printing & Photography 7,594 7,500 2,500 7,500 ___________<br />
Postage 10,095 2,500 7,500 9,168 ___________<br />
Subscriptions & Memberships 3,197 5,771 5,771 5,631 ___________<br />
Telephone, Communications 1,418 1,500 1,218 1,500 ___________<br />
Travel 2,026 6,774 6,574 12,090 ___________<br />
Training 3,208 5,880 5,880 2,000 ___________<br />
All Other Sundry Charges 993 1,193 1,000 ___________<br />
Car Washing 7 26<br />
SUB-TOTAL 356,188 393,142 383,661 395,448<br />
CAPITAL EQUIPMENT<br />
Equipment 15,028 6,772 6,772<br />
E – 32
GENERAL FUND<br />
COMMUNITY DEVELOPMENT - PLANNING<br />
BUDGET FOR YEAR 2007-08<br />
Experience Budget Experience Proposed Adjustments<br />
For Year For Year 2006-07 by by<br />
EXPENSES 2005-06 2006-07 Estimated <strong>City</strong> Manager <strong>City</strong> Commission<br />
SPECIAL PROJECTS<br />
Neighborhood Preservation 6<br />
Historic Preservation Board 15,014 15,000 15,000 13,000 ___________<br />
Comprehensive Plan Update 3,611 100,000 100,000 15,000 ___________<br />
Affordable Housing Incentive Plan 15,415 109,585 109,585 50,000 ___________<br />
Title Clearing Expense - Foreclosures 11,830 24,188 24,188 15,000 ___________<br />
Transportation & Planning Consultant 24,620 171,480 171,480 25,000 ___________<br />
Annexation Referendum 904 3,096 3,096 1,000 ___________<br />
Enterprise Zone 2,000 ___________<br />
Dixieland CRA Expansion 25,000 25,000<br />
Access Management Regulations 18,001 18,001<br />
Impact Fee Study Updates 5,000 5,000 20,000 ___________<br />
Land Development Regulation Update 440 2,500 2,500 2,500 ___________<br />
State Neighborhood Conference 123,420<br />
Neighborhood Leadership Summit 10,000 10,000 10,000 ___________<br />
Sign Code Revisions 10,852 10,852<br />
Lake Wire Redevelopment Master Plan 7,660 469 469<br />
Lake Wire Lakefront Master Plan 3,775 458 458<br />
Carillon Lakes Noise Study 4,000 4,000<br />
Lklnd Interstate Industrial Park Buffer 82,264 82,264<br />
Office Modifications 1,800 1,800<br />
SUB-TOTAL 206,689 583,693 583,699 153,500<br />
TOTAL 1,925,581 2,895,461 2,582,046 2,486,889<br />
COST ALLOCATED TO<br />
<strong>Lakeland</strong> Linder Regional Airport Fund (22,982) (22,982)<br />
Electric Utility Fund (42,605) (114,910) (114,910) (70,105) ___________<br />
(42,605) (137,892) (137,892) (70,105)<br />
GRAND TOTAL 1,882,976 2,757,569 2,444,154 2,416,784<br />
E – 33
GENERAL FUND<br />
COMMUNITY DEVELOPMENT - PLANNING<br />
BUDGET FOR YEAR 2007-08<br />
Experience Budget Experience Proposed Adjustments<br />
For Year For Year 2006-07 by by<br />
EXPENSES 2005-06 2006-07 Estimated <strong>City</strong> Manager <strong>City</strong> Commission<br />
PERSONNEL<br />
Current Proposed Pay Salary<br />
POSITION TITLE Budget Budget Grade Range<br />
Community Development Director 1 1 PB2 *<br />
Asst. Dir. Of Community Development 1 1 PB4 *<br />
Planning Manager 2 2 69 67,974 - 102,918<br />
Transportation Planner 1 1 63 58,718 - 88,899<br />
CRA Coordinator 1 1 60 54,579 - 82,618<br />
Principal Planner 1 1 58 51,979 - 78,666<br />
CRA Project Manager 1 1 56 49,504 - 74,922<br />
Senior Planner 5 5 54 47,133 - 71,365<br />
Computer Application Specialist 1 1 54 47,133 - 71,365<br />
Economic Development Coordinator 1 1 54 47,133 - 71,365<br />
Property Information Supervisor 1 1 49 41,725 - 63,190<br />
Planner 1 1 42 35,173 - 53,248<br />
GIS Technician I 1 1 44 36,941 - 55,910<br />
Building Permit Coordinator 1 38 31,907 - 48,298<br />
Administrative Assistant 1 1 33 28,246 - 42,765<br />
Property Information Specialist 1 1 33 28,246 - 42,765<br />
CRA Program Administrator 1 1 29 25,605 - 38,771<br />
Office Associate II 1 1 29 25,605 - 38,771<br />
Office Associate I 1 1 24 22,693 - 34,320<br />
Office Assistant II 1 1 22 21,590 - 32,677<br />
TOTAL FULL-TIME EMPLOYEES 25 24<br />
PART-TIME<br />
Planning Intern 1 1<br />
TOTAL PART-TIME EMPLOYEES 1 1<br />
E – 34
GENERAL FUND<br />
COMMUNITY DEVELOPMENT - CODE ENFORCEMENT<br />
BUDGET FOR YEAR 2007-08<br />
Experience Budget Experience Proposed Adjustments<br />
For Year For Year 2006-07 by by<br />
EXPENSES 2005-06 2006-07 Estimated <strong>City</strong> Manager <strong>City</strong> Commission<br />
PERSONAL SERVICES 416,263 495,668 477,001 526,285<br />
OPERATING EXPENSES<br />
Rental / Fleet Equipment 16,095 9,735 10,569 11,109 ___________<br />
Gasoline / Fleet Equipment 13,079 15,450 14,193 16,072 ___________<br />
Maintenance / Fleet Equipment 6,471 16,735 12,397 12,350 ___________<br />
Electric Utility Service 27,289 27,825 12,702 13,370 ___________<br />
Solid Waste Service 1,515 2,509 804 844 ___________<br />
Purchasing & Stores Service 11,738 12,466 12,466 13,463 ___________<br />
Intra-Dept Charges - Computer Rental 34,821 28,243 27,971 30,901 ___________<br />
Intra-Dept Charges - Telephone 3,414 2,990 3,034 3,427 ___________<br />
Intra-Dept Charges - Radios 3,340 3,366 3,370 3,215 ___________<br />
Intra-Dept Charges - Facilities 5,935 6,734 6,734<br />
Intra-Dept Charges - Janitorial 6,060 6,861 6,861 3,414 ___________<br />
Intra-Dept Charges - IT 74,020 55,577 55,577 49,883 ___________<br />
Intra-Dept Charges - Training<br />
591 ___________<br />
Special Services 14,594 24,472 24,472 16,525 ___________<br />
Office Supplies 10,987 7,984 8,287 9,000 ___________<br />
Non-Capital Equipment 977 1,562 1,562<br />
Uniforms 1,301 1,720 1,644 1,690 ___________<br />
Leases 400 400<br />
Printing & Photography 3,136 3,272 2,153 3,000 ___________<br />
Postage 4,072 4,500 4,500 7,120 ___________<br />
Subscriptions & Memberships 559 630 620 460 ___________<br />
Telephone, Communications 4,031 9,804 8,842 9,500 ___________<br />
Travel 2,465 4,816 4,816 5,850 ___________<br />
Training 5,492 4,578 4,578 1,625 ___________<br />
All Other Sundry Charges 624<br />
Car Washing 7<br />
SUB-TOTAL 251,391 252,229 228,560 214,033<br />
SPECIAL PROJECTS<br />
Demolition <strong>of</strong> Condemned Bldgs 47,962 75,432 75,432 18,650 ___________<br />
Neighborhood Clean-up 76,590 223,699 223,699<br />
Orangewood Land Maintenance 3,000 ___________<br />
Code Enforcement Board 37,357 ___________<br />
SUB-TOTAL 124,552 299,131 299,131 59,007<br />
GRAND TOTAL 792,206 1,047,028 1,004,692 799,325<br />
E – 35
GENERAL FUND<br />
COMMUNITY DEVELOPMENT - CODE ENFORCEMENT<br />
BUDGET FOR YEAR 2007-08<br />
Experience Budget Experience Proposed Adjustments<br />
For Year For Year 2006-07 by by<br />
EXPENSES 2005-06 2006-07 Estimated <strong>City</strong> Manager <strong>City</strong> Commission<br />
PERSONNEL<br />
Current Proposed Pay Salary<br />
POSITION TITLE Budget Budget Grade Range<br />
Code Enforcement Division Manager 1 1 58 51,979 - 78,666<br />
Code Enforcement Supervisor 1 1 49 41,725 - 63,190<br />
Code Enforcement Officer 3 3 42 35,173 - 53,248<br />
Sign Inspector 1 1 42 35,173 - 53,248<br />
Office Associate II 2 2 29 25,605 - 38,771<br />
Office Associate I 1 1 24 22,693 - 34,320<br />
TOTAL FULL-TIME EMPLOYEES 9 9<br />
PART-TIME<br />
Office Associate I 1 1<br />
TOTAL PART-TIME EMPLOYEES 1 1<br />
E – 36
GENERAL FUND<br />
COMMUNITY DEVELOPMENT - BUILDING INSPECTION<br />
BUDGET FOR YEAR 2007-08<br />
Experience Budget Experience Proposed Adjustments<br />
For Year For Year 2006-07 by by<br />
EXPENSES 2005-06 2006-07 Estimated <strong>City</strong> Manager <strong>City</strong> Commission<br />
PERSONAL SERVICES 1,360,256 1,519,292 1,457,983 1,362,379<br />
OPERATING EXPENSES<br />
Rental / Fleet Equipment 34,186 20,847 20,847 22,021 ___________<br />
Gasoline / Fleet Equipment 17,592 26,597 22,297 25,957 ___________<br />
Maintenance / Fleet Equipment 12,417 22,478 32,844 32,087 ___________<br />
Uninsured Loss Reimbursement 500 500 500 ___________<br />
Water Utility Service 513 634 489 403 ___________<br />
Electric Utility Service 24,109 23,600 23,232 27,040 ___________<br />
Wastewater Utility Service 511 687 541 478 ___________<br />
Solid Waste Service 1,021 1,155 1,059 1,216 ___________<br />
Purchasing & Stores Service 1,027 1,091 1,091 1,178 ___________<br />
Intra-Dept Charges - Computer Rental 66,831 53,683 55,967 64,906 ___________<br />
Intra-Dept Charges - Telephone 11,110 11,120 11,539 13,245 ___________<br />
Intra-Dept Charges - Facilities 15,011 17,031 17,031 21,112 ___________<br />
Intra-Dept Charges - Janitorial 15,327 17,352 17,352 16,295 ___________<br />
Intra-Dept Charges - IT Operating 137,734 67,160 67,160 53,969 ___________<br />
Intra-Dept Charges - IT Projects 1,169 3,444 2,013<br />
Intra-Dept Charges - Training 1,232 ___________<br />
Special Services 2,823 109,000 50,000 50,000 ___________<br />
Office Supplies 16,881 19,837 19,837 20,432 ___________<br />
Non-Capital Equipment 553 3,000 3,000 3,000 ___________<br />
Uniforms 3,577 4,250 4,250 4,377 ___________<br />
Repair <strong>of</strong> Equipment 406 1,100 1,100 1,000 ___________<br />
Printing & Photography 1,527 1,300 1,300 1,339 ___________<br />
Postage 7,100 5,500 3,600 5,800 ___________<br />
Subscriptions & Memberships 1,570 2,030 3,930 3,909 ___________<br />
Telephone, Communications 6,659 8,170 12,485 8,170 ___________<br />
Travel 3,733 7,626 5,838 10,183 ___________<br />
Training 1,873 4,930 7,107 6,200 ___________<br />
All Other Sundry Charges 500<br />
Car Washing 163 465<br />
SUB-TOTAL 385,260 434,285 386,875 396,549<br />
SPECIAL PROJECTS<br />
<strong>City</strong> Hall Renovation/First Floor 44,300 44,300<br />
Reconstruct Inspection Area 750,000 544,278<br />
Relocation Costs for Employees 30,000 30,000<br />
Appeal Board Expense 1,680 2,000 2,000 2,000 ___________<br />
One Step Fire Inspection 41,944 41,944<br />
SUB-TOTAL 1,680 868,244 662,522 2,000<br />
GRAND TOTAL 1,747,196 2,821,821 2,507,380 1,760,928<br />
E – 37
GENERAL FUND<br />
COMMUNITY DEVELOPMENT - BUILDING INSPECTION<br />
BUDGET FOR YEAR 2007-08<br />
Experience Budget Experience Proposed Adjustments<br />
For Year For Year 2006-07 by by<br />
EXPENSES 2005-06 2006-07 Estimated <strong>City</strong> Manager <strong>City</strong> Commission<br />
PERSONNEL<br />
Current Proposed Pay Salary<br />
POSITION TITLE Budget Budget Grade Range<br />
Chief Building Official 1 1 65 61,630 - 93,330<br />
Deputy Building Official 1 1 60 54,579 - 82,618<br />
Building Plans Examiner I 3 3 56 49,504 - 74,922<br />
Electrical Inspector 2 2 51 43,805 - 64,730<br />
Mechanical Inspector 2 2 51 43,805 - 64,730<br />
Plumbing Inspector 2 2 51 43,805 - 64,730<br />
Building Inspector I 3 3 51 43,805 - 64,730<br />
Field Services Inspector 1 1 45 37,835 - 57,304<br />
License Inspector III 1 1 40 33,509 - 50,710<br />
Building Permit Coordinator 1 38 31,907 - 48,298<br />
License Inspector II 1 1 36 30,389 - 45,989<br />
License Inspector I 1 1 31 26,894 - 40,726<br />
Permit Clerk 4 4 31 26,894 - 40,726<br />
Office Associate I 1 1 24 22,693 - 34,320<br />
TOTAL FULL-TIME EMPLOYEES 23 24<br />
PART-TIME<br />
Building Inspector 1 1<br />
Electrical Inspector 1 1<br />
Mechanical Inspector 1 1<br />
Plumbing Inspector 1 1<br />
Office Associate II 1 1<br />
Office Associate I 1 1<br />
TOTAL PART- TIME EMPLOYEES 6 6<br />
E – 38
GENERAL FUND<br />
RISK MANAGEMENT<br />
BUDGET FOR YEAR 2007-08<br />
Experience Budget Experience Proposed Adjustments<br />
For Year For Year 2006-07 by by<br />
EXPENSES 2005-06 2006-07 Estimated <strong>City</strong> Manager <strong>City</strong> Commission<br />
PERSONAL SERVICES 810,342 882,875 882,181 945,395<br />
OPERATING EXPENSES<br />
Auto Allowance 4,814 4,800 5,400 5,400 ___________<br />
Rental / Fleet Equipment 16,828 9,307 9,307 9,523 ___________<br />
Gasoline / Fleet Equipment 9,431 12,210 9,054 10,547 ___________<br />
Maintenance / Fleet Equipment 6,750 12,930 26,133 23,722 ___________<br />
Uninsured Loss Reimbursement 1,000 1,000 1,000 ___________<br />
Water Utility Service 135 137 193 202 ___________<br />
Electric Utility Service 7,831 7,009 6,587 6,711 ___________<br />
Wastewater Utility Service 226 241 326 362 ___________<br />
Solid Waste Service 1,279 1,343 1,376 1,434 ___________<br />
Purchasing & Stores Service 5,889 6,254 6,254 6,755 ___________<br />
Intra-Dept Charges - Computer Rental 33,083 27,495 26,830 30,719 ___________<br />
Intra-Dept Charges - Telephone 10,333 12,869 10,712 11,993 ___________<br />
Intra-Dept Charges - Radios 2,338 2,356 2,359 2,251 ___________<br />
Intra-Dept Charges - Facilities 6,298 7,146 7,146 8,903 ___________<br />
Intra-Dept Charges - Janitorial 6,431 7,281 7,280 6,872 ___________<br />
Intra-Dept Charges - IT 30,703 33,361 33,360 27,397 ___________<br />
Intra-Dept Charges - Training<br />
739 ___________<br />
Special Services 6,196 8,253 5,032 4,780 ___________<br />
Pr<strong>of</strong>essional Services 86,454 158,330 150,830 108,330 ___________<br />
Office Supplies 8,058 9,950 12,349 9,950 ___________<br />
Non-Capital Equipment 2,360 2,250 332 2,250 ___________<br />
All Other Material & Supply 4,475 21,765 5,000 21,765 ___________<br />
Uniforms 295 600 600 300 ___________<br />
Leases 3,051 3,150 2,861 3,150 ___________<br />
Repair <strong>of</strong> Equipment 1,407 1,860 1,429 2,160 ___________<br />
Printing & Photography 939 6,766 761 6,766 ___________<br />
Postage 2,535 3,750 1,889 3,750 ___________<br />
Subscriptions & Memberships 1,130 1,729 1,644 1,769 ___________<br />
Telephone, Communications 2,273 2,175 2,637<br />
Travel 62 3,225 3,225 3,225 ___________<br />
Training 3,015 3,500 3,500 3,500 ___________<br />
All Other Sundry Charges 52 200 300 ___________<br />
Licenses and Permits 115 300 300 180 ___________<br />
Car Washing 100 29<br />
SUB-TOTAL 264,786 373,642 345,737 326,705<br />
E – 39
GENERAL FUND<br />
RISK MANAGEMENT<br />
BUDGET FOR YEAR 2007-08<br />
Experience Budget Experience Proposed Adjustments<br />
For Year For Year 2006-07 by by<br />
EXPENSES 2005-06 2006-07 Estimated <strong>City</strong> Manager <strong>City</strong> Commission<br />
SPECIAL PROJECTS<br />
Safety Program 94,206 86,880 86,880 86,800 ___________<br />
Health Stat Clinic 7,500 50,000 ___________<br />
Emergency Management 15,459 25,000 25,000 25,000 ___________<br />
SUB-TOTAL 109,665 111,880 119,380 161,800<br />
TOTAL 1,184,793 1,368,397 1,347,298 1,433,900<br />
COST ALLOCATED TO<br />
Fleet Management Fund (19,208) (24,424) (24,424) (25,810) ___________<br />
Purchasing & Stores Fund (10,510) (12,417) (12,416) (8,603) ___________<br />
Facilities Maintenance Fund (16,912) (19,921) (19,920) (21,509) ___________<br />
Information Technology Fund (20,778) (22,377) (22,376) (27,244) ___________<br />
<strong>Lakeland</strong> Center Fund (18,483) (20,876) (20,876) (22,942) ___________<br />
Solid Waste Management Fund (57,140) (65,358) (65,358) (34,414) ___________<br />
<strong>Lakeland</strong> Linder Regional Airport Fund (17,275) (18,557) (18,558) (12,905) ___________<br />
Parking Fund (4,590) (4,776) (4,776) (2,868) ___________<br />
Wastewater Utility Fund (51,583) (52,941) (52,940) (38,715) ___________<br />
Electric Utility Fund (478,620) (513,449) (513,450) (547,750) ___________<br />
Cleveland Heights Golf Course Fund (9,664) (10,916) (10,916) (10,037) ___________<br />
Water Utility Fund (58,952) (66,995) (66,996) (90,336) ___________<br />
(763,715) (833,007) (833,006) (843,133)<br />
GRAND TOTAL 421,078 535,390 514,292 590,767<br />
PERSONNEL<br />
Current Proposed Pay Salary<br />
POSITION TITLE Budget Budget Grade Range<br />
Director Of Risk Management & Purchasing 1 1 PB3 *<br />
Safety Manager 1 1 56 49,504 - 74,922<br />
Health Benefits Coordinator 1 1 54 47,133 - 71,365<br />
Safety Coordinator - Energy Delivery 1 1 49 41,725 - 63,190<br />
Safety Coordinator 2 2 49 41,725 - 63,190<br />
Safety Officer 1 1 49 41,725 - 63,190<br />
Occupational Health Nurse 1 1 47 39,749 - 60,174<br />
Risk Management Executive Assistant 1 1 40 33,509 - 50,710<br />
Administrative Assistant 1 1 33 28,246 - 42,765<br />
Account Clerk III 1 1 29 25,605 - 38,771<br />
Office Associate II 3 3 29 25,605 - 38,771<br />
Office Associate I 1 1 24 22,693 - 34,320<br />
TOTAL FULL-TIME EMPLOYEES 15 15<br />
E – 40
GENERAL FUND<br />
INTERNAL AUDIT<br />
BUDGET FOR YEAR 2007-08<br />
Experience Budget Experience Proposed Adjustments<br />
For Year For Year 2006-07 by by<br />
EXPENSES 2005-06 2006-07 Estimated <strong>City</strong> Manager <strong>City</strong> Commission<br />
PERSONAL SERVICES 134,535 145,113 145,113 158,637<br />
OPERATING EXPENSES<br />
Water Utility Service 79 97 75 74 ___________<br />
Electric Utility Service 3,698 3,620 3,563 4,147 ___________<br />
Wastewater Utility Service 78 105 83 89 ___________<br />
Solid Waste Service 157 177 162 187 ___________<br />
Purchasing & Stores Service 42 45 45 48 ___________<br />
Intra-Dept Charges - Computer Rental 5,630 4,359 4,522 5,227 ___________<br />
Intra-Dept Charges - Telephone 808 808 808 930 ___________<br />
Intra-Dept Charges - Facilities 2,052 2,328 2,328 2,886 ___________<br />
Intra-Dept Charges - Janitorial 2,095 2,372 2,372 2,228 ___________<br />
Intra-Dept Charges - IT 5,472 6,098 6,098 4,757 ___________<br />
Intra-Dept Charges - Training<br />
99 ___________<br />
Office Supplies 1,515 1,250 1,308 1,250 ___________<br />
Subscriptions & Memberships 500 680 600 680 ___________<br />
Telephone, Communications 6 20 2 20 ___________<br />
Travel 1,250 1,250 1,250 ___________<br />
Training 800 1,250 1,230 1,250 ___________<br />
SUB-TOTAL 22,932 24,459 24,446 25,121<br />
TOTAL 157,467 169,572 169,559 183,758<br />
COST ALLOCATED TO<br />
Fleet Management Fund (7,977) (8,274) (8,274) (9,188) ___________<br />
Purchasing & Stores Fund (6,381) (6,619) (6,619) (7,350) ___________<br />
Facilities Maintenance Fund (1,595) (1,655) (1,655) (1,838) ___________<br />
Information Technology Fund (3,191) (3,310) (3,310) (3,675) ___________<br />
Wastewater Utility Fund (3,191) (3,310) (3,310) (3,675) ___________<br />
<strong>Lakeland</strong> Center Fund (7,977) (8,274) (8,274) (9,188) ___________<br />
<strong>Lakeland</strong> Linder Regional Airport Fund (7,977) (8,274) (8,274) (9,188) ___________<br />
Solid Waste Fund (3,191) (3,310) (3,310) (3,675) ___________<br />
Cleveland Heights Golf Course Fund (3,191) (3,310) (3,310) (3,675) ___________<br />
Water Utility Fund (4,786) (4,965) (4,965) (5,513) ___________<br />
Electric Utility Fund (63,814) (66,194) (66,194) (73,503) ___________<br />
(113,271) (117,495) (117,495) (130,468)<br />
GRAND TOTAL 44,196 52,077 52,064 53,290<br />
PERSONNEL<br />
Current Proposed Pay Salary<br />
POSITION TITLE Budget Budget Grade Range<br />
Internal Audit Manager 1 1 PB4 *<br />
Internal Auditor I 1 1 49 41,725 - 63,190<br />
TOTAL FULL-TIME EMPLOYEES 2 2<br />
E – 41
GENERAL FUND<br />
FINANCE - CENTRAL ACCOUNTING<br />
BUDGET FOR YEAR 2007-08<br />
Experience Budget Experience Proposed Adjustments<br />
For Year For Year 2006-07 by by<br />
EXPENSES 2005-06 2006-07 Estimated <strong>City</strong> Manager <strong>City</strong> Commission<br />
PERSONAL SERVICES 1,539,740 1,597,850 1,592,356 1,866,730<br />
OPERATING EXPENSES<br />
Auto Allowance 4,814 4,800 5,625 5,400 ___________<br />
Water Utility Service 478 592 456 452 ___________<br />
Electric Utility Service 22,500 22,024 21,682 25,236 ___________<br />
Wastewater Utility Service 477 641 505 545 ___________<br />
Solid Waste Service 953 1,078 988 1,135 ___________<br />
Purchasing & Stores Service 1,008 1,071 1,071 1,156 ___________<br />
Intra Dept-Charges - Computer Rental 67,099 51,339 50,973 57,341 ___________<br />
Intra-Dept Charges - Telephone 9,397 9,330 9,737 11,209 ___________<br />
Intra-Dept Charges - Facilities 12,483 14,164 14,164 17,558 ___________<br />
Intra-Dept Charges - Janitorial 12,746 14,430 14,430 13,552 ___________<br />
Intra-Dept Charges - IT 149,178 215,417 215,417 193,226 ___________<br />
Intra-Dept Charges - Training 1,183 ___________<br />
Special Services 92<br />
Banking Services 9,123 10,056 10,056 10,893 ___________<br />
Pr<strong>of</strong>essional Services 1,500 1,500 1,000 ___________<br />
Advertising 1,134 2,900 2,900 2,000 ___________<br />
Annual Audit 39,966 33,500 30,622 33,500 ___________<br />
Paying Agent, Trustee Fees 1,000 1,000 1,000 ___________<br />
Office Supplies 18,607 22,001 18,607 20,000 ___________<br />
Non-Capital Equipment 3,104 2,100 2,100 2,000 ___________<br />
Repair <strong>of</strong> Equipment 1,156 2,500 2,500 1,820 ___________<br />
Printing & Photography 4,780 7,300 7,300 4,500 ___________<br />
Postage and Mailing 20,231 28,000 22,524 25,000 ___________<br />
Subscriptions & Memberships 3,836 5,130 5,130 5,630 ___________<br />
Telephone, Communications 986 1,400 1,455 1,600 ___________<br />
Travel 6,326 7,915 7,915 7,782 ___________<br />
Training 5,590 6,600 6,600 7,500 ___________<br />
All Other Sundry Charges 1,749 1,000 1,000 750 ___________<br />
Fines & Penalties 2,162<br />
SUB-TOTAL 399,975 467,788 456,257 452,967<br />
CAPITAL EQUIPMENT<br />
Equipment 4,641 6,500 6,500<br />
E – 42
GENERAL FUND<br />
FINANCE - CENTRAL ACCOUNTING<br />
BUDGET FOR YEAR 2007-08<br />
Experience Budget Experience Proposed Adjustments<br />
For Year For Year 2006-07 by by<br />
EXPENSES 2005-06 2006-07 Estimated <strong>City</strong> Manager <strong>City</strong> Commission<br />
SPECIAL PROJECTS<br />
Finance Dir Office Bldg Modifications 1,310<br />
Maximo Upgrade 1,284 1,284<br />
SUB-TOTAL 1,310 1,284 1,284<br />
TOTAL 1,945,666 2,073,422 2,056,397 2,319,697<br />
COST ALLOCATED TO<br />
Fleet Management Fund (61,715) (92,079) (92,079) (118,305) ___________<br />
Purchasing & Stores Fund (41,348) (39,402) (39,402) (57,992) ___________<br />
Facilities Maintenance Fund (41,348) (60,051) (60,051) (69,591) ___________<br />
Information Technology Fund (65,603) (86,811) (86,811) (92,788) ___________<br />
Wastewater Utility Fund (92,574) (67,005) (67,005) (92,788) ___________<br />
Parking Fund (30,472) (29,499) (29,499) (30,156) ___________<br />
Cleveland Heights Golf Course Fund (67,825) (105,354) (105,354) (125,264) ___________<br />
<strong>Lakeland</strong> Center Fund (102,448) (59,841) (59,841) (81,189) ___________<br />
<strong>Lakeland</strong> Linder Regional Airport Fund (84,155) (56,891) (56,891) (39,435) ___________<br />
Solid Waste Fund (90,971) (85,547) (85,547) (95,108) ___________<br />
Water Utility Fund (115,533) (68,058) (68,058) (76,550) ___________<br />
Electric Utility Fund (396,601) (420,571) (420,571) (389,709) ___________<br />
(1,190,593) (1,171,109) (1,171,109) (1,268,875)<br />
GRAND TOTAL 755,073 902,313 885,288 1,050,822<br />
PERSONNEL<br />
Current Proposed Pay Salary<br />
POSITION TITLE Budget Budget Grade Range<br />
Finance Director 1 1 PB2 *<br />
Assistant Finance Director 1 1 PB4 *<br />
HRMS Manager 1 1 67 64,730 - 98,010<br />
Investment Manager 1 1 65 61,630 - 93,330<br />
OMB Manager 1 63 58,718 - 88,899<br />
Chief Accountant 3 3 63 58,718 - 88,899<br />
Payroll Manager 1 1 60 54,579 - 82,618<br />
Accountant III 1 1 58 51,979 - 78,666<br />
Computer Applications Specialist 2 2 54 47,133 - 71,365<br />
Accountant II 2 2 51 43,805 - 64,730<br />
Budget Analyst 1 49 41,725 - 63,190<br />
Accountant I 1 1 47 39,749 - 60,174<br />
Payroll Specialist 3 3 40 33,509 - 50,710<br />
Investment Management Assistant 1 1 38 31,907 - 48,298<br />
Account Clerk IV 3 3 33 28,246 - 42,765<br />
Account Clerk II 1 1 26 23,816 - 36,026<br />
Account Clerk I 1 1 24 22,693 - 34,320<br />
TOTAL FULL-TIME EMPLOYEES 25 23<br />
E – 43
GENERAL FUND<br />
FINANCE - CITY CLERK<br />
BUDGET FOR YEAR 2007-08<br />
Experience Budget Experience Proposed Adjustments<br />
For Year For Year 2006-07 by by<br />
EXPENSES 2005-06 2006-07 Estimated <strong>City</strong> Manager <strong>City</strong> Commission<br />
PERSONAL SERVICES 184,524 251,506 235,301 284,505<br />
OPERATING EXPENSES<br />
Water Utility Service 213 232 197 201 ___________<br />
Electric Utility Service 18,658 20,836 16,595 21,411 ___________<br />
Wastewater Utility Service 254 315 251 279 ___________<br />
Solid Waste Service 2,303 2,363 1,984 979 ___________<br />
Purchasing & Stores Service 1,194 1,268 1,268 1,370 ___________<br />
Intra-Dept Charges - Computer Rental 17,138 13,275 12,218 13,803 ___________<br />
Intra-Dept Charges - Telephone 2,260 2,260 2,374 2,600 ___________<br />
Intra-Dept Charges - Facilities 20,780 23,576 23,576 29,227 ___________<br />
Intra-Dept Charges - Janitorial 33,444 37,863 37,864 35,558 ___________<br />
Intra-Dept Charges - IT 74,589 27,904 27,904 25,173 ___________<br />
Intra-Dept Charges - Training<br />
246 ___________<br />
Contractual Services 4,820 1,163 1,163<br />
Office Supplies 1,602 1,800 1,800 1,700 ___________<br />
Advertising 9,156 10,000 10,000 10,000 ___________<br />
Non-Capital Equipment 2,936 700 700 600 ___________<br />
All Other Material & Supply 38 537 537 600 ___________<br />
Cleaning & Janitor Supply 7 50 50<br />
Repair <strong>of</strong> Equipment 3,673 5,110 5,110 5,535 ___________<br />
Printing & Photography 45 100 100 100 ___________<br />
Postage 268 250 250 950 ___________<br />
Subscriptions & Memberships 673 969 969 1,032 ___________<br />
Telephone, Communications 66 71 26 71 ___________<br />
Travel 3,059 5,429 5,429 5,583 ___________<br />
Training 634 700 700 700 ___________<br />
All Other Sundry Charges 112 112 112 ___________<br />
SUB-TOTAL 197,810 156,883 151,177 157,829<br />
CAPITAL EQUIPMENT<br />
Equipment 3,792 ___________<br />
E – 44
GENERAL FUND<br />
FINANCE - CITY CLERK<br />
BUDGET FOR YEAR 2007-08<br />
Experience Budget Experience Proposed Adjustments<br />
For Year For Year 2006-07 by by<br />
EXPENSES 2005-06 2006-07 Estimated <strong>City</strong> Manager <strong>City</strong> Commission<br />
SPECIAL PROJECTS<br />
Police Report Micr<strong>of</strong>ilming 5,386 7,860 7,860 8,000 ___________<br />
Code Enforcement Board 89,349 62,950 62,950<br />
Shredding 5,000<br />
Election Expenses 85,531 90,000 90,000 10,000 ___________<br />
SUB-TOTAL 180,266 160,810 160,810 23,000<br />
TOTAL 562,600 569,199 547,288 469,126<br />
COST ALLOCATED TO<br />
Purchasing & Stores Fund (24,335) (20,775) (20,775) (2,346) ___________<br />
Wastewater Utility Fund (4,056) (3,463) (3,463) (4,691) ___________<br />
<strong>Lakeland</strong> Center Fund (4,056) (3,463) (3,463)<br />
<strong>Lakeland</strong> Linder Regional Airport Fund (3,753)<br />
Electric Utility Fund (60,837) (51,938) (51,938) (30,493) ___________<br />
Water Utility Fund (6,084) (5,194) (5,194) (4,691) ___________<br />
(99,368) (84,833) (84,833) (45,974)<br />
GRAND TOTAL 463,232 484,366 462,455 423,152<br />
Equipment<br />
1 - Scanner Replacement 3,792<br />
3,792<br />
PERSONNEL<br />
Current Proposed Pay Salary<br />
POSITION TITLE Budget Budget Grade Range<br />
<strong>City</strong> Clerk 1 1 51 43,805 - 64,730<br />
Deputy <strong>City</strong> Clerk 1 1 38 31,907 - 48,298<br />
Records Supervisor 1 1 38 31,907 - 48,298<br />
Warehouse Operations Tech I 1 1 31 26,894 - 40,726<br />
Office Associate II 1 1 29 25,605 - 38,771<br />
TOTAL FULL-TIME EMPLOYEES 5 5<br />
PART-TIME EMPLOYEES<br />
CBE Student 1 1<br />
1 1<br />
E – 45
GENERAL FUND<br />
FINANCE - TREASURER<br />
BUDGET FOR YEAR 2007-08<br />
Experience Budget Experience Proposed Adjustments<br />
For Year For Year 2006-07 by by<br />
EXPENSES 2005-06 2006-07 Estimated <strong>City</strong> Manager <strong>City</strong> Commission<br />
PERSONAL SERVICES 552,410 583,738 583,738 647,558<br />
OPERATING EXPENSES<br />
Uninsured Loss Reimbursement 250 250 250 ___________<br />
Purchasing & Stores Service 1,252 1,330 1,330 1,436 ___________<br />
Intra-Dept Charges - Computer Rental 32,104 25,966 24,175 27,889 ___________<br />
Intra-Dept Charges - Telephone 3,909 4,145 3,941 4,539 ___________<br />
Intra-Dept Charges - IT 74,589 54,886 54,886 48,944 ___________<br />
Intra-Dept Charges - Training<br />
641 ___________<br />
Special Services 10,978 10,466 11,626 9,284 ___________<br />
Office Supplies 12,142 9,249 10,919 13,050 ___________<br />
Non-Capital Equipment 121 121 1,400 ___________<br />
All Other Materials & Supplies 181 181<br />
Repair <strong>of</strong> Equipment 18,384 22,307 22,307 20,400 ___________<br />
Printing & Photography 1,366 1,423 1,423 1,750 ___________<br />
Postage 1,806 2,056 2,056 2,140 ___________<br />
Subscriptions & Memberships 130 127 127 200 ___________<br />
Telephone Communications 887 900 453 900 ___________<br />
Travel 30<br />
Training 35 210 105 90 ___________<br />
SUB-TOTAL 157,612 133,617 133,900 132,913<br />
SPECIAL PROJECTS<br />
Replacement Currency Counter 2,995 2,995<br />
Lobby Security Enhancements 10,000 10,000<br />
SUB-TOTAL 12,995 12,995<br />
TOTAL 710,022 730,350 730,633 780,471<br />
E – 46
GENERAL FUND<br />
FINANCE - TREASURER<br />
BUDGET FOR YEAR 2007-08<br />
Experience Budget Experience Proposed Adjustments<br />
For Year For Year 2006-07 by by<br />
EXPENSES 2005-06 2006-07 Estimated <strong>City</strong> Manager <strong>City</strong> Commission<br />
COST ALLOCATED TO<br />
Fleet Management Fund (3,631) (693) (693) (780) ___________<br />
Purchasing & Stores Fund (3,631)<br />
Facilities Maintenance Fund (3,631)<br />
Information Technology Fund (2,542)<br />
<strong>Lakeland</strong> Center Fund (3,631) (693) (693)<br />
Solid Waste Fund (19,972) (18,706) (18,706) (21,853) ___________<br />
<strong>Lakeland</strong> Linder Regional Airport Fund (3,849) (11,778) (11,778) (11,707) ___________<br />
Parking Fund (23,603) (693) (693) (780) ___________<br />
Wastewater Utility Fund (19,827) (33,948) (33,948) (35,121) ___________<br />
Electric Utility Fund (495,664) (561,878) (561,878) (639,206) ___________<br />
Cleveland Heights Golf Course Fund (3,631)<br />
Water Utility Fund (38,491) (36,027) (36,027) (44,487) ___________<br />
(622,103) (664,416) (664,416) (753,934)<br />
GRAND TOTAL 87,919 65,934 66,217 26,537<br />
PERSONNEL<br />
Current Proposed Pay Salary<br />
POSITION TITLE Budget Budget Grade Range<br />
<strong>City</strong> Treasurer 1 1 63 58,718 - 88,899<br />
Office Manager 2 2 38 31,907 - 48,298<br />
Account Clerk III 2 3 29 25,605 - 38,771<br />
Account Clerk II 1 1 26 23,816 - 36,026<br />
Office Associate I 2 2 24 22,693 - 34,320<br />
Account Clerk I 1 24 22,693 - 34,320<br />
Office Assistant II 1 1 22 21,590 - 32,677<br />
Office Assistant I 3 3 17 19,094 - 28,954<br />
TOTAL FULL-TIME EMPLOYEES 13 13<br />
PART-TIME<br />
Office Assistant I 3 4<br />
TOTAL PART-TIME EMPLOYEES 3 4<br />
E – 47
GENERAL FUND<br />
FINANCE - ELECTRIC UTILITY FINANCE<br />
BUDGET FOR YEAR 2007-08<br />
Experience Budget Experience Proposed Adjustments<br />
For Year For Year 2006-07 by by<br />
EXPENSES 2005-06 2006-07 Estimated <strong>City</strong> Manager <strong>City</strong> Commission<br />
PERSONAL SERVICES 740,800 813,006 813,006 889,587<br />
OPERATING EXPENSES<br />
Purchasing & Stores Service 135 143 143 155 ___________<br />
Intra-Dept Charges - Computer Rental 31,450 24,143 24,143 26,693 ___________<br />
Intra-Dept Charges - Telephone 4,219 4,095 4,095 5,129 ___________<br />
Intra-Dept Charges - IT 86,064 50,190 50,190 43,392 ___________<br />
Intra-Dept Charges - Training 542 ___________<br />
<strong>Lakeland</strong> Electric Charges 162,263 ___________<br />
Subscriptions & Memberships 1,173 1,350 1,350 1,179 ___________<br />
Travel 2,527 1,975 1,975 1,966 ___________<br />
Training 200 200 300 ___________<br />
SUB-TOTAL 125,568 82,096 82,096 241,619<br />
SPECIAL PROJECTS<br />
Maximo Upgrade 10,273 10,273<br />
SUB-TOTAL 10,273 10,273<br />
TOTAL 866,368 905,375 905,375 1,131,206<br />
COST ALLOCATED TO<br />
Water Utility Fund (58,046) (44,754) (44,754) (22,624) ___________<br />
Electric Utility Fund (808,322) (850,321) (850,321) (1,108,582) ___________<br />
(866,368) (895,075) (895,075) (1,131,206)<br />
GRAND TOTAL 10,300 10,300<br />
PERSONNEL<br />
Current Proposed Pay Salary<br />
POSITION TITLE Budget Budget Grade Range<br />
Assistant Finance Director-LE 1 1 PB4 *<br />
Utilities Accounting and Finance Supervisor 1 1 67 64,730 - 98,010<br />
Chief Accountant 1 1 63 58,718 - 88,899<br />
Accountant III 4 4 58 51,979 - 78,666<br />
Account Clerk IV 2 2 33 28,246 - 42,765<br />
Account Clerk III 2 2 29 25,605 - 38,771<br />
TOTAL FULL-TIME EMPLOYEES 11 11<br />
PART-TIME<br />
Account Clerk I 1 1<br />
Account Clerk II 1 1<br />
TOTAL PART-TIME EMPLOYEES 2 2<br />
E – 48
GENERAL FUND<br />
FINANCE - CUSTOMER BILLING<br />
BUDGET FOR YEAR 2007-08<br />
Experience Budget Experience Proposed Adjustments<br />
For Year For Year 2006-07 by by<br />
EXPENSES 2005-06 2006-07 Estimated <strong>City</strong> Manager <strong>City</strong> Commission<br />
PERSONAL SERVICES 461,310 556,658 556,658 671,946<br />
OPERATING EXPENSES<br />
Water Utility Service 277 219 169 168 ___________<br />
Electric Utility Service 13,111 8,159 8,033 9,349 ___________<br />
Wastewater Utility Service 273 237 187 202 ___________<br />
Solid Waste Service 538 400 366 421 ___________<br />
Purchasing & Stores Service 4,058 4,310 4,310 4,654 ___________<br />
Intra Dept Charges - Computer Rental 21,689 17,117 17,117 20,231 ___________<br />
Intra-Dept Charges - Telephone 6,285 5,923 6,012 7,291 ___________<br />
Intra-Dept Charges - Facilities 4,347 5,248 5,248 6,506 ___________<br />
Intra-Dept Charges - Janitorial 4,438 5,346 5,346 5,021 ___________<br />
Intra-Dept Charges - IT 45,901 70,514 70,514 63,608 ___________<br />
Intra-Dept Charges - IT Projects 374 1,102 644<br />
Intra-Dept Charges - Training<br />
591 ___________<br />
Special Services 29,300 29,300 34,500 ___________<br />
Legal Fees 4,200 4,200<br />
Office Supplies 5,554 8,357 8,357 7,000 ___________<br />
Non-Capital Equipment 2,331<br />
Repair <strong>of</strong> Equipment 604 1,000 1,000 1,000 ___________<br />
Printing & Photography 2,671 3,000 3,000 3,000 ___________<br />
Postage 3,408 4,000 4,000 4,000 ___________<br />
Telephone, Communications 240 270 270 300 ___________<br />
Travel 3,867 3,650 3,650 4,890 ___________<br />
Training 379 300 ___________<br />
Subscription & Membership 102 ___________<br />
SUB-TOTAL 120,345 172,352 171,723 173,134<br />
SPECIAL PROJECTS<br />
Customer Billing Office Expansion 10,000 10,000<br />
SUB-TOTAL 10,000 10,000<br />
TOTAL 581,655 739,010 738,381 845,080<br />
E – 49
GENERAL FUND<br />
FINANCE - CUSTOMER BILLING<br />
BUDGET FOR YEAR 2007-08<br />
Experience Budget Experience Proposed Adjustments<br />
For Year For Year 2006-07 by by<br />
EXPENSES 2005-06 2006-07 Estimated <strong>City</strong> Manager <strong>City</strong> Commission<br />
COST ALLOCATED TO:<br />
Wastewater Utility Fund (154,612) (130,550) (130,550) (143,664) ___________<br />
Water Utility Fund (76,580) (101,539) (101,539) (194,368) ___________<br />
Stormwater Fund (55,599) (65,275) (65,275) (76,057) ___________<br />
Solid Waste Fund (193,024) (246,595) (246,595) (211,270) ___________<br />
Electric Utility Fund (100,913) (124,876) (124,876) (76,057) ___________<br />
(580,728) (668,835) (668,835) (701,416)<br />
GRAND TOTAL 927 70,175 69,546 143,663<br />
PERSONNEL<br />
Current Proposed Pay Salary<br />
POSITION TITLE Budget Budget Grade Range<br />
Finance Customer Billing Manager 1 1 65 61,630 - 93,330<br />
Assistant Customer Billing Mgr 1 1 56 49,504 - 74,922<br />
Customer Service Team Leader 1 1 38 31,907 - 48,298<br />
Account Clerk IV 1 1 33 28,246 - 42,765<br />
Account Clerk III 1 1 29 25,605 - 38,771<br />
Customer Service Representative II 6 5 29 25,605 - 38,771<br />
Office Associate II 1 1 29 25,605 - 38,771<br />
TOTAL FULL-TIME EMPLOYEES 12 11<br />
E – 50
GENERAL FUND<br />
FIRE<br />
BUDGET FOR YEAR 2007-08<br />
Experience Budget Experience Proposed Adjustments<br />
For Year For Year 2006-07 by by<br />
EXPENSES 2005-06 2006-07 Estimated <strong>City</strong> Manager <strong>City</strong> Commission<br />
PERSONAL SERVICES 9,112,770 10,200,517 10,199,038 11,590,005<br />
OPERATING EXPENSES<br />
Uninsured Loss Reimbursement 936 750 750 ___________<br />
Water Utility Service 27,100 27,652 25,060 25,150 ___________<br />
Electric Utility Service 116,796 109,445 111,605 121,635 ___________<br />
Wastewater Utility Service 23,623 25,043 24,588 26,618 ___________<br />
Solid Waste Service 15,351 16,117 13,343 14,186 ___________<br />
Purchasing & Stores Service 9,718 10,321 10,320 11,146 ___________<br />
Intra-Dept Charges - Computer Rental 79,704 66,432 87,731 101,543 ___________<br />
Intra-Dept Charges - Telephone 10,364 10,620 11,318 13,132 ___________<br />
Intra-Dept Charges - Radios 29,392 31,640 31,678 29,904 ___________<br />
Intra-Dept Charges - Facilities 95,345 108,178 108,178 180,770 ___________<br />
Intra-Dept Charges - Janitorial 13,649 15,452 15,452 31,836 ___________<br />
Intra-Dept Charges - IT 51,749 103,404 103,404 63,896 ___________<br />
Intra-Dept Charges - IT Projects 94 275 161<br />
Intra-Dept Charges - Training 7,440 ___________<br />
Special Services 1,133 1,200 1,313 1,200 ___________<br />
Office Supplies 9,686 9,500 10,025 9,500 ___________<br />
Equipment - Noncapital 14,773 24,682 24,682 16,000 ___________<br />
All Other Material & Supply 2,784 3,800 3,800 4,000 ___________<br />
Uniforms 29,517 30,000 28,534 30,000 ___________<br />
Chemicals 3,865 4,000 4,000 6,500 ___________<br />
Tools & Implements 2,840 2,500 2,500 2,500 ___________<br />
Fuel 109,323 90,000 113,237 100,000 ___________<br />
Fire Fighting Accessories 56,192 50,580 50,580 50,400 ___________<br />
Leases 5,436 5,000 5,000 5,500 ___________<br />
License Tags 389 300 300 300 ___________<br />
Rentals 350 350 350 ___________<br />
Repair <strong>of</strong> Equipment 23,090 24,250 28,773 25,000 ___________<br />
Printing & Photography 1,975 1,800 1,800 1,800 ___________<br />
Postage 1,447 1,700 1,700 1,900 ___________<br />
Subscriptions & Memberships 1,952 2,184 2,184 2,313 ___________<br />
Telephone, Communications 18,103 26,000 20,321 26,000 ___________<br />
Travel 1,561 5,000 5,000 5,000 ___________<br />
Laundry & Dry Cleaning 35,351 40,000 30,589 40,000 ___________<br />
All Other Sundry Charges 2,326 2,300 2,300 2,750 ___________<br />
Repair <strong>of</strong> Motor Equipment 56,717 54,000 54,000 55,000 ___________<br />
S<strong>of</strong>tware License & Maintenance 1,350 780 780 1,350 ___________<br />
Car Washing 405 450 450<br />
Recoveries-From Outside <strong>City</strong> (216)<br />
SUB-TOTAL 853,100 905,891 935,590 1,015,369<br />
E – 51
GENERAL FUND<br />
FIRE<br />
BUDGET FOR YEAR 2007-08<br />
Experience Budget Experience Proposed Adjustments<br />
For Year For Year 2006-07 by by<br />
EXPENSES 2005-06 2006-07 Estimated <strong>City</strong> Manager <strong>City</strong> Commission<br />
CAPITAL EQUIPMENT<br />
Equipment 29,193 37,711 37,711 37,000 ___________<br />
SPECIAL PROJECTS<br />
Wilma SEOC Mutual Aid 1,567<br />
Training Project 33,628 30,000 30,000 30,000 ___________<br />
EMS Operations 10,795 10,500 10,500 10,500 ___________<br />
Fire Safety Management 29,801 33,400 33,400 23,000 ___________<br />
Hydrant Markers 1,421 1,500 1,500 1,500 ___________<br />
Intersection Control Equipment 3,949 4,000 4,000 4,000 ___________<br />
Maintenance & Replacement <strong>of</strong> Equip. 7,364 7,500 7,500 7,500 ___________<br />
<strong>City</strong> University 1,330 8,000 8,000 8,000 ___________<br />
Paramedic Training 18,333 25,000 22,683 25,000 ___________<br />
Training Program 15,000 15,000<br />
<strong>Lakeland</strong> Fire Dept-The One Step System 18,407<br />
Temporary Fire Station - Airport 20,000 20,000<br />
Fire Prevention Week 3,100 3,100 3,100 ___________<br />
Urban Search And Rescue Team (Usar) 20,000 ___________<br />
Arff Initial Training 15,000 ___________<br />
SUB-TOTAL 126,595 158,000 155,683 147,600<br />
GRAND TOTAL 10,121,658 11,302,119 11,328,022 12,789,974<br />
Equipment<br />
1 - Thermal Image Camera Replacement 9,000<br />
1 - Air Bag Set New 4,500<br />
1 - Bunker Gear Washer New 10,000<br />
1 - Hurst Cutter Replacement 4,500<br />
1 - Thermal Image Camera New 9,000<br />
37,000<br />
E – 52
GENERAL FUND<br />
FIRE<br />
BUDGET FOR YEAR 2007-08<br />
Experience Budget Experience Proposed Adjustments<br />
For Year For Year 2006-07 by by<br />
EXPENSES 2005-06 2006-07 Estimated <strong>City</strong> Manager <strong>City</strong> Commission<br />
PERSONNEL<br />
Current Proposed Pay Salary<br />
POSITION TITLE Budget Budget Grade Range<br />
Fire Chief 1 1 PB3 *<br />
Assistant Fire Chief 2 2 PB5 *<br />
Fire Marshal 1 1 63 58,718 - 88,899<br />
Battalion Chief 6 6 63 58,718 - 88,899<br />
Fire Training Officer Paramedic 1 1 58 51,979 - 78,666<br />
Rescue Chief 1 1 54 47,133 - 71,365<br />
Fire Equipment Supervisor 1 1 53 45,989 - 69,659<br />
Fire Lieutenant 27 27 53 43,160 - 65,412<br />
Fire Safety Inspector 6 6 51 43,805 - 64,730<br />
Public Education Officer 1 1 51 43,805 - 64,730<br />
Fire Equipment Mechanic 1 1 47 39,749 - 60,174<br />
Driver Engineer 42 42 47 37,294 - 56,508<br />
Firefighter 57 57 44 34,674 - 52,524<br />
Administrative Assistant 1 1 33 28,246 - 42,765<br />
Account Clerk III 1 1 29 25,605 - 38,771<br />
Office Associate I 2 2 24 22,693 - 34,320<br />
TOTAL FULL-TIME EMPLOYEES 151 151<br />
PART-TIME<br />
Fire Safety Specialist 2 2<br />
TOTAL PART-TIME EMPLOYEES 2 2<br />
E – 53
GENERAL FUND<br />
POLICE<br />
BUDGET FOR YEAR 2007-08<br />
Proposed Adjustments<br />
Experience Budget 2006-07 by by<br />
EXPENSES 2005-06 2006-07 Estimated <strong>City</strong> Manager <strong>City</strong> Commission<br />
PERSONAL SERVICES 21,741,465 23,288,138 22,779,585 25,088,208<br />
OPERATING EXPENSES<br />
Rental / Fleet Equipment 1,040,432 770,868 757,622 788,950 ___________<br />
Gasoline / Fleet Equipment 611,311 729,169 643,515 727,409 ___________<br />
Maintenance / Fleet Equipment 606,300 671,222 1,007,538 1,063,371 ___________<br />
Uninsured Loss Reimbursement (50) 5,500 1,500 1,500 ___________<br />
Water Utility Service 7,478 8,106 12,436 11,685 ___________<br />
Stormwater Fees 24 25 24 54 ___________<br />
Electric Utility Service 393,184 396,425 380,106 387,355 ___________<br />
Wastewater Utility Service 5,200 5,793 5,645 6,123 ___________<br />
Solid Waste Service 7,405 7,600 7,777 8,166 ___________<br />
Purchasing & Stores Service 21,476 22,808 22,808 24,633 ___________<br />
Intra-Dept Charges - Computer Rental 470,395 503,009 347,750 440,496 ___________<br />
Intra-Dept Charges - Telephone 89,904 92,205 91,303 104,643 ___________<br />
Intra-Dept Charges - Radios 175,016 185,803 185,350 191,964 ___________<br />
Intra-Dept Charges - Facilities 167,403 189,936 189,936 199,399 ___________<br />
Intra-Dept Charges - Janitorial 142,057 163,554 163,554 153,597 ___________<br />
Intra-Dept Charges - IT 931,991 1,430,796 1,430,796 1,342,011 ___________<br />
Intra-Dept Charges - IT Projects 280 827 827<br />
Intra-Dept Charges - Training 18,280 ___________<br />
Special Services 25,574 25,439 28,266 23,015 ___________<br />
Pr<strong>of</strong>essional Services 16,043 15,380 14,685 15,580 ___________<br />
Legal Advertising 956 2,000 1,500 1,500 ___________<br />
Office Supplies 82,748 81,178 83,943 80,763 ___________<br />
Non-Capital Equipment 30,104 41,902 42,978 39,430 ___________<br />
All Other Materials & Supplies 35,445 37,584 38,461 39,344 ___________<br />
Uniforms 113,135 122,500 122,500 127,587 ___________<br />
Fuel 1,000 500 1,000 ___________<br />
License Tags 1,192 1,250 1,100 1,250 ___________<br />
Crime Prevention Unit Material 3,506 4,000 3,700 4,000 ___________<br />
Food & Supplies - Animals 5,125 5,000 5,000 5,000 ___________<br />
Training Ammunition 11,201 12,300 12,100 12,300 ___________<br />
Leases 96,360 104,795 104,254 104,009 ___________<br />
Repair <strong>of</strong> Equipment 127,904 79,172 80,133 83,870 ___________<br />
Printing & Photography 22,733 21,270 20,000 20,500 ___________<br />
Postage 13,517 12,500 12,500 13,500 ___________<br />
Subscriptions & Memberships 15,487 15,153 15,925 16,310 ___________<br />
Telephone, Communications 53,142 65,199 49,366 66,159 ___________<br />
Travel 3,920 4,200 4,200 4,200 ___________<br />
Laundry & Dry Cleaning 121,062 119,000 121,062 127,000 ___________<br />
Training 12,981 16,200 16,200 13,200 ___________<br />
All Other Sundry Charges 5,725 4,800 4,800 22,800 ___________<br />
Car Washing 12,146 13,000 13,000<br />
Confidential Informants 55,000 55,000 55,000<br />
Gift Certificates 660 660<br />
SUB-TOTAL 5,534,812 6,044,128 6,100,320 6,291,953<br />
E – 54
GENERAL FUND<br />
POLICE<br />
BUDGET FOR YEAR 2007-08<br />
Proposed Adjustments<br />
Experience Budget 2006-07 by by<br />
EXPENSES 2005-06 2006-07 Estimated <strong>City</strong> Manager <strong>City</strong> Commission<br />
CAPITAL OUTLAY<br />
Equipment 15,296 12,499 12,499<br />
TOTAL 27,291,573 29,344,765 28,892,404 31,380,162<br />
GRANT PROGRAMS<br />
DOJ - Justice Assistance 106,214 106,214 44,704 ___________<br />
Polk County School Board-SRO 336,160 382,333 382,333 395,013 ___________<br />
Stop Violence Against Women (DART) 63,273 85,699 50,635 85,695 ___________<br />
FOAG-Victim Assistance (VOCA) 122,185 128,526 130,431 143,453 ___________<br />
BJA - Safe Neighborhoods 107,142 115,586 101,855 108,112 ___________<br />
High Intensity Drug Trafficking Area 15,408 1,592 5,275 17,000 ___________<br />
DOJ - Bulletpro<strong>of</strong> Vests 23,994 25,107 24,790 44,340 ___________<br />
FDLE - Neighborhood Enf. Team 52,502 1,447 1,447<br />
FDOT-DUI Enforcement Equipment 22,100 22,100<br />
SUB-TOTAL 720,664 868,604 825,080 838,317<br />
SPECIAL PROJECTS<br />
Crime Watch 8,397 11,013 11,013 8,400 ___________<br />
Special Overtime 75,870 80,000 80,000 85,000 ___________<br />
<strong>Lakeland</strong> Night Out Program 931 1,000 1,000 1,000 ___________<br />
Emergency Preparedness 2,295 2,500 2,500 2,500 ___________<br />
Recruitment 43,570 52,130 52,789 61,138 ___________<br />
Aircraft Operations 144,776 153,750 153,750 160,750 ___________<br />
Victim Assistance Program 25,000 25,000 25,000 25,000 ___________<br />
Training Center 35,347 40,392 40,392 53,892 ___________<br />
Police Education 40,090 35,000 36,540 35,000 ___________<br />
Polk Community College IPS Coordinator 79,832 81,225 81,225 84,504 ___________<br />
Canine Training - Donations 10,171 104<br />
Investigative Cost Reimbursement 103,949 150,926 150,926<br />
Do the Right Thing - Donations 4,854 5,210 5,210<br />
Victim Assistance Donations 944<br />
School Resource Officers - Donations 20,419 22,089 22,089<br />
Police Activities League & DARE 3,000 3,000 3,000 3,000 ___________<br />
Mutual Aid Hurricane Wilma #792 27,569<br />
SUB-TOTAL 627,014 663,339 665,434 520,184<br />
TOTAL 1,347,678 1,531,943 1,490,514 1,358,501<br />
E – 55
GENERAL FUND<br />
POLICE<br />
BUDGET FOR YEAR 2007-08<br />
Proposed Adjustments<br />
Experience Budget 2006-07 by by<br />
EXPENSES 2005-06 2006-07 Estimated <strong>City</strong> Manager <strong>City</strong> Commission<br />
LAW ENFORCEMENT TRUST FUND<br />
OPERATING EXPENSES<br />
Non-Capital Equipment 16,834 7,500 7,500<br />
All Other Material & Supplies 633<br />
Administrative Costs 42,037 43,459 32,313<br />
SUB-TOTAL 58,871 51,592 39,813<br />
CAPITAL OUTLAY<br />
Equipment 58,674 205,490 75,000<br />
TOTAL 117,545 257,082 114,813<br />
FEDERALLY FORFEITED PROPERTY<br />
OPERATING EXPENSES<br />
Equipment - Non-capital 56,583 25,000<br />
SUB-TOTAL 56,583 25,000<br />
CAPITAL OUTLAY<br />
Equipment 20,415 297,988 45,000<br />
TOTAL 20,415 354,571 70,000<br />
GRAND TOTAL 28,777,211 31,488,361 30,567,731 32,738,663<br />
E – 56
GENERAL FUND<br />
POLICE<br />
BUDGET FOR YEAR 2007-08<br />
Proposed Adjustments<br />
Experience Budget 2006-07 by by<br />
EXPENSES 2005-06 2006-07 Estimated <strong>City</strong> Manager <strong>City</strong> Commission<br />
PERSONNEL<br />
Current Proposed Pay Salary<br />
POSITION TITLE Budget Budget Grade Range<br />
Police Chief 1 1 PB2 *<br />
Assistant Police Chief 2 2 PB4 *<br />
Asst Police Chief Admin Services 1 1 PB4 *<br />
Police General Counselor & Advisor 1 1 PB4 *<br />
Police Captain 4 4 65 61,630 - 93,330<br />
Chief Accountant 1 1 63 58,718 - 88,899<br />
Police Lieutenant 11 11 63 56,544 - 81,936<br />
Police Sergeant 33 32 56 48,516 - 70,308<br />
Police Planning & Research Supervisor 1 1 54 47,133 - 71,365<br />
Crime Scene Supervisor 1 1 54 47,133 - 71,365<br />
Background Investigator 1 1 54 47,133 - 71,365<br />
CSU Supervisor 1 1 49 41,725 - 63,190<br />
PAL Executive Director 1 1 49 41,725 - 63,190<br />
Police Officer 179 176 49 40,812 - 59,136<br />
Police Facility Fleet Coord 1 1 47 39,749 - 60,174<br />
Latent Print Examiner 1 47 39,749 - 60,174<br />
Accreditation Manager 1 1 45 37,835 - 57,304<br />
Police Administrative Coordinator 4 4 45 37,835 - 57,304<br />
Recruiter 1 45 37,835 - 57,304<br />
Emergency Comm. Shift Supervisor 4 4 42 35,173 - 53,248<br />
Community Resources Coordinator 1 1 40 33,509 - 50,710<br />
Crime Scene Technician II 1 1 40 33,509 - 50,710<br />
Legal Assistant 1 1 40 33,509 - 50,710<br />
Crime Analyst 1 3 38 31,907 - 48,298<br />
Crime Scene Technician I 3 3 36 30,389 - 45,989<br />
Chief Clerk 2 1 36 30,389 - 45,989<br />
Property Evidence Specialist 1 36 30,389 - 45,989<br />
Administrative Assistant 2 2 33 28,246 - 42,765<br />
Account Clerk IV 1 1 33 28,246 - 42,765<br />
Court Liaison 1 1 33 28,246 - 42,765<br />
Emergency Communications Specialist 36 36 33 28,246 - 42,765<br />
Civilian Crime Prevention Practitioner 6 6 31 26,894 - 40,726<br />
Account Clerk III 2 3 29 25,605 - 38,771<br />
Police Property Clerk 5 4 29 25,605 - 38,771<br />
Office Associate II 4 4 29 25,605 - 38,771<br />
Public Safety Aide I 15 15 29 25,605 - 38,771<br />
Account Clerk II 1 26 23,816 - 36,026<br />
Office Associate I 11 12 24 22,693 - 34,320<br />
Office Assistant II 6 7 22 21,590 - 32,677<br />
TOTAL FULL-TIME EMPLOYEES 347 348<br />
E – 57
GENERAL FUND<br />
POLICE<br />
BUDGET FOR YEAR 2007-08<br />
Proposed Adjustments<br />
Experience Budget 2006-07 by by<br />
EXPENSES 2005-06 2006-07 Estimated <strong>City</strong> Manager <strong>City</strong> Commission<br />
Current Proposed<br />
POSITION TITLE Budget Budget<br />
GRANT-FUNDED POSITIONS<br />
Police Sergeant - IPS Coordinator 1 1 56 48,516 - 70,308<br />
Police Sergeant- SRO 1 56 48,516 - 70,308<br />
Police Officer - SRO 5 8 49 40,812 - 59,136<br />
Crime Analyst - Safe Neighborhoods 2 38 31,907 - 48,298<br />
Victim Assistance Coordinator- VOCA 1 1 36 30,389 - 45,989<br />
Victim Assistance Coordinator- DART 1 1 36 30,389 - 45,989<br />
Victim Assistance Advocate - VOCA 2 2 27 24,398 - 36,941<br />
Victim Assistance Advocate - DART 1 1 27 24,398 - 36,941<br />
TOTAL GRANT-FUNDED POSITIONS 13 15<br />
PART-TIME<br />
Chief Pilot 1 1<br />
DCT (CBE Students) 9 8<br />
Sworn Auxiliary 10 10<br />
Civilian Auxiliary 10 9<br />
Office Associate I 2 2<br />
Account Clerk III 1 1<br />
Emergency Communications Specialist 7 7<br />
TOTAL PART-TIME EMPLOYEES 40 38<br />
E – 58
GENERAL FUND<br />
PUBLIC WORKS - DIRECTOR<br />
BUDGET FOR YEAR 2007-08<br />
Experience Budget Experience Proposed Adjustments<br />
For Year For Year 2006-07 by by<br />
EXPENSES 2005-06 2006-07 Estimated <strong>City</strong> Manager <strong>City</strong> Commission<br />
PERSONAL SERVICES 465,211 493,991 450,356 619,434<br />
OPERATING EXPENSES<br />
Auto Allowance 4,814 4,800 4,800 5,400 ___________<br />
Rental / Fleet Equipment 5,376 3,314 3,313 5,252 ___________<br />
Gasoline / Fleet Equipment 1,446 3,204 1,637 3,227 ___________<br />
Maintenance / Fleet Equipment 3,604 4,794 5,244 5,506 ___________<br />
Uninsured Loss Reimbursement 250<br />
Water Utility Service 184 228 176 174 ___________<br />
Electric Utility Service 8,670 8,487 8,355 9,724 ___________<br />
Wastewater Utility Service 184 247 195 210 ___________<br />
Solid Waste Service 367 415 381 437 ___________<br />
Purchasing & Stores Service 10,501 11,152 11,152 12,045 ___________<br />
Intra-Dept Charges - Computer Rental 17,373 14,327 14,179 16,665 ___________<br />
Intra-Dept Charges - Telephone 3,654 3,773 3,894 4,451 ___________<br />
Intra-Dept Charges - Radios 668 673 674 643 ___________<br />
Intra-Dept Charges - Facilities 4,811 5,458 5,458 6,766 ___________<br />
Intra-Dept Charges - Janitorial 4,912 5,561 5,561 5,222 ___________<br />
Intra-Dept Charges - IT 13,199 42,048 42,048 39,667 ___________<br />
Intra-Dept Charges - IT Projects 1,122 3,306 3,306<br />
Intra-Dept Charges - Training<br />
345 ___________<br />
Special Services 1,200 1,200<br />
Office Supplies 5,340 4,513 4,473 5,200 ___________<br />
Equipment - Noncapital 1,325<br />
Uniforms 611 600 600 700 ___________<br />
Repair <strong>of</strong> Equipment 661 1,100 1,100 1,100 ___________<br />
Printing & Photography 500 500 300 ___________<br />
Postage 530 500 499 500 ___________<br />
Subscriptions & Memberships 1,148 1,070 1,148 1,520 ___________<br />
Telephone, Communications 1,894 2,080 1,894 2,050 ___________<br />
Travel 1,837 2,120 2,120 4,000 ___________<br />
Training 1,780 8,168 8,168 4,500 ___________<br />
All Other Sundry Charges 2,480 1,674 1,674 2,240 ___________<br />
Licenses & Permits 2,000 2,000 2,000 ___________<br />
Car Washing 26 59<br />
SUB-TOTAL 98,741 137,338 135,808 139,844<br />
E – 59
GENERAL FUND<br />
PUBLIC WORKS - DIRECTOR<br />
BUDGET FOR YEAR 2007-08<br />
Experience Budget Experience Proposed Adjustments<br />
For Year For Year 2006-07 by by<br />
EXPENSES 2005-06 2006-07 Estimated <strong>City</strong> Manager <strong>City</strong> Commission<br />
CAPITAL EQUIPMENT<br />
Equipment 1,450 7,500 ___________<br />
TOTAL 565,402 631,329 586,164 766,778<br />
COST ALLOCATED TO<br />
Facilities Maintenance Fund (18,574) (31,401) (31,402) (41,406) ___________<br />
Fleet Management Fund (6,965) (18,840) (18,840) (68,243) ___________<br />
Parking Fund (4,643) (6,280) (6,280) (9,201) ___________<br />
Solid Waste Fund (60,945) (69,081) (69,080) (86,646) ___________<br />
(91,127) (125,602) (125,602) (205,496)<br />
GRAND TOTAL 474,275 505,727 460,562 561,282<br />
Equipment<br />
1 - Color Copier New 7,500<br />
PERSONNEL<br />
Current Proposed Pay Salary<br />
POSITION TITLE Budget Budget Grade Range<br />
Director Of Public Works 1 1 PB2 *<br />
Assistant Public Works Director 1 1 PB4 *<br />
Special Projects Coordinator 2 2 56 49,504 - 74,922<br />
Computer Application Specialist 1 1 54 47,133 - 71,365<br />
Administrative Assistant 1 1 33 28,246 - 42,765<br />
Account Clerk IV 1 1 33 28,246 - 42,765<br />
TOTAL FULL-TIME EMPLOYEES 7 7<br />
E – 60
GENERAL FUND<br />
PUBLIC WORKS - ENGINEERING<br />
BUDGET FOR YEAR 2007-08<br />
Experience Budget Experience Proposed Adjustments<br />
For Year For Year 2006-07 by by<br />
EXPENSES 2005-06 2006-07 Estimated <strong>City</strong> Manager <strong>City</strong> Commission<br />
PERSONAL SERVICES 762,944 934,454 860,336 1,087,949<br />
OPERATING EXPENSES<br />
Rental / Fleet Equipment 15,867 17,256 11,238 18,228 ___________<br />
Gasoline / Fleet Equipment 10,572 20,443 10,758 17,255 ___________<br />
Maintenance / Fleet Equipment 7,140 11,338 11,338 16,194 ___________<br />
Water Utility Service 319 394 304 311 ___________<br />
Electric Utility Service 15,000 14,683 14,455 16,824 ___________<br />
Wastewater Utility Service 318 427 337 374 ___________<br />
Solid Waste Service 635 718 659 757 ___________<br />
Purchasing & Stores Service 7,621 8,094 8,094 8,741 ___________<br />
Intra-Dept Charges - Computer Rental 34,337 29,086 27,868 30,003 ___________<br />
Intra-Dept Charges - Telephone 3,880 4,120 3,912 4,524 ___________<br />
Intra-Dept Charges - Radios 2,672 2,794 2,696 2,572 ___________<br />
Intra-Dept Charges - Facilities 8,322 9,442 9,442 11,706 ___________<br />
Intra-Dept Charges - Janitorial 8,497 9,620 9,620 9,035 ___________<br />
Intra-Dept Charges - IT 38,191 52,643 52,643 48,980 ___________<br />
Intra-Dept Charges - Training<br />
936 ___________<br />
Special Services 53 2,500 2,500 2,700 ___________<br />
Advertising 278 300 300 400 ___________<br />
Office Supplies 7,362 9,473 10,985 9,250 ___________<br />
Non-Capital Equipment 698 2,250 2,250 2,000 ___________<br />
All Other Materials & Supplies 257 335 334 300 ___________<br />
Uniforms 3,742 4,000 4,169 4,000 ___________<br />
Tools & Implements 1,610 2,500 1,743 2,250 ___________<br />
Repair <strong>of</strong> Equipment 1,000 1,000 1,300 1,000 ___________<br />
Printing & Photography 400 400 200 ___________<br />
Postage 435 500 500 500 ___________<br />
Subscriptions & Memberships 2,727 3,000 2,727 3,000 ___________<br />
Telephone, Communications 1,567 1,800 2,909 2,000 ___________<br />
Travel 2,415 2,700 2,150 3,000 ___________<br />
Training 1,456 2,500 2,500 2,500 ___________<br />
All Other Sundry Charges 56 500 500 350 ___________<br />
S<strong>of</strong>tware Licenses & Maintenance 3,816 6,000 3,816 4,000 ___________<br />
Car Washing 46 130<br />
SUB-TOTAL 180,843 220,862 202,577 223,890<br />
CAPITAL EQUIPMENT<br />
Equipment 1,449 1,449<br />
GRAND TOTAL 943,787 1,156,765 1,064,362 1,311,839<br />
E – 61
GENERAL FUND<br />
PUBLIC WORKS - ENGINEERING<br />
BUDGET FOR YEAR 2007-08<br />
Experience Budget Experience Proposed Adjustments<br />
For Year For Year 2006-07 by by<br />
EXPENSES 2005-06 2006-07 Estimated <strong>City</strong> Manager <strong>City</strong> Commission<br />
PERSONNEL<br />
Current Proposed Pay Salary<br />
POSITION TITLE Budget Budget Grade Range<br />
Manager Of Engineering 1 1 74 76,794 - 116,230<br />
Pr<strong>of</strong>essional Engineer 1 1 69 67,974 - 102,918<br />
Traffic Engineer 1 1 67 64,730 - 98,010<br />
<strong>City</strong> Surveyor 1 1 63 58,718 - 88,899<br />
Engineer II 3 3 63 58,718 - 88,899<br />
Engineer I 1 1 56 49,504 - 74,922<br />
Engineering Technician III 1 51 43,805 - 64,730<br />
Engineering Technician II 1 1 45 37,835 - 57,304<br />
Engineering Inspector 3 3 42 35,173 - 53,248<br />
Survey Mapping Technician III 2 2 40 33,509 - 50,710<br />
Engineering Technician I 1 38 31,907 - 48,298<br />
Survey Mapping Technician II 2 2 36 30,389 - 45,989<br />
Survey Mapping Technician I 2 2 29 25,605 - 38,771<br />
TOTAL FULL-TIME EMPLOYEES 19 19<br />
CONTRACT EMPLOYEES<br />
Office Associate I 1 1<br />
TOTAL CONTRACT EMPLOYEES 1 1<br />
E – 62
GENERAL FUND<br />
PUBLIC WORKS - CONSTRUCTION AND MAINTENANCE<br />
BUDGET FOR YEAR 2007-08<br />
Actual Budget Experience Proposed Adjustments<br />
For Year For Year 2006-07 by by<br />
EXPENSES 2005-06 2006-07 Estimated <strong>City</strong> Manager <strong>City</strong> Commission<br />
PERSONAL SERVICES 1,669,757 2,064,821 1,797,655 2,131,359<br />
OPERATING EXPENSES<br />
Rental / Fleet Equipment 199,764 212,191 212,191 209,967 ___________<br />
Gasoline / Fleet Equipment 126,730 236,277 236,277 164,787 ___________<br />
Maintenance / Fleet Equipment 121,110 270,456 270,456 235,624 ___________<br />
Uninsured Loss Reimbursement 500 500 500 500 ___________<br />
Purchasing & Stores Service 16,791 17,832 17,832 19,259 ___________<br />
Water Utility Service 13,234 12,606 9,668 9,994 ___________<br />
Electric Utility Service 34,243 32,940 34,208 36,117 ___________<br />
Wastewater Utility Service 7,589 7,383 7,227 8,083 ___________<br />
Solid Waste Service 37,712 27,105 63,060 67,151 ___________<br />
Intra-Dept Charges - Computer Rental 28,964 22,850 22,786 26,295 ___________<br />
Intra-Dept Charges - Telephone 3,256 3,169 2,966 3,646 ___________<br />
Intra-Dept Charges - Radios 13,360 13,127 13,143 12,541 ___________<br />
Intra-Dept Charges - Facilities 64,388 73,054 73,054 90,561 ___________<br />
Intra-Dept Charges - Janitorial 16,541 18,726 18,726 17,586 ___________<br />
Intra-Dept Charges - IT 35,253 47,113 47,113 41,302 ___________<br />
Intra-Dept Charges - Training 3,203 ___________<br />
Special Services 5,317 4,217 4,217 600 ___________<br />
Office Supplies 4,987 6,300 6,213 6,300 ___________<br />
Non-Capital Equipment 9,136 8,582 8,837 4,616 ___________<br />
All Other Materials & Supplies 21,488 24,000 24,000 21,000 ___________<br />
Uniforms 10,871 15,500 15,500 18,500 ___________<br />
Construction Materials 18,135 34,869 34,869 25,000 ___________<br />
Chemicals 3,152 5,500 3,152 4,500 ___________<br />
Tools, Implements & Instruments 9,281 10,000 9,281 10,000 ___________<br />
Fuel 1,963 1,650 1,963 1,650 ___________<br />
Safety Supplies 5,319 7,000 7,747 7,000 ___________<br />
Parts for Equipment 11,337 9,300 11,205 10,000 ___________<br />
Leases 220,692 227,498 232,335 232,120 ___________<br />
Rentals 633 1,500 1,500 1,500 ___________<br />
Repair <strong>of</strong> Equipment 6,153 15,200 20,327 15,826 ___________<br />
Printing & Photography 147 500 500 500 ___________<br />
Postage 198 400 400 400 ___________<br />
Subscriptions & Memberships 598 858 858 750 ___________<br />
Telephone, Communications 1,436 1,584 1,798 1,584 ___________<br />
Travel 1,746 3,364 3,364 4,064 ___________<br />
Training 1,222 3,425 3,425 4,460 ___________<br />
All Other Sundry Charges 102 1,100 435 2,100 ___________<br />
Car Washing 100 100<br />
SUB-TOTAL 1,053,348 1,377,776 1,421,233 1,319,086<br />
E – 63
GENERAL FUND<br />
PUBLIC WORKS - CONSTRUCTION AND MAINTENANCE<br />
BUDGET FOR YEAR 2007-08<br />
Actual Budget Experience Proposed Adjustments<br />
For Year For Year 2006-07 by by<br />
EXPENSES 2005-06 2006-07 Estimated <strong>City</strong> Manager <strong>City</strong> Commission<br />
CAPITAL OUTLAY<br />
Equipment 9,640 7,200 7,200 7,346 ___________<br />
SPECIAL PROJECTS<br />
Other Projects <strong>City</strong> Departments 18,162<br />
CSX Right <strong>of</strong> Way 365 365 365 365 ___________<br />
Cleaning <strong>of</strong> Downtown Streetscape 18,052 19,827 19,827 19,827 ___________<br />
Painting <strong>of</strong> Ornamental Streetscape 6,025 6,000 6,000 1,734 ___________<br />
Modular Furniture Replacement 2,711<br />
Renovate Office 2,166<br />
Install Hoist in Shop 5,487<br />
Neighborhood Clean Up Project 659<br />
Upgrade Alarm System 20,000 20,000<br />
Steel Building Maintenance 7,000 ___________<br />
SUB-TOTAL 35,465 46,192 64,354 28,926<br />
GRAND TOTAL 2,768,210 3,495,989 3,290,442 3,486,717<br />
Equipment<br />
1 - Concrete Chain Saw New 1,590<br />
2 - Hand Held Radios New 5,756<br />
7,346<br />
PERSONNEL<br />
Current Proposed Pay Salary<br />
POSITION TITLE Budget Budget Grade Range<br />
Manager Of Construction & Maintenance 1 1 65 61,630 - 93,330<br />
Supervisor Of Maintenance 1 1 56 49,504 - 74,922<br />
Construction Supervisor 1 1 56 49,504 - 74,922<br />
Pavement Management Coordinator 1 1 49 41,725 - 63,190<br />
Construction Foreman 2 2 47 39,749 - 60,174<br />
Maintenance Foreman II 2 3 47 39,749 - 60,174<br />
Water Pipefitter Foreman 1 45 37,835 - 57,304<br />
Environmental Technician III 1 45 37,835 - 57,304<br />
Equipment Operator IV 1 2 42 35,173 - 53,248<br />
Environmental Technician II 1 1 40 33,509 - 50,710<br />
Equipment Operator III 4 4 38 31,907 - 48,298<br />
Construction Trades Worker III 2 2 38 31,907 - 48,298<br />
Water Pipefitter II 2 36 30,389 - 45,989<br />
Construction Trades Worker II 12 11 33 28,246 - 42,765<br />
Account Clerk IV 1 1 33 28,246 - 42,765<br />
Equipment Operator II 10 10 33 28,246 - 42,765<br />
Pavement Marking Technician 1 1 33 28,246 - 42,765<br />
Warehouse Op Tech II 1 33 28,332 - 43,200<br />
Water Pipefitter I 2 31 26,894 - 40,726<br />
Office Associate II 2 2 29 25,605 - 38,771<br />
Construction Trades Worker I 7 7 29 25,605 - 38,771<br />
Operations Support Technician II 2 1 29 25,605 - 38,771<br />
Equipment Operator I 2 2 29 25,605 - 38,771<br />
Operations Support Technician I 8 5 24 22,693 - 34,320<br />
TOTAL FULL-TIME EMPLOYEES 62 64<br />
E – 64
GENERAL FUND<br />
PUBLIC WORKS - TRAFFIC<br />
BUDGET FOR YEAR 2007-08<br />
Experience Budget Experience Proposed Adjustments<br />
For Year For Year 2006-07 by by<br />
EXPENSES 2005-06 2006-07 Estimated <strong>City</strong> Manager <strong>City</strong> Commission<br />
PERSONAL SERVICES 654,147 738,385 707,530 809,945<br />
OPERATING EXPENSES<br />
Rental / Fleet Equipment 43,368 28,886 28,886 27,143 ___________<br />
Gasoline / Fleet Equipment 13,611 19,965 14,159 18,480 ___________<br />
Maintenance / Fleet Equipment 11,212 12,419 15,978 21,000 ___________<br />
Uninsured Loss Reimbursement 250 375<br />
Purchasing & Stores Service 7,774 8,256 8,256 8,917 ___________<br />
Water Utility Service 699 966 538 577 ___________<br />
Electric Utility Service 16,501 15,021 16,641 17,362 ___________<br />
Wastewater Utility Service 522 957 248 273 ___________<br />
Solid Waste Service 1,304 1,343 1,376 1,445 ___________<br />
Intra-Dept Charges - Computer Rental 27,004 22,147 21,637 24,801 ___________<br />
Intra-Dept Charges - Radios 4,008 4,039 4,044 3,859 ___________<br />
Intra-Dept Charges - Facilities 13,380 15,181 15,181 18,818 ___________<br />
Intra-Dept Charges - Janitorial 12,120 13,721 13,721 12,886 ___________<br />
Intra-Dept Charges - IT 41,129 21,144 21,144 17,821 ___________<br />
Intra-Dept Charges - Training<br />
591 ___________<br />
Special Services 1,653 150 ___________<br />
Office Supplies 4,368 4,224 4,224 3,750 ___________<br />
Non-Capital Equipment 1,418 4,530 4,530 3,500 ___________<br />
All Other Material & Supply 82,334 76,152 82,334 63,893 ___________<br />
Uniforms 2,787 3,137 3,137 3,500 ___________<br />
Tools & Implements 1,253 1,400 1,400 1,500 ___________<br />
Fuel 68 350 68 70 ___________<br />
Rentals 427 1,500 2,007 1,500 ___________<br />
Repair <strong>of</strong> Equipment 5,085 4,100 5,085 3,500 ___________<br />
Printing & Photography 490 470 470 500 ___________<br />
Postage 238 285 294 300 ___________<br />
Subscriptions & Memberships 1,211 1,862 1,586 1,752 ___________<br />
Telephone, Communications 2,529 2,625 2,159 2,300 ___________<br />
Travel 472 1,753 1,753 2,000 ___________<br />
Training 663 1,115 1,115 1,200 ___________<br />
All Other Sundry Charges 10 293 75<br />
Annual Railroad Maintenance 9,033 12,580 12,580 14,500 ___________<br />
Car Washing 7 7<br />
SUB-TOTAL 306,671 280,678 285,006 277,888<br />
CAPITAL EQUIPMENT<br />
Equipment 8,799 2,295 2,295 7,575 ___________<br />
SPECIAL PROJECTS<br />
FDOT-Hwy Lighting and Traffic Signal 10,000<br />
Rehabilitation <strong>of</strong> Traffic Signal Shop 6,303 19,697 19,697<br />
SUB-TOTAL 16,303 19,697 19,697<br />
GRAND TOTAL 985,920 1,041,055 1,014,528 1,095,408<br />
E – 65
GENERAL FUND<br />
PUBLIC WORKS - TRAFFIC<br />
BUDGET FOR YEAR 2007-08<br />
Experience Budget Experience Proposed Adjustments<br />
For Year For Year 2006-07 by by<br />
EXPENSES 2005-06 2006-07 Estimated <strong>City</strong> Manager <strong>City</strong> Commission<br />
Equipment<br />
1 - Copier Replacement 4,558<br />
1 - Alarm System Replacement 3,017<br />
7,575<br />
PERSONNEL<br />
Current Proposed Pay Salary<br />
POSITION TITLE Budget Budget Grade Range<br />
Manager <strong>of</strong> Traffic Operations 1 1 65 61,630 - 93,330<br />
Traffic Signal Foreman 1 1 51 43,805 - 64,730<br />
Traffic System Operator 1 1 51 43,805 - 64,730<br />
Assistant Traffic System Operator 1 1 45 37,835 - 57,304<br />
Traffic Signal Technician 3 3 45 37,835 - 57,304<br />
Traffic Engineering Technician 1 1 40 33,509 - 50,710<br />
Traffic Sign Fabricator 1 1 31 26,894 - 40,726<br />
Office Associate II 1 1 29 25,605 - 38,771<br />
Traffic Sign Technician 3 3 27 24,398 - 36,941<br />
TOTAL FULL-TIME EMPLOYEES 13 13<br />
PART-TIME<br />
Traffic Engineering Aide 1 1<br />
TOTAL PART-TIME EMPLOYEES 1 1<br />
E – 66
GENERAL FUND<br />
PARKS AND RECREATION DIRECTOR<br />
BUDGET FOR YEAR 2007-08<br />
Experience Budget Experience Proposed Adjustments<br />
For Year For Year 2006-07 by by<br />
EXPENSES 2005-06 2006-07 Estimated <strong>City</strong> Manager <strong>City</strong> Commission<br />
PERSONAL SERVICES 261,245 297,663 283,231 335,864<br />
OPERATING EXPENSES<br />
Auto Allowance 4,814 4,800 5,400 5,400 ___________<br />
Rental / Fleet Equipment 2,688 1,428 1,428 1,508 ___________<br />
Gasoline / Fleet Equipment 327 481 481 485 ___________<br />
Maintenance / Fleet Equipment 392 110 543 570 ___________<br />
Purchasing & Stores Service 11,583 12,301 12,301 13,286 ___________<br />
Water Utility Service 104 129 99 98 ___________<br />
Electric Utility Service 4,910 4,806 4,731 5,506 ___________<br />
Wastewater Utility Service 104 140 110 119 ___________<br />
Solid Waste Service 208 235 216 248 ___________<br />
Intra-Dept Charges - Computer Rental 10,153 8,093 8,999 10,958 ___________<br />
Intra-Dept-Charges - Telephone 3,793 3,793 3,775 4,820 ___________<br />
Intra-Dept Charges - Facilities 2,724 3,090 3,090 3,831 ___________<br />
Intra-Dept Charges - Janitorial 2,781 3,149 3,149 2,957 ___________<br />
Intra-Dept Charges - IT 7,417 6,640 6,640 3,198 ___________<br />
Intra-Dept Charges -Training<br />
197 ___________<br />
Office Supplies 1,763 1,500 1,763 1,500 ___________<br />
Non-Capital Equipment 547 600 547 500 ___________<br />
Repair <strong>of</strong> Equipment 604 604 495 ___________<br />
Printing & Photography 107 200 198 200 ___________<br />
Postage 344 600 344 500 ___________<br />
Subscriptions & Memberships 1,508 1,360 1,360 1,490 ___________<br />
Telephone, Communications 2,361 1,989 1,821 1,989 ___________<br />
Travel 1,671 2,500 2,500 2,667 ___________<br />
Training 140 100 100 100 ___________<br />
All Other Sundry Charges<br />
12 ___________<br />
Car Washing 7<br />
SUB-TOTAL 60,439 58,648 60,206 62,635<br />
SPECIAL PROJECTS<br />
Sculpture Exhibits 33,549 22,000 22,000 11,000 ___________<br />
Advertising and Promotions 4,965 5,000 5,000 5,000 ___________<br />
Kaleidoscope 44,000<br />
Maximo Upgrade 1,284 1,284<br />
SUB-TOTAL 82,514 28,284 28,284 16,000<br />
TOTAL 404,198 384,595 371,721 414,499<br />
COST ALLOCATED TO<br />
Cleveland Heights Golf Course Fund (31,500) (30,286) (30,286) (57,615) ___________<br />
GRAND TOTAL 372,698 354,309 341,435 356,884<br />
PERSONNEL<br />
Current Proposed Pay Salary<br />
POSITION TITLE Budget Budget Grade Range<br />
Director Of Parks & Recreation 1 1 PB2 *<br />
Asst Director P&R - Admin and Planning 1 1 PB4 *<br />
Administrative Assistant 1 1 33 28,246 - 42,765<br />
Office Associate II 1 1 29 25,605 - 38,771<br />
TOTAL FULL-TIME EMPLOYEES 4 4<br />
E – 67
GENERAL FUND<br />
PARKS AND RECREATION - PARKS<br />
BUDGET FOR YEAR 2007-08<br />
Experience Budget Experience Proposed Adjustments<br />
For Year For Year 2006-07 by by<br />
EXPENSES 2005-06 2006-07 Estimated <strong>City</strong> Manager <strong>City</strong> Commission<br />
PERSONAL SERVICES 4,366,313 4,785,134 4,593,024 5,115,114<br />
OPERATING EXPENSES<br />
Rental / Fleet Equipment 349,130 216,574 215,097 224,732 ___________<br />
Gasoline / Fleet Equipment 142,139 172,226 154,290 172,512 ___________<br />
Maintenance / Fleet Equipment 219,633 241,410 272,610 263,305 ___________<br />
Uninsured Loss Reimbursement 2,250 1,000 1,000 1,000 ___________<br />
Water Utility Service 487,955 462,848 394,879 414,235 ___________<br />
Purchasing & Stores Service 6,239 6,626 6,626 7,156 ___________<br />
Stormwater Utility Fees 112 112 252 ___________<br />
Electric Utility Service 522,309 456,668 549,134 570,664 ___________<br />
Wastewater Utility Service 84,553 79,306 93,212 100,981 ___________<br />
Intra-Dept Charges - Computer Rental 30,599 24,030 22,554 27,271 ___________<br />
Intra-Dept Charges - Telephone 2,427 2,437 2,474 3,059 ___________<br />
Intra-Dept Charges - Radios 16,700 17,461 20,220 22,830 ___________<br />
Intra-Dept Charges - Facilities 275,097 325,601 325,601 415,158 ___________<br />
Intra-Dept Charges - Janitorial 2,781 5,972 5,972 8,625 ___________<br />
Intra-Dept Charges - IT 25,404 42,867 42,867 34,033 ___________<br />
Intra-Dept Charges - IT Projects 140 414 242<br />
Intra-Dept Charges - Training 5,075 ___________<br />
Solid Waste Service 132,564 126,262 141,429 148,522 ___________<br />
Contractual Services 134,149 172,431 171,246 170,876 ___________<br />
Pr<strong>of</strong>essional Services 754 255 ___________<br />
Advertising 130 (150) 150 150 ___________<br />
Office Supplies 7,701 7,780 7,780 5,880 ___________<br />
Non-Capital Equipment 5,656 9,100 6,215 5,600 ___________<br />
All Other Mater & Supplies 9,725 16,046 14,422 16,112 ___________<br />
Uniforms 15,573 18,500 18,500 18,395 ___________<br />
Cleaning & Janitor Supply 25,785 33,749 25,700 30,089 ___________<br />
Construction Materials 75 2,700 2,077 2,700 ___________<br />
Chemicals 51,161 48,702 58,295 51,600 ___________<br />
Tools & Implements 4,692 10,443 6,234 10,200 ___________<br />
Electric Hardware & Plumbing Supply 889 10,050 25,351 13,050 ___________<br />
Agriculture & Horticulture Supplies 69,739 92,949 80,675 75,092 ___________<br />
Fuel 1,678 1,500 1,500 1,500 ___________<br />
E – 68
GENERAL FUND<br />
PARKS AND RECREATION - PARKS<br />
BUDGET FOR YEAR 2007-08<br />
Experience Budget Experience Proposed Adjustments<br />
For Year For Year 2006-07 by by<br />
EXPENSES 2005-06 2006-07 Estimated <strong>City</strong> Manager <strong>City</strong> Commission<br />
Recreational Supplies 13,262 11,600 10,400 10,500 ___________<br />
Food & Supplies for Animals 5,675 6,000 6,000 8,000 ___________<br />
Irrigation Supplies 47,480 17,500 26,117 20,800 ___________<br />
Rentals 808 500 1,000 1,000 ___________<br />
Maintenance <strong>of</strong> Facilities 10,000 ___________<br />
Repair <strong>of</strong> Equipment 46,699 40,100 34,682 41,000 ___________<br />
Printing & Photography 1,828 1,500 1,500 1,500 ___________<br />
Postage 281 450 450 450 ___________<br />
Subscriptions & Memberships 784 815 815 815 ___________<br />
Telephone, Communications 15,374 12,626 12,626 12,626 ___________<br />
Travel 2,334 2,021 1,250 1,271 ___________<br />
Training 2,725 2,336 2,336 2,336 ___________<br />
All Other Sundry Charges 2,222 4,525 4,525 4,525 ___________<br />
Car Washing 111<br />
SUB-TOTAL 2,767,099 2,705,587 2,768,276 2,935,732<br />
CAPITAL EQUIPMENT<br />
Equipment 23,585 17,000 17,000 20,500 ___________<br />
TOTAL EXPENSES 7,156,997 7,507,721 7,378,300 8,071,346<br />
SPECIAL PROJECTS<br />
Orange Cup Regatta 3,648 5,833 5,833 1,000 ___________<br />
Christmas Decorations 9,596 10,000 10,000 10,000 ___________<br />
Tree & Palm Program 11,448 15,805 15,805 10,000 ___________<br />
U&CF-Tree Inventory - Northside 20,505 134,129 134,129<br />
U&CF-Tree Inventory - Southside 12,598 128,993 128,993<br />
U&CF-Tree Remediation - SE Quadrant 64,186 76,208 76,208<br />
U&CF-Cemetery Tree Planting 16,085 19,404<br />
Landscape Renovations 19,474 13,573 13,573 10,000 ___________<br />
Landscape Renovations - FDOT 9,355 13,400 13,400 10,000 ___________<br />
Irrigation Modernization 9,329 10,000 10,000 10,000 ___________<br />
Resigning <strong>of</strong> Parks 3,403 3,000 3,000 3,000 ___________<br />
Replace Swan Pens 196 3,000 3,000 1,000 ___________<br />
Replace Park Equipment 10,648 11,500 11,500 10,000 ___________<br />
E – 69
GENERAL FUND<br />
PARKS AND RECREATION - PARKS<br />
BUDGET FOR YEAR 2007-08<br />
Experience Budget Experience Proposed Adjustments<br />
For Year For Year 2006-07 by by<br />
EXPENSES 2005-06 2006-07 Estimated <strong>City</strong> Manager <strong>City</strong> Commission<br />
Spring Training Preparation 16,896 18,446 18,446 13,583 ___________<br />
Install Master Key System - Tigertown,<br />
Peterson Park, and Lake Parker Park 1,809 1,500 1,500 500 ___________<br />
Hollis Gardens 13,603 535 535 10,000 ___________<br />
Sports field Lighting 21,370 25,000 25,000 25,000 ___________<br />
Tigertown Additional Parking Area 40,000 40,000<br />
Tigertown Warning Track Material 4,000 ___________<br />
Henley Field P.A. System Wiring Improvements 4,500 ___________<br />
Henley Field Backstop Canopy Repair 1,500 ___________<br />
SUB-TOTAL 330,271 630,922 632,005 244,083<br />
TOTAL 7,487,268 8,138,643 8,010,305 8,315,429<br />
COST ALLOCATED TO<br />
Fleet Management Fund (2,858) (2,909) (2,909) (6,554) ___________<br />
Purchasing & Stores Fund (23,148) (23,750) (23,750) (26,217) ___________<br />
<strong>Lakeland</strong> Center Fund (197,300) (202,821) (202,821) (229,400) ___________<br />
Parking Fund (31,150) (32,002) (32,002) (39,326) ___________<br />
Electric Utility Fund (85,219) (87,636) (87,636) (98,314) ___________<br />
Water Utility Fund (19,534) (19,534) (19,663) ___________<br />
Cleveland Heights Golf Course Fund (12,974) (13,359) (13,359) (13,109) ___________<br />
(352,649) (382,011) (382,011) (432,583)<br />
GRAND TOTAL 7,134,619 7,756,632 7,628,294 7,882,846<br />
Equipment<br />
1 - Reel Spin Grinder Replacement 20,500<br />
20,500<br />
E – 70
GENERAL FUND<br />
PARKS AND RECREATION - PARKS<br />
BUDGET FOR YEAR 2007-08<br />
Experience Budget Experience Proposed Adjustments<br />
For Year For Year 2006-07 by by<br />
EXPENSES 2005-06 2006-07 Estimated <strong>City</strong> Manager <strong>City</strong> Commission<br />
PERSONNEL<br />
Current Proposed Pay Salary<br />
POSITION TITLE Budget Budget Grade Range<br />
Asst Dir P & R Operations 1 1 PB4 *<br />
Assistant Superintendent Of Parks 2 2 54 47,133 - 71,365<br />
Parks Arborist 1 49 41,725 - 63,190<br />
Horticultural Specialist 1 1 49 41,725 - 63,190<br />
Operations Support Supervisor III 8 7 42 35,173 - 53,248<br />
Operations Support Supervisor II 8 8 36 30,389 - 45,989<br />
Account Clerk IV 1 1 33 28,246 - 42,765<br />
Operations Support Technician III 3 3 33 28,246 - 42,765<br />
Tree Trimmer 2 2 31 26,894 - 40,726<br />
Operations Support Technician II 9 9 29 25,605 - 38,771<br />
Office Associate II 1 1 29 25,605 - 38,771<br />
Equipment Operator I 1 1 29 25,605 - 38,771<br />
Office Associate I 1 1 24 22,693 - 34,320<br />
Operations Support Technician I 42 42 24 22,693 - 34,320<br />
Office Assistant II 1 1 22 21,590 - 32,677<br />
Operations Support Worker II 14 14 18 19,594 - 29,661<br />
TOTAL FULL-TIME EMPLOYEES 95 95<br />
Grant-Funded Positions<br />
Operations Support Supervisor III 1 1 42 35,173 - 53,248<br />
Operations Support Supervisor II 1 1 36 30,389 - 45,989<br />
Operations Support Technician II 1 1 29 25,605 - 38,771<br />
Operations Support Technician I 2 2 24 22,693 - 34,320<br />
Operations Support Worker II (P/T) 7 7<br />
TOTAL GRANT-FUNDED EMPLOYEES 12 12<br />
PART-TIME<br />
Parking Attendants 25 25<br />
Operations Support Worker II 22 22<br />
TOTAL PART-TIME EMPLOYEES 47 47<br />
E – 71
GENERAL FUND<br />
PARKS AND RECREATION - RECREATION<br />
BUDGET FOR YEAR 2007-08<br />
Experience Budget Experience Proposed Adjustments<br />
For Year For Year 2006-07 by by<br />
EXPENSES 2005-06 2006-07 Estimated <strong>City</strong> Manager <strong>City</strong> Commission<br />
PERSONAL SERVICES 2,150,336 2,690,130 2,463,180 2,974,010<br />
OPERATING EXPENSES<br />
Rental / Fleet Equipment 18,601 12,696 12,664 13,139 ___________<br />
Gasoline / Fleet Equipment 5,039 7,748 8,200 7,287 ___________<br />
Maintenance / Fleet Equipment 11,577 11,663 12,278 13,824 ___________<br />
Uninsured Loss Reimbursement 500 250 500 500 ___________<br />
Water Utility Service 26,043 26,485 25,788 29,932 ___________<br />
Electric Utility Service 378,129 364,996 357,480 379,541 ___________<br />
Wastewater Utility Service 20,502 21,622 23,384 24,815 ___________<br />
Solid Waste Service 26,262 27,399 27,444 28,838 ___________<br />
Purchasing & Stores Service 19,520 20,731 20,730 22,389 ___________<br />
Intra-Dept Charges - Computer Rental 53,727 45,321 44,698 56,676 ___________<br />
Intra-Dept Charges - Telephone 3,962 3,866 3,864 4,913 ___________<br />
Intra-Dept Charges - Facilities 258,015 292,742 292,742 323,552 ___________<br />
Intra-Dept Charges - Janitorial 2,781 3,149 3,148 2,957 ___________<br />
Intra-Dept Charges - IT 59,332 69,633 69,632 53,284 ___________<br />
Intra-Dept Charges - Training 2,119 ___________<br />
Special Services 74,751 81,374 80,857 93,024 ___________<br />
Office Supplies 13,986 15,777 15,535 16,492 ___________<br />
Non-Capital Equipment 17,231 19,314 18,914 17,855 ___________<br />
Uniforms 11,923 13,070 13,282 13,320 ___________<br />
Cleaning & Janitor Supply 40,432 42,826 43,529 45,397 ___________<br />
Chemicals 27,443 28,300 28,250 32,500 ___________<br />
Tools, & Implements 2,180 2,390 2,731 2,270 ___________<br />
Electric Hardware & Plumbing Supply 1,341 1,447 1,440 1,550 ___________<br />
Recreational Supplies 6,530 8,775 8,500 8,500 ___________<br />
Fuel - Pool Operations 23,680 25,180 25,180 30,000 ___________<br />
Maintenance <strong>of</strong> Facilities 1,596 2,628 2,628 2,645 ___________<br />
Repair <strong>of</strong> Equipment 28,608 44,423 41,787 53,698 ___________<br />
Postage & Mailing 156 200 200 200 ___________<br />
Subscriptions & Memberships 911 1,270 1,015 1,000 ___________<br />
Telephone, Communications 12,918 14,805 15,350 16,625 ___________<br />
Travel 3,186 6,293 6,293 9,317 ___________<br />
Training 3,148 2,500 2,500 2,900 ___________<br />
Licenses & Permits 500 500 500 500 ___________<br />
SUB-TOTAL 1,154,510 1,219,373 1,211,043 1,311,560<br />
E – 72
GENERAL FUND<br />
PARKS AND RECREATION - RECREATION<br />
BUDGET FOR YEAR 2007-08<br />
Experience Budget Experience Proposed Adjustments<br />
For Year For Year 2006-07 by by<br />
EXPENSES 2005-06 2006-07 Estimated <strong>City</strong> Manager <strong>City</strong> Commission<br />
CAPITAL EQUIPMENT<br />
Equipment 28,078 18,421 18,421 12,600 ___________<br />
SPECIAL PROJECTS<br />
Resurface Tennis Courts 24,500 12,900 12,900 9,000 ___________<br />
Christmas Parade 6,365 7,000 3,663 5,800 ___________<br />
Special Events 58,808 64,870 64,870 60,500 ___________<br />
Program Activity Costs 336,534 415,596 413,946 380,441 ___________<br />
Tournament Costs 18,597 21,250 21,750 18,000 ___________<br />
Wood Floor Refinishing for Simpson<br />
Park & Kelly Recreation Complex 5,625 33,990 33,990<br />
Expanded Cultural Opportunities 4,327 8,075 8,075<br />
Martin Luther King Parade 3,099 3,428 3,428 3,300 ___________<br />
Basketball Uniforms (Mid FL Contrib.) 5,500 5,500<br />
Weight Room Equipment Replacement 25,000 25,000 25,000 ___________<br />
Gandy Pool Security System Enhancements 8,700 ___________<br />
Computer Replacements For Coleman Bush 21,000 ___________<br />
SUB-TOTAL 457,855 597,609 593,122 531,741<br />
GRAND TOTAL 3,790,779 4,525,533 4,285,766 4,829,911<br />
Equipment<br />
1 - Copier Replacement 5,300<br />
1 - Electric Floor Scrubber Replacement 3,000<br />
2 - Aluminum Tip N Roll Bleachers New 4,300<br />
12,600<br />
E – 73
GENERAL FUND<br />
PARKS AND RECREATION - RECREATION<br />
BUDGET FOR YEAR 2007-08<br />
Experience Budget Experience Proposed Adjustments<br />
For Year For Year 2006-07 by by<br />
EXPENSES 2005-06 2006-07 Estimated <strong>City</strong> Manager <strong>City</strong> Commission<br />
PERSONNEL<br />
Current Proposed Pay Salary<br />
POSITION TITLE Budget Budget Grade Grade<br />
Superintendent <strong>of</strong> Recreation 1 1 60 54,579 - 82,618<br />
Assistant Superintendent <strong>of</strong> Recreation 1 1 54 47,133 - 71,365<br />
Recreation Supervisor III 3 3 49 41,725 - 63,190<br />
Aquatics Supervisor 1 1 47 39,749 - 60,174<br />
Therapeutic Supervisor 1 1 45 37,835 - 57,304<br />
Recreation Supervisor II 3 3 45 37,835 - 57,304<br />
Assistant Aquatic Supervisor 1 1 42 35,173 - 53,248<br />
Recreation Supervisor I 5 7 40 33,509 - 50,710<br />
Senior Lifeguard Supervisor 1 38 31,907 - 48,298<br />
Facilities Technician 1 36 30,389 - 45,989<br />
Swimming Pool Operator 3 3 33 28,246 - 42,765<br />
Office Associate II 1 1 29 25,605 - 38,771<br />
Senior Lifeguard 1 1 27 24,398 - 36,941<br />
Custodian Foreman 1 3 27 24,398 - 36,941<br />
Office Associate I 3 3 24 22,693 - 34,320<br />
Recreation Leader 5 5 24 22,693 - 34,320<br />
Office Assistant II 1 1 22 21,590 - 32,677<br />
Operations Support Worker I 10 8 14 17,763 - 26,894<br />
TOTAL FULL-TIME EMPLOYEES 43 43<br />
PART-TIME<br />
Recreation Leader 10 10<br />
Lead Lifeguard 2 2<br />
Playground Specialists 8 8<br />
Bus Driver 7 7<br />
Playground Instructor 37 37<br />
Lifeguard 40 40<br />
Tennis Instructor 8 8<br />
TOTAL PART-TIME EMPLOYEES 112 112<br />
E – 74
GENERAL FUND<br />
PARKS AND RECREATION - MAIN LIBRARY<br />
BUDGET FOR YEAR 2007-08<br />
Experience Budget Experience Proposed Adjustments<br />
For Year For Year 2006-07 by by<br />
EXPENSES 2005-06 2006-07 Estimated <strong>City</strong> Manager <strong>City</strong> Commission<br />
PERSONAL SERVICES 1,203,879 1,337,006 1,304,616 1,411,721<br />
OPERATING EXPENSES<br />
Rental / Fleet Equipment 3,079 1,764 1,764 1,863 ___________<br />
Gasoline / Fleet Equipment 456 430 430 3,736 ___________<br />
Maintenance / Fleet Equipment 159 276 276 1,082 ___________<br />
Purchasing & Stores Service 27,109 28,790 28,790 31,094 ___________<br />
Water Utility Service 3,182 3,758 3,217 3,145 ___________<br />
Stormwater Utility Fees 23 10 16 47 ___________<br />
Electric Utility Service 67,202 57,320 60,728 63,852 ___________<br />
Wastewater Utility Service 1,946 1,805 2,103 2,228 ___________<br />
Solid Waste Service 3,028 2,770 3,021 3,267 ___________<br />
Intra-Dept Charges - Computer Rental 62,554 53,746 50,401 57,572 ___________<br />
Intra-Dept Charges - Telephone 8,438 9,318 8,472 9,749 ___________<br />
Intra-Dept Charges - Radios 334 337<br />
Intra-Dept Charges - Facilities 59,005 66,947 66,947 82,990 ___________<br />
Intra-Dept Charges - Training 1,133 ___________<br />
Intra-Dept Charges - IT 59,333 25,436 25,436 14,262 ___________<br />
Special Services 11,850 17,370 17,370 17,370 ___________<br />
Advertising 211<br />
Office Supplies 11,691 12,500 12,500 12,500 ___________<br />
Non-Capital Equipment 3,127 5,250 5,189 4,800 ___________<br />
Uniforms 732 45 45<br />
Cleaning & Janitor Supply 4,607 4,200 4,200 4,000 ___________<br />
Electric Hardware & Plumbing Supply 93 200 200 200 ___________<br />
Library Materials 121,943 130,590 130,590 130,005 ___________<br />
Repair <strong>of</strong> Equipment 6,683 7,200 7,200 7,100 ___________<br />
Printing & Photography 27<br />
Postage 5,000 5,235 5,235 5,300 ___________<br />
Subscriptions & Memberships 1,600 1,930 1,930 1,484 ___________<br />
Telephone, Communications 1,152 600 407 400 ___________<br />
Travel 908 1,922 1,922<br />
Training 1,130 1,955 1,955 288 ___________<br />
Binding & Processing 8,855 8,950 8,950 7,088 ___________<br />
SUB-TOTAL 475,457 450,654 449,294 466,555<br />
CAPITAL EQUIPMENT<br />
Equipment 4,000 4,000 2,299 ___________<br />
TOTAL 1,679,336 1,791,660 1,757,910 1,880,575<br />
E – 75
GENERAL FUND<br />
PARKS AND RECREATION - MAIN LIBRARY<br />
BUDGET FOR YEAR 2007-08<br />
Experience Budget Experience Proposed Adjustments<br />
For Year For Year 2006-07 by by<br />
EXPENSES 2005-06 2006-07 Estimated <strong>City</strong> Manager <strong>City</strong> Commission<br />
SPECIAL PROJECTS<br />
County-wide Library Program 552,585 593,942 586,492 673,839 ___________<br />
County-wide Bookmobile Program 81,658 109,580 109,580 98,748 ___________<br />
E-Library 192,305 100,254 248,921 ___________<br />
Countywide Library Projects:<br />
Video Security System 5,000 5,000<br />
Library Foundation:<br />
Reference Section 372 372<br />
Special Collections Section 715 715<br />
Fine Arts Collections Section 2,056 2,056<br />
Contribution From Dorothea H. Rose 6,784 748 748<br />
Serena Bailey Foundation:<br />
Reference Section 13,000 13,000<br />
Special Collections Section 10,000 10,000<br />
Fine Arts Collections Section 13,000 13,000<br />
Hollis Anniversary Preservation 12,003 12,003<br />
Louise K Padar Bequest 77,981 77,981<br />
Cabinets - Phase 1 <strong>of</strong> 2 9,963<br />
eLibrary 168,100 168,100<br />
Computer Services Flooring 4,200 ___________<br />
Art Wall Lighting 1,500 ___________<br />
SUB-TOTAL 650,990 1,198,802 1,099,302 1,027,208<br />
GRAND TOTAL 2,330,326 2,990,462 2,857,211 2,907,783<br />
Equipment<br />
1 - Graphic Arts Color Scanner Replacement 2,299<br />
2,299<br />
E – 76
GENERAL FUND<br />
PARKS AND RECREATION - MAIN LIBRARY<br />
BUDGET FOR YEAR 2007-08<br />
Experience Budget Experience Proposed Adjustments<br />
For Year For Year 2006-07 by by<br />
EXPENSES 2005-06 2006-07 Estimated <strong>City</strong> Manager <strong>City</strong> Commission<br />
PERSONNEL<br />
Current Proposed Pay Salary<br />
POSITION TITLE Budget Budget Grade Range<br />
<strong>City</strong> Librarian 1 1 58 51,979 - 78,666<br />
Assistant <strong>City</strong> Librarian 1 1 54 47,133 - 71,365<br />
Librarian Supervisor 2 2 45 37,835 - 57,304<br />
Librarian 5 5 42 35,173 - 53,248<br />
Library Associate 6 6 33 28,246 - 42,765<br />
Office Associate II 1 1 29 25,605 - 38,771<br />
Library Clerk 5 5 20 20,571 - 31,138<br />
Operations Support Worker I 2 2 14 17,763 - 26,894<br />
TOTAL FULL-TIME EMPLOYEES 23 23<br />
County-Wide Library<br />
Librarian (FT) 3 3 42 35,173 - 53,248<br />
Librarian-Bookmobile (FT) 1 1 42 35,173 - 53,248<br />
Library Associate 1 1 33 28,246 - 42,765<br />
Library Clerk (FT) 2 2 20 20,571 - 31,138<br />
Library Clerk (PT) 1 1<br />
Library Page (PT) 1 1<br />
9 9<br />
eLibrary<br />
Librarian Supervisor 1 1 45 37,835 - 57,304<br />
Library Associate 2 2 33 28,246 - 42,765<br />
Library Tech Assist (PT) 3 3<br />
6 6<br />
Part-Time/Seasonal<br />
Librarian 1 1<br />
Technical Assistant 2 2<br />
Library Clerk 3 3<br />
Proctor 2 2<br />
Library Page 9 9<br />
TOTAL PART-TIME EMPLOYEES 17 17<br />
E – 77
GENERAL FUND<br />
PARKS AND RECREATION - BRANCH LIBRARY<br />
BUDGET FOR YEAR 2007-08<br />
Experience Budget Experience Proposed Adjustments<br />
For Year For Year 2006-07 by by<br />
EXPENSES 2005-06 2006-07 Estimated <strong>City</strong> Manager <strong>City</strong> Commission<br />
PERSONAL SERVICES 231,664 276,716 257,287 297,565<br />
OPERATING EXPENSES<br />
Rental / Fleet Equipment 2,164 1,984 1,984 2,095 ___________<br />
Gasoline / Fleet Equipment 468 692 692 586 ___________<br />
Maintenance / Fleet Equipment 1,945 847 847 911 ___________<br />
Water Utility Service 732 751 777 784 ___________<br />
Electric Utility Service 27,971 25,924 30,985 32,699 ___________<br />
Wastewater Utility Service 815 874 896 970 ___________<br />
Solid Waste Service 853 895 917 963 ___________<br />
Purchasing & Stores Service 491 521 521 563 ___________<br />
Intra-Dept Charges - Computer Rental 15,471 10,663 16,619 20,145 ___________<br />
Intra-Dept Charges - Telephone 1,403 2,231 2,232 2,567 ___________<br />
Intra-Dept Charges - Facilities 21,026 23,856 23,856 34,870 ___________<br />
Intra-Dept Charges - Training 246 ___________<br />
Intra-Dept Charges - IT 14,833 8,120 8,120<br />
Special Services 3,934 3,900 3,934 2,290 ___________<br />
Office Supplies 2,621 3,250 2,020 2,900 ___________<br />
Non-Capital Equipment 1,329 2,000 1,113 2,200 ___________<br />
Uniforms 182 200 200 200 ___________<br />
Cleaning & Janitor Supply 1,742 1,850 1,977 1,566 ___________<br />
Electric Hardware & Plumbing Supply 100 100 100 100 ___________<br />
Library Materials 22,130 25,383 22,130 27,947 ___________<br />
Repair <strong>of</strong> Equipment 636 1,250 1,410 1,150 ___________<br />
Subscriptions & Memberships 200 270 270<br />
Telephone, Communications 594 600 594 600 ___________<br />
Travel 150 150<br />
SUB-TOTAL 121,640 116,311 122,344 136,352<br />
SPECIAL PROJECTS<br />
Wal-Mart Branch Library Literacy Grant 750 750<br />
SUB-TOTAL 750 750<br />
GRAND TOTAL 353,304 393,777 380,381 433,917<br />
E – 78
GENERAL FUND<br />
PARKS AND RECREATION - BRANCH LIBRARY<br />
BUDGET FOR YEAR 2007-08<br />
Experience Budget Experience Proposed Adjustments<br />
For Year For Year 2006-07 by by<br />
EXPENSES 2005-06 2006-07 Estimated <strong>City</strong> Manager <strong>City</strong> Commission<br />
PERSONNEL:<br />
Current Proposed Pay Salary<br />
POSITION TITLE Budget Budget Grade Range<br />
Librarian Supervisor 1 1 45 37,835 - 57,304<br />
Librarian 1 1 42 35,173 - 53,248<br />
Library Technical Assistant 2 2 24 22,693 - 34,320<br />
Operations Support Worker I 1 1 14 17,763 - 26,894<br />
TOTAL FULL-TIME EMPLOYEES 5 5<br />
Part-Time/Seasonal<br />
Library Clerk 2 2<br />
Library Page 2 2<br />
TOTAL PART-TIME EMPLOYEES 4 4<br />
County-wide Library<br />
Library Technical Assistant 1 1<br />
1 1<br />
E – 79
GENERAL FUND<br />
PARKS AND RECREATION - CEMETERIES<br />
BUDGET FOR YEAR 2007-08<br />
Experience Budget Experience Proposed Adjustments<br />
For Year For Year 2006-07 by by<br />
EXPENSES 2005-06 2006-07 Estimated <strong>City</strong> Manager <strong>City</strong> Commission<br />
PERSONAL SERVICES 438,216 500,174 457,095 536,079<br />
OPERATING EXPENSES<br />
Rental / Fleet Equipment 29,015 16,022 16,022 16,898 ___________<br />
Gasoline / Fleet Equipment 7,689 12,571 8,797 11,247 ___________<br />
Maintenance / Fleet Equipment 16,273 16,197 16,697 22,165 ___________<br />
Uninsured Loss Reimbursement 250<br />
Purchasing & Stores Service 1,279 1,358 1,358 1,467 ___________<br />
Water Utility Service 9,710 7,143 32,668 33,018 ___________<br />
Electric Utility Service 15,657 14,225 16,826 16,900 ___________<br />
Wastewater Utility Service 1,251 955 3,731 3,557 ___________<br />
Solid Waste Service 10,995 13,605 7,377 7,802 ___________<br />
Intra-Dept-Charges - Computer Rental 4,081 3,415 2,964 4,029 ___________<br />
Intra-Dept Charges - Facilities 1,544 1,752 1,752 12,931 ___________<br />
Intra-Dept Charges - Janitorial 1,577 1,785 1,784 3,599 ___________<br />
Intra-Dept Charges - IT 3,708 5,327 5,328 4,388 ___________<br />
Intra-Dept Charges - Training<br />
493 ___________<br />
Special Services 68,510 71,375 68,510 70,000 ___________<br />
Office Supplies 1,423 1,400 718 1,400 ___________<br />
Non-Capital Equipment 959 2,238 2,938 3,200 ___________<br />
All Other Material & Supplies 1,004 1,300 1,359 1,400 ___________<br />
Uniforms 2,255 2,000 1,950 2,000 ___________<br />
Construction Materials 577 1,000 771 1,000 ___________<br />
Tools & Implements 522 800 800 800 ___________<br />
Agriculture & Horticulture Supplies 8,018 7,900 7,900 7,900 ___________<br />
Merchandise Account 613 200 200 ___________<br />
Repair <strong>of</strong> Equipment 4,577 5,018 5,099 5,822 ___________<br />
Printing & Photography 624 600 628 600 ___________<br />
Postage 527 700 527 700 ___________<br />
Subscriptions & Memberships 40 40 49 49 ___________<br />
Telephone, Communications 2,339 2,000 2,095 2,000 ___________<br />
Training 25 170 170 170 ___________<br />
All Other Sundry Charges 118 118 118 ___________<br />
SUB-TOTAL 194,792 191,214 209,186 235,853<br />
CAPITAL EQUIPMENT<br />
Equipment 4,398 5,000 5,000 5,000 ___________<br />
SPECIAL PROJECTS<br />
Resurface Asphalt Road Way 12,000<br />
U&CF-Cemetery Tree Planting 92,673 3,964 3,964<br />
Roselawn Cemetery Fence 7,000 7,000<br />
Roselawn Landscape Improvements 3,000 3,000<br />
Funeral Set-Ups 5,000 ___________<br />
SUB-TOTAL 104,673 13,964 13,964 5,000<br />
GRAND TOTAL 742,079 710,352 685,245 781,932<br />
E – 80
GENERAL FUND<br />
PARKS AND RECREATION - CEMETERIES<br />
BUDGET FOR YEAR 2007-08<br />
Experience Budget Experience Proposed Adjustments<br />
For Year For Year 2006-07 by by<br />
EXPENSES 2005-06 2006-07 Estimated <strong>City</strong> Manager <strong>City</strong> Commission<br />
Equipment<br />
1 - Portable Chapel Tent New 5,000<br />
5,000<br />
PERSONNEL<br />
Current Proposed Pay Salary<br />
POSITION TITLE Budget Budget Grade Range<br />
Superintendent Of Cemeteries 1 1 54 47,133 - 71,365<br />
Operations Support Supervisor III 1 1 42 35,173 - 53,248<br />
Operations Support Technician IV 1 1 33 28,246 - 42,765<br />
Operations Support Technician II 1 1 29 25,605 - 38,771<br />
Office Associate II 1 1 29 25,605 - 38,771<br />
Operations Support Technician I 5 5 24 22,693 - 34,320<br />
TOTAL FULL-TIME EMPLOYEES 10 10<br />
PART-TIME<br />
Operations Support Worker II 2 2<br />
Office Assistant II 1 1<br />
TOTAL PART-TIME EMPLOYEES 2 3<br />
E – 81
GENERAL FUND<br />
NON-DEPARTMENTAL<br />
BUDGET FOR YEAR 2007-08<br />
Experience Budget Experience Proposed Adjustments<br />
For Year For Year 2006-07 by by<br />
EXPENSES 2005-06 2006-07 Estimated <strong>City</strong> Manager <strong>City</strong> Commission<br />
PERSONAL SERVICES<br />
Reserve for Pay Plan Adjustments 1,238,359 171,009 ___________<br />
Reserve for Accumulated Benefits 40,000 40,000 45,000 ___________<br />
Unemployment Compensation 16,446 30,000 16,382 30,000 ___________<br />
Workers Compensation - Excess 144,081 360,565 121,724 127,290 ___________<br />
SUB-TOTAL 160,527 1,668,924 178,106 373,299<br />
INSURANCE<br />
Fire 129,642 202,632 135,819 200,464 ___________<br />
Insurance Consultant 28,167 30,291 30,291 24,189 ___________<br />
Position Bond & Crime Coverage 5,163 5,163 5,720 ___________<br />
Self-Insurance Services 1,805,885 1,605,231 1,605,231 1,618,839 ___________<br />
Uninsured Loss Reserve 27,699 24,633 24,633 24,633 ___________<br />
SUB-TOTAL 1,996,556 1,862,787 1,801,137 1,873,845<br />
OTHER GENERAL GOVERNMENTAL SERVICES<br />
Ad Valorem Taxes 4,990 6,951 6,951 6,951 ___________<br />
State Sales Tax 29<br />
Bad Checks 4,052 2,500 5,254 2,000 ___________<br />
LDDA Tax Increment Payment 283,484 424,270 424,270 417,761 ___________<br />
Dixieland Tax Increment Payment 35,775 81,654 81,654 95,930 ___________<br />
Mid-Town Tax Increment Payment 501,797 855,649 854,649 1,161,828 ___________<br />
Williams Tax Increment Payment 1,021 1,021 4,572 ___________<br />
Hardin CRA Tax Increment Payment 137,640 137,640 199,308 ___________<br />
Intra-Dept Charges - Facilities 25,000 25,000 30,000 ___________<br />
Retiree Health Insurance Subsidy 534,777 563,785 563,785 607,242 ___________<br />
Appraisal Fees 7,150 7,150 7,150 ___________<br />
Pay Phones 1,782 2,100 2,100 2,100 ___________<br />
Community Visioning Project 37,500 38,600 38,600 38,600 ___________<br />
Polk County Vision 10,000 10,000 10,000 10,000 ___________<br />
Polk County Day at the Capital 2,500 2,500 2,500 ___________<br />
Florida Economic Development Trust 16,000 20,000 20,000 16,000 ___________<br />
Legislative Advisory Services 51,450 53,000 53,000 53,000 ___________<br />
Retiree's Association Expenses 500 800 800 800 ___________<br />
Sun Trust Parking Garage - Lease 21,300 21,300 21,300 21,300 ___________<br />
Employee / <strong>City</strong> Manager Annual Meeting 15,000<br />
Train Station Maintenance 31,301 39,404 38,619 44,716 ___________<br />
Chamber <strong>of</strong> Commerce Maintenance 11,392 13,207 13,207 16,023 ___________<br />
Federal Building Maintenance 74,212 89,561 90,699 96,802 ___________<br />
Contribution to <strong>Lakeland</strong> Housing Authority 31,163 18,632 44,738<br />
Contingency 50,857 50,857 85,000 ___________<br />
SUB-TOTAL 1,651,504 2,480,581 2,493,794 2,919,583<br />
E – 82
GENERAL FUND<br />
NON-DEPARTMENTAL<br />
BUDGET FOR YEAR 2007-08<br />
Experience Budget Experience Proposed Adjustments<br />
For Year For Year 2006-07 by by<br />
EXPENSES 2005-06 2006-07 Estimated <strong>City</strong> Manager <strong>City</strong> Commission<br />
GRANTS AND AIDS TO OTHER AGENCIES<br />
Cultural Agencies<br />
Arts on the Park 10,300 10,609 10,609 10,927 ___________<br />
Explorations V, Inc. 16,250 16,709 16,709 17,210 ___________<br />
Imperial Symphony Orchestra 42,250 43,497 43,497 44,802 ___________<br />
Polk Museum <strong>of</strong> Art 77,250 79,568 79,568 81,955 ___________<br />
Polk Theatre 34,000 35,010 35,010 36,060 ___________<br />
Florida Dance Theatre 8,800 9,018 9,018 9,289 ___________<br />
Mayfair Art Purchase 500 500 515 ___________<br />
Education & Enlightenment Group 5,000 ___________<br />
<strong>Lakeland</strong> Concert Band 5,000 ___________<br />
Platform Florida 5,000 ___________<br />
SUB-TOTAL 188,850 194,911 194,911 215,758<br />
Leases :<br />
<strong>Lakeland</strong> Regional Airport Armory Lease 10,315 10,315 10,315 10,315 ___________<br />
Game & Freshwater Fish Commission 13,157 13,157 13,157 13,157 ___________<br />
<strong>Lakeland</strong> Center:<br />
Just Say No Rally 3,550 4,210 4,210 4,210 ___________<br />
Senior Olympic 1,000 1,200 1,200 1,200 ___________<br />
Economic Expo 2,496 2,496 2,496 2,496 ___________<br />
<strong>Lakeland</strong> Community Band 7,200 7,200 7,200 7,200 ___________<br />
Social Agencies:<br />
Catholic Charities 5,000<br />
Central Florida Deaf Services 8,000 8,000 8,000 ___________<br />
Child Development Center <strong>of</strong> Polk County 58<br />
Coalition for the Homeless 4,978 5,000 5,000 5,000 ___________<br />
The First Tee 50,000 50,000 50,000 50,000 ___________<br />
Girls, Inc 5,000 6,000 6,000 6,000 ___________<br />
<strong>Lakeland</strong> Volunteers in Medicine, Inc. 7,000 7,500 7,500 7,500 ___________<br />
NAMI 8,650 5,000 5,000 5,000 ___________<br />
Polk County Elderly Services 13,000 13,000 13,000 13,000 ___________<br />
Polk County Drug Court 10,000<br />
National College Access Network Program 30,000 30,000 30,000 ___________<br />
E – 83
GENERAL FUND<br />
NON-DEPARTMENTAL<br />
BUDGET FOR YEAR 2007-08<br />
Experience Budget Experience Proposed Adjustments<br />
For Year For Year 2006-07 by by<br />
EXPENSES 2005-06 2006-07 Estimated <strong>City</strong> Manager <strong>City</strong> Commission<br />
Social Agencies (continued)<br />
Salvation Army 10,000 7,500 7,500 7,500 ___________<br />
Sunrise Community <strong>of</strong> Polk County 6,650 14,000 14,000 14,000 ___________<br />
Talbot House Ministries 5,000 7,500 7,500 7,500 ___________<br />
VISTE 15,000 10,000 10,000 10,000 ___________<br />
Wilson House 7,000 7,500 7,500 7,500 ___________<br />
Writers Inc. 5,684 2,000 2,000 2,000 ___________<br />
Lake Mirror Classic Car Show 2,813 2,813 2,813 ___________<br />
MLK Week <strong>of</strong> Education & Activities 2,375 2,375 2,375 ___________<br />
<strong>Lakeland</strong> Futures Classic Tournament 15,000 15,000 15,000 ___________<br />
Other:<br />
Citrus Commission Electricity 12,653 20,800 20,800 20,800 ___________<br />
Electric Modifications for Generators 23,427 23,427<br />
SUB-TOTAL 203,391 275,993 275,993 252,566<br />
PASSENGER CAR POOL<br />
Rental / Fleet Equipment 9,525 5,362<br />
Gasoline / Fleet Equipment 1,729 2,002<br />
Maintenance / Fleet Equipment 7,473 4,621<br />
Washing 2,529 176 176 200 ___________<br />
SUB-TOTAL 21,256 176 12,161 200<br />
CONTRIBUTIONS TO OTHER FUNDS<br />
Cemetery Perpetual Care 39,926 45,204 45,204 49,980 ___________<br />
Reserve for New Recreational Facilities 114,052 114,052 118,674 ___________<br />
General Fund-Cultural Activities 150,350 131,879 131,879 137,869 ___________<br />
Cultural Activities - Equity Increase 100,000 100,000 100,000 ___________<br />
Hollis Gardens Maintenance Trust 133,111 133,111 83,514 ___________<br />
Fleet Management Fund - New Vehicles 118,146 180,329 180,329<br />
Fleet Management Fund - New Vehicles 20,085 20,085<br />
<strong>Lakeland</strong> Center Fund 2,244,702 2,305,438 2,305,438 2,180,969 ___________<br />
Facilities Maintenance Fund 35,000<br />
Cleveland Heights Golf Course Fund 31,500<br />
SUB-TOTAL 2,719,624 3,030,098 2,930,098 2,671,006<br />
E – 84
GENERAL FUND<br />
NON-DEPARTMENTAL<br />
BUDGET FOR YEAR 2007-08<br />
Experience Budget Experience Proposed Adjustments<br />
For Year For Year 2006-07 by by<br />
EXPENSES 2005-06 2006-07 Estimated <strong>City</strong> Manager <strong>City</strong> Commission<br />
UTILITY SERVICE<br />
Electric Utility Service 1,836 1,960 1,908 2,113 ___________<br />
Water Utility Service 584 609 646 656 ___________<br />
Fire Hydrants 351,235 438,341 438,341 440,533 ___________<br />
Street Lights 3,514,824 3,519,919 3,519,919 3,698,834 ___________<br />
Public Works - Traffic Signal Lights 102,450 125,180 125,180 115,677 ___________<br />
Solid Waste Service 269 300 300 303 ___________<br />
Stormwater fees 302 320 302 680 ___________<br />
Utility Connection Fee 45 100 100 ___________<br />
SUB-TOTAL 3,971,545 4,086,729 4,086,596 4,258,896<br />
TOTAL NON-DEPARTMENTAL 10,913,253 13,600,199 11,972,796 12,565,153<br />
GRAND TOTAL 73,602,364 81,616,170 73,077,018 91,143,570<br />
E – 85
THIS PAGE IS INTENTIONALLY BLANK<br />
E-86 Fiscal Year <strong>2008</strong> Annual Budget
REVENUE AND EXPENDITURE SUMMARY<br />
COMMUNITY DEVELOPMENT<br />
Experience Budget Experience 2007-08<br />
For Year For Year 2006-07 Proposed by<br />
EXPENSES 2005-06 2006-07 Estimated <strong>City</strong> Manager<br />
Personnel<br />
Salaries and Wages 317,111 342,805 249,691 396,367<br />
Fringe Benefits 106,314 110,644 80,174 114,166<br />
Total Personnel 423,425 453,449 329,865 510,533<br />
Non-Personnel<br />
Internal Service Charges 35,981 46,698 32,256 49,783<br />
Pr<strong>of</strong>essional and Contractual 1,689 1,288 1,758 1,312<br />
Utilities 1,272 1,354 971 1,000<br />
Insurance and Fixed Charges 34,559 31,096 27,792 26,415<br />
All Other Operations and Maintenance 2,633,776 3,679,687 3,676,263 1,755,579<br />
Capital Outlay 25,015<br />
Debt Service<br />
Total Non-Personnel 2,732,292 3,760,123 3,739,040 1,834,089<br />
Total Expenditures 3,155,717 4,213,572 4,068,905 2,344,622<br />
Transfers<br />
Transfers In<br />
Transfers Out<br />
Net Transfers<br />
Revenue Sources<br />
Taxes<br />
Licenses and Permits<br />
Intergovernmental 2,855,615 3,993,572 3,846,968 1,891,622<br />
Charges for Services<br />
Interest Income 78,186 127,222<br />
All Other Revenue 413,977 95,000 311,924 153,000<br />
Total Revenue 3,347,778 4,088,572 4,286,114 2,044,622<br />
Funding to be Provided (192,061) 125,000 (217,209) 300,000<br />
E – 87
COMMUNITY DEVELOPMENT<br />
BUDGET FOR YEAR 2007-08<br />
Experience Budget Experience Proposed Adjustments<br />
For Year For Year 2006-07 by by<br />
2005-06 2006-07 Estimated <strong>City</strong> Manager <strong>City</strong> Commission<br />
INTERGOVERNMENTAL REVENUE<br />
FEDERAL GRANTS<br />
CDBG Grant 740,690 795,575 753,577 792,623 ___________<br />
HOME Grant 535,930 438,386 201,108 436,671 ___________<br />
SUB-TOTAL 1,276,620 1,233,961 954,685 1,229,294<br />
STATE GRANTS<br />
SHIP Grant 879,227 662,328 795,000 662,328 ___________<br />
FHFC Disaster Relief Home Assistance 288,868 207,636 207,636<br />
Hurricane Housing Recovery 410,900 1,889,647 1,889,647<br />
SUB-TOTAL 1,578,995 2,759,611 2,892,283 662,328<br />
TOTAL INTERGOVERNMENTAL<br />
REVENUE 2,855,615 3,993,572 3,846,968 1,891,622<br />
MISCELLANEOUS REVENUE<br />
INTEREST EARNINGS<br />
CDBG Program Loans 4,248 1,522<br />
Rental Rehabilitation Loans 1,594 1,394<br />
Rental Rehab Pooled Investments 543 124<br />
Dixieland State Program Loans 375 666<br />
Dixieland State Pooled Investments 9,859 11,420<br />
DCA Grant Pooled Investments 1,269 36<br />
SHIP Affordable Housing Loans 149 130<br />
SHIP Pooled Investments 34,201 49,510<br />
SHIP Registry <strong>of</strong> Court 137 70<br />
HOME Program Loans 128<br />
Hurricane Housing Recovery Pooled Investm 25,683 62,350<br />
SUB-TOTAL 78,186 127,222<br />
E – 88
COMMUNITY DEVELOPMENT<br />
BUDGET FOR YEAR 2007-08<br />
Experience Budget Experience Proposed Adjustments<br />
For Year For Year 2006-07 by by<br />
2005-06 2006-07 Estimated <strong>City</strong> Manager <strong>City</strong> Commission<br />
REIMBURSEMENTS<br />
HOME Miscellaneous Reimbursements 16,267<br />
DCA Grant Prior Year Refunds 11,200 700<br />
SUB-TOTAL 27,467 700<br />
ALL OTHER MISCELLANEOUS<br />
CDBG 1,900<br />
Dixieland Rehabilitation 40,027<br />
SUB-TOTAL 41,927<br />
TOTAL MISCELLANEOUS REVENUE 147,580 127,922<br />
PRINCIPAL<br />
CDBG Program Loans 63,948 70,000 67,796 78,000 ___________<br />
Rental Rehabilitation Loans 8,765 8,966<br />
Dixieland State Program Loans 3,886 6,804<br />
SHIP Program Loans 149,375 101,266<br />
HOME Program Loans 118,609 25,000 126,392 75,000 ___________<br />
SUB-TOTAL 344,583 95,000 311,224 153,000<br />
TOTAL NON-REVENUES 344,583 95,000 311,224 153,000<br />
TOTAL REVENUE 3,347,778 4,088,572 4,286,114 2,044,622<br />
SURPLUS - PRIOR YEARS (192,061) 125,000 (217,209) 300,000<br />
TOTAL REVENUES 3,155,717 4,213,572 4,068,905 2,344,622<br />
E – 89
COMMUNITY DEVELOPMENT<br />
BUDGET FOR YEAR 2007-08<br />
Experience Budget Experience Proposed Adjustments<br />
For Year For Year 2006-07 by by<br />
2005-06 2006-07 Estimated <strong>City</strong> Manager <strong>City</strong> Commission<br />
EXPENSES<br />
CDBG-ADMINISTRATION<br />
PERSONAL SERVICES 67,962 77,239 63,918 82,227<br />
OPERATING EXPENSES<br />
Retiree Health Insurance Subsidy 6,558 6,132 6,558 6,264 ___________<br />
Insurance - Position Bonds 88 152 296 63 ___________<br />
Self-Insurance Service 27,913 24,812 20,938 20,088 ___________<br />
Purchasing & Stores Service 17,985 19,101 19,100 20,629 ___________<br />
Intra-Dept Charges - Computer Rental 4,049 2,706 3,858 3,170 ___________<br />
Intra-Dept Charges - Telephone 445 445 444 512 ___________<br />
Banking Services 97 108 140 152 ___________<br />
Insurance Consultant 377 180 751 267 ___________<br />
Legal Advertising 1,215 1,000 867 893 ___________<br />
Office Supplies 231 450 470 484 ___________<br />
Equipment - Noncapital 232 175 74 76 ___________<br />
Printing & Photography 216 400 500 515 ___________<br />
Postage 417 175 200 26 ___________<br />
Subscriptions & Memberships 1,745 400 420 288 ___________<br />
Telephone - Communications 15 40 42 43 ___________<br />
Travel 735 1,652 1,701 ___________<br />
Training 923 750 1,895 1,952 ___________<br />
Rehabilitation <strong>of</strong> Private Property 6,056 4,772 4,915 ___________<br />
SUB-TOTAL 69,297 57,026 62,977 62,038<br />
CONTRIBUTIONS TO OTHER FUNDS<br />
Fleet Management Reserve Fund 12,495<br />
Information Technology Fund 735 735 735 735 ___________<br />
SUB-TOTAL 13,230 735 735 735<br />
TOTAL 150,489 135,000 127,630 145,000<br />
E – 90
COMMUNITY DEVELOPMENT<br />
BUDGET FOR YEAR 2007-08<br />
Experience Budget Experience Proposed Adjustments<br />
For Year For Year 2006-07 by by<br />
2005-06 2006-07 Estimated <strong>City</strong> Manager <strong>City</strong> Commission<br />
CDBG-HOUSING DIVISION<br />
PERSONAL SERVICES 235,499 269,869 180,004 302,214<br />
OPERATING EXPENSES<br />
Rental / Fleet Equipment 667<br />
Gasoline / Fleet Equipment 1,734 1,561 1,616 1,672 ___________<br />
Maintenance / Fleet Equipment 816 727 864 1,234 ___________<br />
Intra-Dept Charges - Computer Rental 3,377 10,594 12,451 ___________<br />
Intra-Dept Charges - Telephone 1,533 1,534 1,534 1,764 ___________<br />
Intra-Dept Charges - Radios 668 698 674 643 ___________<br />
Intra-Dept Charges - Training<br />
493 ___________<br />
Office Supplies 526 500 378 389 ___________<br />
Leases 8,028 8,028 4,683 8,028 ___________<br />
Postage 100 100 103 ___________<br />
Telephone, Communications 1,257 1,314 929 1,009 ___________<br />
Car Washing 46 75 50<br />
SUB-TOTAL 18,652 25,131 10,828 27,786<br />
TOTAL 254,151 295,000 190,832 330,000<br />
E – 91
COMMUNITY DEVELOPMENT<br />
BUDGET FOR YEAR 2007-08<br />
Experience Budget Experience Proposed Adjustments<br />
For Year For Year 2006-07 by by<br />
2005-06 2006-07 Estimated <strong>City</strong> Manager <strong>City</strong> Commission<br />
CDBG-CODE ENFORCEMENT<br />
PERSONAL SERVICES 119,964 106,341 85,943 126,092<br />
OPERATING EXPENSES<br />
Rental / Fleet Equipment 550<br />
Gasoline / Fleet Equipment 2,461 4,217 2,388 3,344 ___________<br />
Maintenance / Fleet Equipment 1,696 5,115 1,778 3,871 ___________<br />
SUB-TOTAL 4,707 9,332 4,166 7,215<br />
CONTRIBUTIONS TO OTHER FUNDS<br />
Fleet Management Reserve 12,520<br />
TOTAL 137,191 115,673 90,109 133,307<br />
CDBG-REHABILITATION OF PRIVATE PROPERTY<br />
OPERATING EXPENSES<br />
Rehabilitation <strong>of</strong> Private Property 23,841 91,902 250,000 155,243 ___________<br />
Clearance Activities 5,000 5,000 5,000 ___________<br />
Relocation Payments & Assistance 51,441 85,000 15,000 50,000 ___________<br />
SUB-TOTAL 75,282 181,902 270,000 210,243<br />
E – 92
COMMUNITY DEVELOPMENT<br />
BUDGET FOR YEAR 2007-08<br />
Experience Budget Experience Proposed Adjustments<br />
For Year For Year 2006-07 by by<br />
2005-06 2006-07 Estimated <strong>City</strong> Manager <strong>City</strong> Commission<br />
SPECIAL PROJECTS<br />
CDBG Program:<br />
Boys & Girls Club Summer Day Camp 7,200 7,200 7,500 ___________<br />
Simpson Park Summer Recreation 28,090 28,090 24,595 ___________<br />
Simpson Park Swim Passes 2,700 2,700 ___________<br />
Simpson Park Art Classes 2,350 2,380 2,380 2,000 ___________<br />
Simpson Park Modeling Classes 460 1,250 1,250<br />
Simpson Park Cultural Dance 1,660 ___________<br />
Simpson Park Football/S<strong>of</strong>tball Field 51,646 95,000 38,028<br />
Coleman-Bush Building:<br />
After School Tutoring Program 8,421 9,410 8,542 9,410 ___________<br />
Summer Tutoring Program 1,900 2,420 2,420 ___________<br />
After School Programs 6,239 4,950 2,806 4,950 ___________<br />
Heart <strong>of</strong> Florida Girl Scouts 5,000 5,000 5,000<br />
Talbot House 5,000 5,000 10,000 ___________<br />
<strong>Lakeland</strong> Coalition for the Homeless 4,549 6,000 6,000 7,500 ___________<br />
VISTE Hot Meals for Elderly 10,000 9,800 9,800 10,000 ___________<br />
Catholic Charities 7,200 7,200<br />
Freedom Center 5,000 5,000<br />
Big Brothers & Big Sisters 9,900 7,200 4,800 5,000 ___________<br />
Swimming Lessons NW Area 2,670<br />
Salvation Army <strong>of</strong> <strong>Lakeland</strong>:<br />
Client ID System 5,000<br />
Refrigerators for Transitional Housing 5,000 5,000<br />
Ranges for Transitional Housing 5,000 ___________<br />
Computers for Community Center 5,000 5,000<br />
Wheelchair Access Computer Desks 3,900<br />
Accessible Shower for Group Home 9,338 ___________<br />
E – 93
COMMUNITY DEVELOPMENT<br />
BUDGET FOR YEAR 2007-08<br />
Experience Budget Experience Proposed Adjustments<br />
For Year For Year 2006-07 by by<br />
2005-06 2006-07 Estimated <strong>City</strong> Manager <strong>City</strong> Commission<br />
SPECIAL PROJECTS (Continued):<br />
CDBG Program:<br />
Wilson House 7,200 7,200 7,500 ___________<br />
<strong>Lakeland</strong> Volunteers in Medicine 14,700 7,200 10,000 ___________<br />
Sidewalk Sidney 7th to 10th 18,689<br />
HCPC - Chronic Homeless Plan 12,500 ___________<br />
Sidewalk - New York Pear to Memorial 1,482 40,000 38,518<br />
Sidewalk - 6th Street 28,000 ___________<br />
Drainage Project - Hull St 192,000 ___________<br />
Central Florida Deaf Services 4,277<br />
Rental Rehabilitation Program:<br />
Rental Rehabilitation Loans 34,640 3,094<br />
Dixieland Program:<br />
Rehabilitation 222 6,845<br />
Affordable Housing 106,975 15,000<br />
DCA Elderly Homeowner Rehab 52,861 1,288<br />
SHIP Program:<br />
Administration 47,407 66,232 45,000 66,232 ___________<br />
Affordable Housing Program 836,697 596,096 750,000 596,096 ___________<br />
HOME Program:<br />
Administration 45,147 43,838 37,500 43,667 ___________<br />
Affordable Housing Program 488,224 342,830 275,000 391,587 ___________<br />
Keystone Challenge 7,307 76,718 15,000 76,417 ___________<br />
FHFC Disaster Relief Home Assistance Program:<br />
Rehabilitation 288,868 207,636 207,636<br />
Hurricane Housing Recovery Program:<br />
Affordable Housing Program 419,288 1,463,201 1,463,201<br />
Administration 17,295 326,446 326,446<br />
Special Needs Rental Housing 100,000 100,000<br />
SUB-TOTAL 2,538,604 3,485,997 3,390,334 1,526,072<br />
TOTAL EXPENSES 3,155,717 4,213,572 4,068,905 2,344,622<br />
PERSONNEL<br />
Current Proposed Pay Salary<br />
POSITION TITLE Budget Budget Grade Range<br />
Housing Division Manager 1 1 58 51,979 - 78,666<br />
Housing Programs Coordinator 1 1 51 43,805 - 64,730<br />
Housing Rehabilitation Specialist II 2 2 45 37,835 - 57,304<br />
Code Enforcement Officer 2 2 42 35,173 - 53,248<br />
Housing Rehabilitation Finance Officer II 1 2 42 35,173 - 53,248<br />
Planning Assistant 1 1 36 30,389 - 45,989<br />
Account Clerk II 1 1 26 23,816 - 36,026<br />
Office Assistant II 1 1 22 21,590 - 32,677<br />
TOTAL FULL-TIME EMPLOYEES 10 11<br />
PART-TIME<br />
Housing Rehab Finance Officer I 1 1<br />
TOTAL PART-TIME EMPLOYEES 1 1<br />
E – 94
REVENUE AND EXPENDITURE SUMMARY<br />
DEBT SERVICE<br />
Experience Budget Experience 2007-08<br />
For Year For Year 2006-07 Proposed by<br />
EXPENSES 2005-06 2006-07 Estimated <strong>City</strong> Manager<br />
Personnel<br />
Salaries and Wages<br />
Fringe Benefits<br />
Total Personnel<br />
Non-Personnel<br />
Internal Service Charges<br />
Pr<strong>of</strong>essional and Contractual<br />
Utilities<br />
Insurance and Fixed Charges<br />
All Other Operations and Maintenance<br />
Capital Outlay<br />
Debt Service 340,463 350,463 350,463 359,898<br />
Total Non-Personnel 340,463 350,463 350,463 359,898<br />
Total Expenditures 340,463 350,463 350,463 359,898<br />
Transfers<br />
Transfers In 317,722 350,463 350,463 359,898<br />
Transfers Out<br />
Net Transfers 317,722 350,463 350,463 359,898<br />
Revenue Sources<br />
Taxes<br />
Licenses and Permits<br />
Intergovernmental<br />
Charges for Services<br />
Interest Income 5,334 6,173 6,100<br />
All Other Revenue<br />
Total Revenue 5,334 6,173 6,100<br />
Funding to be Provided 17,407 (6,173) (6,100)<br />
E – 95
DEBT SERVICE<br />
BUDGET FOR YEAR 2007-08<br />
Experience Budget Experience Proposed Adjustments<br />
For Year For Year 2006-07 by by<br />
EXPENSES 2005-06 2006-07 Estimated <strong>City</strong> Manager <strong>City</strong> Commission<br />
REVENUES<br />
Interfund Transfers:<br />
Public Improvement Fund 250,034 283,775 283,775 289,260 ___________<br />
<strong>Lakeland</strong> Linder Regional Airport Fund 67,688 66,688 66,688 70,638 ___________<br />
SUB-TOTAL 317,722 350,463 350,463 359,898<br />
Interest Earnings:<br />
2002 Utility Tax Reserve Fund 5,334 6,173 6,100<br />
Prior Year Surplus 17,407 (6,173) (6,100)<br />
(2002 Debt Service Reserve)<br />
TOTAL REVENUES 340,463 350,463 350,463 359,898<br />
EXPENDITURES<br />
Principal Payable:<br />
2002 Utility Tax Revenue Bonds 250,000 265,000 265,000 280,000 ___________<br />
Interest Payable:<br />
2002 Utility Tax Revenue Bonds 90,463 85,463 85,463 79,898 ___________<br />
TOTAL EXPENDITURES 340,463 350,463 350,463 359,898<br />
E – 96
REVENUE AND EXPENDITURE SUMMARY<br />
FLEET MANAGEMENT<br />
Experience Budget Experience 2007-08<br />
For Year For Year 2006-07 Proposed by<br />
EXPENSES 2005-06 2006-07 Estimated <strong>City</strong> Manager<br />
Personnel<br />
Salaries and Wages 1,369,313 1,565,611 1,483,739 1,679,101<br />
Fringe Benefits 335,400 403,968 365,154 463,192<br />
Total Personnel 1,704,713 1,969,579 1,848,893 2,142,293<br />
Non-Personnel<br />
Internal Service Charges 395,261 500,562 463,243 583,734<br />
Pr<strong>of</strong>essional and Contractual 570,758 276,463 612,072 493,793<br />
Utilities 72,714 75,526 67,623 81,373<br />
Insurance and Fixed Charges 98,198 103,567 94,128 97,539<br />
All Other Operations and Maintenance 4,263,306 5,096,643 4,636,362 4,727,041<br />
Capital Outlay 3,956,704 7,271,974 7,094,462 3,755,378<br />
Debt Service<br />
Total Non-Personnel 9,356,941 13,324,735 12,967,890 9,738,858<br />
Total Expenditures 11,061,654 15,294,314 14,816,783 11,881,151<br />
Transfers<br />
Transfers In<br />
Transfers Out<br />
Net Transfers<br />
Revenue Sources<br />
Taxes<br />
Licenses and Permits<br />
Intergovernmental 149,861 147,000 147,000 148,000<br />
Charges for Services 10,472,002 11,145,488 10,834,786 11,465,071<br />
Interest Income 747,356 1,093,404 903,412 880,451<br />
All Other Revenue 653,017 988,914 1,027,914 349,059<br />
Total Revenue 12,022,236 13,374,806 12,913,112 12,842,581<br />
Funding to be Provided (960,582) 1,919,508 1,903,671 (961,430)<br />
E – 97
FLEET MANAGEMENT<br />
BUDGET FOR YEAR 2007-08<br />
Experience Budget Experience Proposed Adjustments<br />
For Year For Year 2006-07 by by<br />
2005-06 2006-07 Estimated <strong>City</strong> Manager <strong>City</strong> Commission<br />
INTERGOVERNMENTAL REVENUE<br />
REVENUES<br />
State Shared Revenues<br />
Motor Fuel Tax Rebate 149,861 147,000 147,000 148,000 ___________<br />
TOTAL INTERGOVERNMENTAL<br />
REVENUE 149,861 147,000 147,000 148,000<br />
MISCELLANEOUS REVENUE<br />
Interest Earnings<br />
Interest on Pooled Investments 20,387 43,931 43,020 41,926 ___________<br />
Interest Earnings - Depreciation<br />
Reserve<br />
Interest on Pooled Investments 726,969 1,049,473 860,392 838,525 ___________<br />
SUB-TOTAL 726,969 1,049,473 860,392 838,525<br />
Sales & Compensation for Loss<br />
<strong>of</strong> Fixed Assets<br />
Sale <strong>of</strong> Rental Equipment 211,627 145,000 185,000 225,000 ___________<br />
SUB-TOTAL 211,627 145,000 185,000 225,000<br />
Sales <strong>of</strong> Surplus Materials<br />
and Scrap<br />
Scrap Sales 1,332 1,300 1,300 1,350 ___________<br />
Reimbursements<br />
Insurance Proceeds 1,200 1,200 1,200 ___________<br />
Insurance Proceeds - Workers Comp 876 500 500 500 ___________<br />
Reimbursements / Loss Recovery 15,167 7,700 6,700 6,900 ___________<br />
Refund <strong>of</strong> Prior Years Expense 2,609 2,609 2,609 ___________<br />
Dare-Contribution & Donations 5,000<br />
SUB-TOTAL 21,043 12,009 11,009 11,209<br />
TOTAL MISCELLANEOUS<br />
REVENUE 981,358 1,251,713 1,100,721 1,118,010<br />
E – 98
FLEET MANAGEMENT<br />
BUDGET FOR YEAR 2007-08<br />
Experience Budget Experience Proposed Adjustments<br />
For Year For Year 2006-07 by by<br />
2005-06 2006-07 Estimated <strong>City</strong> Manager <strong>City</strong> Commission<br />
INTRAGOVERNMENTAL SERVICES<br />
Equipment Rental Services<br />
Rental / Fleet Equipment 1,593,515<br />
Maintenance / Fleet Equipment 2,658,703 3,859,159 4,425,450 4,645,815 ___________<br />
Maintenance / Fleet Equipment/Other 349,406 353,000 176,757 140,000 ___________<br />
Motor Fuel Billings 2,575,776 3,562,932 2,948,749 3,119,795 ___________<br />
Depreciation Reserve 3,294,602 3,370,397 3,283,830 3,559,461 ___________<br />
TOTAL INTRAGOVERNMENTAL<br />
SERVICES 10,472,002 11,145,488 10,834,786 11,465,071<br />
TOTAL REVENUE 11,603,221 12,544,201 12,082,507 12,731,081<br />
SUBSIDIES<br />
Interfund Transfers<br />
Uninsured Loss Reserve Fund 29,422<br />
General Fund 118,146 234,212 234,212<br />
Community Development Fund 25,015<br />
Facilities Maintenance Fund 14,415 30,000 30,000 72,000 ___________<br />
<strong>Lakeland</strong> Linder Regional Airport Fund 3,000 3,000 14,500 ___________<br />
Solid Waste Fund 143,620 219,000 219,000<br />
Wastewater Utility Fund 13,000 13,000<br />
Wastewater Renewal & Replacement Fund 11,190 29,810 29,810<br />
Water Renewal & Replacement Fund 62,207 137,822 137,822 25,000 ___________<br />
Electric Utility Fund 15,000 163,761 163,761<br />
TOTAL SUBSIDIES 419,015 830,605 830,605 111,500<br />
SURPLUS - PRIOR YEARS (185,992) 62,831 (12,191) 38,454<br />
SURPLUS - DEPRECIATION<br />
RESERVE (774,590) 1,856,677 1,915,862 (999,884)<br />
GRAND TOTAL REVENUES 11,061,654 15,294,314 14,816,783 11,881,151<br />
E – 99
FLEET MANAGEMENT<br />
BUDGET FOR YEAR 2007-08<br />
Experience Budget Experience Proposed Adjustments<br />
For Year For Year 2006-07 by by<br />
2005-06 2006-07 Estimated <strong>City</strong> Manager <strong>City</strong> Commission<br />
EXPENSES ADMINISTRATION<br />
PERSONAL SERVICES 300,156 328,785 316,473 380,466<br />
OPERATING EXPENSES<br />
Retiree Health Insurance Subsidy 17,532 18,258 18,258 20,393 ___________<br />
Rental / Fleet Equipment 31,209 26,463 20,367 22,837 ___________<br />
Gasoline / Fleet Equipment 37,349 74,437 42,390 47,434 ___________<br />
Maintenance / Fleet Equipment 63,383 100,008 96,226 109,124 ___________<br />
Insurance - Fire 2,639 3,917 2,754 4,507 ___________<br />
Insurance - Position Bond 167 483 483 200 ___________<br />
Insurance - Consultant Fee 1,127 508 1,179 1,013 ___________<br />
Uninsured Loss Reserve 11,700 11,700<br />
Self-Insurance Service 77,860 69,209 60,933 72,439 ___________<br />
Purchasing & Stores Service 41,699 44,285 44,285 47,828 ___________<br />
General Fund Service 161,195 198,205 198,205 291,585 ___________<br />
Water Utility Service 1,276 1,400 1,193 1,232 ___________<br />
Electric Utility Service 55,710 60,661 53,226 67,032 ___________<br />
Wastewater Utility Service 1,879 2,065 1,796 1,988 ___________<br />
Solid Waste Service 12,507 9,200 9,808 9,671 ___________<br />
Intra-Dept Charges - Computer Rental 22,758 17,570 21,738 26,353 ___________<br />
Intra-Dept Charges - Telephone 5,905 5,848 6,282 7,285 ___________<br />
Intra-Dept Charges - Radios 3,006 3,029 3,033 2,894 ___________<br />
Intra-Dept Charges - Facilities 11,735 12,498 12,498 18,133 ___________<br />
Intra-Dept Charges - Janitorial 8,029 8,551 8,551 8,536 ___________<br />
Intra-Dept Charges - IT 8,993 9,668 9,668<br />
Intra-Dept Charges - Training 1,725 ___________<br />
Special Services 4,896 11,100 11,000 6,100 ___________<br />
Banking Service 957 1,055 1,055 1,055 ___________<br />
Annual Audit 4,878 4,000 3,759 4,125 ___________<br />
Office Supplies 2,782 3,700 2,800 3,200 ___________<br />
Equipment - Noncapital 1,635 6,295 7,000 6,500 ___________<br />
All Other Material & Supplies 5,806 5,500 7,600 7,600 ___________<br />
Uniforms 12,919 14,000 13,400 13,900 ___________<br />
Safety Installations 8,925 9,000 8,200 9,200 ___________<br />
Leases 2,050 12,300 9,045 9,045 ___________<br />
Repair <strong>of</strong> Equipment 9,266 12,700 9,000 9,500 ___________<br />
Printing & Photography 22 600 600 640 ___________<br />
Postage 154 200 175 220 ___________<br />
Subscriptions & Memberships 1,134 1,285 1,285 1,495 ___________<br />
S<strong>of</strong>tware License & Maintenance 2,992 2,992 2,992 2,992 ___________<br />
Telephone, Communications 1,342 2,200 1,600 1,450 ___________<br />
Travel 1,272 4,175 4,175 5,270 ___________<br />
Training 1,164 3,000 4,100 2,390 ___________<br />
All Other Sundry Charges 742 600 600 650 ___________<br />
SUB-TOTAL 628,894 772,665 712,959 847,541<br />
TOTAL 929,050 1,101,450 1,029,432 1,228,007<br />
E – 100
FLEET MANAGEMENT<br />
BUDGET FOR YEAR 2007-08<br />
Experience Budget Experience Proposed Adjustments<br />
For Year For Year 2006-07 by by<br />
2005-06 2006-07 Estimated <strong>City</strong> Manager <strong>City</strong> Commission<br />
OPERATIONS<br />
PERSONAL SERVICES 1,404,557 1,640,794 1,532,420 1,761,827<br />
OTHER EXPENDITURES<br />
Special Services 558,900 259,800 595,079 481,500 ___________<br />
Transmission 48,372 45,000 37,574 45,000 ___________<br />
Body Shop Services 115,557 95,000 151,113 150,000 ___________<br />
Towing 48,166 35,000 47,206 45,000 ___________<br />
All Other Mat & Supplies 41,537 37,500 59,409 42,000 ___________<br />
Fuel Island Maintenance 20,000 20,000 22,000 ___________<br />
Chemicals 9,334 8,000 9,890 8,200 ___________<br />
Paints & Paint Supplies 8,981 14,000 5,143 8,000 ___________<br />
Tools & Implements 26,361 21,000 26,389 24,300 ___________<br />
Tires & Tubes 388,176 280,000 402,266 395,000 ___________<br />
Parts For Equipment 897,984 837,299 859,515 922,776 ___________<br />
Lubricants 62,717 48,000 65,611 60,000 ___________<br />
All Other Sundry Charges 525<br />
Car Washing 200 239<br />
Licenses and Permits 5,716 4,000 7,310 7,500 ___________<br />
SUB-TOTAL 2,211,801 1,704,799 2,286,743 2,211,801<br />
TOTAL 3,616,358 3,345,593 3,819,163 3,973,628<br />
FUEL<br />
Fuel 2,501,510 3,300,000 2,605,429 2,898,841 ___________<br />
TOTAL 2,501,510 3,300,000 2,605,429 2,898,841<br />
TOTAL EXPENSES 7,046,918 7,747,043 7,454,024 8,100,476<br />
OTHER CASH DISBURSEMENTS<br />
Equipment - Operational 58,959 116,049 115,000 42,300 ___________<br />
Motor Equipment 3,877,623 7,153,352 6,976,889 3,710,505 ___________<br />
Vehicle Reserve Contingency 100,000 100,000 25,297 ___________<br />
Increase/Decrease in Inventory 53,032<br />
Fencing/Security Gate 17,549<br />
Parking Lot Repavement 150,297 150,297<br />
Design Assistance 25,000 18,000<br />
SUB-TOTAL 4,007,163 7,544,698 7,360,186 3,778,102<br />
TRANSFERS TO OTHER FUNDS<br />
Cleveland Heights Golf Course Fund 5,000<br />
PIF - Radio Tower Upgrade & Purchases 2,573 2,573 2,573 2,573 ___________<br />
SUB-TOTAL 7,573 2,573 2,573 2,573<br />
GRAND TOTAL 11,061,654 15,294,314 14,816,783 11,881,151<br />
E – 101
FLEET MANAGEMENT<br />
BUDGET FOR YEAR 2007-08<br />
Experience Budget Experience Proposed Adjustments<br />
For Year For Year 2006-07 by by<br />
2005-06 2006-07 Estimated <strong>City</strong> Manager <strong>City</strong> Commission<br />
Equipment<br />
1 - Network Computer New 3,800<br />
1 - SQL Server S<strong>of</strong>tware New 15,000<br />
1 - Metal Brake and Shear New 10,000<br />
1 - Puller Set Replacement 8,500<br />
1 - A/C Recycling Machine Replacement 5,000<br />
42,300<br />
PERSONNEL<br />
Current Proposed Pay Salary<br />
POSITION TITLE Budget Budget Grade Range<br />
Fleet Manager 1 1 65 61,630 - 93,330<br />
Automotive Shop Foreman 2 2 54 47,133 - 71,365<br />
Management Analyst 1 1 51 43,805 - 64,730<br />
Automotive Mechanic III 18 18 47 39,749 - 60,174<br />
Automotive Maintenance Coordinator 1 1 45 37,835 - 57,304<br />
Automotive Mechanic II 1 1 42 35,173 - 53,248<br />
Paint & Body Mechanic 1 1 42 35,173 - 53,248<br />
Office Manager 1 1 38 31,907 - 48,298<br />
Automotive Mechanic I 2 2 38 31,907 - 48,298<br />
Warehouse Operations Tech I 1 1 31 26,894 - 40,726<br />
Equipment Operator I 1 1 29 25,605 - 38,771<br />
Account Clerk III 1 1 29 25,605 - 38,771<br />
Automotive Parts Clerk 2 2 27 24,398 - 36,941<br />
Account Clerk II 1 1 26 23,816 - 36,026<br />
Automotive Mechanic Helper 1 1 18 19,594 - 29,661<br />
TOTAL FULL-TIME EMPLOYEES 35 35<br />
FLEET PURCHASES<br />
Routine Replacements<br />
20 - Police Cars 710,183<br />
1 - 3/4 Ton Pickup Truck w/Crew Cab 27,000<br />
1 - 1/2 Ton Pickup Truck 18,025<br />
3 - 1/2 Ton Pickup Trucks (AF) 68,348<br />
1 - Mower 15,826<br />
1 - Boom Truck 91,054<br />
1 - Tractor w/ Mower 20,019<br />
2 - Pothole Patchers 13,000<br />
1 - Tractor w/Trailer 96,867<br />
3 - Front Loading Refuse Trucks 548,814<br />
6 - Rear Loading Refuse Trucks 1,060,512<br />
2 - Grabber Trash Trucks 194,962<br />
2 - 3/4 Ton Vans 39,981<br />
1 - Tanker Trailer 32,288<br />
1 - Tanker Truck 46,108<br />
2 - Air Compressors 47,563<br />
3 - Bucket Trucks 568,455<br />
TOTAL REPLACEMENTS 3,599,005<br />
New Equipment<br />
1 - Passenger Car 14,500<br />
2 - Compact Pickup Trucks 25,000<br />
3 - 3/4 Cargo Vans 72,000<br />
TOTAL NEW PURCHASES 111,500<br />
TOTAL EQUIPMENT PURCHASES 3,710,505<br />
E – 102
REVENUE AND EXPENDITURE SUMMARY<br />
PURCHASING AND STORES<br />
Experience Budget Experience 2007-08<br />
For Year For Year 2006-07 Proposed by<br />
EXPENSES 2005-06 2006-07 Estimated <strong>City</strong> Manager<br />
Personnel<br />
Salaries and Wages 794,068 843,438 840,937 894,677<br />
Fringe Benefits 198,785 211,356 213,118 241,369<br />
Total Personnel 992,853 1,054,794 1,054,055 1,136,046<br />
Non-Personnel<br />
Internal Service Charges 465,724 463,058 464,835 484,688<br />
Pr<strong>of</strong>essional and Contractual 13,793 30,287 30,042 30,356<br />
Utilities 72,586 66,521 49,638 77,476<br />
Insurance and Fixed Charges 52,769 62,027 47,822 49,678<br />
All Other Operations and Maintenance 935,470 1,107,417 1,108,020 1,182,939<br />
Capital Outlay 12,308 83,638 83,638 11,308<br />
Debt Service<br />
Total Non-Personnel 1,552,650 1,812,948 1,783,995 1,836,445<br />
Total Expenditures 2,545,503 2,867,742 2,838,050 2,972,491<br />
Transfers<br />
Transfers In<br />
Transfers Out<br />
Net Transfers<br />
Revenue Sources<br />
Taxes<br />
Licenses and Permits<br />
Intergovernmental<br />
Charges for Services 2,571,795 2,748,501 2,749,899 2,916,184<br />
Interest Income 47,052 46,260 30,114 29,348<br />
All Other Revenue 20,371 13,000 12,444 13,000<br />
Total Revenue 2,639,218 2,807,761 2,792,457 2,958,532<br />
Funding to be Provided (93,715) 59,981 45,593 13,959<br />
E – 103
PURCHASING AND STORES<br />
BUDGET FOR YEAR 2007-08<br />
Experience Budget Experience Proposed Adjustments<br />
For Year For Year 2006-07 by by<br />
2005-06 2006-07 Estimated <strong>City</strong> Manager <strong>City</strong> Commission<br />
REVENUES MISCELLANEOUS REVENUE<br />
Interest Earnings<br />
Interest on Pooled Investments 47,052 46,260 30,114 29,348 ___________<br />
SUB-TOTAL 47,052 46,260 30,114 29,348<br />
Sales <strong>of</strong> Surplus Materials and Scrap<br />
Scrap Sales 20,194 13,000 12,444 13,000 ___________<br />
SUB-TOTAL 20,194 13,000 12,444 13,000<br />
Refund <strong>of</strong> Prior Year Expenditures<br />
All Other Refund - Prior Years 177<br />
TOTAL MISCELLANEOUS<br />
REVENUE 67,423 59,260 42,558 42,348<br />
INTRAGOVERNMENTAL SERVICES<br />
Central Stores Services - Sales to <strong>City</strong> Funds<br />
General Fund 102,335 99,672 99,672 102,662 ___________<br />
Transportation Fund 3,501 1,200 1,541 1,587 ___________<br />
Public Improvement Fund 1,201 2,400 1,000 1,030 ___________<br />
Community Development Fund 151 305 305 314 ___________<br />
SHIP Program 233 466 466 480 ___________<br />
HOME Program 65 130 291 300 ___________<br />
Jeanne Disaster 4 Fund 593 593<br />
Facilities Maintenance Fund 14,396 11,500 14,500 14,935 ___________<br />
Fleet Management Fund 4,670 5,600 5,600 5,768 ___________<br />
Purchasing & Stores Fund (1,224) 2,800 3,024 3,115 ___________<br />
Information Technology Fund 3,572 4,500 4,500 4,635 ___________<br />
Cleveland Heights Golf Course Fund 22 75 75 77 ___________<br />
Parking Fund 806 750 992 1,022 ___________<br />
<strong>Lakeland</strong> Center Fund 885 1,600 1,728 1,780 ___________<br />
<strong>Lakeland</strong> Linder Regional Airport Fund 6,337 9,500 4,000 4,120 ___________<br />
Solid Waste Fund 7,155 6,500 6,500 6,695 ___________<br />
Stormwater Fund 228 180 180 185 ___________<br />
Wastewater Utility Fund 25,173 24,500 26,460 27,254 ___________<br />
Wastewater Renewal & Replacement Fund 580 597 ___________<br />
Water Utility Fund 694,656 774,500 774,500 797,735 ___________<br />
Water Impact Fee Fund 86,424 98,500 98,500 101,455 ___________<br />
LCRA Fund 55 57 ___________<br />
Electric Utility Fund 42,685 27,500 29,700 30,591 ___________<br />
Home Again 70<br />
Hurricane Housing Assistance Plan 109<br />
Sales - 2001 Sunshine Bond Fund 591<br />
TOTAL INTRAGOVERNMENTAL<br />
SERVICES 994,634 1,072,771 1,074,169 1,106,394<br />
TOTAL REVENUE 1,062,057 1,132,031 1,116,727 1,148,742<br />
E – 104
PURCHASING AND STORES<br />
BUDGET FOR YEAR 2007-08<br />
Experience Budget Experience Proposed Adjustments<br />
For Year For Year 2006-07 by by<br />
2005-06 2006-07 Estimated <strong>City</strong> Manager <strong>City</strong> Commission<br />
OPERATING SUBSIDIES<br />
Purchasing and Stores Services<br />
General Fund 174,944 185,795 185,795 200,659 ___________<br />
Fleet Management Fund 41,699 44,285 44,285 47,828 ___________<br />
Facilities Maintenance Fund 22,014 23,379 23,379 25,250 ___________<br />
Information Technology Fund 28,826 30,614 30,614 33,063 ___________<br />
Community Development Fund 17,985 19,100 19,100 20,629 ___________<br />
Cleveland Heights Golf Course Fund 11,168 11,861 11,861 12,810 ___________<br />
Parking Fund 1,154 1,226 1,226 1,324 ___________<br />
<strong>Lakeland</strong> Center Fund 9,901 10,515 10,515 11,356 ___________<br />
Solid Waste Fund 6,154 6,536 6,536 7,059 ___________<br />
<strong>Lakeland</strong> Linder Regional Airport Fund 7,650 8,125 8,125 8,774 ___________<br />
Wastewater Utility Fund 43,232 45,913 45,913 49,587 ___________<br />
Water Utility Fund 119,972 127,413 127,413 137,607 ___________<br />
Electric Utility Fund 1,092,462 1,160,968 1,160,968 1,253,844 ___________<br />
TOTAL OPERATING SUBSIDIES 1,577,161 1,675,730 1,675,730 1,809,790<br />
PRIOR YEARS SURPLUS (93,715) 59,981 45,593 13,959<br />
GRAND TOTAL 2,545,503 2,867,742 2,838,050 2,972,491<br />
E – 105
PURCHASING AND STORES<br />
EXPENSES ADMINISTRATION<br />
BUDGET FOR YEAR 2007-08<br />
Experience Budget Experience Proposed Adjustments<br />
For Year For Year 2006-07 by by<br />
2005-06 2006-07 Estimated <strong>City</strong> Manager <strong>City</strong> Commission<br />
PERSONAL SERVICES 598,534 592,963 592,963 640,410<br />
OPERATING EXPENSES<br />
Increase/Decrease in Inventory (95,786)<br />
Retiree Health Insurance Subsidy 9,584 10,033 10,033 11,076 ___________<br />
Rental / Fleet Equipment 21,720 16,228 16,228 16,917 ___________<br />
Gasoline / Fleet Equipment 2,495 1,332 2,932 4,194 ___________<br />
Maintenance / Fleet Equipment 20,661 21,510 19,910 18,635 ___________<br />
Insurance - Fire 22,542 33,464 23,527 23,122 ___________<br />
Insurance - Position Bond 91 262 262 109 ___________<br />
Insurance - Consultant 604 727 727 486 ___________<br />
Self-Insurance 20,552 18,268 14,000 15,371 ___________<br />
General Fund Service 186,906 183,242 183,242 191,430 ___________<br />
Water Utility Service 4,544 5,160 3,220 2,650 ___________<br />
Electric Utility Service 54,223 48,892 35,272 63,115 ___________<br />
Wastewater Utility Service 479 526 386 491 ___________<br />
Solid Waste Service 9,473 8,003 6,820 7,161 ___________<br />
Intra-Dept Charges - Computer Rental 46,668 36,436 37,600 43,799 ___________<br />
Intra-Dept Charges - Telephone 7,834 7,519 8,132 9,197 ___________<br />
Intra-Dept Charges - Facilities 26,340 28,052 28,052 40,050 ___________<br />
Intra-Dept Charges - Janitorial 93,866 99,967 99,967 99,799 ___________<br />
Intra-Dept Charges - IT 55,888 65,406 65,406 56,515 ___________<br />
Intra-Dept Charges - Training 936 ___________<br />
Special Services 9,242 25,594 25,594 26,000 ___________<br />
Banking Services 695 766 766 789 ___________<br />
Legal Advertising 500 500 300 ___________<br />
Annual Audit 3,252 2,700 2,455 2,781 ___________<br />
Office Supplies 8,707 7,420 7,420 7,000 ___________<br />
Equipment - Noncapital 3,221 655 655 700 ___________<br />
All Other Materials & Supplies 1,173 1,000 1,000 800 ___________<br />
Uniforms 2,011 2,100 2,100 2,100 ___________<br />
Cleaning & Janitor Supply 11<br />
Tools and Implements 498 500 500 300 ___________<br />
Merchandise 1,005,009 1,083,151 1,083,121 1,158,593 ___________<br />
Rentals 760 760 760 ___________<br />
Repair <strong>of</strong> Equipment 4,393 3,600 4,233 4,278 ___________<br />
Postage 1,322 1,900 1,900 1,957 ___________<br />
Subscriptions & Memberships 1,439 1,055 1,055 1,175 ___________<br />
Telephone, Communications 3,867 3,940 3,940 4,059 ___________<br />
Travel 2,876 4,320 4,320 4,320 ___________<br />
Training 550 905 905 905 ___________<br />
All Other Sundry Charges 51<br />
Car Washing 46 51 51<br />
SUB-TOTAL 1,536,996 1,725,944 1,696,991 1,821,922<br />
CAPITAL OUTLAY<br />
Equipment 9,000 8,500 8,500 8,000 ___________<br />
TOTAL 2,144,530 2,327,407 2,298,454 2,470,332<br />
E – 106
PURCHASING AND STORES<br />
BUDGET FOR YEAR 2007-08<br />
Experience Budget Experience Proposed Adjustments<br />
For Year For Year 2006-07 by by<br />
2005-06 2006-07 Estimated <strong>City</strong> Manager <strong>City</strong> Commission<br />
WAREHOUSE<br />
PERSONAL SERVICES 394,319 461,831 461,092 495,636<br />
OPERATING EXPENSES<br />
Intra Dept Charges - Radios 3,346 3,366 3,366 3,215 ___________<br />
SUB-TOTAL 3,346 3,366 3,366 3,215<br />
TOTAL 397,665 465,197 464,458 498,851<br />
SPECIAL PROJECTS<br />
Maximo Upgrade 21,830 21,830<br />
Optio Upgrade 50,000 50,000<br />
SUB-TOTAL 71,830 71,830<br />
TRANSFER TO OTHER FUNDS<br />
Information Technology Fund - Radio Towe 3,308 3,308 3,308 3,308 ___________<br />
SUB-TOTAL 3,308 3,308 3,308 3,308<br />
GRAND TOTAL 2,545,503 2,867,742 2,838,050 2,972,491<br />
Equipment<br />
Warehouse Break Room Furniture Replacement 1,980<br />
Cantilever Racks Replacement 2,500<br />
1 - Heavy Duty Hydraulic Reel Jack Replacement 3,520<br />
8,000<br />
PERSONNEL<br />
Current Proposed Pay Salary<br />
POSITION TITLE Budget Budget Grade Range<br />
Purchasing Manager 1 1 65 61,630 - 93,330<br />
Assistant Purchasing Manager 1 1 54 47,133 - 71,365<br />
Superintendent Of Stores 1 1 49 41,725 - 63,190<br />
Inventory Control Specialist 1 1 42 35,173 - 53,248<br />
Purchasing Agent 4 4 42 35,173 - 53,248<br />
Account Clerk IV 1 1 33 28,246 - 42,765<br />
Warehouse Operations Technician II 2 2 33 28,246 - 42,765<br />
Warehouse Operations Technician I 5 5 31 26,894 - 40,726<br />
Account Clerk III 1 1 29 25,605 - 38,771<br />
Account Clerk II 2 2 26 23,816 - 36,026<br />
TOTAL FULL-TIME EMPLOYEES 19 19<br />
E – 107
THIS PAGE IS INTENTIONALLY BLANK<br />
E-108 Fiscal Year <strong>2008</strong> Annual Budget
REVENUE AND EXPENDITURE SUMMARY<br />
FACILITIES MAINTENANCE<br />
Experience Budget Experience 2007-08<br />
For Year For Year 2006-07 Proposed by<br />
EXPENSES 2005-06 2006-07 Estimated <strong>City</strong> Manager<br />
Personnel<br />
Salaries and Wages 1,418,645 1,698,163 1,588,804 1,895,785<br />
Fringe Benefits 368,857 461,969 419,059 547,435<br />
Total Personnel 1,787,502 2,160,132 2,007,862 2,443,220<br />
Non-Personnel<br />
Internal Service Charges 365,506 363,807 413,304 479,462<br />
Pr<strong>of</strong>essional and Contractual 105,114 100,345 101,087 139,106<br />
Utilities 31,004 33,351 31,552 33,639<br />
Insurance and Fixed Charges 76,606 73,411 65,509 95,471<br />
All Other Operations and Maintenance 653,803 725,788 748,808 810,371<br />
Capital Outlay 15,914 38,500 37,969 97,000<br />
Debt Service<br />
Total Non-Personnel 1,247,947 1,335,202 1,398,229 1,655,049<br />
Total Expenditures 3,035,449 3,495,334 3,406,091 4,098,269<br />
Transfers<br />
Transfers In<br />
Transfers Out<br />
Net Transfers<br />
Revenue Sources<br />
Taxes<br />
Licenses and Permits<br />
Intergovernmental<br />
Charges for Services 3,004,231 3,376,707 3,369,789 4,082,633<br />
Interest Income 16,326 17,565 21,510 20,963<br />
All Other Revenue 115,430 25,000 25,000<br />
Total Revenue 3,135,987 3,419,272 3,416,299 4,103,596<br />
Funding to be Provided (100,538) 76,062 (10,208) (5,327)<br />
E – 109
FACILITIES MAINTENANCE<br />
BUDGET FOR YEAR 2007-08<br />
Experience Budget Experience Proposed Adjustments<br />
For Year For Year 2006-07 by by<br />
2005-06 2006-07 Estimated <strong>City</strong> Manager <strong>City</strong> Commission<br />
REVENUES<br />
MISCELLANEOUS REVENUE<br />
Interest Earnings<br />
Interest on Pooled Investment 16,326 17,565 21,510 20,963 ___________<br />
SUB-TOTAL 16,326 17,565 21,510 20,963<br />
Reimbursements<br />
Reimbursements/Loss Recovery 4,054<br />
Refund <strong>of</strong> Prior Years Expense 6,376<br />
SUB-TOTAL 10,430<br />
TOTAL MISCELLANEOUS REVENUE 26,756 17,565 21,510 20,963<br />
INTRAGOVERNMENTAL SERVICES<br />
Facility Maintenance Services to <strong>City</strong> Funds<br />
Self Insurance Fund 147,704 ___________<br />
General Fund 1,139,740 1,344,941 1,338,024 1,652,534 ___________<br />
Facilities Maintenance Fund 23,756 13,477 13,476 18,354 ___________<br />
Fleet Management Fund 11,735 12,498 12,498 18,133 ___________<br />
Purchasing & Stores Fund 26,340 28,052 28,052 40,050 ___________<br />
Information Technology Fund 19,709 12,616 12,616 16,478 ___________<br />
Cleveland Heights Golf Course Fund 26,316 29,858 29,858 40,664 ___________<br />
Parking Fund 8,917 10,117 10,116 14,003 ___________<br />
<strong>Lakeland</strong> Linder Regional Airport Fund 210,352 194,110 194,110<br />
Solid Waste Fund 4,395 4,986 4,986 7,690 ___________<br />
Wastewater Utility Fund 25,959 29,453 29,454 39,723 ___________<br />
Water Utility Fund 10,114 11,474 11,474 49,377 ___________<br />
Electric Utility Fund 433,860 562,260 562,260 799,275 ___________<br />
SUB-TOTAL 1,941,193 2,253,842 2,246,924 2,843,985<br />
Janitorial Services to <strong>City</strong> Funds<br />
General Fund 371,067 441,697 441,697 437,393 ___________<br />
Facilities Maintenance Fund 4,987 2,823 2,823 2,651 ___________<br />
Fleet Management Fund 8,029 8,551 8,551 8,536 ___________<br />
Purchasing & Stores Fund 93,866 99,967 99,967 99,799 ___________<br />
Information Technology Fund 17,396 9,763 9,763 14,971 ___________<br />
Cleveland Heights Golf Course Fund 20,553 23,269 23,269 21,852 ___________<br />
<strong>Lakeland</strong> Linder Regional Airport Fund 65,674 74,352 74,352 69,825 ___________<br />
Solid Waste Fund 4,844 5,485 5,485 6,334 ___________<br />
Wastewater Utility Fund 26,461 29,957 29,957 28,133 ___________<br />
Water Utility Fund 4,213 4,770 4,770 4,480 ___________<br />
Electric Utility Fund 445,948 422,231 422,231 544,674 ___________<br />
SUB-TOTAL 1,063,038 1,122,865 1,122,865 1,238,648<br />
TOTAL INTRAGOVERNMENTAL<br />
SERVICES 3,004,231 3,376,707 3,369,789 4,082,633<br />
E – 110
FACILITIES MAINTENANCE<br />
BUDGET FOR YEAR 2007-08<br />
Experience Budget Experience Proposed Adjustments<br />
For Year For Year 2006-07 by by<br />
2005-06 2006-07 Estimated <strong>City</strong> Manager <strong>City</strong> Commission<br />
OPERATING SUBSIDIES<br />
Interfund Transfers<br />
General Fund 35,000<br />
Transfer for Special Projects 25,000 25,000<br />
Public Improvement Fund 70,000<br />
TOTAL OPERATING SUBSIDIES 105,000 25,000 25,000<br />
TOTAL REVENUE 3,135,987 3,419,272 3,416,299 4,103,596<br />
PRIOR YEAR SURPLUS (100,538) 76,062 (10,208) (5,327)<br />
GRAND TOTAL REVENUES 3,035,449 3,495,334 3,406,091 4,098,269<br />
EXPENSES<br />
FACILITIES MAINTENANCE<br />
PERSONAL SERVICES 944,626 1,170,359 1,003,981 1,126,880<br />
OPERATING EXPENSES<br />
Rental / Fleet Equipment 45,393 26,843 26,074 29,413 ___________<br />
Gasoline / Fleet Equipment 32,050 36,940 30,336 36,334 ___________<br />
Maintenance / Fleet Equipment 26,965 29,293 86,106 79,493 ___________<br />
Retiree Health Insurance Subsidy 17,958 19,920 19,920 22,763 ___________<br />
Insurance - Fire 1,639 2,289 2,034 2,062 ___________<br />
Insurance - Position Bond 229 731 731 303 ___________<br />
Self-Insurance Service 56,780 50,471 42,824 70,343 ___________<br />
Water Utility Service 508 589 452 486 ___________<br />
Electric Utility Service 18,958 19,831 16,722 17,587 ___________<br />
Wastewater Utility Service 440 496 376 510 ___________<br />
Solid Waste Service 2,332 2,409 2,962 3,110 ___________<br />
General Fund Service 170,368 192,422 192,422 223,812 ___________<br />
Purchasing & Stores Service 22,014 23,379 23,380 25,250 ___________<br />
Intra-Dept Charges - Computer Rental 13,621 10,782 10,498 12,272 ___________<br />
Intra-Dept Charges - Telephone 5,209 5,209 5,208 5,993 ___________<br />
Intra-Dept Charges - Radios 1,336 1,346 1,686 1,286 ___________<br />
Intra-Dept Charges - Facilities 23,756 13,477 13,476 18,354 ___________<br />
Intra-Dept Charges - Janitorial 4,987 2,823 2,824 2,651 ___________<br />
Intra-Dept Charges - IT 19,807 21,293 21,294 15,266 ___________<br />
Intra-Dept Charges - Training 2,956 ___________<br />
Insurance Consultant 800 388 1,279 980 ___________<br />
Annual Audit 1,526 1,300 1,151 1,300 ___________<br />
Contractual Services 83,980 98,657 98,657 95,826 ___________<br />
Office Supplies 4,713 5,000 3,968 5,000 ___________<br />
Equipment - Noncapital 7,139 5,000 3,000 5,000 ___________<br />
Uniforms 2,577 3,000 3,000 3,000 ___________<br />
Tools & Implements 4,468 4,000 4,500 4,000 ___________<br />
Agricultural & Horticultural Supplies 1,400 1,500 1,500 1,500 ___________<br />
Parts For Equipment 39,944 65,000 65,000 65,000 ___________<br />
Rentals 2,317 3,000 3,800 4,000 ___________<br />
Maintenance <strong>of</strong> Facilities 451,058 385,888 275,944 232,000 ___________<br />
Repair <strong>of</strong> Equipment 2,431 1,500 1,326 1,500 ___________<br />
Printing & Photography 1,223 1,200 1,200 1,200 ___________<br />
Postage 249 300 250 300 ___________<br />
E – 111
FACILITIES MAINTENANCE<br />
BUDGET FOR YEAR 2007-08<br />
Experience Budget Experience Proposed Adjustments<br />
For Year For Year 2006-07 by by<br />
2005-06 2006-07 Estimated <strong>City</strong> Manager <strong>City</strong> Commission<br />
Subscriptions & Memberships 997 500 500 500 ___________<br />
Telephone, Communications 8,586 9,786 10,800 9,786 ___________<br />
Travel 1,854 1,500 1,500 1,500 ___________<br />
Training 4,497 4,000 4,000 4,000 ___________<br />
All Other Sundry Charges 916 1,000 800 1,065 ___________<br />
Licenses & Permits 500 500 500 500 ___________<br />
Car Washing 64<br />
Contingency 25,000 25,000 25,000 ___________<br />
SUB-TOTAL 1,085,525 1,078,562 1,007,064 1,033,201<br />
TOTAL 2,030,151 2,248,921 2,011,045 2,160,081<br />
JANITORIAL SERVICES<br />
PERSONAL SERVICES 842,876 989,773 1,003,882 1,098,333<br />
OPERATING EXPENSES<br />
Contractual Services 18,808<br />
Uniforms 2,155 3,500 3,500 3,500 ___________<br />
Cleaning & Janitor Supplies 115,707 117,000 117,000 117,000 ___________<br />
Repair <strong>of</strong> Equipment 9,658 2,400 2,400 2,400 ___________<br />
Telephone - Communications 180 240 240 240 ___________<br />
SUB-TOTAL 146,508 123,140 123,140 123,140<br />
TOTAL 989,384 1,112,913 1,127,022 1,221,473<br />
FIRE SAFETY TEAM<br />
PERSONAL SERVICES 218,007<br />
OPERATING EXPENSES<br />
Rental / Fleet Equipment 8,247 ___________<br />
Gasoline / Fleet Equipment 4,410 ___________<br />
Maintenance / Fleet Equipment 9,912 ___________<br />
Intra-Dept Charges - Computer Rental 3,356 ___________<br />
Intra-Dept Charges - Telephone<br />
457 ___________<br />
Telephone - Communications 1,920 ___________<br />
Contractual Services 41,000 ___________<br />
Equipment - Noncapital 2,330 ___________<br />
Materials 15,000 ___________<br />
Office Supplies<br />
600 ___________<br />
Tools & Implements<br />
725 ___________<br />
Parts For Equipment 15,000 ___________<br />
Repair <strong>of</strong> Equipment 1,300 ___________<br />
Subscriptions & Membership<br />
600 ___________<br />
S<strong>of</strong>tware License & Maintenance 1,135 ___________<br />
Uniforms<br />
500 ___________<br />
Training 6,200 ___________<br />
Licenses & Permits<br />
960 ___________<br />
SUB-TOTAL 113,652<br />
TOTAL 331,659<br />
E – 112
FACILITIES MAINTENANCE<br />
BUDGET FOR YEAR 2007-08<br />
Experience Budget Experience Proposed Adjustments<br />
For Year For Year 2006-07 by by<br />
2005-06 2006-07 Estimated <strong>City</strong> Manager <strong>City</strong> Commission<br />
OTHER CASH DISBURSEMENTS<br />
CAPITAL OUTLAY<br />
Equipment 1,499 8,500 8,500 25,000 ___________<br />
SUB-TOTAL 1,499 8,500 8,500 25,000<br />
SPECIAL PROJECTS<br />
Generator/UPS Maintenance 15,000 15,000 15,000 ___________<br />
Security Systems Controls Maintenance 25,000 25,000<br />
Electric Chiller HVAC Maintenance 55,000 55,000 55,000 ___________<br />
Air Quality Investigations 10,000 ___________<br />
Garage Door /Operator Maintenance 25,000 ___________<br />
Plumbing Repairs / Replacement 10,000 ___________<br />
Investment Grade Audits for Energy 20,000 ___________<br />
Pinnacle Threshold Card Reader Data Base 18,000 ___________<br />
COL Chiller Maintenance 95,056 95,056 ___________<br />
Elevator Maintenance 40,000 40,000 ___________<br />
SUB-TOTAL 95,000 230,056 288,056<br />
CONTRIBUTIONS TO OTHER FUNDS<br />
Fleet Management Reserve Fund 14,415 30,000 29,469 72,000 ___________<br />
TOTAL 15,914 133,500 268,025 385,056<br />
GRAND TOTAL EXPENSES 3,035,449 3,495,334 3,406,091 4,098,269<br />
E – 113
FACILITIES MAINTENANCE<br />
BUDGET FOR YEAR 2007-08<br />
Experience Budget Experience Proposed Adjustments<br />
For Year For Year 2006-07 by by<br />
2005-06 2006-07 Estimated <strong>City</strong> Manager <strong>City</strong> Commission<br />
Equipment<br />
1 - Electric High Lift Replacement 25,000<br />
25,000<br />
PERSONNEL<br />
Current Proposed Pay Salary<br />
POSITION TITLE Budget Budget Grade Range<br />
MAINTENANCE:<br />
Facilities Maintenance Manager 1 1 65 61,630 - 93,330<br />
Facilities Maintenance Supervisor 1 1 56 49,504 - 74,922<br />
Facilities Project Coordinator 1 1 54 47,133 - 71,365<br />
Maintenance Electrician 1 1 49 41,725 - 63,190<br />
Security Specialist 1 1 45 37,835 - 57,304<br />
Maintenance Mechanic III 2 43 36,026 - 54,579<br />
Maintenance Mechanic II 6 5 38 31,907 - 48,298<br />
Painter 3 3 33 28,246 - 42,765<br />
Administrative Assistant 1 1 33 28,246 - 42,765<br />
Maintenance Mechanic I 4 2 33 28,246 - 42,765<br />
Account Clerk III 1 1 29 25,605 - 38,771<br />
Operations Support Tech I 1 1 24 22,693 - 34,320<br />
JANITORIAL:<br />
Custodian Supervisor 1 1 31 26,894 - 40,726<br />
Custodian Foreman 2 2 27 24,398 - 36,941<br />
Operations Support Worker II 1 1 18 19,594 - 29,661<br />
Janitorial Lead 2 2 16 18,658 - 28,246<br />
Operations Support Worker I 26 26 14 17,763 - 26,894<br />
FIRE SAFETY TEAM:<br />
Fire Suppression System Foreman 1 53 45,989 - 69,659<br />
Fire Suppression System Tech II 2 47 39,749 - 60,174<br />
TOTAL FULL-TIME POSITIONS 53 55<br />
PART-TIME<br />
Operations Support Worker I 1 1<br />
TOTAL PART-TIME POSITIONS 1 1<br />
E – 114
REVENUE AND EXPENDITURE SUMMARY<br />
INFORMATION TECHNOLOGY<br />
Experience Budget Experience 2007-08<br />
For Year For Year 2006-07 Proposed by<br />
EXPENSES 2005-06 2006-07 Estimated <strong>City</strong> Manager<br />
Personnel<br />
Salaries and Wages 3,594,024 4,528,785 4,138,150 4,680,329<br />
Fringe Benefits 809,223 1,039,071 909,933 1,161,947<br />
Total Personnel 4,403,247 5,567,856 5,048,083 5,842,276<br />
Non-Personnel<br />
Internal Service Charges 868,869 1,153,177 1,138,007 1,185,408<br />
Pr<strong>of</strong>essional and Contractual 371,933 339,177 465,183 565,594<br />
Utilities 145,429 185,692 177,345 187,180<br />
Insurance and Fixed Charges 139,870 159,592 124,457 153,218<br />
All Other Operations and Maintenance 1,772,900 2,254,761 2,057,367 2,532,199<br />
Capital Outlay 2,349,606 3,136,338 2,839,935 2,179,168<br />
Debt Service<br />
Total Non-Personnel 5,648,607 7,228,737 6,802,294 6,802,767<br />
Total Expenditures 10,051,854 12,796,593 11,850,377 12,645,043<br />
Transfers<br />
Transfers In<br />
Transfers Out<br />
Net Transfers<br />
Revenue Sources<br />
Taxes<br />
Licenses and Permits<br />
Intergovernmental<br />
Charges for Services 10,368,137 10,936,500 10,961,733 10,548,852<br />
Interest Income 74,765 50,000 141,965 83,852<br />
All Other Revenue 1,177,894 950,477 950,477 875,479<br />
Total Revenue 11,620,796 11,936,977 12,054,175 11,508,183<br />
Funding to be Provided (1,568,942) 859,616 (203,798) 1,136,860<br />
E – 115
INFORMATION TECHNOLOGY<br />
BUDGET FOR YEAR 2007-08<br />
Experience Budget Experience Proposed Adjustments<br />
For Year For Year 2006-07 by by<br />
2005-06 2006-07 Estimated <strong>City</strong> Manager <strong>City</strong> Commission<br />
REVENUES<br />
MISCELLANEOUS REVENUE<br />
Interest Earnings<br />
Interest on Pooled Investment 74,765 50,000 141,965 83,852 ___________<br />
SUB-TOTAL 74,765 50,000 141,965 83,852<br />
Sales <strong>of</strong> Surplus Materials and Scrap<br />
Surplus Furniture and Equip. Sales 14,250<br />
Insurance Proceeds 1,673<br />
Refund <strong>of</strong> Prior Year Expenses 1,187<br />
SUB-TOTAL 17,110<br />
TOTAL MISCELLANEOUS REVENUE 91,875 50,000 141,965 83,852<br />
INTRAGOVERNMENTAL SERVICES<br />
Radio<br />
General Fund 265,239 265,239 271,064 ___________<br />
Community Development Fund<br />
643 ___________<br />
Fleet Management Fund 3,029 3,029 2,894 ___________<br />
Purchasing & Stores Fund 3,366 3,366 3,215 ___________<br />
Facilities Maintenance Fund 1,346 1,346 1,286 ___________<br />
Information Technology Fund 2,700 2,700 2,572 ___________<br />
Parking Fund 360 360 322 ___________<br />
<strong>Lakeland</strong> Linder Regional Airport Fund 4,376 4,376 4,180 ___________<br />
Solid Waste Fund 17,503 17,503 16,720 ___________<br />
Wastewater Utility Fund 17,503 17,503 18,971 ___________<br />
Water Utility Fund 28,611 28,611 32,476 ___________<br />
Electric Utility Fund 130,570 130,570 126,047 ___________<br />
Reimbursements - Communications 451,236<br />
Reimbursements-Administration 667<br />
Reimbursements-Radio communications 5,602<br />
SUB-TOTAL 456,838 474,603 475,270 480,390<br />
Telecommunications<br />
Telephone 679,809 24,566<br />
General Fund 226,938 226,938 264,501 ___________<br />
Community Development Fund 1,979 1,979 2,276 ___________<br />
Fleet Management Fund 5,848 5,848 7,285 ___________<br />
Purchasing & Stores Fund 7,519 7,519 9,197 ___________<br />
Facilities Maintenance Fund 5,209 5,209 6,449 ___________<br />
Information Technology Fund 42,480 42,480 48,247 ___________<br />
Parking Fund 234 234 310 ___________<br />
<strong>Lakeland</strong> Center Fund 38,979 38,979 47,085 ___________<br />
Solid Waste Fund 5,283 5,283 6,078 ___________<br />
Wastewater Utility Fund 10,584 10,584 8,912 ___________<br />
Water Utility Fund 19,788 19,788 26,317 ___________<br />
Electric Utility Fund 892,376 1,114,144 1,114,144 311,029 ___________<br />
SUB-TOTAL 1,572,185 1,478,985 1,503,551 737,686<br />
E – 116
INFORMATION TECHNOLOGY<br />
BUDGET FOR YEAR 2007-08<br />
Experience Budget Experience Proposed Adjustments<br />
For Year For Year 2006-07 by by<br />
2005-06 2006-07 Estimated <strong>City</strong> Manager <strong>City</strong> Commission<br />
Application Development & Support<br />
General Fund 1,512,518 1,771,790 1,771,790 1,250,700 ___________<br />
Information Technology Fund 166,525 166,525 158,320 ___________<br />
Telecommunications 115,606 115,606 108,727 ___________<br />
Facilities Maintenance Fund 19,807 21,293 21,293 15,266 ___________<br />
Fleet Management Fund 8,993 9,668 9,668<br />
Purchasing & Stores Fund 55,888 65,406 65,406 56,515 ___________<br />
Cleveland Heights Golf Course Fund 11,722 11,405 11,405 10,458 ___________<br />
Parking Fund 1,786 2,627 2,627 2,393 ___________<br />
<strong>Lakeland</strong> Center Fund 20,800 44,088 44,088 23,018 ___________<br />
<strong>Lakeland</strong> Linder Regional Airport Fund 5,078 11,474 11,474 9,109 ___________<br />
Solid Waste Fund 14,408 11,330 11,330 10,286 ___________<br />
Wastewater Utility Fund 164,212 104,910 104,910 91,160 ___________<br />
Water Utility Fund 163,073 117,833 117,833 109,725 ___________<br />
Electric Utility Fund 1,808,981 2,252,407 2,252,407 2,693,607 ___________<br />
SUB-TOTAL 3,787,266 4,706,362 4,706,362 4,539,284<br />
Network Administration & Support<br />
Community Development Fund 6,680 ___________<br />
General Fund 371,572 371,572 616,658 ___________<br />
Information Technology Fund 50,414 50,414 75,694 ___________<br />
Telecommunications 8,027 8,027 11,807 ___________<br />
Facilities Maintenance Fund 3,097 3,097 6,162 ___________<br />
Fleet Management Fund 5,050 5,050 10,689 ___________<br />
Purchasing & Stores Fund 10,674 10,674 17,519 ___________<br />
Cleveland Heights Golf Course Fund 1,684 1,684 3,340 ___________<br />
Parking Fund 571 571 668 ___________<br />
<strong>Lakeland</strong> Center Fund 13,892 13,892 24,867 ___________<br />
<strong>Lakeland</strong> Linder Regional Airport Fund 5,052 5,052 8,208 ___________<br />
Solid Waste Fund 3,789 3,789 6,012 ___________<br />
Wastewater Utility Fund 21,198 21,198 28,876 ___________<br />
Water Utility Fund 23,995 23,995 49,125 ___________<br />
Electric Utility Fund 246,789 246,789 398,071 ___________<br />
Network Connections 1,588,526<br />
SUB-TOTAL 1,588,526 765,804 765,804 1,264,376<br />
E – 117
INFORMATION TECHNOLOGY<br />
BUDGET FOR YEAR 2007-08<br />
Experience Budget Experience Proposed Adjustments<br />
For Year For Year 2006-07 by by<br />
2005-06 2006-07 Estimated <strong>City</strong> Manager <strong>City</strong> Commission<br />
PC Support<br />
Community Development Fund 7,100 ___________<br />
General Fund 635,135 635,135 483,540 ___________<br />
Information Technology Fund 73,954 73,954 70,294 ___________<br />
Telecommunications 13,051 13,051 12,071 ___________<br />
Facilities Maintenance Fund 5,075 5,075 6,390 ___________<br />
Fleet Management Fund 8,700 8,700 11,361 ___________<br />
Purchasing & Stores Fund 17,401 17,401 17,751 ___________<br />
Cleveland Heights Golf Course Fund 8,700 8,700 8,520 ___________<br />
Parking Fund 725 725 710 ___________<br />
<strong>Lakeland</strong> Center Fund 23,201 23,201 25,561 ___________<br />
<strong>Lakeland</strong> Linder Regional Airport Fund 8,700 8,700 8,523 ___________<br />
Solid Waste Fund 6,525 6,525 6,390 ___________<br />
Wastewater Utility Fund 33,352 33,352 27,692 ___________<br />
Water Utility Fund 41,327 41,327 51,807 ___________<br />
Electric Utility Fund 406,025 406,025 408,983 ___________<br />
Support Services 1,036,699<br />
SUB-TOTAL 1,036,699 1,281,871 1,281,871 1,146,693<br />
PC Rental<br />
Community Development Fund 1,840 ___________<br />
General Fund 247,197 247,197 239,686 ___________<br />
Information Technology Fund 75,241 75,241 59,333 ___________<br />
Telecommunications 10,583 10,583 7,555 ___________<br />
Facilities Maintenance Fund 2,610 2,610 3,076 ___________<br />
Fleet Management Fund 3,818 3,818 4,304 ___________<br />
Purchasing & Stores Fund 8,361 8,361 8,529 ___________<br />
Cleveland Heights Golf Course Fund 2,309 2,309 1,780 ___________<br />
Parking Fund 380 380 493 ___________<br />
<strong>Lakeland</strong> Center Fund 11,013 11,013 10,641 ___________<br />
<strong>Lakeland</strong> Linder Regional Airport Fund 4,486 4,486 4,067 ___________<br />
Solid Waste Fund 3,595 3,595 2,496 ___________<br />
Wastewater Utility Fund 21,596 21,596 20,028 ___________<br />
Water Utility Fund 22,888 22,888 26,999 ___________<br />
Electric Utility Fund 270,606 270,606 244,047 ___________<br />
PC Rental 677,861<br />
SUB-TOTAL 677,861 684,683 684,683 634,874<br />
GIS<br />
General Fund 132,261 139,688 139,688 194,351 ___________<br />
Information Technology Fund 7,003 7,003 6,321 ___________<br />
Telecommunications 1,760 1,760 6,395 ___________<br />
Wastewater Utility Fund 51,754 42,782 42,782 33,576 ___________<br />
Water Utility Fund 51,754 46,000 46,000 43,169 ___________<br />
Electric Utility Fund 355,998 441,843 441,843 425,625 ___________<br />
SUB-TOTAL 591,767 679,076 679,076 709,437<br />
E – 118
INFORMATION TECHNOLOGY<br />
BUDGET FOR YEAR 2007-08<br />
Experience Budget Experience Proposed Adjustments<br />
For Year For Year 2006-07 by by<br />
2005-06 2006-07 Estimated <strong>City</strong> Manager <strong>City</strong> Commission<br />
Public Safety<br />
General Fund-Police 644,093 828,018 828,018 981,112 ___________<br />
SUB-TOTAL 644,093 828,018 828,018 981,112<br />
GIS Upgrade<br />
General Fund 3,226 9,506 9,506<br />
Wastewater Utility Fund 1,290 3,692 3,692<br />
Water Utility Fund 1,290 3,692 3,692<br />
Electric Utility Fund 7,096 20,208 20,208<br />
SUB-TOTAL 12,902 37,098 37,098<br />
Special project<br />
Ums Oracle Database Partitioning Licenses 55,000 ___________<br />
SUB-TOTAL 55,000<br />
TOTAL INTRAGOVERNMENTAL<br />
SERVICES 10,368,137 10,936,500 10,961,733 10,548,852<br />
OPERATING SUBSIDIES<br />
Interfund Transfers<br />
Radio System Expansion 476,375 476,375 476,375 476,375 ___________<br />
Standard (Type II) Radio Replacements 100,000 100,000 100,000 ___________<br />
Public Improvement Fund 125,000<br />
Public Improvement Fund - 99 Sunshine 181,860 174,102 174,102 174,104 ___________<br />
Public Improvement Fund - LPD<br />
Laptops & Servers 252,549 200,000 200,000 125,000 ___________<br />
Electric Utility Fund 125,000<br />
TOTAL OPERATING SUBSIDIES 1,160,784 950,477 950,477 875,479<br />
TOTAL REVENUE 11,620,796 11,936,977 12,054,175 11,508,183<br />
PRIOR YEAR SURPLUS (1,412,841) 859,616 (203,798) 1,136,860<br />
GRAND TOTAL REVENUES 10,207,955 12,796,593 11,850,377 12,645,043<br />
E – 119
INFORMATION TECHNOLOGY<br />
BUDGET FOR YEAR 2007-08<br />
Experience Budget Experience Proposed Adjustments<br />
For Year For Year 2006-07 by by<br />
2005-06 2006-07 Estimated <strong>City</strong> Manager <strong>City</strong> Commission<br />
EXPENSES<br />
ADMINISTRATION<br />
PERSONAL SERVICES 666,656 886,220 846,710 743,906<br />
OPERATING EXPENSES<br />
Auto Allowance 4,814 4,800 5,400 5,400 ___________<br />
Retiree Health Insurance Subsidy 52,166 54,050 54,050 56,939 ___________<br />
Insurance- Fire 3,381 4,116 2,957 9,988 ___________<br />
Insurance - Position Bond 363 1,048 1,048 435 ___________<br />
Insurance - Data Processing Equipment 31,184 53,466 30,402 44,326 ___________<br />
Self Insurance Service 52,776 46,912 36,000 41,530 ___________<br />
General Fund Service 205,455 227,605 227,605 242,494 ___________<br />
Purchasing & Stores Service 28,826 30,614 30,614 33,063 ___________<br />
Intra-Dept Charges - Computer Rental 26,888 22,811 22,811 20,856 ___________<br />
Intra-Dept Charges - IT 173,528 173,528 164,641 ___________<br />
Intra-Dept Charges - Telephone 4,402 4,274 4,274 4,537 ___________<br />
Electric Utility Charges 200,000 224,416 224,416 249,253 ___________<br />
Intra-Dept Charges - Facilities 4,776<br />
Intra-Dept Charges - Janitorial 4,877<br />
Intra-Dept Charges - Training 3,794 ___________<br />
Insurance Consultant 1,183 661 661 1,219 ___________<br />
Annual Audit 3,051 2,500 2,302 2,371 ___________<br />
Contractual Services 67<br />
Advertising 3,223 5,100 4,000 5,100 ___________<br />
Office Supplies 274 2,550 2,150 2,550 ___________<br />
Equipment - Noncapital 2,281 25,282 25,000 1,020 ___________<br />
Repair <strong>of</strong> Equipment 1,530 1,258 1,530 ___________<br />
Printing & Photography 14 102 30 102 ___________<br />
Postage 99 75 125 75 ___________<br />
Materials 553<br />
Subscriptions & Memberships 259 962 665 665 ___________<br />
Telephone, Communications 1,022 1,710 1,626 1,725 ___________<br />
Travel 228 1,530 1,000 1,530 ___________<br />
Training 11,472 12,446 12,000 11,500 ___________<br />
All Other Sundry Charges 444 168 135 168 ___________<br />
SUB-TOTAL 644,078 902,256 864,057 906,811<br />
TOTAL 1,310,734 1,788,476 1,710,767 1,650,718<br />
E – 120
INFORMATION TECHNOLOGY<br />
BUDGET FOR YEAR 2007-08<br />
Experience Budget Experience Proposed Adjustments<br />
For Year For Year 2006-07 by by<br />
2005-06 2006-07 Estimated <strong>City</strong> Manager <strong>City</strong> Commission<br />
RADIO COMMUNICATIONS<br />
PERSONAL SERVICES 162,880 168,441 167,058 188,812<br />
OPERATING EXPENSES<br />
Rental / Fleet Equipment 2,487 1,138 1,138 1,203 ___________<br />
Gasoline / Fleet Equipment 1,823 2,914 1,809 825 ___________<br />
Maintenance / Fleet Equipment 1,432 1,279 990 908 ___________<br />
Electric Utility Service 21,632 21,287 18,447 19,731 ___________<br />
Intra-Dept Charges - Computer Rental 5,403 4,437 4,437 4,907 ___________<br />
Intra-Dept Charges - Telephone 1,623 1,623 1,623 1,868 ___________<br />
Intra-Dept Charges - Facilities 5,227 5,931 5,931 8,077 ___________<br />
Intra-Dept Charges - Janitorial 2,608 2,952 2,952 2,773 ___________<br />
Contractual Services 720 2,550 2,550 2,550 ___________<br />
Office Supplies 363 341 350 341 ___________<br />
Equipment - Noncapital 3,771 765 765 765 ___________<br />
All Other Material & Supplies 88 96 55 100 ___________<br />
Uniforms 240 256 256 256 ___________<br />
Tools & Implements 718 504 500 204 ___________<br />
Parts For Equipment 37,195 50,900 46,368 46,000 ___________<br />
Repair <strong>of</strong> Equipment 124,075 131,147 125,540 131,147 ___________<br />
Postage 233 26 26 25 ___________<br />
Subscriptions & Memberships 538 655 655 605 ___________<br />
Materials 1,000 766<br />
Telephone, Communications 882 882 832 585 ___________<br />
Travel 1,126 1,545 1,000 1,545 ___________<br />
Training 4,545 3,276 1,638 3,276 ___________<br />
SUB-TOTAL 216,729 235,504 218,628 227,690<br />
TOTAL 379,609 403,945 385,686 416,502<br />
E – 121
INFORMATION TECHNOLOGY<br />
BUDGET FOR YEAR 2007-08<br />
Experience Budget Experience Proposed Adjustments<br />
For Year For Year 2006-07 by by<br />
2005-06 2006-07 Estimated <strong>City</strong> Manager <strong>City</strong> Commission<br />
TELECOMMUNICATIONS<br />
PERSONAL SERVICES 717,776 882,498 882,126 992,913<br />
OPERATING EXPENSES<br />
Rental / Fleet Equipment 26,582 16,979 16,979 17,619 ___________<br />
Gasoline / Fleet Equipment 10,331 13,731 9,262 12,094 ___________<br />
Maintenance / Fleet Equipment 8,597 26,345 17,332 19,213 ___________<br />
Electric Utility Service 1,035 1,055 985 1,028 ___________<br />
Solid Waste Service 57 60 52 65 ___________<br />
Utility Billing Service 7,200<br />
Intra-Dept Charges - PC Rental 38,379 31,661 31,661 31,433 ___________<br />
Intra-Dept Charges - Telephone 14,309 14,260 14,260 16,853 ___________<br />
Intra-Dept Charges - Radios 2,672 2,693 2,693 2,572 ___________<br />
Intra-Dept Charges - Facilities 456 517 517<br />
Intra-Dept Charges - Janitorial 466 527 527 4,780 ___________<br />
Intra-Dept Charges - IT 117,366 117,366 115,120 ___________<br />
Contractual Services (16) 2,550 500 2,550 ___________<br />
Office Supplies 1,131 2,030 1,500 1,530 ___________<br />
Equipment - Noncapital 1,399 2,550 2,550 2,550 ___________<br />
All Other Material & Supplies 3,224 9,700 4,114 3,060 ___________<br />
Uniforms 1,552 1,398 1,398 1,581 ___________<br />
Parts For Equipment 547 1,020 1,018 1,020 ___________<br />
Materials 5,410 3,060 2,414 9,000 ___________<br />
Tools & Implements 175 1,224 1,224 1,224 ___________<br />
Repair <strong>of</strong> Equipment 5,171 2,500 2,500 2,500 ___________<br />
Postage 799 402 512 400 ___________<br />
Subscriptions & Memberships 4,781 1,276 1,276 1,276 ___________<br />
Telephone, Communications 3,418 4,842 2,904 4,876 ___________<br />
Travel 20 965 500 965 ___________<br />
Training 2,943 16,288 10,000 16,288 ___________<br />
All Other Sundry Charges 204 130 204 ___________<br />
SUB-TOTAL 133,438 282,403 244,174 269,800<br />
TOTAL 851,214 1,164,901 1,126,300 1,262,713<br />
E – 122
INFORMATION TECHNOLOGY<br />
BUDGET FOR YEAR 2007-08<br />
Experience Budget Experience Proposed Adjustments<br />
For Year For Year 2006-07 by by<br />
2005-06 2006-07 Estimated <strong>City</strong> Manager <strong>City</strong> Commission<br />
APPLICATION DEVELOPMENT AND SUPPORT<br />
PERSONAL SERVICES 1,363,470 1,856,613 1,477,049 2,086,021<br />
OPERATING EXPENSES<br />
Intra-Dept Charges - Computer Rental 93,602 72,088 72,088 69,198 ___________<br />
Intra-Dept Charges - Telephone 6,847 6,103 6,103 6,543 ___________<br />
Intra-Dept Charges - Facilities 9,250<br />
Intra-Dept Charges - Janitorial 9,445<br />
Water Utility Service 375<br />
Electric Utility Service 17,532<br />
Wastewater Utility Service 374<br />
Solid Waste Service 736<br />
Contractual Services 10,922 42,052 102,052 65,000 ___________<br />
Advertising 395 1,500 1,000 1,500 ___________<br />
Office Supplies 3,642 3,000 2,000 3,000 ___________<br />
Equipment - Noncapital 2,994 1,025 1,025 1,025 ___________<br />
Computer S<strong>of</strong>tware 55 2,500 2,500 2,500 ___________<br />
Repair <strong>of</strong> Equipment 309 510 250 510 ___________<br />
Printing & Photography 102 25 75 ___________<br />
Postage 19 26 15 25 ___________<br />
Parts for Equipment 1,010<br />
Subscriptions & Memberships 982 510 400 510 ___________<br />
Telephone, Communications 1,396 4,575 3,000 6,005 ___________<br />
Travel 3,213 3,570 1,785 3,570 ___________<br />
Training 27,678 40,003 30,656 25,003 ___________<br />
All Other Sundry Charges 55 398 250 398 ___________<br />
S<strong>of</strong>tware License & Maintenance 654,130 857,426 730,000 753,240 ___________<br />
SUB-TOTAL 843,951 1,035,388 954,159 938,102<br />
TOTAL 2,207,421 2,892,001 2,431,208 3,024,123<br />
E – 123
INFORMATION TECHNOLOGY<br />
BUDGET FOR YEAR 2007-08<br />
Experience Budget Experience Proposed Adjustments<br />
For Year For Year 2006-07 by by<br />
2005-06 2006-07 Estimated <strong>City</strong> Manager <strong>City</strong> Commission<br />
NETWORK ADMINISTRATION & SUPPORT<br />
PERSONAL SERVICES 530,907 576,846 595,370 621,592<br />
OPERATING EXPENSES<br />
Rental / Fleet Equipment 3,888 2,059 2,059 2,175 ___________<br />
Gasoline / Fleet Equipment 933 1,627 697 1,493 ___________<br />
Maintenance / Fleet Equipment 313 146 5,150 61 ___________<br />
Water Utility Service 446 339 341 ___________<br />
Electric Utility Service 18,022 17,026 19,003 ___________<br />
Wastewater Utility Service 483 382 411 ___________<br />
Solid Waste Service 811 744 855 ___________<br />
Intra-Dept Charges - Computer Rental 55,858 47,059 47,059 51,158 ___________<br />
Intra-Dept Charges - Telephone 10,982 9,628 9,628 9,543 ___________<br />
Intra-Dept Charges - Facilities 6,168 6,168 8,401 ___________<br />
Intra-Dept Charges - Janitorial 6,284 6,284 5,902 ___________<br />
Contractual Services 348,770 224,658 224,658 235,604 ___________<br />
Office Supplies 573 1,363 1,363 1,100 ___________<br />
Equipment - Noncapital 23,222 51,000 51,000 51,000 ___________<br />
All Other Material & Supplies 861 3,060 3,060 3,060 ___________<br />
Materials - Default Purchasing Card 5,798<br />
Uniforms 915 1,020 1,020 1,020 ___________<br />
Computer S<strong>of</strong>tware 1,006 10,000 10,000 5,000 ___________<br />
Parts For Equipment 35,131 8,241 21,065 8,241 ___________<br />
Repair <strong>of</strong> Equipment 16,325 79,973 55,000 60,000 ___________<br />
Postage 184 200 225 100 ___________<br />
Subscriptions & Memberships 100 100 ___________<br />
Telephone, Communications 3,876 4,676 4,600 6,907 ___________<br />
Travel 24 702 702 702 ___________<br />
Training 11,346 12,155 9,600 12,155 ___________<br />
All Other Sundry Charges 120 80 120 ___________<br />
S<strong>of</strong>tware License & Maintenance 124,683 200,399 178,000 183,388 ___________<br />
SUB-TOTAL 644,688 690,300 656,009 667,840<br />
TOTAL 1,175,595 1,267,146 1,251,379 1,289,432<br />
E – 124
INFORMATION TECHNOLOGY<br />
BUDGET FOR YEAR 2007-08<br />
Experience Budget Experience Proposed Adjustments<br />
For Year For Year 2006-07 by by<br />
2005-06 2006-07 Estimated <strong>City</strong> Manager <strong>City</strong> Commission<br />
PC SUPPORT<br />
PERSONAL SERVICES 409,747 531,875 475,311 535,848<br />
OPERATING EXPENSES<br />
Rental / Fleet Equipment 2,890 2,199 2,199 2,026 ___________<br />
Gasoline / Fleet Equipment 747 1,493 752 1,389 ___________<br />
Maintenance / Fleet Equipment 579 493 264 320 ___________<br />
Intra-Dept Charges - Computer Rental 33,086 27,421 32,329 28,846 ___________<br />
Intra-Dept Charges - Telephone 4,441 4,381 4,381 5,213 ___________<br />
Recoveries From Other Funds (7,816) (23,160)<br />
Contractual Services 3,344 1,356 17,810<br />
Office Supplies 2,648 1,020 1,686 1,020 ___________<br />
Equipment - Noncapital 15,786 10,000 13,079 8,000 ___________<br />
Materials 19<br />
All Other Material & Supplies 2,466 4,000 1,200 3,000 ___________<br />
Uniforms 920 1,148 1,148 1,272 ___________<br />
Computer S<strong>of</strong>tware 224 13,668 2,500 800 ___________<br />
Parts For Equipment 18,724 30,000 21,000 25,000 ___________<br />
Repair <strong>of</strong> Equipment 335 21,734 21,734 23,700 ___________<br />
Postage 106 200 100 100 ___________<br />
Subscriptions & Memberships 250 125 250 ___________<br />
Telephone, Communications 3,082 3,759 4,000 5,609 ___________<br />
Training 1,004 13,793 5,000 13,793 ___________<br />
Travel 8 877 600 877 ___________<br />
All Other Sundry Charges 135 104 135 ___________<br />
S<strong>of</strong>tware License & Maintenance 365,824 238,833 317,026 407,707 ___________<br />
SUB-TOTAL 448,398 376,760 423,896 529,058<br />
TOTAL 858,145 908,635 899,207 1,064,906<br />
E – 125
INFORMATION TECHNOLOGY<br />
BUDGET FOR YEAR 2007-08<br />
Experience Budget Experience Proposed Adjustments<br />
For Year For Year 2006-07 by by<br />
2005-06 2006-07 Estimated <strong>City</strong> Manager <strong>City</strong> Commission<br />
GIS<br />
PERSONAL SERVICES 248,915 288,590 289,425 323,543<br />
OPERATING EXPENSES<br />
Rental / Fleet Equipment 2,917 1,565 1,565 1,653 ___________<br />
Gasoline / Fleet Equipment 670 1,543 552 1,135 ___________<br />
Maintenance / Fleet Equipment 567 115 37 ___________<br />
Intra-Dept Charges - Computer Rental 18,318 14,835 14,835 16,874 ___________<br />
Intra-Dept Charges - Telephone 1,168 1,170 1,170 1,913 ___________<br />
Office Supplies 1,564 852 500 850 ___________<br />
Equipment - Noncapital 229 2,550 2,000 2,000 ___________<br />
All Other Material & Supplies 271 1,020 900 1,000 ___________<br />
Computer S<strong>of</strong>tware 5,100 4,500 4,500 ___________<br />
Parts For Equipment 830 2,040 1,800 2,000 ___________<br />
Repair <strong>of</strong> Equipment 623 2,040 1,900 2,000 ___________<br />
Postage 21 26 26 10 ___________<br />
Subscriptions & Memberships 343 306 300 300 ___________<br />
Telephone, Communications 195 500 450 500 ___________<br />
Travel 439 250 430 ___________<br />
Training 5,306 8,191 7,000 8,000 ___________<br />
Uniforms 457 625 625 640 ___________<br />
All Other Sundry Charges 33 77 55 75 ___________<br />
Recoveries-other funds (1,750)<br />
S<strong>of</strong>tware License & Maintenance 70,370 140,249 125,000 147,011 ___________<br />
SUB-TOTAL 102,132 183,243 163,428 190,928<br />
TOTAL 351,047 471,833 452,853 514,471<br />
PUBLIC SAFETY<br />
PERSONAL SERVICES 302,896 376,773 315,034 349,641<br />
OPERATING EXPENSES<br />
Intra-Dept Charges - Computer Rental 13,579 10,958 10,958 11,179 ___________<br />
Intra-Dept Charges - Telephone 1,170 1,041 1,041 1,467 ___________<br />
Equipment - Noncapital 856<br />
S<strong>of</strong>tware License & Maintenance 95,612 82,831 82,000 81,060 ___________<br />
Contractual Services 56,250 107,500 249,700 ___________<br />
Office Supplies 303 351 350 351 ___________<br />
Computer S<strong>of</strong>tware 3,020 3,000<br />
Parts For Equipment 6,342 15,300 15,000 15,000 ___________<br />
Repair <strong>of</strong> Equipment 4,070 18,245 18,000 19,000 ___________<br />
Subscriptions & Memberships 753 753 753 ___________<br />
Travel 948 1,326 1,200 1,326 ___________<br />
Telephone, Communications 90,611 122,584 122,584 119,539 ___________<br />
Training 3,508 8,191 7,000 8,191 ___________<br />
SUB-TOTAL 216,999 320,850 369,386 507,566<br />
TOTAL 519,895 697,623 684,420 857,207<br />
E – 126
INFORMATION TECHNOLOGY<br />
BUDGET FOR YEAR 2007-08<br />
Experience Budget Experience Proposed Adjustments<br />
For Year For Year 2006-07 by by<br />
2005-06 2006-07 Estimated <strong>City</strong> Manager <strong>City</strong> Commission<br />
CAPITAL OUTLAY<br />
Loss on Disposal <strong>of</strong> Fixed Assets 156,101<br />
Equipment - Radio Communications 34,900 13,000 13,000 13,000 ___________<br />
Equipment - Network Admin. 450,085 789,450 500,000 513,000 ___________<br />
Equipment - GIS 1,750<br />
SUB-TOTAL 642,836 802,450 513,000 526,000<br />
SPECIAL PROJECTS<br />
Vulnerability Assessment 15,000 16,000 10,000 ___________<br />
Security Management 2,956 17,361 19,288 137,470 ___________<br />
Radio System Upgrade 194,583 181,055 174,102 174,104 ___________<br />
Radio System-Public Safety 476,375 476,375 476,375 476,375 ___________<br />
Florida Southern College WIFI Network 208<br />
GIS Upgrade 16,454 33,546 33,546<br />
Telephone Switch Maintenance 238,611 299,208 299,208 251,964 ___________<br />
LPD Laptops and Servers 252,549 200,000 200,000 125,000 ___________<br />
Standard (Type II) Radio Replacements 100,000 100,000 100,000 ___________<br />
PC Replacements 552,883 820,806 820,806 395,725 ___________<br />
IDS Consolidation 22,502<br />
CTC5201 FDOT LAP ATMS Fiber Network 106,033<br />
CIS5105 Wiring Upgrade 2,111 22,889 22,889<br />
CDO5006 ISS LAN Systems 562<br />
CIS4005 GIS/CAD Replacement 97,349 97,349<br />
U&CF-Tree Inventory-Northside 8,612 8,612<br />
U&CF-Tree Inventory-Southside 28,559 28,559<br />
Maximo Upgrade 65,489 65,489<br />
Aerial Photography 33,334 33,334 33,334 ___________<br />
Lpd Firewall 30,000 ___________<br />
Web Application Firewall 50,000 ___________<br />
Ups Replacement (<strong>City</strong> Hall) 100,000 ___________<br />
It Architecture Study 100,000 ___________<br />
Ums Oracle Database Partitioning Licenses 55,000 ___________<br />
TOTAL SPECIAL PROJECTS 1,865,827 2,399,583 2,395,557 2,038,972<br />
CONTRIBUTIONS TO OTHER FUNDS<br />
General Fund 14,279<br />
Electric Utility Fund 31,353<br />
TOTAL 45,632<br />
GRAND TOTAL EXPENSES 10,207,955 12,796,593 11,850,377 12,645,043<br />
E – 127
INFORMATION TECHNOLOGY<br />
BUDGET FOR YEAR 2007-08<br />
Experience Budget Experience Proposed Adjustments<br />
For Year For Year 2006-07 by by<br />
2005-06 2006-07 Estimated <strong>City</strong> Manager <strong>City</strong> Commission<br />
Equipment<br />
1 - Trunked Transmitter New 13,000<br />
Network Equipment Replacement 513,000<br />
526,000<br />
PERSONNEL Current Proposed Annual<br />
Budget Budget Pay Grade Range<br />
ADMINISTRATION<br />
Director <strong>of</strong> Information Technology 1 1 PB3 *<br />
Assistant Director <strong>of</strong> Information Technology 1 1 PB5 *<br />
Program Manager 1 1 65 61,630 - 93,330<br />
IT Operations Manager 1 1 63 58,718 - 88,899<br />
Information Security Officer 1 1 63 58,718 - 88,899<br />
Project Manager 1 1 51 43,805 - 64,730<br />
IT Inventory Specialist 1 1 36 30,389 - 45,989<br />
Administrative Assistant 1 1 33 28,246 - 42,765<br />
Account Clerk IV 2 2 33 28,246 - 42,765<br />
Account Clerk III 1 1 29 25,605 - 38,771<br />
COMMUNICATIONS<br />
Radio Communications System Supervisor 1 1 60 54,579 - 82,618<br />
Senior Simulcast System Specialist 1 1 54 47,133 - 71,365<br />
TELECOMMUNICATIONS<br />
Telecomm Engineering Supervisor 1 1 67 64,730 - 98,010<br />
Engineer III 1 1 67 64,730 - 98,010<br />
Fiber Optics Supervisor 1 1 63 58,718 - 88,899<br />
Chief Electronics/Relay Technician 1 1 60 54,579 - 82,618<br />
Fiber Optics Specialist 1 1 56 49,504 - 74,922<br />
Electronics/Relay Technician 3 3 54 47,133 - 71,365<br />
Fiber Operations Technician 1 1 54 47,133 - 71,365<br />
Telecommunications Service Coordinator 2 2 47 39,749 - 60,174<br />
E – 128
INFORMATION TECHNOLOGY<br />
BUDGET FOR YEAR 2007-08<br />
Experience Budget Experience Proposed Adjustments<br />
For Year For Year 2006-07 by by<br />
2005-06 2006-07 Estimated <strong>City</strong> Manager <strong>City</strong> Commission<br />
APPLICATION DEVELOPMENT AND SUPPORT . .<br />
Systems & Programming Administrator 2 2 63 58,718 - 88,899<br />
Database Manager 1 1 63 58,718 - 88,899<br />
Systems Analyst 5 5 60 54,579 - 82,618<br />
Programmer III 7 7 58 51,979 - 78,666<br />
Database Administrator II 3 3 58 51,979 - 78,666<br />
Programmer II 3 3 54 47,133 - 71,365<br />
Programmer I 4 4 49 41,725 - 63,190<br />
NETWORK ADMINISTRATION & SUPPORT<br />
Network Administrator 1 1 63 58,718 - 88,899<br />
Systems Analyst 1 1 60 54,579 - 82,618<br />
Network Technician 4 4 54 47,133 - 71,365<br />
IT Support Specialist I 2 2 40 33,509 - 50,710<br />
PC SUPPORT<br />
IT Support Administrator 1 1 54 47,133 - 71,365<br />
IT Support Specialist III 2 2 49 41,725 - 63,190<br />
IT Support Specialist II 3 3 45 37,835 - 57,304<br />
IT Support Specialist I 3 3 40 33,509 - 50,710<br />
GIS<br />
GIS Technician II 4 4 49 41,725 - 63,190<br />
GIS Technician I 1 1 44 36,941 - 55,910<br />
PUBLIC SAFETY<br />
Public Safety IT Manager 1 1 63 58,718 - 88,899<br />
Programmer III 1 1 58 51,979 - 78,666<br />
Network Technician 1 1 54 47,133 - 71,365<br />
IT Support Specialist III 1 1 49 41,725 - 63,190<br />
Programmer I 1 1 49 41,725 - 63,190<br />
TOTAL FULL-TIME EMPLOYEES 76 76<br />
E – 129
THIS PAGE IS INTENTIONALLY BLANK<br />
E-130 Fiscal Year <strong>2008</strong> Annual Budget
REVENUE AND EXPENDITURE SUMMARY<br />
WASTEWATER UTILITY<br />
Experience Budget Experience 2007-08<br />
For Year For Year 2006-07 Proposed by<br />
EXPENSES 2005-06 2006-07 Estimated <strong>City</strong> Manager<br />
Personnel<br />
Salaries and Wages 3,395,811 3,727,828 3,163,851 3,834,008<br />
Fringe Benefits 783,204 898,734 711,909 1,028,990<br />
Total Personnel 4,179,015 4,626,562 3,875,760 4,862,998<br />
Non-Personnel<br />
Internal Service Charges 1,809,065 2,286,487 2,217,098 2,437,530<br />
Pr<strong>of</strong>essional and Contractual 887,088 953,368 938,153 1,375,861<br />
Utilities 1,824,480 1,930,850 1,862,605 1,971,491<br />
Insurance and Fixed Charges 260,338 270,371 270,371 360,255<br />
All Other Operations and Maintenance 2,947,242 4,210,265 3,817,202 2,093,225<br />
Capital Outlay 11,392,032 46,736,628 46,736,628 18,284,484<br />
Debt Service 2,173,863 2,174,614 2,174,614 3,141,549<br />
Total Non-Personnel 21,294,108 58,562,583 58,016,672 29,664,395<br />
Total Expenditures 25,473,123 63,189,145 61,892,432 34,527,393<br />
Transfers<br />
Transfers In<br />
Transfers Out (1,770,821) (1,754,555) (1,754,555) (1,965,102)<br />
Net Transfers (1,770,821) (1,754,555) (1,754,555) (1,965,102)<br />
Revenue Sources<br />
Taxes<br />
Licenses and Permits<br />
Intergovernmental<br />
Charges for Services 19,792,183 19,454,188 19,778,440 21,659,907<br />
Interest Income 523,175 232,042 242,077 238,594<br />
All Other Revenue 5,947,367 36,062,557 36,065,057 14,901,500<br />
Total Revenue 26,262,725 55,748,787 56,085,574 36,800,001<br />
Funding to be Provided 981,219 9,194,913 7,561,413 (307,506)<br />
E – 131
WASTEWATER UTILITY<br />
BUDGET FOR YEAR 2007-08<br />
Experience Budget Experience Proposed Adjustments<br />
For Year For Year 2006-07 by by<br />
2005-06 2006-07 Estimated <strong>City</strong> Manager <strong>City</strong> Commission<br />
REVENUES CHARGES FOR SERVICES<br />
Sewer Utility Revenues:<br />
Wastewater Service Charges 14,514,295 15,689,425 15,638,521 16,979,524 ___________<br />
Pretreatment Surcharge 1,673,938 1,718,308 2,023,058 2,349,782 ___________<br />
Pretreatment Lab Analysis Fees 82,410 86,000 86,456 100,419 ___________<br />
Connection Fees 273,401 35,000 78,552 85,288 ___________<br />
SUB-TOTAL 16,544,044 17,528,733 17,826,587 19,515,012<br />
<strong>City</strong> Services:<br />
General Fund 150,389 152,284 166,514 181,880 ___________<br />
Fleet Management Fund 1,879 2,065 1,761 1,988 ___________<br />
Purchasing & Stores Fund 479 526 386 491 ___________<br />
Facilities Maintenance Fund 440 496 424 510 ___________<br />
Information Technology Fund 374 483 390 411 ___________<br />
<strong>Lakeland</strong> Center Fund 27,776 27,271 39,314 39,945 ___________<br />
<strong>Lakeland</strong> Linder Regional Airport Fund 3,061 3,416 3,101 3,377 ___________<br />
<strong>Lakeland</strong> Airside Center Fund 27,164 24,664 29,545 30,662 ___________<br />
Cleveland Heights Golf Course Fund 7,559 8,644 7,363 8,039 ___________<br />
Parking Fund 4,043 4,008 4,320 4,495 ___________<br />
Solid Waste Fund 5,211 5,417 5,549 5,985 ___________<br />
Stormwater Fund<br />
24 ___________<br />
Water Utility Fund 812 891 1,640 1,745 ___________<br />
Electric Utility Fund 48,628 53,394 50,310 54,077 ___________<br />
Wastewater Re-use water charges 229,969 212,660 212,000 235,532 ___________<br />
SUB-TOTAL 507,784 496,219 522,617 569,161<br />
TOTAL CHARGES FOR SERVICES 17,051,828 18,024,952 18,349,204 20,084,173<br />
MISCELLANEOUS REVENUE<br />
Interest Earnings<br />
Interest on Pooled Investments:<br />
Revenue Fund 63,119 97,354 103,247 100,623 ___________<br />
WW 2002 Bond Sinking Interest 4,775 6,050 6,046 5,893 ___________<br />
Debt Service Sinking Principal 20,455 23,638 27,784 27,078 ___________<br />
SUB-TOTAL 88,349 127,042 137,077 133,594<br />
Other Miscellaneous Revenue<br />
Reimbursements / Loss Recovery 500<br />
All Other Misc. Revenue 1,500 1,500 ___________<br />
Bad Check Charges 6,224 3,500<br />
Refund <strong>of</strong> Prior Year Expenses 760<br />
SUB-TOTAL 6,984 1,500 4,000 1,500<br />
TOTAL MISCELLANEOUS REVENUE 95,333 128,542 141,077 135,094<br />
E – 132
WASTEWATER UTILITY<br />
BUDGET FOR YEAR 2007-08<br />
Experience Budget Experience Proposed Adjustments<br />
For Year For Year 2006-07 by by<br />
2005-06 2006-07 Estimated <strong>City</strong> Manager <strong>City</strong> Commission<br />
Interfund Transfers<br />
2002 Debt Service Sinking Interest from<br />
Wastewater Impact Fees 526,368 526,368 526,368 526,368 ___________<br />
2002 Debt Service Sinking Principal from<br />
Wastewater Impact Fees 526,368 526,368 526,368 526,368 ___________<br />
SRL Debt Service - English Oaks 111,498 ___________<br />
SUB-TOTAL 1,052,736 1,052,736 1,052,736 1,164,234<br />
PRIOR YEARS SURPLUS 1,696,075 1,490,517 (157,736) (635,816)<br />
GRAND TOTAL REVENUES 19,895,972 20,696,747 19,385,281 20,747,685<br />
EXPENSES ADMINISTRATION<br />
PERSONAL SERVICES 299,879 365,523 198,230 318,477<br />
OPERATING EXPENSES<br />
Retiree Health Insurance Subsidy 45,338 42,312 42,312 45,733 ___________<br />
Rental / Fleet Equipment 4,326 1,657 1,657 1,750 ___________<br />
Gasoline / Fleet Equipment 817 442 641 1,633 ___________<br />
Maintenance / Fleet Equipment 1,127 1,250 1,364 1,171 ___________<br />
Uninsured Loss Reimbursement 250<br />
Insurance - Position Bond 382 1,117 1,117 515 ___________<br />
Insurance Consultant 2,967 3,308 3,474 4,035 ___________<br />
Self-Insurance Service 153,271 136,241 136,241 198,233 ___________<br />
Purchasing & Stores Service 43,232 45,914 45,914 49,587 ___________<br />
Stormwater Fees 1,710 1,750 1,750 3,848 ___________<br />
General Fund Service 575,519 560,785 560,785 637,352 ___________<br />
Utility Billing Service 377,043 386,588 386,588 385,059 ___________<br />
Intra-Dept Charges - Computer Rental 6,467 3,324 3,324 4,035 ___________<br />
Intra-Dept Charges - Telephone 2,197 1,138 2,528 ___________<br />
Intra-Dept Charges - Radios 1,002 706 706 322 ___________<br />
Intra-Dept Charges - IT 215,966 147,692 147,692 91,133 ___________<br />
Intra-Dept Charges - IT Projects 1,290 3,692 3,692<br />
Intra-Dept Charges - Training 4,336 ___________<br />
Allocation Shared Cost - Water Utilities 189,693 189,693 207,793 ___________<br />
Banking Service 2,233 2,462 2,300 2,667 ___________<br />
Advertising 100 100 ___________<br />
Annual Audit 15,582 12,900 15,636 12,900 ___________<br />
Office Supplies 1,080 1,550 749 1,550 ___________<br />
All Other Materials & Supplies 50 14 50 ___________<br />
Materials 6 50 50 ___________<br />
Materials - Default Purchasing Card 2,613<br />
Repair <strong>of</strong> Equipment 8,366 1,500 2,013 3,000 ___________<br />
Printing & Photography 150 150 ___________<br />
Postage & Mailing 1,902 400 1,274 400 ___________<br />
Subscription & Membership 710 280 710 ___________<br />
Telephone, Communications 264 195 280 200 ___________<br />
E – 133
WASTEWATER UTILITY<br />
BUDGET FOR YEAR 2007-08<br />
Experience Budget Experience Proposed Adjustments<br />
For Year For Year 2006-07 by by<br />
2005-06 2006-07 Estimated <strong>City</strong> Manager <strong>City</strong> Commission<br />
OPERATING EXPENSES continued):<br />
Travel 249 1,000 64 1,000 ___________<br />
Training 448 500 442 500 ___________<br />
All Other Sundry Charges 453 850 800 ___________<br />
Licenses & Permits 7,269 8,943 7,520 8,900 ___________<br />
Car Washing 78 50 112<br />
Bad Debt Expense 71,387 84,000 69,829 84,000 ___________<br />
Easement & Rights-Of-Way 281 435 435 435 ___________<br />
SUB-TOTAL 1,542,502 1,643,454 1,630,512 1,756,476<br />
TOTAL 1,842,381 2,008,977 1,828,742 2,074,953<br />
ENGINEERING<br />
PERSONAL SERVICES 406,650<br />
OPERATING EXPENSES<br />
Rental / Fleet Equipment 8,434<br />
Gasoline / Fleet Equipment 4,345<br />
Maintenance / Fleet Equipment 1,687<br />
Intra-Dept Charges - Computer Rental 25,791<br />
Intra-Dept Charges - Telephone 2,865<br />
Intra-Dept Charges - Radios 2,004<br />
Allocation Shared Cost - Water Utility 365,200 365,200 405,575 ___________<br />
Contractual Services 45<br />
Office Supplies 4,942<br />
All Other Materials & Supplies 623<br />
Repair <strong>of</strong> Equipment 156<br />
Postage & Mailing 85<br />
Subscription & Membership 938<br />
Telephone, Communications 735<br />
Travel 211<br />
Training 2,364<br />
All Other Sundry Charges 97<br />
Licenses & Permits 424<br />
SUB-TOTAL 55,746 365,200 365,200 405,575<br />
TOTAL 462,396 365,200 365,200 405,575<br />
E – 134
WASTEWATER UTILITY<br />
BUDGET FOR YEAR 2007-08<br />
Experience Budget Experience Proposed Adjustments<br />
For Year For Year 2006-07 by by<br />
2005-06 2006-07 Estimated <strong>City</strong> Manager <strong>City</strong> Commission<br />
GLENDALE PLANT<br />
PERSONAL SERVICES 1,066,560 1,208,524 1,131,083 1,303,141<br />
OPERATING EXPENSES<br />
Rental / Fleet Equipment 35,952 25,020 25,020 29,711 ___________<br />
Gasoline / Fleet Equipment 13,739 34,483 13,756 13,537 ___________<br />
Maintenance / Fleet Equipment 16,757 9,123 19,433 8,932 ___________<br />
Insurance - Fire 61,097 90,701 90,701 115,774 ___________<br />
Water Utility Service 7,909 11,503 10,749 12,426 ___________<br />
Electric Utility Service 751,906 805,820 735,458 796,628 ___________<br />
Solid Waste Service 12,874 10,700 14,520 15,245 ___________<br />
Intra-Dept Charges - Computer Rental 8,799 6,139 6,139 11,191 ___________<br />
Intra-Dept Charges - Telephone 1,088 1,089 1,089 1,252 ___________<br />
Intra-Dept Charges - Radios 3,451 3,883 3,883 3,537 ___________<br />
Intra-Dept. Charges - Facilities 25,959 29,453 29,453 34,581 ___________<br />
Intra-Dept Charges - Janitorial 26,461 29,957 29,957 28,133 ___________<br />
Contractual Services 88,981 93,750 84,619 110,250 ___________<br />
Sludge Disposal 476,797 500,000 514,635 858,000 ___________<br />
Office Supplies 3,252 10,600 4,051 5,600 ___________<br />
All Other Materials & Supplies 3,434 2,500 2,756 2,500 ___________<br />
Uniforms 2,980 3,500 3,449 3,500 ___________<br />
Cleaning & Janitor Supply 612 800 1,136 800 ___________<br />
Construction Material 1,394 600 1,682 600 ___________<br />
Chemicals 383,220 422,000 344,762 420,737 ___________<br />
Tools & Implements 4,298 5,000 3,598 5,000 ___________<br />
Laboratory Supplies 13,574 13,000 12,765 13,000 ___________<br />
Auto/Heavy Equipment Fuel 23,884 21,000 24,188 21,000 ___________<br />
Materials 23,176 22,400 18,301 22,400 ___________<br />
Rentals 6,124 5,500 3,875 5,500 ___________<br />
Maintenance <strong>of</strong> Facilities 596 750 608 750 ___________<br />
Repair <strong>of</strong> Equipment 113,237 152,625 169,334 148,500 ___________<br />
Subscription & Membership 160 1,200 846 1,200 ___________<br />
Telephone, Communications 1,014 1,200 1,237 1,266 ___________<br />
Travel 150 800 800 ___________<br />
Training 16,491 12,000 14,195 12,000 ___________<br />
All Other Sundry Charges 279 500 35 500 ___________<br />
Solid Waste Disposal Charges (1,850) 10,000 10,000 ___________<br />
SUB-TOTAL 2,127,795 2,337,596 2,186,228 2,714,851<br />
TOTAL 3,194,355 3,546,120 3,317,311 4,017,992<br />
E – 135
WASTEWATER UTILITY<br />
BUDGET FOR YEAR 2007-08<br />
Experience Budget Experience Proposed Adjustments<br />
For Year For Year 2006-07 by by<br />
2005-06 2006-07 Estimated <strong>City</strong> Manager <strong>City</strong> Commission<br />
NORTHSIDE PLANT<br />
PERSONAL SERVICES 723,076 763,920 776,036 789,083<br />
OPERATING EXPENSES<br />
Rental / Fleet Equipment 10,197 5,678 5,678 5,998 ___________<br />
Gasoline / Fleet Equipment 2,932 3,629 3,062 2,733 ___________<br />
Maintenance / Fleet Equipment 1,641 3,494 5,323 4,536 ___________<br />
Water Utility Service 5,170 6,420 5,402 5,429 ___________<br />
Electric Utility Service 537,082 562,200 548,465 586,858 ___________<br />
Solid Waste Service 4,264 4,550 4,586 4,815 ___________<br />
Intra-Dept Charges - Computer Rental 4,557 3,274 3,274 5,870 ___________<br />
Intra-Dept Charges - Telephone 2,260 2,260 188 2,600 ___________<br />
Intra-Dept Charges - Radios 1,002 1,059 1,059 965 ___________<br />
Intra-Dept. Charges - Facilities 5,142 ___________<br />
Contractual Services 27,099 28,500 17,379 33,000 ___________<br />
Sludge Disposal 148,067 150,000 156,650 157,300 ___________<br />
Office Supplies 1,262 3,750 1,533 3,750 ___________<br />
All Other Materials & Supplies 690 700 31 700 ___________<br />
Uniforms 1,591 1,700 1,678 1,700 ___________<br />
Cleaning & Janitor Supply 666 1,500 1,033 1,500 ___________<br />
Construction Material 300 300 ___________<br />
Chemicals 73,866 118,440 68,635 142,758 ___________<br />
Tools & Implements 636 1,000 727 1,000 ___________<br />
Laboratory Supplies 6,989 7,900 7,735 7,900 ___________<br />
Auto/Heavy Equipment Fuel 4,327 2,500 4,456 2,500 ___________<br />
Materials 6,183 8,500 4,368 8,500 ___________<br />
Rentals 2,872 7,750 6,738 7,750 ___________<br />
Repair <strong>of</strong> Equipment 62,060 72,625 77,717 90,000 ___________<br />
Subscription & Membership 240 900 1,051 400 ___________<br />
Telephone, Communications 173 210 185 200 ___________<br />
Travel 150 500 500 ___________<br />
Training 6,522 8,500 4,905 8,500 ___________<br />
All Other Sundry Charges 184 300 300 ___________<br />
Solid Waste Disposal Charges 5,500 5,500 ___________<br />
SUB-TOTAL 912,682 1,013,639 931,860 1,099,004<br />
TOTAL 1,635,758 1,777,559 1,707,896 1,888,087<br />
E – 136
WASTEWATER UTILITY<br />
BUDGET FOR YEAR 2007-08<br />
Experience Budget Experience Proposed Adjustments<br />
For Year For Year 2006-07 by by<br />
2005-06 2006-07 Estimated <strong>City</strong> Manager <strong>City</strong> Commission<br />
COLLECTION ADMINISTRATION<br />
PERSONAL SERVICES 350,950 274,155 392,846<br />
OPERATING EXPENSES<br />
Rental / Fleet Equipment 4,922 4,922 5,198 ___________<br />
Gasoline / Fleet Equipment 2,364 1,229 2,698 ___________<br />
Maintenance / Fleet Equipment 2,926 878 3,094 ___________<br />
Intra-Dept Charges - Computer Rental 10,688 10,688 16,365 ___________<br />
Intra-Dept Charges - Telephone 1,088 1,088 1,252 ___________<br />
Intra-Dept Charges - Radios 1,059 1,059 2,251 ___________<br />
Contractual Services 13,800 13,800 15,000 ___________<br />
Office Supplies 1,850 869 1,850 ___________<br />
Uniforms 180 530 ___________<br />
Materials 150 120 300 ___________<br />
Postage & Mailing 1,000 400 1,000 ___________<br />
Subscription & Membership 495 465 ___________<br />
Telephone, Communications 700 347 1,300 ___________<br />
Travel 1,125 1,125 ___________<br />
Training 500 140 850 ___________<br />
All Other Sundry Charges 400 400 ___________<br />
SUB-TOTAL 43,247 35,539 53,678<br />
TOTAL 394,197 309,694 446,524<br />
E – 137
WASTEWATER UTILITY<br />
BUDGET FOR YEAR 2007-08<br />
Experience Budget Experience Proposed Adjustments<br />
For Year For Year 2006-07 by by<br />
2005-06 2006-07 Estimated <strong>City</strong> Manager <strong>City</strong> Commission<br />
PUMPING STATIONS<br />
PERSONAL SERVICES 430,409 488,866 416,999 541,358<br />
OPERATING EXPENSES<br />
Rental / Fleet Equipment 30,710 20,929 20,929 21,975 ___________<br />
Gasoline / Fleet Equipment 19,248 31,877 19,671 10,014 ___________<br />
Maintenance / Fleet Equipment 27,183 29,069 31,951 46,397 ___________<br />
Water Utility Service 8,563 8,828 8,828 10,653 ___________<br />
Electric Utility Service 482,366 505,980 505,980 512,589 ___________<br />
Intra-Dept Charges - Computer Rental 12,820 7,823 7,823 9,358 ___________<br />
Intra-Dept Charges - Telephone 222 223 223 256 ___________<br />
Intra-Dept Charges - Radios 2,004 2,471 2,471 3,215 ___________<br />
Contractual Services 4,647 38,100 10,494 65,000 ___________<br />
Contract Labor 42,434 37,887 29,345 39,024 ___________<br />
Office Supplies 1,586 1,500 1,570 1,500 ___________<br />
Equipment - Noncapital 1,500 199 1,500 ___________<br />
All Other Materials & Supplies 500 12 500 ___________<br />
Uniforms 2,390 2,000 2,416 2,700 ___________<br />
Cleaning & Janitor Supply 176 150 340 200 ___________<br />
Construction Material 379 500 380 500 ___________<br />
Chemicals 244,882 282,000 243,572 282,000 ___________<br />
Tools & Implements 6,154 6,000 5,874 6,000 ___________<br />
Auto/Heavy Equipment Fuel 1,219 7,000 6,301 14,000 ___________<br />
Materials 62,507 59,950 74,697 80,000 ___________<br />
Rentals 390 500 402 500 ___________<br />
Maintenance <strong>of</strong> Facilities (2) 750 500 ___________<br />
Repair <strong>of</strong> Equipment 69,979 102,400 91,730 105,400 ___________<br />
Subscription & Membership 20 20 ___________<br />
Telephone, Communications 563 860 720 4,900 ___________<br />
Travel 200 200 ___________<br />
Training 5,000 35 5,000 ___________<br />
All Other Sundry Charges 103 500 500 ___________<br />
SUB-TOTAL 1,020,523 1,154,517 1,065,963 1,224,401<br />
TOTAL 1,450,932 1,643,383 1,482,962 1,765,759<br />
E – 138
WASTEWATER UTILITY<br />
BUDGET FOR YEAR 2007-08<br />
Experience Budget Experience Proposed Adjustments<br />
For Year For Year 2006-07 by by<br />
2005-06 2006-07 Estimated <strong>City</strong> Manager <strong>City</strong> Commission<br />
SEWER MAINTENANCE<br />
PERSONAL SERVICES 669,819 740,843 549,895 805,733<br />
OPERATING EXPENSES<br />
Rental / Fleet Equipment 105,560 85,185 85,185 88,465 ___________<br />
Gasoline / Fleet Equipment 38,174 55,688 39,851 62,985 ___________<br />
Maintenance / Fleet Equipment 41,514 54,584 40,472 87,141 ___________<br />
Intra-Dept Charges - Computer Rental 23,235 14,026 14,026 19,840 ___________<br />
Intra-Dept Charges - Telephone 1,078 1,089 222 256 ___________<br />
Intra-Dept Charges - Radios 5,344 4,589 4,589 6,109 ___________<br />
Contractual Services 11,249 7,000 8,548 9,000 ___________<br />
Contract Labor 47,196 35,000 52,607 39,024 ___________<br />
Office Supplies 5,926 3,500 4,790 3,500 ___________<br />
Equipment - Noncapital 1,514 2,000 2,000 ___________<br />
All Other Materials & Supplies 21 500 55 500 ___________<br />
Uniforms 2,814 3,400 2,911 3,400 ___________<br />
Construction Material 1,506 4,500 5,538 9,000 ___________<br />
Chemicals 1,596 3,000 3,201 4,000 ___________<br />
Tools & Implements 4,545 4,000 5,827 5,000 ___________<br />
Auto/Heavy Equipment Fuel 2,473 1,500 2,862 1,500 ___________<br />
Materials 32,527 22,000 36,394 40,000 ___________<br />
Rentals 204 500 297 500 ___________<br />
Repair <strong>of</strong> Equipment 8,663 7,000 9,237 7,000 ___________<br />
Subscription & Membership 200 200 ___________<br />
Telephone, Communications 951 1,200 795 4,900 ___________<br />
Travel 300 300 ___________<br />
Training 175 2,000 285 2,000 ___________<br />
All Other Sundry Charges 179 600 8 500 ___________<br />
SUB-TOTAL 336,444 313,361 317,701 397,120<br />
TOTAL 1,006,263 1,054,204 867,595 1,202,852<br />
E – 139
WASTEWATER UTILITY<br />
BUDGET FOR YEAR 2007-08<br />
Experience Budget Experience Proposed Adjustments<br />
For Year For Year 2006-07 by by<br />
2005-06 2006-07 Estimated <strong>City</strong> Manager <strong>City</strong> Commission<br />
PRETREATMENT<br />
PERSONAL SERVICES 163,366 153,834 94,134 162,923<br />
OPERATING EXPENSES<br />
Rental / Fleet Equipment 8,700 4,458 4,458 4,672 ___________<br />
Gasoline / Fleet Equipment 4,343 5,119 4,014 2,128 ___________<br />
Maintenance / Fleet Equipment 758 2,832 3,239 4,996 ___________<br />
Intra-Dept Charges - Computer Rental 3,714 1,500 1,500 1,759 ___________<br />
Intra-Dept Charges - Telephone 222 223<br />
Intra-Dept Charges - Radios 1,002 1,059 1,059 965 ___________<br />
Contractual Services 7,426 8,745 10,321 8,745 ___________<br />
Advertising 287 400 40 400 ___________<br />
Office Supplies 219 500 1,436 600 ___________<br />
All Other Materials & Supplies 100 6 100 ___________<br />
Uniforms 156 700 188 700 ___________<br />
Tools & Implements 721 700 499 700 ___________<br />
Laboratory Supplies 2,073 3,000 2,791 3,400 ___________<br />
Materials 1,318 1,800 924 1,800 ___________<br />
Rentals 100 100 ___________<br />
Repair <strong>of</strong> Equipment 44 900 46 900 ___________<br />
Postage & Mailing 11 100 21 100 ___________<br />
Subscription & Membership 97 80 97 100 ___________<br />
Telephone, Communications 18 100 28 100 ___________<br />
Travel 325 20 325 ___________<br />
Training 82 1,250 84 1,250 ___________<br />
All Other Sundry Charges 28 100 100 ___________<br />
SUB-TOTAL 31,219 34,091 30,771 33,940<br />
TOTAL 194,585 187,925 124,905 196,862<br />
E – 140
WASTEWATER UTILITY<br />
BUDGET FOR YEAR 2007-08<br />
Experience Budget Experience Proposed Adjustments<br />
For Year For Year 2006-07 by by<br />
2005-06 2006-07 Estimated <strong>City</strong> Manager <strong>City</strong> Commission<br />
WETLANDS MANAGEMENT<br />
PERSONAL SERVICES 172,186 268,443 171,417 243,759<br />
OPERATING EXPENSES<br />
Rental / Fleet Equipment 23,159 30,754 30,754 32,305 ___________<br />
Gasoline / Fleet Equipment 5,265 15,219 4,128 14,720 ___________<br />
Maintenance / Fleet Equipment 14,520 18,980 16,979 27,571 ___________<br />
Intra-Dept Charges - Computer Rental 3,870 3,042 3,042 3,506 ___________<br />
Intra-Dept Charges - Telephone 218 223 223 256 ___________<br />
Intra-Dept Charges - Radios 1,336 1,412 1,412 1,608 ___________<br />
Contractual Services 11,603 20,416 18,082 20,416 ___________<br />
Office Supplies 926 1,500 1,853 1,500 ___________<br />
All Other Materials & Supplies 1,578 1,600 1,018 1,600 ___________<br />
Uniforms 743 1,000 1,228 1,500 ___________<br />
Construction Material 381 600 500 600 ___________<br />
Chemicals 3,358 3,800 3,459 3,800 ___________<br />
Tools & Implements 1,289 1,500 535 2,000 ___________<br />
Laboratory Supplies 1,133 2,700 1,938 2,700 ___________<br />
Auto/Heavy Equipment Fuel 1,275 1,500 538 1,500 ___________<br />
Materials 487 600 447 600 ___________<br />
Rentals 3,356 2,500 3,411 2,500 ___________<br />
Maintenance <strong>of</strong> Facilities 570 1,750 1,001 1,750 ___________<br />
Repair <strong>of</strong> Equipment 11,490 7,700 6,201 9,000 ___________<br />
Subscription & Membership 260 360 329 360 ___________<br />
Telephone, Communications 534 584 580 584 ___________<br />
Travel 100 100 ___________<br />
Training 895 2,750 283 2,750 ___________<br />
All Other Sundry Charges 61 100 59 100 ___________<br />
Electric Service - TECO 8,368 8,000 7,913 9,500 ___________<br />
SUB-TOTAL 96,675 128,690 105,913 142,826<br />
TOTAL 268,861 397,133 277,329 386,585<br />
E – 141
WASTEWATER UTILITY<br />
BUDGET FOR YEAR 2007-08<br />
Experience Budget Experience Proposed Adjustments<br />
For Year For Year 2006-07 by by<br />
2005-06 2006-07 Estimated <strong>City</strong> Manager <strong>City</strong> Commission<br />
LABORATORY<br />
PERSONAL SERVICES 247,070 285,659 263,811 305,679<br />
OPERATING EXPENSES<br />
Intra-Dept Charges - Computer Rental 5,514 3,999 3,999 4,671 ___________<br />
Intra-Dept Charges - Telephone 445 445 445 512 ___________<br />
Contractual Services 1,000 223 1,000 ___________<br />
Office Supplies 467 1,200 519 1,200 ___________<br />
Uniforms 499 500 353 500 ___________<br />
Laboratory Supplies 25,077 27,200 24,980 27,200 ___________<br />
Materials 30 100 37 100 ___________<br />
Laboratory Analysis 495 1,500 834 1,500 ___________<br />
Repair Of Equipment 18,697 20,000 19,473 20,000 ___________<br />
Subscription & Membership 3,319 2,795 3,506 2,795 ___________<br />
Telephone, Communications 16 50 29 50 ___________<br />
All Other Sundry Charges 47 100 100 ___________<br />
SUB-TOTAL 54,606 58,889 54,399 59,627<br />
TOTAL 301,676 344,548 318,210 365,306<br />
E – 142
WASTEWATER UTILITY<br />
BUDGET FOR YEAR 2007-08<br />
Experience Budget Experience Proposed Adjustments<br />
For Year For Year 2006-07 by by<br />
2005-06 2006-07 Estimated <strong>City</strong> Manager <strong>City</strong> Commission<br />
MAINTENANCE PROJECTS<br />
ADMINISTRATION / OTHER<br />
Contingency 182,667 100,000 ___________<br />
Acquisition <strong>of</strong> Easements 428 750 750<br />
Water-Wastewater Service Study 18,757 6,243 6,243<br />
Permits, Process, & Operations Review 46,000 46,000<br />
Wastewater Management Study 40,000 40,000<br />
Maximo Upgrade 45,827 45,827<br />
Master Water Balance Study 25,000 25,000<br />
Safety Incentive Program 3,440 2,000 ___________<br />
GLENDALE<br />
Interim Sludge Stabil. & Disposal Services 1,446,969 1,808,000 1,808,000<br />
Supervisory Testing - Reimbursable 1,000<br />
NPDES Permit Renewal 50,000 50,000<br />
Operational Technical Assistance 21,350 50,000 5,000 25,000 ___________<br />
PSM / RMP Internal Audit 7,500 7,500<br />
NORTHSIDE<br />
NPDES Permit Renewal 50,000 50,000<br />
PSM / RMP Internal Audit 7,000 7,000<br />
PUMPING STATIONS<br />
Master Pump Station Rebuilds 45,021 46,186 46,186 45,000 ___________<br />
SEWER MAINTENANCE<br />
Utility Relocation Engineering & Surveying 3,950 77,390 77,390 50,000 ___________<br />
Root Treatment <strong>of</strong> Sewer System 24,100 26,136 26,194 30,000 ___________<br />
Manhole Adjustments 1,654 15,000 15,000 25,000 ___________<br />
System Maintenance & Repairs - Reimb. 989 3,864 3,864 5,000 ___________<br />
PRETREATMENT<br />
Reimbursable Sampling Analysis 1,427 1,000 1,000 1,000 ___________<br />
WETLANDS<br />
Wetlands Algae Solids 50,000 50,000 50,000 ___________<br />
Mowing Services - Reimbursable (13,792) 1,229 30,041<br />
Wetlands Operations Assistance 10,000 10,000 10,000 ___________<br />
Summer College Intern 8,300 8,300 8,300 ___________<br />
LABORATORY<br />
Lab Analysis Reimbursement (2,026) 1,000 4,292<br />
SUB-TOTAL 1,549,827 2,559,092 2,367,027 351,300<br />
TOTAL OPERATING EXPENSES 11,907,034 14,278,338 12,966,872 13,101,795<br />
E – 143
WASTEWATER UTILITY<br />
BUDGET FOR YEAR 2007-08<br />
Experience Budget Experience Proposed Adjustments<br />
For Year For Year 2006-07 by by<br />
2005-06 2006-07 Estimated <strong>City</strong> Manager <strong>City</strong> Commission<br />
OTHER EXPENSES<br />
Debt Service and Other Expenses<br />
State Revolving Loan Debt Service 965,572 ___________<br />
Trustee, Registrar, Paying Agent<br />
and LOC Fees 475<br />
Principal & Interest on Internal Loan 63,482 63,482 63,482 63,482 ___________<br />
2002 Wastewater Bond Interest 740,381 706,132 706,132 667,494 ___________<br />
2002 Wastewater Bond Principal 1,370,000 1,405,000 1,405,000 1,445,000 ___________<br />
SUB-TOTAL 2,174,338 2,174,614 2,174,614 3,141,548<br />
Contributions to Other Funds<br />
General Fund 1,770,821 1,754,555 1,754,555 1,965,102 ___________<br />
Fleet Management Reserve Fund 11,190<br />
Wastewater Renewal & Replacement Fund 2,105,000 2,489,240 2,489,240 2,539,240 ___________<br />
Capital Improvement Fund 1,927,589<br />
SUB-TOTAL 5,814,600 4,243,795 4,243,795 4,504,342<br />
GRAND TOTAL EXPENSES 19,895,972 20,696,747 19,385,281 20,747,685<br />
E – 144
WASTEWATER UTILITY<br />
BUDGET FOR YEAR 2007-08<br />
Experience Budget Experience Proposed Adjustments<br />
For Year For Year 2006-07 by by<br />
2005-06 2006-07 Estimated <strong>City</strong> Manager <strong>City</strong> Commission<br />
PERSONNEL<br />
Current Proposed Pay Salary<br />
POSITION TITLE Budget Budget Grade Range<br />
ADMINISTRATION<br />
Assistant Director <strong>of</strong> Water Utilities 1 1 PB4 *<br />
COLLECTION ADMINISTRATION<br />
Manager <strong>of</strong> Wastewater Collection 1 1 60 54,579 - 82,618<br />
Industrial Pretreatment Coordinator 1 1 54 47,133 - 71,365<br />
Water Utilities Engineering Tech III 1 1 51 43,805 - 64,730<br />
Warehouse Operations Technician I 1 1 31 26,894 - 40,726<br />
Office Associate II 2 2 29 25,605 - 38,771<br />
SEWER MAINTENANCE<br />
Collection System Supervisor 1 1 51 43,805 - 64,730<br />
Inspection & Sealing Technician 2 2 47 39,749 - 60,174<br />
Water Pipefitter Foreman 2 2 45 37,835 - 57,304<br />
Water Pipefitter II 5 5 36 30,389 - 45,989<br />
Equipment Operator II 4 4 33 28,246 - 42,765<br />
Water Pipefitter I 3 3 31 26,894 - 40,726<br />
Operations Support Technician I 1 1 24 22,693 - 34,320<br />
PUMPING STATIONS<br />
Pump Station Supervisor 1 1 49 41,725 - 63,190<br />
Electrical Technician 2 2 45 37,835 - 57,304<br />
Pump Station Equipment Mechanic I 1 38 31,907 - 48,298<br />
Pumping Station Operator II 3 3 36 30,389 - 45,989<br />
Pumping Station Operator I 3 3 31 26,894 - 40,726<br />
Operations Support Tech I 1 1 24 22,693 - 34,320<br />
PRETREATMENT<br />
Industrial Pretreatment Technician II 2 2 38 31,907 - 48,298<br />
Industrial Pretreatment Technician I 1 1 36 30,389 - 45,989<br />
W. CARL DICKS PLANT<br />
Manager <strong>of</strong> Wastewater Treatment 1 1 60 54,579 - 82,618<br />
Wastewater Plant Chief Operator 1 1 54 47,133 - 71,365<br />
Wastewater Maintenance Supervisor 1 1 49 41,725 - 63,190<br />
Wastewater Plant Supervisor 4 4 49 41,725 - 63,190<br />
Wastewater Equipment Mechanic III 1 1 47 39,749 - 60,174<br />
Electrical Technician 1 2 45 37,835 - 57,304<br />
Wastewater Equipment Mechanic II 4 4 38 31,907 - 48,298<br />
Wastewater Plant Operator II 6 6 38 31,907 - 48,298<br />
NORTHSIDE PLANT<br />
Wastewater Plant Chief Operator 1 1 54 47,133 - 71,365<br />
Wastewater Plant Supervisor 4 4 49 41,725 - 63,190<br />
Wastewater Operator II 6 6 38 31,907 - 48,298<br />
Operations Support Technician I 1 1 24 22,693 - 34,320<br />
WEST LAKELAND WASTELOAD FACILITY<br />
Wastewater Operator II 3 3 38 31,907 - 48,298<br />
E – 145
WASTEWATER UTILITY<br />
BUDGET FOR YEAR 2007-08<br />
Experience Budget Experience Proposed Adjustments<br />
For Year For Year 2006-07 by by<br />
2005-06 2006-07 Estimated <strong>City</strong> Manager <strong>City</strong> Commission<br />
Proposed Proposed Pay Salary<br />
POSITION TITLE Budget Budget Grade Range<br />
LABORATORY<br />
Wastewater Chemist 1 1 56 49,504 - 74,922<br />
Laboratory Technician II 3 3 38 31,907 - 48,298<br />
WETLANDS MANAGEMENT<br />
Environmental Scientist 1 1 56 49,504 - 74,922<br />
Environmental Technician III 1 1 45 37,835 - 57,304<br />
Environmental Technician I 1 1 36 30,389 - 45,989<br />
Equipment Operator I 1 1 29 25,605 - 38,771<br />
Operations Support Technician I 1 1 24 22,693 - 34,320<br />
TOTAL FULL-TIME EMPLOYEES 81 83<br />
PART-TIME<br />
Account Clerk IV 2 2<br />
Student 1 1<br />
Laboratory Technician II 1 1<br />
TOTAL PART TIME EMPLOYEES 4 4<br />
CONTRACT EMPLOYEES<br />
Water Pipefitter I 2 2<br />
Operations Support Tech I 2 2<br />
Account Clerk 1 1<br />
TOTAL CONTRACT EMPLOYEES 5 5<br />
E – 146
REVENUE AND EXPENDITURE SUMMARY<br />
WATER UTILITY<br />
Experience Budget Experience FY 2006-07<br />
For Year For Year 2005-06 Proposed by<br />
EXPENSES 2004-05 2005-06 Estimated <strong>City</strong> Manager<br />
Personnel<br />
Salaries and Wages 3,548,237 3,858,601 3,301,665 3,942,040<br />
Fringe Benefits 742,567 862,107 776,610 943,058<br />
Total Personnel 4,290,804 4,720,708 4,078,275 4,885,098<br />
Non-Personnel<br />
Internal Service Charges 2,355,277 2,972,701 2,896,126 3,249,802<br />
Pr<strong>of</strong>essional and Contractual 592,960 1,003,831 975,786 814,210<br />
Utilities 1,829,266 1,810,862 1,872,820 1,910,569<br />
Insurance and Fixed Charges 304,295 318,585 318,585 336,292<br />
All Other Operations and Maintenance 977,674 1,154,911 1,117,204 2,154,293<br />
Capital Outlay 10,237,755 13,398,889 13,398,889 6,297,689<br />
Debt Service 4,383,117 4,447,359 4,449,265 4,437,830<br />
Total Non-Personnel 20,680,344 25,107,138 25,028,676 19,200,685<br />
Total Expenditures 24,971,148 29,827,846 29,106,951 24,085,783<br />
Transfers<br />
Transfers In<br />
Transfers Out (3,664,114) (3,734,108) (3,734,108) (3,902,143)<br />
Net Transfers (3,664,114) (3,734,108) (3,734,108) (3,902,143)<br />
Revenue Sources<br />
Taxes<br />
Licenses and Permits<br />
Intergovernmental 333,500<br />
Charges for Services 25,071,411 23,298,670 24,843,888 25,112,343<br />
Interest Income 801,953 869,698 989,247 998,767<br />
All Other Revenue 23,559 8,500 11,040 9,246<br />
Total Revenue 25,896,923 24,176,868 25,844,175 26,453,855<br />
Funding to be Provided 2,738,339 9,385,086 6,996,884 1,534,071<br />
E – 147
WATER UTILITY<br />
BUDGET FOR YEAR 2007-08<br />
Experience Budget Experience Proposed Adjustments<br />
For Year For Year 2006-07 by by<br />
2005-06 2006-07 Estimated <strong>City</strong> Manager <strong>City</strong> Commission<br />
REVENUES CHARGES FOR SERVICES<br />
Water Utility Revenues<br />
Charges for Services:<br />
Water Sales 20,276,253 20,120,135 21,735,730 21,953,087 ___________<br />
Hydrants 25,494 25,480 24,946 25,195 ___________<br />
Fire Protection 649,649 746,181 765,172 770,631 ___________<br />
SUB-TOTAL 20,951,396 20,891,796 22,525,848 22,748,914<br />
Sales to Public Authorities/Intra-<strong>City</strong> Sales<br />
General Fund 581,110 560,506 505,173 537,196 ___________<br />
Fleet Management Fund 1,276 1,400 1,149 1,232 ___________<br />
Purchasing & Stores Fund 4,544 5,160 3,220 2,650 ___________<br />
Facilities Maintenance Fund 508 589 447 486 ___________<br />
Information Technology Fund 375 446 351 341 ___________<br />
Cleveland Heights Golf Course Fund (1,432) 24,150 20,313 21,790 ___________<br />
Parking Fund 5,263 5,108 5,567 5,544 ___________<br />
<strong>Lakeland</strong> Center Fund 37,315 35,261 37,016 35,645 ___________<br />
<strong>Lakeland</strong> Linder Regional Airport Fund 9,924 7,460 11,672 9,909 ___________<br />
<strong>Lakeland</strong> Airside Center Fund 29,237 25,998 32,436 31,557 ___________<br />
Solid Waste Fund 4,047 4,300 4,716 4,536 ___________<br />
Stormwater Fund<br />
20 ___________<br />
Wastewater Utility Fund 21,642 26,750 26,323 28,508 ___________<br />
Water Utility Fund 645 1,473 1,357 1,366 ___________<br />
Electric Utility Fund 161,114 147,523 124,412 134,966 ___________<br />
SUB-TOTAL 855,568 846,124 774,152 815,746<br />
Other Water Operating Revenues<br />
Forfeited Discount/Penalty Charges 90,248 100,000 87,183 88,055 ___________<br />
Bad Check Charges 7,780 7,500 8,164 8,246 ___________<br />
Connection Fees-Delinquent Accts 113,799 112,000 125,643 126,899 ___________<br />
All Other Revenue 18,456 17,500 26,000 26,260 ___________<br />
Commission 7,699 6,250 6,610 6,676 ___________<br />
Service Cut-on Fees 322,799 325,000 296,824 299,792 ___________<br />
Scrap sales 3,947 1,000 50 1,000 ___________<br />
Insurance Proceeds-Workers Comp Claims 11,832 1,876<br />
Refund <strong>of</strong> Prior Year Expenses 250<br />
Reimbursements / Loss Recovery 700<br />
SUB-TOTAL 576,560 569,250 553,300 556,928<br />
TOTAL CHARGES FOR SERVICES 22,383,524 22,307,170 23,853,300 24,121,588<br />
E – 148
WATER UTILITY<br />
BUDGET FOR YEAR 2007-08<br />
Experience Budget Experience Proposed Adjustments<br />
For Year For Year 2006-07 by by<br />
2005-06 2006-07 Estimated <strong>City</strong> Manager <strong>City</strong> Commission<br />
MISCELLANEOUS REVENUE<br />
Intergovernmental<br />
SWFWMD 50/50 Grants 333,500 ___________<br />
Interest Earnings<br />
Interest on Pooled Investments:<br />
Revenue Fund 78,027 91,578 159,713 163,512 ___________<br />
Debt Service Sinking Funds 34,721 43,768 44,052 42,932 ___________<br />
Meter Deposit Fund 49,272 70,152 72,058 72,323 ___________<br />
2002 Bond Reserve - Int on Investments 153,424 104,200 153,424 150,000 ___________<br />
TOTAL MISCELLANEOUS REVENUE 315,444 309,698 429,247 762,267<br />
PRIOR YEARS SURPLUS (972,441) 872,295 (1,493,031) 132,480<br />
GRAND TOTAL REVENUES 21,726,527 23,489,163 22,789,516 25,016,335<br />
EXPENSES<br />
WATER ADMINISTRATION<br />
PERSONAL SERVICES 372,485 339,129 128,259 206,348<br />
OPERATING EXPENSES<br />
Auto Allowance 4,814 4,800<br />
Retiree Health Insurance Subsidy 55,396 66,265 66,265 70,699 ___________<br />
Rental / Fleet Equipment 2,002 1,095 1,579 1,157 ___________<br />
Gasoline / Fleet Equipment 371 586 393 4,086 ___________<br />
Maintenance / Fleet Equipment 287 178 144 3,647 ___________<br />
Insurance - Fire 50,504 74,976 74,976 36,512 ___________<br />
Insurance - Position Bond 483 1,421 1,421 618 ___________<br />
Insurance Consultant 3,414 3,746 3,955 3,451 ___________<br />
Self Insurance Service 197,912 175,923 175,923 228,462 ___________<br />
Purchasing & Stores Service 119,972 127,413 127,413 137,607 ___________<br />
General Fund Service 579,448 564,724 564,724 706,803 ___________<br />
Intra-Dept Charges - Computer Rental 16,448<br />
Intra-Dept Charges - Telephone 1,851<br />
Intra-Dept Charges - IT 214,827 163,833 163,833 150,299 ___________<br />
Intra-Dept Charges - IT Projects 1,290 3,692 3,692<br />
Intra-Dept Charges - Training 6,110 ___________<br />
Allocation Shared Cost - Water Utility 231,847 262,348 253,970 ___________<br />
Contractual Services 624<br />
Banking Service 7,852 8,655 8,088 9,376 ___________<br />
Advertising 4,368<br />
E – 149
WATER UTILITY<br />
BUDGET FOR YEAR 2007-08<br />
Experience Budget Experience Proposed Adjustments<br />
For Year For Year 2006-07 by by<br />
2005-06 2006-07 Estimated <strong>City</strong> Manager <strong>City</strong> Commission<br />
Annual Audit 15,582 12,900 15,636 12,900 ___________<br />
Office Supplies 3,474<br />
All Other Materials & Supplies 1,917 892 623<br />
Personal Safety Equipment 21<br />
Postage & Mailing 22<br />
Subscription & Membership 16,120<br />
Telephone, Communications 233<br />
Travel 902 2,000 973<br />
Contingency 25,000 ___________<br />
Training 1,396 1,000 1,497 1,200 ___________<br />
Bad Debt Expense 73,271 110,000 82,000 90,000 ___________<br />
Telephone-Long Distance 28<br />
SUB-TOTAL 1,370,015 1,551,146 1,555,483 1,741,897<br />
Skyview Utility System 25,000<br />
Water Billing Service 722,229 592,770 592,770 628,170 ___________<br />
Water Support <strong>of</strong> COL-Training-Safety 2,000 ___________<br />
Salaries Students 18,353 18,353 21,803 ___________<br />
Water Conservation Enforcement 11,000 11,000 61,000 ___________<br />
Bond Holders Report 7,935 15,000 15,000 15,000 ___________<br />
Water Cost <strong>of</strong> Service - Rates Div 90<br />
Water Forecast - Rates Div 13,210 16,309 16,309 15,420 ___________<br />
Water Rate Survey - Rates Div 809 1,015 1,015<br />
Water Rates - Rates Div 27 396 396<br />
Water Rev Forecast (Budget) - Rates Div 171 1,947 1,947<br />
Water Rev Forecast (Long-term) - Rates Div 288 288<br />
Water Customer Statistics - Rates Div 2,543 2,782 2,782 6,425 ___________<br />
Master Meter Updating - Rates Div 4,190 3,409 3,409 2,570 ___________<br />
Data Book Updating - Rates Div 448 321 321<br />
Other Water Projects and Recoveries 684 1,730 1,730 1,285 ___________<br />
MWA 1218 100 Years <strong>of</strong> Water 10,503 21,000 21,000 10,000 ___________<br />
MWA Water Conservation Program 1,135 177,478 177,478<br />
SWFWMD Low Flow Toilet Rebate Program 800,000 ___________<br />
SWFWMD Low Flow Dish Sprayer Valves R 45,000 ___________<br />
SWFWMD Plumbing Retr<strong>of</strong>it Kits 30,000 ___________<br />
CROW Retainer Work (ROW) 997 7,000 7,000 7,000 ___________<br />
Water Environmental Affairs 24,375 25,500 25,500 25,500 ___________<br />
Water Building Maintenance Support 139,397 183,521 183,521 203,833 ___________<br />
Cost <strong>of</strong> Service Study 13,750 11,250 11,250<br />
Water Balance Study 25,000 25,000<br />
TOTAL WATER ADMIN 2,689,717 3,036,234 2,799,811 3,823,251<br />
E – 150
WATER UTILITY<br />
BUDGET FOR YEAR 2007-08<br />
Experience Budget Experience Proposed Adjustments<br />
For Year For Year 2006-07 by by<br />
2005-06 2006-07 Estimated <strong>City</strong> Manager <strong>City</strong> Commission<br />
WATER UTILITY ADMINISTRATION - SHARED<br />
EXPENSES<br />
PERSONAL SERVICES 349,990 429,739 388,083<br />
OPERATING EXPENSES<br />
Auto Allowance 5,363 5,400 ___________<br />
Intra-Dept Charges - Computer Rental 14,563 14,563 18,295 ___________<br />
Intra-Dept Charges - Telephone 8,457 8,457 2,130 ___________<br />
Intra-Dept Charges - IT 2,595 ___________<br />
Contractual Services 1,250<br />
Pr<strong>of</strong>essional Services 10,000 10,000 ___________<br />
Office Supplies 3,555 780 2,500 ___________<br />
All Other Materials & Supplies 2,100 183 3,500 ___________<br />
Personal Safety Equipment 150 10 200 ___________<br />
Materials 1,350<br />
Postage & Mailing 100 200 ___________<br />
Subscription & Membership 17,310 16,881 17,610 ___________<br />
Telephone, Communications 250 101 250 ___________<br />
Travel 10,800 250 8,300 ___________<br />
Training 1,515 670 2,500 ___________<br />
Telephone-Long Distance 150 200 ___________<br />
SUB-TOTAL 71,550 47,257 73,680<br />
COST ALLOCATED TO<br />
55% Water Utilities Fund (231,847) (262,348) (253,970) ___________<br />
45% Wastewater Fund (189,693) (214,648) (207,793) ___________<br />
TOTAL WATER UTILITY<br />
ADMIN -SHARED<br />
E – 151
WATER UTILITY<br />
BUDGET FOR YEAR 2007-08<br />
Experience Budget Experience Proposed Adjustments<br />
For Year For Year 2006-07 by by<br />
2005-06 2006-07 Estimated <strong>City</strong> Manager <strong>City</strong> Commission<br />
WATER ENGINEERING<br />
PERSONAL SERVICES 149,602<br />
OPERATING EXPENSES<br />
Intra-Dept Charges - Computer Rental 23,340<br />
Intra-Dept Charges - Radios 4,008<br />
Allocation Shared Cost - Water Utility 446,356 422,544 495,703 ___________<br />
Repair Of Equipment 156<br />
Office Supplies 3,717<br />
Equipment - Noncapital 40<br />
All Other Materials & Supplies 5,291<br />
Tools & Implements 112<br />
Personal Safety Equipment 50<br />
Computer S<strong>of</strong>tware 20<br />
Postage & Mailing 1,802<br />
Telephone, Communications 165<br />
Intra Dept Charges - Telephone 3,322<br />
Travel 54<br />
Training 1,372<br />
Telephone-Long Distance 212<br />
Licenses and Permits 1,486<br />
Subscription & Membership 155<br />
SUB-TOTAL 45,302 446,356 422,544 495,703<br />
Technical Training 2,500 2,500<br />
TOTAL WATER ENGINEERING 194,904 448,856 425,044 495,703<br />
E – 152
WATER UTILITY<br />
BUDGET FOR YEAR 2007-08<br />
Experience Budget Experience Proposed Adjustments<br />
For Year For Year 2006-07 by by<br />
2005-06 2006-07 Estimated <strong>City</strong> Manager <strong>City</strong> Commission<br />
WATER UTILITY ENGINEERING - SHARED<br />
PERSONAL SERVICES 680,078 642,872 742,086<br />
OPERATING EXPENSES<br />
Rental / Fleet Equipment 2,985 2,985 1,158 ___________<br />
Gasoline / Fleet Equipment 1,891 4,086 1,079 ___________<br />
Maintenance / Fleet Equipment 158 292 1,171 ___________<br />
Intra-Dept Charges - Computer Rental 39,241 39,241 43,511 ___________<br />
Intra-Dept Charges - Telephone 6,241 6,241 7,814 ___________<br />
Intra-Dept Charges - Radios 6,354 6,354 7,074 ___________<br />
Engineering - Basic 5,150 5,000 ___________<br />
Repair Of Equipment 18,700 19,562 20,350 ___________<br />
Advertising 515 500 ___________<br />
Contract Labor 12,150 12,150 30,000 ___________<br />
Office Supplies 12,180 12,666 14,000 ___________<br />
Equipment - Noncapital 618 640 500 ___________<br />
All Other Materials & Supplies 3,525 3,584 4,000 ___________<br />
Tools & Implements 665 1,170 720 ___________<br />
Personal Safety Equipment 250 18 250 ___________<br />
Materials 150<br />
Postage & Mailing 450 364 450 ___________<br />
Telephone, Communications 6,350 3,132 6,350 ___________<br />
Travel 640 96 1,000 ___________<br />
Training 8,200 8,200 8,200 ___________<br />
Telephone-Long Distance 500 500 ___________<br />
Licenses and Permits 1,600 3,032 1,800 ___________<br />
Car Washing 50 7<br />
All Other Sundry Charges<br />
100 ___________<br />
Printing & Photography 1,100 1,200 ___________<br />
Subscription & Membership 1,815 1,571 2,465 ___________<br />
SUB-TOTAL 811,556 768,263 901,278<br />
COST ALLOCATED TO<br />
55% Water Utilities Fund (446,356) (422,544) (495,703) ___________<br />
45% Wastewater Fund (365,200) (345,718) (405,575) ___________<br />
TOTAL WATER UTILITY ENG - SHARED<br />
E – 153
WATER UTILITY<br />
BUDGET FOR YEAR 2007-08<br />
Experience Budget Experience Proposed Adjustments<br />
For Year For Year 2006-07 by by<br />
2005-06 2006-07 Estimated <strong>City</strong> Manager <strong>City</strong> Commission<br />
WATER PRODUCTION - GENERAL<br />
PERSONAL SERVICES 1,356,695 1,360,866 1,233,449 1,502,696<br />
OPERATING EXPENSES<br />
Rental / Fleet Equipment 12,221 8,025 8,025 8,364 ___________<br />
Gasoline / Fleet Equipment 3,877 2,660 5,500 10,093 ___________<br />
Maintenance / Fleet Equipment 3,656 4,471 5,725 9,501 ___________<br />
Water Utility Service 645 723 723 612 ___________<br />
Stormwater Fees 1,009 1,010 1,010 2,270 ___________<br />
Electric Utility Service 1,268,610 1,281,586 1,251,886 1,241,680 ___________<br />
Wastewater Utility Service 812 891 891 938 ___________<br />
Solid Waste Service 2,206 2,125 3,032 3,804 ___________<br />
Intra-Dept Charges - Computer Rental 16,811 13,340 13,340 14,896 ___________<br />
Intra-Dept Charges - Telephone 3,805 3,765 3,765 4,359 ___________<br />
Intra-Dept Charges - Radios 2,004 4,376 4,376 4,180 ___________<br />
Intra-Dept Charges - Facilities 13,673 ___________<br />
Contractual Services 25,867 21,700 21,700 24,000 ___________<br />
Advertising 722 1,500 500 500 ___________<br />
Office Supplies 4,107 6,800 6,800 7,000 ___________<br />
Equipment - Noncapital 151 1,000 1,000 1,000 ___________<br />
All Other Materials & Supplies 2,619 4,000 2,600 4,100 ___________<br />
Uniforms 4,914 8,000 6,500 8,200 ___________<br />
Tools & Implements 4,469 2,000 4,265 2,000 ___________<br />
Electrical, Hardware & Plumbing Supplies 4,054 4,000 2,150 4,000 ___________<br />
Personal Safety Equipment 483 1,300 1,300 1,300 ___________<br />
Parts For Equipment 4,760 5,600 5,600 5,600 ___________<br />
Materials 31,072 29,930 20,500 31,000 ___________<br />
#2 Oil 544 3,400 3,400 5,000 ___________<br />
Rentals 2,494 2,000 2,000 2,000 ___________<br />
Repair Of Equipment 300 300 300 ___________<br />
Postage & Mailing 112 300 300 300 ___________<br />
Telephone, Communications 10,069 11,000 11,000 11,000 ___________<br />
Contingency 1,000 1,000 25,000 ___________<br />
Training 105 105<br />
Telephone-Long Distance 83 200 200 200 ___________<br />
Licenses & Permits 1,500 2,765 2,765 2,765 ___________<br />
Direct Response Campaign 1,000<br />
SUB-TOTAL 1,413,676 1,430,872 1,392,258 1,449,635<br />
E – 154
WATER UTILITY<br />
BUDGET FOR YEAR 2007-08<br />
Experience Budget Experience Proposed Adjustments<br />
For Year For Year 2006-07 by by<br />
2005-06 2006-07 Estimated <strong>City</strong> Manager <strong>City</strong> Commission<br />
Recruitment 1,000<br />
PICS Expendables 8,386 8,000 8,000 8,000 ___________<br />
Painting Of Structures 1,028 5,000 5,000 5,000 ___________<br />
Electric System Inspection 42,000 42,000 42,000 ___________<br />
Emergency Generator Service 3,506 7,300 7,300 7,300 ___________<br />
Risk Management Process 4,000 5,000 5,000 5,000 ___________<br />
Contractual Water Plant O & M 20,670 18,000 22,170 18,000 ___________<br />
MWP1519 PSM / RMP Internal Audit 7,000 7,000<br />
Technical Training-Water Production 2,000 2,000 2,000 ___________<br />
Water Plant Security 83,220 112,648 112,648 112,648 ___________<br />
GE Operations S<strong>of</strong>tware Maintenance 14,000<br />
Consumer Confidence Report 1,738 2,200 2,200 2,200 ___________<br />
Env. Mitigation at Williams Water Plant 1,865 20,000 20,000 20,000 ___________<br />
TOTAL WATER PRODUCTION-GENERAL 2,895,784 3,034,886 2,859,025 3,174,479<br />
WATER PUMPING<br />
Maintenance Of NE Wellfield 2,855<br />
Well Preventative Maintenance 70,159 102,000 96,950 105,000 ___________<br />
Repumping 69,320 62,000 62,000 62,795 ___________<br />
TOTAL WATER PUMPING 142,334 164,000 158,950 167,795<br />
WATER TREATMENT<br />
OPERATING EXPENSES<br />
Rental / Fleet Equipment 6,340 3,343 3,343 3,405 ___________<br />
Gasoline / Fleet Equipment 4,595 9,082 3,070 4,325 ___________<br />
Maintenance / Fleet Equipment 1,245 3,505 2,119 5,731 ___________<br />
Electric Utility Service 186,045 177,998 177,998 175,040 ___________<br />
Contractual Services 20,559 9,800 9,250 9,800 ___________<br />
Chemicals 332,489 385,129 355,116 423,640 ___________<br />
Tools & Implements 403 1,800 1,800 1,800 ___________<br />
Parts For Equipment 26,307 33,700 33,700 33,700 ___________<br />
Materials 42,884 30,000 30,000 30,000 ___________<br />
Licenses & Permits 1,575 2,500 2,500 2,500 ___________<br />
Rentals 1,100 1,100 1,100 ___________<br />
SUB-TOTAL 622,442 657,957 619,996 691,041<br />
Mandatory Certification Requirement 1,799 6,500 6,500 6,500 ___________<br />
CACO3 Transport 33,763 31,000 31,000 37,000 ___________<br />
Cleaning Of Upflow Internals 14,824 15,000 15,000 15,000 ___________<br />
Outside Laboratory Services (2,970) 25,000 25,000 25,000 ___________<br />
TOTAL WATER TREATMENT 669,858 735,457 697,496 774,541<br />
E – 155
WATER UTILITY<br />
BUDGET FOR YEAR 2007-08<br />
Experience Budget Experience Proposed Adjustments<br />
For Year For Year 2006-07 by by<br />
2005-06 2006-07 Estimated <strong>City</strong> Manager <strong>City</strong> Commission<br />
COMBEE WATER TREATMENT PLANT - GENERAL<br />
PERSONAL SERVICES 652,539 896,019 762,286 916,787<br />
OPERATING EXPENSES<br />
Rental / Fleet Equipment 5,347 3,256 3,256 3,439 ___________<br />
Gasoline / Fleet Equipment 2,315 1,824 2,705 3,211 ___________<br />
Maintenance / Fleet Equipment 567 1,520 2,041 2,342 ___________<br />
Water Utility Service 356 750 750 754 ___________<br />
Stormwater Fees 800 800 1,800 ___________<br />
Electric Utility Service 287,536 249,197 354,197 387,107 ___________<br />
Wastewater Utility Service 750 750 806 ___________<br />
Solid Waste Service 722 1,182 617 963 ___________<br />
Other <strong>City</strong> Department Charges 15 3 3<br />
Intra-Dept Charges - Computer Rental 11,014 10,854 10,854 12,068 ___________<br />
Intra-Dept Charges - Telephone 5,425 5,491 5,491 5,943 ___________<br />
Intra-Dept Charges - Radios 2,338 2,356 2,356 2,572 ___________<br />
Intra-Dept Charges - Facilities 14,363 ___________<br />
Contractual Services 820 12,800 12,800 12,800 ___________<br />
Advertising 2,997 2,000 2,000 ___________<br />
Security 2,922<br />
Pr<strong>of</strong>essional Services 2,922<br />
Office Supplies 4,521 4,000 4,000 4,000 ___________<br />
Equipment - Noncapital 1,948 2,000 2,000 2,000 ___________<br />
All Other Materials & Supplies 8,916 8,300 8,300 9,000 ___________<br />
Uniforms 4,365 4,500 4,500 4,500 ___________<br />
Chemicals 104,648 151,200 131,008 151,200 ___________<br />
Tools & Implements 5,367 3,000 3,000 3,000 ___________<br />
Electrical, Hardware & Plumbing Supplies 3,536 2,500 2,500 2,500 ___________<br />
Personal Safety Equipment 508 3,000 3,000 3,000 ___________<br />
Parts For Equipment 2,736 3,000 3,000 3,000 ___________<br />
Materials 6,058 12,000 12,000 18,000 ___________<br />
Use Tax Allocation (7) (32)<br />
#2 Oil 5,000 5,000 5,000 ___________<br />
Rentals 800 800 800 ___________<br />
Repair Of Equipment 4,100 4,100 4,100 ___________<br />
Postage & Mailing 47 200 200 200 ___________<br />
Telephone, Communications 486 9,900 9,900 9,900 ___________<br />
Contingency 25,000 ___________<br />
Training 140<br />
Telephone-Long Distance 10 190 190 190 ___________<br />
Licenses & Permits 2,050 3,500 3,500 3,500 ___________<br />
SUB-TOTAL 467,628 510,970 595,587 699,058<br />
E – 156
WATER UTILITY<br />
BUDGET FOR YEAR 2007-08<br />
Experience Budget Experience Proposed Adjustments<br />
For Year For Year 2006-07 by by<br />
2005-06 2006-07 Estimated <strong>City</strong> Manager <strong>City</strong> Commission<br />
NE Wellfield Monitoring 31,646 40,000 45,000 45,000 ___________<br />
PICS Expendables 1,136 2,000 2,000 2,000 ___________<br />
Maintenance Of NE Wellfield 1,790 20,000 20,050 27,550 ___________<br />
Emergency Well Maintenance 11,000 11,000 11,000 ___________<br />
Emergency Generator Service 2,500 2,500 2,500 ___________<br />
Mandatory Certification Requirement 4,266 5,800 5,800 5,800 ___________<br />
CACO3 Transport 11,918 18,000 18,000 19,000 ___________<br />
Risk Management Process 6,500 6,500 6,500 ___________<br />
Water Plant Security 100,971 119,662 119,662 122,000 ___________<br />
Delta V Operations S<strong>of</strong>tware Maint. 16,700 16,700 17,473 ___________<br />
TOTAL COMBEE WATER TREATMENT<br />
PLANT - GENERAL 1,271,894 1,649,151 1,605,085 1,874,668<br />
TOTAL WATER PRODUCTION 4,979,870 5,583,494 5,320,556 5,991,483<br />
WATER T&D - GENERAL<br />
PERSONAL SERVICES 745,102 1,006,251 854,279 989,954<br />
OPERATING EXPENSES<br />
Rental / Fleet Equipment 9,528 17,613 17,613 18,012 ___________<br />
Gasoline / Fleet Equipment 4,430 58,977 4,502 14,062 ___________<br />
Maintenance / Fleet Equipment 2,902 50,436 4,874 13,774 ___________<br />
Other <strong>City</strong> Department Charges 6,664 1,000 1,000 1,000 ___________<br />
Intra-Dept Charges - Computer Rental 39,011 32,543 32,543 39,162 ___________<br />
Electric Charges- Dispatch 44,964 34,610 34,610 39,760 ___________<br />
Intra-Dept Charges - Telephone 5,300 10,701 10,701 6,070 ___________<br />
Intra-Dept Charges - Radios 17,702 17,503 17,503 18,649 ___________<br />
Intra-Dept Charges - Facilities 10,114 11,725 11,725 13,461 ___________<br />
Intra-Dept Charges - Janitorial 4,213 4,770 4,770 4,453 ___________<br />
Pr<strong>of</strong>essional Services 30 60 ___________<br />
Contract Labor 8,946 12,000 12,722 12,500 ___________<br />
Office Supplies 5,476 4,500 7,588 5,100 ___________<br />
Equipment - Noncapital 2,785 1,500 3,510 1,700 ___________<br />
All Other Materials & Supplies 1,793 2,000 2,116 2,000 ___________<br />
Uniforms 11,435 13,200 15,611 14,850 ___________<br />
Tools & Implements 13,945 8,000 13,521 12,000 ___________<br />
Personal Safety Equipment 2,566 2,500 3,626 2,700 ___________<br />
Parts For Equipment 1,413 800 785 800 ___________<br />
Materials 2,910 700 1,002 600 ___________<br />
Repair Of Equipment 541 2,000 56 3,500 ___________<br />
Subscriptions & Memberships 174 150 32 150 ___________<br />
Telephone, Communications 1,052 950 1,464 1,100 ___________<br />
Travel 2 800 3 600 ___________<br />
Training 370 4,128 3,541 5,000 ___________<br />
Telephone-Long Distance 90 200 29 200 ___________<br />
Licenses & Permits - CSX 500 234 500 ___________<br />
Recoveries-From Outside <strong>City</strong> (4,595) (1,628) (1,628)<br />
SUB-TOTAL 193,761 292,178 204,052 231,763<br />
E – 157
WATER UTILITY<br />
BUDGET FOR YEAR 2007-08<br />
Experience Budget Experience Proposed Adjustments<br />
For Year For Year 2006-07 by by<br />
2005-06 2006-07 Estimated <strong>City</strong> Manager <strong>City</strong> Commission<br />
Water T&D - Services 288,958 287,900 298,602 300,000 ___________<br />
Water T&D - Mains 333,690 334,900 283,700 320,600 ___________<br />
Water T&D - Hydrants 13,004 28,090 25,904 30,055 ___________<br />
Water T&D - Medical Asbestos Screening 6,579 13,930 13,930 14,290 ___________<br />
Water T&D - A/C Pipe Handling Training 7,344 19,320 17,820 19,520 ___________<br />
Water T&D - Skills Training 2,004 10,980 10,980 10,980 ___________<br />
Water T&D - Disposal/Dumping Fees 2,000 2,000 ___________<br />
Water T&D - Equipment Maintenance 1,362 5,300 3,100 5,400 ___________<br />
Water T&D - Sunshine One-Call Locates 156,528 134,670 137,441 144,940 ___________<br />
Water T&D - Leak Detection/Main Repair 19,106 23,650 28,300 55,400 ___________<br />
Water T&D - Valve Maintenance Program 26,526 50,095 44,000 73,195 ___________<br />
Water T&D - Hydrant Maint. Program 77,930 88,200 98,200 161,500 ___________<br />
Water T&D - <strong>City</strong> P & R Maint. Support 217 3,525 475 3,725 ___________<br />
Water T&D - Traffic Control Support O&M 2,500 2,500 2,500 ___________<br />
Water T&D - Water Facilities Security 7,800 10,000 10,000 10,230 ___________<br />
TOTAL WATER T & D - GENERAL 1,879,911 2,311,489 2,035,282 2,376,052<br />
WATER T&D - METERS<br />
PERSONAL SERVICES 200,396 216,450 213,033 204,750<br />
OPERATING EXPENSES<br />
Rental / Fleet Equipment 14,556 12,000 12,468 12,000 ___________<br />
Gasoline / Fleet Equipment 18,879 16,000 20,108 19,500 ___________<br />
Maintenance / Fleet Equipment 15,894 10,700 21,436 20,000 ___________<br />
Other <strong>City</strong> Department Charges 4,698 2,000 2,000 3,000 ___________<br />
Contractual Services 375<br />
Contract Labor 1,053 3,000 2,365 2,000 ___________<br />
Office Supplies 9 500 500 ___________<br />
Equipment - Noncapital 500 500 ___________<br />
All Other Materials & Supplies 128 200 200 ___________<br />
Uniforms 2,311<br />
Tools & Implements 5,844 4,200 6,078 5,000 ___________<br />
Personal Safety Equipment 1,106 1,000 1,257 1,100 ___________<br />
Parts For Equipment 4,025 4,000 6,376 4,000 ___________<br />
Materials 82,554 50,000 89,172 75,000 ___________<br />
Use Tax Allocation (15)<br />
Rentals 65 500 496 600 ___________<br />
Repair Of Equipment 3,000 5,700 ___________<br />
Construction Advances (8,156) (950)<br />
SUB-TOTAL 143,341 107,600 160,792 149,100<br />
Water T&D-Meters - Polk <strong>City</strong> 130 130 ___________<br />
Water T&D-Meters - Rebuild Water Meters 157,073 169,250 166,250 170,250 ___________<br />
TOTAL T & D - METERS 500,810 493,430 540,075 524,230<br />
E – 158
WATER UTILITY<br />
BUDGET FOR YEAR 2007-08<br />
Experience Budget Experience Proposed Adjustments<br />
For Year For Year 2006-07 by by<br />
2005-06 2006-07 Estimated <strong>City</strong> Manager <strong>City</strong> Commission<br />
WATER T & D - CROSS CONNECTION CONTROL<br />
PERSONAL SERVICES 81,115 72,800 121,521 104,650<br />
Rental / Fleet Equipment 3,769 4,400 3,504 4,400 ___________<br />
Gasoline / Fleet Equipment 4,698 4,700 5,924 6,000 ___________<br />
Maintenance / Fleet Equipment 4,543 2,500 5,732 5,000 ___________<br />
Other <strong>City</strong> Department Charges 1,228 1,300 2,800 1,100 ___________<br />
Contractual Services 95 95 ___________<br />
Contract Labor 9 750 431 750 ___________<br />
Office Supplies 500 500 ___________<br />
Equipment - Noncapital 500 500 ___________<br />
Tools & Implements 18 100 100 ___________<br />
Personal Safety Equipment 100 100 ___________<br />
Parts For Equipment 12,250 3,500 ___________<br />
Materials 12,008 7,500 18,752 12,000 ___________<br />
Repair Of Equipment 598 500 612 750 ___________<br />
Postage & Mailing 100 100 ___________<br />
SUB-TOTAL 26,871 35,295 37,755 34,895<br />
TOTAL WATER T & D - CROSS<br />
CONNECTION CONTROL 107,986 108,095 159,276 139,545<br />
TOTAL WATER T & D 2,488,707 2,913,014 2,734,633 3,039,827<br />
Total Operating Expenses 10,353,198 11,981,598 11,280,045 13,350,264<br />
Debt Service and Other Expenses<br />
Interest on Long Term Debt 3,104,931 3,072,207 3,072,207 3,035,507 ___________<br />
Principal on Long-Term Debt 1,270,000 1,305,000 1,305,000 1,330,000 ___________<br />
Interest Paid on Customer Deposits 8,186 70,152 72,058 72,323 ___________<br />
SUB-TOTAL 4,383,117 4,447,359 4,449,265 4,437,830<br />
Contributions to Other Funds<br />
General Fund 3,664,114 3,734,108 3,734,108 3,902,143 ___________<br />
Information Technology Fund 26,098 26,098 26,098 26,098 ___________<br />
Water Renewal and Replacement Fund 3,300,000 3,300,000 3,300,000 3,300,000 ___________<br />
SUB-TOTAL 6,990,212 7,060,206 7,060,206 7,228,241<br />
TOTAL EXPENSES 21,726,527 23,489,163 22,789,516 25,016,335<br />
E – 159
WATER UTILITY<br />
BUDGET FOR YEAR 2007-08<br />
Experience Budget Experience Proposed Adjustments<br />
For Year For Year 2006-07 by by<br />
2005-06 2006-07 Estimated <strong>City</strong> Manager <strong>City</strong> Commission<br />
PERSONNEL<br />
Current Proposed Pay Salary<br />
POSITION TITLE Budget Budget Grade Range<br />
ADMINISTRATION<br />
Director Of Water Utilities 1 1 PB 2 *<br />
Assistant Director <strong>of</strong> Water Utilities 1 1 PB 4 *<br />
Chief Accountant 1 1 63 58,718 - 88,899<br />
Environmental Coordinator 1 1 60 54,579 - 82,618<br />
Data Analyst II 1 1 42 35,173 - 53,248<br />
ENGINEERING<br />
Water Utilities Engineering Supervisor 1 1 74 76,794 - 116,230<br />
Water Utility Construction Coordinator 1 1 71 71,365 - 108,077<br />
Pr<strong>of</strong>essional Engineer 2 2 69 67,974 - 102,918<br />
Engineer III 2 2 67 64,730 - 98,010<br />
Eng Tech Supervisor 1 1 58 51,979 - 78,666<br />
Engineering Tech IV 3 3 56 49,504 - 74,922<br />
Water Utilities New Growth Tech III 1 1 51 43,805 - 64,730<br />
Engineering Tech II 2 2 45 37,835 - 57,304<br />
Water Utility Line Construction Inspector 4 4 42 35,173 - 53,248<br />
Engineering Tech I 2 2 38 31,907 - 48,298<br />
Office Associate II 1 1 29 25,605 - 38,771<br />
Office Associate I 1 1 24 22,693 - 34,320<br />
PRODUCTION<br />
Manager Of Water Production 1 1 60 54,579 - 82,618<br />
Water Chemist 1 1 56 49,504 - 74,922<br />
Chief Water Plant Operator 2 2 54 47,133 - 71,365<br />
Programmer II 1 1 54 47,133 - 71,365<br />
Water Plant Supervisor 10 10 49 41,725 - 63,190<br />
Electrical Technician 1 1 45 37,835 - 57,304<br />
Water Plant Operator II 13 13 38 31,907 - 48,298<br />
Water Plant Mechanic II 2 2 38 31,907 - 48,298<br />
Water Plant Instrument Tech II 1 1 38 31,907 - 48,298<br />
Office Associate II 2 2 29 25,605 - 38,771<br />
Operations Support Technician I 2 2 24 22,693 - 34,320<br />
E – 160
WATER UTILITY<br />
BUDGET FOR YEAR 2007-08<br />
Experience Budget Experience Proposed Adjustments<br />
For Year For Year 2006-07 by by<br />
2005-06 2006-07 Estimated <strong>City</strong> Manager <strong>City</strong> Commission<br />
DISTRIBUTION<br />
Manager Of Water Distribution 1 1 60 54,579 - 82,618<br />
Engineering Technician IV 1 1 56 49,504 - 74,922<br />
Water Distribution Supervisor 2 2 54 47,133 - 71,365<br />
Engineering Technician III 2 2 51 43,805 - 64,730<br />
Materials Planner 1 1 47 39,749 - 60,174<br />
Water Meter Repairer Foreman 2 2 45 37,835 - 57,304<br />
Water Pipefitter Foreman 6 6 45 37,835 - 57,304<br />
Water Meter Repairer II 11 11 36 30,389 - 45,989<br />
Water Pipefitter II 20 22 36 30,389 - 45,989<br />
Account Clerk IV 1 1 33 28,246 - 42,765<br />
Water Meter Repairer I 1 1 31 26,894 - 40,726<br />
Water Pipefitter I 2 2 31 26,894 - 40,726<br />
Account Clerk III 1 1 29 25,605 - 38,771<br />
Office Associate II 1 1 29 25,605 - 38,771<br />
Traffic Control Technician 4 4 22 21,590 - 32,677<br />
TOTAL FULL-TIME EMPLOYEES 118 120<br />
PART-TIME<br />
Students 2 2<br />
TOTAL PART TIME EMPLOYEES 2 2<br />
CONTRACT EMPLOYEES<br />
Water Pipefitter I 6 6<br />
Special Project Inspector 2 2<br />
TOTAL CONTRACT EMPLOYEES 8 8<br />
E – 161
THIS PAGE IS INTENTIONALLY BLANK<br />
E-162 Fiscal Year <strong>2008</strong> Annual Budget
REVENUE AND EXPENDITURE SUMMARY<br />
PARKING<br />
Experience Budget Experience 2007-08<br />
For Year For Year 2006-07 Proposed by<br />
EXPENSES 2005-06 2006-07 Estimated <strong>City</strong> Manager<br />
Personnel<br />
Salaries and Wages 207,330 213,486 196,837 239,792<br />
Fringe Benefits 52,649 62,234 55,817 78,371<br />
Total Personnel 259,979 275,720 252,654 318,163<br />
Non-Personnel<br />
Internal Service Charges 161,452 136,415 135,710 151,507<br />
Pr<strong>of</strong>essional and Contractual 9,635 17,400 7,274 6,149<br />
Utilities 106,406 121,288 113,583 120,744<br />
Insurance and Fixed Charges 27,295 30,264 25,145 42,700<br />
All Other Operations and Maintenance 97,858 282,532 245,405 507,730<br />
Capital Outlay 5,026 84,203 60,203 36,400<br />
Debt Service 89,668 334,468 89,668 89,668<br />
Total Non-Personnel 497,340 1,006,570 676,988 954,898<br />
Total Expenditures 757,319 1,282,290 929,642 1,273,061<br />
Transfers<br />
Transfers In 288,933 180,168 127,293 555,333<br />
Transfers Out<br />
Net Transfers 288,933 180,168 127,293 555,333<br />
Revenue Sources<br />
Taxes<br />
Licenses and Permits<br />
Intergovernmental<br />
Charges for Services 492,928 520,468 500,985 561,503<br />
Interest Income 10,470 11,434 9,658 9,423<br />
All Other Revenue 97,581 257,540 233,215 68,050<br />
Total Revenue 600,979 789,442 743,858 638,976<br />
Funding to be Provided (132,593) 312,680 58,491 78,752<br />
E – 163
PARKING<br />
BUDGET FOR YEAR 2007-08<br />
Experience Budget Experience Proposed Adjustments<br />
For Year For Year 2006-07 by by<br />
2005-06 2006-07 Estimated <strong>City</strong> Manager <strong>City</strong> Commission<br />
REVENUES CHARGES FOR SERVICES<br />
Parking Lots - Leased<br />
North Florida Avenue Lot - Heacock Ins. 12,964 13,334 6,018<br />
South Massachusetts Avenue - Publix 9,210 8,580 10,378 10,375 ___________<br />
Citrus Mutual Lot:<br />
Publix 20,045 21,000 20,044 20,045 ___________<br />
Chamber / Ruthven 10,800 10,800 10,800 12,600 ___________<br />
Bay Street Lot 12,084 14,040 12,300 14,770 ___________<br />
Massachusetts & Main Temp Lot 24,870 23,400 17,760 26,000 ___________<br />
Parking Lot-South Tennessee - Leased 18,388 18,720 20,040 26,460 ___________<br />
Missouri Avenue 10,280 9,780 8,880 8,880 ___________<br />
Dixieland 360 720 360 420 ___________<br />
Cedar St. / Mass Ave. (Crisper's Lot) 3,960 3,960 3,960 4,620 ___________<br />
Parking Lot - Federal Building 2,550 4,140<br />
SUB-TOTAL 125,511 124,334 114,680 124,170<br />
Parking Lots - Metered<br />
Munn Park - Cedar Street 12,657 18,000 13,762 13,367 ___________<br />
Bay Street Lot 3,637 3,300 2,348 2,400 ___________<br />
SUB-TOTAL 16,294 21,300 16,110 15,767<br />
Parking Garages<br />
FedEx-Orange St. Garage 62,887 55,732 62,887 62,903 ___________<br />
Publix-Orange St. Garage 43,501 43,103 43,103 43,103 ___________<br />
Ad Valorem Taxes - Orange St. Garage 4,272 4,115 4,146 4,500 ___________<br />
Daily Collections - Main Street 11,681 10,500 11,600 11,300 ___________<br />
Leased Parking - Main Street 215,242 232,116 232,000 267,900 ___________<br />
Ad Valorem Taxes - Main Street 1,630 4,068 4,099 4,500 ___________<br />
State Garage 11,910 25,200 12,360 27,360 ___________<br />
SUB-TOTAL 351,123 374,834 370,195 421,566<br />
TOTAL CHARGES FOR SERVICES 492,928 520,468 500,985 561,503<br />
E – 164
PARKING<br />
BUDGET FOR YEAR 2007-08<br />
Experience Budget Experience Proposed Adjustments<br />
For Year For Year 2006-07 by by<br />
2005-06 2006-07 Estimated <strong>City</strong> Manager <strong>City</strong> Commission<br />
FINES AND FORFEITS<br />
Violation <strong>of</strong> Local Ordinances<br />
Parking Fines 97,544 85,000 60,000 68,000 ___________<br />
TOTAL FINES AND FORFEITS 97,544 85,000 60,000 68,000<br />
MISCELLANEOUS REVENUE<br />
Interest Earnings<br />
Interest on Pooled Investments 9,715 10,355 8,604 8,385 ___________<br />
Int. on Pooled Invest. - Expan Res. 755 1,079 1,054 1,038 ___________<br />
SUB-TOTAL 10,470 11,434 9,658 9,423<br />
Other Miscellaneous Revenue<br />
Insurance Proceeds - Workers Comp Claim 670<br />
All Other Miscellaneous Revenue 37 40 45 50 ___________<br />
SUB-TOTAL 37 40 715 50<br />
TOTAL MISCELLANEOUS<br />
REVENUE 10,507 11,474 10,373 9,473<br />
OPERATING SUBSIDIES<br />
Interfund Transfers<br />
Transportation Fund 288,933 352,668 127,293 555,333 ___________<br />
TOTAL OPERATING SUBSIDIES 288,933 352,668 127,293 555,333<br />
PRIOR YEARS SURPLUS (132,593) 312,680 230,991 78,752<br />
GRAND TOTAL REVENUES 757,319 1,282,290 929,642 1,273,061<br />
E – 165
PARKING<br />
BUDGET FOR YEAR 2007-08<br />
Experience Budget Experience Proposed Adjustments<br />
For Year For Year 2006-07 by by<br />
2005-06 2006-07 Estimated <strong>City</strong> Manager <strong>City</strong> Commission<br />
EXPENSES<br />
PARKING GARAGES - ORANGE STREET<br />
PERSONAL SERVICES 59,785 69,061 31,376 93,416<br />
OPERATING EXPENSES<br />
Retiree Health Insurance Subsidy 2,460 2,570 2,570 3,215 ___________<br />
Rental / Fleet Equipment 3,187 1,073 989 1,133 ___________<br />
Gasoline / Fleet Equipment 145 407 153 64 ___________<br />
Maintenance / Fleet Equipment 253 379 756 296 ___________<br />
Intra-Dept Charges - Telephone 234 234 240 311 ___________<br />
Intra-Dept Charges - Facilities 3,901 4,301 4,300 7,275 ___________<br />
Special Services 500 500 500 ___________<br />
Equipment - Noncapital 1,250 50 50 50 ___________<br />
All Other Materials & Supplies 1,719 1,500 1,500 2,000 ___________<br />
Uniforms 488 500 500 500 ___________<br />
Repair <strong>of</strong> Equipment 100 100 100 ___________<br />
Telephone, Communications 1,907 1,800 1,800 1,800 ___________<br />
All Other Sundry Charges 34 100 100 100 ___________<br />
Ad Valorem Taxes 4,274 4,147 4,146 4,500 ___________<br />
SUB-TOTAL 19,852 17,661 17,704 21,844<br />
TOTAL 79,637 86,722 49,080 115,260<br />
E – 166
PARKING<br />
BUDGET FOR YEAR 2007-08<br />
Experience Budget Experience Proposed Adjustments<br />
For Year For Year 2006-07 by by<br />
2005-06 2006-07 Estimated <strong>City</strong> Manager <strong>City</strong> Commission<br />
PARKING GARAGES - MAIN STREET<br />
PERSONAL SERVICES 125,584 106,018 125,316 112,121<br />
OPERATING EXPENSES<br />
Rental / Fleet Equipment 7,774 2,760 2,892 2,915 ___________<br />
Gasoline / Fleet Equipment 816 259 240 164 ___________<br />
Maintenance / Fleet Equipment 757 1,777 1,401 762 ___________<br />
Intra-Dept Charges - Computer Rental 2,090 1,676 1,582 1,872 ___________<br />
Intra-Dept Charges - Radios 360 322 ___________<br />
Intra-Dept Charges - Facilities 2,166 2,511 2,512 3,013 ___________<br />
Intra-Dept Charges - IT 1,786 2,627 2,628 2,393 ___________<br />
Intra-Dept Charges - Training<br />
296 ___________<br />
Special Services 600 4,000 4,000 2,500 ___________<br />
Office Supplies 2,092 2,050 2,050 2,000 ___________<br />
All Other Materials & Supplies 1,859 2,450 2,450 3,200 ___________<br />
Uniforms 683 1,000 1,000 1,000 ___________<br />
Cleaning and Janitorial Supplies 199<br />
Repair <strong>of</strong> Equipment 36 500 500 500 ___________<br />
Subscription & Membership 400 600 600 720 ___________<br />
Travel 1,264 1,300 750 750 ___________<br />
Contingency 2,004<br />
Training 514 600 600 600 ___________<br />
All Other Sundry Charges 303 400 400 300 ___________<br />
Ad Valorem Taxes 4,225 4,099 4,099 4,500 ___________<br />
SUB-TOTAL 27,564 30,973 27,704 27,807<br />
TOTAL 153,148 136,991 153,020 139,928<br />
E – 167
PARKING<br />
BUDGET FOR YEAR 2007-08<br />
Experience Budget Experience Proposed Adjustments<br />
For Year For Year 2006-07 by by<br />
2005-06 2006-07 Estimated <strong>City</strong> Manager <strong>City</strong> Commission<br />
PARKING GARAGES - IOWA AVENUE<br />
PERSONAL SERVICES 61,694 61,928 56,661 67,076<br />
OPERATING EXPENSES<br />
Intra-Dept Charges - Facilities 2,850 3,305 3,306 3,715 ___________<br />
Uniforms 500 ___________<br />
All Other Materials and Supplies 250 ___________<br />
SUB-TOTAL 2,850 3,305 3,306 4,465<br />
Costs Allocated to E&W (64,591) (65,233) (59,967) (71,541)<br />
TOTAL (47)<br />
PARKING GARAGES - STATE GARAGE<br />
PERSONAL SERVICES 19,927 15,732 27,502<br />
OPERATING EXPENSES<br />
Uniforms 400 400 500 ___________<br />
All other Materials & Supplies 800 800 800 ___________<br />
SUB-TOTAL 1,200 1,200 1,300<br />
TOTAL 21,127 16,932 28,802<br />
PARKING ENFORCEMENT<br />
PERSONAL SERVICES 77,507 84,019 83,536 89,588<br />
OPERATING EXPENSES<br />
Rental / Fleet Equipment 1,635 1,115 1,116 1,178 ___________<br />
Gasoline / Fleet Equipment 11 36 65 ___________<br />
Maintenance / Fleet Equipment 746 231 231 307 ___________<br />
Agency Commission 5,328 10,000<br />
Office Supplies 257 400 400 400 ___________<br />
Uniforms 694 600 600 600 ___________<br />
Repair <strong>of</strong> Equipment 250 200 ___________<br />
Printing and Photography 1,657 3,500 2,200 3,500 ___________<br />
SUB-TOTAL 10,328 16,132 4,547 6,250<br />
TOTAL 87,835 100,151 88,083 95,838<br />
E – 168
PARKING<br />
BUDGET FOR YEAR 2007-08<br />
Experience Budget Experience Proposed Adjustments<br />
For Year For Year 2006-07 by by<br />
2005-06 2006-07 Estimated <strong>City</strong> Manager <strong>City</strong> Commission<br />
OTHER CASH DISBURSEMENTS<br />
NON-DEPARTMENTAL EXPENSES<br />
Self-Insurance Service 12,575 11,178 9,726 10,901 ___________<br />
Water Utility Service 5,263 5,108 5,567 5,544 ___________<br />
Purchasing & Stores Service 1,154 1,226 1,226 1,324 ___________<br />
Stormwater Fees 1,272 1,280 1,272 2,862 ___________<br />
General Fund Service 131,947 112,138 112,138 124,102 ___________<br />
Electric Utility Service 92,814 107,941 99,434 104,794 ___________<br />
Wastewater Utility Service 4,043 4,008 4,320 4,495 ___________<br />
Solid Waste Service 1,107 1,151 1,190 1,250 ___________<br />
Insurance - Fire 12,231 16,433 12,766 28,550 ___________<br />
- Position Bond and<br />
Crime Coverage 29 83 83 34 ___________<br />
Banking Service 533 600 600 650 ___________<br />
Insurance Consultant 347 400 400 499 ___________<br />
Annual Audit 2,827 1,900 1,774 2,000 ___________<br />
Bad Debt Expense 528 1,300 600 1,100 ___________<br />
Citrus Mutual Parking Lot Lease 26,382 26,382 25,560 25,560 ___________<br />
State Garage Leases 18,000 18,000 18,000 18,000 ___________<br />
TOTAL 311,052 309,128 294,656 331,665<br />
OTHER CASH DISBURSEMENTS<br />
SPECIAL PROJECTS<br />
Orange Street Garage:<br />
Deck Coating Sealant 270,000 ___________<br />
Main Street Garage:<br />
Pay By Space Machines 2,920 22,578 22,578<br />
Main St Garage Lighting 11,000 11,000<br />
Security Cameras Main St Garage 2,106 26,625 26,625<br />
Structural Inspections 3,500 5,500 5,500 5,500 ___________<br />
Deck Coating 160,000 ___________<br />
Gate Replacement 20,000 ___________<br />
Main and Orange St Garage -<br />
Structural Repairs 27,500 172,500 172,500<br />
Multi Space Parking Meters 24,000 16,400 ___________<br />
Munn Park - Parking Lot Resurfacing 13,500<br />
L<strong>of</strong>ts on the Park/Main St Parking Garage 7,250<br />
Misc. Parking Projects 10,750<br />
SUB-TOTAL 36,026 293,703 238,203 471,900<br />
E – 169
PARKING<br />
BUDGET FOR YEAR 2007-08<br />
Experience Budget Experience Proposed Adjustments<br />
For Year For Year 2006-07 by by<br />
2005-06 2006-07 Estimated <strong>City</strong> Manager <strong>City</strong> Commission<br />
DEBT SERVICE<br />
Principal & Interest - Internal Loans:<br />
Verizon Property Purchase 88,933 88,933 88,933 88,933 ___________<br />
State Garage 244,800<br />
Radio System Expan. - DOIT 735 735 735 735 ___________<br />
SUB-TOTAL 89,668 334,468 89,668 89,668<br />
TOTAL 125,694 628,171 327,871 561,568<br />
GRAND TOTAL EXPENSES 757,319 1,282,290 929,642 1,273,061<br />
PERSONNEL<br />
Current Proposed Pay Salary<br />
POSITION TITLE Budget Budget Grade Range<br />
Parking System Foreman 1 1 38 31,907 - 48,298<br />
Parking System Attendant 5 6 27 24,398 - 36,941<br />
TOTAL FULL-TIME EMPLOYEES 6 7<br />
PART-TIME<br />
Parking System Attendant 3 2<br />
TOTAL PART-TIME EMPLOYEES 3 2<br />
E – 170
REVENUE AND EXPENDITURE SUMMARY<br />
THE LAKELAND CENTER<br />
Experience Budget Experience 2007-08<br />
For Year For Year 2006-07 Proposed by<br />
EXPENSES 2005-06 2006-07 Estimated <strong>City</strong> Manager<br />
Personnel<br />
Salaries and Wages 2,054,651 2,204,733 2,433,246 2,314,380<br />
Fringe Benefits 331,166 244,385 409,838 442,645<br />
Total Personnel 2,385,817 2,449,118 2,843,084 2,757,025<br />
Non-Personnel<br />
Internal Service Charges 594,263 604,928 605,510 634,121<br />
Pr<strong>of</strong>essional and Contractual 1,395,001 1,398,963 1,400,903 1,551,831<br />
Utilities 853,453 674,335 913,542 925,869<br />
Insurance and Fixed Charges 121,104 142,059 110,436 150,143<br />
All Other Operations and Maintenance 862,660 733,225 701,322 703,933<br />
Capital Outlay 150,558 732,829 744,680 759,780<br />
Debt Service 1,437,200 1,432,501 1,432,501 1,416,501<br />
Total Non-Personnel 5,414,239 5,718,840 5,908,894 6,142,178<br />
Total Expenditures 7,800,056 8,167,958 8,751,978 8,899,203<br />
Transfers<br />
Transfers In 2,727,994 3,075,602 3,075,602 3,155,969<br />
Transfers Out<br />
Net Transfers 2,727,994 3,075,602 3,075,602 3,155,969<br />
Revenue Sources<br />
Taxes<br />
Licenses and Permits<br />
Intergovernmental 512,657 477,669 499,784 499,784<br />
Charges for Services 4,532,986 4,462,893 4,964,995 5,210,947<br />
Interest Income 64,769 82,146 79,063 53,629<br />
All Other Revenue 4,071 115,000 65,000 75,000<br />
Total Revenue 5,114,483 5,137,708 5,608,842 5,839,360<br />
Funding to be Provided (42,421) (45,352) 67,534 (96,126)<br />
E – 171
LAKELAND CENTER<br />
BUDGET FOR YEAR 2007-08<br />
Experience Budget Experience Proposed Adjustments<br />
For Year For Year 2006-07 by by<br />
2005-06 2006-07 Estimated <strong>City</strong> Manager <strong>City</strong> Commission<br />
REVENUES INTERGOVERNMENTAL<br />
Local Grants<br />
PCCVB-Visitor Information Office 11,000 11,000 11,000 11,000 ___________<br />
PCCVB-Reimbursement <strong>of</strong><br />
Expenses 24,986 26,665 48,780 48,780 ___________<br />
Tourist Development Tax 476,671 440,004 440,004 440,004 ___________<br />
TOTAL INTERGOVERNMENTAL 512,657 477,669 499,784 499,784<br />
CHARGES FOR SERVICES<br />
Rentals (Client Services)<br />
Conference Center 180,772 171,011 194,596 196,891 ___________<br />
Exhibit Hall 112,960 137,506 146,818 153,645 ___________<br />
Arena 250,153 199,070 209,973 215,900 ___________<br />
Theatre 180,290 178,410 229,990 240,205 ___________<br />
SUB-TOTAL 724,175 685,997 781,376 806,641<br />
Events - ARA (Client Services)<br />
Catering 200,202 212,529 205,397 211,559 ___________<br />
Service Charge Commission 102,488 59,166 114,400 117,832 ___________<br />
Concessions 228,881 226,939 271,674 279,824 ___________<br />
Beverages 90,095 89,075 100,430 103,443 ___________<br />
Program Sales 36,304 40,248 35,179 36,234 ___________<br />
SUB-TOTAL 657,970 627,957 727,081 748,893<br />
Event Revenue (Client Services)<br />
Set Up Charges 40,465 20,000 10,000 10,000 ___________<br />
Forfeited Deposits 3,735 12,000 5,000 ___________<br />
Vending Machine Sales 6,610 6,910 6,000 6,500 ___________<br />
Net Income on Promotions (42,398) (60,000) (225,000) (60,000) ___________<br />
All Other 46,492 58,500 120,000 125,000 ___________<br />
State Sales Tax Collection Fee 360 360 360 360 ___________<br />
SUB-TOTAL 55,264 25,770 (76,640) 86,860<br />
Event Revenue - (Parking)<br />
Parking 429,486 516,039 479,916 494,314 ___________<br />
Over Sized Vehicle Parking 9,983 14,919 13,875 14,291 ___________<br />
Overnight Parking 17,144 12,368 11,502 11,847 ___________<br />
Pre-Paid Parking 134,849 136,498 126,943 130,751 ___________<br />
SUB-TOTAL 591,462 679,824 632,236 651,203<br />
E – 172
LAKELAND CENTER<br />
BUDGET FOR YEAR 2007-08<br />
Experience Budget Experience Proposed Adjustments<br />
For Year For Year 2006-07 by by<br />
2005-06 2006-07 Estimated <strong>City</strong> Manager <strong>City</strong> Commission<br />
Event Revenue - (Box Office)<br />
Facilities & Service Charge 115,164 113,712 135,000 140,000 ___________<br />
Box Office Charges 28,983 24,000 15,000 20,000 ___________<br />
Ticket Recovery 30,608 29,534 40,000 42,000 ___________<br />
State Sales Tax Collection Fee 327 240 240 350 ___________<br />
Advertising Charges 4,000 1,000 1,000 ___________<br />
Packing and Shipping 27,363 30,000 20,000 20,000 ___________<br />
Cash Over and Short (329) 200 100 200 ___________<br />
SUB-TOTAL 202,116 201,686 211,340 223,550<br />
Expense Recoveries - (Client Services)<br />
Payroll Recovery - Other 677,545 629,698 1,008,103 830,000 ___________<br />
Equipment Rental/Misc Supplies 259,504 344,160 230,000 235,000 ___________<br />
Products for Resale 215 300 1,500 1,500 ___________<br />
Personal Food Service Recovery 69,101 56,100 68,000 74,800 ___________<br />
Contract Labor Recovery 208,911 302,500 202,500 202,500 ___________<br />
Piano Tuner 1,890 500 2,500 700 ___________<br />
Advertising Charges 269,566 183,750 348,000 365,400 ___________<br />
Talent Fees - Promotions 724,589 630,300 736,000 885,000 ___________<br />
Energy and Utility Hookup 47,582 43,316 50,000 52,500 ___________<br />
Packaging and Shipping 5,406 15,000 6,500 6,825 ___________<br />
Cash Over and Short (114)<br />
SUB-TOTAL 2,264,195 2,205,624 2,653,103 2,654,225<br />
Expense Recoveries - (Parking)<br />
Advertising Charges 2,000<br />
Payroll Recovery - Other 3,982 200 3,000 3,150 ___________<br />
SUB-TOTAL 3,982 2,200 3,000 3,150<br />
Expense Recoveries - (Box Office)<br />
Ticket Commissions 15,742 14,602 15,000 17,000 ___________<br />
SUB-TOTAL 15,742 14,602 15,000 17,000<br />
Expense Recoveries - (Communications)<br />
Telephone - Long Distance 2,072 2,550 1,500 1,575 ___________<br />
Telephone - Equipment 15,961 16,683 17,000 17,850 ___________<br />
Telephone - Local 47<br />
SUB-TOTAL 18,080 19,233 18,500 19,425<br />
TOTAL CHARGES FOR SERVICES 4,532,986 4,462,893 4,964,995 5,210,947<br />
E – 173
LAKELAND CENTER<br />
BUDGET FOR YEAR 2007-08<br />
Experience Budget Experience Proposed Adjustments<br />
For Year For Year 2006-07 by by<br />
2005-06 2006-07 Estimated <strong>City</strong> Manager <strong>City</strong> Commission<br />
MISCELLANEOUS REVENUE<br />
Interest Earnings<br />
Interest on Pooled Investments 13,836 32,964 25,812 4,193 ___________<br />
03A Utility Tax Sinking<br />
Interest on Investments 14,345 14,130 11,786 11,000 ___________<br />
03A Utility Tax Reserve<br />
Interest from S.B.A. 9,550 8,773 10,152 9,284 ___________<br />
03C TDT Sinking Fund<br />
Interest on Investments 7,287 8,302 8,604 8,385 ___________<br />
03A TDT Reserve<br />
Interest from S.B.A. 19,751 17,977 22,709 20,767 ___________<br />
SUB-TOTAL 64,769 82,146 79,063 53,629<br />
Other Miscellaneous Revenue<br />
Arena Scoreboard Contributions 25,000 15,000 25,000 ___________<br />
Arena Improvements Contributions 90,000 50,000 50,000 ___________<br />
Youkey Theatre Memorial Fund 500<br />
Insurance Proceeds - WC Claims 3,571<br />
SUB-TOTAL 4,071 115,000 65,000 75,000<br />
TOTAL MISCELLANEOUS<br />
REVENUE 68,840 197,146 144,063 128,629<br />
OPERATING SUBSIDIES<br />
Interfund Transfers<br />
General Fund - Operations 1,285,188 1,362,123 1,362,123 1,253,908 ___________<br />
General Fund - UT Debt Service Sk 974,697 922,940 923,905 911,594 ___________<br />
General Fund - TDT Debt Service Sk (15,182) 20,375 15,341 15,467 ___________<br />
UT Reserve - UT Debt Service Sk 9,550 8,773 10,152 9,284 ___________<br />
TDT Reserve - TDT Debt Service Sk 19,751 17,977 22,709 20,767 ___________<br />
Public Improvement Fund - Operating 226,500 225,000 225,000 225,000 ___________<br />
Public Improvement Fund - Projects 256,791 545,164 532,900 750,000 ___________<br />
TOTAL OPERATING SUBSIDIES 2,757,295 3,102,352 3,092,130 3,186,020<br />
PRIOR YEARS SURPLUS (42,421) (45,352) 83,867 (96,126)<br />
GRAND TOTAL REVENUES 7,829,356 8,194,707 8,784,839 8,929,254<br />
E – 174
LAKELAND CENTER<br />
BUDGET FOR YEAR 2007-08<br />
Experience Budget Experience Proposed Adjustments<br />
For Year For Year 2006-07 by by<br />
2005-06 2006-07 Estimated <strong>City</strong> Manager <strong>City</strong> Commission<br />
EXPENSES<br />
ADMIN, FINANCE, & MARKETING<br />
PERSONAL SERVICES 574,887 696,441 682,582 743,211<br />
OPERATING EXPENSES<br />
Rental / Fleet Equipment 2,633 1,609 1,608 1,699 ___________<br />
Gasoline / Fleet Equipment 1,115 1,454 1,080 1,412 ___________<br />
Maintenance / Fleet Equipment 143 1,080 448 2,855 ___________<br />
Auto Allowance 4,814 4,800 5,400 5,400 ___________<br />
Retiree Health Insurance Subsidy 15,467 17,092 17,092 17,836 ___________<br />
Insurance - Fire 46,995 72,516 49,050 62,316 ___________<br />
Insurance - Position Bond 162 469 300 206 ___________<br />
Insurance - Consultant 1,495 1,721 1,721 1,709 ___________<br />
Intra-Dept Charges - Computer Rental 62,551 48,106 50,052 61,070 ___________<br />
Intra-Dept Charges - Telephone 34,195 34,291 36,342 41,767 ___________<br />
Intra-Dept Charges - IT 20,800 44,088 44,088 23,018 ___________<br />
Intra-Dept Charges - Training 1,922 ___________<br />
Special Services 2,286 695 700 500 ___________<br />
Paying Agent, Trustee Fees 2,460 3,410 3,410 3,400 ___________<br />
Annual Audit 4,819 2,500 2,422 2,500 ___________<br />
Banking Service 1,316 1,451 1,456 1,572 ___________<br />
Legal Advertising 1,667 500 500 250 ___________<br />
Promotion Expense 3,078 1,700 700 500 ___________<br />
Office Supplies 12,974 16,000 16,000 11,000 ___________<br />
Equipment - Noncapital 1,531<br />
Leases 2,532 3,038 2,604 4,400 ___________<br />
Rents 347 600 600 600 ___________<br />
Repair <strong>of</strong> Equipment 1,322 1,356 1,356 1,300 ___________<br />
Printing and Photography 2,675 3,500 2,500 2,500 ___________<br />
Postage 5,694 6,000 6,000 6,000 ___________<br />
Subscriptions and Memberships 5,361 4,279 4,300 4,409 ___________<br />
Telephone Communications 13,002 12,000 12,000 12,000 ___________<br />
Travel 6,058 10,662 10,662 12,195 ___________<br />
Training 7,247 2,500 2,000 2,000 ___________<br />
All Other Sundry Charges 547 800 800 820 ___________<br />
Telephone- Long Distance 937 2,500 2,500 2,500 ___________<br />
Licenses 1,528 2,800 2,800 2,800 ___________<br />
Car Washing 20 7 20<br />
S<strong>of</strong>tware License & Maintenance 10,392 12,332 12,000 12,500 ___________<br />
Sales Expenses 11,362 17,230 18,000 17,000 ___________<br />
Advertising Program 51,600 40,827 31,000 44,000 ___________<br />
SUB-TOTAL 341,125 373,913 341,511 365,956<br />
TOTAL 916,012 1,070,354 1,024,093 1,109,167<br />
E – 175
LAKELAND CENTER<br />
BUDGET FOR YEAR 2007-08<br />
Experience Budget Experience Proposed Adjustments<br />
For Year For Year 2006-07 by by<br />
2005-06 2006-07 Estimated <strong>City</strong> Manager <strong>City</strong> Commission<br />
PROPERTY, OPERATIONS & MAINTENANCE<br />
PERSONAL SERVICES 792,488 770,833 926,948 912,598<br />
OPERATING EXPENSES<br />
Rental / Fleet Equipment 2,537 1,401 1,400 1,480 ___________<br />
Gasoline / Fleet Equipment 1,203 3,828 1,121 1,230 ___________<br />
Maintenance / Fleet Equipment 1,046 2,644 2,644 754 ___________<br />
Intra-Dept Charges - Radios 300 300 300 ___________<br />
Gasoline and Oil 8,388 7,000 7,500 7,500 ___________<br />
Special Services 21,194 34,000 36,000 48,000 ___________<br />
Contract Labor 24,697 10,000 10,000 12,000 ___________<br />
Office Supplies and Printing 1,304 694 500 500 ___________<br />
All Other Materials & Supply 22,150 17,000 8,000 21,000 ___________<br />
Equipment - Noncapital 4,286 8,699<br />
Uniforms, Accessories, Laundry 2,486 3,520 3,000 4,500 ___________<br />
Cleaning & Janitorial Supplies 61,459 55,000 50,000 60,000 ___________<br />
Paint & Paint Supplies 9,490 11,090 11,000 13,000 ___________<br />
Tools, Implements & Instruments 4,127 3,020 4,000 4,200 ___________<br />
Electrical, Plumbing, Hardware Supplies 69,497 65,000 55,000 75,000 ___________<br />
Rents 1,902 3,203 3,500 3,500 ___________<br />
Compactor Rental 6,948 7,300 6,600 7,032 ___________<br />
Maintenance <strong>of</strong> Facilities 115,290 100,000 100,000 120,000 ___________<br />
Repair <strong>of</strong> Equipment 25,420 40,000 40,000 35,000 ___________<br />
Postage & Mailing 20 200<br />
Telephone, Communications 1,300 2,671 4,000 4,500 ___________<br />
Lodging / Travel 155 50<br />
Training 35 100 100 1,000 ___________<br />
SUB-TOTAL 385,234 376,420 344,665 420,496<br />
TOTAL 1,177,722 1,147,253 1,271,613 1,333,094<br />
E – 176
LAKELAND CENTER<br />
BUDGET FOR YEAR 2007-08<br />
Experience Budget Experience Proposed Adjustments<br />
For Year For Year 2006-07 by by<br />
2005-06 2006-07 Estimated <strong>City</strong> Manager <strong>City</strong> Commission<br />
BOX OFFICE<br />
PERSONAL SERVICES 160,268 207,496 190,718 191,440<br />
OPERATING EXPENSES<br />
Ticket Commissions - 10 Cents 1,211 1,400 1,400 1,500 ___________<br />
Credit Card Discount Charges 41,560 45,000 45,000 45,000 ___________<br />
Office Supplies 1,561 5,000 5,000 3,500 ___________<br />
Leases 1,994 2,000 2,000 1,776 ___________<br />
Repair <strong>of</strong> Equipment 846 750 750 500 ___________<br />
Postage 738 1,000 1,000 1,000 ___________<br />
Special Services 3,149 2,794 2,794 2,880 ___________<br />
Refunds on Settled Shows 305<br />
Other Reimbursable Event Costs 225 1,400 1,400 1,400 ___________<br />
SUB-TOTAL 51,589 59,344 59,344 57,556<br />
TOTAL 211,857 266,840 250,062 248,996<br />
COMMUNICATIONS<br />
OPERATING EXPENSES<br />
Intra-Dept Charges - Telephone 4,617 3,685 3,685 5,318 ___________<br />
TLC Communications - Other Costs 1,003 1,003 1,000 ___________<br />
Telephone - Communications 2,376 2,495 2,376 2,400 ___________<br />
Telephone - Long Distance 795 210 210 221 ___________<br />
TOTAL 7,788 7,393 7,274 8,939<br />
E – 177
LAKELAND CENTER<br />
BUDGET FOR YEAR 2007-08<br />
Experience Budget Experience Proposed Adjustments<br />
For Year For Year 2006-07 by by<br />
2005-06 2006-07 Estimated <strong>City</strong> Manager <strong>City</strong> Commission<br />
CLIENT SERVICES<br />
PERSONAL SERVICES 728,797 649,287 918,026 785,748<br />
OPERATING EXPENSES<br />
Talent Fees - Promotions 708,176 745,387 736,000 885,000 ___________<br />
Talent Fees - Promotions 1,304 1,294 1,500 1,500 ___________<br />
Visa/MasterCard/Bank Charges 5,933 6,000 6,000 6,120 ___________<br />
Food Purchases 77,369 63,368 68,000 74,800 ___________<br />
Special Services 11,891<br />
Special Services - Non-Billable Expenses 100 200 200 ___________<br />
Advertising Charges 168,676 290,181 300,000 315,000 ___________<br />
Advertising - Non-Billable Expenses 65,168<br />
Piano Tuner 1,440 2,080 2,500 700 ___________<br />
Contract Labor 276,561 250,150 250,000 225,000 ___________<br />
Contract Labor - Non-Billable Expenses 48,131<br />
Office Supplies 6,032 7,872 8,500 5,000 ___________<br />
Uniforms 482 1,101 1,100<br />
Rents 64,859 39,000 45,000 45,900 ___________<br />
Rents - Non-Billable Expenses 1,405 1,210 1,500 1,530 ___________<br />
Repair <strong>of</strong> Equipment 190 1,637 1,700 200 ___________<br />
Printing & Photography 22,000 27,255 50,000 35,000 ___________<br />
Postage & Mailing 14,706 11,000 11,000 11,000 ___________<br />
Lodging 28,536 39,320 39,320 13,000 ___________<br />
Licenses And Permits 2,826 1,000 1,000 1,000 ___________<br />
All Other Reimbursable Costs 31,944 15,000 15,000 15,000 ___________<br />
Bad Debt Expense (24,694) 35,000 35,000 5,000 ___________<br />
SUB-TOTAL 1,512,935 1,557,700 1,573,320 1,640,950<br />
TOTAL 2,241,732 2,206,987 2,491,346 2,426,698<br />
E – 178
LAKELAND CENTER<br />
BUDGET FOR YEAR 2007-08<br />
Experience Budget Experience Proposed Adjustments<br />
For Year For Year 2006-07 by by<br />
2005-06 2006-07 Estimated <strong>City</strong> Manager <strong>City</strong> Commission<br />
PARKING OPERATIONS<br />
PERSONAL SERVICES 129,377 125,061 124,810 124,028<br />
OPERATING EXPENSES<br />
Office Supplies 484 883 1,000 1,000 ___________<br />
All Other Materials and Supplies 1,286 1,666<br />
Uniforms 250 ___________<br />
Repair <strong>of</strong> Equipment 3,414 2,500 1,200 1,200 ___________<br />
Printing & Photography 1,618 2,701 2,500 2,500 ___________<br />
All Other Sundry 100<br />
SUB-TOTAL 6,802 7,850 4,700 4,950<br />
TOTAL 136,179 132,911 129,510 128,978<br />
NON-DEPARTMENTAL EXPENSES<br />
Self-Insurance Service 58,480 51,982 43,994 69,785 ___________<br />
Purchasing & Stores Service 9,901 10,515 10,516 11,356 ___________<br />
General Fund Service 453,222 452,227 452,226 479,940 ___________<br />
Equipment - Noncapital 230<br />
Water Utility Service 37,315 35,261 37,016 35,645 ___________<br />
Electric Utility Service 751,995 574,084 796,584 801,988 ___________<br />
Wastewater Utility Service 27,776 27,271 39,314 39,945 ___________<br />
Stormwater Fees 5,037 5,100 5,066 11,399 ___________<br />
Solid Waste Service 14,652 14,450 16,183 16,992 ___________<br />
TOTAL 1,358,608 1,170,890 1,400,899 1,467,050<br />
E – 179
LAKELAND CENTER<br />
BUDGET FOR YEAR 2007-08<br />
Experience Budget Experience Proposed Adjustments<br />
For Year For Year 2006-07 by by<br />
2005-06 2006-07 Estimated <strong>City</strong> Manager <strong>City</strong> Commission<br />
OTHER CASH DISBURSEMENTS<br />
CAPITAL OUTLAY<br />
Equipment 2,864<br />
SPECIAL PROJECTS<br />
Visitor Information Center 11,000 11,000 11,000 11,000 ___________<br />
PCCVB Reimbursable Expenses 29,180 26,665 48,780 48,780 ___________<br />
Replace Air Handler 84,918 4,581 4,581<br />
Carpet Replacement 161,900<br />
Electric Powered Golf Carts 581 14,419 14,419 10,000 ___________<br />
Timekeeping S<strong>of</strong>tware Replacement 12,042 5,504 5,504<br />
Youkey Theatre Memorial Fund 500<br />
Replacement Tables 20,000 20,000<br />
Electronic Gate Operator for Parking Lots 5,200 5,200 20,000 ___________<br />
Youkey Theatre Lobby Seating 9,973<br />
Cooling Towers 180,000 180,000<br />
PO&M Equipment Storage Unit 40,000 ___________<br />
Renovate Sound Systems in<br />
Arena & Theater 250,000 253,196<br />
Arena Lighting 50,000 50,000<br />
Theater Sound Console 15,460<br />
Exhibit Hall and Sikes Hall wall coverings 50,000 ___________<br />
Replace Forklifts 27,000 ___________<br />
Repainting <strong>of</strong> Facility Exterior 75,000 ___________<br />
Upgrade CCTV System 65,000 ___________<br />
Riser Replacement (Meeting Room Risers) 28,000 ___________<br />
Commercial Washer/Dryer Replacement 15,000 ___________<br />
AV Equipment Upgrades and/or Purchases 20,000 ___________<br />
Resurfacing <strong>of</strong> Parking Lots 350,000 ___________<br />
Arena Improvements - FHSAA 150,000 152,000<br />
SUB-TOTAL 310,094 732,829 744,680 759,780<br />
E – 180
LAKELAND CENTER<br />
BUDGET FOR YEAR 2007-08<br />
Experience Budget Experience Proposed Adjustments<br />
For Year For Year 2006-07 by by<br />
2005-06 2006-07 Estimated <strong>City</strong> Manager <strong>City</strong> Commission<br />
DEBT SERVICE<br />
Interest Payments - 03A UT 293,942 280,843 280,843 266,878 ___________<br />
Principal Payments - 03A UT 655,000 665,000 665,000 665,000 ___________<br />
Interest Payments - 03C TD 158,258 151,658 151,658 144,623 ___________<br />
Principal Payments - 03C TD 330,000 335,000 335,000 340,000 ___________<br />
SUB-TOTAL 1,437,200 1,432,501 1,432,501 1,416,501<br />
TRANSFERS TO OTHER FUNDS<br />
03A UT Reserve to UT Sinking - Interest 9,550 8,773 10,152 9,284 ___________<br />
03C TDT Reserve to TDT Sinking - Int. 19,751 17,977 22,709 20,767 ___________<br />
SUB-TOTAL 29,301 26,750 32,861 30,051<br />
TOTAL 1,779,459 2,192,080 2,210,042 2,206,332<br />
GRAND TOTAL EXPENSES 7,829,357 8,194,708 8,784,839 8,929,254<br />
E – 181
LAKELAND CENTER<br />
BUDGET FOR YEAR 2007-08<br />
Experience Budget Experience Proposed Adjustments<br />
For Year For Year 2006-07 by by<br />
2005-06 2006-07 Estimated <strong>City</strong> Manager <strong>City</strong> Commission<br />
PERSONNEL<br />
Current Proposed Pay Salary<br />
POSITION TITLE Budget Budget Grade Range<br />
ADMINISTRATION<br />
<strong>Lakeland</strong> Center Director 1 1 PB3 *<br />
Assistant <strong>Lakeland</strong> Center Director 1 1 PB5 *<br />
<strong>Lakeland</strong> Center Accountant 1 1 58 51,979 - 78,666<br />
Client Services Manager 1 1 51 43,805 - 64,730<br />
Marketing Manager 1 1 49 41,725 - 63,190<br />
Marketing Sales Representative 1 1 47 39,749 - 60,174<br />
Senior Client Services Coordinator 1 1 45 37,835 - 57,304<br />
Client Services Coordinator 2 2 36 30,389 - 45,989<br />
Marketing Associate 1 1 33 28,246 - 42,765<br />
Administrative Assistant 1 1 33 28,246 - 42,765<br />
Account Clerk IV 1 1 33 28,246 - 42,765<br />
Group Sales Coordinator 1 1 24 22,693 - 34,320<br />
Office Assistant I 1 1 17 19,094 - 28,954<br />
OPERATIONS<br />
<strong>Lakeland</strong> Center Operations Manager 1 1 56 49,504 - 74,922<br />
<strong>Lakeland</strong> Center Technician Coordinator 1 1 45 37,835 - 57,304<br />
<strong>Lakeland</strong> Center Chief Engineer 1 1 45 37,835 - 57,304<br />
<strong>Lakeland</strong> Center Engineer 2 2 36 30,389 - 45,989<br />
Operations Support Supervisor II 1 1 36 30,389 - 45,989<br />
Event Setup Supervisor 3 3 31 26,894 - 40,726<br />
Operations Support Worker II 9 9 18 19,594 - 29,661<br />
Operations Support Worker I 1 1 14 17,763 - 26,894<br />
BOX OFFICE<br />
Box Office Manager 1 1 47 39,749 - 60,174<br />
Assistant Box Office Manager 1 1 33 28,246 - 42,765<br />
Box Office Supervisor 1 1 29 25,605 - 38,771<br />
TOTAL FULL-TIME EMPLOYEES 36 36<br />
PART-TIME<br />
<strong>Lakeland</strong> Center Pool Employees 200 200<br />
TOTAL PART-TIME EMPLOYEES 200 200<br />
E – 182
REVENUE AND EXPENDITURE SUMMARY<br />
CLEVELAND HEIGHTS GOLF COURSE<br />
Experience Budget Experience 2007-08<br />
For Year For Year 2006-07 Proposed by<br />
EXPENSES 2005-06 2006-07 Estimated <strong>City</strong> Manager<br />
Personnel<br />
Salaries and Wages 864,130 948,982 901,111 928,446<br />
Fringe Benefits 194,583 212,190 208,889 235,017<br />
Total Personnel 1,058,713 1,161,172 1,109,999 1,163,462<br />
Non-Personnel<br />
Internal Service Charges 311,125 373,535 373,682 441,283<br />
Pr<strong>of</strong>essional and Contractual 94,713 81,901 95,493 89,392<br />
Utilities 149,203 161,321 143,673 166,357<br />
Insurance and Fixed Charges 45,595 45,228 41,392 46,796<br />
All Other Operations and Maintenance 712,284 808,861 764,919 749,535<br />
Capital Outlay 129,338 78,094 80,594 119,000<br />
Debt Service 362,939 308,667 284,712 304,479<br />
Total Non-Personnel 1,805,197 1,857,607 1,784,465 1,916,842<br />
Total Expenditures 2,863,910 3,018,779 2,894,464 3,080,304<br />
Transfers<br />
Transfers In 63,697 66,905 66,905 50,000<br />
Transfers Out<br />
Net Transfers 63,697 66,905 66,905 50,000<br />
Revenue Sources<br />
Taxes<br />
Licenses and Permits<br />
Intergovernmental<br />
Charges for Services 2,659,753 2,783,500 2,578,500 2,717,350<br />
Interest Income 6,209 14,580 15,057 14,674<br />
All Other Revenue 125,727 189,000 209,900 79,800<br />
Total Revenue 2,791,689 2,987,080 2,803,457 2,811,824<br />
Funding to be Provided 8,524 (35,206) 24,102 218,480<br />
E – 183
CLEVELAND HEIGHTS GOLF COURSE<br />
BUDGET FOR YEAR 2007-08<br />
Experience Budget Experience Proposed Adjustments<br />
For Year For Year 2006-07 by by<br />
2005-06 2006-07 Estimated <strong>City</strong> Manager <strong>City</strong> Commission<br />
CHARGES FOR SERVICES<br />
REVENUES<br />
Green Fees 44,430 51,500 48,000 50,400 ___________<br />
Cart Fees 1,064,138 1,105,000 1,085,000 1,139,250 ___________<br />
Range Fees 25,000 24,000 25,200 ___________<br />
Membership Dues 290,397 300,000 268,000 281,400 ___________<br />
Trail Fees 24,848<br />
Summer Memberships 10,000 7,500 7,500 ___________<br />
Tournament Fees 162,390 169,000 145,000 155,000 ___________<br />
Golf Clinic 4,580 14,000 5,000 6,000 ___________<br />
Food Sales - Restaurant 541,124 614,000 505,000 556,600 ___________<br />
Food Sales - Bar 12,000<br />
Beverage Sales - Beer 128,775 135,000 135,000 135,000 ___________<br />
Beverage Sales - Liquor 129,974 135,000 122,000 122,000 ___________<br />
Beverage Sales - Wine 31,822 4,000 10,000 10,000 ___________<br />
Merchandise Sales - Pro Shop 198,672 185,000 205,000 205,000 ___________<br />
Facility Rentals 22,035 24,000 19,000 24,000 ___________<br />
Gosh! Rental 16,568<br />
TOTAL CHARGES FOR SERVICES 2,659,753 2,783,500 2,578,500 2,717,350<br />
MISCELLANEOUS REVENUE<br />
Interest Earnings<br />
Interest on Pooled Investments 6,209 14,580 15,057 14,674 ___________<br />
SUB-TOTAL 6,209 14,580 15,057 14,674<br />
Other Miscellaneous Revenue<br />
Surplus Equipment Sales 3,325 144,000 150,000<br />
All Other Miscellaneous Rev. 60 2,700<br />
Cash Over & Short 7,052 5,200 5,000 ___________<br />
Building Leases - Other 9,871<br />
All Other Misc. Rev. - Operations 19,083 15,000 16,000 24,000 ___________<br />
All Other Misc. Rev. - Food & Beverage 6,336 3,000 12,000 16,000 ___________<br />
Alltel Tower Rent 27,000 24,000 34,800 ___________<br />
SUB-TOTAL 45,727 189,000 209,900 79,800<br />
TOTAL MISCELLANEOUS REVENUE 51,936 203,580 224,957 94,474<br />
E – 184
CLEVELAND HEIGHTS GOLF COURSE<br />
BUDGET FOR YEAR 2007-08<br />
Experience Budget Experience Proposed Adjustments<br />
For Year For Year 2006-07 by by<br />
2005-06 2006-07 Estimated <strong>City</strong> Manager <strong>City</strong> Commission<br />
OPERATING SUBSIDIES<br />
Interfund Transfers<br />
Public Improvement Fund<br />
Carpet 29,102<br />
Repair Cart Paths 3,095 66,905 66,905 50,000 ___________<br />
Debt Proceeds - Internal Loan<br />
Restroom Renovations 75,000<br />
General Fund 31,500<br />
Fleet Management Fund 5,000<br />
TOTAL OPERATING SUBSIDIES 143,697 66,905 66,905 50,000<br />
PRIOR YEAR SURPLUS 8,524 (35,206) 24,102 218,480<br />
TOTAL REVENUES 2,863,910 3,018,779 2,894,464 3,080,304<br />
EXPENSES<br />
ADMINISTRATION<br />
PERSONAL SERVICES 182,219 228,969 182,382 202,971<br />
OPERATING EXPENSES<br />
Contingency 32,811<br />
Bad Checks (806) 200<br />
Retiree Health Insurance Subsidy 8,114 8,488 8,488 8,655 ___________<br />
Insurance - Fire 9,275 11,678 11,677 8,512 ___________<br />
Insurance - Position Bond 105 304 304 126 ___________<br />
Insurance - Consultant 542 261 628 492 ___________<br />
General Fund Service 187,854 240,377 240,378 290,674 ___________<br />
Self-Insurance Service 27,851 24,758 20,423 29,003 ___________<br />
Purchasing & Stores Service 11,168 11,861 11,862 12,810 ___________<br />
Water Utility Service 9,526 24,150 20,313 21,790 ___________<br />
Stormwater Fees 2,652 2,700 2,701 6,077 ___________<br />
Electric Utility Service 104,334 102,527 90,749 106,003 ___________<br />
Wastewater Utility Service 7,559 8,644 7,363 8,039 ___________<br />
Solid Waste Service 17,698 15,800 15,998 16,798 ___________<br />
Intra-Dept Charges - Computer Rental 13,793 12,694 12,518 13,641 ___________<br />
Intra-Dept Charges - Telephone (77)<br />
Intra-Dept Charges - Facilities 26,316 29,858 29,858 40,664 ___________<br />
Intra-Dept Charges - Janitorial 20,553 23,269 23,268 21,852 ___________<br />
Intra-Dept Charges - IT 11,722 11,405 11,406 10,458 ___________<br />
Intra-Dept Charges - Training 1,084 ___________<br />
E – 185
CLEVELAND HEIGHTS GOLF COURSE<br />
BUDGET FOR YEAR 2007-08<br />
Experience Budget Experience Proposed Adjustments<br />
For Year For Year 2006-07 by by<br />
2005-06 2006-07 Estimated <strong>City</strong> Manager <strong>City</strong> Commission<br />
Contractual Services 3,473 4,800 4,850 6,000 ___________<br />
Banking Service 30,677 24,000 26,000 26,000 ___________<br />
Pr<strong>of</strong>essional Services 6,843 5,000 15,000 15,000 ___________<br />
Advertising 9,076 10,000 11,248 13,000 ___________<br />
Annual Audit 5,051 2,500 2,438 2,500 ___________<br />
Promotions/Public Relations 1,918<br />
Office Supplies 2,648 3,000 2,965 3,500 ___________<br />
All Other Materials & Supplies 7,181 4,000 4,441 3,000 ___________<br />
Repair Of Equipment 1,535 1,000 100 500 ___________<br />
Printing & Photography 4,259 4,000 4,379 4,000 ___________<br />
Postage & Mailing 164 1,200 827 750 ___________<br />
Subscription & Membership 1,989 2,500 1,500 1,200 ___________<br />
Telephone, Communications 6,404 6,500 5,598 6,600 ___________<br />
Travel 294 1,750 25<br />
Training 35 500 ___________<br />
Car Washing 7<br />
Bad Debt Expense (700) 1,000<br />
SUB-TOTAL 538,991 633,035 587,347 679,228<br />
TOTAL 721,210 862,004 769,729 882,198<br />
COURSE OPERATIONS<br />
PERSONAL SERVICES 170,106 178,853 182,349 189,460<br />
OPERATING EXPENSES<br />
Uninsured Loss Reimbursements 250 500 500 ___________<br />
Contractual Services 6,098 6,200 6,203 7,500 ___________<br />
All Other Materials & Supplies 1,867 1,000 506 1,000 ___________<br />
Merchandise 156,123 135,000 144,216 143,500 ___________<br />
Tires & Tubes 1,599 1,000 1,144 2,000 ___________<br />
Parts for Equipment 60 1,000 687 500 ___________<br />
Increase/Decrease in Inventory (8,365)<br />
Leases 827 38,825 38,822 77,650 ___________<br />
Repair Of Equipment 4,510 2,500 1,655 2,500 ___________<br />
Printing & Photography 6,209 3,200 2,986 4,000 ___________<br />
Postage & Mailing 175 100 90 100 ___________<br />
Subscription & Membership (6)<br />
Telephone, Communications 1,010 1,000 951 1,050 ___________<br />
Tournament Expenses 2,000 1,928 2,000 ___________<br />
SUB-TOTAL 170,357 191,825 199,688 242,300<br />
TOTAL 340,463 370,678 382,037 431,760<br />
E – 186
CLEVELAND HEIGHTS GOLF COURSE<br />
BUDGET FOR YEAR 2007-08<br />
Experience Budget Experience Proposed Adjustments<br />
For Year For Year 2006-07 by by<br />
2005-06 2006-07 Estimated <strong>City</strong> Manager <strong>City</strong> Commission<br />
COURSE MAINTENANCE<br />
PERSONAL SERVICES 404,447 447,532 428,631 471,591<br />
OPERATING EXPENSES<br />
Rental / Fleet Equipment 15,318 8,718 8,718 9,208 ___________<br />
Gasoline / Fleet Equipment 22,700 30,104 30,093 33,742 ___________<br />
Maintenance / Fleet Equipment 1,778 5,249 5,581 7,150 ___________<br />
Contractual Services 13,582 12,440 12,368 11,000 ___________<br />
All Other Materials & Supplies 3,981 3,000 3,182 3,000 ___________<br />
Uniforms 755 500 750 ___________<br />
Chemicals 39,220 60,000 54,583 56,000 ___________<br />
Tools & Implements 796 1,500 1,531 2,000 ___________<br />
Electrical & Plumbing Supplies 1,857 1,500 1,041 1,000 ___________<br />
Agricultural & Horticultural Supplies 19,350 10,000 10,134 11,500 ___________<br />
Parts for Equipment 49,552 26,000 28,341 24,000 ___________<br />
Soil and Sand 5,779 4,800 10,212 10,000 ___________<br />
Swan Feed 1,800<br />
Fertilizer 32,618 49,375 49,568 50,000 ___________<br />
Leases (801) 27,000 27,000 20,000 ___________<br />
Rental <strong>of</strong> Equipment 1,460 1,500 500 500 ___________<br />
Repair Of Equipment 339 1,000 1,000<br />
Telephone, Communications 20<br />
Maintenance <strong>of</strong> Lakes 5,019 5,600 5,580 6,000 ___________<br />
Licenses & Permits 465<br />
SUB-TOTAL 213,788 250,086 249,432 245,850<br />
TOTAL 618,235 697,618 678,063 717,441<br />
E – 187
CLEVELAND HEIGHTS GOLF COURSE<br />
BUDGET FOR YEAR 2007-08<br />
Experience Budget Experience Proposed Adjustments<br />
For Year For Year 2006-07 by by<br />
2005-06 2006-07 Estimated <strong>City</strong> Manager <strong>City</strong> Commission<br />
FOOD & BEVERAGE<br />
PERSONAL SERVICES 301,941 284,318 295,389 299,441<br />
OPERATING EXPENSES<br />
Contractual Services 17,453 16,700 16,758 7,900 ___________<br />
Equipment - Noncapital 1,139 1,500<br />
All Other Materials & Supplies 1,278 1,500 1,470 1,500 ___________<br />
Uniforms 789<br />
Tools & Implements 3,962 2,500 2,673 2,500 ___________<br />
Food Purchases 240,805 227,200 206,628 160,485 ___________<br />
Beverage Purchases - Beer 50,565 47,250 46,086 45,000 ___________<br />
Beverage Purchases - Liquor 53,142 48,650 52,000 52,000 ___________<br />
Increase/Decrease in Inventory (205)<br />
Natural Gas Consumption 13,030 10,000 9,549 9,000 ___________<br />
Rental <strong>of</strong> Equipment 48<br />
Repair Of Equipment 1,600 1,000 630 2,000 ___________<br />
Sales Tax 5,036 4,400 4,400 4,000 ___________<br />
Licenses & Permits 2,395 3,200 3,085 3,200 ___________<br />
SUB-TOTAL 390,989 363,900 343,327 287,585<br />
TOTAL 692,930 648,218 638,716 587,026<br />
TRAPS RESTAURANT<br />
PERSONAL SERVICES 21,500 21,249<br />
OPERATING EXPENSES<br />
All Other Materials & Supplies (1,205) 6,000 5,749 1,000 ___________<br />
Tools & Implements 1,000 961 1,000 ___________<br />
Food Purchases 25,000 32,655 36,400 ___________<br />
SUB-TOTAL (1,205) 32,000 39,365 38,400<br />
TOTAL (1,205) 53,500 60,614 38,400<br />
E – 188
CLEVELAND HEIGHTS GOLF COURSE<br />
BUDGET FOR YEAR 2007-08<br />
Experience Budget Experience Proposed Adjustments<br />
For Year For Year 2006-07 by by<br />
2005-06 2006-07 Estimated <strong>City</strong> Manager <strong>City</strong> Commission<br />
OTHER CASH DISBURSEMENTS<br />
CAPITAL OUTLAY<br />
Equipment - Admin 13,035 6,000 ___________<br />
Equipment - Food & Beverage 11,189 13,689<br />
SUB-TOTAL 13,035 11,189 13,689 6,000<br />
SPECIAL PROJECTS<br />
Repair Cart Paths 13,095 66,905 66,905 50,000 ___________<br />
Carpet 29,102<br />
Restroom Renovations on Golf Course 74,106<br />
Renovations <strong>of</strong> Tee Boxes 63,000 ___________<br />
SUB-TOTAL 116,303 66,905 66,905 113,000<br />
DEBT SERVICE<br />
Principal & Interest - Internal Loans:<br />
Driving Range 13,710 13,710 13,710 13,710 ___________<br />
Restroom Renovations 10,561 21,123 21,123 21,123 ___________<br />
Interest Expense - Textron Leases 556<br />
Principal - Textron Leases 77,277<br />
Principal & Interest - 99 Sunshine State 260,835 273,834 249,879 269,646 ___________<br />
SUB-TOTAL 362,939 308,667 284,712 304,479<br />
GRAND TOTAL EXPENSES 2,863,910 3,018,779 2,894,464 3,080,304<br />
E – 189
CLEVELAND HEIGHTS GOLF COURSE<br />
BUDGET FOR YEAR 2007-08<br />
Experience Budget Experience Proposed Adjustments<br />
For Year For Year 2006-07 by by<br />
2005-06 2006-07 Estimated <strong>City</strong> Manager <strong>City</strong> Commission<br />
Equipment<br />
Point <strong>of</strong> Sale S<strong>of</strong>tware Replacement 6,000<br />
6,000<br />
PERSONNEL<br />
Current Proposed Pay Salary<br />
POSITION TITLE Budget Budget Grade Range<br />
ADMINISTRATION<br />
Golf Course Manager 1 1 60 54,579 - 82,618<br />
Accountant III 1 1 58 51,979 - 78,666<br />
Office Associate I 1 24 22,693 - 34,320<br />
COURSE OPERATIONS<br />
Golf Pr<strong>of</strong>essional 1 1 36 30,389 - 45,989<br />
Assistant Golf Pr<strong>of</strong>essional 1 1 20 20,571 - 31,138<br />
COURSE MAINTENANCE<br />
Greens Superintendent 1 1 51 43,805 - 64,730<br />
Assistant Greens Superintendent 1 1 33 28,246 - 42,765<br />
Grounds Maintenance Worker II 1 1 24 22,693 - 34,320<br />
Light Equipment Mechanic I 1 1 24 22,693 - 34,320<br />
Grounds Maintenance Worker I 7 7 16 18,658 - 28,246<br />
FOOD AND BEVERAGE<br />
Food and Beverage Manager 1 1 33 28,246 - 42,765<br />
Food Supervisor 2 2 22 21,590 - 32,677<br />
Cook 2 2 16 18,658 - 28,246<br />
Beverage Service Worker 1 1 1 12,938 - 19,594<br />
Food Service Worker 1 1 1 12,938 - 19,594<br />
TOTAL FULL-TIME 23 22<br />
PART-TIME<br />
Sales Assistants 4 4<br />
Player Assistant 7 7<br />
Cart Attendant 7 7<br />
Food Service Worker 18 24<br />
Kitchen Utility Worker 7 9<br />
Beverage Service Worker 6<br />
Grounds Worker 9 12<br />
Office Assistant I 1 1<br />
TOTAL PART-TIME 59 64<br />
E – 190
REVENUE AND EXPENDITURE SUMMARY<br />
LAKELAND LINDER REGIONAL AIRPORT<br />
Experience Budget Experience 2007-08<br />
For Year For Year 2006-07 Proposed by<br />
EXPENSES 2005-06 2006-07 Estimated <strong>City</strong> Manager<br />
Personnel<br />
Salaries & Wages 835,936 996,802 980,802 1,092,265<br />
Fringe Benefits 189,817 235,711 230,803 268,681<br />
Total Personnel 1,025,753 1,232,513 1,211,605 1,360,946<br />
Non-Personnel<br />
Internal Service Charges 775,078 733,201 758,217 507,363<br />
Pr<strong>of</strong>essional & Contractual 126,076 309,002 308,666 291,092<br />
Utilities 330,083 376,900 365,231 430,019<br />
Insurance and Fixed Charges 151,964 197,457 192,366 197,247<br />
All Other Operations and Maintenance 366,897 869,212 876,862 905,505<br />
Capital Outlay 4,206,536 3,545,857 2,805,343 208,000<br />
Debt Service 1,172,467 1,176,570 1,122,717 1,323,962<br />
Total Non-Personnel 7,129,101 7,208,199 6,429,402 3,863,188<br />
Total Expenditures 8,154,854 8,440,712 7,641,007 5,224,134<br />
Transfers<br />
Transfers In<br />
Transfers Out (67,688) (66,688) (66,688) (70,638)<br />
Net Transfers (67,688) (66,688) (66,688) (70,638)<br />
Revenue Sources<br />
Taxes<br />
Licenses & Permits<br />
Intergovernmental 4,271,769 3,483,621 1,314,525 936,556<br />
Charges for Services 4,096,864 3,573,144 3,750,279 3,736,533<br />
Interest Income 114,717 135,856 137,307 127,574<br />
All Other Revenue 625,677 328 675 250<br />
Total Revenue 9,109,027 7,192,949 5,202,786 4,800,913<br />
Funding to be Provided (886,485) 1,314,451 2,504,909 493,859<br />
E – 191
LAKELAND LINDER REGIONAL AIRPORT<br />
BUDGET FOR YEAR 2007-08<br />
Experience Budget Experience Proposed Adjustments<br />
For Year For Year 2006-07 by by<br />
2005-06 2006-07 Estimated <strong>City</strong> Manager <strong>City</strong> Commission<br />
REVENUES INTERGOVERNMENTAL<br />
Federal Grants<br />
FAA - Tower Program 454,801 475,200 516,351 536,556 ___________<br />
Rehab Taxiway B - north side 72,228<br />
Construct Eastern Service Road (53,010) 53,010<br />
FAA/FDOT-Improve Runway 5/23 3,238,100 1,542,138 45,058<br />
FAA Airport Grant (Hurricane) 5,322 514,475 50,000<br />
FEMA - <strong>Lakeland</strong> Linder Airport 201,600 30,022 30,022<br />
SUB-TOTAL 3,919,041 2,614,845 641,431 536,556<br />
State Grants<br />
FDOT-LAC Land Acq.-WPI 1827970 31,310<br />
FDOT - 2004 Hurricane 173,918 166,082 18,449<br />
FDOT - Land Acquisition West <strong>of</strong> Airport 500,200 500,200<br />
Rehab Taxiway B - north side (2,160) 2,160<br />
Construct Eastern Service Road 82<br />
FAA - Rehab / Construct Taxiway "C" 19,628<br />
FAA/FDOT-Improve Runway 5/23 92,005 29,734 18,978<br />
FDOT-Airport Perimeter Fencing 26,745 74,200 47,455<br />
FEMA - <strong>Lakeland</strong> Linder Airport PW15540C 11,200 1,612<br />
FDOT-Airport Security Plan 10,000<br />
FDOT - Door/Gate Access Control System, 26,400 26,400<br />
Airport Security Assessment Plan 28,000 28,000<br />
Construct ATC Facility Site Study 32,000 32,000<br />
FDOT - 1500 ARFF Vehicle 400,000 ___________<br />
SUB-TOTAL 352,728 868,776 673,094 400,000<br />
TOTAL INTERGOVERNMENTAL 4,271,769 3,483,621 1,314,525 936,556<br />
E – 192
LAKELAND LINDER REGIONAL AIRPORT<br />
BUDGET FOR YEAR 2007-08<br />
Experience Budget Experience Proposed Adjustments<br />
For Year For Year 2006-07 by by<br />
2005-06 2006-07 Estimated <strong>City</strong> Manager <strong>City</strong> Commission<br />
CHARGES FOR SERVICES<br />
Airport - Building Leases<br />
Lease - Hangar 4 73,954 ___________<br />
Lease - 3610 Drane Field (formerly AET) 43,200 ___________<br />
Buildings-Miscellaneous Office 14,453 5,000 5,000<br />
Buildings - Other 12,418 12,000 12,000 14,000 ___________<br />
Building Leases-Other 176,470 172,000 172,000 202,350 ___________<br />
Landmark (formerly Piedmont Hawthorne) 137,537 139,317 139,317 139,317 ___________<br />
Tony's Airside Restaurant 44,739 45,668 45,668 28,600 ___________<br />
Gulf Coast Avionics 185,940 176,933 176,933 194,948 ___________<br />
Europa (13)<br />
Sun N' Fun 434,925 329,124 329,124 300,201 ___________<br />
Renaissance Aviation<br />
Columbia 127,650 117,279 117,279 43,061 ___________<br />
AET LLC 41,471<br />
Enterprise Leasing 11,274 553<br />
Lease - Anheuser Busch 19,541 19,541 19,541 20,030 ___________<br />
Lease-Wing Waxers <strong>of</strong> South Florida Inc 20,986 23,450 23,450 20,985 ___________<br />
SUB-TOTAL 1,227,391 1,040,312 1,040,865 1,080,646<br />
Airside - Building Leases<br />
Columbia<br />
Building S-8, Publix 104,167 252,083 252,083 258,385 ___________<br />
<strong>Lakeland</strong> Electric-3525 Aviation Drive 373,750 382,500 382,500 87,429 ___________<br />
Training Center-3525 Aviation Drive 109,286 ___________<br />
Publix-3525 Aviation Drive 165,750 ___________<br />
Cypress Aviation Office 96,650<br />
Navigator Aircraft 1,581<br />
National Flight Services, Inc. 28,667 29,384 29,384 30,119 ___________<br />
Keiser College (GEICO Bldg) 288,331 68,958 68,958<br />
Lease - 3515 Aviation Dr (formerly Keiser) 225,000 ___________<br />
Globe Fiberglass 35,861 37,293 37,293 38,225 ___________<br />
Modular Solid Surfaces (Etura Premier) 360,400 360,400 360,400<br />
Lease - 3240 Flightline (formerly MSS) 367,158 ___________<br />
LPD (SIS) 25,000 25,000 25,000 25,000 ___________<br />
S & S Development 195,761 234,913 234,913 236,675 ___________<br />
Specialized Vehicles Corp. 425,151 365,240 365,240 297,294 ___________<br />
Lease - Air Logic Solutions 143,000 146,667 146,667<br />
Foster's Aircraft Refinishing 9,900 10,148 10,148 10,402 ___________<br />
Nextran Corporation 12,899 16,200 16,200 16,605 ___________<br />
CDG Management 178,317 141,100 141,100 109,933 ___________<br />
John J Jerue Truck Broker Inc 127,820 132,107 132,107 131,554 ___________<br />
Lease - LPD Aviation Unit 37,500 37,500 37,500 37,500 ___________<br />
Bombardier Transportation USA 4,106 5,474 5,474 5,474 ___________<br />
All Wood Cabinetry LLC 21,055 152,432 152,432 ___________<br />
Miscellaneous Storage 5,125 ___________<br />
Lease - 3200 Flightline (1st floor suite) 7,200 ___________<br />
SUB-TOTAL 2,469,916 2,244,967 2,397,399 2,316,546<br />
E – 193
LAKELAND LINDER REGIONAL AIRPORT<br />
BUDGET FOR YEAR 2007-08<br />
Experience Budget Experience Proposed Adjustments<br />
For Year For Year 2006-07 by by<br />
2005-06 2006-07 Estimated <strong>City</strong> Manager <strong>City</strong> Commission<br />
Airport - Land Leases<br />
Watkins Motor Lines 51,196 25,598 25,598 25,598 ___________<br />
Globe Aero 7,271 8,179 8,179 8,179 ___________<br />
Landmark (formerly Piedmont Hawthorne) 2,223 2,180 2,180 2,180 ___________<br />
Publix 9,218 9,342 9,342 9,982 ___________<br />
Everett 3,264 3,264 3,264 11,527 ___________<br />
Gulf Coast Avionics 9,008 18,015 18,015<br />
Knight Aviation 6,066 6,270 6,270 6,427 ___________<br />
JRW Company 1,435 1,615 1,615 1,615 ___________<br />
<strong>Lakeland</strong> Executive Hangars 5,331 5,331 5,331 5,553 ___________<br />
Anheuser Busch 6,041 6,041 6,041 6,041 ___________<br />
Lance Aviation, Inc. 4,497 5,107 5,107 5,235 ___________<br />
Game & Fresh Water Fish 13,157 13,157 13,157 14,802 ___________<br />
Amory Board 10,315 10,315 10,315 11,604 ___________<br />
Sun 'N Fun 1 1 1 ___________<br />
Flight Safety International 9,436 9,436 9,436 9,436 ___________<br />
Champagne Investments LLC 6,447 6,609 6,609 6,738 ___________<br />
JBS Equities LLC 18,644 18,644 18,644 18,644 ___________<br />
Columbia Land Lease20 20,261 20,261 27,014 ___________<br />
Hotel Land 50,000 ___________<br />
SUB-TOTAL 163,549 169,365 169,365 220,576<br />
All Other Charges for Services<br />
Gasoline 96,372 98,000 98,000 98,000 ___________<br />
Sun 'N Fun Service Charge 9,000 9,000 9,000 9,000 ___________<br />
Airfield Security and Access Control 420 150<br />
Concessions 543 10,500 10,500 10,765 ___________<br />
All Other Airport Revenue 129,673 1,000 25,000 1,000 ___________<br />
SUB-TOTAL 236,008 118,500 142,650 118,765<br />
TOTAL CHARGES FOR SERVICES 4,096,864 3,573,144 3,750,279 3,736,533<br />
E – 194
LAKELAND LINDER REGIONAL AIRPORT<br />
BUDGET FOR YEAR 2007-08<br />
Experience Budget Experience Proposed Adjustments<br />
For Year For Year 2006-07 by by<br />
2005-06 2006-07 Estimated <strong>City</strong> Manager <strong>City</strong> Commission<br />
CAPITAL REVENUE<br />
Airpark Land Sale - Phase 1 616,156<br />
TOTAL CAPITAL REVENUE 616,156<br />
MISCELLANEOUS REVENUE<br />
Interest Earnings<br />
Interest on Pooled Investments 113,581 134,061 135,512 125,779 ___________<br />
Interest From SBA 1,136<br />
Interest From SBA - Cap Expenditures 1,795 1,795 1,795 ___________<br />
SUB-TOTAL 114,717 135,856 137,307 127,574<br />
Other Miscellaneous Revenue<br />
All Other Miscellaneous 2,446 250 250 250 ___________<br />
Miscellaneous Reimbursements 3,456 322<br />
Reimbursements / Loss Recovery 3,619 78 103<br />
SUB-TOTAL 9,521 328 675 250<br />
TOTAL MISCELLANEOUS<br />
REVENUE 124,238 136,184 137,982 127,824<br />
PRIOR YEAR SURPLUS (886,485) 1,314,451 2,504,909 493,859<br />
GRAND TOTAL REVENUES 8,222,542 8,507,400 7,707,695 5,294,772<br />
E – 195
LAKELAND LINDER REGIONAL AIRPORT<br />
BUDGET FOR YEAR 2007-08<br />
Experience Budget Experience Proposed Adjustments<br />
For Year For Year 2006-07 by by<br />
2005-06 2006-07 Estimated <strong>City</strong> Manager <strong>City</strong> Commission<br />
EXPENSES<br />
AIRPORT ADMINISTRATION & OPERATIONS<br />
PERSONAL SERVICES 1,025,753 1,232,513 1,211,605 1,360,946<br />
OPERATING EXPENSES<br />
Auto Allowance 4,814 4,800 4,950 5,400 ___________<br />
Retiree Health Ins Subsidy 10,947 11,553 11,553 13,008 ___________<br />
Rental / Fleet Equipment 32,931 19,721 19,721 20,830 ___________<br />
Gasoline / Fleet Equipment 19,095 28,594 28,594 28,410 ___________<br />
Maintenance / Fleet Equipment 25,782 23,149 23,149 41,153 ___________<br />
Uninsured Loss Reimbursement 500 500 540 ___________<br />
Insurance - Fire 19,868 85,505 85,505 86,953 ___________<br />
Insurance - Airport Liability 43,555 65,000 65,000 47,910 ___________<br />
Insurance - Position Bond & Crime Coverag 91 131 131 114 ___________<br />
Insurance - Consultant 1,141 2,333 2,299 2,099 ___________<br />
Self-Insurance Service 29,266 17,319 14,774 33,581 ___________<br />
General Fund Service 362,914 347,865 347,865 297,235 ___________<br />
Purchasing & Stores Service 7,650 8,125 8,125 8,774 ___________<br />
Water Utility Service 9,924 9,200 11,672 9,909 ___________<br />
Stormwater Fees 10,403 10,750 10,900 24,525 ___________<br />
Electric Utility Service 125,884 143,000 124,895 142,986 ___________<br />
Wastewater Utility Service 3,061 3,500 3,101 3,377 ___________<br />
Solid Waste Service 7,661 8,300 7,793 8,183 ___________<br />
Intra-Dept Charges - Computer Rental 23,255 18,238 17,834 20,754 ___________<br />
Intra-Dept Charges - Radios 4,342 4,376 4,376 4,180 ___________<br />
Intra-Dept Charges - Facilities 222,552 194,110 220,774<br />
Intra-Dept Charges - Janitorial 43,281 51,064 51,064 45,473 ___________<br />
Intra-Dept Charges - IT 5,078 10,220 10,220 7,855 ___________<br />
Intra-Dept Charges - Training 985 ___________<br />
Special Services 71,714 248,373 248,373 218,164 ___________<br />
Litigation Expense 260 1,500 1,500 1,500 ___________<br />
Banking Services 179 198 198 215 ___________<br />
Advertising 466 500 500 500 ___________<br />
Audit Fees 4,317 3,200 2,898 3,200 ___________<br />
Office Supplies 4,982 5,531 5,531 5,500 ___________<br />
Non-Capital Equipment 5,230 4,200 4,200 4,200 ___________<br />
All Other Materials & Supplies 1,967 2,547 2,547 2,500 ___________<br />
E – 196
LAKELAND LINDER REGIONAL AIRPORT<br />
BUDGET FOR YEAR 2007-08<br />
Experience Budget Experience Proposed Adjustments<br />
For Year For Year 2006-07 by by<br />
2005-06 2006-07 Estimated <strong>City</strong> Manager <strong>City</strong> Commission<br />
Uniforms 2,427 3,250 3,250 3,250 ___________<br />
Cleaning & Janitor Supplies 468 500 500 500 ___________<br />
Chemicals 2,075 2,200 2,200 2,200 ___________<br />
Tools, Implements & Instruments 1,642 1,500 1,500 1,500 ___________<br />
LP Gas 290 290 290 ___________<br />
Leases 3,143 6,300 6,300 6,300 ___________<br />
Rents 721 800 800 800 ___________<br />
Maintenance <strong>of</strong> Facilities 1,962 3,000 3,000 126,190 ___________<br />
Repair <strong>of</strong> Equipment 11,176 25,100 25,100 25,850 ___________<br />
Printing & Photography 2,388 1,500 1,500 1,500 ___________<br />
Postage 1,178 1,250 1,250 1,300 ___________<br />
Subscriptions & Memberships 7,023 6,886 6,886 8,300 ___________<br />
Telephone, Communications 7,667 7,500 7,500 9,950 ___________<br />
Travel 6,112 15,000 15,000 26,875 ___________<br />
Training 2,010 3,800 3,800 3,800 ___________<br />
All Other Sundry Charges 580 750 750 900 ___________<br />
Ad Valorem Taxes 528 4,300 4,300 4,400 ___________<br />
Licenses and Permits 500 500 500 500 ___________<br />
Car Washing 107 150 150 ___________<br />
Bad Debt Expense (102,023) 5,100 5,100 5,100 ___________<br />
Airport Advertising / Promotions 18,515 50,000 50,000 50,000 ___________<br />
Airport Advertising/Promotions - Public Relations 31,485 31,485 20,000 ___________<br />
Safety and Compliance Training 1,000 1,000 1,000 ___________<br />
Environmental Mitigation 3,600 3,600 3,600 ___________<br />
Air Traffic Control Tower Expenses 2,727 4,625 4,625 1,500 ___________<br />
Airpark Land Sale - Phase I 53,853<br />
SUB-TOTAL 1,073,536 1,567,641 1,520,928 1,395,618<br />
E – 197
LAKELAND LINDER REGIONAL AIRPORT<br />
BUDGET FOR YEAR 2007-08<br />
Experience Budget Experience Proposed Adjustments<br />
For Year For Year 2006-07 by by<br />
2005-06 2006-07 Estimated <strong>City</strong> Manager <strong>City</strong> Commission<br />
AIRPORT MAINTENANCE<br />
Leases:<br />
Landmark (formerly Piedmont Hawthorne) 1,000 1,000 1,000 ___________<br />
Tony's Airside Restaurant 250 1,000 1,000 1,000 ___________<br />
August Busch III (formerly Europa) 500 500 500 ___________<br />
Wing Waxers (formerly Renaissance) 240 500 500 500 ___________<br />
Columbia (formerly <strong>Lakeland</strong> Air) 1,600 1,600 1,600 ___________<br />
Top Gun 1,418 2,600 2,600 2,600 ___________<br />
AET LLC 1,000 1,000 1,000 ___________<br />
Air Logic Solutions 1,000 1,000 1,000 ___________<br />
Airport Maintenance Building N-1 750 1,250 750 ___________<br />
Airport Maintenance Building N-7 1,800 1,800 1,800 ___________<br />
Maintenance <strong>of</strong> Facilities 1,500 1,500 1,500 ___________<br />
Sun 'N Fun Maintenance 23,612 25,000 25,000 25,000 ___________<br />
Drainage Maintenance 12,003 51,073 51,073 35,000 ___________<br />
Airfield Security and Access Control 9,289 13,500 15,000 15,450 ___________<br />
Airfield Pavement Maintenance 575 139,816 139,816 50,000 ___________<br />
Misc. Maintenance Projects 15,000 31,588 31,588 25,000 ___________<br />
Repair <strong>of</strong> Fixtures - Airside 3,648 12,022 12,022 12,500 ___________<br />
T-Hangar Painting/Repair 20,300 20,300 10,000 ___________<br />
Hangar Maintenance Program 1,658 7,887 7,887 5,000 ___________<br />
Hangar Maintenance 36-70 51<br />
Paint runway 5-23 and 9-27 438 30,012 30,012<br />
Runway Markings Maintenance 20,000 20,000 20,000 ___________<br />
Ditch Spraying 3,995 5,000 5,000 5,000 ___________<br />
Hangar Door Repairs 2,426 3,000 3,000 23,000 ___________<br />
Reglaze & Recaulk Glass & Doors<br />
- 3200 Flightline 75,000 ___________<br />
Deforestation - Runway 9 Approach 30,000 ___________<br />
SUB-TOTAL 74,603 372,448 374,448 344,200<br />
TOTAL AIRPORT 2,173,892 3,172,602 3,106,981 3,100,764<br />
E – 198
LAKELAND LINDER REGIONAL AIRPORT<br />
BUDGET FOR YEAR 2007-08<br />
Experience Budget Experience Proposed Adjustments<br />
For Year For Year 2006-07 by by<br />
2005-06 2006-07 Estimated <strong>City</strong> Manager <strong>City</strong> Commission<br />
AIRSIDE EXPENSES<br />
OPERATING EXPENSES<br />
Rental / Fleet Equipment 3,150 1,413 1,413 1,492 ___________<br />
Gasoline / Fleet Equipment 416 522 522 1,885 ___________<br />
Maintenance / Fleet Equipment 2,239 1,262 18 2,731 ___________<br />
Insurance - Fire 38,537<br />
Insurance - Position Bond & Crime Coverag 131 131 141 ___________<br />
Insurance - Consultant 754<br />
Self-Insurance Service 9,700 17,318 14,772 15,000 ___________<br />
Water Utility Service 29,237 27,000 34,750 31,557 ___________<br />
Stormwater Fees 881 950 819 1,843 ___________<br />
Electric Utility Service 91,891 124,000 120,383 147,668 ___________<br />
Wastewater Utility Service 27,164 26,000 29,545 30,662 ___________<br />
Intra-Dept Charges - Janitorial 22,393 23,288 23,288 24,352 ___________<br />
Intra-Dept Charges - IT 1,254 1,254 1,254 ___________<br />
Solid Waste Service 13,875 14,300 11,473 16,959 ___________<br />
Special Services 24,566 26,200 26,200 31,200 ___________<br />
Banking Services 179 198 198 214 ___________<br />
Promotion Expense 4,000 4,000 4,000 ___________<br />
Agency Commissions 22,500 22,500 22,500 30,000 ___________<br />
Non-Capital Equipment 750 750 750 ___________<br />
All Other Materials & Supplies 2,362 4,200 4,200 4,200 ___________<br />
Uniforms 283 600 600 600 ___________<br />
Cleaning & Janitor Supplies 250 250 250 250 ___________<br />
Chemicals 424 500 500 500 ___________<br />
Tools, Implements & Instruments 656 750 750 750 ___________<br />
Rents 600 600 600 ___________<br />
Repair <strong>of</strong> Equipment 882 10,000 10,000 10,300 ___________<br />
Printing & Photography 123 300 300 300 ___________<br />
Telephone, Communications 2,435 2,400 2,400 2,400 ___________<br />
Ad Valorem Taxes 90,375 193,800 199,300 200,000 ___________<br />
Bad Debt Expense 210,879 8,500 8,500 8,500 ___________<br />
SUB-TOTAL 596,151 512,986 519,416 570,108<br />
E – 199
LAKELAND LINDER REGIONAL AIRPORT<br />
BUDGET FOR YEAR 2007-08<br />
Experience Budget Experience Proposed Adjustments<br />
For Year For Year 2006-07 by by<br />
2005-06 2006-07 Estimated <strong>City</strong> Manager <strong>City</strong> Commission<br />
AIRSIDE MAINTENANCE<br />
Leases:<br />
S & S Development 408 15,050 15,050<br />
Clean LAC Ditch 10,000 10,000<br />
Fire System Maintenance 5,400 36,500 36,500 21,300 ___________<br />
Old Geico Bldg - Pressure Wash & Paint 25,000 25,000<br />
SUB-TOTAL 5,808 86,550 86,550 21,300<br />
TOTAL AIRSIDE 601,959 599,536 605,966 591,408<br />
OTHER CASH DISBURSEMENTS<br />
CAPITAL OUTLAY<br />
Equipment 4,000 17,000 17,000 15,500<br />
SPECIAL PROJECTS<br />
FDOT - Land Acquisition W <strong>of</strong> Airport 658,696 658,696<br />
FAA/FDOT Construct E End Serv. Rd. 10,000<br />
FAA/FDOT Runway 5-23 Rehab. 3,580,750 234,899 73,696<br />
FDOT-Airport Perimeter Fencing 33,431 59,319 59,319<br />
FDOT - 2004 Hurricane 217,398 207,602 23,061<br />
FEMA-<strong>Lakeland</strong> Linder Airport PW15540C 224,000<br />
FDOT-Airport Security Plan 10,000<br />
FDOT-1500 ARFF Vehicle 750,000 750,000<br />
FEMA - Tenant 383,818 383,818<br />
Hanger 3 Ro<strong>of</strong> Replacement 77,000 75,200<br />
FAA Airport Grant (Hurricane) 5,322 449,763 56,793<br />
LAC Fire Sprinkler Upgrade 30,000 30,000 10,000 ___________<br />
LAC Fire Suppression System Pump 135,000 135,000<br />
LAC Buildout Contingency 51,635 73,365 73,365 50,000 ___________<br />
LAC R&D Building - Ro<strong>of</strong> 80,000 8,000 8,000<br />
Pneumatic Controls Repair - S&S Develop. 17,635 17,635<br />
LAC - Install Electrical Submeters 15,000 15,000 25,000 ___________<br />
Keiser Tenant Buildout Payback 108,760 108,760<br />
Renovate Tower Building 75,000 75,000<br />
Construct ATC Facility Site Study 40,000 40,000<br />
FDOT - Door/Gate Access Control System 33,000 68,000<br />
Airport Security Assessment Plan 25,000<br />
3131 Flightline - HVAC 134,000 134,000<br />
Fire System Repair - 3131 Flightline Dr 30,000 ___________<br />
Building Repairs - 3830 Airfield Ct, W 48,000 ___________<br />
Airport Entrance Sign 15,000 ___________<br />
SUB-TOTAL 4,202,536 3,525,857 2,785,343 178,000<br />
E – 200
LAKELAND LINDER REGIONAL AIRPORT<br />
BUDGET FOR YEAR 2007-08<br />
Experience Budget Experience Proposed Adjustments<br />
For Year For Year 2006-07 by by<br />
2005-06 2006-07 Estimated <strong>City</strong> Manager <strong>City</strong> Commission<br />
DEBT SERVICE<br />
Sun Bank - Sun 'N Fun Loan Interest 3,754 331 331<br />
Sun Bank - Sun 'N Fun Loan Principal 63,271 22,095 22,095<br />
Airport Terminal Construction 161,245 156,094 156,094 152,093 ___________<br />
Internal Loan - LAC Acquisition 140,000 140,000 140,000 140,000 ___________<br />
Airport / Airside Loan Consolidation 788,731 788,731 788,731 788,731 ___________<br />
Land Acquisition West <strong>of</strong> Airport 10,688 10,688 10,688 238,360 ___________<br />
SUB-TOTAL 1,167,689 1,117,939 1,117,939 1,319,184<br />
CONTRIBUTION TO OTHER FUNDS<br />
Radio System Expansion - Public Safety 4,778 4,778 4,778 4,778 ___________<br />
Debt Service Fund 38,582 34,678 34,678 36,732 ___________<br />
LAC - Sinking Fund 29,106 32,010 32,010 33,906 ___________<br />
Fleet Management Reserve Fund 3,000 3,000 14,500 ___________<br />
SUB-TOTAL 72,466 74,466 74,466 89,916<br />
TOTAL 5,446,691 4,735,262 3,994,748 1,602,600<br />
GRAND TOTAL EXPENSES 8,222,542 8,507,400 7,707,695 5,294,772<br />
E – 201
LAKELAND LINDER REGIONAL AIRPORT<br />
BUDGET FOR YEAR 2007-08<br />
Experience Budget Experience Proposed Adjustments<br />
For Year For Year 2006-07 by by<br />
2005-06 2006-07 Estimated <strong>City</strong> Manager <strong>City</strong> Commission<br />
Equipment<br />
Trailer New 10,000<br />
Equipment Hi-lift New 5,500<br />
15,500<br />
PERSONNEL Current Proposed Pay Salary<br />
POSITION TITLE Budget Budget Grade Range<br />
Airport Director 1 1 PB3 *<br />
Airport Operations Manager 1 1 58 51,979 - 78,666<br />
Accountant III 1 1 58 51,979 - 78,666<br />
Airport Property Manager 1 1 51 43,805 - 64,730<br />
Operations Support Supervisor III 1 1 42 35,173 - 53,248<br />
Maintenance Mechanic II 1 2 38 31,907 - 48,298<br />
Maintenance Mechanic I 1 1 33 28,246 - 42,765<br />
Account Clerk IV 1 1 33 28,246 - 42,765<br />
Operations Support Technician II 1 1 29 25,605 - 38,771<br />
Operations Support Technician I 1 1 24 22,693 - 34,320<br />
Office Assistant II 1 1 22 21,590 - 32,677<br />
Operations Support Worker II 1 1 18 19,594 - 29,661<br />
TOTAL FULL-TIME EMPLOYEES 12 13<br />
GRANT-FUNDED POSITIONS<br />
Air Traffic Control Tower Chief 1 1 54 47,133 - 71,365<br />
Air Traffic Controller 7 7 43 36,026 - 54,579<br />
TOTAL GRANT-FUNDED POSITIONS 8 8<br />
PART-TIME<br />
Operations Support Worker II 2 2<br />
TOTAL PART-TIME EMPLOYEES 2 2<br />
E – 202
REVENUE AND EXPENDITURE SUMMARY<br />
SOLID WASTE<br />
Experience Budget Experience 2007-08<br />
For Year For Year 2006-07 Proposed by<br />
EXPENSES 2005-06 2006-07 Estimated <strong>City</strong> Manager<br />
Personnel<br />
Salaries and Wages 2,385,845 2,825,598 2,488,436 2,935,957<br />
Fringe Benefits 642,719 801,847 682,081 908,161<br />
Total Personnel 3,028,564 3,627,445 3,170,518 3,844,118<br />
Non-Personnel<br />
Internal Service Charges 3,420,966 3,848,730 3,507,317 3,748,862<br />
Pr<strong>of</strong>essional and Contractual 282,033 222,765 224,427 218,224<br />
Utilities 26,678 27,348 25,791 29,732<br />
Insurance and Fixed Charges 246,445 358,724 308,965 367,066<br />
All Other Operations and Maintenance 3,332,850 3,763,454 3,131,467 3,766,008<br />
Capital Outlay 18,416 260,584 254,046 375,000<br />
Debt Service 272,134 155,977 155,978 155,978<br />
Total Non-Personnel 7,599,522 8,637,582 7,607,991 8,660,870<br />
Total Expenditures 10,628,086 12,265,027 10,778,509 12,504,988<br />
Transfers<br />
Transfers In<br />
Transfers Out (1,287,198) (1,255,900) (1,255,900) (1,314,720)<br />
Net Transfers (1,287,198) (1,255,900) (1,255,900) (1,314,720)<br />
Revenue Sources<br />
Taxes<br />
Licenses and Permits<br />
Intergovernmental 42,607<br />
Charges for Services 12,179,213 12,899,900 12,859,184 13,550,589<br />
Interest Income 38,554 47,415 96,794 83,852<br />
All Other Revenue 540,945 525,000 491,106 288,800<br />
Total Revenue 12,801,319 13,472,315 13,447,084 13,923,241<br />
Funding to be Provided (886,035) 48,612 (1,412,675) (103,533)<br />
E – 203
SOLID WASTE<br />
INTERGOVERNMENTAL REVENUE<br />
State Grants<br />
Debris Removal - Solid Waste 42,607<br />
TOTAL INTERGOVERNMENTAL<br />
REVENUE 42,607<br />
BUDGET FOR YEAR 2007-08<br />
Experience Budget Experience Proposed Adjustments<br />
For Year For Year 2006-07 by by<br />
2005-06 2006-07 Estimated <strong>City</strong> Manager <strong>City</strong> Commission<br />
CHARGES FOR SERVICES<br />
Physical Environment/Garbage -<br />
Solid Waste Revenue:<br />
Roll-Off Container Fees:<br />
Franchise Fees 379,796 347,500 383,450 354,500 ___________<br />
<strong>City</strong> <strong>of</strong> <strong>Lakeland</strong> Operations:<br />
Collection Charge 176<br />
Rental Fees 12,154 12,700 10,844 11,000 ___________<br />
Delivery Fees 9,675 10,900 6,672 7,000 ___________<br />
Return/Replacement Fees 252,068 275,000 273,158 285,000 ___________<br />
Roll-Off Collection Surcharge 47,542 54,600 48,324 50,500 ___________<br />
Disposal Charges 201,559 218,200 175,000 202,000 ___________<br />
Refuse Collection Charges:<br />
Residential 5,523,522 5,765,000 5,746,362 6,094,017 ___________<br />
Commercial 4,749,360 5,168,000 5,201,172 5,507,800 ___________<br />
Intra-<strong>City</strong> 301,147 326,000 291,402 305,972 ___________<br />
Recycling Residential 702,214 722,000 722,800 732,800 ___________<br />
TOTAL CHARGES FOR SERVICE 12,179,213 12,899,900 12,859,184 13,550,589<br />
MISCELLANEOUS REVENUE<br />
Interest Earnings<br />
Interest on Pooled Investments 38,554 47,415 96,794 83,852 ___________<br />
SUB-TOTAL 38,554 47,415 96,794 83,852<br />
Other Miscellaneous Revenue<br />
Recycling Proceeds 212,383 230,000 219,378 232,300 ___________<br />
Scrap Metal 23,334 30,000 6,728 6,500 ___________<br />
Insurance Proceeds - Workers Comp 113<br />
All Other 447<br />
Bad Check Charges 4,668<br />
Payment in lieu <strong>of</strong> waste disposal - LE 150,000 100,000 100,000 50,000 ___________<br />
SUB-TOTAL 390,945 360,000 326,106 288,800<br />
TOTAL MISCELLANEOUS REVENUE 429,499 407,415 422,900 372,652<br />
OPERATING SUBSIDIES<br />
Transfers From Other Funds<br />
Internal Loan Fund- Rear Packer 150,000 165,000 165,000<br />
TOTAL TRANSFERS 150,000 165,000 165,000<br />
TOTAL REVENUE 12,801,319 13,472,315 13,447,084 13,923,241<br />
SURPLUS - PRIOR YEARS (886,035) 48,612 (1,412,675) (103,533)<br />
GRAND TOTAL REVENUES 11,915,284 13,520,927 12,034,409 13,819,708<br />
E – 204
SOLID WASTE<br />
BUDGET FOR YEAR 2007-08<br />
Experience Budget Experience Proposed Adjustments<br />
For Year For Year 2006-07 by by<br />
2005-06 2006-07 Estimated <strong>City</strong> Manager <strong>City</strong> Commission<br />
EXPENSES<br />
ADMINISTRATION<br />
PERSONAL SERVICES 266,290 450,717 292,640 389,008<br />
OPERATING EXPENSES<br />
Rental / Fleet Equipment 2,938 1,638 1,638 1,729 ___________<br />
Gasoline / Fleet Equipment 594 774 540 1,387 ___________<br />
Maintenance / Fleet Equipment 481 1,292 1,292 1,813 ___________<br />
Insurance - Fire 1,262 1,319 1,318 1,000 ___________<br />
Insurance - Position Bond 368 1,104 1,104 458 ___________<br />
Insurance - Consultant 5,044 2,887 4,959 4,418 ___________<br />
Self-Insurance Service 215,005 325,638 275,880 331,273 ___________<br />
Purchasing & Stores Service 6,154 6,536 6,536 7,059 ___________<br />
General Fund Service 614,545 636,314 636,314 612,399 ___________<br />
Billing Services 144,088 150,023 150,024 157,524 ___________<br />
Water Utility Service 4,047 4,300 4,716 4,536 ___________<br />
Electric Utility Service 11,981 11,994 10,200 13,570 ___________<br />
Wastewater Utility Service 5,211 5,417 5,549 5,985 ___________<br />
Stormwater Fees 69 100 70 155 ___________<br />
Solid Waste Service 3,411 3,600 3,669 3,852 ___________<br />
Intra-Dept Charges - Computer Rental 17,355 13,909 12,860 14,899 ___________<br />
Intra-Dept Charges - Telephone 5,262 5,283 5,282 6,078 ___________<br />
Intra-Dept Charges - Radios 16,700 17,461 17,524 16,720 ___________<br />
Intra-Dept Charges - Facilities 4,395 4,986 4,986 7,690 ___________<br />
Intra-Dept Charges - Janitorial 4,844 5,485 5,485 6,334 ___________<br />
Intra-Dept Charges - IT 14,408 11,330 11,330 10,286 ___________<br />
Intra-Dept Charges - Training 4,188 ___________<br />
Special Services 1,879 12,700 12,700 2,700 ___________<br />
Banking Services 1,336 1,473 1,473 1,596 ___________<br />
Advertising 574 990 990 1,010 ___________<br />
Annual Audit 5,420 4,500 4,090 4,500 ___________<br />
Office Supplies 4,415 5,165 5,165 5,320 ___________<br />
Non-Capital Equipment 77,229 76,300 76,300 78,550 ___________<br />
All Other Material & Supply 5,053 5,165 5,165 5,320 ___________<br />
Uniforms 30,038 28,840 28,840 29,700 ___________<br />
Chemicals 5,976 5,253 5,253 5,300 ___________<br />
Tools & Implements 2,929 5,000 5,000 5,150 ___________<br />
Personal Safety Equipment 4,087 4,120 4,120 4,240 ___________<br />
Parts For Equipment 12,308 9,424 9,424 9,700 ___________<br />
Tolls 6,777 4,738 4,738 4,880 ___________<br />
Repair <strong>of</strong> Equipment 2,267 2,858 2,858 2,678 ___________<br />
Printing & Photography 2,356 2,530 2,530 2,530 ___________<br />
Postage & Mailing 34 1,100 1,100 1,100 ___________<br />
Subscriptions & Memberships 527 504 504 424 ___________<br />
E – 205
SOLID WASTE<br />
BUDGET FOR YEAR 2007-08<br />
Experience Budget Experience Proposed Adjustments<br />
For Year For Year 2006-07 by by<br />
2005-06 2006-07 Estimated <strong>City</strong> Manager <strong>City</strong> Commission<br />
OPERATING EXPENSES (continued)<br />
Telephone, Communications 1,817 1,587 1,587 1,634 ___________<br />
Travel 1,770 3,000 3,000 3,000 ___________<br />
Training 105 800 800 824 ___________<br />
All Other Sundry Charges 790 772 772 795 ___________<br />
Bad Debt Expense 56,564 70,000 70,000 65,000 ___________<br />
Retiree Health Insurance Subsidy 29,810 30,663 30,663 34,335 ___________<br />
SUB-TOTAL 1,332,223 1,488,872 1,438,348 1,483,639<br />
TOTAL ADMINISTRATION 1,598,513 1,939,589 1,730,988 1,872,647<br />
RECYCLING<br />
PERSONAL SERVICES 217,449 255,928 306,336 266,359<br />
OPERATING EXPENSES<br />
Rental / Fleet Equipment 120,278 97,884 97,884 121,448 ___________<br />
Gasoline / Fleet Equipment 71,962 124,319 84,276 97,326 ___________<br />
Maintenance / Fleet Equipment 89,610 165,642 93,018 228,386 ___________<br />
Advertising 1,000 1,000 1,000 1,000 ___________<br />
Office Supplies 308 515 515 515 ___________<br />
Non-Capital Equipment 5,528 15,200 15,200 15,650 ___________<br />
All Other Materials & Supplies 7,685 9,270 9,270 9,270 ___________<br />
Uniforms 444 636 636 655 ___________<br />
Printing & Photography 750 750 750 ___________<br />
Postage & Mailing 164 164 164 ___________<br />
Subscription & Membership 340 340 340 340 ___________<br />
Travel 844 726 726 750 ___________<br />
Training 70 324 324 333 ___________<br />
SUB-TOTAL 298,069 416,770 304,103 476,587<br />
TOTAL RECYCLING 515,518 672,698 610,440 742,946<br />
RECYCLING MATERIALS PROCESSING FACILITY<br />
PERSONAL SERVICES 244<br />
OPERATING EXPENSES<br />
Rental / Fleet Equipment 5,947 4,395 4,396 4,642 ___________<br />
Gasoline / Fleet Equipment 421 1,767 3,725 ___________<br />
Maintenance / Fleet Equipment 1,471 23,869 35,179 ___________<br />
Electric Utility Service 142 350<br />
SUB-TOTAL 7,981 30,381 4,396 43,546<br />
TOTAL RMPF 8,225 30,381 4,396 43,546<br />
E – 206
SOLID WASTE<br />
BUDGET FOR YEAR 2007-08<br />
Experience Budget Experience Proposed Adjustments<br />
For Year For Year 2006-07 by by<br />
2005-06 2006-07 Estimated <strong>City</strong> Manager <strong>City</strong> Commission<br />
RESIDENTIAL COLLECTION<br />
PERSONAL SERVICES 2,000,599 2,161,868 1,982,530 2,368,656<br />
OPERATING EXPENSES<br />
Rental / Fleet Equipment 599,707 403,266 384,686 408,497 ___________<br />
Gasoline / Fleet Equipment 315,435 532,703 351,893 330,065 ___________<br />
Maintenance / Fleet Equipment 590,418 724,180 842,564 742,648 ___________<br />
Contractual Services 243,480 149,215 149,215 153,000 ___________<br />
Disposal Charges 1,483,778 1,644,007 1,450,000 1,750,000 ___________<br />
SUB-TOTAL 3,232,818 3,453,371 3,178,358 3,384,210<br />
TOTAL RESIDENTIAL 5,233,417 5,615,239 5,160,888 5,752,866<br />
COMMERCIAL COLLECTION<br />
PERSONAL SERVICES 443,267 652,598 482,159 701,851<br />
OPERATING EXPENSES<br />
Rental / Fleet Equipment 282,026 186,897 186,896 270,697 ___________<br />
Gasoline / Fleet Equipment 162,187 249,416 205,050 213,530 ___________<br />
Maintenance / Fleet Equipment 264,151 375,957 337,462 346,419 ___________<br />
Special Services 23,300 50,000 50,000 50,000 ___________<br />
Disposal Charges 1,413,408 1,644,153 1,250,000 1,551,170 ___________<br />
SUB-TOTAL 2,145,072 2,506,423 2,029,407 2,431,816<br />
TOTAL COMMERCIAL 2,588,339 3,159,021 2,511,566 3,133,667<br />
ROLL-OFF CONTAINER SERVICE<br />
PERSONAL SERVICES 100,715 106,334 106,851 118,244<br />
OPERATING EXPENSES<br />
Rental / Fleet Equipment 48,445 28,404 28,404 30,005 ___________<br />
Gasoline / Fleet Equipment 20,816 35,000 19,024 24,046 ___________<br />
Maintenance / Fleet Equipment 16,328 40,000 17,954 44,143 ___________<br />
Disposal Charges 201,559 218,200 175,000 202,000 ___________<br />
SUB-TOTAL 287,148 321,604 240,382 300,194<br />
TOTAL ROLL-OFF SERVICE 387,863 427,938 347,233 418,438<br />
E – 207
SOLID WASTE<br />
BUDGET FOR YEAR 2007-08<br />
Experience Budget Experience Proposed Adjustments<br />
For Year For Year 2006-07 by by<br />
2005-06 2006-07 Estimated <strong>City</strong> Manager <strong>City</strong> Commission<br />
OTHER CASH DISBURSEMENTS<br />
CAPITAL OUTLAY<br />
Equipment<br />
Equipment Containers 18,416 21,584 15,046<br />
SUB-TOTAL 18,416 21,584 15,046<br />
SPECIAL PROJECTS<br />
Replace Overhead Door 3,995<br />
Solid Waste Office Renovation 1,666<br />
Wash Bay Renovation 20,000 20,000<br />
Ice Machine Covers 2,400 1,773<br />
Shelving and Flooring 1,200 1,200<br />
Washbay Repairs And Truck Wash System 300,000 ___________<br />
Replace Main Air Conditioning Unit For Solid Waste Building 6,000 ___________<br />
Replace Overhead Garage Door On Welding Shop 3,900 ___________<br />
Routesmart S<strong>of</strong>tware Application 75,000 ___________<br />
SUB-TOTAL 5,661 23,600 22,973 384,900<br />
DEBT SERVICE<br />
Recycling Trucks and Bins 73,511<br />
Recyclable Materials Processing Facility 25,185 25,185 25,185 25,185 ___________<br />
Rear Packing Refuse Trucks 157,265 54,581 54,581 54,581 ___________<br />
Solid Waste Rear-Packer 07 60,038 60,039 60,039 ___________<br />
SUB-TOTAL 255,961 139,804 139,805 139,805<br />
CONTRIBUTIONS TO OTHER FUNDS<br />
General Fund 1,287,198 1,255,900 1,255,900 1,314,720 ___________<br />
Information Technology Fund - Radio Towe 16,173 16,173 16,173 16,173 ___________<br />
Fleet Management Fund<br />
New Vehicles 54,000 54,000<br />
Solid Waste Rear-Packing Trucks 165,000 165,000<br />
SUB-TOTAL 1,303,371 1,491,073 1,491,073 1,330,893<br />
GRAND TOTAL EXPENSES 11,915,284 13,520,927 12,034,409 13,819,708<br />
E – 208
SOLID WASTE<br />
BUDGET FOR YEAR 2007-08<br />
Experience Budget Experience Proposed Adjustments<br />
For Year For Year 2006-07 by by<br />
2005-06 2006-07 Estimated <strong>City</strong> Manager <strong>City</strong> Commission<br />
PERSONNEL<br />
Current Proposed Pay Salary<br />
POSITION TITLE Budget Budget Grade Range<br />
Manager Of Solid Waste 1 1 65 61,630 - 93,330<br />
Supervisor Of Solid Waste 2 3 54 47,133 - 71,365<br />
Solid Waste Foreman 2 2 47 39,749 - 60,174<br />
Solid Waste Collection Driver III 17 17 31 26,894 - 40,726<br />
Account Clerk III 1 1 29 25,605 - 38,771<br />
Office Associate II 1 1 29 25,605 - 38,771<br />
Solid Waste Collection Driver II 14 15 29 25,605 - 38,771<br />
Customer Service Representative II 1 1 29 25,605 - 38,771<br />
Solid Waste Collection Driver I 9 10 24 22,693 - 34,320<br />
Customer Service Representative I 1 1 24 22,693 - 34,320<br />
Solid Waste Collector 31 33 20 20,571 - 31,138<br />
TOTAL FULL-TIME EMPLOYEES 80 85<br />
E – 209
THIS PAGE IS INTENTIONALLY BLANK<br />
E-210 Fiscal Year <strong>2008</strong> Annual Budget
REVENUE AND EXPENDITURE SUMMARY<br />
STORMWATER FUND<br />
Experience Budget Experience 2007-08<br />
For Year For Year 2006-07 by<br />
EXPENSES 2005-06 2006-07 Estimated <strong>City</strong> Manager<br />
Personnel<br />
Salaries and Wages 148,262 157,044 136,632 268,209<br />
Fringe Benefits 10,023 27,687 8,990 70,319<br />
Total Personnel 158,285 184,731 145,621 338,528<br />
Non-Personnel<br />
Internal Service Charges 105,413 120,058 114,154 134,169<br />
Pr<strong>of</strong>essional and Contractual<br />
Utilities 1,066 1,062 1,031 1,195<br />
Insurance and Fixed Charges<br />
All Other Operations and Maintenance 745,857 780,650 780,224 394,950<br />
Capital Outlay 2,233,040 6,069,714 5,584,714 5,051,457<br />
Debt Service<br />
Total Non-Personnel 3,085,376 6,971,484 6,480,124 5,581,771<br />
Total Expenditures 3,243,661 7,156,215 6,625,745 5,920,299<br />
Transfers<br />
Transfers In 1,475,000 1,205,000 1,205,000<br />
Transfers Out (47,803)<br />
Net Transfers 1,427,197 1,205,000 1,205,000<br />
Revenue Sources<br />
Taxes<br />
Licenses and Permits<br />
Intergovernmental 403,922 1,346,562 1,096,562 2,674,717<br />
Charges for Services 1,395,400 1,413,067 1,413,067 3,315,596<br />
Interest Income 92,176 61,819 61,819 100,830<br />
All Other Revenue 21,947<br />
Total Revenue 1,913,446 2,821,448 2,571,448 6,091,143<br />
Funding to be Provided (96,982) 3,129,767 2,849,297 (170,844)<br />
E – 211
LAKES AND STORMWATER<br />
BUDGET FOR YEAR 2007-08<br />
Actual Budget Experience Proposed Adjustments<br />
For Year For Year 2006-07 by by<br />
EXPENSES 2005-06 2006-07 Estimated <strong>City</strong> Manager <strong>City</strong> Commission<br />
INTERGOVERNMENTAL REVENUE<br />
REVENUES<br />
Federal Grants<br />
N <strong>Lakeland</strong> Drainage Basin A 83,873 83,873 545,127 ___________<br />
N <strong>Lakeland</strong> Drainage Basin B 8,456 8,456 47,777 ___________<br />
N <strong>Lakeland</strong> Drainage Basin C 144,786 144,786 781,844 ___________<br />
N <strong>Lakeland</strong> Drainage Basin D 3,047 3,047 17,219 ___________<br />
SUB-TOTAL 240,162 240,162 1,391,967<br />
State Grants<br />
Griffin Road Stormwater Retr<strong>of</strong>it 125,000<br />
Urban Restoration Initiative 500,000 250,000 250,000 ___________<br />
SUB-TOTAL 125,000 500,000 250,000 250,000<br />
Local Grants<br />
Lk. Parker - SW Basin Inflow Quality (7,580)<br />
Griffin Road Stormwater Retr<strong>of</strong>it 200,000<br />
Lk. Morton Shoreline Improvements 67,931 5,459 5,459<br />
Westside Hollingsworth Stormwater 189,216 189,216<br />
Lk. Parker - SW Basin BMPs 5,743 336,725 336,725 470,250 ___________<br />
Lk. Gibson SW Basin Design 12,828 75,000 75,000 562,500 ___________<br />
SUB-TOTAL 278,922 606,400 606,400 1,032,750<br />
TOTAL INTERGOVERNMENTAL 403,922 1,346,562 1,096,562 2,674,717<br />
CHARGES FOR SERVICES<br />
Stormwater Utility Revenues<br />
Commercial 634,549 638,000 638,000 1,526,850 ___________<br />
Residential 731,387 746,000 746,000 1,720,350 ___________<br />
Intra-<strong>City</strong> 29,465 29,067 29,067 68,396 ___________<br />
TOTAL CHARGES FOR SERVICES 1,395,401 1,413,067 1,413,067 3,315,596<br />
E – 212
LAKES AND STORMWATER<br />
BUDGET FOR YEAR 2007-08<br />
Actual Budget Experience Proposed Adjustments<br />
For Year For Year 2006-07 by by<br />
EXPENSES 2005-06 2006-07 Estimated <strong>City</strong> Manager <strong>City</strong> Commission<br />
MISCELLANEOUS REVENUE<br />
Interest Earnings<br />
Interest on Pooled Investments 92,176 61,819 61,819 100,830 ___________<br />
SUB-TOTAL 92,176 61,819 61,819 100,830<br />
Other Miscellaneous Revenue<br />
Bad Check Charges 1,556<br />
Refund <strong>of</strong> Prior Year Expenses 900<br />
Reimbursements/Loss Recovery 19,491<br />
SUB-TOTAL 21,947<br />
TOTAL MISCELLANEOUS REVENUE 114,123 61,819 61,819 100,830<br />
OPERATING SUBSIDIES<br />
Transfers From Other Funds<br />
Transportation Fund 1,475,000 1,205,000 1,205,000<br />
TOTAL TRANSFERS 1,475,000 1,205,000 1,205,000<br />
TOTAL REVENUE 3,388,446 4,026,448 3,776,448 6,091,143<br />
PRIOR YEAR SURPLUS (96,982) 3,129,767 2,849,297 (170,844)<br />
GRAND TOTAL REVENUES 3,291,464 7,156,215 6,625,745 5,920,299<br />
ADMINISTRATION<br />
PERSONAL SERVICES 158,285 184,731 145,621 335,208<br />
E – 213
LAKES AND STORMWATER<br />
BUDGET FOR YEAR 2007-08<br />
Actual Budget Experience Proposed Adjustments<br />
For Year For Year 2006-07 by by<br />
EXPENSES 2005-06 2006-07 Estimated <strong>City</strong> Manager <strong>City</strong> Commission<br />
OPERATING EXPENSES<br />
Retiree Health Insurance Subsidy 3,320 ___________<br />
Rental / Fleet Equipment 7,078 7,637 6,066 6,407 ___________<br />
Gasoline / Fleet Equipment 2,072 5,613 1,668 3,533 ___________<br />
Maintenance / Fleet Equipment 1,813 4,710 4,710 6,612 ___________<br />
Purchasing & Stores Service 2,454 2,606 2,606 2,815 ___________<br />
General Fund Services 57,239 65,275 65,275 76,057 ___________<br />
Water Utility Service 21 26 20 20 ___________<br />
Electric Utility Service 982 961 946 1,101 ___________<br />
Wastewater Utility Service 21 28 22 24 ___________<br />
Solid Waste Service 42 47 43 50 ___________<br />
Intra-Dept Charges - Computer Rental 13,715 11,283 11,133 12,908 ___________<br />
Intra-Dept Charges - Telephone 1,313 1,299 1,098 1,280 ___________<br />
Intra-Dept Charges - Radios 1,002 1,048 1,011 965 ___________<br />
Intra-Dept Charges - Facilities 544 617 617 2,212 ___________<br />
Intra-Dept Charges - Janitorial 556 629 629 1,708 ___________<br />
Intra-Dept Charges - IT 17,627 19,341 19,341 19,376 ___________<br />
Intra-Dept Charges - Training<br />
296 ___________<br />
Office Supplies 117 344 281 850 ___________<br />
Uniforms 25 1,000 947 750 ___________<br />
Tools, Implements & Instruments 453 500 453 350 ___________<br />
Safety Supplies 108 100 100 100 ___________<br />
Repair <strong>of</strong> Equipment 150 150<br />
Printing & Photography 132 250 250 250 ___________<br />
Telephone, Communications 378 800 537 850 ___________<br />
All Other Administrative 475 300 300 300 ___________<br />
Bad Debt Expense 6,944 10,000 10,000 10,000 ___________<br />
NPDES Permitting - Administration 57,819 60,000 60,000 7,500 ___________<br />
Stormwater Administration 14,233 60,000 60,000 3,000 ___________<br />
SUB-TOTAL 187,163 254,564 248,204 162,634<br />
TOTAL ADMINISTRATION 345,448 439,295 393,825 497,842<br />
OTHER CASH DISBURSEMENTS<br />
SPECIAL PROJECTS<br />
Stormwater Projects 1,659,981 5,396,143 4,911,143 2,201,500<br />
Drainage Projects 1,067,944 997,598 997,598 2,940,957<br />
Lakes and Environmental Projects 218,091 323,179 323,179 280,000<br />
SUB-TOTAL 2,946,016 6,716,920 6,231,920 5,422,457<br />
GRAND TOTAL EXPENSES 3,291,464 7,156,215 6,625,745 5,920,299<br />
PERSONNEL<br />
Current Proposed Pay Salary<br />
POSITION TITLE Budget Budget Grade Range<br />
Manager <strong>of</strong> Lakes & Stormwater 1 1 65 61,630 - 93,330<br />
Environmental Specialist 3 3 47 39,749 - 60,174<br />
Lakes Program Coordinator 1 1 40 33,509 - 50,710<br />
TOTAL FULL-TIME EMPLOYEES 5 5<br />
E – 214
REVENUE AND EXPENDITURE SUMMARY<br />
ELECTRIC UTILITY<br />
Experience Budget Experience 2007-08<br />
For Year For Year 2006-07 Proposed by<br />
EXPENSES 2005-06 2006-07 Estimated <strong>City</strong> Manager<br />
Personnel<br />
Salaries and Wages 22,864,002 27,207,060 25,051,690 28,546,406<br />
Fringe Benefits 5,017,250 6,250,021 5,324,254 6,212,108<br />
Total Personnel 27,881,253 33,457,081 30,375,944 34,758,515<br />
Non-Personnel<br />
Internal Service Charges 9,690,964 10,904,223 9,594,979 11,932,910<br />
Pr<strong>of</strong>essional and Contractual 8,875,213 10,475,888 8,678,890 9,677,763<br />
Utilities 1,086,273 1,031,741 1,019,353 1,041,371<br />
Insurance and Fixed Charges 2,034,673 2,750,921 2,055,311 2,400,241<br />
All Other Operations and Maintenance 268,682,728 261,463,922 263,965,266 244,089,002<br />
Capital Outlay 21,623,211 16,830,521 16,922,275 36,567,000<br />
Debt Service 37,589,904 40,850,000 40,838,980 42,661,938<br />
Total Non-Personnel 349,582,966 344,307,216 343,075,054 348,370,225<br />
Total Expenditures 377,464,219 377,764,297 373,450,998 383,128,740<br />
Transfers<br />
Transfers In<br />
Transfers Out (18,000,000) (16,600,000) (16,600,000) (24,000,000)<br />
Net Transfers (18,000,000) (16,600,000) (16,600,000) (24,000,000)<br />
Revenue Sources<br />
Taxes<br />
Licenses and Permits<br />
Intergovernmental<br />
Charges for Services 385,997,913 392,778,667 391,432,540 403,984,551<br />
Interest Income 3,723,648 3,852,324 3,158,748 3,014,000<br />
All Other Revenue 1,125,625 142,633 10,324,468 139,300<br />
Total Revenue 390,847,186 396,773,624 404,915,757 407,137,851<br />
Funding to be Provided 4,617,033 (2,409,327) (14,864,759) (9,111)<br />
E – 215
ELECTRIC UTILITY<br />
BUDGET FOR YEAR 2007-08<br />
Experience Budget 12 Month Proposed Adjustments<br />
For Year For Year Actual Thru by by<br />
2005-06 2006-07 March 31 <strong>City</strong> Manager <strong>City</strong> Commission<br />
FULL-ACCRUAL FINANCIAL INFORMATION<br />
ELECTRIC REVENUE 381,352,085 382,775,667 383,394,429 403,984,551 ___________<br />
ELECTRIC EXPENSES:<br />
O&M Expenses<br />
Fuel and Purchased Power 246,095,420 243,600,415 245,790,107 226,738,440 ___________<br />
Production 21,223,470 23,734,892 22,081,994 22,757,476 ___________<br />
Transmission/Distribution 16,511,768 19,452,481 17,764,087 19,965,445 ___________<br />
Customer Service and Accounting 7,726,592 9,421,803 7,403,862 8,749,258 ___________<br />
Administrative and General 22,641,041 23,574,185 22,327,679 25,389,183 ___________<br />
Total O&M Expenses 314,198,290 319,783,776 315,367,728 303,599,802<br />
Depreciation 38,264,783 38,088,708 38,088,708 36,645,007 ___________<br />
TOTAL OPERATING EXPENSE 352,463,073 357,872,484 353,456,436 340,244,809<br />
OPERATING INCOME 28,889,012 24,903,183 29,937,993 63,739,742<br />
NON OPERATING INCOME/EXPENSE<br />
Investment Income 3,723,647 3,852,324 3,158,748 3,014,000 ___________<br />
Other Income 1,351,468 145,633 2,502,580 139,300 ___________<br />
Interest Expense 23,292,245 25,033,786 25,022,766 24,698,704 ___________<br />
Amortization 2,492,478 2,376,383 2,376,383 2,672,567 ___________<br />
Net Non-Operating Items (20,709,608) (23,412,212) (21,737,821) (24,217,971)<br />
INCOME BEFORE TRANSFERS 8,179,404 1,490,971 8,200,172 39,521,771<br />
OPERATING TRANSFERS<br />
<strong>City</strong> Dividend 18,000,000 16,600,000 16,600,000 24,000,000 ___________<br />
NET INCOME (9,820,596) (15,109,029) (8,399,828) 15,521,771<br />
E – 216
ELECTRIC UTILITY<br />
BUDGET FOR YEAR 2007-08<br />
Experience Budget 12 Month Proposed Adjustments<br />
For Year For Year Actual Thru by by<br />
2005-06 2006-07 March 31 <strong>City</strong> Manager <strong>City</strong> Commission<br />
CASH BASIS FINANCIAL INFORMATION<br />
NET INCOME - FULL ACCRUAL (9,820,596) (15,109,029) (8,399,828) 15,521,771 ___________<br />
Adjustments to convert full accrual-based net income to Cash Available for Future Expansion:<br />
Add Back Non-cash Expenses: ___________<br />
Depreciation, Amortization 41,204,685 40,465,091 40,443,076 39,317,574 ___________<br />
Interest Expense 2,250,972 2,358,786 2,358,786 2,471,766 ___________<br />
Production Expense (4,862,517) (4,042,638) (4,042,638) (3,651,000) ___________<br />
Deduct Cash Disbursements Excluded<br />
From Expenses:<br />
Capitalized Interest Expense (453,631) (940,000) (940,000) (1,000,000) ___________<br />
Non-cash Pension Cost Credit (12,906) (300,000) (300,000) (300,000) ___________<br />
Capital Transfers to other Funds:<br />
Renewal & Replacement (16,310,511) (12,363,622) (12,363,622) (32,616,000) ___________<br />
Fleet Management (15,000) (125,261) (125,261)<br />
Information Technology Fund (125,000)<br />
Emergency Repair Fund (310,183) (299,000) (390,754) (300,000) ___________<br />
Sale <strong>of</strong> Bond Warrants 7,860,000<br />
Over (Under) Recovery <strong>of</strong> Fuel Costs 4,419,984 10,000,000 8,000,000<br />
Bond Principal Payments (16,095,000) (17,235,000) (17,235,000) (19,435,000) ___________<br />
Increase in Inventory (4,487,330)<br />
Balance Available For<br />
Reserve For Future Expansion (4,617,033) 2,409,327 14,864,759 9,111<br />
E – 217
ELECTRIC UTILITY<br />
Experience Budget Proposed<br />
For Year For Year by<br />
2005-06 2006-07 <strong>City</strong> Manager<br />
RETAIL BUSINESS SEGMENT<br />
ELECTRIC REVENUE 156,672,257 160,159,985 179,076,881<br />
ELECTRIC EXPENSES:<br />
O&M Expenses (69,465,791) (70,781,304) (78,862,934)<br />
Depreciation (38,712,207) (38,066,693) (36,645,007)<br />
OPERATING INCOME 48,494,259 51,311,988 63,568,940<br />
NON OPERATING INCOME/EXPENSE<br />
Investment Income 3,723,647 3,158,748 3,014,000<br />
Other Income 1,351,468 2,502,580 139,300<br />
Interest Expense (23,292,245) (25,022,766) (24,698,704)<br />
Amortization (2,492,478) (2,376,383) (2,672,567)<br />
Net Non-Operating Items (20,709,608) (21,737,821) (24,217,971)<br />
INCOME BEFORE TRANSFERS 27,784,651 29,574,166 39,350,969<br />
CITY DIVIDEND (18,000,000) (16,600,000) (24,000,000)<br />
NET INCOME 9,784,651 12,974,166 15,350,969<br />
FUEL COST RECOVERY BUSINESS SEGMENT<br />
ELECTRIC REVENUE 185,687,396 189,203,094 181,403,800<br />
ELECTRIC EXPENSES:<br />
O&M Expenses (185,239,972) (189,181,079) (181,403,800)<br />
Depreciation (447,424) (22,015)<br />
OPERATING INCOME<br />
WHOLESALE BUSINESS SEGMENT<br />
ELECTRIC REVENUE 39,439,856 34,053,366 43,503,870<br />
ELECTRIC EXPENSES:<br />
O&M Expenses (59,045,103) (55,427,360) (43,333,068)<br />
OPERATING GAIN (LOSS) (19,605,247) (21,373,994) 170,802<br />
E – 218
ELECTRIC UTILITY<br />
BUDGET FOR YEAR 2007-08<br />
Experience Budget 12 Month Proposed Adjustments<br />
For Year For Year Actual Thru by by<br />
2005-06 2006-07 March 31 <strong>City</strong> Manager <strong>City</strong> Commission<br />
ELECTRIC REVENUE<br />
Sales <strong>of</strong> Electricity<br />
Residential Sales 84,222,111 86,873,194 86,353,382 94,308,190 ___________<br />
Fuel 93,023,720 89,004,217 92,231,436 91,090,085 ___________<br />
SUB-TOTAL 177,245,831 175,877,411 178,584,818 185,398,275<br />
Commercial & Industrial Sales<br />
Commercial 34,830,494 35,222,054 36,723,181 39,128,027 ___________<br />
Industrial 15,733,567 17,671,080 16,416,532 18,054,487 ___________<br />
Fuel 90,267,374 85,480,773 94,563,205 88,389,603 ___________<br />
SUB-TOTAL 140,831,435 138,373,907 147,702,918 145,572,117<br />
Private Area Lights 2,774,481 2,857,367 2,820,313 4,182,805 ___________<br />
Fuel 1,082,241 981,659 1,107,310 1,012,511 ___________<br />
SUB-TOTAL 3,856,722 3,839,026 3,927,623 5,195,316<br />
Public Street & Highway Lighting<br />
Unmetered Lighting 3,088,924 2,967,458 2,988,635 2,927,628 ___________<br />
Fuel 433,319 552,571 639,564 650,161 ___________<br />
SUB-TOTAL 3,522,243 3,520,029 3,628,199 3,577,789<br />
Roadway Lighting 1,026,252 1,039,263 1,039,263 788,927 ___________<br />
Fuel 433,318 552,571 639,564 261,440 ___________<br />
SUB-TOTAL 1,459,570 1,591,834 1,678,827 1,050,367<br />
Environmental Costs 4,200,931 ___________<br />
Conservation 483,981 ___________<br />
SUB-TOTAL 4,684,912<br />
Sales for Resale 35,073,652 41,207,600 30,180,266 42,811,780 ___________<br />
Capacity Charges 4,366,204 3,873,100 3,873,100 692,090 ___________<br />
Accrued Electric Revenue 1,617,444 140,000<br />
SUB-TOTAL 41,057,300 45,220,700 34,053,366 43,503,870<br />
TOTAL SALES OF ELECTRICITY 367,973,101 368,422,907 369,575,751 388,982,646<br />
E – 219
ELECTRIC UTILITY<br />
BUDGET FOR YEAR 2007-08<br />
Experience Budget 12 Month Proposed Adjustments<br />
For Year For Year Actual Thru by by<br />
2005-06 2006-07 March 31 <strong>City</strong> Manager <strong>City</strong> Commission<br />
Other Electric Revenues<br />
PSC & Gross Receipts Tax 8,064,508 8,368,644 8,319,751 8,775,534 ___________<br />
Penalty Charges 1,480,494 1,650,000 1,449,743 1,430,000 ___________<br />
SUB-TOTAL 9,545,002 10,018,644 9,769,493 10,205,534<br />
Miscellaneous Service Revenue<br />
Pole Attachments 1,367,313 1,619,223 1,472,291 1,619,613 ___________<br />
Facilities Charges 519,022 595,000 561,331 598,000 ___________<br />
Connection Fees 623,271 600,000 603,790 570,000 ___________<br />
Wheeling Fees 554,208 554,208 556,979 554,208 ___________<br />
Electric portion <strong>of</strong> Bad Check Charges 135,375 135,000 137,035 135,000 ___________<br />
Byproduct Revenue 230,918 464,842 327,721 913,688 ___________<br />
SUB-TOTAL 3,430,107 3,968,273 3,659,147 4,390,509<br />
TOTAL OTHER ELECTRIC<br />
REVENUES 12,975,109 13,986,917 13,428,640 14,596,043<br />
TOTAL ELECTRIC OPERATING<br />
REVENUES 380,948,210 382,409,824 383,004,391 403,578,689<br />
Other Retail Services<br />
Facilities-Tower Rental 84,177 58,076 88,426 88,078 ___________<br />
Surge Suppression 242,653 260,089 270,785 296,184 ___________<br />
Fiber Rental 77,045 47,678 30,828 21,600 ___________<br />
SUB-TOTAL 403,875 365,843 390,039 405,862<br />
TOTAL UTILITY OPERATING<br />
REVENUES 381,352,085 382,775,667 383,394,429 403,984,551<br />
E – 220
ELECTRIC UTILITY<br />
BUDGET FOR YEAR 2007-08<br />
Experience Budget 12 Month Proposed Adjustments<br />
For Year For Year Actual Thru by by<br />
2005-06 2006-07 March 31 <strong>City</strong> Manager <strong>City</strong> Commission<br />
PERSONNEL SERVICES 35,175,614 39,614,509 37,838,937 40,779,114<br />
OPERATING EXPENSES<br />
Rental / Fleet Mgmt Equipment 281,397 818,431 40,186 557,414 ___________<br />
Gasoline / Fleet Mgmt Equipment 264,667 474,570 302,793 391,083 ___________<br />
Maintenance / Fleet Mgmt Equipment 259,590 353,680 452,877 564,519 ___________<br />
Uninsured Loss Reimbursement 500<br />
Insurance - Fire 1,099,503 1,893,302 1,330,275 1,423,421 ___________<br />
Insurance - Position Bond 9,202<br />
Self-Insurance Service 1,036,041 920,927 782,794 920,927 ___________<br />
Water Utility Service 161,114 154,300 141,122 168,851 ___________<br />
Purchasing & Stores Service 1,092,462 1,160,967 1,155,012 1,253,844 ___________<br />
Stormwater Utility Fees 6,003 6,500 5,651 6,615 ___________<br />
General Fund Service 3,966,327 4,226,552 4,199,559 4,390,285 ___________<br />
Electric Utility Service 800,253 781,058 825,846 745,751 ___________<br />
Wastewater Service 48,628 56,500 50,404 55,693 ___________<br />
Other <strong>City</strong> Department Charges 272,982 236,863 246,512 192,650 ___________<br />
Legal Fees - <strong>City</strong> To Electric 2,172 3,950 2,500 ___________<br />
Intra Departmental Charges 205,648 106,250 160,778 136,408 ___________<br />
Intra-Dept Charges - Computer Rental 1,166,424 1,151,446 971,831 1,050,952 ___________<br />
Wastewater Re-use Charges 229,969 232,200 202,548 241,000 ___________<br />
Intra-Dept Charges - Telephone 277,972 294,545 271,969 311,029 ___________<br />
Intra-Dept Charges - Radios 128,590 130,600 128,151 126,131 ___________<br />
Intra-Dept Charges - Facilities 433,860 562,260 543,029 799,275 ___________<br />
Intra-Dept Charges - Janitorial 445,948 422,231 445,958 634,674 ___________<br />
Intra-Dept Charges - IT 3,058,155 2,694,249 2,774,953 3,281,527 ___________<br />
Contractual Services 8,340,479 9,657,610 7,951,272 9,541,807 ___________<br />
Legal Fees 196,416 118,650 57,230 245,600 ___________<br />
Engineering - Basic 14,640 199,374 13,547 123,078 ___________<br />
Banking Service 67,546 72,535 72,168 76,162 ___________<br />
Pr<strong>of</strong>essional Services 71,454 61,150 47,960 54,000 ___________<br />
Insurance Consultant 17,546<br />
Advertising 108,871 229,200 106,711 220,555 ___________<br />
Annual Audit 40,850 1,045 115,000 ___________<br />
Promotions/Public Relations 43,766 65,500 49,973 60,500 ___________<br />
Paying Agent,Trustee Fees 3,000 8,510<br />
Solid Waste Service 103,047 94,400 98,608 94,411 ___________<br />
Contract Labor 492,530 547,355 499,541 427,981 ___________<br />
Temporary Contract Labor 1,730,091 1,348,673 1,955,977 604,768 ___________<br />
Utility Service-Polk County 1,050 1,050 ___________<br />
Office Supplies 163,348 192,637 148,442 174,712 ___________<br />
Equipment - Noncapital 45,133 184,080 55,161 244,155 ___________<br />
All Other Materials & Supplies 106,808 118,050 76,001 111,862 ___________<br />
Uniforms 97,644 130,390 97,835 125,819 ___________<br />
E – 221
ELECTRIC UTILITY<br />
BUDGET FOR YEAR 2007-08<br />
Experience Budget 12 Month Proposed Adjustments<br />
For Year For Year Actual Thru by by<br />
2005-06 2006-07 March 31 <strong>City</strong> Manager <strong>City</strong> Commission<br />
Chemicals 1,154,624 1,073,150 956,368 506,880 ___________<br />
Tools & Implements 143,830 172,015 124,084 169,527 ___________<br />
Auto/Heavy Equipment Fuel 226,613 193,000 236,373 226,613 ___________<br />
Personal Safety Equipment 103,966 120,145 93,580 128,920 ___________<br />
Parts For Equipment 1,818,381 1,496,324 1,841,557 1,512,183 ___________<br />
Materials 3,203,042 2,160,779 2,832,917 2,072,563 ___________<br />
Use Tax Allocation 29,010 38,866 35,149 33,450 ___________<br />
Materials - Default Purchasing Card (6,786)<br />
Lubricants 72,842 59,250 103,194 72,050 ___________<br />
Computer S<strong>of</strong>tware 4,535 1,060 835 41,755 ___________<br />
Truck Wire 60,889 19,600 130,310 34,250 ___________<br />
Petroleum Coke 2,318,741 5,935,690 574,886 6,058,570 ___________<br />
Coal 59,262,182 68,358,780 52,504,367 69,692,010 ___________<br />
Commission/Fees - Fuel Hedges 123,640 125,000 45,918 25,000 ___________<br />
Fuel-Pool Operations 353,455 480,000 436,067 480,000 ___________<br />
#2 Oil 845,015 1,001,230 29,524,943 550,770 ___________<br />
#6 Oil 8,584,007 3,186,900 986,090 ___________<br />
Natural Gas 82,042,317 99,850,340 68,564,228 139,902,533 ___________<br />
Natural Gas Demand Charge 12,357,374 14,596,363 11,011,280 14,596,363 ___________<br />
Sale <strong>of</strong> Fuel -- NG 4,104,371 2,756,258<br />
Fuel Hedging Activity 23,028,863 5,686,610 33,296,741 3,532,180 ___________<br />
Limestone 1,447,709 1,800,000 799,089 1,500,000 ___________<br />
Purchased Power 75,479,428 74,570,900 63,900,517 18,463,584 ___________<br />
Leases 406,105 404,124 400,390 201,543 ___________<br />
Rentals 188,331 311,601 235,459 285,157 ___________<br />
Repair Of Equipment 591,176 547,157 713,114 571,544 ___________<br />
Printing & Photography 26,976 54,500 34,019 43,000 ___________<br />
Postage & Mailing 549,468 612,766 557,435 696,259 ___________<br />
Subscription & Membership 333,728 393,366 396,886 380,131 ___________<br />
Telephone, Communications 235,708 124,494 142,614 144,621 ___________<br />
Travel 28,670 76,635 35,531 94,809 ___________<br />
Training 182,499 319,060 190,702 397,961 ___________<br />
All Other Sundry Charges 38,398 28,890 32,937 35,345 ___________<br />
Ad Valorem Taxes 21,818 25,000 23,697 25,650 ___________<br />
Florida Public Service Commission 50,198 50,684 53,299 53,145 ___________<br />
Gross Receipts Tax Expense 8,285,855 8,317,960 8,556,232 8,722,389 ___________<br />
Miscellaneous Tax Expense 5,815 5,989<br />
S<strong>of</strong>tware License & Maintenance 424,426 520,651 299,249 590,862 ___________<br />
Licenses & Permits 317,155 324,481 315,079 319,245 ___________<br />
Car Washing 1,031<br />
Refund Of Prior Years Revenue 82,789 85,273<br />
Bad Debt Expense 1,907,927 1,903,923 1,462,611 1,523,138 ___________<br />
Gift Certificates 16,812 8,940 ___________<br />
Contribution to Chamber <strong>of</strong> Commerce 94,300 95,000 94,300 95,000 ___________<br />
Analytical Services - Rating Agencies (29,421) 5,510 12,500<br />
E – 222
ELECTRIC UTILITY<br />
BUDGET FOR YEAR 2007-08<br />
Experience Budget 12 Month Proposed Adjustments<br />
For Year For Year Actual Thru by by<br />
2005-06 2006-07 March 31 <strong>City</strong> Manager <strong>City</strong> Commission<br />
Interest Expense 21,519,030 23,609,490 23,591,480 23,226,938 ___________<br />
Capitalized Interest Expense (453,631) (940,000) (940,000) (1,000,000) ___________<br />
Interest Accretion 2,250,972 2,358,786 2,358,786 2,471,766 ___________<br />
Remarketing Fees/Liquidity Fees 5,295<br />
Equipment - Capital 53,359 45,576<br />
Amortization 2,492,478 2,376,383 2,376,383 2,672,567 ___________<br />
Depreciation-Plant 38,712,207 38,088,708 38,066,693 36,645,007 ___________<br />
Transfer To General Fund 18,000,000 16,600,000 16,600,000 24,000,000 ___________<br />
Recoveries-Intra Department Charges (2,286,836) (291,000) (2,754,377) (254,100) ___________<br />
Recoveries-Materials (37,413) (72,291) (4,000) ___________<br />
Recoveries-From Outside <strong>City</strong> (928,809) (317,947) (953,683) (339,198) ___________<br />
Recoveries-Other Funds (1,974,447) (1,551,584) (1,718,239) (1,698,847) ___________<br />
Recoveries-Fuel (310,092) (250,000) (171,636) (250,000) ___________<br />
Recoveries-For Water Allocations (220,787) (278,618) (270,811) (301,792) ___________<br />
Recoveries - Grant (814) 5,032<br />
OUC Coal Expense (23,704,873) (27,343,512) (21,001,747) (27,876,804) ___________<br />
OUC Other Fuel Expense (1,641,768) (2,994,276) (819,373) (2,923,428) ___________<br />
OUC Expense (6,777,342) (7,484,625) (6,681,027) (6,824,182) ___________<br />
OUC Admin & General Expense (953,579) (934,248) (934,735) (957,000) ___________<br />
361,072,181 362,268,144 359,616,648 350,836,966<br />
396,247,796 401,882,653 397,455,585 391,616,080<br />
E – 223
ELECTRIC UTILITY<br />
RENEWAL AND REPLACEMENT PROJECTS BUDGET FOR 2007-<strong>2008</strong><br />
Less OUC Total<br />
Project Or Recoveries Project<br />
Amount Amount Amount<br />
Energy Production<br />
CLP4035 U8 New HRSG Limitorque Drives 56,500 56,500<br />
CMP5285 U5 NH3 Protective Equip. 25,000 25,000<br />
CMP5294 U5 Stairways and Platforms 80,000 80,000<br />
CMP5302 Run<strong>of</strong>f Containment for HRSG 111,508 111,508<br />
CMP5310 JT U3 CSI Conveyor Replacement and 150,000 60,000 90,000<br />
CMP5339 CM Replace Spectrophotometers 15,000 3,849 11,151<br />
CMP5342 U5 CT Insulation Replacement 334,525 334,525<br />
CMP5344 CM Upgrade Gas Regulators for U1, U2, 20,500 5,260 15,240<br />
CMP5346 JT U3 Landell Crane Upgrade 250,000 100,000 150,000<br />
CMP5352 PCM Upgrade Primavera 5,000 700 4,300<br />
CMP5353 JT U3 "B" Phase Current Transformer 55,000 22,000 33,000<br />
CMP5354 JT U3 Stack & Scrubber Elevators 75,000 30,000 45,000<br />
CMP5355 JT U3 Coal Yard Emergency Generator 32,000 12,800 19,200<br />
CMP5356 JT U3 Reverse Osmosis Membranes 20,000 8,000 12,000<br />
CMP5357 JT U3 C1 Conveyor Belt Replacement 71,856 28,742 43,114<br />
CMP5358 JT U3 PSM Safety Equipment Purchase 25,000 10,000 15,000<br />
CMP5359 JT U3 Scrubber Absorber Suction Valves 150,000 60,000 90,000<br />
CMP5360 JT U3 Rotor Probe Equipment Purchase 25,000 10,000 15,000<br />
CMP5361 JT U3 Acoustic Horns for Regenerative 100,000 40,000 60,000<br />
CMP5362 JT U3 Reheat Condenser Recovery Pump 110,000 44,000 66,000<br />
CMP5363 JT U3 Critical Motor Protective Relay 150,000 60,000 90,000<br />
CMP5364 JT U3 Air Horns on Economizer 25,000 10,000 15,000<br />
CMP5365 JT U3 Upper Furnace Monitoring 478,925 191,570 287,355<br />
CMP5366 U5 CT Battery Replacement 90,000 90,000<br />
CMPN217 U5 Switch Yard Fence CT & ST 40,000 40,000<br />
CMP5368 U5 HP Drum Level Control Valve 175,069 175,069<br />
CMP5369 U5 HRSG Manual Header Drains 36,000 36,000<br />
CMP5370 U5 HRSG Pipe Penetrations Upgrade 111,508 111,508<br />
CMP5371 U5 Attemperation Control Valves Upgrade 289,921 289,921<br />
CMP5372 U5 Cooling Tower Structure 156,112 156,112<br />
CMP5373 U5 NH3 Storage Tank Platforms & 45,000 45,000<br />
CMP5374 U2 Boiler Safety Valves Repl. 192,554 192,554<br />
CMP5375 U2 Bridge Crane Upgrade 278,768 278,768<br />
CMP5376 U2 Plant Battery Chargers Upgrade 190,680 190,680<br />
CMP5377 CM Control Room Ro<strong>of</strong> Upgrade 65,000 16,679 48,321<br />
CMP5378 MGT1 Battery and Chargers Replacement 39,000 39,000<br />
CWP5379 Winston Ammonia Control 60,000 60,000<br />
CMP5380 JT U3 Cooling Tower Rebuild 399,105 159,642 239,463<br />
CMP5381 U5 Transition Steam Filters 90,000 90,000<br />
CMP5382 U2 Governor Valves - Major Repairs 212,855 212,855<br />
CMP5383 Replace Diesel 1 Controls and Voltage 133,034 133,034<br />
CMP5384 Replace Diesel 2 Controls and Voltage 133,034 133,034<br />
CMP5526 JT U3 Landfill Stack-Out Resurfing 48,000 19,200 28,800<br />
E – 224
ELECTRIC UTILITY<br />
RENEWAL AND REPLACEMENT PROJECTS BUDGET FOR 2007-<strong>2008</strong><br />
Less OUC Total<br />
Project Or Recoveries Project<br />
Amount Amount Amount<br />
CMP5528 U5 NH3 Valving Replacement 111,509 111,509<br />
CPP6501 PCM Maintenance Tools 01-88 82,628 11,568 71,060<br />
CPP6503 PCM Plant Safety Equipment 31-88 10,000 1,400 8,600<br />
CPP6504 PCM Environmental Tools-Cptl 42-88 2,000 280 1,720<br />
CPP6506 PCM Lab Test Equipment 25,600 3,584 22,016<br />
CPP6509 PCM Plant A/C and Air Handler 53,550 7,497 46,053<br />
CPP6525 PCM Warehouse Restrooms Addition 20,000 5,132 14,868<br />
CPP6526 PCM JLG Man-Lift Purchase 100,000 14,000 86,000<br />
CPP6529 PCM Five Year Coatings Plan 601,319 84,185 517,134<br />
CPP6534 PCM Mowing Machine Replacement 20,000 2,800 17,200<br />
CPP6535 PCM All Terrain Vehicle Purchase 25,000 3,500 21,500<br />
CPP6536 PCM Dump Trailer Purchase 6,500 910 5,590<br />
Energy Production Sub-Total 6,209,560 1,027,298 5,182,262<br />
Energy Delivery<br />
CEE4001 Major Road Improv/Reloc (007) 482,553 482,553<br />
CEE4003 Engineering Project Support (007) 192,751 192,751<br />
CEM4005 Major Line & Shop Equipment (007) 21,500 21,500<br />
CSC4006 Purchs New Electric Meters 474,988 474,988<br />
CPM6001 Lt Proj Resources (007) 35,047 35,047<br />
CEC8810 Transmission Pole Repl (007) 79,305 79,305<br />
CEM6085 Various Breaker Replacements 217,310 217,310<br />
CEM6086 Various Regulator Controls Replacements 40,746 40,746<br />
CEM6117 69KV Switch Upgrades 54,331 54,331<br />
CEC4005 Major Line & Safety Equip (596) 97,000 97,000<br />
CEC4006 Dist System Eq Replace 35,245 35,245<br />
CEC4007 Line Switch Installation 128,022 128,022<br />
CEC4008 Padmount Switch Install (007) 164,601 164,601<br />
CEC4011 Distribution Pole Repl 211,271 211,271<br />
CEE4018 Resurface T&D Parking Lot 50,000 50,000<br />
CEE4020 Roadway Lighting Installations 812,062 200,000 612,062<br />
CEE4025 Public Works Lighting Project 263,191 263,191<br />
CEE4033 Parks & Rec Lighting Project 128,708 128,708<br />
CEE4038 ED-Maximo Strategic Asset Management 529,544 529,544<br />
CEE4040 Private Area Lighting Installation 766,990 50,000 716,990<br />
CEC4045 Wood Poles Inspection/Retreatment 432,000 46,700 385,300<br />
E – 225
ELECTRIC UTILITY<br />
RENEWAL AND REPLACEMENT PROJECTS BUDGET FOR 2007-<strong>2008</strong><br />
Less OUC Total<br />
Project Or Recoveries Project<br />
Amount Amount Amount<br />
CEC4500 Subdiv & Comm Development (007) 1,729,735 33,048 1,696,687<br />
CEC4502 New OH Residential Svc 140,593 10,000 130,593<br />
CEC4503 New UG Residential Svc 353,329 10,000 343,329<br />
CEC4504 Upgr OH Residential Svc (007) 28,169 5,000 23,169<br />
CEC4505 Upgr UG Residential Svc 21,850 5,000 16,850<br />
CEC4506 OH Line Extensions (007) 168,505 168,505<br />
CEC4507 UG Line Extensions (007) 47,126 5,000 42,126<br />
CEC4508 OH New Comm Svc GS 35,596 4,000 31,596<br />
CEC4509 UG New Comm Svc GS 66,871 10,000 56,871<br />
CEC4510 OH Upgr Comm Svc 31,487 2,000 29,487<br />
CEC4511 UG Upgr Comm Svc 137,165 15,000 122,165<br />
CEC4512 OH New Comm Svc GSD 73,615 2,000 71,615<br />
CEC4513 UG New Comm Svc GSD 535,259 15,000 520,259<br />
CEC4515 UG New Comm Svc GSLD 234,586 5,000 229,586<br />
CEE6243 Upgrade <strong>of</strong> Open Secondarys 109,732 109,732<br />
CSR6251 Reliability-Recloser Installation 341,674 341,674<br />
CEE6260 Fault Indicator Installation 136,668 136,668<br />
CEE6268 General Reliability Improvements 146,312 146,312<br />
CEM6269 Replacement <strong>of</strong> Distribution Feeder Relays 108,659 108,659<br />
CEE6272 Line Regulator Installations 109,331 109,331<br />
CEE6274 UG Cable Upgrade for Substation Exits 113,889 113,889<br />
ED6282 Dist Substation Equip Replacement 95,583 95,583<br />
SCADA/EMS Upgrade 490,623 490,623<br />
CEM6289 Delta Star Transformer Repair 20,000 20,000<br />
CEE6309 GSLD Facilities Charge Equipment Fund 227,780 227,780<br />
CEE6311 Replacement for VJP Design Pkg 203,329 203,329<br />
CEM6320 Fork Lift Truck, GC-LJ Cushion I.C.E. 8000lb 30,000 30,000<br />
CEM6324 Battery Multimeter CRT-300 8,000 8,000<br />
CEM6325 Megger MM25 5KV Insulation Tester 6,000 6,000<br />
CBO6339 OMS Phase II 88,256 88,256<br />
CEE6340 Minor Line Extensions and Switch 22,812 22,812<br />
CEE6341 West W354 Line Upgrade 273,760 273,760<br />
CSC6342 CVDS ComLog Recorder Upgrade 22,000 22,000<br />
CEM6344 Omicrom S<strong>of</strong>tware & CPS Hardware 34,074 34,074<br />
CEM6346 Various 12KV Breaker Replacement FY08 81,492 81,492<br />
CEM6347 SFRA Transformer Test Equipment 18,000 18,000<br />
CEM6348 Substation Oil Containment Systems 20,000 20,000<br />
Energy Delivery Sub-Total 11,529,025 417,748 11,111,277<br />
E – 226
ELECTRIC UTILITY<br />
RENEWAL AND REPLACEMENT PROJECTS BUDGET FOR 2007-<strong>2008</strong><br />
Less OUC Total<br />
Project Or Recoveries Project<br />
Amount Amount Amount<br />
Technical Support<br />
CMP5352 PCM Upgrade Primavera 17,000 2,380 14,620<br />
CTR1788 Business Continuity Plan 230,633 230,633<br />
Energy Conservation Capital 108,500 108,500<br />
IT contingency 108,755 108,755<br />
Liberty Net Env. Affairs 10,000 10,000<br />
CIS4003 Pc Systems Upgrade/Repl 40,000 40,000<br />
CTC5111 Fiber Services Connections 156,000 62,500 93,500<br />
Technical Support Sub-Total 670,888 64,880 606,008<br />
Customer Service<br />
Routing S<strong>of</strong>tware 141,113 141,113<br />
CCS4114 UMS Upgrade to V 7.5 218,025 218,025<br />
CCS4002 Wireless Laptops in FS Vehicles 374,868 374,868<br />
Customer Service Sub-Total 734,006 734,006<br />
General Services<br />
CDO7001 PCM Equip for Training Instructor-Capital 3,000 420 2,580<br />
CSS7040 PCM Copy Machines 12,000 1,680 10,320<br />
CED6326 Safety Capital Equipment 3,000 3,000<br />
CSF4651 Security Systems for E&W Building (007) 20,000 20,000<br />
CSS4701 Copy Machines 82,000 82,000<br />
Plant Substation - 230KV Ro<strong>of</strong> and 69KV Ro<strong>of</strong> 38,000 38,000<br />
CTR5707 HVAC System Upgrades 10,000 10,000<br />
General Services Sub-Total 168,000 2,100 165,900<br />
General Manager<br />
CCO4110 Load Research & Analysis Equip 107,092 107,092<br />
CRR4303 UtiliPrice Application Enhancement 10,500 10,500<br />
General Manager Sub-Total 117,592 117,592<br />
E&W Finance<br />
CPP7051 Depreciation & Forecasting Tool 140,000 140,000<br />
E&W Finance Sub-Total 140,000 140,000<br />
Grand Total 19,569,071 1,512,026 18,057,045<br />
E – 227
ELECTRIC UTILITY<br />
Actual<br />
FY 2007 FY <strong>2008</strong> Pay Salary<br />
PERSONNEL SCHEDULE Budget Budget Grade Range<br />
SUMMARY BY DIVISION<br />
General Manager 14 13<br />
Energy Production 258 240<br />
Energy Delivery 214 217<br />
Customer Service 127 112<br />
General Services 23 21<br />
Technical Support 27 24<br />
TOTAL FULL-TIME EMPLOYEES 663 627<br />
SUMMARY PART-TIME / SEASONAL<br />
Engineering Technician IV 1<br />
Planning Specialist I 1<br />
Meter Technician III<br />
Energy Production Trainee I 13 3<br />
Energy Production Trainee II 2 3<br />
Customer Service Representative I 2 2<br />
College Interns 5 5<br />
Co-op Students 4 4<br />
DCT/BCE Students 7 7<br />
High School Summer Interns 1 1<br />
TOTAL PART-TIME EMPLOYEES 36 25<br />
CONTRACT LABOR 17 9<br />
GENERAL MANAGER<br />
General Manager 1 1 *<br />
Deputy General Manager 1 1 *<br />
Assistant to the General Manager 67 64,730 - 98,010<br />
Business Operations Manager II-Finance 1 67 64,730 - 98,010<br />
Business Operations Manager II-Corporate 1 67 64,730 - 98,010<br />
Budget & Forecasting Manager 1 67 64,730 - 98,010<br />
Assistant to the General Manager 1 1 60 54,579 - 82,618<br />
Executive Assistant 1 1 48 40,726 - 61,630<br />
Process Analyst 1 40 33,509 - 50,710<br />
Utility Education Representative 1 38 31,907 - 48,298<br />
Administrative Assistant 3 3 33 28,246 - 42,765<br />
General Manager/Pricing & Rates<br />
Manager <strong>of</strong> Pricing and Rates 1 1 71 71,365 - 108,077<br />
Engineer III 1 1 69 67,974 - 102,918<br />
Electric Utility Analyst 1 1 54 47,133 - 71,365<br />
Data Analyst II 1 1 42 35,173 - 53,248<br />
General Manager Subtotal 14 13<br />
E – 228
ELECTRIC UTILITY<br />
Actual<br />
FY 2007 FY <strong>2008</strong> Pay Salary<br />
PERSONNEL SCHEDULE Budget Budget Grade Range<br />
Part Time/Seasonal:<br />
College Interns 5 5<br />
Co-op Students 4 4<br />
DCT/BCE Students 7 7<br />
High School Summer Interns 1 1<br />
ENERGY PRODUCTION DIVISION<br />
Assistant General Manager Production 1 1 *<br />
Energy Production/Production<br />
Plant Operations Manager *<br />
Plant Manager 76 80,642 - 122,034<br />
Plant Manager-Combined Cycle Operations 1 1 76<br />
Plant Manager-Units 1, 2, 3 & Peakers 1 1 76<br />
Supervisor <strong>of</strong> Chemical Process 1 73 74,922 - 113,464<br />
Superintendent <strong>of</strong> Operations 1 71 71,365 - 108,077<br />
Maintenance Manager 1 1 71 71,365 - 108,077<br />
Power Production Supervisor 11 11 65 61,630 - 93,330<br />
Training Supervisor/PPO Foreman 58 51,979 - 78,666<br />
Power Production Foreman 20 19 58 51,979 - 78,666<br />
Multi-Craft Operator 22 23 56 49,504 - 74,922<br />
Laboratory Chemist 1 56 49,504 - 74,922<br />
Superintendent <strong>of</strong> Stores & Security 1 54 47,133 - 71,365<br />
Station Electrician 14 13 54 47,133 - 71,365<br />
PSM Project Administrator 1 1 54 47,133 - 71,365<br />
Protective Equipment Specialist II 4 3 54 47,133 - 71,365<br />
Instrument & Control Specialist 1 1 54 47,133 - 71,365<br />
Control Center Operator 10 9 54 47,133 - 71,365<br />
Plant Welder II 10 10 53 45,989 - 69,659<br />
Plant Mechanic II 20 17 53 45,989 - 69,659<br />
Instrument & Control Technician II 15 13 51 43,805 - 64,730<br />
Superintendent <strong>of</strong> Stores 1 49 41,725 - 63,190<br />
Plant Mechanic I 1 49 41,725 - 63,190<br />
Power Plant Technician 4 4 47 39,749 - 60,174<br />
Power Plant Operator III 41 36 47 39,749 - 60,174<br />
Power Plant Operator II 11 11 42 35,173 - 53,248<br />
Operations Support Supervisor III 1 1 42 35,173 - 53,248<br />
Inventory Control Specialist 1 1 42 35,173 - 53,248<br />
Industrial Coatings Foreman 1 1 38 31,907 - 48,298<br />
Warehouse Operations Technician II 3 3 33 28,246 - 42,765<br />
Operations Support Technician III 1 1 33 28,246 - 42,765<br />
Industrial Coatings Specialist 3 33 28,246 - 42,765<br />
Administrative Assistant 1 1 33 28,246 - 42,765<br />
Warehouse Operations Technician I 4 4 31 26,894 - 40,726<br />
Plant Helper 1 29 25,605 - 38,771<br />
Account Clerk III 1 29 25,605 - 38,771<br />
Account Clerk II 1 26 23,816 - 36,026<br />
Operations Support Technician I 1 1 24 22,693 - 34,320<br />
Office Associate I 1 1 24 22,693 - 34,320<br />
E – 229
ELECTRIC UTILITY<br />
Actual<br />
FY 2007 FY <strong>2008</strong> Pay Salary<br />
PERSONNEL SCHEDULE Budget Budget Grade Range<br />
Energy Production/Business Operations<br />
Business Operations Manager III 1 1 71 71,365 - 108,077<br />
Energy Resource Specialist 1 63 58,718 - 88,899<br />
Business Analyst II 1 1 58 51,979 - 78,666<br />
Computer Applications Specialist 1 1 54 47,133 - 71,365<br />
Electric Utility Analyst 1 1 54 47,133 - 71,365<br />
Account Clerk IV 2 3 33 28,246 - 42,765<br />
Account Clerk III 1 29 25,605 - 38,771<br />
Office Associate I 2 2 24 22,693 - 34,320<br />
Energy Production/Engineering<br />
Energy Production Engineering Manager 1 1 78 84,656 - 128,149<br />
Engineering Supervisor 1 1 74 76,794 - 116,230<br />
Pr<strong>of</strong>essional Engineer 3 3 71 71,365 - 108,077<br />
Engineer IV 71 71,365 - 108,077<br />
Engineer III 4 3 69 67,974 - 102,918<br />
Supervisor <strong>of</strong> WFM/Projects 65 61,630 - 93,330<br />
Power Production Projects Coordinator 1 1 65 61,630 - 93,330<br />
Power Plant Construction Supervisor 1 1 65 61,630 - 93,330<br />
Engineering Construction Supervisor 65 61,630 - 93,330<br />
Power Production Foreman 3 2 58 51,979 - 78,666<br />
Engineering Technician IV 4 4 58 51,979 - 78,666<br />
Regulatory Programs Coordinator 1 1 54 47,133 - 71,365<br />
Instrument & Control Specialist 2 2 54 47,133 - 71,365<br />
Engineering Technician III 1 1 54 47,133 - 71,365<br />
Plant Mechanic II 1 1 53 45,989 - 69,659<br />
Maintenance Coordinator 8 8 51 43,805 - 64,730<br />
Materials Planner 1 1 47 39,749 - 60,174<br />
Engineering Technician II 1 47 39,749 - 60,174<br />
Office Associate I 2 1 24 22,693 - 34,320<br />
Energy Production/Special Projects<br />
Manager <strong>of</strong> Special Projects 1 1 78 84,656 - 128,149<br />
Pr<strong>of</strong>essional Engineer 1 1 71 71,365 - 108,077<br />
Engineer IV 71 71,365 - 108,077<br />
Engineer III 2 2 69 67,974 - 102,918<br />
Office Associate II 1 1 29 25,605 - 38,771<br />
Energy Production Subtotal 258 240<br />
E – 230
ELECTRIC UTILITY<br />
Actual<br />
FY 2007 FY <strong>2008</strong> Pay Salary<br />
PERSONNEL SCHEDULE Budget Budget Grade Range<br />
Part Time:<br />
Energy Production/Production<br />
Energy Production Trainee II 2 3 26 23,816 - 36,026<br />
Energy Production Trainee I 13 3 22 21,590 - 32,677<br />
Contract Labor:<br />
Energy Production/Production<br />
Instrument And Control Tech II 1 51 43,805 - 64,730<br />
Power Plant Operator I 3 38 31,907 - 48,298<br />
Equipment Operator III 1 38 31,907 - 48,298<br />
Wastewater Operator II 1 1 36 30,389 - 45,989<br />
Laboratory Technician I 1 31 26,894 - 40,726<br />
Operations Support Tech II 1 1 29 25,605 - 38,771<br />
Operations Support Tech I 4 1 24 22,693 - 34,320<br />
Operations Support Worker II 1 1 18 19,594 - 29,661<br />
Operations Support Worker I 9 14 17,763 - 26,894<br />
ENERGY DELIVERY DIVISION<br />
Assistant General Manager-Delivery 1 1 *<br />
Energy Delivery/Operations<br />
Delivery Operations Manager 1 1 71 71,365 - 108,077<br />
System Operations Engineer 1 1 67 64,730 - 98,010<br />
T&D Supervisor 6 6 65 61,630 - 93,330<br />
T&D Scheduler 1 2 58 51,979 - 78,666<br />
Lead T&D Lineperson 11 11 58 51,979 - 78,666<br />
Electrician Foreman 1 1 58 51,979 - 78,666<br />
Planning Specialist I 1 1 54 47,133 - 71,365<br />
Lineman 1/C 35 61 54 47,133 - 71,365<br />
Electrician 1/C 2 2 54 47,133 - 71,365<br />
Line Clearance Coordinator 2 2 51 43,805 - 64,730<br />
Utility Line Inspector 2 2 42 35,173 - 53,248<br />
Special Equipment Operator 2 2 40 33,509 - 50,710<br />
Lineman Apprentice 26 40 33,509 - 50,710<br />
Materials Reclaimer II 1 1 36 30,389 - 45,989<br />
Traffic Control Foreman 1 1 31 26,894 - 40,726<br />
Materials Reclaimer I 1 1 29 25,605 - 38,771<br />
Traffic Control Technician 1 1 22 21,590 - 32,677<br />
Energy Delivery/System Control & Reliability<br />
System Control Supervisor 1 1 69 67,974 - 102,918<br />
Energy Management System (EMS) Supervisor 1 1 71 71,365 - 108,077<br />
Supervisor <strong>of</strong> Troublemen 1 1 63 58,718 - 88,899<br />
Lead Electric System Operator 2 2 63 58,718 - 88,899<br />
EMS Analyst 1 1 60 54,579 - 82,618<br />
Electric System Operator 10 12 60 54,579 - 82,618<br />
Chief Electronics Relay Technician 1 60 54,579 - 82,618<br />
Troubleman 7 7 56 49,504 - 74,922<br />
SCADA/EMS Technician 2 1 54 47,133 - 71,365<br />
Planning Specialist I 1 1 54 47,133 - 71,365<br />
E – 231
ELECTRIC UTILITY<br />
Actual<br />
FY 2007 FY <strong>2008</strong> Pay Salary<br />
PERSONNEL SCHEDULE Budget Budget Grade Range<br />
Energy Delivery/Engineering<br />
Energy Delivery Engineering Manager 1 1 78 84,656 - 128,149<br />
Engineering Supervisor 1 1 74 76,794 - 116,230<br />
Pr<strong>of</strong>essional Engineer 4 3 71 71,365 - 108,077<br />
New Development Engineering Supervisor 71 71,365 - 108,077<br />
Engineer III 4 5 69 67,974 - 102,918<br />
Engineer II 1 1 65 61,630 - 93,330<br />
Engineering Technician Supervisor 2 1 60 54,579 - 82,618<br />
Engineering Technician IV 9 11 58 51,979 - 78,666<br />
Engineer I 1 1 58 51,979 - 78,666<br />
Engineering Technician III 9 8 54 47,133 - 71,365<br />
Engineering Technician II 1 1 47 39,749 - 60,174<br />
Office Associate II 1 1 29 25,605 - 38,771<br />
Energy Delivery/Substation Operations<br />
Manager <strong>of</strong> Substation Operations 1 1 78 84,656 - 128,149<br />
Engineering Supervisor 1 1 74 76,794 - 116,230<br />
Pr<strong>of</strong>essional Engineer 2 2 71 71,365 - 108,077<br />
Manager <strong>of</strong> Advanced Metering 71 71,365 - 108,077<br />
Engineer III 2 2 69 67,974 - 102,918<br />
T&D Supervisor 1 1 65 61,630 - 93,330<br />
Engineer II 1 65 61,630 - 93,330<br />
Utilities Resource Coordinator 1 1 60 54,579 - 82,618<br />
Chief Meter Technician 1 1 60 54,579 - 82,618<br />
Chief Electronics Relay Technician 2 1 60 54,579 - 82,618<br />
Engineering Technician IV 1 1 58 51,979 - 78,666<br />
Electrician Foreman 2 2 58 51,979 - 78,666<br />
Apparatus Repairer Foreman 1 1 56 49,504 - 74,922<br />
Protective Relay Technician 4 2 54 47,133 - 71,365<br />
Meter Technician III 3 3 54 47,133 - 71,365<br />
Electrician 1/C 8 7 54 47,133 - 71,365<br />
Meter Technician II 2 3 47 39,749 - 60,174<br />
Apparatus Repairer 1/C 4 4 47 39,749 - 60,174<br />
Electronic Relay Technician (Apprentice) 2 45 37,835 - 57,304<br />
Electrician Apprentice 4 4 45 37,835 - 57,304<br />
Meter Technician I 1 42 35,173 - 53,248<br />
Industrial Coatings Specialist 2 2 33 28,246 - 42,765<br />
Account Clerk III 1 1 29 25,605 - 38,771<br />
Operations Support Technician I 2 2 24 22,693 - 34,320<br />
E – 232
ELECTRIC UTILITY<br />
Actual<br />
FY 2007 FY <strong>2008</strong> Pay Salary<br />
PERSONNEL SCHEDULE Budget Budget Grade Range<br />
Energy Delivery/Business Operations<br />
Business Operations Manager II 1 1 67 64,730 - 98,010<br />
Computer Applications Specialist 2 2 54 47,133 - 71,365<br />
Business Analyst I 1 1 54 47,133 - 71,365<br />
Materials Planner 1 1 47 39,749 - 60,174<br />
Data Analyst II 1 42 35,173 - 53,248<br />
IT Support Specialist I 1 40 33,509 - 50,710<br />
Account Clerk IV 1 33 28,246 - 42,765<br />
Office Associate II 2 2 29 25,605 - 38,771<br />
Account Clerk III 2 2 29 25,605 - 38,771<br />
Energy Delivery/Right <strong>of</strong> Way<br />
Utilities Right <strong>of</strong> Way Officer 1 1 58 51,979 - 78,666<br />
Right <strong>of</strong> Way Liaison Specialist 1 1 51 43,805 - 64,730<br />
Energy Delivery Subtotal 214 217<br />
Part-Time<br />
Engineering Technician IV 1 58 51,979 - 78,666<br />
Planning Specialist I 1 54 47,133 - 71,365<br />
Meter Technician III 54 47,133 - 71,365<br />
CUSTOMER SERVICE DIVISION<br />
Assistant GM Customer Service 1 1 *<br />
UMS Coordinator 1 65 61,630 - 93,330<br />
Quality Assurance Manager 1 1 56 49,504 - 74,922<br />
Computer Applications Specialist 4 2 54 47,133 - 71,365<br />
Customer Service/Energy & Business Services<br />
Manager <strong>of</strong> Energy & Business Services 71 71,365 - 108,077<br />
Product Manager 1 1 63 58,718 - 88,899<br />
Senior Account Executive 1 1 54 47,133 - 71,365<br />
Account Executive 2 2 49 41,725 - 63,190<br />
Energy Analyst II 3 45 37,835 - 57,304<br />
Office Associate II 1 1 29 25,605 - 38,771<br />
Customer Service Representative II 1 29 25,605 - 38,771<br />
Customer Service/Call Center<br />
Call Center Manager 1 1 58 51,979 - 78,666<br />
Customer Service Trainer 1 1 54 47,133 - 71,365<br />
Customer Service Team Leader 5 4 38 31,907 - 48,298<br />
Commercial Account Specialist 4 29 25,605 - 38,771<br />
Customer Service Representative II 18 17 29 25,605 - 38,771<br />
Customer Service Representative I 22 18 24 22,693 - 34,320<br />
Office Associate I 1 24 22,693 - 34,320<br />
E – 233
ELECTRIC UTILITY<br />
Actual<br />
FY 2007 FY <strong>2008</strong> Pay Salary<br />
PERSONNEL SCHEDULE Budget Budget Grade Range<br />
Customer Service/Field Services<br />
Manager <strong>of</strong> Field Services 1 1 58 51,979 - 78,666<br />
Field Services Supervisor 1 1 47 39,749 - 60,174<br />
Energy Analyst II 3 45 37,835 - 57,304<br />
Energy Diversion Investigator 2 2 40 33,509 - 50,710<br />
Field Services Coordinator 1 1 40 33,509 - 50,710<br />
Meter Service Worker 12 12 38 31,907 - 48,298<br />
Meter Reading Coordinator 2 2 38 31,907 - 48,298<br />
Meter Reader 20 20 29 25,605 - 38,771<br />
Customer Service Representative II 2 2 29 25,605 - 38,771<br />
Customer Service Representative I 1 24 22,693 - 34,320<br />
Office Associate I 1 24 22,693 - 34,320<br />
Customer Service/Billing and Collections<br />
Revenue Manager 1 1 60 54,579 - 82,618<br />
Customer Service Team Leader 1 2 38 31,907 - 48,298<br />
Account Clerk IV 1 1 33 28,246 - 42,765<br />
Account Clerk III 1 29 25,605 - 38,771<br />
Customer Service Representative II 7 6 29 25,605 - 38,771<br />
Customer Service Representative I 7 6 24 22,693 - 34,320<br />
Customer Service Subtotal 127 112<br />
Part Time/Seasonal:<br />
Customer Service Representative I 1 1<br />
GENERAL SERVICES DIVISION<br />
Associate General Manager - General Services 1 1 *<br />
Employee Program Specialist 1 1 36 30,389 - 45,989<br />
General Services/Contract Services<br />
Contracts Manager 1 1 67 64,730 - 98,010<br />
Supervisor <strong>of</strong> Administrative Services 1 1 47 39,749 - 60,174<br />
Contract Analyst 1 1 33 28,246 - 42,765<br />
Account Clerk III 2 3 29 25,605 - 38,771<br />
Mail Clerk II 1 1 29 25,605 - 38,771<br />
Account Clerk II 1 26 23,816 - 36,026<br />
Mail Clerk I 1 1 24 22,693 - 34,320<br />
Office Associate I 1 1 24 22,693 - 34,320<br />
Account Clerk I 2 2 24 22,693 - 34,320<br />
General Services/Utility Employee Programs<br />
HR Generalist 1 47 39,749 - 60,174<br />
Office Associate II 1 29 25,605 - 38,771<br />
E – 234
ELECTRIC UTILITY<br />
Actual<br />
FY 2007 FY <strong>2008</strong> Pay Salary<br />
PERSONNEL SCHEDULE Budget Budget Grade Range<br />
General Services/Safety & Training<br />
Manager <strong>of</strong> Safety & Training 1 71 71,365 - 108,077<br />
Senior Lineman Trainer 1 1 58 51,979 - 78,666<br />
Operator Safety and Training Specialist 1 1 58 51,979 - 78,666<br />
Lineman Trainer 1 1 56 49,504 - 74,922<br />
Training Specialist 2 2 54 47,133 - 71,365<br />
Training/School-to-Work Coordinator 1 49 41,725 - 63,190<br />
Office Associate II 1 1 29 25,605 - 38,771<br />
General Services/Legislative & Regulatory<br />
Manager <strong>of</strong> Legislative & Regulatory Relations 1 1 63 58,718 - 88,899<br />
General Services Subtotal 23 21<br />
TECHNICAL SUPPORT DIVISION<br />
Associate General Manager - Technical Support 1 1 *<br />
Power Pool Coordinator 1 67 64,730 - 98,010<br />
Administrative Assistant 1 1 33 28,246 - 42,765<br />
Technical Support/System Planning<br />
Manager <strong>of</strong> System Planning 1 1 78 84,656 - 128,149<br />
Manager <strong>of</strong> Electric System Compliance 71 71,365 - 108,077<br />
Engineer III 3 3 69 67,974 - 102,918<br />
Engineer II 1 65 61,630 - 93,330<br />
Energy Resource Specialist 1 1 63 58,718 - 88,899<br />
Utility Risk Manager 1 63 58,718 - 88,899<br />
Planning Specialist III 2 2 63 58,718 - 88,899<br />
Engineer I 2 2 58 51,979 - 78,666<br />
Alternative Energy Coordinator 1 51 43,805 - 64,730<br />
Data Analyst II 1 1 42 35,173 - 53,248<br />
Technical Support/IT Resources<br />
Manager <strong>of</strong> LE IT Resources 1 65 61,630 - 93,330<br />
Technical Support/Fuel Purchasing<br />
Wholesale Energy&Fuels Mgr 1 1 76 80,642 - 122,034<br />
Manager <strong>of</strong> Fuels 76 80,642 - 122,034<br />
Energy Resource Specialist 2 1 63 58,718 - 88,899<br />
Fuels Coordinator 2 2 60 54,579 - 82,618<br />
Power Production Foreman 1 1 58 51,979 - 78,666<br />
Statistician 2 1 33 28,246 - 42,765<br />
E – 235
ELECTRIC UTILITY<br />
Actual<br />
FY 2007 FY <strong>2008</strong> Pay Salary<br />
PERSONNEL SCHEDULE Budget Budget Grade Range<br />
Technical Support/Wholesale Energy<br />
Manager <strong>of</strong> Wholesale Energy 69 67,974 - 102,918<br />
Technical Support/Environment Permitting<br />
Manager <strong>of</strong> Environmental Affairs 1 71 71,365 - 108,077<br />
Engineer III 1 1 69 67,974 - 102,918<br />
Environmental Coordinator 1 1 71 71,365 - 108,077<br />
Alternative Energy Coordinator 1 51 43,805 - 64,730<br />
Office Associate II 1 1 29 25,605 - 38,771<br />
Technical Support Subtotal 27 24<br />
E – 236
Table <strong>of</strong> Contents<br />
Capital Improvement Plan ............................................................................................Section—F<br />
Introduction....................................................................................................................F-2<br />
Transportation ............................................................................................................... F-4<br />
Public Improvement .................................................................................................... F-10<br />
Downtown Community Redevelopment Area .......................................................... F-20<br />
Mid-Town Community Redevelopment Area............................................................ F-21<br />
Dixieland Community Redevelopment Area............................................................. F-23<br />
Parking ......................................................................................................................... F-24<br />
<strong>Lakeland</strong> Center........................................................................................................... F-25<br />
<strong>Lakeland</strong> Linder Regional Airport.............................................................................. F-26<br />
Solid Waste .................................................................................................................. F-29<br />
Stormwater................................................................................................................... F-30<br />
Oakhill Cemetery Fund ............................................................................................... F-33<br />
Wastewater Utility........................................................................................................ F-34<br />
Water Utility.................................................................................................................. F-41<br />
Electric Utility............................................................................................................... F-48<br />
F-1 Fiscal Year <strong>2008</strong> Annual Budget
Introduction<br />
The <strong>City</strong>’s 10-year CIP includes various fund types and balances. They are listed below with their Fiscal<br />
Year <strong>2008</strong> - 2017 budget request totals.<br />
The CIP was developed from departmental requests. These requests are based upon known<br />
operational and project needs. They are also based upon the <strong>City</strong>’s Comprehensive Master Plan as well<br />
as master plans developed for certain core services provided by the <strong>City</strong>.<br />
Transportation Fund $ 88,579,459<br />
Public Improvement Fund 140,983,211<br />
<strong>Lakeland</strong> CRA Fund 20,213,141<br />
Mid-Town CRA Fund 30,559,119<br />
Dixieland CRA Fund 3,199,084<br />
Parking Fund 1,158,317<br />
<strong>Lakeland</strong> Center Fund 3,847,800<br />
Airport Fund 7,281,516<br />
Solid Waste Fund 719,264<br />
Stormwater Fund 39,465,108<br />
Cemetery Fund 400,000<br />
Wastewater Fund 112,309,680<br />
Water Fund 49,099,311<br />
<strong>Lakeland</strong> Electric Fund 778,315,257<br />
The CIP requests for Fiscal Year <strong>2008</strong> totals $127,608,583. This amount is comprised <strong>of</strong> the following<br />
amounts by Fund:<br />
Transportation Fund $ 10,421,261<br />
Public Improvement Fund 16,296,543<br />
<strong>Lakeland</strong> CRA Fund 1,749,478<br />
Mid-Town CRA Fund 3,226,944<br />
Dixieland CRA Fund 434,900<br />
Parking Fund 555,333<br />
<strong>Lakeland</strong> Center Fund 700,000<br />
Airport Fund 767,921<br />
Solid Waste Fund 540,878<br />
Stormwater Fund 5,920,299<br />
Cemetery Fund 138,200<br />
Wastewater Fund 19,448,283<br />
Water Fund 6,271,591<br />
<strong>Lakeland</strong> Electric Fund 61,136,952<br />
F-2 Fiscal Year <strong>2008</strong> Annual Budget
Introduction<br />
An informal CIP review committee was formed to review requests for changes or additions. This committee<br />
consists <strong>of</strong> representatives from the <strong>City</strong> Manager’s <strong>of</strong>fice, the Finance Department and the requesting<br />
department.<br />
The request process begins each year when all departments are asked to complete an automated needs<br />
assessment worksheet. This worksheet compiles information about the requesting party, justification for the<br />
project or equipment, the amount(s) required, dates(s) required, implications <strong>of</strong> not proceeding with the<br />
request and any sources <strong>of</strong> revenue associated with funding the request.<br />
The CIP is developed using the following guidelines:<br />
• A capital improvement project is defined as a major construction expansion, purchase or major<br />
repair/replacement <strong>of</strong> buildings, infrastructure or other property which has an estimated total<br />
expenditure <strong>of</strong> $25,000 or more.<br />
• Except for emergency repairs, capital improvements are programmed and scheduled based<br />
upon the <strong>City</strong>’s projected financial ability to purchase and maintain the capital project or<br />
equipment.<br />
Funding for capital expenditure items will come from the following sources:<br />
• Current year revenues from the Public Improvement Fund, Transportation Fund,<br />
Stormwater Fund, Mid-Town CRA Fund, Dixieland CRA Fund, <strong>Lakeland</strong> CRA Fund<br />
Parking Fund, Cemetery Fund, Solid Waste Fund, Electric Fund, Water Fund, Wastewater<br />
Fund, <strong>Lakeland</strong> Center Fund, Airport Fund, Golf Course Fund.<br />
• Electric, Water and Wastewater Revenue Bonds - the Electric and Water/Wastewater<br />
funds are operated by balancing total revenues and total expenditures/expenses. Revenue<br />
bonds are issued for reasons such as increasing plant capacity, expanding a distribution<br />
system or to upgrade the existing system. These bonds are always secured<br />
by the utility’s revenue stream.<br />
• Variable Rate Debt – this source <strong>of</strong> revenue is used to purchase capital items or<br />
develop projects through the Sunshine State Governmental Financing Commission with<br />
a contractual obligation specifying payment terms, including principal and interest to be<br />
paid over a period <strong>of</strong> time.<br />
• Equity/Surplus Financing - This source <strong>of</strong> revenues are derived from surpluses<br />
generated in each fund annually. By using accumulated surpluses, the city avoids<br />
paying interest on monies borrowed.<br />
The adopted 10-year CIP provides the necessary components <strong>of</strong> a comprehensive plan. It is updated<br />
annually as needs and priorities change within the <strong>City</strong>’s large physical plant.<br />
In summary, the <strong>City</strong>’s capital improvement plan is an economical and responsible financial plan to ensure<br />
quality public services today and in the future.<br />
F-3 Fiscal Year <strong>2008</strong> Annual Budget
TRANSPORTATION<br />
CAPITAL IMPROVEMENT PLAN<br />
ADJUSTED<br />
2007 <strong>2008</strong> 2009 2010 2011 2012 2013 2014 2015 2016 2017<br />
BUDGET PROPOSED PROJECTED PROJECTED PROJECTED PROJECTED PROJECTED PROJECTED PROJECTED PROJECTED PROJECTED<br />
REVENUES:<br />
State Revenue Sharing Gas Tax - 8th cent 2,700,000 2,714,000 2,728,000 2,742,000 2,756,000 2,770,000 2,784,000 2,798,000 2,812,000 2,826,000 2,840,000<br />
Local Option Gas Tax - 5 cents 1,650,000 1,658,000 1,666,000 1,674,000 1,682,000 1,690,000 1,698,000 1,706,000 1,715,000 1,724,000 1,733,000<br />
Local Option Gas Tax - 6 cents 906,000 911,000 916,000 921,000 926,000 931,000 936,000 941,000 946,000 951,000 956,000<br />
Local Option Gas Tax - 9th cent 500,000 503,000 506,000 509,000 512,000 515,000 518,000 521,000 524,000 527,000 530,000<br />
Investments & Earnings 116,944 116,441 116,837 131,887 147,037 147,532 148,027 148,522 149,033 149,545 150,056<br />
Special Assessments - Alleys, Sts & Sidewalks 10,000 5,000 5,000 5,000 5,000 5,000 5,000 5,000 5,000 5,000 5,000<br />
Rental Income-Florida/Harden E/W Connector 5,927<br />
Impact Fees - District 1 2,569,200 1,950,000 550,000 550,000 1,589,818 450,000<br />
Impact Fees - District 2 4,624,561 400,000 600,000 600,000 600,000 600,000 700,000 700,000 700,000 700,000 700,000<br />
Impact Fees - District 3 280,000 140,000 140,000 140,000 140,000 140,000 140,000 140,000 140,000 140,000 140,000<br />
Bond Issue - East-West Connector 9,000,000<br />
Internal Loan - East-West Connector 12,500,000<br />
Cnty Grant - E-W Connector (Applied to prin) 1,000,000 1,500,000 1,500,000<br />
Fed Grant - E-W Connector (Applied to prin) 4,000,000<br />
Bond Issue - Waring Road 4,500,000<br />
OTTED Grant - Fairbanks/Bella Vista 1,757,090<br />
FDOT Grants:<br />
Intown Bypass Park & Ride 185,709<br />
Socrum Loop / I-4 Interchange 450,000<br />
Wabash / Sloan Sidewalk (GJ Blvd) 210,705<br />
Lime Street Two-Way Conversion 497,797<br />
Robson Street Neighborhood Sidewalks 76,462<br />
Granada Street Intersection Improvement 81,544<br />
Edgewood Intersection Improvement 73,158<br />
Imperial Street Intersection Improvement 48,897<br />
Sidewalk Impr - Bartow Rd & Main St. 275,000<br />
JPA for Intown Bypass Phase 2 714,998<br />
Closing Streets & Alleys 48,742<br />
Transfer from CRA 14,532<br />
Oxford Lumber Company 350,000<br />
Developer Contributions 60,000<br />
Polk County Interlocal-AZ Park Rd 190,648<br />
Unappropriated Surplus 6,619,988 523,820 (220,416) (428,684) (184,584) 64,921 (543,755) 41,998 (459,513) 225,975 (473,536)<br />
TOTAL REVENUES 42,517,902 10,421,261 22,007,421 6,844,203 8,173,270 6,863,453 6,835,272 7,001,520 6,531,520 7,248,520 6,580,520<br />
F – 4
TRANSPORTATION<br />
CAPITAL IMPROVEMENT PLAN<br />
ADJUSTED<br />
2007 <strong>2008</strong> 2009 2010 2011 2012 2013 2014 2015 2016 2017<br />
BUDGET PROPOSED PROJECTED PROJECTED PROJECTED PROJECTED PROJECTED PROJECTED PROJECTED PROJECTED PROJECTED<br />
EXPENSES:<br />
Facilities Projects 30,000 200,000<br />
Sidewalk Projects 1,293,990 963,000 1,048,000 881,250 919,000 1,000,000 1,025,000 1,050,000 1,075,000 1,100,000 1,125,000<br />
Street Resurfacing and Sealing 2,325,000 2,685,000 2,224,000 2,274,000 2,439,000 3,039,000 2,439,000 2,589,000 2,564,000 2,614,000 2,764,000<br />
Street Improvements 27,758,084 2,425,000 16,464,520 1,364,520 1,414,520 1,364,520 1,479,520 1,889,520 1,494,520 2,159,520 1,389,520<br />
Impact Fee Projects - District 1 2,569,200 1,950,000 550,000 550,000 1,589,818 450,000<br />
Impact Fee Projects - District 2 4,624,561 400,000 600,000 600,000 600,000 600,000 700,000 700,000 700,000 700,000 700,000<br />
Impact Fee Projects - District 3 280,000 140,000 140,000 140,000 140,000 140,000 140,000 140,000 140,000 140,000 140,000<br />
Traffic Operations Projects 457,194 415,000 240,000 240,500 265,000 326,000 327,000 328,000 328,000 330,000 332,000<br />
Miscellaneous Improvements 1,242,154 302,000 451,968 205,000 547,000 205,000 130,000 205,000 130,000 205,000 130,000<br />
Contributions to Other Funds 1,967,719 1,141,261 258,933 388,933 258,933 188,933 144,752 100,000 100,000<br />
TOTAL EXPENSES 42,517,902 10,421,261 22,007,421 6,844,203 8,173,270 6,863,453 6,835,272 7,001,520 6,531,520 7,248,520 6,580,520<br />
UNAPPROPRIATED SURPLUS:<br />
Beginning Balance 8,630,998 2,011,010 1,487,190 1,707,606 2,136,290 2,320,875 2,255,954 2,799,709 2,757,711 3,217,225 2,991,250<br />
Sources/(Uses) (6,619,988) (523,820) 220,416 428,684 184,584 (64,921) 543,755 (41,998) 459,513 (225,975) 473,536<br />
Ending Balance 2,011,010 1,487,190 1,707,606 2,136,290 2,320,875 2,255,954 2,799,709 2,757,711 3,217,225 2,991,250 3,464,786<br />
FACILITIES PROJECTS:<br />
C&M Sewer Lift Station & Force Main Upgrade 30,000 200,000<br />
TOTAL FACILITIES PROJECTS 30,000 200,000<br />
SIDEWALK PROJECTS:<br />
Sidewalk Repair & Replacement (includes ADA 248,496 700,000 725,000 750,000 775,000 800,000 825,000 850,000 875,000 900,000 925,000<br />
George Jenkins Blvd. Sidewalk 392,877<br />
Robson Street Neighborhood 107,377<br />
N. Socrum Loop Rd. Sidewalk 92,195<br />
2nd St. - Lincoln Ave. to Omohundro Ave. 21,758<br />
New Jersey Rd - Bartow Rd. to Crystal Lake Dr 49,000<br />
Main Street / Lake Beulah Dr to Central Avenue 57,000<br />
Sidewalk Contingency - Developer Contrib. 6,694<br />
Bartow Rd. & Main Street 275,000<br />
Kennedy Blvd., Williamstown Blvd. to Sleepy H 26,805<br />
Lake Hollingsworth Dr., Buckingham to Clevela 16,788<br />
Old Combee Road (N. Socrum Lp. Rd./SR 33) 144,000<br />
Commerce Point Dr. (A-Z Park Rd.) 18,000<br />
Highland Dr. from Old 37 to S. Florida Ave. 40,000<br />
New Jersey Rd., Shorewood Pl to Waterford Dr 61,000<br />
SR 33 (Old Combee Rd/N. Socrum Loop Rd) 203,000<br />
Central Ave Sidewalk-Sikes Blvd. to Ruby St. 105,000<br />
Lakeshore Dr. Sidewalk-Memorial Bl. to Parker 15,000<br />
F – 5
TRANSPORTATION<br />
CAPITAL IMPROVEMENT PLAN<br />
ADJUSTED<br />
2007 <strong>2008</strong> 2009 2010 2011 2012 2013 2014 2015 2016 2017<br />
BUDGET PROPOSED PROJECTED PROJECTED PROJECTED PROJECTED PROJECTED PROJECTED PROJECTED PROJECTED PROJECTED<br />
Parkview Pl - <strong>Lakeland</strong> Hills to W. Lake Parker 43,750<br />
Deter Rd. from Hallam Dr. to Lake Miriam Dr. 87,500<br />
Skipper Place, Glendale St. to Regency Apts. 17,000<br />
Pablo Street & Windsor Street Sidewalks 37,000<br />
Sidewalks for Collector Streets 90,000 200,000 200,000 200,000 200,000 200,000 200,000<br />
TOTAL SIDEWALK PROJECTS 1,293,990 963,000 1,048,000 881,250 919,000 1,000,000 1,025,000 1,050,000 1,075,000 1,100,000 1,125,000<br />
STREET RESURFACING AND SEALING PROJECTS:<br />
Street Resurfacing and Sealing 1,500,000 2,500,000 2,139,000 2,189,000 2,239,000 2,289,000 2,339,000 2,389,000 2,439,000 2,489,000 2,539,000<br />
Pavement Markings 75,000 85,000 85,000 85,000 100,000 100,000 100,000 100,000 125,000 125,000 125,000<br />
Edgewood Resurfacing (U.S 98 South to New J 450,000<br />
Socrum Loop Road Resurfacing 300,000 650,000<br />
Pavement Management Information System 100,000 100,000 100,000 100,000<br />
TOTAL STREET RESURFACING PROJECTS 2,325,000 2,685,000 2,224,000 2,274,000 2,439,000 3,039,000 2,439,000 2,589,000 2,564,000 2,614,000 2,764,000<br />
STREET SWEEPING PROJECTS:<br />
Street Sweeping Disposal<br />
STREET IMPROVEMENT PROJECTS:<br />
Undesignated Projects 34,000 50,000 50,000 50,000 50,000 50,000 50,000 50,000 50,000 50,000 50,000<br />
Alley Maintenance & Improvements 50,000 50,000 50,000 50,000 50,000 50,000 75,000 75,000 75,000 75,000 75,000<br />
Edgewood Dr. Widening - Debt Service, <strong>City</strong> sh 100,000 100,000 100,000 100,000 100,000 100,000 100,000 100,000 100,000 100,000 100,000<br />
Intersection Impr - Beacon / Lincoln / Harden / S 1,061,270<br />
N. Combee Road Intersection Realignment 46,914<br />
Fairbanks Street Improvement 1,782,089<br />
Intown Bypass Park & Ride - FDOT #005629 352,724<br />
Brunnell Pkwy / G.Jenkins Blvd Intersection Imp 41,226<br />
Lime Street - Two Way Conversion 809,880<br />
Cleveland Heights Blvd. Drainage Modifications 68,509<br />
A-Z Park Road Improvements 998,923<br />
Imperial Blvd / S. Florida Ave. Intersection Impr 47,897<br />
Edgewood Dr. at Lkld Highlands Intersection Im 74,758<br />
Granada St. @ <strong>Lakeland</strong> Hills Blvd. Intersection 80,874<br />
Robson Street Improvement and Bridge Replac 195,000<br />
Martin Luther King, Jr. Blvd. 7,341<br />
Medulla / Waring Road Imps. 22,222<br />
Sleepy Hill Road - 98 to Kathleen Rd. (4-lane) 2,827,411<br />
F – 6
TRANSPORTATION<br />
CAPITAL IMPROVEMENT PLAN<br />
ADJUSTED<br />
2007 <strong>2008</strong> 2009 2010 2011 2012 2013 2014 2015 2016 2017<br />
BUDGET PROPOSED PROJECTED PROJECTED PROJECTED PROJECTED PROJECTED PROJECTED PROJECTED PROJECTED PROJECTED<br />
FDOT-Rd Impr Socrum Loop Rd/I-4 Interchang 450,000<br />
Socrum Loop Intersection Improvements 16,000<br />
FDOT- Joint Project Agreement for <strong>Lakeland</strong> In 714,998<br />
South Florida Avenue/Dixieland Drainage Imps 275,000 375,000<br />
Webster Avenue 114,000 75,000<br />
Downtown Brick Crosswalks 275,000 160,000 100,000<br />
East-West Connector 12,312,048 9,000,000<br />
East-West Connector (Grant rev applied to prin 5,000,000 1,500,000 1,500,000<br />
East-West Connector (Debt Service on Bond) to 2028 753,114 753,114 753,114 753,114 753,114 753,114 753,114 753,114 753,114<br />
N. Florida Ave. Median Improvements at Peach 115,000<br />
Waring Road Extension 4,500,000<br />
Waring Road Extension (<strong>City</strong> share <strong>of</strong> debt service) 411,406 411,406 411,406 411,406 411,406 411,406 411,406 411,406 411,406<br />
Churchhill Ave. Improvement 50,000<br />
Hallam Dr. @ <strong>Lakeland</strong> Highlands Rd. Intersect 90,000<br />
Robson Road Street Improvement 500,000<br />
Massachusetts Avenue Beautification 105,000 770,000<br />
TOTAL STREET IMPROVEMENT PROJECTS 27,758,084 2,425,000 16,464,520 1,364,520 1,414,520 1,364,520 1,479,520 1,889,520 1,494,520 2,159,520 1,389,520<br />
TRANSPORTATION IMPACT FEE PROJECTS:<br />
District 1:<br />
In-Town-By-Pass - Bartow Rd to George Jenkin 199,637<br />
Sleepy Hill Road - 98 to Kathleen Rd. (4-lane) 1,090,864<br />
Sleepy Hill - Debt Service on <strong>City</strong> Share 450,000 550,000 550,000 550,000 1,589,818 450,000<br />
Carpenter's Way Imp. (Corporate to Wedgewoo 528,699<br />
North <strong>Lakeland</strong> Eastern Connector Study 300,000<br />
Fairbanks Street Improvement 1,400,000<br />
District 2:<br />
Airport Southside Access - Medulla Road 18,316<br />
Beacon/Lincoln Intersection Improvements 1,325,000<br />
Waring Road Extension 2,906,744<br />
Waring Road Extension (Impact Fee share <strong>of</strong> debt service) 200,000 200,000 200,000 200,000 200,000 200,000 200,000 200,000 200,000<br />
East-West Connector 374,501 400,000 400,000 400,000 400,000 400,000 500,000 500,000 500,000 500,000 500,000<br />
District 3:<br />
Lk. Miriam Dr. (S.R. 37. - Cleveland Heights Blv 140,000<br />
Debt Service - Edgewood Dr Widening (Paid in 140,000 140,000 140,000 140,000 140,000 140,000 140,000 140,000 140,000 140,000 140,000<br />
TOTAL TRANS. IMPACT FEE PROJECTS 7,473,761 2,490,000 1,290,000 1,290,000 2,329,818 740,000 1,290,000 840,000 840,000 840,000 840,000<br />
ASSESSED STREET, ALLEY & SIDEWALK PROJECTS:<br />
Undesignated<br />
TOTAL ASSESSED STREET, ALLEY &<br />
SIDEWALK PROJECTS<br />
F – 7
TRANSPORTATION<br />
CAPITAL IMPROVEMENT PLAN<br />
ADJUSTED<br />
2007 <strong>2008</strong> 2009 2010 2011 2012 2013 2014 2015 2016 2017<br />
BUDGET PROPOSED PROJECTED PROJECTED PROJECTED PROJECTED PROJECTED PROJECTED PROJECTED PROJECTED PROJECTED<br />
TRAFFIC PROJECTS:<br />
Traffic Calming Projects 57,480 50,000 50,000 50,000 50,000 50,000 50,000 50,000 50,000 50,000 50,000<br />
Undesignated Projects 5,000 5,000 5,000 5,000 5,000 5,000 5,000 5,000 5,000 5,000 5,000<br />
Traffic Sign Rehabilitation 50,000 50,000 50,000 50,000 50,000 50,000 50,000 50,000 50,000 50,000 50,000<br />
Pedestrian Safety Awareness Campaign 10,000 10,000 10,000 10,000 10,000 10,000 10,000 10,000 10,000 10,000 10,000<br />
ITS Maintenance 15,000 15,000 15,000 15,000 15,000 15,000 15,000 15,000 15,000 15,000 15,000<br />
Flashing Signal Upgrades 60,000 60,000 60,000 60,000 60,000<br />
Illuminated Overhead Street Sign Program 10,000<br />
New York Avenue 2-Way Conversion 71,914<br />
ITS Video Wall Expansion 25,000<br />
Directional Median Cleveland Hgts @ Glendale 46,800<br />
Rebuild Traffic Signal Edgewood Dr @ New Jer 106,000<br />
Rebuild Traffic Signal-Edgewood @ Lkld Highla 120,000<br />
Re-build Fire Station 4 Signal 20,000<br />
Video Expansion 20,000<br />
FSC Flashing Beacon Replacement 40,000<br />
Painting <strong>of</strong> Traffic Signal Structures 25,000 25,000 25,000 25,000 25,000 25,000 25,000 25,000 25,000 25,000<br />
Light Emitting Diode (LED) Signal lamp replace 25,000 25,500 50,000 51,000 52,000 53,000 53,000 55,000 57,000<br />
Socrum Loop Rd @ Old Combee Rd Traffic Sig 120,000<br />
MLK @ 5th St Traffic Signal Re-Build 120,000<br />
Ingraham Av @ Rose St Traffic Signal Re-Build 120,000<br />
Ingraham Av @ Parker St Traffic Signal Re-Bui 120,000<br />
Ingraham Av @ Main St Traffic Signal Re-Build 120,000<br />
Parker St @ Evelyn Av Traffic Signal Re-build 120,000<br />
TOTAL TRAFFIC PROJECTS 457,194 415,000 240,000 240,500 265,000 326,000 327,000 328,000 328,000 330,000 332,000<br />
MISCELLANEOUS IMPROVEMENT PROJECTS:<br />
Survey for <strong>City</strong>wide GIS Database 34,000 52,000 30,000 30,000 30,000 30,000 30,000 30,000 30,000 30,000 30,000<br />
Contingency 91,000 100,000 100,000 100,000 100,000 100,000 100,000 100,000 100,000 100,000 100,000<br />
Equipment Leases 22,113<br />
Fleet Maintenance Parking Lot 28,703<br />
General Office Help 8,001<br />
Emergency Generator Power Supply 108,337<br />
Oxford Lumber Company purchase 950,000 321,968<br />
Replacement Cement Silo 75,000<br />
Concrete Crushing 75,000 75,000 75,000 75,000 75,000<br />
Tigertown - Resurface Parking Lot 225,000<br />
Sikes Blvd. Bridge Recoating 192,000<br />
TOTAL MISC. IMPROVEMENT PROJECTS 1,242,154 302,000 451,968 205,000 547,000 205,000 130,000 205,000 130,000 205,000 130,000<br />
F – 8
TRANSPORTATION<br />
CAPITAL IMPROVEMENT PLAN<br />
ADJUSTED<br />
2007 <strong>2008</strong> 2009 2010 2011 2012 2013 2014 2015 2016 2017<br />
BUDGET PROPOSED PROJECTED PROJECTED PROJECTED PROJECTED PROJECTED PROJECTED PROJECTED PROJECTED PROJECTED<br />
CONTRIBUTIONS TO OTHER FUNDS:<br />
Transfer to General Fund (C&M Employees) 112,551 115,928<br />
Transfer to General Fund (Street Lighting) 300,000 300,000<br />
Stormwater Fund 1,205,000<br />
Parking System:<br />
Orange Street Garage 270,000 130,000<br />
Main Street Garage 180,000<br />
Debt service - Verizon property (10 yr Int. loa 88,933 88,933 88,933 88,933 88,933 88,933 44,752<br />
Contribution for new Parking Garage<br />
Munn Park Surface Parking Lot Paving 13,500<br />
Radio System Expansion - Public Safety 735<br />
Parking Lots 16,400<br />
Miscellaneous Parking Projects 18,000<br />
Main St Garage Lighting 11,000<br />
Security Cameras Main Street Garage 24,000<br />
Multi Space Parking Meters 24,000<br />
Debt Service - Lake Mirror Park 100,000 100,000 100,000 100,000 100,000 100,000 100,000 100,000 100,000<br />
Transfer to Mid-town CRA - Internal Loan Hope 70,000 70,000 70,000 70,000 70,000<br />
TOTAL CONTRIB. TO OTHER FUNDS 1,967,719 1,141,261 258,933 388,933 258,933 188,933 144,752 100,000 100,000<br />
TOTAL EXPENSES 42,517,902 10,421,261 22,007,421 6,844,203 8,173,270 6,863,453 6,835,272 7,001,520 6,531,520 7,248,520 6,580,520<br />
F – 9
PUBLIC IMPROVEMENT<br />
CAPITAL IMPROVEMENT PLAN<br />
ADJUSTED<br />
2007 <strong>2008</strong> 2009 2010 2011 2012 2013 2014 2015 2016 2017<br />
BUDGET PROPOSED PROJECTED PROJECTED PROJECTED PROJECTED PROJECTED PROJECTED PROJECTED PROJECTED PROJECTED<br />
REVENUES:<br />
LRMC Lease Payments 10,060,000 10,085,000 10,110,000 10,135,000 10,160,000 10,185,000 10,210,000 10,235,000 10,260,000 10,285,000 10,310,000<br />
Investment Earnings 380,000 300,000 341,213 342,056 342,900 343,744 344,588 345,431 346,275 347,119 347,963<br />
Miscellaneous Grant Revenues:<br />
Beautification Grants (50%) 399,793<br />
Polk County School Board - Freedom Park 500,000<br />
FRDAP Grants 321,764 400,000 200,000<br />
Rotary Club - Common Ground 300,000<br />
Kaliedescope / Common Ground 567,000<br />
PCMSTU - Common Ground 100,000<br />
PCMSTU - Cypress Youth Complex 100,000<br />
FDOT JPA - Fort Frasier Trail 1,581,012<br />
FDOT JPA - Highland <strong>City</strong> Intermodal Transfer 348,218<br />
FDOT-LAP Landscape I-4 and Hwy 98 (100%) 742,609<br />
FDOT-I4 & Memorial Blvd Bridge Beautification 200,000<br />
FDOT-I4 & Kathleen Interchange Landscape 300,000<br />
FDOT Intermodal Connector - Phases I & II 149,498<br />
Intown Bypass Beautification Grant (100%) 95,539<br />
Sale <strong>of</strong> Capital Assets:<br />
Sale <strong>of</strong> Land - Fridovich Property 675,000<br />
Sale <strong>of</strong> Land - LPD Impound Lot 150,000<br />
Miscellaneous Internal Loans:<br />
Kelly Recreation A/C & Expansion (6 years)<br />
Transfers From:<br />
Transportation Fund 100,000 100,000 100,000 100,000 100,000 100,000 100,000 100,000 100,000<br />
Impact Fee Fund:<br />
Parks & Recreation 633,671 1,025,000 125,000 109,532 1,000,000 500,000 750,000<br />
Police 180,500 825,000 150,000 150,000 150,000 150,000 150,000 150,000 150,000 150,000 150,000<br />
Lake Mirror Park:<br />
Internal Loan - Lake Mirror Park 260,663<br />
CRA contribution to debt service 250,000 250,000 350,000 350,000 350,000 350,000 350,000 350,000<br />
Marchant Stadium Expansion Revenues:<br />
State <strong>of</strong> Florida - Office <strong>of</strong> Tourism 466,668 466,668 466,668 466,668 466,668 466,668 466,668 466,668 466,668<br />
Polk County Tourist Development Council 192,685 192,685 192,685 192,685 192,685 192,685 192,685 192,685 192,685<br />
Detroit Tiger - Commissions 234,797 234,797 234,797 234,797 234,797 234,797 234,797 234,797 234,797<br />
Detroit Tiger - Commissions-seating loan (Paid 55,470 55,470 55,470 55,470 55,470 55,470 55,470 55,470 55,470 55,470<br />
F – 10
PUBLIC IMPROVEMENT<br />
CAPITAL IMPROVEMENT PLAN<br />
ADJUSTED<br />
2007 <strong>2008</strong> 2009 2010 2011 2012 2013 2014 2015 2016 2017<br />
BUDGET PROPOSED PROJECTED PROJECTED PROJECTED PROJECTED PROJECTED PROJECTED PROJECTED PROJECTED PROJECTED<br />
Library Revenues:<br />
County Library Cooperative 448,801 200,000 200,000 200,000 200,000 200,000 200,000 200,000 200,000 200,000 200,000<br />
County Library Cooperative - E-Library 246,156<br />
Fire Department Revenues:<br />
Fire Protection Fees 261,543 261,543 222,312 222,312 200,000 200,000 175,000 175,000 175,000 175,000 175,000<br />
Transfer from Imp. Fee Fund 170,500 200,000 200,000 325,000 325,000 325,000 325,000 364,301 300,000 1,042,950 300,000<br />
Nextel Antenna Tower Lease 22,500 30,000 30,000 30,000 30,000 30,000 30,000 30,000 30,000 30,000 30,000<br />
Surplus Furniture & Equipment 17,396<br />
Contributions / Reimbursements 12,000<br />
Bond Proceeds - NE Recreation Complex 9,000,000<br />
Unappropriated Surplus - Used / (Generated) 6,520,174 553,379 (676,472) (65,613) (1,129,688) 585,618 615,910 494,872 (1,088,120) 637,299 (62,643)<br />
TOTAL REVENUES 25,576,958 16,296,543 12,301,672 12,847,907 12,677,832 22,918,982 13,450,118 14,144,224 11,772,775 12,922,838 11,450,320<br />
EXPENSES:<br />
Parks 13,772,239 4,782,620 4,433,372 3,540,531 3,937,632 4,047,654 4,138,147 4,208,147 2,896,159 415,470 1,295,000<br />
FDOT Enhancement Program 548,520<br />
Recreation 779,102 2,151,745 714,745 393,745 523,745 11,570,802 2,683,302 2,582,002 2,382,994 2,522,057 1,440,000<br />
Parks & Recreation Impact Fee Projects 632,171 1,025,000 125,000 109,532 1,000,000 500,000 750,000<br />
Library 451,500 200,000 200,000 200,000 200,000 200,000 200,000 200,000 200,000 200,000 200,000<br />
Police Department 1,346,228 1,082,000 175,000 2,325,000 700,000 270,000 217,000 150,000 150,000 150,000 150,000<br />
Fire Department 1,124,794 1,089,260 1,093,635 1,206,585 1,108,460 1,114,185 1,123,685 1,016,586 950,000 4,325,000 625,000<br />
Non-Departmental 1,559,442 1,615,918 1,639,921 1,054,814 1,094,814 1,009,814 775,161 800,331 674,000 680,000 696,000<br />
Contributions to Other Funds 5,362,962 4,350,000 3,920,000 4,017,700 4,113,181 4,206,526 4,312,822 4,437,157 4,519,622 4,630,310 7,044,320<br />
TOTAL EXPENSES 25,576,958 16,296,543 12,301,672 12,847,907 12,677,832 22,918,982 13,450,118 14,144,224 11,772,775 12,922,838 11,450,320<br />
UNAPPROPRIATED SURPLUS:<br />
Beginning Balance 8,679,987 2,159,813 1,606,434 2,282,906 2,348,519 3,478,208 2,892,589 2,276,679 1,781,808 2,869,928 2,232,629<br />
Sources/(Uses) (6,520,174) (553,379) 676,472 65,613 1,129,688 (585,618) (615,910) (494,872) 1,088,120 (637,299) 62,643<br />
Ending Balance 2,159,813 1,606,434 2,282,906 2,348,519 3,478,208 2,892,589 2,276,679 1,781,808 2,869,928 2,232,629 2,295,272<br />
F – 11
PUBLIC IMPROVEMENT<br />
CAPITAL IMPROVEMENT PLAN<br />
ADJUSTED<br />
2007 <strong>2008</strong> 2009 2010 2011 2012 2013 2014 2015 2016 2017<br />
BUDGET PROPOSED PROJECTED PROJECTED PROJECTED PROJECTED PROJECTED PROJECTED PROJECTED PROJECTED PROJECTED<br />
EXPENSES:<br />
PARKS:<br />
Beautification Projects (Partial Grant & 100% <strong>City</strong> Funded):<br />
Neighborhood Beautification 63,185 50,000 50,000 50,000 50,000 50,000 50,000 50,000 50,000 50,000 50,000<br />
St. Beautification Design Consult Fees 30,499<br />
Beautification Projects (50% Grants):<br />
Memorial Boulevard 600,000<br />
Beautification Projects (100% Grants):<br />
I-4 and U.S. 98 North 742,609<br />
Landscape 92 to Iowa (Memorial Blvd III) 66,358<br />
Landscape Iowa to W Lk Parker (Memorial Blvd 33,435<br />
FDOT-I4 & Kathleen Interchange Landscape 300,000<br />
I-4 & Memorial Bridge Beautification 200,000<br />
Bryant Stadium Complex:<br />
Henley Field Structural Inspections 15,000<br />
Henley Field - Replace Net and Bullpen Lights 150,000<br />
Henley Field - Locker Room & Batting Cage 80,000<br />
Common Ground Park:<br />
Park Construction 10,025 600,000 900,000<br />
Crystal Grove Park:<br />
Playground Replacement 120,000<br />
Cypress Youth Complex:<br />
Construction ($2.3m <strong>City</strong> & $500k Imp Fees) 370,752 944,248 985,000<br />
Dobbins Park:<br />
Playground Replacement 200,000<br />
Freedom Park:<br />
Park Construction 1,266,925<br />
Horney Park:<br />
Playground 60,000<br />
Jackson Park:<br />
Playgound Renovation 513,475 80,000<br />
Lake Bonny Community Park:<br />
Park Land Debt Service 104,000<br />
Boardwalk (Impact Fees, Grant & <strong>City</strong>) 25,352<br />
Playground Replacement 180,000<br />
Lake Hollingsworth:<br />
Park Restrooms Addition 100,000<br />
Lake Mirror Park:<br />
Hollis Gardens Sidewalk Lighting 95,000<br />
Regency Hotel - Internal Loan Subsidy (Paid 20 100,000 100,000 100,000 100,000 100,000 100,000 100,000 100,000 100,000<br />
Lake Mirror Park - Construction 5,735,230 750,000<br />
Lake Mirror Park - Debt Service (Paid 2015) 635,057 1,000,000 1,000,000 2,000,000 2,250,000 2,250,000 2,500,000 2,500,000 868,012<br />
Internal Loan - Motel ($450,000 for 10 years @ 59,485 59,485 59,485 59,485 59,485 59,507<br />
Purchase Nally Property ($2,500/mo. for 15 yea 30,000 30,000 30,000 30,000 30,000 30,000 30,000 30,000 30,000 30,000 30,000<br />
Barnett Park Playground Replacement 200,000<br />
Lake Mirror Loggia 125,000<br />
Tent Magnolia Building for Termites 30,000<br />
Replace Wood Floor in Magnolia Building 70,000<br />
F – 12
PUBLIC IMPROVEMENT<br />
CAPITAL IMPROVEMENT PLAN<br />
ADJUSTED<br />
2007 <strong>2008</strong> 2009 2010 2011 2012 2013 2014 2015 2016 2017<br />
BUDGET PROPOSED PROJECTED PROJECTED PROJECTED PROJECTED PROJECTED PROJECTED PROJECTED PROJECTED PROJECTED<br />
Lake Parker Park:<br />
Bathroom Renovations 100,000<br />
Playground Replacement 180,000<br />
Dog Park 75,000<br />
Marchant Stadium:<br />
Expansion - Debt Service (To 2015) 882,070 894,150 894,150 894,150 894,150 894,150 894,150 894,150 894,150<br />
Expansion - Debt Service (To 2015) <strong>City</strong> Share 28,527 28,527 28,527 28,527 28,527 28,527 28,527 28,527 28,527<br />
Seating - Int. Loan Debt Service (To 2016) 67,550 55,470 55,470 55,470 55,470 55,470 55,470 55,470 55,470 55,470<br />
Marchant Stadium Structural Survey 5,000 5,000 5,000<br />
Stadium Scoreboard - Debt Service 45,740 45,740 45,740 22,899<br />
Miami Park:<br />
Playground Replacement 50,000<br />
Peterson Park:<br />
Playground Replacement 200,000<br />
Sertoma Park:<br />
Picnic Shed Replacement 40,000<br />
Park Renovation 55,000<br />
Tigertown:<br />
Stadium Facility Improvements 80,000 50,000 50,000<br />
Minor League Field Fencing 85,000<br />
Hanger #3 Renovations 100,000<br />
H.V.A.C. Retr<strong>of</strong>it 200,000<br />
Washington Park:<br />
Playground Replacement 145,000<br />
Webster Park:<br />
Resurface Basketball Court 25,000<br />
Playground Replacement 110,000<br />
Westside / Southwest Complexes:<br />
S.W./W.S. Complexes-Bathroom Upgrade 55,000<br />
Southwest Complex - Clubhouse Remodel 125,000<br />
Westside Complex Concession Stand Rehab 125,000<br />
Woodlake Park:<br />
Playground Replacement 100,000<br />
Irrigation Projects:<br />
Centralized Irrigation System 50,000 50,000<br />
Sportsfield Projects:<br />
Sports Field Lighting Upgrade 175,000<br />
Sports Complex Scoreboard Replacement 50,000<br />
Sports Field Lighting Replacement 150,000<br />
F – 13
PUBLIC IMPROVEMENT<br />
CAPITAL IMPROVEMENT PLAN<br />
ADJUSTED<br />
2007 <strong>2008</strong> 2009 2010 2011 2012 2013 2014 2015 2016 2017<br />
BUDGET PROPOSED PROJECTED PROJECTED PROJECTED PROJECTED PROJECTED PROJECTED PROJECTED PROJECTED PROJECTED<br />
Miscellaneous Parks Projects:<br />
Park Consultant Design Services 25,000 25,000 25,000 25,000 25,000 25,000 25,000 25,000 30,000 30,000 30,000<br />
Fort Fraser Trail 1,574,532<br />
In-Town Bypass Maintenance 5,175<br />
Harden Blvd Median South <strong>of</strong> Beacon 11,778<br />
Landscape Harden @ Lakeside Village Mall 35,480<br />
Nursery Greenhouse and Facilities 55,000<br />
Pavement Mgmt System - (Re-pave Park Paths 50,000 50,000 50,000 50,000 50,000<br />
Holiday Decorations 50,000 50,000<br />
Lake Hunter Boat Ramp Picnic Pavilion 35,000<br />
Interlachen Park - Camellia Garden 50,000<br />
Bartow Highway Railroad Planting 30,000<br />
Parks Signage Upgrade - <strong>City</strong> Wide 35,000<br />
Southside Maintenance Facility 700,000<br />
TOTAL PARKS 13,772,239 4,782,620 4,433,372 3,540,531 3,937,632 4,047,654 4,138,147 4,208,147 2,896,159 415,470 1,295,000<br />
FDOT ENHANCEMENT PROGRAM (10%):<br />
Intermodal Connector Projects:<br />
Intermodal Transfer Center (Highland <strong>City</strong>) 400,022<br />
Intermodal Connector - 1 148,498<br />
TOTAL FDOT ENHANCEMENT PROGRAM 548,520<br />
F – 14
PUBLIC IMPROVEMENT<br />
CAPITAL IMPROVEMENT PLAN<br />
ADJUSTED<br />
2007 <strong>2008</strong> 2009 2010 2011 2012 2013 2014 2015 2016 2017<br />
BUDGET PROPOSED PROJECTED PROJECTED PROJECTED PROJECTED PROJECTED PROJECTED PROJECTED PROJECTED PROJECTED<br />
RECREATION:<br />
Coleman Bush Building:<br />
Building Renovation ($2,000,000 total project) 1,600,000<br />
Kelly Recreation Complex:<br />
Kelly Rec - A/C & Expansion (<strong>City</strong> share <strong>of</strong> $1 525,000<br />
D/S - Kelly Rec A/C & Exp (<strong>City</strong> Share)<br />
Kelly Rec - Replace Weight Room Equipment 40,000<br />
Gandy/Kelly Rec Painting & Repair 60,000<br />
Kelly Rec - Tennis Courts Relighting 120,000<br />
Gandy Pool Gas Heater Replacement 40,000<br />
Gandy & Simpson / Lane Lines 42,000<br />
Gandy & Simpson Pools - Shade Awnings 30,000<br />
Kelly Rec - Playground 85,000<br />
Kelly Rec - Fence Tennis Courts 35,000<br />
Gandy - Air / Heat Installed in Locker Rooms 52,000<br />
Gandy Pool Deck Repair and Upgrade 90,000<br />
Lake Mirror Center:<br />
Update Theater Lighting 47,000<br />
Replace Theater Ceiling/Asbestos Removal 200,000<br />
Theater Seat Replacement 160,000<br />
Sound System Improvements 26,000<br />
Furniture Replacement 99,500<br />
Northeast Recreation Complex:<br />
Construction (9 million <strong>City</strong> + 1.5 million Impact 9,000,000<br />
Debt Service - NE Rec Complex (5 years) 2,122,057 2,122,057 2,122,057 2,122,057 2,122,057<br />
Debt Service - Rec Complex Property 143,745 143,745 143,745 143,745 143,745 143,745 143,745 143,745 35,937<br />
Simpson Park:<br />
Simpson Park Land Acquisition 35,000<br />
Pool Deck Repair 90,000<br />
Replace Weight Room Equipment 40,000<br />
Bathroom Renovation 65,000<br />
Ro<strong>of</strong> Replacement 150,000<br />
Playground Replacement 90,000<br />
Gas Heater/Pool Blankets 165,000<br />
Steel Outer Perimeter Fence 80,000<br />
Simpson Park Pool Resurfacing 175,000<br />
Expansion <strong>of</strong> Community Center 1,200,000<br />
Veterans Park:<br />
Park Renovations 730<br />
Overlaying Tennis Courts with 1" asphalt 56,000 56,000 75,000 75,000<br />
Miscellaneous Recreation Projects:<br />
Renovate Buildings and Playgrounds 109,627 100,000 100,000 100,000 100,000 100,000 100,000 150,000 150,000 150,000 150,000<br />
Pool & Vacuum Pump, Valve Replacements 34,200<br />
TOTAL RECREATION 779,102 2,151,745 714,745 393,745 523,745 11,570,802 2,683,302 2,582,002 2,382,994 2,522,057 1,440,000<br />
F – 15
PUBLIC IMPROVEMENT<br />
CAPITAL IMPROVEMENT PLAN<br />
ADJUSTED<br />
2007 <strong>2008</strong> 2009 2010 2011 2012 2013 2014 2015 2016 2017<br />
BUDGET PROPOSED PROJECTED PROJECTED PROJECTED PROJECTED PROJECTED PROJECTED PROJECTED PROJECTED PROJECTED<br />
P&R IMPACT FEE PROJECTS:<br />
District 1:<br />
Freedom Park 1,807<br />
Simpson Park Football Field 1,697<br />
Impact Fee Study 12,500<br />
Coleman Bush expansion 400,000<br />
NE Rec Complex 1,000,000 500,000<br />
District 2:<br />
Westside Complex - Walking Path 4,125<br />
Westside Park Picnic Pavilions 2,566<br />
Southwest Park - Playground 1,426<br />
Common Ground 120,550<br />
Impact Fee Study 12,500<br />
Capital & DS - Kelly Rec A/C & Expansion (Imp 475,000 125,000 125,000 109,532<br />
Cypress Youth Complex 500,000 750,000<br />
TOTAL P&R IMPACT FEE PROJECTS 632,171 1,025,000 125,000 109,532 1,000,000 500,000 750,000<br />
LIBRARY:<br />
Co-op Funded Projects:<br />
Future Expansion Reserve 73,538 131,000 165,000 175,000 182,000 160,000 150,000 150,000 100,000 160,000 200,000<br />
Youth Room Expansion ($942,931 total project 26,462<br />
Library Furniture 25,000 25,000<br />
Exterior lighting and signage - (Main) 50,000<br />
Internet Instruction Lab 1,500<br />
Lobby Restroom Renovation (Main) 25,000<br />
Carpet (Branch) 42,000<br />
Phone System Upgrade - Libraries 27,000<br />
Computer Equipment Upgrade 35,000 40,000 40,000<br />
Technical Services Furniture - Main Library 18,000<br />
Carpet (Main) 50,000 50,000<br />
Meeting Room Renovation (Branch) 100,000<br />
<strong>City</strong> Funded Projects:<br />
e-Library 250,000<br />
TOTAL LIBRARY 451,500 200,000 200,000 200,000 200,000 200,000 200,000 200,000 200,000 200,000 200,000<br />
F – 16
PUBLIC IMPROVEMENT<br />
CAPITAL IMPROVEMENT PLAN<br />
ADJUSTED<br />
2007 <strong>2008</strong> 2009 2010 2011 2012 2013 2014 2015 2016 2017<br />
BUDGET PROPOSED PROJECTED PROJECTED PROJECTED PROJECTED PROJECTED PROJECTED PROJECTED PROJECTED PROJECTED<br />
POLICE DEPARTMENT:<br />
Police Facility Expansion Debt Service for 15 yrs. 985,645<br />
Impact Fee Study 20,500<br />
LPD In-Car Video Systems 89,000 75,000 75,000 75,000 75,000 150,000 75,000 75,000 75,000 75,000 75,000<br />
LPD A/C Controls 4,459<br />
LPD Property & Evidence Expansion 10,000 190,000<br />
Helicopter Renovation 236,624 100,000 100,000 100,000 100,000 75,000 75,000 75,000 75,000 75,000<br />
Purchase and Expand Oleander Street property 650,000<br />
Resurface Main Police Headquarter Parking Lot 40,000<br />
General Storage - Property & Evidence Room 10,000<br />
LPD Camera System Repair and Upgrade 67,000<br />
LPD Recoating & Sealing 50,000<br />
New Flooring/Carpet 100,000 20,000 67,000<br />
Training Center Expansion 325,000<br />
A/C Chiller Replacments 225,000 225,000<br />
North / South Substations 1,500,000<br />
Ro<strong>of</strong> Replacement 300,000<br />
TOTAL POLICE 1,346,228 1,082,000 175,000 2,325,000 700,000 270,000 217,000 150,000 150,000 150,000 150,000<br />
FIRE DEPARTMENT:<br />
Central Fire Station Debt Service (Paid in '14) 283,775 289,260 293,635 301,585 308,460 314,185 323,685 327,285<br />
Debt Service - Station #6 150,000 200,000 200,000 200,000 200,000 200,000 200,000 89,301<br />
Motor Pool Purchases 610,312 600,000 600,000 600,000 600,000 600,000 600,000 600,000 600,000 625,000 625,000<br />
Station #4 - Dorm upgrade 10,207<br />
Impact Fee Study 20,500<br />
Heavy Truck Lift 50,000<br />
Engine Bay Door Upgrade 70,000<br />
Station #1 - Condenser Replacement 35,000<br />
Station #7 - Construction 350,000 3,500,000<br />
Station 7 Engine Equipment 200,000<br />
TOTAL FIRE 1,124,794 1,089,260 1,093,635 1,206,585 1,108,460 1,114,185 1,123,685 1,016,586 950,000 4,325,000 625,000<br />
F – 17
PUBLIC IMPROVEMENT<br />
CAPITAL IMPROVEMENT PLAN<br />
ADJUSTED<br />
2007 <strong>2008</strong> 2009 2010 2011 2012 2013 2014 2015 2016 2017<br />
BUDGET PROPOSED PROJECTED PROJECTED PROJECTED PROJECTED PROJECTED PROJECTED PROJECTED PROJECTED PROJECTED<br />
NON-DEPARTMENTAL:<br />
Neighborhood Projects:<br />
Neighborhood Preservation 24,302 20,000 30,000 30,000 40,000 40,000 50,000 50,000 60,000 100,000 100,000<br />
Neighborhood Matching Grants Program 32,197 30,000 35,000 35,000 40,000 40,000 45,000 45,000 45,000 65,000 65,000<br />
Historic Street Lighting - Cumberland Neighbor 40,000 40,000 50,000 50,000 60,000 60,000 60,000 70,000 70,000<br />
Information Technologies:<br />
D/S for Sunshine St. Loan - Radio Replacemen 174,102 174,104 174,106<br />
Upgrade/Purchase <strong>of</strong> Radio Towers (D/S) 264,653 264,653 264,653 264,653 264,653 264,653<br />
<strong>City</strong> Hall:<br />
North Wing Renovation 66<br />
<strong>City</strong> Hall Construct Receptionist Station 1,920<br />
<strong>City</strong> Hall Fresh Air & A/C Chillers 200,000<br />
<strong>City</strong> Hall Digital Controls 200,000<br />
All Other General Fund Buildings:<br />
Air Quality Investigations 10,000<br />
Ro<strong>of</strong> Replacements 114,118 100,000 105,000 110,000 116,000 122,000 128,000 134,000 141,000 148,000 155,000<br />
Air Conditioner Replacements 91,041 50,000 55,000 60,000 65,000 70,000 75,000 80,000 85,000 90,000 95,000<br />
Carpet Replacements 30,000 35,000 37,000 39,000 41,000 43,000 45,000 47,000 49,000 51,000 53,000<br />
Recoating / Sealing 60,000 60,000 62,000 64,000 66,000 68,000 70,000 72,000 74,000 76,000 78,000<br />
Security System Controls (General Fund facilities) 75,000<br />
Security Audit <strong>of</strong> Downtown <strong>City</strong> Buildings 15,000<br />
Miscellaneous Non-Departmental Projects:<br />
ADA Compliance 25,000 25,000 25,000 25,000 25,000 25,000 25,000 25,000 25,000 25,000 25,000<br />
Land Acquisition - (Debt Service for 10 years) 152,161 152,161 152,161 152,161 152,161 152,161 152,161 152,331<br />
Contingency 47,386 100,000 125,000 125,000 125,000 125,000 125,000 125,000 125,000 125,000 125,000<br />
Cultural Activities Reserve (10 years) 100,000 100,000 100,000 100,000 100,000<br />
Wireless Laptops - Code Enf. & Bldg Insp. 5,318<br />
Demolition <strong>of</strong> <strong>City</strong> Buildings 50,000<br />
Electrical Modifications for Generators 920<br />
Ad Valorem Taxes 4,258<br />
Chamber <strong>of</strong> Commerce Sub-Level Ceiling 130,000<br />
Refrigerated Trailer 12,000<br />
Federal Building Exterior Renovation 160,000<br />
<strong>Lakeland</strong> Credit Union Renovation 350,000<br />
Upgrade <strong>City</strong> Elevators 30,000 25,000 25,000<br />
TOTAL NON DEPARTMENTAL 1,559,442 1,615,918 1,639,921 1,054,814 1,094,814 1,009,814 775,161 800,331 674,000 680,000 696,000<br />
F – 18
PUBLIC IMPROVEMENT<br />
CAPITAL IMPROVEMENT PLAN<br />
ADJUSTED<br />
2007 <strong>2008</strong> 2009 2010 2011 2012 2013 2014 2015 2016 2017<br />
BUDGET PROPOSED PROJECTED PROJECTED PROJECTED PROJECTED PROJECTED PROJECTED PROJECTED PROJECTED PROJECTED<br />
CONTRIBUTIONS TO OTHER FUNDS:<br />
General Fund 1,875,000 3,000,000 3,090,000 3,182,700 3,278,181 3,376,526 3,477,822 3,582,157 3,689,622 3,800,310 3,914,320<br />
Fire Station #7 - (6 Personnel per shift) 2,300,000<br />
Dividend assistance 2,200,000<br />
Information Technologies Fund:<br />
LPD Laptops & Servers 210,893 125,000 125,000 125,000 125,000 125,000 130,000 130,000 130,000 130,000 130,000<br />
Radio Replacement Reserve 100,000 100,000 100,000 100,000 100,000 100,000 100,000 100,000 100,000 100,000 100,000<br />
<strong>Lakeland</strong> Center Fund:<br />
Capital Transfer 545,164 750,000 350,000 350,000 350,000 350,000 350,000 350,000 350,000 350,000 350,000<br />
Operating Transfer 225,000 225,000 225,000 225,000 225,000 225,000 225,000 225,000 225,000 225,000 225,000<br />
Cleveland Heights Golf Course 66,905 50,000<br />
Oak Hill Fund 140,000 100,000 30,000 35,000 35,000 30,000 30,000 50,000 25,000 25,000 25,000<br />
TOTAL CONTRIBUTIONS TO OTHER FUNDS 5,362,962 4,350,000 3,920,000 4,017,700 4,113,181 4,206,526 4,312,822 4,437,157 4,519,622 4,630,310 7,044,320<br />
TOTAL EXPENSES 25,576,958 16,296,543 12,301,672 12,847,907 12,677,832 22,918,982 13,450,118 14,144,224 11,772,775 12,922,838 11,450,320<br />
F – 19
DOWNTOWN COMMUNITY REDEVELOPMENT AREA<br />
CAPITAL IMPROVEMENT PLAN<br />
ADJUSTED<br />
2007 <strong>2008</strong> 2009 2010 2011 2012 2013 2014 2015 2016 2017<br />
BUDGET PROPOSED PROJECTED PROJECTED PROJECTED PROJECTED PROJECTED PROJECTED PROJECTED PROJECTED PROJECTED<br />
REVENUES:<br />
Tax Increment Revenues 1,696,760 1,500,000 1,530,000 1,561,000 1,592,000 1,624,000 1,656,000 1,689,000 1,723,000 1,757,000 1,792,000<br />
Investment Income 54,588 32,352 40,838 41,917 55,643 49,573 41,254 37,034 18,300 2,042 4,161<br />
Internal Loan (Residential Developmnent) 500,000 500,000 87,608<br />
Land Sales 2,000,000<br />
Unappropriated Surplus 628,974 (282,874) (35,938) 6,137 151,755 207,984 105,493 468,353 406,443 (52,957) (95,977)<br />
TOTAL REVENUES 2,880,322 1,749,478 1,622,509 3,609,054 1,799,398 1,881,558 1,802,747 2,194,387 2,147,743 1,706,085 1,700,184<br />
EXPENSES:<br />
Streetscape:<br />
Lemon Street Pedestrian Connector 36,041<br />
Cleaning 21,000 21,500 22,000 22,500 23,000 23,500 24,000 24,500 25,000 25,500 26,000<br />
Cedar St Streetscape - Mass Ave to Kentucky 1,063<br />
Downtown - Watkins Motor Lines 3,236<br />
Pilot Bank - S. Florida Avenue 250,000<br />
Streetscape Projects 250,000 100,000 100,000 100,000 100,000 100,000 100,000 100,000 100,000 100,000<br />
Debt Service :<br />
Downtown Streetscape Loan (Paid 2015) 125,000 125,000 125,000 125,000 125,000 125,000 125,000 125,000 60,250<br />
Lake Mirror Park (Paid 2015) 250,000 250,000 350,000 350,000 350,000 350,000 350,000 350,000<br />
Miscellaneous Projects:<br />
Container Gardens - New 1,000 1,000 1,000 1,000 1,000 1,000 1,000 1,000 1,000 1,000 1,000<br />
Container Garden - Maintenance 75,000 77,250 79,568 81,955 84,413 86,946 89,554 92,241 95,008 97,858 100,794<br />
Debt Service - Residential Redevelopment (20 450,425 400,000 425,000 2,500,000 725,000 725,000 700,000 1,075,000 1,075,000 1,025,000 1,000,000<br />
Residential Redevelopment - Land Acquisition 1,165,707<br />
Massachusetts Ave Brick Crosswalks 165,834<br />
Downtown Plan Updates / Brochures 70,000<br />
Aluminum Dumpster 5,000<br />
Downtown Signage 185,632<br />
Lake Wire - Design 200,000<br />
Mowing 12,000 7,000 3,600 3,600<br />
Operating:<br />
Contribution to LDDA 195,605 199,503 203,493 207,563 211,714 215,948 220,267 224,672 229,165 233,748 238,423<br />
Tax Increment Refunds 88,279 92,693 97,328 102,194 107,304 112,669 118,302 124,217 130,428 136,949 143,796<br />
Debt Service for Signage Loan 11,500 211,532<br />
Additional Personnel 50,000 53,000 56,000 59,000 62,000 65,000 68,000 71,000 75,000 79,000 83,000<br />
Pr<strong>of</strong>essional Services 50,000 50,000 50,000 50,000<br />
Annual Audit 6,000 6,120 6,242 6,367 6,495 6,624 6,757 6,892 7,030 7,171<br />
TOTAL EXPENSES 2,880,322 1,749,478 1,622,509 3,609,054 1,799,398 1,881,558 1,802,747 2,194,387 2,147,743 1,706,085 1,700,184<br />
UNAPPROPRIATED SURPLUS:<br />
Beginning Balance 1,707,382 1,078,408 1,361,282 1,397,220 1,391,083 1,239,328 1,031,344 925,851 457,498 51,056 104,013<br />
Sources/(Uses) (628,974) 282,874 35,938 (6,137) (151,755) (207,984) (105,493) (468,353) (406,443) 52,957 95,977<br />
Ending Balance 1,078,408 1,361,282 1,397,220 1,391,083 1,239,328 1,031,344 925,851 457,498 51,056 104,013 199,990<br />
F – 20
MID-TOWN COMMUNITY REDEVELOPMENT AREA<br />
CAPITAL IMPROVEMENT PLAN<br />
ADJUSTED<br />
2007 <strong>2008</strong> 2009 2010 2011 2012 2013 2014 2015 2016 2017<br />
BUDGET PROPOSED PROJECTED PROJECTED PROJECTED PROJECTED PROJECTED PROJECTED PROJECTED PROJECTED PROJECTED<br />
REVENUES:<br />
Tax Increment 2,966,803 2,700,000 2,754,000 2,809,000 2,865,000 2,922,000 2,980,000 3,040,000 3,101,000 3,163,000 3,226,000<br />
Interest Income 104,000 20,000 20,000 19,000 29,000 27,000 34,000 17,000 25,000 18,000 23,000<br />
Transfers:<br />
Transportation Fund (Hope VI Debt Service) 70,000 70,000 70,000 70,000 70,000<br />
Residential Redevelopment - Rental Income 100,000<br />
FDOT - MLK - Myrtle to Memorial 200,000<br />
Unappropriated Surplus 1,463,272 436,944 (700) 77,186 (260,411) 74,600 (105,300) 402,900 (193,900) 174,300 (118,500)<br />
TOTAL REVENUES 4,904,075 3,226,944 2,843,300 2,975,186 2,703,589 3,023,600 2,908,700 3,459,900 2,932,100 3,355,300 3,130,500<br />
EXPENSES:<br />
Hope VI - Debt Service 556,061<br />
Landscape / Pedestrian Enhancements:<br />
MLK - Memorial to 10th St. 4,934<br />
10th St. - Providence Rd. to N. Fla. Ave 100,000 100,000<br />
Providence Rd. - 10th St. to Alameda Dr. 100,000 100,000<br />
Massachusetts Improvements - In Town Bypas 100,000 500,000<br />
Parker Street 3-lane conversion 800,000<br />
Other Pedestrian Enhancements 100,000 100,000 100,000 100,000 100,000<br />
Landscaping Maint by Other <strong>City</strong> Departments 19,000 10,000 11,000 12,000 13,000 14,000 15,000 16,000 17,000 18,000 19,000<br />
Model Blocks:<br />
N. Lake Wire - land acquisition 750,000 500,000<br />
Northwest - land acquisition 1,000,000 750,000<br />
Parker St. - land acquisition 675,552 1,250,000 500,000<br />
Webster Park South - land acquisition 1,250,000 500,000<br />
Other Model Blocks 50,000 50,000 50,000 50,000 50,000 100,000 100,000 100,000 100,000 1,000,000 750,000<br />
F – 21
MID-TOWN COMMUNITY REDEVELOPMENT AREA<br />
CAPITAL IMPROVEMENT PLAN<br />
ADJUSTED<br />
2007 <strong>2008</strong> 2009 2010 2011 2012 2013 2014 2015 2016 2017<br />
BUDGET PROPOSED PROJECTED PROJECTED PROJECTED PROJECTED PROJECTED PROJECTED PROJECTED PROJECTED PROJECTED<br />
Residential Buffers:<br />
Lakeshore interface w/ <strong>Lakeland</strong> Hills Blvd. 100,000<br />
N. Lake Wire interface w/ N. Fla. Ave. 100,000 30,000<br />
Kathleen Rd. - Memorial to I-4 100,000 50,000<br />
Other Residential Buffering 115,000 120,000 120,000 120,000 120,000<br />
Corridor Enhancements:<br />
US 98 / N. Fla. Ave. - Memorial to Griffin Road 78,421 300,000<br />
Other Corridor Enhancements TEAM BRICK 100,000 100,000 102,000 104,000 106,000 108,000 110,000 112,000 114,000 116,000 118,000<br />
MLK - Myrtle to Memorial (FDOT 50/50 Grant) 398,018<br />
Miscellaneous:<br />
Operating Expenses / Pr<strong>of</strong>essional Services 103,900 133,200 140,300 147,400 154,500 162,600 170,700 178,900 188,100 197,300 207,500<br />
Small Project Assistance 46,687 50,000 50,000 50,000 50,000 50,000 50,000 75,000 75,000 75,000 75,000<br />
Owner-Occupant Acquisition and Relocation Pr 403,200 200,000 200,000 200,000<br />
Project Manager Workstation & Equipment 20,000<br />
Commercial Project 200,000 200,000 300,000 500,000 500,000 500,000<br />
Transfer to General Fund / Actual Staff 88,000 133,744 140,000 147,000 154,000 162,000 170,000 179,000 188,000 197,000 207,000<br />
Anticipated Personnel 82,133 34,786 26,089 27,000 28,000 29,000 30,000 32,000 34,000<br />
Metro <strong>Lakeland</strong> Community Housing Strategy - 750,000 500,000 500,000 500,000 500,000 500,000 500,000 500,000 500,000 500,000<br />
Residential Redevelopment Debt Service 1,040,000<br />
Residential Redevelopment 67,515<br />
Residential Redevelopment Property Mgmt 220,654 200,000 200,000 200,000 200,000 200,000 200,000 200,000 200,000 200,000 200,000<br />
Infill Downpayment Assistance 150,000 250,000 250,000 250,000<br />
Infill Construction Incentive 300,000 300,000 300,000 300,000 300,000 300,000 300,000 300,000 300,000<br />
TOTAL EXPENSES 4,904,075 3,226,944 2,843,300 2,975,186 2,703,589 3,023,600 2,908,700 3,459,900 2,932,100 3,355,300 3,130,500<br />
UNAPPROPRIATED SURPLUS:<br />
Beginning Balance 2,480,843 1,017,571 580,627 581,327 504,141 764,552 689,952 795,252 392,352 586,252 411,952<br />
Sources / (Uses) (1,463,272) (436,944) 700 (77,186) 260,411 (74,600) 105,300 (402,900) 193,900 (174,300) 118,500<br />
Ending Balance 1,017,571 580,627 581,327 504,141 764,552 689,952 795,252 392,352 586,252 411,952 530,452<br />
F – 22
DIXIELAND COMMUNITY REDEVELOPMENT AREA<br />
CAPITAL IMPROVEMENT PLAN<br />
ADJUSTED<br />
2007 <strong>2008</strong> 2009 2010 2011 2012 2013 2014 2015 2016 2017<br />
BUDGET PROPOSED PROJECTED PROJECTED PROJECTED PROJECTED PROJECTED PROJECTED PROJECTED PROJECTED PROJECTED<br />
REVENUES:<br />
Tax Increment 283,542 250,000 255,000 260,000 265,000 270,000 275,000 281,000 287,000 293,000 299,000<br />
Internal Loan - Corridor Beautification 300,000 200,000<br />
Interest Income 12,000 5,000 3,400 2,500 1,900 1,200 1,000 1,000 1,000 1,000 2,000<br />
Unappropriated Surplus (57,872) 179,900 44,185 21,585 17,185 17,885 13,085 2,085 (3,465) (449) (27,915)<br />
TOTAL REVENUES 537,670 434,900 502,585 284,085 284,085 289,085 289,085 284,085 284,535 293,551 273,085<br />
EXPENSES:<br />
Façade Improvement Program:<br />
Small Project Assistance - Façade Impr. 55,500 75,000 50,000 50,000 50,000 50,000 50,000 50,000 50,000 50,000 50,000<br />
Design Assistance 35,000 20,000 20,000 20,000 20,000 20,000 20,000 20,000 20,000 20,000 20,000<br />
Parking and Access Program 50,000 50,000 50,000 50,000 50,000 50,000 50,000 50,000 50,000 50,000<br />
Corridor Improvements:<br />
Engineering and Architectural Design 45,000<br />
Debt Service - Corridor Imp. (Pays <strong>of</strong>f in 2015) 64,400 43,000 43,000 43,000 43,000 43,000 43,000 43,000 21,466<br />
Medians and Gateway Features - Construction 15,000 200,000<br />
Debt Service II - Corridor Imp (Paid in '17) 29,085 29,085 29,085 29,085 29,085 29,085 29,085 29,085 29,085<br />
Alley Improvements 53,500 150,000 75,000 50,000 50,000 50,000 50,000 50,000 50,000 75,000 75,000<br />
SR 37 Stormwater Improvements 345,000<br />
Miscellaneous:<br />
Maintenance 5,000 2,500 2,500 2,500 2,500 2,500 2,500 2,500 2,500<br />
Operating Expenses / Pr<strong>of</strong>essional Services 16,872 15,000 20,000 15,000 15,000 20,000 20,000 15,000 15,000 20,000 20,000<br />
Meeting Supplies 128 500 500 500 500 500 500 500 500 500 500<br />
Anticipated Personnel 11,670 9,000 9,000 9,000 9,000 9,000 9,450 10,000 11,000<br />
Enhancements 10,000 10,000 10,000 10,000 10,000 10,000 10,000 10,000 10,000 10,000<br />
Publications and Promotions 5,000 5,000 5,000 5,000 5,000 5,000 5,000 5,000 5,000 5,000<br />
TOTAL EXPENSES 537,670 434,900 502,585 284,085 284,085 289,085 289,085 284,085 284,535 293,551 273,085<br />
UNAPPROPRIATED SURPLUS:<br />
Beginning Balance 253,833 311,705 131,805 87,620 66,034 48,849 30,964 17,878 15,793 19,258 19,706<br />
Sources / (Uses) 57,872 (179,900) (44,185) (21,585) (17,185) (17,885) (13,085) (2,085) 3,465 449 27,915<br />
Ending Balance 311,705 131,805 87,620 66,034 48,849 30,964 17,878 15,793 19,258 19,706 47,621<br />
F – 23
PARKING<br />
CAPITAL IMPROVEMENT PLAN<br />
ADJUSTED<br />
2007 <strong>2008</strong> 2009 2010 2011 2012 2013 2014 2015 2016 2017<br />
BUDGET PROPOSED PROJECTED PROJECTED PROJECTED PROJECTED PROJECTED PROJECTED PROJECTED PROJECTED PROJECTED<br />
REVENUES:<br />
Transfer from Transportation Fund:<br />
Orange Street Garage 270,000 130,000<br />
Main Street Garage 35,000 180,000 72,500<br />
Parking Lots 16,400<br />
Radio System Expansion - Public Safety 735<br />
Debt service - Verizon property purchase 88,933 88,933 88,933 88,933 88,933 88,933 44,752<br />
Miscellaneous Projects 55,500<br />
Sale <strong>of</strong> Old Fire Station Parking Lot 750,000<br />
TOTAL REVENUES 180,168 555,333 838,933 218,933 161,433 88,933 44,752<br />
EXPENSES:<br />
Orange Street Garage:<br />
Deck Coating 270,000<br />
Exterior Coating 130,000<br />
Main Street Garage:<br />
Exterior Coating 72,500<br />
Security Camera 24,000<br />
Deck Coating 160,000<br />
Garage Lighting 11,000<br />
Gate Replacement 20,000<br />
Parking Lots:<br />
Multi Space Parking Meters 24,000 16,400<br />
Munn Park Parking Lot Resurfacing 13,500<br />
Verizon Property:<br />
Debt service - Verizon property purchase 88,933 88,933 88,933 88,933 88,933 88,933 44,752<br />
Pay by Space Machines:<br />
Installation 18,000<br />
Radio System Expansion - Public Safety 735<br />
TOTAL EXPENSES 180,168 555,333 88,933 218,933 161,433 88,933 44,752<br />
UNAPPROPRIATED SURPLUS 750,000 750,000 750,000 750,000 750,000 750,000 750,000 750,000 750,000<br />
F – 24
THE LAKELAND CENTER<br />
CAPITAL IMPROVEMENT PLAN<br />
ADJUSTED<br />
2007 <strong>2008</strong> 2009 2010 2011 2012 2013 2014 2015 2016 2017<br />
BUDGET PROPOSED PROJECTED PROJECTED PROJECTED PROJECTED PROJECTED PROJECTED PROJECTED PROJECTED PROJECTED<br />
REVENUES:<br />
Capital Transfer from PIF 545,164 750,000 350,000 350,000 350,000 350,000 350,000 350,000 350,000 350,000 350,000<br />
Contributions from Publix - Arena Improvements 50,000 50,000 50,000<br />
Unappropriated Surplus (Used)/Generated 100,000 (100,000) 65,000 19,400 1,900 (32,500) (80,500) (96,500) 3,000 68,000<br />
TOTAL REVENUES 695,164 700,000 465,000 369,400 351,900 317,500 269,500 253,500 353,000 418,000 350,000<br />
EXPENSES:<br />
Air Handler Replacement 20,041<br />
Renovate Sound Systems in Arena & Theater 250,000<br />
Arena Lighting 50,000<br />
Electric Powered Golf Carts 14,419 10,000 15,000<br />
Replacement Tables & Fixtures 20,000 27,500 17,500 17,500 17,500 18,000 18,000<br />
Cooling Towers 180,000<br />
Timekeeping S<strong>of</strong>tware Replacement 5,504<br />
Arena Improvements - FHSAA 150,000<br />
Electronic Gate Operator for Parking Lots 5,200 20,000<br />
Exhibit Hall and Sikes Hall wall coverings 50,000<br />
Replace Forklifts 27,000 27,000<br />
Upgrade CCTV System 65,000<br />
Riser Replacement (Meeting Room Risers) 28,000<br />
Commercial Washer/Dryer Replacement 15,000 16,000<br />
PO&M Equipment Storage Unit 40,000<br />
Resurfacing <strong>of</strong> all parking lots 350,000 350,000<br />
Repainting <strong>of</strong> facility exterior 75,000 75,000 75,000 250,000<br />
AV Equipment Upgrades and/or Purchases 20,000 20,000 20,000<br />
Ticket Master system replacement 40,000<br />
Application Server Replacement 20,000 20,000<br />
Ro<strong>of</strong> Replacements 274,400 274,400 300,000 150,000<br />
Headset Intercom System 30,000<br />
Administration Office Space 75,000<br />
Carpet Replacement 200,000 200,000<br />
<strong>Lakeland</strong> Center Carpet replacement 100,000 150,000 350,000<br />
TOTAL EXPENSES 695,164 700,000 465,000 369,400 351,900 317,500 269,500 253,500 353,000 418,000 350,000<br />
Capital Surplus 100,000 35,000 15,600 13,700 46,200 126,700 223,200 220,200 152,200 152,200<br />
F – 25
LAKELAND LINDER REGIONAL AIRPORT<br />
CAPITAL IMPROVEMENT PLAN<br />
ADJUSTED<br />
2007 <strong>2008</strong> 2009 2010 2011 2012 2013 2014 2015 2016 2017<br />
BUDGET PROPOSED PROJECTED PROJECTED PROJECTED PROJECTED PROJECTED PROJECTED PROJECTED PROJECTED PROJECTED<br />
REVENUES:<br />
FAA Grants 125,080 180,000<br />
FDOT Grants 673,094 400,000 10,000 400,000 357,000 1,000,000<br />
Unappropriated Surplus Used / (Generated) 2,680,714 367,921 508,671 345,779 582,156 740,071 487,266 479,719 476,990 474,298 471,643<br />
TOTAL CAPITAL REVENUES 3,478,888 767,921 698,671 745,779 939,156 1,740,071 487,266 479,719 476,990 474,298 471,643<br />
EXPENSES:<br />
Install Perimeter Fencing & Gates 59,319<br />
3131 Flightline - HVAC 134,000<br />
ARFF Truck 750,000<br />
Radio System Expansion - Transfer to IT 4,778 4,778 4,778 4,778 4,778 4,778 4,778<br />
Drainage Maintenance-Ditches 61,073 35,000 35,000 35,000 35,000 35,000 35,000 35,000 35,000 35,000 35,000<br />
Ditch Spraying 5,000 5,000 5,000 5,000 5,000 5,000 5,000 5,000 5,000 5,000 5,000<br />
FAA Airport Grant (Hurricane) Contr. Svcs 56,793<br />
FDOT-2004 Hurricane - Contractual Svcs. 23,061<br />
Airfield Security and Access Control 15,000 15,450 15,900 16,390 16,880 17,390 17,910 18,445 19,000 19,570 20,155<br />
FDOT - Airport Security Plan<br />
Renovate Tower Bldg for ARFF & Firefighters 75,000<br />
Construct ATC Facility Site Study 40,000<br />
Door/Gates Access Control System - Phase 1 68,000<br />
Door/Gates Access Control System - Phase 2 156,250<br />
Door/Gates Access Control System - Phase 3 110,000<br />
Equipment 17,000 15,500 5,000 5,000 5,000 5,000 5,000 5,000 5,000 5,000 5,000<br />
Rehab South Apron 250,000 1,250,000<br />
Safety & Compliance Training-Contractual Svcs 1,000 1,000 1,000 1,000 1,000 1,000 1,000 1,000 1,000 1,000 1,000<br />
Environmental Mitigation-Contractual Svcs. 3,600 3,600 3,600 3,600 3,600 3,600 3,600 3,600 3,600 3,600 3,600<br />
Advertising / Promotions 50,000 50,000 50,000 50,000 50,000 50,000 50,000 50,000 50,000 50,000 50,000<br />
FEMA-Tenant-Contractual Svcs. 383,818<br />
F – 26
LAKELAND LINDER REGIONAL AIRPORT<br />
CAPITAL IMPROVEMENT PLAN<br />
ADJUSTED<br />
2007 <strong>2008</strong> 2009 2010 2011 2012 2013 2014 2015 2016 2017<br />
BUDGET PROPOSED PROJECTED PROJECTED PROJECTED PROJECTED PROJECTED PROJECTED PROJECTED PROJECTED PROJECTED<br />
Airport Maintenance-Sun 'N Fun 25,000 25,000 25,000 25,000 25,000 25,000 25,000 25,000 25,000 25,000 25,000<br />
Airfield Pavement Maintenance 139,816 50,000 50,000 50,000 50,000 50,000 50,000 50,000 50,000 50,000 50,000<br />
Misc. Maintenance Projects 31,588 25,000 25,000 25,000 25,000 25,000 25,000 25,000 25,000 25,000 25,000<br />
Maint. - Top Gun 2,600 2,600 2,600 2,600 2,600 2,600 2,600 2,600 2,600 2,600 2,600<br />
Runway Markings Maintenance 20,000 20,000 20,600 21,218 21,855 22,510 23,185 23,881 24,597 25,335 26,095<br />
Reglaze & Recaulk Windows & Doors - 3200 Fli 75,000<br />
Deforestation - Runway 9 Approach 30,000<br />
Building Repairs - Everett 48,000<br />
Airport Entrance Sign 15,000<br />
Fire System Repair - 3131 Flightline Dr. 30,000<br />
Runway 5:<br />
Rehab Runway 5/23 73,696<br />
Paint Runway 5/23 & 9/27 30,012<br />
Property Acquisition:<br />
Land Acquisition West <strong>of</strong> Airport 658,696<br />
Terminal:<br />
Terminal Construction 156,094 152,093 148,093 144,093 140,093 136,093 132,093 128,093 124,093 120,093 116,093<br />
Hangar:<br />
T-Painting/Repair 20,300 10,000 10,000 10,000 10,000 10,000 10,000 10,000 10,000 10,000 10,000<br />
Maintenance Program 7,887 5,000 5,000 5,000 5,000 5,000 5,000 5,000 5,000 5,000 5,000<br />
Door Repairs 3,000 23,000 3,000 3,000 3,000 3,000 3,000 3,000 3,000 3,000 3,000<br />
Tower:<br />
Tower Repairs 4,625 1,500 1,500 1,500 1,500 1,500 1,500 1,500 1,500 1,500 1,500<br />
Airside:<br />
LAC - Assembly Bldg. Improvements<br />
LAC Fire Sprinkler Upgrade 30,000 10,000<br />
LAC Fire System Maintenance 36,500 21,300 21,500 21,500 21,500 21,500 21,500 21,500 21,500 21,500 21,500<br />
Buildout Contingency 73,365 50,000 50,000 50,000 50,000 50,000 50,000 50,000 50,000 50,000 50,000<br />
Ro<strong>of</strong> over for LAC R&D building 8,000<br />
Hangar 3 Ro<strong>of</strong> Replacement 75,200<br />
Repair <strong>of</strong> Fixtures 12,022 12,500 9,500 9,500 9,500 9,500 9,500 9,500 9,500 9,500 9,500<br />
Maint. Piedmont Hawthorne Facility 1,000 1,000 1,000 1,000 1,000 1,000 1,000 1,000 1,000 1,000 1,000<br />
Maint. Tony's Airside Restaurant 1,000 1,000 1,000 1,000 1,000 1,000 1,000 1,000 1,000 1,000 1,000<br />
Maint. Europa Facility 500 500 500 500 500 500 500 500 500 500 500<br />
Maint. Renaisance Facility 500 500 500 500 500 500 500 500 500 500 500<br />
Maint. Air Service Facility 1,600 1,600 1,600 1,600 1,600 1,600 1,600 1,600 1,600 1,600 1,600<br />
Maint. AET LLC Facility 1,000 1,000 1,000 1,000 1,000 1,000 1,000 1,000 1,000 1,000 1,000<br />
Maint. Air Logic Solutions Facility 1,000 1,000 1,000 1,000 1,000 1,000 1,000 1,000 1,000 1,000 1,000<br />
Maint. S&S Devel. Facility 15,050<br />
Pneumatic Controls Repair-S&S Dev. Facility 17,635<br />
Press. Wash/Paint- Old Geico Bldg. 25,000<br />
F – 27
LAKELAND LINDER REGIONAL AIRPORT<br />
CAPITAL IMPROVEMENT PLAN<br />
ADJUSTED<br />
2007 <strong>2008</strong> 2009 2010 2011 2012 2013 2014 2015 2016 2017<br />
BUDGET PROPOSED PROJECTED PROJECTED PROJECTED PROJECTED PROJECTED PROJECTED PROJECTED PROJECTED PROJECTED<br />
Capital Costs - Airpark Land Sale:<br />
LAC Fire Suppression System Pump 135,000<br />
Install Electric Submeters 15,000 25,000<br />
KEISER College Tenant Buildout Payback 108,760<br />
Acquire Airfield Sweeper Truck 180,000<br />
Airport Master Plan Update 200,000<br />
TOTAL CAPITAL EXPENSES 3,478,888 767,921 698,671 745,779 939,156 1,740,071 487,266 479,719 476,990 474,298 471,643<br />
UNAPPROPRIATED SURPLUS:<br />
Beginning Balance 4,606,449 2,077,826 1,510,199 1,143,305 1,133,652 597,760 260,731 212,422 173,576 219,034 499,039<br />
Sources / (Uses) - Capital (2,680,714) (367,921) (508,671) (345,779) (582,156) (740,071) (487,266) (479,719) (476,990) (474,298) (471,643)<br />
Sources / (Uses) - Operating 152,091 (199,706) 141,777 336,126 46,264 403,042 438,957 440,874 522,449 754,303 1,293,288<br />
Ending Balance - Capital 2,229,978 2,229,978 2,229,978 2,229,978 2,229,978 2,229,978 2,229,978 2,229,978 2,229,978 2,229,978 2,229,978<br />
Ending Balance - Operating (152,152) (719,779) (1,086,673) (1,096,326) (1,632,218) (1,969,247) (2,017,556) (2,056,402) (2,010,944) (1,730,939) (909,295)<br />
Ending Balance - TOTAL 2,077,826 1,510,199 1,143,305 1,133,652 597,760 260,731 212,422 173,576 219,034 499,039 1,320,683<br />
F – 28
REVENUES:<br />
Transfer from Int Loan Fund 165,000<br />
SOLID WASTE MANAGEMENT FUND<br />
CAPITAL IMPROVEMENT PLAN<br />
ADJUSTED<br />
2007 <strong>2008</strong> 2009 2010 2011 2012 2013 2014 2015 2016 2017<br />
BUDGET PROPOSED PROJECTED PROJECTED PROJECTED PROJECTED PROJECTED PROJECTED PROJECTED PROJECTED PROJECTED<br />
TOTAL REVENUES 165,000<br />
EXPENSES:<br />
Wash Bay Rennovation 20,000<br />
Shelving and Flooring 1,200<br />
Ice Machine Covers 2,400<br />
Recyclable Materials Processing Facility 25,185 25,185 12,706<br />
Radio System Expansion-Public Safety 16,173 16,173 16,173 16,173 16,173 16,173<br />
Solid Waste rear-packing trucks 54,581 54,581 40,965<br />
Solid Waste rear-packing trucks - 07 225,039 60,039 60,023<br />
Replace Overhead Door 3,900<br />
Wash Bay Repairs and Truck Wash System 300,000<br />
Replace Main A/C Unit for Solid Waste Bldg 6,000<br />
Route Smart S<strong>of</strong>tware 75,000<br />
TOTAL EXPENSES 344,578 540,878 129,867 16,173 16,173 16,173<br />
F – 29
STORMWATER<br />
CAPITAL IMPROVEMENT PLAN<br />
ADJUSTED<br />
2007 <strong>2008</strong> 2009 2010 2011 2012 2013 2014 2015 2016 2017<br />
BUDGET PROPOSED PROJECTED PROJECTED PROJECTED PROJECTED PROJECTED PROJECTED PROJECTED PROJECTED PROJECTED<br />
REVENUES:<br />
Stormwater Utility Revenues-Commercial 638,000 1,526,850 1,542,000 1,557,000 1,573,000 1,589,000 1,605,000 1,621,000 1,637,000 1,653,000 1,670,000<br />
Stormwater Utility Revenues-Residential 746,000 1,720,350 1,738,000 1,755,000 1,773,000 1,791,000 1,809,000 1,827,000 1,845,000 1,863,000 1,882,000<br />
Transfer from Transportation Fund 1,205,000<br />
Stormwater Fees-Interfund 29,067 68,396 69,080 69,771 70,468 71,173 71,885 72,604 73,330 74,063 74,804<br />
SWFWMD Grants:<br />
Lk. Hollingsworth Westside 189,216<br />
Lk. Parker - SW Basin BMPs 470,250 470,250<br />
Lk. Parker - SW Basin BMPs 336,725 336,725<br />
Lk. Morton Shoreline Imp. 5,459<br />
Lk. Gibson SW Basin Design 75,000 562,500 562,500 562,500<br />
SOF/DEM Grants:<br />
N <strong>Lakeland</strong> Drainage Basin A 83,873 545,127<br />
N <strong>Lakeland</strong> Drainage Basin B 8,456 47,777<br />
N <strong>Lakeland</strong> Drainage Basin C 144,786 781,844<br />
N <strong>Lakeland</strong> Drainage Basin D 3,047 17,219<br />
FDEP Grants:<br />
Urban Restoration Initiative 250,000 250,000<br />
Investments & Earnings 75,000 100,830 106,940 108,328 110,891 111,891 111,344 119,236 117,358 122,200 127,559<br />
Unappropriated Surplus 3,122,566 (170,844) (14,267) (51,438) 646 52,261 (229,093) 96,609 (127,405) (142,612) (134,791)<br />
TOTAL REVENUES 6,912,195 5,920,299 4,811,227 4,001,161 3,528,005 3,615,326 3,368,135 3,736,449 3,545,283 3,569,651 3,619,571<br />
EXPENSES:<br />
Stormwater Projects 5,102,127 2,699,342 3,976,227 2,616,161 1,888,005 1,805,326 1,823,135 2,241,449 2,560,283 2,584,651 2,609,571<br />
Drainage Projects 1,382,794 2,940,957 555,000 1,105,000 1,335,000 1,505,000 1,235,000 1,185,000 675,000 675,000 675,000<br />
Lakes and Environmental Projects 427,274 280,000 280,000 280,000 305,000 305,000 310,000 310,000 310,000 310,000 335,000<br />
TOTAL EXPENSES 6,912,195 5,920,299 4,811,227 4,001,161 3,528,005 3,615,326 3,368,135 3,736,449 3,545,283 3,569,651 3,619,571<br />
UNAPPROPRIATED SURPLUS:<br />
Beginning Balance 3,236,375 113,809 284,653 298,921 350,358 349,712 297,451 526,544 429,935 557,340 699,952<br />
Sources / (Uses) (3,122,566) 170,844 14,267 51,438 (646) (52,261) 229,093 (96,609) 127,405 142,612 134,791<br />
Ending Balance 113,809 284,653 298,921 350,358 349,712 297,451 526,544 429,935 557,340 699,952 834,743<br />
F – 30
STORMWATER<br />
CAPITAL IMPROVEMENT PLAN<br />
ADJUSTED<br />
2007 <strong>2008</strong> 2009 2010 2011 2012 2013 2014 2015 2016 2017<br />
BUDGET PROPOSED PROJECTED PROJECTED PROJECTED PROJECTED PROJECTED PROJECTED PROJECTED PROJECTED PROJECTED<br />
STORMWATER PROJECTS<br />
Lake Bonny:<br />
Diagnostic Study 150,000<br />
Watershed Management Projects 250,000 750,000 750,000 750,000 750,000<br />
Lake Gibson:<br />
Southwest Basin Retr<strong>of</strong>it 520,106 187,500 375,000<br />
Watershed Mgmt Plan and Projects 250,000<br />
Lk Gibson SW Basin-Design 150,000 1,125,000 1,125,000 1,125,000<br />
FDEP-Urban Restroration Initiative 500,000<br />
Lake Hollingsworth:<br />
W Hollingsworth Stormwater Retr<strong>of</strong>it 905,982<br />
South Shoreline Erosion Repair 100,000<br />
Hunter\BeulahWire Watershed:<br />
Watershed Mgmt Plan and Projects 150,000 300,000 300,000 900,000 900,000 900,000<br />
Lake Morton:<br />
Shoreline Improvements 154,550<br />
Lake Parker:<br />
Lk Parker SW Basin BMPs 786,964 673,450<br />
Lk Parker SW Basin BMPs 200,000 940,500 940,500<br />
Shoreline Erosion Control 49,854<br />
TMDL Project - W/Q Treatment 300,000 1,100,000 1,100,000 1,100,000<br />
North Lkld Stormwater Master Plan 982,703<br />
Lake Parker BMAP 50,000 100,000<br />
Lake John:<br />
Erosion Control 31,178<br />
Miscellaneous:<br />
Stormwater O&M 216,180 497,842 512,777 528,161 544,005 560,326 577,135 594,449 612,283 630,651 649,571<br />
Repair and Maintenance <strong>of</strong> PCD's 100,001 86,000 87,000 88,000 94,000 95,000 96,000 97,000 98,000 104,000 110,000<br />
Highlands Hills Ditch Maint & Repairs 250,000<br />
Flood Control Automation Study 50,000 50,000 200,000 200,000<br />
Water Quality Instrumentation 16,000<br />
Lakes & Stormwater Move 178,177<br />
Undesignated Equipment Leases 10,432<br />
TOTAL STORMWATER PROJECTS 5,102,127 2,699,342 3,976,227 2,616,161 1,888,005 1,805,326 1,823,135 2,241,449 2,560,283 2,584,651 2,609,571<br />
F – 31
STORMWATER<br />
CAPITAL IMPROVEMENT PLAN<br />
ADJUSTED<br />
2007 <strong>2008</strong> 2009 2010 2011 2012 2013 2014 2015 2016 2017<br />
BUDGET PROPOSED PROJECTED PROJECTED PROJECTED PROJECTED PROJECTED PROJECTED PROJECTED PROJECTED PROJECTED<br />
DRAINAGE PROJECTS:<br />
Storm Sewer Inventory 30,000 30,000 30,000 30,000 30,000 30,000 30,000 30,000 30,000 30,000 30,000<br />
TV & Cleaning Storm Drainage 171,738 125,000 125,000 150,000 150,000 150,000 150,000 150,000 175,000 175,000 175,000<br />
Maint & Retr<strong>of</strong>it <strong>of</strong> Drainage Facilities 275,000 275,000 275,000 300,000 300,000 300,000 300,000 300,000 325,000 325,000 325,000<br />
Drainage Study:<br />
Park Drive @ Atlanta Ave 5,953<br />
Pinewood Avenue 50,000<br />
Lakeside Hills Estate Underdrain 46,680<br />
Meadows Subdivision Underdrain 5,681<br />
Kathryn Avenue Underdrain 6,666<br />
Shore Acre Subdivision (Fern Road) 250,000 520,000 420,000<br />
Camphor Drive Area Drainage Impr 33,190<br />
Street Sweeping Disposal 105,000 105,000 125,000 125,000 125,000 135,000 135,000 135,000 145,000 145,000 145,000<br />
N Lake Parker Ave Drainage Imp 40,000<br />
Portable TV Inspection System 42,670<br />
SOF/DEM N <strong>Lakeland</strong> Drainage Basin A 111,830 726,836<br />
SOF/DEM N <strong>Lakeland</strong> Drainage Basin B 11,275 63,703<br />
SOF/DEM N <strong>Lakeland</strong> Drainage Basin C 193,048 1,042,459<br />
SOF/DEM N <strong>Lakeland</strong> Drainage Basin D 4,063 22,959<br />
Curran St Stormwater Retr<strong>of</strong>it 25,000 160,000<br />
Morgan Avenue Outfall Pipe 450,000<br />
Mass Ave. & Plum St. Stormsewer Retro 100,000 500,000<br />
Wayman St. Ditch Repairs 50,000 500,000<br />
Deter Pit Retr<strong>of</strong>it 30,000 200,000<br />
Allamanda Street and Horney Park Pump Retr 40,000 230,000<br />
Ruby Street in Lake Hunter Terrace 15,000 40,000<br />
East Highland Dr./Nunnswood Lane 50,000 250,000<br />
Lake John - Sommerset Weir Retr<strong>of</strong>it 30,000 150,000<br />
Charnes Drive 100,000<br />
TOTAL DRAINAGE PROJECTS 1,382,794 2,940,957 555,000 1,105,000 1,335,000 1,505,000 1,235,000 1,185,000 675,000 675,000 675,000<br />
LAKES AND ENVIRONMENTAL PROJECTS:<br />
Contribution to LEAD 25,000 25,000 25,000 25,000 25,000 25,000 25,000 25,000 25,000 25,000 25,000<br />
Lake Improvement Projects 372,274 225,000 225,000 225,000 250,000 250,000 250,000 250,000 250,000 250,000 275,000<br />
Public Education Programs 30,000 30,000 30,000 30,000 30,000 30,000 35,000 35,000 35,000 35,000 35,000<br />
TOTAL LAKES AND ENV. PROJECTS 427,274 280,000 280,000 280,000 305,000 305,000 310,000 310,000 310,000 310,000 335,000<br />
TOTAL EXPENSES 6,912,195 5,920,299 4,811,227 4,001,161 3,528,005 3,615,326 3,368,135 3,736,449 3,545,283 3,569,651 3,619,571<br />
F – 32
OAK HILL CEMETERY FUND<br />
CAPITAL IMPROVEMENT PLAN<br />
ADJUSTED<br />
2007 <strong>2008</strong> 2009 2010 2011 2012 2013 2014 2015 2016 2017<br />
BUDGET PROPOSED PROJECTED PROJECTED PROJECTED PROJECTED PROJECTED PROJECTED PROJECTED PROJECTED PROJECTED<br />
REVENUES:<br />
Interest Income 4,408 4,424 3,073 3,001 2,633 1,932 3,225 4,576 2,388 3,476 4,614<br />
Transfer from Public Improvement Fund 140,000 100,000 30,000 35,000 35,000 30,000 30,000 50,000 25,000 25,000 25,000<br />
Unappropriated Surplus (408) 33,776 10,127 8,199 15,567 (28,732) (30,025) 48,624 (24,188) (25,276) (26,414)<br />
TOTAL REVENUES 144,000 138,200 43,200 46,200 53,200 3,200 3,200 103,200 3,200 3,200 3,200<br />
EXPENSES:<br />
Routine Maintenance 3,000 3,200 3,200 3,200 3,200 3,200 3,200 3,200 3,200 3,200 3,200<br />
Roselawn Maintenance Building Upgrade 25,000<br />
Oak Hill Expansion Phase II 25,000<br />
Oak Hill Expansion Phase III 40,000<br />
Oak Hill Expansion Phase IV 25,000<br />
Oak Hill Expansion Phase V 50,000<br />
Roselawn Irrigation 40,000<br />
Oak Hill Irrigation Upgrade 100,000<br />
Resurface Roadways 75,000 110,000<br />
Oakhill Equipment Storage Area and Bay 1,000<br />
48 Niche Collumbarium 18,000<br />
TOTAL EXPENSES 144,000 138,200 43,200 46,200 53,200 3,200 3,200 103,200 3,200 3,200 3,200<br />
UNAPPROPRIATED SURPLUS:<br />
Beginning Balance 110,195 110,603 76,827 66,700 58,501 42,934 71,666 101,691 53,067 77,255 102,532<br />
Sources / (Uses) 408 (33,776) (10,127) (8,199) (15,567) 28,732 30,025 (48,624) 24,188 25,276 26,414<br />
Ending Balance 110,603 76,827 66,700 58,501 42,934 71,666 101,691 53,067 77,255 102,532 128,946<br />
F – 33
WASTEWATER UTILITY<br />
CAPITAL IMPROVEMENT PLAN<br />
ADJUSTED<br />
2007 <strong>2008</strong> 2009 2010 2011 2012 2013 2014 2015 2016 2017<br />
BUDGET PROPOSED PROJECTED PROJECTED PROJECTED PROJECTED PROJECTED PROJECTED PROJECTED PROJECTED PROJECTED<br />
REVENUES:<br />
Impact Fee Collections 1,327,736 1,362,736 1,252,736 1,562,736 1,252,736 2,052,736 1,332,736 1,417,736 1,252,736 230,000 200,000<br />
SRL Debt Service - Impact Fees 111,498 1,480,000 1,480,000 1,695,000 1,695,000 1,695,000 1,695,000 1,695,000 1,695,000 1,695,000<br />
Transfer from Operations-R&R 2,489,240 2,539,240 2,589,240 2,689,240 2,789,240 2,839,240 2,889,240 2,939,240 2,989,240 2,989,240 2,989,240<br />
Contributions from Developers - R&R 75,000 75,000 75,000 75,000 75,000 75,000 75,000 75,000 75,000 75,000 75,000<br />
Property Assessments - Orangewood 26,500 26,500 26,500 26,500 26,500 26,500 26,500 26,500 26,500 26,500 26,500<br />
Interest Earnings-R&R 65,000 65,000 65,000 65,000 65,000 65,000 65,000 65,000 65,000 65,000 65,000<br />
Interest Earnings-Impact Fees 40,000 40,000 40,000 40,000 40,000 40,000 40,000 40,000 40,000 40,000 40,000<br />
Proceeds from East-West Connector Project 400,000<br />
Grant Proceeds-Skyview Utilities 1,500,000<br />
Proceeds from Issuance <strong>of</strong> LT Debt 34,646,112 14,900,000 15,000,000 30,000 25,250,000<br />
Unappropriated Surplus 7,619,341 328,309 (68,891) (308,891) 16,109 (203,891) (258,891) (48,740) 46,260 (123,740) 191,260<br />
TOTAL REVENUES 47,788,929 19,448,283 5,859,585 5,629,585 5,959,585 21,589,585 5,894,585 6,209,736 6,189,736 30,247,000 5,282,000<br />
EXPENSES:<br />
COLLECTION SYSTEM:<br />
Sewer Maintenance:<br />
Contractor Installed Liners 796,016<br />
Contractor Cleaning & Televising 172,743<br />
<strong>City</strong> Installed Short Liners 75,000<br />
<strong>City</strong> Performed Point Repairs 75,000<br />
Rehabilitation Program 185,000 900,000 950,000 950,000 950,000 1,000,000 1,000,000 1,000,000 1,000,000 1,000,000 1,000,000<br />
Other Construction Projects 70,000 70,000 70,000 70,000 70,000 150,000 250,000 250,000 250,000<br />
Other Replacement Projects 70,000 70,000 70,000 70,000 70,000 150,000 250,000 250,000 250,000<br />
Telemetry System Upgrades 130,495 50,000 50,000 25,000 100,000 100,000 100,000 100,000 100,000 100,000<br />
Relocation Edgewood Dr, Fl Ave to Harden Blvd 80,000<br />
Collection System Monitoring 45,000 45,000<br />
Undesignated Utility Relocations 30,000 50,000 50,000 50,000 50,000 50,000 50,000 50,000 50,000 50,000<br />
Utility Relocates US 92 - Airport Rd. to Intown Bypass 75,000<br />
US 98S - CR 540 to SR 540 Utility Relocations 100,000<br />
Utility Relocation - West Pipkin, Medulla to Harden. 20,000<br />
Southwest Force Main Replacement 400,000<br />
Utility Relocation - US 98 S. Clubhouse to Winter Lake 200,000 250,000<br />
Utility Relocation - SR 563 Parkway to Pipkin 50,000<br />
Utility Relocation - Business 92 Airport Rd to Intown Bypass 50,000 100,000 100,000<br />
Utility Relocation - Knights Station Road 10,000<br />
FEMA Matching Capital 150,000<br />
Candyce Ave. Sewer Replacement 147,576<br />
Intown Bypass Utility Accommodation 647,000<br />
Pipe Lay Down Area 27,000<br />
Utility Relocation - Lakeshore @ Memorial 102,363<br />
DOT Project Griffin Rd. Kathleen Rd. to US.98 772<br />
Main Street Realignment 44,815<br />
Massachussetts Ave @ Memorial Blvd 15,000<br />
US 98 3rd Street to Griffin Road 25,000<br />
F – 34
WASTEWATER UTILITY<br />
CAPITAL IMPROVEMENT PLAN<br />
ADJUSTED<br />
2007 <strong>2008</strong> 2009 2010 2011 2012 2013 2014 2015 2016 2017<br />
BUDGET PROPOSED PROJECTED PROJECTED PROJECTED PROJECTED PROJECTED PROJECTED PROJECTED PROJECTED PROJECTED<br />
CR 540A Utility Relocation 34,849<br />
Orangewood Collection System Acceptance 200,000<br />
US 98 N @ Griffin Road 31,628<br />
Inflow Reduction 101,367<br />
Highlands Monitoring Station 30,000<br />
Lake Hollingsworth Monitoring System 34,000<br />
Memorial Blvd./Wabash Avenue to CSX 30,000<br />
MLK and Tenth Street Utility Relocation 50,000<br />
Lake Parker Ave. Traffic Signals 45,000<br />
Utility Relocation - Lakeshore, Memorial to Bon A 35,000<br />
<strong>Lakeland</strong> Highlands 12" Forcemain 105,083<br />
Beacon Rd @ Lincoln Ave Intersection Imp. 12,670<br />
Sewer Maintenance - Manhole Rehabilitation 30,000<br />
Sun & Fun Discharge Monitor Point 22,000<br />
Rebuild Grinder Pumps 50,000<br />
Northeast Service Area Expansion 715,338<br />
System Capacity Augmentation 447,389<br />
Undesignated Capacity Expansion 100,000 100,000 100,000 100,000 100,000 100,000 100,000 100,000 100,000 100,000<br />
WW Line Oversizing Projects - Developers 100,000 100,000 100,000 100,000 100,000 100,000 100,000 100,000 100,000 100,000 100,000<br />
Florida Treatt 30,843<br />
English Oaks Accommodations [E.O. 1] 8,087<br />
Hampton HIlls Oversizing 168,537<br />
Sewer Extension on Kathleen Rd. 27,665<br />
Sub-total 4,903,236 1,225,000 1,820,000 1,585,000 1,660,000 1,890,000 1,600,000 1,650,000 1,850,000 1,850,000 1,850,000<br />
Pump Stations:<br />
Generator Storage Shed 50,000<br />
Oak Street Pump Station Flow Meter 13,000<br />
Effluent Pump Station Phase II Expansion 8,212<br />
American Cyanamid Emer. Standby Gen. Install 45,000<br />
NE Pump Station Airconditioner Replacement 5,000<br />
Providence Road PS Pump Replacement 20,000<br />
Northside Pump Station Upgrade. 200,000<br />
Interstate Lanes PS Pumps & Panel Upgrade 40,000<br />
Wedgewood PS Pumps & Panel Replacement 40,000<br />
Grasslands Generator 55,000<br />
Generator at Great Oaks Pump Station 45,000<br />
Spring Oaks Pump Station Pump and Panel Replacement 30,000<br />
Bridgefield Pump Station Pumps and Panel Replacement 30,000<br />
Stone Water Pump Station Pumps and Panel Replacemet 30,000<br />
Willow Brook Pump Station Pumps and Panel Replacement 30,000<br />
Highland Fairways Generator 45,000<br />
Carillon Lakes Generator 45,000<br />
F – 35
WASTEWATER UTILITY<br />
CAPITAL IMPROVEMENT PLAN<br />
ADJUSTED<br />
2007 <strong>2008</strong> 2009 2010 2011 2012 2013 2014 2015 2016 2017<br />
BUDGET PROPOSED PROJECTED PROJECTED PROJECTED PROJECTED PROJECTED PROJECTED PROJECTED PROJECTED PROJECTED<br />
<strong>Lakeland</strong> Harbor Pumps and Panel Replacement 40,000<br />
Woodlake Cove Pump Station Pumps and Panel Replacement 40,000<br />
Honey Tree III Pump and Panel Replacement 40,000<br />
West <strong>Lakeland</strong> Pump Station Pump and Panel Replacement 40,000<br />
Crystal Grove Pump Station Generator 50,000<br />
American Cyanamid Pump Station Generator 50,000<br />
Cypress Avaiation Pump and Panel Replacement 30,000<br />
Yankee Place Pumps and Panel Replacement 40,000<br />
Fairway Lakes Pumps and Panel Replacement 40,000<br />
Waterford Pump and Panel Replacement 40,000<br />
Elizabeth Street Pumps and Panel Replacement 40,000<br />
Morris Realty Pump Station 275,000<br />
Replace Emma Street Pump Station 4,042<br />
Waring Road Pump Station Access 15,796<br />
Install Pumps & Generator - Cheverly Station 54,940<br />
NW Pump Station Flow Meter Replacement 3,221 15,000<br />
Villas III Pump Station Upgrade 45,253<br />
Tradewinds Odor Control 15,207<br />
Install Generator - Interstate Lift Station 59,542<br />
Materials Storage Shed 40,000<br />
Air Park Pump Station Panel and Pumps 18,297<br />
Heather Point Pumps and Panel 20,000<br />
Peterson Park Pumps and Panel 30,000<br />
Sandpiper Pumps and Panel 24,000<br />
Interstate Pumps and Panel 40,000<br />
Interstate Bus Park 1 Pump & Panel Rplmt. 50,000<br />
<strong>Lakeland</strong> Harbor Pump Replacement 24,000<br />
Canyon Lakes Pumps & Panel Replacement 30,000<br />
Northeast Pump Station Flow Meter 10,000<br />
Northside Flow Meter Replacement 10,000<br />
Westside Flow Meter 12,568<br />
Yankee Place Generator 61,112<br />
Lakeside Hills Estates PS Pump Replacement 44,000<br />
Interlachen Generator 56,053<br />
SW-Pump & Airpark Upgrade (Eng Oaks II) 200,000<br />
Highway 98 Pump Station Solids 1,747<br />
Lone Palm Generator 55,085<br />
West <strong>Lakeland</strong> Generator 59,615<br />
Lake Gibson Generator 67,579<br />
Bonny Apartements Generator 45,414<br />
Woodlake Cove PS Gen. & Pump Upgrade 40,000<br />
Bentley Pines Pump and Panel Replacement 50,000<br />
Polk Parkway Pump and Panel Replacement 50,000<br />
Highland Hills Pump Station Pump Replacement 50,000<br />
Martins Landing Pumps Replacement 35,000<br />
Mission Lakes Pump Station Pumps Replacement 35,000<br />
F – 36
WASTEWATER UTILITY<br />
CAPITAL IMPROVEMENT PLAN<br />
ADJUSTED<br />
2007 <strong>2008</strong> 2009 2010 2011 2012 2013 2014 2015 2016 2017<br />
BUDGET PROPOSED PROJECTED PROJECTED PROJECTED PROJECTED PROJECTED PROJECTED PROJECTED PROJECTED PROJECTED<br />
Westside Pump Station Pumps Replacement 50,000<br />
Replace Oak Street Pump Station Pumps Replacement 35,000<br />
Upgrade Southwest Pump Station 1,000,000<br />
Upgrade Northeast Pump Station 500,000 500,000<br />
Replace Northside Pumpstation Pumps and Controls 800,000<br />
<strong>Lakeland</strong> Harbor Pump Replacement 31,250<br />
SW Area-Upgrade Existing Pump Stations [E.O. 70,000<br />
West <strong>Lakeland</strong> Business Park Pumps & Panel U 70,000<br />
Highland Hills 3rd. Pump Addition 30,000<br />
Sub-total 1,346,933 143,000 20,000 490,000 150,000 710,000 760,000 990,000 1,305,000<br />
TREATMENT PLANTS:<br />
Glendale:<br />
Glendale CAR 50,000<br />
Replace Reuse Station Gen. & Switch Gear 100,000<br />
Re-Use Basin A Bypass 325,000<br />
Controls 75,000<br />
Replacement <strong>of</strong> Magnetic Flowmeters. 40,000<br />
Chlorine Building Containment 250,000<br />
Repair and Repave Roads 55,000<br />
Facility Painting 250,000<br />
Replacement <strong>of</strong> Scum Pumping Equipment 100,000<br />
Laboratory Atomic Absorption Replacement 75,000<br />
Replacement <strong>of</strong> Clarifier Drive Mechanisms 400,000<br />
Laboratory Fume Hoods Replacement 60,000<br />
Replacement <strong>of</strong> Sludge Pumping Equipment 85,000<br />
Replacement <strong>of</strong> Magnetic Flow Meters 50,000<br />
Plant Painting 250,000<br />
Climber Screen Replacement 120,000<br />
Glendale Controls 100,000<br />
Chlorine Building Containment 300,000<br />
Repair and Repave Service Roads 60,000<br />
Sludge Thickener Upgrade 2,353<br />
Retaining Wall Construction and Landscape 91,205<br />
Replacement <strong>of</strong> Inlet Scrubber 170,255<br />
Glendale Grit System Rehabilitation 41,794<br />
Reuse Pneumatic Valve Controller Replacemen 8,575<br />
Upgrade <strong>of</strong> Intermediate PS Controls 183,628<br />
Laboratory Nutrient Analyzer Replacement 40,000<br />
Glendale Chemical Feed System Installation 35,000<br />
Glendale WWTP - Odor Control Enhancements 60,000<br />
Glendale Primary III Corrosion Control 47,474<br />
Glendale WWTP - Debris Removal 65,000<br />
Glendale WWTP - Replace Primary Scrubber Recirculation Sy 165,000<br />
F – 37
WASTEWATER UTILITY<br />
CAPITAL IMPROVEMENT PLAN<br />
ADJUSTED<br />
2007 <strong>2008</strong> 2009 2010 2011 2012 2013 2014 2015 2016 2017<br />
BUDGET PROPOSED PROJECTED PROJECTED PROJECTED PROJECTED PROJECTED PROJECTED PROJECTED PROJECTED PROJECTED<br />
Glendale Spare Blower 150,000<br />
Glendale Flow Equalization Tank 500,000<br />
Northside Supplemental Odor Control 40,000<br />
Glendale Grit System Replacement 35,000<br />
Glendale Sludge System Modification 75,000<br />
Glendale WWTP - Repair Walker Clarifiers and A 45,000<br />
Glendale Debris Removal From Process Tanks 45,000<br />
Glendale WWTP Odor Control Enhancements Phase II 65,000<br />
Glendale Operator Assistance Program Phase II 25,000<br />
Glendale Replacement <strong>of</strong> Submersible Pumps 250,000<br />
Gas Compressors Cap. Upgrade 2,787<br />
Glendale PSM 2,000<br />
Sludge Storage Capacity Expansion 10,724<br />
Northside:<br />
Northside CAR 50,000<br />
Northside Bypass Pump Station Rehab 175,000<br />
Northside Climber Screen Repairs 250,000<br />
Northside WWTP - Repair Eimco Clarifiers 65,000<br />
Rehab. Of Pretreatment Structure 44,111<br />
Northside WWTP Effluent Pumps Refurbishment 80,000<br />
Northside WWTP Debris Removal from Process Tanks 30,000<br />
Northside Operator Assistance Program Phase II 25,000<br />
Engineering For Plant Expansion 30,000 800,000<br />
Inc. Pump Capacity - Bypass Pump #4 22,981<br />
Second CROM Tank 576,280<br />
Fourth ATAD Tank 885,501<br />
Westside:<br />
West <strong>Lakeland</strong> Wasteload Facility Land Purch 15,180<br />
W. Lklnd Morris Realty Easement 100,000 165,000<br />
Sub-total 2,484,848 775,000 885,000 430,000 235,000 1,350,000 985,000 670,000 400,000<br />
WETLANDS:<br />
Wetlands - Polk County Intertie 882<br />
Tow Drain and Blowers Generators 85,690<br />
Piping <strong>of</strong> Effluent Ditch 150,000<br />
Distribution Ditch Rehabilitation 175,000<br />
Wetlands Berm Clearing 27,840<br />
Building Upgrades 84,150<br />
Mosquito Habitat Abatement 30,000<br />
Replacement <strong>of</strong> Stop Gates 56,000<br />
Wetlands West Boundry Fence 47,469<br />
Wetlands Effluent Monitoring Station Rehab 15,000<br />
Wetlands Northwest Boundary Fence 90,000<br />
Wetlands East Boundary Fence 180,000<br />
Wetlands Discharge Ditch Dredge 200,000<br />
Sub-total 276,031 71,000 90,000 330,000 375,000<br />
F – 38
WASTEWATER UTILITY<br />
CAPITAL IMPROVEMENT PLAN<br />
ADJUSTED<br />
2007 <strong>2008</strong> 2009 2010 2011 2012 2013 2014 2015 2016 2017<br />
BUDGET PROPOSED PROJECTED PROJECTED PROJECTED PROJECTED PROJECTED PROJECTED PROJECTED PROJECTED PROJECTED<br />
ENGINEERING<br />
Wastewater Structures Identification and Inspec 135,813<br />
Orangewood Collection System Acceptance 20,000<br />
Subdivision and Commercial Development 49,000 75,000<br />
County Projects 1,000 5,000<br />
D.O.T. Projects 5,000 5,000<br />
Survey Services - Public Works Engineering 862<br />
Retaining Wall Construciton and Landscape 1,500<br />
Sewer Line Relocation - Intown Bypass Utility Ac 5,500<br />
Memorial @ Lakeshore 11,000<br />
FDEP West Lklnd Wasteload Reduction Facility 25,000<br />
FDEP Glendale Class A Sludge Stabilization 5,500<br />
FDEP Chlorine Contact Chamber 761<br />
<strong>Lakeland</strong> Highlands 12" Forcemain 1,500<br />
Beacon Rd @ Lincoln Ave Intersection Imp. 1,500<br />
Wastewater Support - Other <strong>City</strong> Departments 4,000 5,000<br />
Cataloging (Permits, Easements & Svc Agreeme 18,500 20,000 20,000 20,000 20,000 20,000 20,000 20,000 20,000 20,000 20,000<br />
Northeast Service Area Expansion 25,000<br />
SW-Pump & Airpark Upgrade (Eng Oaks II) 15,000<br />
SW Area-Upgrade Existing Pump Stations [E.O. 30,000<br />
Wastewater Structures Identification and Inspec 9,845<br />
Second CROM Tank 15,000<br />
Fourth ATAD Tank 25,000<br />
Inspection <strong>of</strong> Developer-Financed Projects 155<br />
Subdivision and Commercial Development 95,000 300,000<br />
Sub-total 501,436 410,000 20,000 20,000 20,000 20,000 20,000 20,000 20,000 20,000 20,000<br />
STATE REVOLVING LOAN<br />
Skyview Utilties - FDEP Grant 1,500,000<br />
Revolving Loan Administration 109,528<br />
Dranefield Road Capacity Expansion 28,598<br />
Skyview Utility System <strong>City</strong> Acceptance 2,021,249<br />
Eng. Oaks Accommodations (Eng Oaks I) 133,413<br />
SW-Pump & Airpark Upgrade (Eng Oaks II) 1,881,259 4,500,000<br />
SW-Upgrade Existing Pump Stat. (Eng Oaks III) 7,448,060 5,100,000<br />
Class A Sludge Stabilization 8,387,448<br />
Westside Area Roughing Plant 12,812,709<br />
Northside WWTP-FDEP Chlorine Contact Cham 563,848<br />
Additional Treatment Capacity 15,000,000<br />
Additional Treatment Capacity 30,000 250,000<br />
Glendale Capacity Increase 25,000,000<br />
Effluent Filtration Wetlands Algae Reduction 1,260,000 2,300,000<br />
US 98 South Growth Area Capacity Expansion 3,000,000<br />
Sub-total 36,146,112 14,900,000 15,000,000 30,000 25,250,000<br />
F – 39
WASTEWATER UTILITY<br />
CAPITAL IMPROVEMENT PLAN<br />
ADJUSTED<br />
2007 <strong>2008</strong> 2009 2010 2011 2012 2013 2014 2015 2016 2017<br />
BUDGET PROPOSED PROJECTED PROJECTED PROJECTED PROJECTED PROJECTED PROJECTED PROJECTED PROJECTED PROJECTED<br />
MISCELLANEOUS:<br />
SRL Debt Service - Impact Fees 111,498 1,480,000 1,480,000 1,695,000 1,695,000 1,695,000 1,695,000 1,695,000 1,695,000 1,695,000<br />
Debt Service-Impact Fees 1,052,736 1,052,736 1,052,736 1,052,736 1,052,736 1,052,736 1,052,736 1,052,736 1,052,736<br />
Wastewater Impact Fee Study 30,000 30,000<br />
Skyview Utility System 74,154<br />
Local Limits Headworks Study 70,000 80,000<br />
Video Conversion Catalog 40,000<br />
Wastewater Building Expansion 250,000<br />
US98 Capacity Study 150,000<br />
Contingency 125,000 150,000 150,000 150,000 150,000 150,000 150,000 150,000 150,000 150,000 150,000<br />
Equipment 231,387 188,200 150,000 150,000 150,000 150,000 150,000 150,000 150,000 150,000 150,000<br />
Transfer to Fleet Management Fund 41,000<br />
Radio Replacement - repayment <strong>of</strong> FY 2000 pur 19,849 19,849 19,849 19,849 19,849 19,849 19,849<br />
Inventory Bar Coding System 12,622<br />
Inventory Bar Coding System 1,383<br />
Maximo Phase II Implementation 18,118<br />
Reuse Utility Preliminary Engineering 100,000<br />
Wireless Work Order System Interface 25,000<br />
MAXIMO Upgrade <strong>City</strong> Wide 45,000<br />
Alternative Collection/Disposal Study 1,531<br />
System Capacity Evaluation 38,950<br />
Security Enhancements 164,389 30,000 80,000<br />
Annual Report 12,000 12,000 12,000 12,000 12,000 12,000 12,000 12,000 12,000 12,000 12,000<br />
Sanitary Sewer Inventory Conversion 167,214 100,000 100,000 100,000 100,000 100,000 100,000 100,000 100,000 100,000 100,000<br />
Sub-total 2,130,333 1,924,283 3,044,585 3,244,585 3,179,585 3,179,585 3,259,585 3,159,736 3,159,736 2,137,000 2,107,000<br />
TOTAL EXPENSES 47,788,929 19,448,283 5,859,585 5,629,585 5,959,585 21,589,585 5,894,585 6,209,736 6,189,736 30,247,000 5,282,000<br />
ENDING CASH BALANCES:<br />
IMPACT FEES 2,072,615 1,897,615 1,937,615 2,227,615 2,267,615 2,307,615 2,427,615 2,467,615 2,507,615 2,547,615 2,587,615<br />
RENEWAL AND REPLACEMENT 503,432 325,123 354,014 372,905 316,796 480,687 619,578 628,318 542,058 625,798 394,538<br />
TOTAL CASH BALANCES 2,576,047 2,222,738 2,291,629 2,600,520 2,584,411 2,788,302 3,047,193 3,095,933 3,049,673 3,173,413 2,982,153<br />
F – 40
WATER UTILITY<br />
CAPITAL IMPROVEMENT PLAN<br />
ADJUSTED<br />
2007 <strong>2008</strong> 2009 2010 2011 2012 2013 2014 2015 2016 2017<br />
BUDGET PROPOSED PROJECTED PROJECTED PROJECTED PROJECTED PROJECTED PROJECTED PROJECTED PROJECTED PROJECTED<br />
REVENUES:<br />
Impact Fee Collections 1,650,000 1,000,000 2,000,000 2,000,000 2,000,000 2,000,000 2,250,000 2,250,000 2,250,000 2,250,000 2,250,000<br />
Transfer from Operations-R&R 3,300,000 3,300,000 3,300,000 3,300,000 3,300,000 3,300,000 3,300,000 3,300,000 3,300,000 3,300,000 3,300,000<br />
Interest Earnings-Impact Fees 305,000 298,000 140,000 140,000 140,000 140,000 140,000 140,000 140,000 140,000 140,000<br />
Interest Earnings-Renewal and Replacement 271,000 272,000 272,000 272,000 272,000 272,000 272,000 272,000 272,000 272,000 272,000<br />
Unappropriated Surplus 7,846,791 1,401,591 (28,090) 779,672 1,092,935 594,370 (2,573,030) (2,565,145) (2,369,562) (2,409,240) (2,352,190)<br />
TOTAL REVENUES 13,372,791 6,271,591 5,683,910 6,491,672 6,804,935 6,306,370 3,388,970 3,396,855 3,592,438 3,552,760 3,609,810<br />
IMPACT FEE PROJECTS<br />
PRODUCTION:<br />
New Production Wells 500,000 500,000<br />
Northeast Plant Upgrade (C.W. Combee WTP) 100,000<br />
Northeast Water Treatment Plant Expansion 800,000 2,225,000 2,225,000<br />
LWD9550 Northeast Water Treatment Plant 210,000<br />
LWP9579 Combee Area Production Wells 1,231,771<br />
Sub-total 1,441,771 1,300,000 2,725,000 2,225,000 100,000<br />
RENEWAL AND REPLACEMENT FUND PROJECTS<br />
PRODUCTION:<br />
Tools & Equipment 30,000 32,000 32,000 34,000 34,000 36,000 36,000 38,000 38,000 40,000 40,000<br />
PICS Capital Equipment 3,000 4,000 4,000 4,000 5,000 5,000 6,000 6,000 8,000 8,000 8,000<br />
Equipment Replacement 90,000 90,000 90,000 90,000 90,000 90,000 90,000 100,000 100,000 100,000 100,000<br />
Upflow Unit Overhaul (Unit 1 & 2) 292,358<br />
NW Plant Auxiliary System Upgrades 400,000 100,000 100,000 100,000 100,000 100,000 100,000 100,000 100,000 100,000 100,000<br />
LWP9020 Northwest Plant Upgrades 10,632<br />
Chlorine Building Improvements 300,000<br />
PICS System Replacement 150,000 250,000 600,000<br />
Security Enhancements 87,980<br />
Overhaul / Rehab HS Pumps & Backwash/Transfer Pumps 120,000 180,000 60,000<br />
Distribution System Water Quality Station 20,000<br />
Lake Bonny Community Park 8,852<br />
Diesel Containment Structures 158,340 350,000<br />
CWP5506 Sludge Thickener Unit Overhaul 75,000<br />
CWP5507 Distribution System Water Quality S 40,000<br />
CWP5512 Combee HSP - VFD Conversion 35,000<br />
F – 41
WATER UTILITY<br />
CAPITAL IMPROVEMENT PLAN<br />
ADJUSTED<br />
2007 <strong>2008</strong> 2009 2010 2011 2012 2013 2014 2015 2016 2017<br />
BUDGET PROPOSED PROJECTED PROJECTED PROJECTED PROJECTED PROJECTED PROJECTED PROJECTED PROJECTED PROJECTED<br />
CWP5513 Williams WTP MCC Upgrade 75,000<br />
Northeast Monitor Well Equipment 58,000<br />
Combee WTP Lighting Improvements 20,000<br />
Northeast Wellfield Fencing Upgrades 30,000<br />
Water Plant Parking Improvement 30,000<br />
Painting <strong>of</strong> Structures Williams WTP 40,000 40,000<br />
NE Monitoring Well Equipment Replacement 40,000 40,000 40,000 40,000 40,000 40,000 40,000 40,000 40,000 40,000<br />
Williams Wet Lab Replacement 25,000<br />
Chlorine Response Equipment Replacement 15,000 15,000 15,000 15,000 20,000 20,000 20,000 20,000 20,000 20,000<br />
Combee Access 15,000<br />
Williams Access 35,000<br />
Williams Security Cameras 80,000 100,000 200,000<br />
Williams Filter Rehabilitation 250,000 750,000<br />
Systems Reporting Development Project 60,000<br />
Combee NE Well Pumps VFD 300,000<br />
Williams Liquid Chlorine Conversion 200,000<br />
Sub-total 1,444,162 2,226,000 1,561,000 1,143,000 284,000 291,000 332,000 304,000 306,000 308,000 308,000<br />
TRANSMISSION AND DISTRIBUTION: IMPACT FEES<br />
SR 563 (Harden Blvd) - N/S Route - 36" Relocate 626,000<br />
New Tampa Hwy Widen - DOT 198,000<br />
W. Pipkin Widening (Medulla to Harden) 180,000<br />
Polk County Road Improvements 170,000 170,000 170,000 170,000 170,000 170,000 170,000 170,000 170,000 180,000 180,000<br />
Medulla Road Extension 385,000<br />
In Town Bypass - Phase II 557,000<br />
Mcintosh Access Rd. To Bob Rawls Rd 132,056<br />
US 98 Intertie to Polk Co Utils 135,000<br />
<strong>Lakeland</strong> Highlands Rd Widening - Parkway south 405,000<br />
Bartow Tie 340,000<br />
Galloway Rd - Discount Auto north 45,000<br />
Old Polk <strong>City</strong> Rd - West to Moore 315,000<br />
Hamilton Road Loop - Ph 1 180,000<br />
Hamilton Road Loop - Ph 2 225,000<br />
NE Water Trans Lines (Mt. Olive) 135,000<br />
Williams Tie South - 20" 450,000<br />
US 98 - Highland <strong>City</strong> Widen - SR 540 to CR 540A 90,000<br />
F – 42
WATER UTILITY<br />
CAPITAL IMPROVEMENT PLAN<br />
ADJUSTED<br />
2007 <strong>2008</strong> 2009 2010 2011 2012 2013 2014 2015 2016 2017<br />
BUDGET PROPOSED PROJECTED PROJECTED PROJECTED PROJECTED PROJECTED PROJECTED PROJECTED PROJECTED PROJECTED<br />
Lake Gibson Trans Loop - 16" Phase 1 234,000<br />
Lake Gibson Trans Loop - 16" Phase 2 360,000<br />
Lake Gibson Trans Loop - 16" Phase 3 292,000<br />
Sleepy Hill Rd Widen (Circuit <strong>City</strong> to Kathleen) 8,624 270,000<br />
County Line Rd - SW Loop (Gateway to W. Pipkin) 608,000<br />
(Old) Medulla Rd Ext. (Hamilton to County Line) 135,000<br />
Drane Field Rd Ext (Hamilton to County Line) 135,000<br />
Lakeshore Dr Relo - DOT (Memorial to Bon Air 5,515<br />
FDOT US98 South Widening 5,000<br />
Williams DRI Completion 1,000,000<br />
540A Widening-US 98S to Lkld Highlands 72,000<br />
SR563 (MLK Blvd)-2nd St to US 98 27,000<br />
S. Florida - Harden Connector (Edgewood Ext) 200,000<br />
Harden Blvd 3-Laning (Parkway to Alamo) 450,000<br />
Hwy 33 Trans Line Improv - 16" 290,000<br />
Sub-total 3,761,195 1,160,000 1,385,000 1,313,000 960,000 931,000 170,000 170,000 170,000 180,000 180,000<br />
RENEWAL AND REPLACEMENT FUND PROJECTS<br />
TRANSMISSION AND DISTRIBUTION:<br />
Subdivision & Commercial Development 30,250 53,500 54,565 55,660 56,770 57,905 59,060 60,240 61,450 62,680 63,525<br />
New Service Connections 38,469 42,460 43,310 44,175 45,060 45,960 46,880 47,820 48,780 49,760 50,755<br />
Minor Extensions & Improvements 215,197 194,080 197,965 201,925 205,965 210,090 214,300 218,600 222,975 227,435 232,000<br />
Distribution Facilities Replacement 2,660 43,515 44,385 45,270 46,180 47,100 48,040 49,000 50,000 51,000 52,000<br />
New Water Meters 110,410 130,000 132,600 135,300 138,000 140,800 143,600 145,500 148,400 151,400 157,500<br />
Meter Relocation/Improvement 5,400 10,500 10,700 10,900 11,100 11,300 11,525 11,755 12,000 12,230 12,475<br />
Tools & Equipment 16,560 16,890 17,230 17,575 17,925 18,280 18,645 19,020 19,400 19,800 20,200<br />
Asbestos Pipe Removal 29,655 30,250 30,855 31,470 32,100 32,740 33,395 34,060 34,750 35,450 36,200<br />
Hydrant Installation-New Annexation 22,215 37,960 38,720 39,495 40,285 41,090 41,910 42,750 43,605 44,480 45,700<br />
<strong>City</strong> Project Support 24,310 30,000 30,600 31,200 31,840 32,475 33,125 33,800 34,500 35,200 35,900<br />
Polk County Project Support 34,585 35,275 35,980 36,700 37,435 38,185 38,950 39,730 40,525 41,335 42,160<br />
State/FDOT Project Support 53,905 60,000 61,200 62,420 63,675 65,000 66,250 67,600 68,960 70,350 71,750<br />
<strong>City</strong> Parks & Rec Support 55,205 56,310 57,435 58,582 59,755 60,950 62,170 63,420 64,700 66,000 67,320<br />
GIS Water Data Collection 144,276 107,041 109,180 111,365 113,595 115,865 118,180 120,540 122,950 125,400 127,900<br />
Asbestos Pipe Abatement-Contractors 33,120 33,785 34,460 35,150 35,850 36,570 37,300 38,050 38,800 39,600 40,400<br />
Traffic Control Support 186,675 90,410 94,215 148,000 202,060 206,105 210,225 214,430 218,720 223,100 227,550<br />
Central Controlled Irrigation 21,435 11,040 11,260 11,490 11,715 11,950 12,190 12,435 12,690 12,940 13,200<br />
Long Term Project Support 335,179 80,185 83,790 187,465 191,215 195,040 198,940 202,920 206,980 211,100 215,325<br />
Water Meter Replacement 111,097 120,000 122,400 124,850 127,350 129,900 132,500 135,150 137,850 140,600 143,425<br />
F – 43
WATER UTILITY<br />
CAPITAL IMPROVEMENT PLAN<br />
ADJUSTED<br />
2007 <strong>2008</strong> 2009 2010 2011 2012 2013 2014 2015 2016 2017<br />
BUDGET PROPOSED PROJECTED PROJECTED PROJECTED PROJECTED PROJECTED PROJECTED PROJECTED PROJECTED PROJECTED<br />
Backflow Prevention 60,725 61,940 63,180 64,440 65,730 67,045 68,385 69,755 71,150 72,575 74,025<br />
Wireless Data System 21,920<br />
Other Distribution Projects 354,312 220,815 225,230 229,740 234,330 239,020 243,800 248,680 253,653 258,725 263,900<br />
Tennessee Rd - Lebanon to Old Tampa Rd Fir 153,000<br />
Cochran St -Wabash to Chestnut Fire Improve 39,000<br />
N. Virginia/W. 8th/N. New York Fire Improveme 58,000<br />
Plateau Ave/Patterson St/Southern Ave Fire Im 73,043<br />
N. Davis Ave - Memorial to 7th St Fire Imprv 108,000<br />
Woodward/Eddy/Buckingham Fire Imprv 52,000<br />
Nottingham/John Arthur Way AC Replace 110,420<br />
Reynolds Rd AC Replace-Trans Upgrade 207,000<br />
Replacement <strong>of</strong> Hand Held Radios 18,598 8,635 8,650 11,500 11,500 11,500 3,100 3,100 3,100 3,100 3,100<br />
Water Master Plan Projects 40,000 200,000 200,000 200,000 200,000 200,000 200,000 200,000 200,000<br />
Skyview Utility System 250,000 150,000<br />
Reynolds Rd & Maine Ave Intersection Improv 379,227<br />
Morgan Combee Rd. WL ext. 10,000<br />
Water Meter Shop Improvement 24,038<br />
A-Z Park Road Utility Relocation 119,012<br />
Beacon Road to Lincoln Ave. WL Relocation 95,383<br />
Stokes Rd & 540A Tie 19,475<br />
Main St/Lake Mirror Promenade 126,498<br />
Wabash - Fairbanks Connector Phase I 71,627<br />
Euclid Ave - Lk Hollingsworth Dr to Lk Horney 62,000<br />
Easton Terr/Alma/Berkley/Denton Fire Improve 58,000<br />
Hillsboro St/S Hilltop Ave Fire Improvement 34,000<br />
W Parker St - Wabash to Chestnut System Imp 53,000<br />
Sylvester Rd/Sims Pl. 6 inch Water Line Repla 2,418<br />
Fire Imps. E. Magnolia St. - Fairway to Meridia 36,800<br />
Parker Road - Lunn to Old Hwy 37 Tie 168,000<br />
I-4 Section 8 (107) 1,617<br />
540A Widening 83,155<br />
NE Water Transmission Lines (South) 428,102<br />
NE Water Transmission Lines (North) 15,992<br />
Polk County Road Improvements 157,634 100,000 100,000 100,000 100,000 100,000 100,000 100,000 100,000 100,000 100,000<br />
Kathleen Rd. Widening - PC 17,786<br />
Griffin Rd. Widening - PC 40,652<br />
NE Water Plant By-Pass Line 31,000<br />
Backflow Preventer Aesthetic Retr<strong>of</strong>it 50,000 20,000 20,000 50,000 50,000 50,000 50,000 50,000 50,000 50,000 50,000<br />
Automated Water Meter/ AMR 50,000<br />
Water Distribution Facility Paving 209,000<br />
Replacement <strong>of</strong> Water Line Locators 10,000<br />
Replacement <strong>of</strong> Leak Detection Equipment 50,000 50,000<br />
Sub-total 4,954,037 2,211,591 1,677,910 2,044,672 2,129,435 2,164,870 2,192,470 2,228,355 2,265,938 2,304,260 2,346,310<br />
F – 44
WATER UTILITY<br />
CAPITAL IMPROVEMENT PLAN<br />
ADJUSTED<br />
2007 <strong>2008</strong> 2009 2010 2011 2012 2013 2014 2015 2016 2017<br />
BUDGET PROPOSED PROJECTED PROJECTED PROJECTED PROJECTED PROJECTED PROJECTED PROJECTED PROJECTED PROJECTED<br />
ENGINEERING: IMPACT FEES<br />
Polk County Road Improvements 25,000 30,000 35,000 35,000 35,000 35,000 35,000 35,000 35,000 35,000 35,000<br />
Bartow Tie 37,000<br />
Medulla Road Extension 5,000<br />
US 98 Intertie to Polk Co Utils 15,000<br />
Galloway Rd - Discount Auto north 5,000<br />
Old Polk <strong>City</strong> Rd - West to Moore 39,930<br />
Williams Tie South - 20" 50,000<br />
540A Widening - US 98S to Lkld Highlands 6,439<br />
US 98 - Highland <strong>City</strong> Widen - SR 540 to CR 540A 10,000<br />
S. Florida - Harden Connector (Edgewood Ext. 110,000<br />
Harden Blvd 3-Laning (Parkway to Alamo) 50,000<br />
Lake Gibson Trans Loop - 16" Phase 1 25,930<br />
Sleepy Hill Rd Widen (Circuit <strong>City</strong> to Kathleen) 30,000<br />
County Line Rd - SW Loop (Gateway to W. Pipkin) 67,000<br />
(Old) Medulla Rd Ext. (Hamilton to County Line) 15,000<br />
Drane Field Rd Ext (Hamilton to County Line) 15,000<br />
New Tampa Hwy Widen - DOT 22,000<br />
W. Pipkin Widening (Medulla to Harden) 20,000<br />
Sleepy Hill Rd Widen (Circuit <strong>City</strong> to Kathleen) 2,365<br />
McIntosh Access Road to Bob Rawls Road 6,176<br />
LWD9574 Lakeshore Dr. Relocation - DOT 4,645<br />
LWE9581 Hamilton Road Loop - Phase I 20,000<br />
In-Town Bypass 43,000<br />
FDOT US98 S. Widening (Brooks & Edgewood 4,000<br />
Williams DRI Completion 26,911<br />
Hwy 33 Trans Line Improv - 16" 40,000<br />
<strong>Lakeland</strong> Highlands Rd Widening - Parkway So 45,000<br />
Hamilton Road Loop - Phase 2 25,000<br />
Lake Gibson Trans Loop - 16" Phase 3 33,000<br />
English Oaks Water System Improvements 45,000<br />
LWE9583 Lake Gibson Trans Loop - 16" Phas 40,000<br />
New Production Wells 400,000<br />
Sub-total 602,396 97,000 532,000 152,000 35,000 35,000 35,000 35,000 35,000 35,000 35,000<br />
F – 45
WATER UTILITY<br />
CAPITAL IMPROVEMENT PLAN<br />
ADJUSTED<br />
2007 <strong>2008</strong> 2009 2010 2011 2012 2013 2014 2015 2016 2017<br />
BUDGET PROPOSED PROJECTED PROJECTED PROJECTED PROJECTED PROJECTED PROJECTED PROJECTED PROJECTED PROJECTED<br />
RENEWAL AND REPLACEMENT FUND PROJECTS<br />
ENGINEERING:<br />
SR 563 (Harden Blvd) - N/S Route - 36" Relocate<br />
Subdivision & Commercial Development 262,996 250,000 250,000 250,000 250,000 250,000 250,000 250,000 250,000 250,000 250,000<br />
Minor Extensions & Improvements 8,785 15,000 15,000 20,000 20,000 20,000 20,000 20,000 25,000 25,000 25,000<br />
Hydrant Installation-New Annexation 5,970 3,500 3,500 3,500 5,000 5,000 5,000 5,000 5,500 5,500 5,500<br />
<strong>City</strong> Project Support 8,749 25,000 25,000 25,000 30,000 30,000 30,000 30,000 30,000 35,000 35,000<br />
Polk County Project Support 10,483 8,500 8,500 8,500 9,500 9,500 9,500 9,500 10,000 10,000 10,000<br />
State/FDOT Project Support 11,129 30,000 30,000 30,000 35,000 35,000 35,000 35,000 40,000 40,000 45,000<br />
<strong>City</strong> Parks & Rec Support 11,204 20,000 20,000 20,000 25,000 25,000 25,000 25,000 30,000 30,000 35,000<br />
Other Distribution Projects 150,000 100,000 100,000 100,000 200,000 200,000 200,000 200,000 230,000 230,000 230,000<br />
Compson Pl. - W. Bella Vista To Fairbanks 3,000<br />
Palm Center Shops Tie To Doris Dr. 2,000<br />
Tennessee Rd. - Lebanon To Old Tampa Hwy 6,937<br />
Chocran St. - Wabash Av To Chestnut - Fire Im 2,371<br />
N. Virginia / W. 8Th St / N.Y. Fire Imp. 6,000<br />
Plateau / Patterson / Southern Fire Imp 4,733<br />
CWE 5096 Crow Water Projects Easements 30,000 30,000 30,000 30,000 40,000 40,000 40,000 40,000 45,000 45,000 45,000<br />
Woodward/Eddy/Buckingham Fire Imprv 6,000<br />
N. Davis Ave - Memorial to 7th St Fire Imprv 12,000<br />
Nottingham/John Arthur Way AC Replace 3,696<br />
New Tampa Hwy Widen - DOT 22,000<br />
Water Master Plan Projects 4,000 20,000 20,000 20,000 20,000 20,000 20,000 20,000 25,000 25,000<br />
Replacement <strong>of</strong> Hand Held Radios 6,000 6,000 12,000 12,000<br />
Polk County Road Improvements 3,500 20,000 20,000 20,000 25,000 25,000 25,000 25,000 30,000 30,000 35,000<br />
MWD1023 Skyview Utility System 120,000<br />
Reynolds Rd & Maine Ave Intersection Improv 27,754<br />
CWD5093 Morgan Combee Rd. WL ext. 1,155<br />
Maximo Implemenation 46,952<br />
CWD5129 A-Z Park Road Utility Relocation 2,786<br />
Beacon Road to Lincoln Ave. WL Relocation 16,910<br />
CWD5131 Stokes Rd & 540A Tie 2,422<br />
Main St/Lake Mirror Promenade 6,045<br />
CWE5148 Northwest Loop Phase 8 17,772<br />
CWE455152 Wabash - Fairbanks Connector P 7,369<br />
CWE5154 Bridgewater Inspection 14,752<br />
CWE5156 Euclid Ave - Lk Hollingsworth Dr to 7,000<br />
CWE5157 Easton Terr/Alma/Berkley/Denton F 6,000<br />
F – 46
WATER UTILITY<br />
CAPITAL IMPROVEMENT PLAN<br />
ADJUSTED<br />
2007 <strong>2008</strong> 2009 2010 2011 2012 2013 2014 2015 2016 2017<br />
BUDGET PROPOSED PROJECTED PROJECTED PROJECTED PROJECTED PROJECTED PROJECTED PROJECTED PROJECTED PROJECTED<br />
CWE5158 Hillsboro St/S Hilltop Ave Fire Impro 3,971<br />
CWE5159 W Parker St - Wabash to Chestnut S 6,000<br />
CWE5160 SR 563 (Harden Blvd) - N/S Route - 50,000<br />
CWE5161 Northside Water Maintenance Facili 40,000<br />
CWE5162 W Pipkin Widening (Medulla to Hard 20,000<br />
CWD5166 Park Dr & Atlanta Relocate - PW 4,918<br />
CWA5149 Sixth Floor Furnishings 42,766<br />
Containment Structures 5,000<br />
Purchase <strong>of</strong> Radios 1,195<br />
Sylvester Rd/Sims Pl. 6 inch Water Line Repla 2,099<br />
Fire Imps. E. Magnolia St. - Fairway to Meridia 4,000<br />
Parker Road - Lunn to Old Hwy 37 Tie 18,000<br />
Reynolds Rd AC Replace - Trans Upgrade 23,000<br />
Maximo Upgrade 75,000<br />
I-4 Section 8 (107) 1,000<br />
540A Widening 5,000<br />
In-Town Bypass 3,500<br />
Kathleen Rd. Widening - PC 3,048<br />
T&D Workorder Management System 52,263<br />
Transfer to Fleet - Additional Vehicle -Water Cops 25,000<br />
Sub-total 1,169,230 577,000 528,000 539,000 671,500 659,500 659,500 659,500 715,500 725,500 740,500<br />
TOTAL EXPENSES 13,372,791 6,271,591 5,683,910 6,491,672 6,804,935 6,306,370 3,388,970 3,396,855 3,592,438 3,552,760 3,609,810<br />
ENDING CASH BALANCES:<br />
IMPACT FEES 3,028,954 3,069,954 3,292,954 2,667,954 1,087,954 36,954 2,221,954 4,406,954 6,491,954 8,666,954 10,841,954<br />
RENEWAL AND REPLACEMENT 2,235,388 792,797 597,887 443,215 930,280 1,386,910 1,774,940 2,155,085 2,439,647 2,673,887 2,851,077<br />
TOTAL CASH BALANCES 5,264,342 3,862,751 3,890,841 3,111,169 2,018,234 1,423,864 3,996,894 6,562,039 8,931,601 11,340,841 13,693,031<br />
F – 47
LAKELAND ELECTRIC<br />
CAPITAL IMPROVEMENT PLAN<br />
ADJUSTED<br />
2007 <strong>2008</strong> 2009 2010 2011 2012 2013 2014 2015 2016 2017<br />
BUDGET PROPOSED PROJECTED PROJECTED PROJECTED PROJECTED PROJECTED PROJECTED PROJECTED PROJECTED PROJECTED<br />
REVENUES:<br />
Transfer from Operating Fund 12,363,000 36,267,000 36,267,000 36,267,000 36,267,000 36,267,000 36,267,000 36,267,000 36,267,000 36,267,000 36,267,000<br />
Capital Reserves or New Debt 42,628,605 45,000,000 21,450,000 136,895,000 147,988,000 62,667,000<br />
TOTAL REVENUES 54,991,605 81,267,000 36,267,000 36,267,000 57,717,000 173,162,000 184,255,000 98,934,000 36,267,000 36,267,000 36,267,000<br />
EXPENDITURES:<br />
Operations Control Center (Parker St. Renovate/Rebuild) 1,050,000 2,250,000<br />
Fire System Battery 71,251 410,000<br />
Energy Service Evaluation 650,000<br />
Structural Reparis in Parking Garage 60,000<br />
NERC Cyber Security 199,692 181,328<br />
Call Center Technology (CISCO) 282,000<br />
AMI Meter Project 1,299,000 6,041,000 7,245,000 4,571,000<br />
RTU Replacement (EMS System Replacement) 209,744 143,000<br />
ITRON Replacement 144,749<br />
230kv/69kv Transmission Lines 4,728,798 1,685,000 700,000 3,110,000 529,000 1,100,000 1,400,000 1,000,000 1,000,000<br />
Substations 9,220,157 4,815,727 8,050,000 9,325,000 10,894,000 8,387,000 4,432,000 4,098,000 500,000 3,952,000<br />
Larsen Plant Unit 8 991,131 1,400,000 600,000 2,000,000 1,000,000 1,000,000 1,000,000 1,000,000 1,000,000 1,000,000<br />
McIntosh Plant Unit 1 28,733 1,763,267 4,550,000<br />
McIntosh Plant Unit 2 1,706,036 500,000 1,000,000 1,000,000 1,000,000 900,000<br />
McIntosh Plant Unit 3 39,606,912 23,988,585 8,483,185 3,702,000 3,034,000 4,404,000 6,899,000 4,600,000 6,857,000 4,800,000 3,000,000<br />
McIntosh Plant Unit 5 1,083,278 6,151,000 7,754,540 9,340,680 4,680,900<br />
Winston Plant 52,164<br />
New Generation 1,000,000 21,450,000 136,895,000 147,988,000 62,667,000<br />
TOTAL LTC CAPITAL PROJECTS 59,042,645 43,079,907 32,386,725 30,708,680 53,413,900 155,786,000 162,419,000 74,665,000 9,357,000 10,752,000 4,000,000<br />
RENEWAL & REPLACEMENT PROJECTS 12,363,000 18,057,045 18,508,000 18,971,000 19,445,000 19,931,000 20,429,000 20,940,000 21,464,000 22,001,000 22,001,000<br />
TOTAL EXPENDITURES 71,405,645 61,136,952 50,894,725 49,679,680 72,858,900 175,717,000 182,848,000 95,605,000 30,821,000 32,753,000 26,001,000<br />
Cash Balance (16,414,040) 3,716,008 (10,911,717) (24,324,397) (39,466,297) (42,021,297) (40,614,297) (37,285,297) (31,839,297) (28,325,297) (18,059,297)<br />
F – 48
LAKELAND ELECTRIC<br />
CAPITAL IMPROVEMENT PLAN<br />
ADJUSTED<br />
2007 <strong>2008</strong> 2009 2010 2011 2012 2013 2014 2015 2016 2017<br />
BUDGET PROPOSED PROJECTED PROJECTED PROJECTED PROJECTED PROJECTED PROJECTED PROJECTED PROJECTED PROJECTED<br />
230kv/69kv Transmission Lines<br />
Glendale-Eaton Park 69kv Line 1,019,331<br />
Capacitor Modernization 200,000<br />
Interstate-Northwest 69kv Line Reconductor 305,000<br />
McIntosh-Teneroc 230kv Line Reconductor 1,100,000 400,000<br />
Dranefield New Circuit D384 135,000<br />
Eaton Park New Circuit D384 350,000<br />
Orangedale V334 Extension 80,000<br />
Orangedale V334 Extension existing line 170,000<br />
LEE8281 OH Route Selection Hamilton to Winst 60,000 250,000 112,000<br />
Indian Lake 30MVA Capacitor Bank 112,000<br />
Highland <strong>City</strong> T&D 100,000<br />
Tenoroc-Northwest 69kv Line 1,379,673 500,000<br />
Transmission Line Life Extension 2,000,000 1,000,000 1,000,000 1,000,000<br />
Crews Lake Grove 69Kv 700,000 700,000<br />
West-Winston 69kv Line Upgrade 310,000<br />
Interstate-Galloway 69 kV 42,910<br />
I4 Widening - Hwy 98 to SR 559 (1 6,240<br />
Highlands <strong>City</strong> T&D Connection Reloc 215,168<br />
Christina-Grove 69kv Line 269,107<br />
Socrum-Hemphill 69kV Line Reconduct 221,773<br />
Dranefield Add 69KV Capacitor Bank 134,545<br />
H Route Selection-Hamilon to Winsto 76,543<br />
Dranefield New Circuit D344 306,600<br />
Hemphill Circuit H334 New Open Swit 4,000<br />
Hemphill Circuit H344 New Line Exte 11,000<br />
Winston T374 Lind Upgrade 164,136<br />
UG Lake Mirror Road Realignment Pro 176,032<br />
Dist Changes - Sutton Feeders for H 445,350<br />
Dist Changes - West Feeders for Ham 102,371<br />
Dist Changes - for Bridgwater Sub D 94,019<br />
Total 4,728,798 1,685,000 700,000 3,110,000 529,000 1,100,000 1,400,000 1,000,000 1,000,000<br />
F – 49
LAKELAND ELECTRIC<br />
CAPITAL IMPROVEMENT PLAN<br />
ADJUSTED<br />
2007 <strong>2008</strong> 2009 2010 2011 2012 2013 2014 2015 2016 2017<br />
BUDGET PROPOSED PROJECTED PROJECTED PROJECTED PROJECTED PROJECTED PROJECTED PROJECTED PROJECTED PROJECTED<br />
Substations<br />
Hamilton Substation 900,000 800,000 1,200,000<br />
Bridgewater 69Kv and 12Kv Lines 500,000 1,000,000 4,225,000<br />
Indian Lakes Substation 350,000<br />
Bridgewater Substation 900,000 800,000<br />
County Line South Substations, Tx & Feeders 20,000 500,000<br />
Hamilton-Dranefield 69Kv Trans 12KV 250,000 1,000,000 1,000,000<br />
Hamilton-Winston 69Kv Trans 12KV 1,000,000 1,000,000<br />
LEE8138 2014 Sub/TX Feeders/Cap 2,652,423 1,315,727<br />
CEE8128Orangedale to Socrum 69Kv 50,000 1,200,000 1,550,000<br />
Socrum-Orangedal Line sub work 1,000,000<br />
Galloway Substation Capacity Upgrades 691,037 899,000<br />
Glendale Substation Rebuild 1,662,909 500,000 540,000<br />
Highland <strong>City</strong> Sub Capacity upgrades 865,000<br />
Indian Lake Substation, Tx & Feeders 150,000 6,000,000 4,985,000<br />
Bridgewater Substation 60,000<br />
Eaton Park Substation Rebuild 805,770<br />
Grove Substation 30 MVAR Capacity B 114,252<br />
OH Highland <strong>City</strong> Sub Capacity Upgr 1,767,851<br />
Hamilton Substation & T&D Feeders 502,000<br />
Capacitor Modernization Program 549,712<br />
Sutton Sub for Hamilton Sub Delay 98,203<br />
West Sub for Hamilton Sub Delay 96,000<br />
Mt. Olive Substation, Tx & Feeders 1,000,000 3,698,000<br />
Medulla Grove 60kV Line 1,000,000 2,210,000 570,000<br />
Medulla Substation Capacity Upgrade TX#1 832,000<br />
Southwest Substation Capacity Upgrade 700,000<br />
Northwest Substation Capacity Upgrade 1,200,000 300,000<br />
West Substation Auto Trans upg to 225MVA 2,300,000 400,000<br />
Northwest Trans. #1/#2 Upgrade 800,000 832,000<br />
Larsen to McIntosh Tie 1,200,000<br />
Total 9,220,157 4,815,727 8,050,000 9,325,000 10,894,000 8,387,000 4,432,000 4,098,000 500,000 3,952,000<br />
Larsen Plant<br />
Larsen Plant Unit 8 Generation Reliability Impro 600,000 2,000,000 1,000,000 1,000,000 1,000,000 1,000,000 1,000,000 1,000,000<br />
U8 Combusion Turbine Inspection 991,131<br />
U8 Dampers & Expansion Joint 600,000<br />
U8 Steam Turbine Inspection 800,000<br />
Total 991,131 1,400,000 600,000 2,000,000 1,000,000 1,000,000 1,000,000 1,000,000 1,000,000 1,000,000<br />
F – 50
LAKELAND ELECTRIC<br />
CAPITAL IMPROVEMENT PLAN<br />
ADJUSTED<br />
2007 <strong>2008</strong> 2009 2010 2011 2012 2013 2014 2015 2016 2017<br />
BUDGET PROPOSED PROJECTED PROJECTED PROJECTED PROJECTED PROJECTED PROJECTED PROJECTED PROJECTED PROJECTED<br />
McIntosh Plant<br />
CPE7219 Unidentified Capital Projects 663,267<br />
McIntosh Plant Maintenance Building 100,000 3,000,000<br />
McIntosh Plant Administration Building 1,000,000 1,550,000<br />
MMP U1 Generation Reliability Improveme 28,733<br />
McIntosh Plant Unit 2 Circulating Water Line 500,000 900,000<br />
McIntosh Plant Unit 2 Turbine Generator Outage 1,263,014 1,000,000<br />
McIntosh Plant Unit 2 Generation Reliability Imp 343,022 1,000,000 1,000,000<br />
McIntosh Plant Unit 2 Cooling Tower Inspect & R 100,000<br />
McIntosh Plant Unit 3 Air Reheater Basket 317,400 150,000 317,000 150,000<br />
McIntosh Plant Unit 3 Boiler Hanger Replaceme 119,626<br />
McIntosh Plant Unit 3 Clean Air Act Improvemen 22,264,980 18,600,000<br />
McIntosh Plant Unit 3 Coal Yard Heavy Equip Replace 900,000<br />
McIntosh Plant Unit 3 Coal Yard Reconstruction 720,000<br />
McIntosh Plant Unit 3 Coal Yard System Improv 404,474 930,000 75,000 150,000<br />
McIntosh Plant Unit 3 Coal Truck Unloading Sys 600,000 2,400,000<br />
McIntosh Plant Unit 3 Control Replacements 573,218 60,000 240,000 2,400,000<br />
McIntosh Plant Unit 3 Fire system upg 60,000 150,000 150,000 150,000 150,000<br />
McIntosh Plant Unit 3 Primary Superheater 750,000<br />
McIntosh Plant Unit 3 Reheat Vertical Upleg Tub 750,000<br />
McIntosh Plant Unit 3Limestone System Improve 852,000<br />
McIntosh Plant Unit 3 CSI Facilities Upgrade 292,680 180,000 180,000 180,000<br />
MMP JT U3 Reheat Horizontal Tube Replac 450,000 750,000<br />
McIntosh Plant Unit 3 Economizer Header & Tub 106 450,000 750,000<br />
McIntosh Plant Unit 3 High Temp Reheater Replacement 954,000 582,000<br />
LMP9247 MGT Turbine Controls 756,000<br />
McIntosh Plant Unit 3 CAMR Compliance 150,000<br />
McIntosh Plant Unit 3 Low Nox Burners 4,581,403<br />
McIntosh Plant Unit 3 Reline Process Wastewater Ponds 1,800,000<br />
McIntosh Plant Unit 3 Painting 1,200,000 1,200,000 1,200,000 1,200,000 1,200,000<br />
McIntosh Plant Unit 3 Replace Rail Cars 1,103,185 1,103,185<br />
McIntosh Plant Unit 3 Scrubber Improvements 180,000 120,000 1,200,000 2,400,000<br />
McIntosh Plant Unit 3 Scrubber Forced Oxidatio 4,462,776<br />
McIntosh Plant Unit 3 Soot Blower Wall Panel (5 566,672 120,000 60,000<br />
MGT Hot Gas Path Inspection 500,000<br />
McIntosh Plant Unit 3 Pulverizer Improvements 634,019 120,000 60,000 222,000 229,000 250,000 257,000<br />
McIntosh Plant Unit 3 Generation Reliability Imp 2,100,000 2,400,000 3,000,000 3,000,000 3,000,000 3,000,000<br />
McIntosh Plant Unit 3 Turbine Blades 300,000 900,000<br />
McIntosh Plant Unit 3 MBFP Rotating Element R 282,062<br />
McIntosh Plant Unit 3 Scrubber Piping Replacem 122,015<br />
McIntosh Plant Unit 3 Boiler Ignitor Scanners-Co 47,887<br />
McIntosh Plant Unit 3 CSI Conveyor Replaceme 327,966<br />
McIntosh Plant Unit 3 CEMS Analyzer Repl 73,290<br />
F – 51
LAKELAND ELECTRIC<br />
CAPITAL IMPROVEMENT PLAN<br />
ADJUSTED<br />
2007 <strong>2008</strong> 2009 2010 2011 2012 2013 2014 2015 2016 2017<br />
BUDGET PROPOSED PROJECTED PROJECTED PROJECTED PROJECTED PROJECTED PROJECTED PROJECTED PROJECTED PROJECTED<br />
McIntosh Plant Unit 3 Ball Mill Shell Liner Repl 206,069<br />
McIntosh Plant Unit 3 Acoustic Horns for Precip 154,819<br />
McIntosh Plant Unit 3 TR Set Transformer Rebu 128,645<br />
McIntosh Plant Unit 3 Circulating Water Pumps 52,632<br />
McIntosh Plant Unit 3 Scrubber 480V Breaker T 21,242<br />
McIntosh Plant Unit 3 C2 Coal Conveyor Belt Re 13,742<br />
McIntosh Plant Unit 3 Coal Feeder Trans. Chute 30,574<br />
McIntosh Plant Unit 3 Condesate Pumps Rebuil 51,779<br />
McIntosh Plant Unit 3 Compressed Air System U 44,207<br />
McIntosh Plant Unit 3 Main Steam Safety Valve 11,004<br />
McIntosh Plant Unit 3 Turbine Repair 30,000<br />
Generation Land Acquisition 2,000,000<br />
McIntosh Plant Unit 3 McIntosh Facility Security 422,861<br />
McIntosh Plant Unit 3 Reliab Improve/CapSup 213,282<br />
McIntosh Plant Unit 3 Limestone System Improv 120,000<br />
McIntosh Plant Unit 3 32 ID Fan Motor Replacm 189,000<br />
McIntosh Plant Unit 3 Site Expansion Land Acqu 297,943<br />
McIntosh Plant Unit 3 Combustion Byproduct Ma 205,411<br />
McIntosh Plant Unit 3 Rail Cars 540,528<br />
McIntosh Plant Unit 3 Coal Transportation Optio 60,000<br />
McIntosh Plant Unit 5 DCS Controls Replacement 500,000 1,500,000<br />
McIntosh Plant Unit 5 CT Corrosion Mitigation&System Upg 1,000,000 2,000,000<br />
McIntosh Plant Unit 5 Steam Turbine Control Va 1,000,000<br />
McIntosh Plant Unit 5 Generator Rewind 2,000,000<br />
McIntosh Plant Unit 5 Turbine Major Outage 2,000,000<br />
McIntosh Plant Unit 5 ST Instrument Air Compre 11,625<br />
McIntosh Plant Unit 5 CEMS Upgrade 40,943<br />
McIntosh Plant Unit 5 Expansion Joint 106,370<br />
McIntosh Plant Unit 5 Combustion Turbine Repa 127,767<br />
McIntosh Plant Unit 5 Combustion Turbine Row 12,873<br />
McIntosh Plant Unit 5 CT & HRSG Dehumidifier 315,700<br />
McIntosh Plant Unit 5 Generation Reliability Imp 2,000,000 2,000,000 2,000,000 2,000,000<br />
McIntosh Plant Unit 5 Catalyst Replacement 807,000 1,000,000<br />
Winston Peaking Project 52,164<br />
New Generation 1,000,000 21,450,000 136,895,000 147,988,000 62,667,000<br />
McIntosh Plant Unit 5 Siemens LTMA- Assets 468,000 3,651,000 4,254,540 5,340,680 4,680,900<br />
Total 43,477,123 32,402,852 20,787,725 14,849,680 30,164,900 141,299,000 156,887,000 70,167,000 8,857,000 6,800,000 5,000,000<br />
F – 52
Table <strong>of</strong> Contents<br />
Supplementary Information.............................................................. Section—G<br />
Largest Taxpayers................................................................................G-2<br />
Schedule <strong>of</strong> Property Tax Rates..........................................................G-3<br />
General Fund Property Tax Levies and Collections..........................G-4<br />
Governmental Activities Tax Revenues by Source ...........................G-6<br />
Changes in Fund Balances <strong>of</strong> Governmental Funds.........................G-7<br />
Department Tables <strong>of</strong> Organization ....................................................G-9<br />
G-1 Fiscal Year <strong>2008</strong> Annual Budget
Ten Largest Taxpayers<br />
2006<br />
Employer Type <strong>of</strong> Business Employees Rank Total<br />
% <strong>of</strong><br />
Publix Supermarkets, Inc.<br />
Retail/Distribution-<br />
Grocery 4,600 1 25.62%<br />
<strong>Lakeland</strong> Regional Medical Center Hospital 3,800 2 21.16%<br />
<strong>City</strong> <strong>of</strong> <strong>Lakeland</strong> Government 2,186 3 12.17%<br />
Government Employees Insurance<br />
Company Insurance 2,130 4 11.86%<br />
Watson Clinic Medical Facility 1,200 5 6.68%<br />
GC Services Telemarketing 1,200 6 6.68%<br />
Watkins Motor Lines (now FedEx) Trucking 848 7 4.72%<br />
Retail/Distribution-<br />
Rooms To Go Furniture Corp. Furniture 800 8 4.46%<br />
Summit Consulting Insurance 693 9 3.86%<br />
ICT Group Telemarketing 500 10 2.78%<br />
Total 17,957 100.00%<br />
Source: <strong>Lakeland</strong> Economic Development Council<br />
G-2 Fiscal Year <strong>2008</strong> Annual Budget
Schedule <strong>of</strong> Property Tax Rates—Direct<br />
and Overlapping Governments<br />
MILLS ($1 PER $1,000 VALUATION)<br />
<strong>City</strong> <strong>of</strong> <strong>Lakeland</strong><br />
Southwest<br />
<strong>Lakeland</strong> <strong>Lakeland</strong> Florida Polk Peace Lake<br />
Fiscal Year<br />
Area<br />
Mass Downtown Water County River Deeson Total Direct &<br />
Ending Transit Development Management School Water Water Overlapping<br />
September 30 Municipal District District Total County District Board Basin Basin Rates<br />
2006 3.545 0.488 1.956 5.989 8.330 0.284 7.770 0.195 - 22.568<br />
2005 3.545 0.500 1.956 6.001 8.727 0.284 8.078 0.195 - 23.285<br />
2004 3.545 0.488 1.956 5.989 7.727 0.284 8.206 0.195 0.422 22.823<br />
2003 2.995 0.488 1.956 5.439 7.727 0.284 8.317 0.195 0.420 22.382<br />
2002 2.995 0.488 1.956 5.439 7.727 0.422 8.578 0.195 0.420 22.781<br />
2001 2.995 0.488 1.956 5.439 7.727 0.422 8.722 0.195 0.420 22.925<br />
2000 2.995 0.488 1.956 5.439 7.727 0.422 8.846 0.195 0.420 23.049<br />
1999 2.995 0.488 1.956 5.439 7.977 0.422 9.072 0.195 0.430 23.535<br />
1998 2.995 0.488 1.956 5.439 7.977 0.422 9.431 0.195 0.450 23.914<br />
1997 2.995 0.488 2.000 5.483 7.977 0.422 9.336 0.195 – 23.413<br />
G-3 Fiscal Year <strong>2008</strong> Annual Budget
General Fund Property Tax Levies and<br />
Collections<br />
Total Taxable (1)<br />
Fiscal Year<br />
Less:<br />
Ending Real Tangible Railroad Tax Exempt Total Taxable Total Direct<br />
September 30 Property Property Property Adjustments Real Property Assessed Value Tax Rate<br />
2006 $5,130,793,065 $ 706,098,416 $ 3,274,177 $ 87,998,484 $ 1,618,347,457 $ 4,309,816,685 5.989<br />
2005 4,655,054,178 672,059,352 4,953,520 1,268,093 1,476,605,744 3,856,729,399 6.001<br />
2004 4,616,004,195 638,220,261 4,924,316 22,470,923 1,663,559,485 3,618,060,210 5.989<br />
2003 4,464,328,783 626,841,981 3,464,127 (25,279,627) 1,672,222,365 3,397,132,899 5.439<br />
2002 3,971,232,232 655,013,363 3,392,140 15,559,346 1,521,480,883 3,123,716,198 5.439<br />
2001 3,599,943,469 562,173,024 3,770,520 12,058,934 1,438,060,592 2,739,885,355 5.439<br />
2000 3,298,672,555 551,427,010 3,868,515 4,039,250 1,373,782,651 2,484,224,679 5.439<br />
1999 3,210,939,922 513,590,740 5,156,699 32,237,567 1,402,565,552 2,359,359,376 5.439<br />
1998 3,089,521,487 494,818,390 4,325,524 51,300,859 1,363,534,883 2,276,431,377 5.439<br />
1997 2,976,200,373 437,868,390 2,671,163 4,216,494 1,316,262,123 2,104,694,297 5.483<br />
(1) The State <strong>of</strong> Florida, by statute, requires property appraisers to assess all property within the State<br />
at 100% <strong>of</strong> market value. Therefore, the assessed valuation and estimated actual value is the same.<br />
(2) Total property tax levy minus any discounts given to taxpayers . Therefore, the realized tax rate may<br />
be less than the tax rate used to assess property taxes.<br />
G-4 Fiscal Year <strong>2008</strong> Annual Budget
General Fund Property Tax Levies and<br />
Collections (cont’d)<br />
Total Percent Delinquent Total Ratio <strong>of</strong> Total<br />
Tax Current Tax <strong>of</strong> Levy Tax Tax Collection<br />
Levy (2) Collections Collected Collections Collections to Tax Levy<br />
$ 14,749,149 $ 14,676,659 99.51 $ 54,401 $ 14,731,060 99.88<br />
13,200,608 13,149,626 99.61 48,378 13,198,004 99.98<br />
12,393,605 12,031,025 97.07 371,298 12,402,323 100.07<br />
9,833,878 9,777,693 99.43 5,538 9,783,231 99.48<br />
9,048,822 8,985,692 99.30 10,446 8,996,138 99.42<br />
7,936,350 7,849,760 98.91 117,963 7,967,723 100.40<br />
7,196,005 6,997,185 97.24 20,061 7,017,246 97.52<br />
6,828,739 6,799,492 99.57 19,100 6,818,592 99.85<br />
6,601,635 6,374,042 96.55 17,767 6,391,809 96.82<br />
6,096,308 6,070,206 99.57 22,240 6,092,446 99.94<br />
G-5 Fiscal Year <strong>2008</strong> Annual Budget
Governmental Activities Tax Revenues by Source<br />
State Shared Revenues<br />
Utility &<br />
Communication Motor Half Cent Mobile Home Alcoholic Firefighters'<br />
Fiscal Property Services Fuel Franchise Sales Cigarette License Beverage Compensation<br />
Year Tax Tax Tax Tax Tax Tax Fees Tax Tax Total<br />
2006 $ 17,845,105 $ 14,161,883 $ 5,599,243 $ 320,781 $ 6,004,380 $ 2,330,366 $ 197,190 $ 60,222 $ 25,011 $ 46,544,181<br />
2005 15,363,705 13,957,483 5,640,954 283,085 5,696,157 2,210,905 194,245 55,968 24,234 43,426,736<br />
2004 14,250,266 13,494,278 5,372,283 235,506 5,148,418 1,683,783 206,255 52,481 11,304 40,454,574<br />
2003 11,344,358 13,253,466 5,082,474 222,025 4,783,809 1,381,652 177,699 47,090 19,705 36,312,278<br />
2002 10,213,198 11,417,676 4,849,799 367,971 4,498,493 1,393,771 160,674 51,780 25,646 32,979,008<br />
2001 8,734,808 9,607,908 4,909,572 931,021 4,241,268 1,353,164 221,576 48,978 25,999 30,074,294<br />
2000 7,034,113 9,209,518 4,311,913 832,446 4,263,752 1,478,131 142,895 49,517 20,670 27,342,955<br />
1999 6,832,836 8,717,825 3,337,663 815,614 4,151,338 1,495,547 159,163 48,172 19,378 25,577,536<br />
1998 6,404,808 8,121,291 3,259,116 777,337 3,906,637 1,556,545 157,434 49,970 24,630 24,257,768<br />
1997 6,105,370 7,671,288 3,258,911 755,030 3,579,710 1,509,679 152,037 42,609 12,070 23,086,704<br />
G-6 Fiscal Year <strong>2008</strong> Annual Budget
Changes in Fund Balances <strong>of</strong><br />
Governmental Funds<br />
LAST SIX FISCAL YEARS*<br />
(Modified Accrual Basis <strong>of</strong> Accounting)<br />
2001 2002 2003 2004 2005 2006<br />
REVENUES<br />
Taxes $ 24,183,309 $ 26,848,644 $ 29,902,323 $ 33,352,333 $ 35,245,227 $ 37,927,012<br />
Licenses and permits 2,143,017 2,413,095 2,223,201 2,467,512 2,954,750 4,464,447<br />
Intergovernmental 11,983,091 15,053,538 15,544,520 13,986,162 23,118,835 21,899,528<br />
Charges for services 4,197,994 4,804,024 5,213,617 5,672,915 6,282,903 8,187,813<br />
Fines and forfeits 1,174,308 1,017,180 1,049,606 1,020,071 1,016,958 1,356,977<br />
Miscellaneous 15,136,697 10,341,281 11,836,109 10,916,707 14,584,500 16,696,210<br />
Total revenues 58,818,416 60,477,762 65,769,376 67,415,700 83,203,173 90,531,987<br />
EXPENDITURES<br />
General government 7,116,950 7,661,481 10,746,888 10,106,841 11,097,440 9,471,365<br />
Public safety 29,783,630 32,300,614 34,029,669 43,480,111 40,557,388 41,528,088<br />
Physical environment 5,513,046 6,300,969 6,303,665 4,574,179 4,648,935 5,117,903<br />
Transportation 12,017,950 7,997,819 8,162,399 8,681,486 9,375,714 8,555,437<br />
Economic environment 2,806,781 2,293,352 3,854,605 3,089,020 2,614,004 3,727,171<br />
Human services 355,918 217,964 199,269 217,263 250,528 233,823<br />
Culture/recreation 9,289,189 10,063,936 10,374,730 12,328,029 12,826,204 14,350,923<br />
Capital outlay 6,412,968 21,397,473 24,519,097 14,672,331 19,291,451 18,642,941<br />
Debt service<br />
Principal 699,318 2,646,023 3,316,338 2,387,355 3,292,180 3,233,872<br />
Interest 1,778,177 873,033 923,819 1,386,616 836,258 2,394,600<br />
Total expenditures 75,773,927 91,752,664 102,430,479 100,923,231 104,790,102 107,256,123<br />
Excess (deficiency) <strong>of</strong> revenues<br />
over (under) expenditures (16,955,511) (31,274,902) (36,661,103) (33,507,531) (21,586,929) (16,724,136)<br />
OTHER FINANCING SOURCES (USES)<br />
Proceeds from issuance <strong>of</strong> long-term<br />
debt - 12,510,000 15,219,585 723,043 16,170,801 3,925,920<br />
Transfers from other funds 26,756,343 34,306,986 37,367,884 33,732,673 34,657,404 33,540,530<br />
Transfers to other funds (8,592,860) (12,693,601) (13,716,489) (9,534,503) (14,884,804) (12,583,493)<br />
Total other financing sources and<br />
(uses) 18,163,483 34,123,385 38,870,980 24,921,213 35,943,401 24,882,957<br />
Net change in fund balances $ 1,207,972 $ 2,848,483 $ 2,209,877 $ (8,586,318) $ 14,356,472 $ 8,158,821<br />
Debt Service as a percentage <strong>of</strong> 3.70% 5.27% 5.76% 4.58% 5.07% 6.78%<br />
*Only last six fiscal years shown for comparability to net asset schedules.<br />
G-7 Fiscal Year <strong>2008</strong> Annual Budget
THIS PAGE IS INTENTIONALLY BLANK
Department Tables <strong>of</strong> Organization<br />
Table <strong>of</strong> Contents<br />
Airport ........................................................................................................... G-11<br />
<strong>City</strong> Attorney................................................................................................. G-12<br />
<strong>City</strong> Manager................................................................................................. G-13<br />
Communications .......................................................................................... G-14<br />
Community Development ............................................................................ G-15<br />
Electric<br />
General Manager ..................................................................................... G-16<br />
General Services ..................................................................................... G-17<br />
Customer Service.................................................................................... G-21<br />
Delivery .................................................................................................... G-26<br />
Production ............................................................................................... G-34<br />
Technical Support ................................................................................... G-42<br />
Finance.......................................................................................................... G-47<br />
Fire................................................................................................................. G-48<br />
Human Resources<br />
Staffing & Compensation........................................................................ G-49<br />
Workforce Development & Labor Relations.......................................... G-50<br />
Information Technology............................................................................... G-51<br />
Internal Audit ................................................................................................ G-52<br />
<strong>Lakeland</strong> Center ........................................................................................... G-53<br />
Parks & Recreation<br />
Director..................................................................................................... G-54<br />
Aquatics ................................................................................................... G-55<br />
Cemeteries ............................................................................................... G-55<br />
Cleveland Heights Golf Course.............................................................. G-56<br />
Library ...................................................................................................... G-57<br />
Parks......................................................................................................... G-58<br />
Recreation................................................................................................ G-59<br />
G-9 Fiscal Year <strong>2008</strong> Annual Budget
Department Tables <strong>of</strong> Organization<br />
Table <strong>of</strong> Contents<br />
Police Department<br />
Admin/Direct Reports.............................................................................. G-60<br />
Administrative Services.......................................................................... G-61<br />
Investigative Services............................................................................. G-62<br />
Uniform Patrol Divisions......................................................................... G-63<br />
Public Works<br />
Director..................................................................................................... G-64<br />
Construction and Maintenance .............................................................. G-65<br />
Engineering.............................................................................................. G-66<br />
Facilities Maintenance ............................................................................ G-67<br />
Fleet.......................................................................................................... G-68<br />
Lakes & Stormwater................................................................................ G-69<br />
Solid Waste .............................................................................................. G-70<br />
Traffic ....................................................................................................... G-71<br />
Purchasing & Risk Management................................................................. G-72<br />
Retirement Services..................................................................................... G-73<br />
Wastewater<br />
Administration ......................................................................................... G-74<br />
Collection ................................................................................................. G-75<br />
Treatment ................................................................................................. G-76<br />
Wetlands .................................................................................................. G-77<br />
Water<br />
Administration ......................................................................................... G-78<br />
Distribution .............................................................................................. G-79<br />
Engineering.............................................................................................. G-80<br />
Production ............................................................................................... G-81<br />
G-10 Fiscal Year <strong>2008</strong> Annual Budget
Airport<br />
Legend<br />
Left number= 2007 FTE<br />
Right number= <strong>2008</strong> FTE<br />
G-11 Fiscal Year <strong>2008</strong> Annual Budget
<strong>City</strong> Attorney<br />
Legend<br />
Left number= 2007 FTE<br />
Right number= <strong>2008</strong> FTE<br />
G-12 Fiscal Year <strong>2008</strong> Annual Budget
<strong>City</strong> Manager<br />
Legend<br />
Left number= 2007 FTE<br />
Right number= <strong>2008</strong> FTE<br />
G-13 Fiscal Year <strong>2008</strong> Annual Budget
Communications<br />
Legend<br />
Left number= 2007 FTE<br />
Right number= <strong>2008</strong> FTE<br />
G-14 Fiscal Year <strong>2008</strong> Annual Budget
Community Development<br />
Legend<br />
Left number= 2007 FTE<br />
Right number= <strong>2008</strong> FTE<br />
G-15 Fiscal Year <strong>2008</strong> Annual Budget
Electric: General Manager’s Office<br />
Legend<br />
Left number= 2007 FTE<br />
Right number= <strong>2008</strong> FTE<br />
G-16 Fiscal Year <strong>2008</strong> Annual Budget
Electric: General Services<br />
Overview<br />
See the following Workgroup pages for detailed breakdown.<br />
Legend<br />
Left number= 2007 FTE<br />
Right number= <strong>2008</strong> FTE<br />
G-17 Fiscal Year <strong>2008</strong> Annual Budget
Electric: General Services<br />
Contracts/Administrative Services<br />
Workgroup<br />
Legend<br />
Left number= 2007 FTE<br />
Right number= <strong>2008</strong> FTE<br />
G-18 Fiscal Year <strong>2008</strong> Annual Budget
Electric: General Services<br />
AGM Workgroup<br />
Legend<br />
Left number= 2007 FTE<br />
Right number= <strong>2008</strong> FTE<br />
G-19 Fiscal Year <strong>2008</strong> Annual Budget
Electric: General Services<br />
Legislative and Regulatory<br />
Workgroup<br />
Legend<br />
Left number= 2007 FTE<br />
Right number= <strong>2008</strong> FTE<br />
Safety/Training Workgroup<br />
G-20 Fiscal Year <strong>2008</strong> Annual Budget
Electric: Customer Service<br />
Overview<br />
See the following Workgroup pages for detailed breakdown.<br />
Legend<br />
Left number= 2007 FTE<br />
Right number= <strong>2008</strong> FTE<br />
G-21 Fiscal Year <strong>2008</strong> Annual Budget
Electric: Customer Service<br />
Billing and Collections<br />
Workgroup<br />
Legend<br />
Left number= 2007 FTE<br />
Right number= <strong>2008</strong> FTE<br />
G-22 Fiscal Year <strong>2008</strong> Annual Budget
Electric: Customer Service<br />
Call Center/Customer<br />
Contact Workgroup<br />
Legend<br />
Left number= 2007 FTE<br />
Right number= <strong>2008</strong> FTE<br />
G-23 Fiscal Year <strong>2008</strong> Annual Budget
Electric: Customer Service<br />
Field Services Workgroup<br />
Legend<br />
Left number= 2007 FTE<br />
Right number= <strong>2008</strong> FTE<br />
G-24 Fiscal Year <strong>2008</strong> Annual Budget
Electric: Customer Service<br />
Energy and Business<br />
Services Workgroup<br />
Legend<br />
Left number= 2007 FTE<br />
Right number= <strong>2008</strong> FTE<br />
G-25 Fiscal Year <strong>2008</strong> Annual Budget
Electric: Delivery<br />
Overview<br />
See the following Workgroup pages for detailed breakdown.<br />
Legend<br />
Left number= 2007 FTE<br />
Right number= <strong>2008</strong> FTE<br />
G-26 Fiscal Year <strong>2008</strong> Annual Budget
Electric: Delivery<br />
Business Operations<br />
Workgroup<br />
See the following Workgroup pages for detailed breakdown.<br />
Legend<br />
Left number= 2007 FTE<br />
Right number= <strong>2008</strong> FTE<br />
G-27 Fiscal Year <strong>2008</strong> Annual Budget
Electric: Delivery<br />
Engineering Workgroup<br />
Legend<br />
Left number= 2007 FTE<br />
Right number= <strong>2008</strong> FTE<br />
G-28 Fiscal Year <strong>2008</strong> Annual Budget
Electric: Delivery<br />
Operations Workgroup<br />
Legend<br />
Left number= 2007 FTE<br />
Right number= <strong>2008</strong> FTE<br />
G-29 Fiscal Year <strong>2008</strong> Annual Budget
Electric: Delivery<br />
Right-<strong>of</strong>-Way Workgroup<br />
Legend<br />
Left number= 2007 FTE<br />
Right number= <strong>2008</strong> FTE<br />
G-30 Fiscal Year <strong>2008</strong> Annual Budget
Electric: Delivery<br />
Substation Operations<br />
Workgroup<br />
Legend<br />
Left number= 2007 FTE<br />
Right number= <strong>2008</strong> FTE<br />
G-31 Fiscal Year <strong>2008</strong> Annual Budget
Electric: Delivery<br />
System Control Workgroup<br />
Legend<br />
Left number= 2007 FTE<br />
Right number= <strong>2008</strong> FTE<br />
G-32 Fiscal Year <strong>2008</strong> Annual Budget
Electric: Delivery<br />
Business Operations<br />
Workgroup<br />
Legend<br />
Left number= 2007 FTE<br />
Right number= <strong>2008</strong> FTE<br />
G-33 Fiscal Year <strong>2008</strong> Annual Budget
Electric: Production<br />
Overview<br />
See the following Workgroup pages for detailed breakdown.<br />
G-34 Fiscal Year <strong>2008</strong> Annual Budget
Electric: Production<br />
Administration Workgroup<br />
Legend<br />
Left number= 2007 FTE<br />
Right number= <strong>2008</strong> FTE<br />
G-35 Fiscal Year <strong>2008</strong> Annual Budget
Electric: Production<br />
Business Operations<br />
Workgroup<br />
Legend<br />
Left number= 2007 FTE<br />
Right number= <strong>2008</strong> FTE<br />
G-36 Fiscal Year <strong>2008</strong> Annual Budget
Electric: Production<br />
Engineering Workgroup<br />
Legend<br />
Left number= 2007 FTE<br />
Right number= <strong>2008</strong> FTE<br />
G-37 Fiscal Year <strong>2008</strong> Annual Budget
Electric: Production<br />
Engineering (Supervisor)<br />
Workgroup<br />
Legend<br />
Left number= 2007 FTE<br />
Right number= <strong>2008</strong> FTE<br />
G-38 Fiscal Year <strong>2008</strong> Annual Budget
Electric: Production<br />
Maintenance Workgroup<br />
Legend<br />
Left number= 2007 FTE<br />
Right number= <strong>2008</strong> FTE<br />
G-39 Fiscal Year <strong>2008</strong> Annual Budget
Electric: Production<br />
Operations Workgroup<br />
Legend<br />
Left number= 2007 FTE<br />
Right number= <strong>2008</strong> FTE<br />
G-40 Fiscal Year <strong>2008</strong> Annual Budget
Electric: Production<br />
Special Projects Workgroup<br />
Legend<br />
Left number= 2007 FTE<br />
Right number= <strong>2008</strong> FTE<br />
G-41 Fiscal Year <strong>2008</strong> Annual Budget
Electric: Technical Support<br />
Overview<br />
See the following Workgroup pages for detailed breakdown.<br />
Legend<br />
Left number= 2007 FTE<br />
Right number= <strong>2008</strong> FTE<br />
G-42 Fiscal Year <strong>2008</strong> Annual Budget
Electric: Technical Support<br />
AGM Workgroup<br />
Legend<br />
Left number= 2007 FTE<br />
Right number= <strong>2008</strong> FTE<br />
G-43 Fiscal Year <strong>2008</strong> Annual Budget
Electric: Technical Support<br />
Environmental Permitting<br />
Workgroup<br />
Legend<br />
Left number= 2007 FTE<br />
Right number= <strong>2008</strong> FTE<br />
G-44 Fiscal Year <strong>2008</strong> Annual Budget
Electric: Technical Support<br />
Fuel Purchasing Workgroup<br />
Legend<br />
Left number= 2007 FTE<br />
Right number= <strong>2008</strong> FTE<br />
G-45 Fiscal Year <strong>2008</strong> Annual Budget
Electric: Technical Support<br />
System Planning Workgroup<br />
Legend<br />
Left number= 2007 FTE<br />
Right number= <strong>2008</strong> FTE<br />
G-46 Fiscal Year <strong>2008</strong> Annual Budget
Finance<br />
Legend<br />
Left number= 2007 FTE<br />
Right number= <strong>2008</strong> FTE<br />
G-47 Fiscal Year <strong>2008</strong> Annual Budget
Fire<br />
Legend<br />
Left number= 2007 FTE<br />
Right number= <strong>2008</strong> FTE<br />
G-48 Fiscal Year <strong>2008</strong> Annual Budget
Human Resources: Staffing & Compensation<br />
Legend<br />
Left number= 2007 FTE<br />
Right number= <strong>2008</strong> FTE<br />
G-49 Fiscal Year <strong>2008</strong> Annual Budget
Human Resources: Workforce Development<br />
And Labor Relations<br />
Legend<br />
Left number= 2007 FTE<br />
Right number= <strong>2008</strong> FTE<br />
G-50 Fiscal Year <strong>2008</strong> Annual Budget
Information Technology<br />
Legend<br />
Left number= 2007 FTE<br />
Right number= <strong>2008</strong> FTE<br />
G-51 Fiscal Year <strong>2008</strong> Annual Budget
Internal Audit<br />
Legend<br />
Left number= 2007 FTE<br />
Right number= <strong>2008</strong> FTE<br />
G-52 Fiscal Year <strong>2008</strong> Annual Budget
<strong>Lakeland</strong> Center<br />
Legend<br />
Left number= 2007 FTE<br />
Right number= <strong>2008</strong> FTE<br />
G-53 Fiscal Year <strong>2008</strong> Annual Budget
Parks & Recreation: Director<br />
Legend<br />
Left number= 2007 FTE<br />
Right number= <strong>2008</strong> FTE<br />
G-54 Fiscal Year <strong>2008</strong> Annual Budget
Parks & Recreation: Aquatics and<br />
Cemeteries<br />
Legend<br />
Left number= 2007 FTE<br />
Right number= <strong>2008</strong> FTE
Parks & Recreation: Cleveland Heights<br />
Golf Course<br />
Legend<br />
Left number= 2007 FTE<br />
Right number= <strong>2008</strong> FTE<br />
G-56 Fiscal Year <strong>2008</strong> Annual Budget
Parks & Recreation: Library<br />
Legend<br />
Left number= 2007 FTE<br />
Right number= <strong>2008</strong> FTE<br />
G-57 Fiscal Year <strong>2008</strong> Annual Budget
Parks & Recreation: Parks<br />
Legend<br />
Left number= 2007 FTE<br />
Right number= <strong>2008</strong> FTE<br />
G-58 Fiscal Year <strong>2008</strong> Annual Budget
Parks & Recreation: Recreation<br />
Legend<br />
Left number= 2007 FTE<br />
Right number= <strong>2008</strong> FTE<br />
G-59 Fiscal Year <strong>2008</strong> Annual Budget
Police Department: Admin/Direct Reports<br />
Legend<br />
Left number= 2007 FTE<br />
Right number= <strong>2008</strong> FTE<br />
G-60 Fiscal Year <strong>2008</strong> Annual Budget
Police Department: Administrative Svcs.<br />
Legend<br />
Left number= 2007 FTE<br />
Right number= <strong>2008</strong> FTE<br />
G-61 Fiscal Year <strong>2008</strong> Annual Budget
Police Department: Investigative Services.<br />
Legend<br />
Left number= 2007 FTE<br />
Right number= <strong>2008</strong> FTE<br />
G-62 Fiscal Year <strong>2008</strong> Annual Budget
Police Department: Uniform Patrol<br />
Legend<br />
Left number= 2007 FTE<br />
Right number= <strong>2008</strong> FTE<br />
G-63 Fiscal Year <strong>2008</strong> Annual Budget
Public Works: Director<br />
Legend<br />
Left number= 2007 FTE<br />
Right number= <strong>2008</strong> FTE<br />
G-64 Fiscal Year <strong>2008</strong> Annual Budget
Public Works: Construction & Maintenance<br />
Legend<br />
Left number= 2007 FTE<br />
Right number= <strong>2008</strong> FTE<br />
G-65 Fiscal Year <strong>2008</strong> Annual Budget
Public Works: Engineering<br />
Legend<br />
Left number= 2007 FTE<br />
Right number= <strong>2008</strong> FTE<br />
G-66 Fiscal Year <strong>2008</strong> Annual Budget
Public Works: Facilities Maintenance<br />
Legend<br />
Left number= 2007 FTE<br />
Right number= <strong>2008</strong> FTE<br />
G-67 Fiscal Year <strong>2008</strong> Annual Budget
Public Works: Fleet<br />
Legend<br />
Left number= 2007 FTE<br />
Right number= <strong>2008</strong> FTE<br />
G-68 Fiscal Year <strong>2008</strong> Annual Budget
Public Works: Lakes & Stormwater<br />
Legend<br />
Left number= 2007 FTE<br />
Right number= <strong>2008</strong> FTE<br />
G-69 Fiscal Year <strong>2008</strong> Annual Budget
Public Works: Solid Waste<br />
Legend<br />
Left number= 2007 FTE<br />
Right number= <strong>2008</strong> FTE<br />
G-70 Fiscal Year <strong>2008</strong> Annual Budget
Public Works: Traffic<br />
Legend<br />
Left number= 2007 FTE<br />
Right number= <strong>2008</strong> FTE<br />
G-71 Fiscal Year <strong>2008</strong> Annual Budget
Purchasing & Risk Management<br />
Legend<br />
Left number= 2007 FTE<br />
Right number= <strong>2008</strong> FTE<br />
G-72 Fiscal Year <strong>2008</strong> Annual Budget
Retirement Services<br />
Legend<br />
Left number= 2007 FTE<br />
Right number= <strong>2008</strong> FTE<br />
G-73 Fiscal Year <strong>2008</strong> Annual Budget
Wastewater: Administration<br />
Legend<br />
Left number= 2007 FTE<br />
Right number= <strong>2008</strong> FTE<br />
G-74 Fiscal Year <strong>2008</strong> Annual Budget
Wastewater: Collection<br />
Legend<br />
Left number= 2007 FTE<br />
Right number= <strong>2008</strong> FTE<br />
G-75 Fiscal Year <strong>2008</strong> Annual Budget
Wastewater: Treatment<br />
Legend<br />
Left number= 2007 FTE<br />
Right number= <strong>2008</strong> FTE<br />
G-76 Fiscal Year <strong>2008</strong> Annual Budget
Wastewater: Wetlands<br />
Legend<br />
Left number= 2007 FTE<br />
Right number= <strong>2008</strong> FTE<br />
G-77 Fiscal Year <strong>2008</strong> Annual Budget
Water: Administration<br />
Legend<br />
Left number= 2007 FTE<br />
Right number= <strong>2008</strong> FTE<br />
G-78 Fiscal Year <strong>2008</strong> Annual Budget
Water: Distribution<br />
Legend<br />
Left number= 2007 FTE<br />
Right number= <strong>2008</strong> FTE<br />
G-79 Fiscal Year <strong>2008</strong> Annual Budget
Water: Engineering<br />
Legend<br />
Left number= 2007 FTE<br />
Right number= <strong>2008</strong> FTE<br />
G-80 Fiscal Year <strong>2008</strong> Annual Budget
Water: Production<br />
Legend<br />
Left number= 2007 FTE<br />
Right number= <strong>2008</strong> FTE<br />
G-81 Fiscal Year <strong>2008</strong> Annual Budget
<strong>City</strong> <strong>of</strong> <strong>Lakeland</strong>, Florida<br />
228 South Massachusetts Avenue<br />
<strong>Lakeland</strong>, Florida 33801-5086<br />
www.lakelandgov.net<br />
863-834-6000