2010 - City of Lakeland
2010 - City of Lakeland
2010 - City of Lakeland

You also want an ePaper? Increase the reach of your titles
YUMPU automatically turns print PDFs into web optimized ePapers that Google loves.
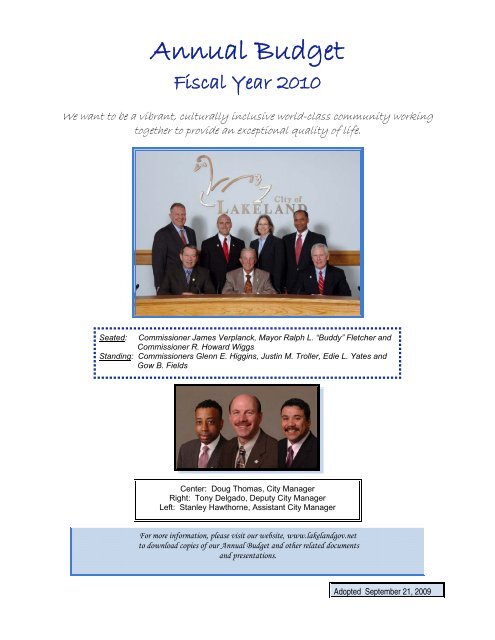
Annual Budget<br />
Fiscal Year <strong>2010</strong><br />
We want to be a vibrant, culturally inclusive world-class community working<br />
together to provide an exceptional quality <strong>of</strong> life.<br />
Seated: Commissioner James Verplanck, Mayor Ralph L. “Buddy” Fletcher and<br />
Commissioner R. Howard Wiggs<br />
Standing: Commissioners Glenn E. Higgins, Justin M. Troller, Edie L. Yates and<br />
Gow B. Fields<br />
Center: Doug Thomas, <strong>City</strong> Manager<br />
Right: Tony Delgado, Deputy <strong>City</strong> Manager<br />
Left: Stanley Hawthorne, Assistant <strong>City</strong> Manager<br />
For more information, please visit our website, www.lakelandgov.net<br />
to download copies <strong>of</strong> our Annual Budget and other related documents<br />
and presentations.<br />
Adopted September 21, 2009
The Government Finance Officers Association <strong>of</strong> the United States and Canada (GFOA) presented a<br />
Distinguished Budget Presentation Award to <strong>City</strong> <strong>of</strong> <strong>Lakeland</strong>, Florida for the Annual Budget beginning<br />
October 01, 2008. In order to receive this award, a governmental unit must publish a budget document<br />
that meets program criteria as a policy document, as an operations guide, as a financial plan, and as a<br />
communications device.<br />
This award is valid for a period <strong>of</strong> one year only. We believe our current budget continues to conform to<br />
program requirements, and we are submitting it to the GFOA to determine its eligibility for another<br />
award.<br />
A-1 Fiscal Year <strong>2010</strong> Annual Budget
How to Use This Book<br />
We’ve made every effort to make this book as<br />
easy as possible to read, but we understand<br />
just how difficult it can be to find what you’re<br />
looking for in such a complex document. To<br />
make your search easier, we’ve provided a<br />
number <strong>of</strong> tools to help you get what you need.<br />
either technical in nature or unique to the <strong>City</strong><br />
<strong>of</strong> <strong>Lakeland</strong>. Each term is given a short entry<br />
that defines it within the context that we use<br />
the term. Table <strong>of</strong> Organizations and Position<br />
Management totals are also included by<br />
Department.<br />
Organization <strong>of</strong> This Book<br />
Table <strong>of</strong> Contents<br />
The <strong>City</strong> <strong>of</strong> <strong>Lakeland</strong>’s Annual Budget is made<br />
up <strong>of</strong> two separate books: The Annual Budget<br />
(this book) and the Business Plan.<br />
This Annual Budget volume is divided into<br />
seven sections:<br />
The main Table <strong>of</strong> Contents starts on page A-3<br />
and provides an overview <strong>of</strong> the different<br />
sections <strong>of</strong> the book. Each section <strong>of</strong> the<br />
document also has a Table <strong>of</strong> Contents for<br />
easy page referencing.<br />
Introduction - This section contains the <strong>City</strong><br />
Manager’s Letter <strong>of</strong> Transmittal, Organization<br />
Chart, the <strong>City</strong>’s Vision, Mission and Values, a<br />
few brief statistics about the <strong>City</strong> and its<br />
history.<br />
Budget Overview - A discussion <strong>of</strong> the Budget<br />
Highlights for FY<strong>2010</strong>, financial policies, and<br />
the Budget Process Overview.<br />
Long-Range Planning - The analysis and data<br />
that went into the development <strong>of</strong> the budget,<br />
specifically our planning and forecasting<br />
activities.<br />
Performance Budget - Performance and Core<br />
Service data from the Business Plan and<br />
performance-based budgets for all<br />
departments.<br />
Line Item Budget - Detailed Fund Accounting.<br />
Capital Improvement Plan (CIP) - This section<br />
provides the <strong>City</strong>’s 10-year CIP and projected<br />
funds.<br />
Supplementary - Miscellaneous information<br />
regarding largest taxpayers, property tax rates<br />
and revenues. A useful list <strong>of</strong> abbreviations<br />
and acronyms used in the book is also<br />
included in this section, along with a Glossary<br />
<strong>of</strong> the terminology used in this document that is<br />
Key Tools<br />
Callout Text<br />
Interesting facts<br />
have been included<br />
in callout boxes<br />
located throughout<br />
the document.<br />
<strong>City</strong> Organization Chart A-12<br />
Vision, Mission, Goals & Outcomes A-14<br />
Budget Summary (Charts/Graphs) B-3<br />
Staffing Changes by Fund B-10<br />
Core Values C-3<br />
Outcomes C-4<br />
Financial Health and Strategy C-12<br />
Performance/Program<br />
D<br />
<strong>City</strong>-Wide Key Success Indicators D-4<br />
Process Improvement Teams D-14<br />
Department Performance Levels D-16<br />
Core Services by Program Overview D-35<br />
Line Item Budget<br />
E<br />
Capital Improvement Plan<br />
F<br />
Dept. Organization Charts/Position Mgmt. G-15<br />
A-2 Fiscal Year <strong>2010</strong> Annual Budget
Table <strong>of</strong> Contents<br />
Introduction ................................................................................................................... Section—A<br />
Government Finance Officers Association Award .................................................... A-1<br />
How to Use This Book ................................................................................................... A-2<br />
<strong>City</strong> Manager’s Letter .................................................................................................... A-5<br />
<strong>City</strong> Organization Chart ............................................................................................. A-12<br />
Vision, Mission, Goals and Outcomes ...................................................................... A-14<br />
<strong>Lakeland</strong> at a Glance ................................................................................................... A-16<br />
Service Statistics ......................................................................................................... A-17<br />
History <strong>of</strong> <strong>Lakeland</strong> ..................................................................................................... A-18<br />
Budget Overview .......................................................................................................... Section—B<br />
Budget Highlights .......................................................................................................... B-2<br />
Budget Summary (Graphs/Charts) .............................................................................. B-3<br />
Ad Valorem Taxes ......................................................................................................... B-9<br />
Staffing Changes by Fund ......................................................................................... B-10<br />
Employee/Population Growth .................................................................................... B-11<br />
Overview and Financial Policies ................................................................................ B-12<br />
Budget Process Overview .......................................................................................... B-16<br />
Long-Range Planning .................................................................................................. Section—C<br />
Long-Range Planning Overview & Mission Statement .............................................. C-2<br />
Core Values .................................................................................................................... C-3<br />
Outcomes ....................................................................................................................... C-4<br />
Environmental Scan ...................................................................................................... C-9<br />
Financial Health and Strategy .................................................................................... C-12<br />
Revenue Sources ........................................................................................................ C-18<br />
Debt Management Overview ...................................................................................... C-23<br />
Performance Budget .................................................................................................... Section—D<br />
Performance Budget Overview .................................................................................... D-2<br />
Measuring Results ......................................................................................................... D-3<br />
Key Success Indicators (KSI’s) .................................................................................... D-4<br />
Service and Operations Strategy ............................................................................... D-13<br />
Process Improvement Teams .................................................................................... D-14<br />
Department Performance Levels ............................................................................... D-16<br />
Core Services by Program Overview ........................................................................ D-35<br />
Program Performance Levels<br />
Economic and Community Development .................................................... D-37<br />
Community Safety .......................................................................................... D-40<br />
Transportation Services ................................................................................ D-43<br />
Legislative Activities ...................................................................................... D-44<br />
Environmental and Utility Services .............................................................. D-46<br />
Cultural and Community Services ................................................................ D-48<br />
Parks, Recreation and Properties ................................................................. D-50<br />
Support Services ............................................................................................ D-52<br />
A-3 Fiscal Year <strong>2010</strong> Annual Budget
Table <strong>of</strong> Contents<br />
Line Item Budget ........................................................................................................... Section—E<br />
Funds Overview ............................................................................................................. E-2<br />
<strong>City</strong>-Wide Fund Totals .................................................................................................. E-5<br />
General Fund ................................................................................................................. E-7<br />
Community Development - Affordable Housing ...................................................... E-77<br />
Community Redevelopment Agency ......................................................................... E-81<br />
Debt Service ................................................................................................................. E-87<br />
Fleet Management ....................................................................................................... E-89<br />
Purchasing and Stores ............................................................................................... E-95<br />
Facilities Maintenance ................................................................................................ E-99<br />
Information Technology ........................................................................................... E-105<br />
Wastewater Utility ..................................................................................................... E-119<br />
Water Utility ................................................................................................................ E-133<br />
Parking ....................................................................................................................... E-147<br />
The <strong>Lakeland</strong> Center ................................................................................................. E-155<br />
Cleveland Heights Golf Course ................................................................................ E-165<br />
<strong>Lakeland</strong> Linder Regional Airport ............................................................................ E-171<br />
Solid Waste ................................................................................................................ E-181<br />
Lakes and Stormwater .............................................................................................. E-187<br />
Electric Utility ............................................................................................................. E-191<br />
Capital Improvement Plan ............................................................................................ Section—F<br />
CIP Overview ................................................................................................................. F-2<br />
Transportation ............................................................................................................... F-5<br />
Public Improvement .................................................................................................... F-10<br />
Downtown Community Redevelopment Area .......................................................... F-18<br />
Mid Town Community Redevelopment Area ............................................................ F-19<br />
Dixieland Community Redevelopment Area ............................................................. F-21<br />
Parking ......................................................................................................................... F-22<br />
The <strong>Lakeland</strong> Center ................................................................................................... F-23<br />
<strong>Lakeland</strong> Linder Regional Airport .............................................................................. F-24<br />
Stormwater ................................................................................................................... F-25<br />
Wastewater Utility ....................................................................................................... F-28<br />
Water Utility .................................................................................................................. F-35<br />
Electric Utility ............................................................................................................... F-39<br />
Supplementary Information ......................................................................................... Section—G<br />
Largest Taxpayers ......................................................................................................... G-2<br />
Schedule <strong>of</strong> Property Tax Rates .................................................................................. G-3<br />
General Fund Property Tax Levies and Collections .................................................. G-4<br />
Governmental Activities Tax Revenues by Source ................................................... G-6<br />
Changes in Fund Balances <strong>of</strong> Governmental Funds ................................................. G-7<br />
Glossary <strong>of</strong> Terms ......................................................................................................... G-8<br />
Abbreviations & Acronyms ........................................................................................ G-13<br />
Department Tables <strong>of</strong> Organization/Position Management Totals ........................ G-15<br />
A-4 Fiscal Year <strong>2010</strong> Annual Budget
September 9, 2009<br />
Honorable Mayor and <strong>City</strong> Commissioners:<br />
Submitted herewith for your consideration are the <strong>City</strong> <strong>of</strong> <strong>Lakeland</strong> Proposed Fiscal Year <strong>2010</strong> Annual<br />
<strong>City</strong> Budget and the <strong>2010</strong>-2019 Capital Improvement Program Budgets. These documents represent<br />
the sixth financial, operational and capital plans prepared since my appointment as <strong>City</strong> Manager in<br />
2003, and I believe you will find them to be fiscally responsible in light <strong>of</strong> the historic recession our<br />
economy is currently experiencing.<br />
Historic Economic Times Results in Evolution <strong>of</strong> <strong>Lakeland</strong>’s Budgeting Process<br />
The <strong>City</strong> has been operating and refining its innovative Strategic Operating Plan (SOP) since its<br />
development roughly five years ago. The SOP is not only intended to be a statement <strong>of</strong> <strong>Lakeland</strong>’s<br />
goals, values and desired outcomes that articulate what the community strives to attain, but also serves<br />
as the foundation in which the municipal organization can best align our programs, policies, procedures,<br />
human capital and resources in a coordinated fashion in support <strong>of</strong> the community’s shared vision. This<br />
alignment has been taken to new heights in FY <strong>2010</strong> as the <strong>City</strong> developed its new “Budget by Priorities”<br />
process to better define the varied and numerous Municipal Core Services (along with their respective<br />
costs and revenues) provided to our constituents and comparatively evaluate their respective influence<br />
on achieving the SOP’s Goals and Outcomes. This process is specifically designed to provide a higher<br />
degree <strong>of</strong> understanding among decision makers regarding the scope, costs and impact <strong>of</strong> the various<br />
Core Services and better articulate how we value our services, invest in our priorities and ultimately<br />
divest ourselves <strong>of</strong> lower priority services.<br />
The “Budget by Priorities” approach is intended to be a more progressive budget strategy in response to<br />
fiscal restraints than traditional “across the board” budget cuts many municipalities employ in their efforts<br />
to treat budget cuts “equitably” among departments. The problem with the “across the board” approach<br />
is that all Core Services do not equally influence a <strong>City</strong>’s SOP, so one could question why certain Core<br />
Services that have a greater influence on supporting the SOP be cut to the same extent as those<br />
services that have little to no impact? In a similar fashion, household budgets are not uniformly cut in<br />
response to constrained revenues, as expenses such as mortgage payments, insurance, utilities and<br />
essential food costs are likely to remain constant, but more discretionary expenses like eating out,<br />
entertainment, etc. are undoubtedly trimmed in response to reduced household income. Revenue<br />
projections for the upcoming 3-year period assume no increases in property<br />
tax revenues, limited growth in sales tax revenues, a 2% growth in utility<br />
dividend revenues due to sales and flat revenue trends for most other revenue<br />
sources. Against the backdrop <strong>of</strong> these projected future revenue constraints,<br />
the more targeted Budget by Priorities approach served as the foundation for<br />
the following budget policies that were implemented in the development <strong>of</strong> the<br />
proposed FY <strong>2010</strong> Budget:<br />
A-5 Fiscal Year <strong>2010</strong> Annual Budget
FY <strong>2010</strong> Budget Policies<br />
1. Proposed Millage Rate<br />
The FY 2009 Total Taxable Value <strong>of</strong> $5,977,719,387 at the current 3.4031 millage rate generates<br />
roughly $19.3 million. The comparable FY <strong>2010</strong> taxable valuation (less new construction) <strong>of</strong><br />
$5,355,150,411 represents a reduction <strong>of</strong> $622,568,976 or a 10.4% decline. Pursuant to Florida’s<br />
TRIM requirements, municipalities are eligible to receive the same level <strong>of</strong> property tax proceeds at a<br />
corresponding millage rate that is equal to the previous year, plus any tax proceeds from new<br />
construction, without the millage rate being advertised as an increase. That so called “rollback” (or<br />
sometimes “rollup”) rate would equate to a millage <strong>of</strong> 3.7734 in FY <strong>2010</strong>, which would result in a total<br />
gross property tax yield <strong>of</strong> $ 19.7 million, or roughly a $450,000 increase from the current year. Based<br />
upon preliminary budget deliberations with the <strong>City</strong> Commission, it was determined that the FY <strong>2010</strong><br />
Budget should be based upon a millage rate that would yield no greater net<br />
property tax revenues for General Fund operations, including new<br />
construction, and less tax revenues transferred to CRA districts, than the<br />
comparable net amount collected in FY 2009. In other words, the <strong>City</strong> would<br />
consciously defer tax receipts associated with the roughly $159 million <strong>of</strong> new<br />
taxable investment value, and propose a millage rate <strong>of</strong> 3.6538 which will<br />
yield the same net tax revenues <strong>of</strong> $18.3 million for General Fund operations<br />
as was received in FY 2009. This policy position was taken in recognition <strong>of</strong><br />
the economic recession that has challenged our nation, our state and most notably our own<br />
community. The strategy also means that on average, taxpayers will pay less in property taxes in FY<br />
<strong>2010</strong> than they paid in FY 2009 in that all property taxpayers will receive the proportionate benefit <strong>of</strong><br />
the <strong>City</strong> Commission’s decision to forgo property tax revenues associated with new construction in the<br />
upcoming year.<br />
More specifically, the proposed millage rate <strong>of</strong> 3.6538 on an “average” <strong>Lakeland</strong> Homestead property<br />
taxpayer with a residential Homestead value <strong>of</strong> $64,354 will experience a 1.1% property tax bill<br />
reduction. Similarly, the “average” residential Non-Homestead residential property will experience a<br />
1.4% reduction in their tax bill in the upcoming fiscal year. Development <strong>of</strong> an “average” for<br />
commercial and industrial properties is less meaningful given the vast valuation differences inherent<br />
among such properties, however it should be noted that a tax shift between Homestead properties<br />
versus Non-Homestead, Commercial and Industrial properties is inherent in the administration <strong>of</strong> ad<br />
valorem tax liabilities in light <strong>of</strong> the applicability <strong>of</strong> “Save Our Homes” and Amendment 1 provisions<br />
that have been approved by Florida voters.<br />
2. “Global” Wage/Merit Freezes and Benefit Costs<br />
By far, the single largest expense category within a typical municipality’s General Fund is payroll and<br />
benefits, and <strong>Lakeland</strong>’s budget is by no means an exception to this trend with proposed FY <strong>2010</strong><br />
payroll and benefit costs <strong>of</strong> $68.5 million representing 70% <strong>of</strong> the budget. Given such, it is very<br />
difficult to address the projected significant revenue constraints without impacting payroll costs in<br />
some fashion. The <strong>City</strong>’s Classification & Compensation Plans typically provide for merit steps for<br />
employees that have not reached the maximum <strong>of</strong> their respective classification Pay Grade/Band<br />
being eligible for anywhere from a 0 to 5% merit increase based upon their Annual Performance<br />
Planning and Review (PPR). (Merit pay administration for employees covered by Collective Bargaining<br />
Agreements (CBA) is similar, but not necessarily identical based upon the particular CBA.) In light <strong>of</strong><br />
the projected fiscal constraints in the upcoming year, the FY <strong>2010</strong> Budget has been prepared by<br />
freezing merit increases for employees who would otherwise be eligible for increases. This approach<br />
represents a budget savings <strong>of</strong> approximately $1.1 million in the General Fund and $3.1 million across<br />
all funds. Furthermore, the FY <strong>2010</strong> Budget does not include any “across the board” annual increases<br />
for the same reason. CBA’s with the Police Benevolent Association (PBA) and the International<br />
Association <strong>of</strong> Fire Fighters (IAFF) will both be expired by the start <strong>of</strong> the FY <strong>2010</strong> and negotiations<br />
that are presently underway with both unions have advanced the same merit pay freeze and no<br />
A-6 Fiscal Year <strong>2010</strong> Annual Budget
“across the board increases” as has been done with general non-unionized employees. (Due to the<br />
declaration <strong>of</strong> an impasse over wages by the Utility Workers Union <strong>of</strong> America (UWUA) in conjunction<br />
with their inaugural CBA, negotiations with <strong>Lakeland</strong> Electric unionized employees are currently on hold<br />
pending the review <strong>of</strong> recommendations by an appointed Special Master.)<br />
While the freezing <strong>of</strong> merits and the decision not to award “across the board”<br />
wage increases is similarly being implemented by many local governments<br />
across Florida and the country, unlike many <strong>of</strong> our sister cities, <strong>Lakeland</strong> is not<br />
facing significant employee lay<strong>of</strong>fs. This is a result <strong>of</strong> our previous budget<br />
strategies involving vacant position freezes and a conscious decision to increase<br />
the General Fund Balance to roughly $10.7 million or 12% <strong>of</strong> the budget. This<br />
surplus is projected to be used judiciously over the next three fiscal years to<br />
s<strong>of</strong>ten program impacts associated with budget cuts as the country recovers<br />
from the current recession. Although the reserves are proposed to be reduced<br />
each year, the strategy will still allow the organization to adhere to its 7.5%<br />
reserve target at the end <strong>of</strong> the 3-year period from FY <strong>2010</strong> to FY 2012 at 9.8%,<br />
7.6% and 6.0% respectively.<br />
With respect to benefits, the <strong>City</strong> operates a self-insured health insurance plan<br />
and similar to the industry as a whole, premium costs are projected to increase<br />
considerably in the upcoming year. Left unchecked, the organization would be<br />
facing approximately a 20% increase in premiums, and various plan adjustments<br />
will need to be implemented in an effort to limit premium increases to roughly 12%.<br />
The premium increases are proposed to be advanced equally to both general nonunionized<br />
employees and those covered by CBA’s.<br />
3. Increased Pension Obligations<br />
Not surprisingly, losses sustained in the stock market in response to the current recession have<br />
substantially lowered investment yields in the <strong>City</strong>’s various defined benefit retirement plans. In March<br />
<strong>of</strong> 2009, the actuary estimated that the General Employees Pension Plan could require up to a 10%<br />
increase over the next three years. The <strong>City</strong> is legally obligated to fund these costs unless benefit<br />
changes are implemented that would reduce costs or yields on the portfolio consistently recover the<br />
assumed rate <strong>of</strong> return or better for 2009 and beyond. Since that time, that markets have rebounded to<br />
some extent, although as <strong>of</strong> the end <strong>of</strong> July 2009, the FYTD fund’s earnings were a negative 3.76%. For<br />
FY <strong>2010</strong>, the employer pension contribution is required to increase approximately 2.0% from the current<br />
15.39%, representing an annual increase <strong>of</strong> $2.1 million. The FY <strong>2010</strong> Budget has been developed<br />
based upon a 2.8% increase in pension costs, which may be able to be reduced slightly to provide<br />
additional funding to address the increased Health Insurance Fund costs discussed above. I previously<br />
appointed a Retirement and Health Insurance Task Force that has been evaluating a number <strong>of</strong> issues<br />
associated with the <strong>City</strong>’s health insurance and retirement programs, and it is hoped that the projected<br />
pension increases over the next several years can be mitigated through various<br />
modifications. These increased costs however, largely contributed to the decision<br />
to freeze merit pay and eliminate consideration <strong>of</strong> any “across the board”<br />
increases as there simply is insufficient funding to cover discretionary<br />
compensation increases versus defined benefit obligations which are mandatory<br />
under Florida Statutes.<br />
4. “Budget By Priority” Departmental Targets<br />
The new “Budget by Priorities” model discussed above which was adopted by the <strong>City</strong> in advance <strong>of</strong> the<br />
development <strong>of</strong> the FY <strong>2010</strong> Budget became the cornerstone in which individual Departmental budget<br />
targets were established. Every Department developed a listing <strong>of</strong> Core Municipal Services and<br />
allocated respective expenses and revenues for each such service. General Fund Departments<br />
respective Core Services were then evaluated and ranked with a raw score relative to their influence<br />
A-7 Fiscal Year <strong>2010</strong> Annual Budget
on achieving the Outcomes in the <strong>City</strong>’s SOP, coupled with other factors including the degree to which<br />
the Core Service covered any or all <strong>of</strong> its costs through fees or rates; whether demand for the service<br />
was increasing or decreasing; if the service was required by federal, state or local laws, regulations or<br />
polices; and lastly, special <strong>City</strong> Commission consideration based upon community expectations <strong>of</strong> the<br />
particular ranking <strong>of</strong> the services. The final ranked Core Services were then divided into roughly four<br />
equal quartiles. Departmental budget reduction targets were then established based upon the following<br />
schedule: 1.75% - Quadrant 1 Services; 2.00% - Quadrant 2 Services; 2.25% - Quadrant 3 Services;<br />
and 2.50% - Quadrant 4 Services.<br />
In that this was the first year, the <strong>City</strong> utilized the new “Budget by Priorities”<br />
Model, Departments were not required to cut Core Services by the above<br />
percentages based on their quartile rankings; rather the overall Departmental<br />
budget target was established by the cumulative impact <strong>of</strong> their respective Core<br />
Services rankings. Accordingly, Departmental budget targets on average<br />
resulted in 2% cuts from current Fiscal Year controllable costs, less<br />
compensation built-ins, one-time projects and any carryovers. Governance<br />
Departments and Internal Service Funds (involving operations and services that are provided internally<br />
such as Human Resources, Finance, Risk Management, Information Technology, Fleet Maintenance,<br />
etc.) that provide general support to operational Departments that ultimately deliver services to the<br />
general public were similarly provided 2% budget reduction targets and were also subjected to the same<br />
“global” wage and benefit freezes. Although a 2% budget reduction in controllable costs may not appear<br />
significant given the projected financial constraints, please keep in mind that the freezing <strong>of</strong><br />
compensation increases largely addressed the projected budget shortfalls, and the remaining<br />
Departmental operational cuts come on top <strong>of</strong> roughly $11 million cuts in FY 2008 and a FY 2009<br />
Budget mandate that Departmental expenses could be no greater than their original FY 2008 approved<br />
Budgets.<br />
Enterprise Operations, such as <strong>Lakeland</strong> Electric, Water, Wastewater, Solid Waste, etc. were subjected<br />
to the same “global” wage and merit freezes, increased pension obligations and increased health<br />
insurance costs as all other operations. Enterprise Funds were not provided specific budget target<br />
reductions in that such operations are expected to fully cover their costs and generate a sufficient pr<strong>of</strong>it<br />
to meet ongoing operational, capital and dividend payments. That said, dividend percentages or<br />
methodologies generated by Enterprise operations have not been increased in FY <strong>2010</strong>, other than that<br />
generated by corresponding increases in projected sales and services.<br />
It is important to note that Departments have consistently controlled operational costs in a variety <strong>of</strong><br />
ways, including eliminating vacant personnel positions whenever possible. In FY 2007 the <strong>City</strong><br />
employed 2,215 full-time equivalent (FTE) positions. This figure was reduced by 15.5 FTE’s in FY 2008,<br />
65 FTE’s in FY 2009 and an additional 52.5 FTE’s in FY <strong>2010</strong> resulting in 133 fewer FTE’s in the 3-year<br />
period. It should be stated that while many assume the elimination <strong>of</strong> a vacant position does not impact<br />
services, such thinking mistakenly negates the value and contributions <strong>of</strong> the previously filled position as<br />
well as the future assistance it would have provided towards the advancement <strong>of</strong> the respective<br />
Department’s mission and the <strong>City</strong>’s overall SOP.<br />
5. Red Light Camera Enforcement Program Revenues<br />
Without doubt, one <strong>of</strong> the most significant public policy issues currently being debated in the community<br />
concerns the implementation <strong>of</strong> the Red Light Camera (RLC) Enforcement Program. The <strong>City</strong><br />
Commission implemented the RLC Program, after working with other entities in the state with the<br />
expressed goal <strong>of</strong> establishing statewide standards for RLC Enforcement Programs. Following inaction<br />
to enact a uniform RLC State Statute for the last two Legislative Sessions, the <strong>City</strong> proceeded with its<br />
own program in June <strong>of</strong> 2009. The <strong>City</strong>’s RLC fine structure consists <strong>of</strong> the first two citations issued at<br />
$125 each and subsequent tickets at $250.00 each. Under the agreement with our vendor, American<br />
Traffic Solutions (ATS), they receive the first $125 from each violation from each camera daily; receive<br />
$25 from the next 2 violations per camera daily; and receive $10 from each remaining violation daily.<br />
The balance <strong>of</strong> fines goes directly to the <strong>City</strong>. In the first three months <strong>of</strong> the program, over 9,000<br />
A-8 Fiscal Year <strong>2010</strong> Annual Budget
citations have been issued resulting in a net <strong>of</strong> roughly $410,000 fines paid to date, although this<br />
number will undoubtedly change given delays in payments due to appeals and payment deadlines. It is<br />
clearly too early in the RLC Program to determine when the current pace <strong>of</strong> infractions will begin to taper<br />
<strong>of</strong>f to predict with any accuracy what future trends may reveal about the number <strong>of</strong> infractions and<br />
resulting revenue that may be generated.<br />
The <strong>City</strong> Commission’s interest to proceed with a RLC Enforcement<br />
Program has always had as its goals to improve public safety and<br />
modify driving behavior, but I believe it was a surprise to almost<br />
everyone how prevalent violations were occurring as evidenced by<br />
the infractions that are being captured by cameras at only five<br />
controlled intersections. Although the program has and continues to<br />
be about improving public safety, the inevitable question arises about<br />
how the proceeds <strong>of</strong> the RLC Enforcement Program should be used.<br />
This issue has risen in importance given the recent class action suit<br />
which has challenged the legality <strong>of</strong> the <strong>City</strong>’s RLC Ordinance and seeks repayment <strong>of</strong> fines collected<br />
plus undisclosed damages. Although the <strong>City</strong> believes its RLC Program will ultimately be upheld in the<br />
court system, the <strong>City</strong> Attorney’s Office has understandably cautioned the <strong>City</strong> Commission regarding<br />
the spending <strong>of</strong> the revenues pending the results <strong>of</strong> the legal challenge.<br />
In light <strong>of</strong> the above, I have proposed the use <strong>of</strong> $174,000 in RLC revenues to <strong>of</strong>fset additional budget<br />
cuts that the <strong>Lakeland</strong> Police Department (LPD) would otherwise need to implement to achieve their FY<br />
<strong>2010</strong> Budget target. If such was not done, it would likely have resulted in the lay<strong>of</strong>f <strong>of</strong> sworn personnel<br />
which would be counterproductive to the public safety goals the <strong>City</strong> Commission was striving to achieve<br />
under the RLC Program. Furthermore, the <strong>City</strong>’s RLC Program involves a second review <strong>of</strong> infractions<br />
by sworn LPD Traffic Division personnel prior to issuing notices <strong>of</strong> violations. I have also proposed the<br />
use <strong>of</strong> an additional $40,000 in RLC fine revenues to hire two part-time sworn Reserve Officers who<br />
would be fully dedicated to the RLC Program so that the current full-time sworn Traffic Division<br />
personnel can perform their other normal duties.<br />
Lastly, I am proposing that the balance <strong>of</strong> any RLC revenue be deposited in the <strong>City</strong>’s Cultural<br />
Assistance Trust Fund which was established several years ago in an effort to provide an ongoing<br />
funding source to support area Cultural Assistance Programs and Community Support Service<br />
organizations. You may recall that in response FY 2009 fiscal restraints, the <strong>City</strong> eliminated all General<br />
Fund support to such organizations (representing roughly $340,000) opting instead to use the Trust<br />
Fund’s interest earnings (approximately $65,000) plus a portion <strong>of</strong> the Fund’s corpus to maintain support<br />
to the organizations at historical levels approximating $400,000.<br />
Recognizing the meaningful contributions these groups provide to the <strong>Lakeland</strong> area and the supporting<br />
role they play in advancing our SOP, I have proposed that contributions for the upcoming year to<br />
existing Cultural Assistance Grant recipients be frozen at their current levels and that funding to<br />
proposed Community Support Service Agencies recipients as recommended by the Citizen’s Advisory<br />
Committee (CAC) be derived from the use <strong>of</strong> the Cultural Assistance Trust Fund interest earnings with<br />
the remaining amount deducted from the Trust Fund corpus. The difference this year is that the<br />
revenues from the RLC Program will likely increase the Trust Fund’s corpus, which is currently at<br />
approximately $1.7 million, as opposed to reducing it by maintaining current levels <strong>of</strong> contributions to<br />
area organizations. The Finance Department has estimated that the Trust Fund will need to develop a<br />
corpus <strong>of</strong> approximately $8 million and earn an interest rate <strong>of</strong> 4% to provide sufficient interest yields to<br />
support existing organizations at their current level. Depending upon future trends with RLC violations,<br />
this strategy may provide a long term solution to the <strong>City</strong> Commission’s goals <strong>of</strong> maintaining financial<br />
support to Cultural Assistance Programs and Community Support Service organizations in an era <strong>of</strong><br />
fiscal uncertainty.<br />
A-9 Fiscal Year <strong>2010</strong> Annual Budget
Proposed FY <strong>2010</strong> Budget Basics<br />
FY 2009<br />
Budget<br />
FY <strong>2010</strong><br />
Proposed<br />
Budget<br />
% Change<br />
Budget/<br />
Proposed<br />
Total <strong>City</strong> Budget<br />
(Less Intra-<strong>City</strong><br />
Transactions)<br />
General Fund<br />
Less Intra-<strong>City</strong><br />
Transactions)<br />
$603,719,491 $541,829,808 (10.3)%<br />
$87,025,239 $88,936,922 2.2%<br />
Given the above background information, I am proposing a FY <strong>2010</strong> Total <strong>City</strong> Budget <strong>of</strong> $541,829,808<br />
and a General Fund Budget <strong>of</strong> $88,936,922 which is net <strong>of</strong> intra-city transactions. A significant<br />
component <strong>of</strong> the Total <strong>City</strong> Budget decrease from 2009 to <strong>2010</strong> is a reduction in fuel costs and capital<br />
spending within <strong>Lakeland</strong> Electric. The Proposed Budget also includes a 7.5% increase in Wastewater<br />
flow charges and a 15% High Strength surcharge to support a $1.9 million increase in debt service<br />
associated with various capital improvements including the completion <strong>of</strong> the new West <strong>Lakeland</strong><br />
Wasteload Reduction Facility; a projected increase <strong>of</strong> 0.04468 per KWH in the <strong>Lakeland</strong> Electric<br />
Environmental Compliance surcharge for a total new charge <strong>of</strong> 0.27175 cents per KWH (Largely due to<br />
the installation <strong>of</strong> the SCR environmental equipment installed on Macintosh Unit #3); increased Building<br />
Inspection fees; and a 10% increase in cemetery rates. Additional information regarding the various<br />
proposed rate and fee increases can be found in their respective Performance Levels information in the<br />
Performance Budget section <strong>of</strong> this document.<br />
Conclusion<br />
The format <strong>of</strong> the FY <strong>2010</strong> Annual Budget Book builds upon the success <strong>of</strong> the current Budget<br />
document that received the Government Finance Officers Association (GFOA) “Distinguished Budget<br />
Presentation Award” in recognition <strong>of</strong> its layout, planning, content and overall presentation. The award is<br />
noteworthy in that it is bestowed on only a small percentage <strong>of</strong> public organizations. It is believed that<br />
the FY <strong>2010</strong> Proposed Budget which fully incorporates the <strong>City</strong>’s Strategic Planning process with the<br />
annual allocation <strong>of</strong> financial resources represents an excellent opportunity for the <strong>City</strong> Commission,<br />
staff and residents to review the delivery <strong>of</strong> municipal services vis-à-vis our effectiveness to accomplish<br />
the collective desires <strong>of</strong> the community. It is hoped that Commissioners and the public will continue to<br />
find the <strong>City</strong>’s Budget to be user friendly and serve as a continuing reference throughout the year as<br />
both a financial tool and operations guide.<br />
In reviewing the Program Budget, the concept <strong>of</strong> total operating expenditures versus traditional General<br />
Fund expenditures should always be kept in mind. The property tax rate and other taxes and dividends<br />
primarily cover expenditures for the General Fund (which includes many <strong>of</strong> the traditional governmental<br />
services such as Police, Fire, Park & Recreation, Planning and general government), except for those<br />
costs attributable to Enterprise Operations (e.g. <strong>Lakeland</strong> Electric, Water and Wastewater Funds, Solid<br />
Waste Fund, Airport Fund, The <strong>Lakeland</strong> Center and Cleveland Heights Golf Course), Special Revenue<br />
Funds (Community Development Fund) or Capital Project Funds (e.g. the Transportation Fund,<br />
Stormwater Fund and Public Improvement Fund). The Public Improvement Fund pays for deficiencies in<br />
some funds such as the General Fund and the <strong>Lakeland</strong> Center through a transfer <strong>of</strong> funds. All <strong>of</strong> the<br />
funds together, with the exception <strong>of</strong> the Internal Service Funds (e.g. Fleet Management, Purchasing<br />
A-10 Fiscal Year <strong>2010</strong> Annual Budget
& Stores, Information Technology and Facilities Maintenance Funds) and the allocation <strong>of</strong><br />
Administrative Services expenses comprise the operational budget.<br />
I would also like to take this opportunity to recognize the dedication <strong>of</strong> the <strong>City</strong> <strong>of</strong> <strong>Lakeland</strong>’s municipal<br />
workforce as they provide an extensive array <strong>of</strong> municipal Core Services for residents with enthusiasm<br />
and pride, especially under the trying time <strong>of</strong> fiscal constraints. Many <strong>of</strong> these employees have<br />
contributed extensively in the analysis and preparation <strong>of</strong> this document, and I appreciate their<br />
demonstrated commitment to the continuous evolution and enhancement <strong>of</strong> the budgeting process.<br />
On behalf <strong>of</strong> the entire municipal staff, we look forward to working with you during the review <strong>of</strong> the<br />
Proposed FY <strong>2010</strong> Annual <strong>City</strong> Budget and Capital Improvement Program Budgets and stand ready to<br />
address any related questions or comments.<br />
Very truly yours,<br />
Douglas B. Thomas<br />
<strong>City</strong> Manager<br />
A-11 Fiscal Year <strong>2010</strong> Annual Budget
<strong>City</strong> <strong>of</strong> <strong>Lakeland</strong> <strong>2010</strong> Organization Chart*<br />
Municipal Boards & Committees<br />
(see page A-13)<br />
CITIZENS OF THE CITY OF LAKELAND<br />
Operating Boards<br />
(see page A-13)<br />
CITY ATTORNEY<br />
Tim McCausland<br />
MAYOR AND CITY COMMISSION<br />
(see page A-13)<br />
DEPUTY CITY MANAGER<br />
Tony Delgado<br />
CITY MANAGER<br />
Doug Thomas<br />
ASSISTANT CITY MANAGER<br />
Stanley Hawthorne<br />
Community Redevelopment Areas<br />
Performance Excellence<br />
Retirement Services<br />
Jennifer Kerr<br />
COMMUNICATIONS<br />
Kevin Cook<br />
POLICE<br />
Roger Boatner<br />
FINANCE<br />
Greg Finch<br />
ELECTRIC UTILITY<br />
Jim Stanfield<br />
Switchboard Operations<br />
Media Relations<br />
Government Access Television<br />
Website & Social Media Management<br />
Community<br />
Programs<br />
Juvenile<br />
Programs<br />
Patrol<br />
Investigative<br />
Aviation<br />
Dispatching<br />
Payroll<br />
Treasurers Office<br />
Central Accounting<br />
Customer Billing<br />
E&W Finance<br />
Accounts Payable<br />
<strong>City</strong> Clerk<br />
Delivery<br />
Customer Service<br />
General Service<br />
Production<br />
Technical<br />
Support<br />
WATER UTILITY<br />
Greg Boettcher<br />
PUBLIC WORKS<br />
Rick Lilyquist<br />
FIRE<br />
Mike Mohler<br />
PARKS & RECREATION<br />
Bill Tinsley<br />
COMMUNITY DEVELOPMENT<br />
Jim Studiale<br />
AIRPORT<br />
Vacant<br />
Water Production &<br />
Distribution<br />
Wastewater Collection<br />
& Treatment<br />
Lakes & Stormwater<br />
Solid Waste<br />
Traffic & Operations<br />
Construction &<br />
Maintenance<br />
Engineering<br />
Facilities<br />
Maintenance<br />
Fleet Management<br />
Firefighting<br />
Rescue<br />
Parks<br />
Recreation &<br />
Facilities<br />
Cultural Support<br />
Aquatics<br />
Cemeteries<br />
Golf Course<br />
Library<br />
Current Planning<br />
Long-Range Planning<br />
Building Inspection<br />
Neighborhood Services<br />
Operations<br />
Leasing Activities<br />
THE LAKELAND CENTER<br />
Mike LaPan<br />
RISK MANAGEMENT<br />
Karen Lukhaub<br />
INTERNAL AUDIT<br />
John Zuercher<br />
INFORMATION TECHNOLOGY<br />
Terry Brigman<br />
Human Resources<br />
Tommy Hamrick\George Brooks<br />
A-12 Fiscal Year <strong>2010</strong> Annual Budget<br />
Client Services<br />
Accounting &<br />
Information<br />
Technology<br />
Property Operations &<br />
Maintenance<br />
Marketing<br />
Sales<br />
Purchasing & Stores<br />
Safety<br />
Network Administration &<br />
Support<br />
IT Support<br />
Security Administration<br />
Business Operations<br />
Application<br />
Development & Support<br />
Telecommunications<br />
Employee<br />
Relations<br />
Civil Service<br />
*Department Organization Charts located in Supplementary Section
<strong>City</strong> <strong>of</strong> <strong>Lakeland</strong> <strong>2010</strong> Organization Chart<br />
CITIZENS OF THE CITY OF LAKELAND<br />
OPERATING BOARDS<br />
MUNICIPAL BOARDS & COMMITTEES<br />
Airport Advisory Board<br />
American Public Power Association Policy Makers Council<br />
Central Florida MPO Alliance<br />
Central Florida Regional Planning Council<br />
Enterprise Zone Development Agency<br />
Florida League <strong>of</strong> Cities<br />
Joint Airport-Zoning Board<br />
<strong>Lakeland</strong> Area Mass Transit District<br />
<strong>Lakeland</strong> Downtown Development Authority<br />
Mid Town Community Redevelopment Area<br />
Polk County Visitors & Convention Bureau<br />
Polk Transit Authority<br />
Sun n’ Fun Board <strong>of</strong> Directors<br />
Transportation Planning Organization<br />
Tourist Development Council<br />
West Central Florida Chairs Coordinating Committee<br />
MAYOR AND CITY COMMISSION<br />
R. L. Buddy Fletcher (Mayor)<br />
Gow B. Fields James S. Verplanck<br />
Glenn E. Higgins R. Howard Wiggs<br />
Justin M Troller Edie L. Yates<br />
Affordable Housing Advisory<br />
Affordable Housing Review<br />
Airport Advisory Board<br />
Beautification<br />
Citizen’s Advisory<br />
Civil Service<br />
Code Enforcement<br />
Dixieland Community Redevelopment Area<br />
Drug-Related Nuisance Abatement<br />
Enterprise Zone Development Agency<br />
Firefighter’s Pension Trust<br />
Historic Preservation<br />
Housing Authority<br />
Mid Town Community Redevelopment Area<br />
Planning and Zoning<br />
Police Officer’s Retirement<br />
Public Employee Relations<br />
Retirement Services<br />
Utility Committee<br />
Zoning Board <strong>of</strong> Adjustment and Appeals<br />
<strong>Lakeland</strong> is located<br />
midway between<br />
Tampa and Orlando<br />
along Interstate 4 in<br />
Polk County, Florida.<br />
A-13 Fiscal Year <strong>2010</strong> Annual Budget
Vision, Mission, Goals and Outcomes<br />
Vision<br />
<strong>Lakeland</strong> - a vibrant, culturally inclusive world-class community.<br />
Mission Statement<br />
A community working together to provide an exceptional quality <strong>of</strong> life.<br />
CORE VALUES<br />
Leadership<br />
Commitment to Excellence<br />
Diversity<br />
Integrity<br />
Empowered Workforce<br />
Social Responsibility<br />
(See Page C-3)<br />
Quality <strong>of</strong> Life Goal:<br />
“Provide quality public spaces; deliver superior municipal services, and support arts, education,<br />
recreation and wellness”<br />
Outcome: Arts and Cultural Enrichment<br />
Outcome: Continuous and Inclusive Public Engagement<br />
Outcome: Diverse Recreational Opportunities and Quality Public Spaces<br />
Outcome: Educational Training Achievements and Life Long Learning<br />
Outcome: Economic, Cultural and Service Oriented Public/Private Partnerships<br />
Outcome: Enhanced Mobility Options<br />
Outcome: Reliable and Efficient Public Safety Programs<br />
Outcome: Responsive, Efficient and Superior Standards <strong>of</strong> Municipal Services<br />
Outcome: Vibrant Communities and Healthy Lifestyles<br />
Economic Opportunity Goal:<br />
“Create and encourage inclusive, lasting environments that grow, attract and retain a creative,<br />
talented, educated and technically qualified workforce”<br />
Outcome: Partnering for Economic Connections, Collaboration and Creation<br />
Outcome: Downtown Focus and Vibrancy<br />
Outcome: Enriched Community Workforce/Creative Class Jobs<br />
Outcome: Generationally Diverse and Attractive Environment<br />
Outcome: Sustainable Business Environment and Tourism<br />
A-14 Fiscal Year <strong>2010</strong> Annual Budget
Vision, Mission, Goals and Outcomes<br />
Growth Management Goal:<br />
“Ensure planning and infrastructure results in quality development and safe, attractive neighborhoods”<br />
Outcome: Comprehensive Integrated Approach to Land Use Decisions<br />
Outcome: Fiscal Responsibility and Shared Resources<br />
Outcome: Quality Developments Consistent with Community Industry and Green<br />
Outcome: Regionally Adequate Transportation Systems<br />
Outcome: Reliable, Adequate Infrastructure<br />
Outcome: Safe Attractive Neighborhoods Across the Economic Spectrum<br />
Fiscal Management Goal:<br />
“Develop and effectively manage financial resources”<br />
Outcome: Measurable Performance <strong>of</strong> Innovation, Efficiency and Effectiveness<br />
Outcome: New or Diversified Revenue Streams to Fund Priorities<br />
Outcome: Strategic and Budgetary Planning and Prioritization <strong>of</strong> Resources<br />
Outcome: Strategic, Accountable and Transparent Cost Management<br />
Communication Goal:<br />
“Develop an informed and engaged community”<br />
Outcome: Customer Experience Deemed Pr<strong>of</strong>essional, Responsive and Productive<br />
Outcome: Effective and Timely Communication with Customers<br />
Outcome: Media Partnerships for Real Time Communication Feedback<br />
Outcome: Transparent and Understandable Message Content<br />
Governance Goal:<br />
“Provide for responsive and responsible governmental service”<br />
Outcome: Customer and Market Focus (Benchmarking)<br />
Outcome: Enriched, Informed and Engaged Workforce<br />
Outcome: Knowledge and Analysis Based Decision-Making<br />
Outcome: Regulatory and Policy Compliance<br />
Outcome: Results Oriented and Value Based Leadership<br />
Outcome: Safeguarding <strong>of</strong> Assets and Prudent Management <strong>of</strong> Fiscal Resources<br />
Outcome: Strategic and Long Term Planning<br />
Outcome: Transparent, Accountable and Efficient Business Processes<br />
A-15 Fiscal Year <strong>2010</strong> Annual Budget
<strong>Lakeland</strong> at a Glance<br />
Incorporated January 1, 1885<br />
Commission - <strong>City</strong> Manager Form <strong>of</strong> Government<br />
Mayor and six-member <strong>City</strong> Commission, nonpartisan, elected at large<br />
<strong>City</strong> Manager appointed by the <strong>City</strong> Commission<br />
Demographics<br />
Population (As <strong>of</strong> April 1st <strong>of</strong> each year from Bureau <strong>of</strong><br />
Economic and Business Research-BEBR 2000)<br />
2000 78,452<br />
2001 82,706<br />
2002 85,517<br />
2003 88,741<br />
2004 89,731<br />
2005 90,851<br />
2006 91,623<br />
2007 93,428<br />
2008 93,508<br />
2009 94,163<br />
<strong>2010</strong> (est.) 94,800<br />
Median Age 39.1<br />
Percentage <strong>of</strong> Households<br />
Single Family/Duplex 77%<br />
Multi-Family 23%<br />
Median Household Income (Claritas 2009) $39,947<br />
Racial Composition<br />
White 69.9%<br />
Black or African American 22.1%<br />
American Indian 0.3%<br />
Asian 2.2%<br />
Other Race 5.5%<br />
Education<br />
For School Year 2008 - 2009<br />
Number <strong>of</strong> Public Schools<br />
Elementary 31<br />
Middle 12<br />
High School 7<br />
Public/Private Colleges 5<br />
Land Use<br />
Land Area (sq. miles) 74.34<br />
Land Use:<br />
Residential 51%<br />
Commercial 8%<br />
Recreation/Open Space 17%<br />
Public/Institutional 1%<br />
Industrial 23%<br />
100%<br />
(Source: 2008 Community Development Land Data Record System)<br />
Economics<br />
Permitted in 2008:<br />
Office Space (sq. ft.) 103,447<br />
Retail Space (sq. ft.) 97,557<br />
Industrial Space (sq. ft.) 24,446<br />
Assessed Taxable Property Valuation 6,045,214,497<br />
(2008 Tax Year)<br />
% <strong>of</strong> Total<br />
Principal Taxpayers:<br />
Assessed Value<br />
Publix Super Markets, Inc. 4.84%<br />
Rooms To Go Furniture Corp 1.01%<br />
Watson Clinic 0.83%<br />
Verizon 0.80%<br />
Casto Oakbridge Venture LTD 0.92%<br />
<strong>2010</strong> Property Tax Millage Rate 3.6538<br />
Per Capita Debt:<br />
Total Debt Per Capita (less Electric system debt) $1,977<br />
(Fiscal Year End 2008)<br />
FY<strong>2010</strong> Net Adopted Budget $541,829,808<br />
FCAT Results (2009) Polk County<br />
Reading Mean Math Mean<br />
Elementary<br />
Grade 3 313 337<br />
Grade 4 324 330<br />
Grade 5 311 335<br />
Middle<br />
Grade 6 313 316<br />
Grade 7 318 314<br />
Grade 8 312 322<br />
High School<br />
Grade 9 316 313<br />
Grade 10 305 327<br />
A-16 Fiscal Year <strong>2010</strong> Annual Budget
Service Statistics<br />
Police<br />
Sworn Officers 226<br />
Number <strong>of</strong> service calls 103,533<br />
Number <strong>of</strong> 911 calls 59,063<br />
Average emergency response time (min.) 6.8<br />
Fire/EMS<br />
Certified Firefighters 146<br />
Number <strong>of</strong> fire stations 7<br />
Number <strong>of</strong> service calls:<br />
Fire 2,448<br />
EMS 17,059<br />
Parks & Recreation<br />
Number <strong>of</strong> parks & facilities 72<br />
Number <strong>of</strong> acres 1,232<br />
Cleveland Heights Golf Course:<br />
Holes 27<br />
Memberships 267<br />
Rounds 64,000<br />
Lake Mirror Complex:<br />
Auditorium<br />
Size (sq. ft.) 6,500<br />
Number <strong>of</strong> rentals 175<br />
Theatre<br />
Size (sq. ft.) 5,500<br />
Number <strong>of</strong> rentals 280<br />
Peggy Brown Building<br />
Size (sq. ft.) 4,700<br />
Number <strong>of</strong> rentals 190<br />
Magnolia Building<br />
Size (sq. ft.) 4,700<br />
Number <strong>of</strong> rentals 221<br />
Number <strong>of</strong> Libraries 3<br />
Number <strong>of</strong> Sports Complexes 8<br />
Number <strong>of</strong> sports teams 357<br />
Number <strong>of</strong> Aquatic Complex visitors<br />
(Kelly and Simpson Pools) 105,000<br />
Number <strong>of</strong> swim classes 249<br />
Number <strong>of</strong> swim participants 700<br />
<strong>Lakeland</strong> Center<br />
George Jenkins Arena:<br />
Size (sq. ft.) 24,380<br />
Capacity (reserved) 8,136<br />
Exhibit Hall:<br />
Size (sq. ft.) 28,262<br />
Youkey Theatre:<br />
Size (sq. ft.) 39,000<br />
Capacity (reserved) 2,246<br />
Sikes Conference Center:<br />
Size (sq. ft.) 33,804<br />
Total Events 410<br />
Total Attendance 450,000<br />
Public Works<br />
Tons <strong>of</strong> waste recycled 4,300<br />
Streets maintained (miles) 381<br />
<strong>City</strong> vehicles & equipment maintained 1,216<br />
Sidewalks maintained (miles) 260<br />
Electric Utility<br />
Customer territory (sq. miles) 246<br />
Miles <strong>of</strong> transmission lines 145<br />
Residential accounts 100,664<br />
Commercial accounts 12,006<br />
Municipal accounts 539<br />
Private Area Lights accounts 9,154<br />
Average daily electric (kWh) 64.52<br />
Water/Wastewater Utilities<br />
Water customer territory (sq. miles) 136<br />
Water customer accounts 55,787<br />
Miles <strong>of</strong> water mains 983<br />
Fire hydrants 3,971<br />
Annual average water demand (mgd) 22.98<br />
Daily water treatment capacity (mgd) 59<br />
Wastewater customer accounts 42,259<br />
Miles <strong>of</strong> Wastewater lines 445<br />
Average daily wastewater treated (mgd) 10.07<br />
<strong>Lakeland</strong> Linder Airport<br />
Runway 9/27 (ft. long) 8,500<br />
Runway 5/23 (ft. long) 5,000<br />
A-17 Fiscal Year <strong>2010</strong> Annual Budget
History <strong>of</strong> <strong>Lakeland</strong><br />
<strong>Lakeland</strong> is the heart <strong>of</strong> Polk County and it is <strong>Lakeland</strong>’s charm that creates a beautiful blend <strong>of</strong> a small town<br />
feel with the convenience and amenities <strong>of</strong> much larger cities.<br />
In 1882, Abraham Munn <strong>of</strong> Louisville Kentucky bought, sight<br />
unseen, 80 acres <strong>of</strong> land in an area <strong>of</strong> small lakes in Polk<br />
County, Florida. Munn arrived in February 1884 to establish<br />
the <strong>Lakeland</strong> Improvement Company (LIC) with two business<br />
partners. The company platted Munn’s 80 acre purchase<br />
and began selling lots in the budding town <strong>of</strong> <strong>Lakeland</strong>. He<br />
helped to assure the success <strong>of</strong> his venture and the survival<br />
<strong>of</strong> <strong>Lakeland</strong> by persuading Henry Plant’s South Florida<br />
Railroad to locate its depot on LIC land just north <strong>of</strong> today’s<br />
Munn Park. The LIC lots constitute much <strong>of</strong> what is now<br />
<strong>Lakeland</strong>’s downtown business district.<br />
<br />
<br />
<br />
<br />
<br />
<br />
<br />
<br />
<br />
<br />
<br />
<br />
<br />
<br />
<br />
1883 - Lewis Ballard provided the first Post Office and General Store<br />
1884 - Herbert Drane opened the first drugstore<br />
1884 - Norman Riggins opened a dry goods store and saw mill<br />
1884 - Munn built the Tremont House (considered to be one <strong>of</strong> the finest hotels in Central Florida)<br />
1885 - Thirty-four citizens democratically decided to incorporate the town after a 22 to 12 vote<br />
1885 - John Torrence donated the site <strong>of</strong> Roselawn Cemetery to the <strong>City</strong><br />
1886 - First jail was named McDemerott House (after it’s first occupant)<br />
1891 - <strong>Lakeland</strong> Light and Power Company erected a light plant (3rd city in Florida to have electric lights)<br />
1902 - First telephone exchange was built<br />
1912 - First fire department was organized<br />
1913 - Mail delivery was established<br />
1916 - Cornerstone <strong>of</strong> the first hospital was laid<br />
1922 - Established a commission-manager form <strong>of</strong> government<br />
1922 - Florida Southern College moved here from Sutherland (Palm Harbor)<br />
1927 - Polk Theatre was built<br />
A-18 Fiscal Year <strong>2010</strong> Annual Budget
History <strong>of</strong> <strong>Lakeland</strong><br />
The Spanish American War <strong>of</strong> 1898 was another<br />
important event that led to greater development in<br />
<strong>Lakeland</strong>. Among the six thousand U.S. soldiers<br />
encamped here during the war, many wrote letters<br />
about the attractiveness <strong>of</strong> the city. As a result <strong>of</strong> this<br />
favorable impression and free advertising, many<br />
soldiers retired here and <strong>Lakeland</strong> got its first influx <strong>of</strong><br />
tourist during the first winter after the war’s end.<br />
Similar to other towns in the Southern U.S., “<strong>Lakeland</strong><br />
was agriculturally oriented from the first.” Citrus and<br />
strawberries were vital cash crops and/or industries to<br />
<strong>Lakeland</strong>. In the 1870’s, citrus started to become a<br />
greater activity in <strong>Lakeland</strong> when Archie McLeod<br />
moved down from Alabama<br />
to plant a grove where<br />
Florida Southern College<br />
now stands. In fact, it was<br />
in <strong>Lakeland</strong> that the<br />
seedless grapefruit was<br />
developed by Ed Tison in<br />
1887. Tison sold his<br />
nursery to C.M. Marsh who<br />
gave his name to the popular fruit.<br />
By May 26, 1891, the <strong>City</strong> became<br />
one <strong>of</strong> the first three cities in Florida,<br />
besides Tampa and Jacksonville to<br />
have electric lights. Today, the city<br />
owns and operates it’s own electric<br />
company, <strong>Lakeland</strong> Electric.<br />
The Florida boom resulted in the construction <strong>of</strong> many<br />
significant structures in <strong>Lakeland</strong>, a number <strong>of</strong> which<br />
are listed on the National Register <strong>of</strong> Historic Places.<br />
This list includes the Terrace Hotel (1924), Polk<br />
Theatre (1927),<br />
Park Trammell<br />
Building (1927-<br />
today known as<br />
the Chamber <strong>of</strong><br />
Commerce),<br />
Promenade <strong>of</strong><br />
Lake Mirror (1928)<br />
and others.<br />
The “boom” period went “bust” quickly and years<br />
passed before the city<br />
recovered. Part <strong>of</strong> the<br />
reemergence was due to the<br />
arrival <strong>of</strong> the Detroit Tigers in<br />
1934 for spring training. The<br />
development <strong>of</strong> the <strong>Lakeland</strong><br />
Municipal Airport as a major<br />
facility in Central Florida<br />
transportation was another factor. The 1930’s also<br />
featured the arrival <strong>of</strong> renowned architect Frank Lloyd<br />
Wright who designed 12 structures for Florida<br />
Southern College, the project was named “A Child <strong>of</strong><br />
the Sun.” It is the largest collection <strong>of</strong> Wright’s<br />
buildings in the world.<br />
Swans have long been a part <strong>of</strong> the ambience <strong>of</strong><br />
<strong>Lakeland</strong>. Records and sightings indicate that swans<br />
have been on the city’s lakes since at least 1923. For<br />
different reasons the swan population dwindled to<br />
zero by 1945. Mrs. Robert Pickhardt wrote to Queen<br />
Elizabeth inquiring about purchasing a pair <strong>of</strong> swans<br />
for <strong>Lakeland</strong>. A royal representative replied that the<br />
Queen would donate a pair <strong>of</strong> swans if the city would<br />
pay the cost <strong>of</strong> capture, crating and<br />
shipping (estimated at $300). A pair<br />
<strong>of</strong> white mute swans from England<br />
arrived in <strong>Lakeland</strong> and were released<br />
on Lake Morton on February 9, 1957.<br />
Today there are over 200 swans here<br />
including Coscorobas, Australian<br />
blacks, black-necks, Polish mutes and<br />
English mutes. They are found on Lakes Morton,<br />
Wire, Mirror, Parker and at Cleveland Heights Golf<br />
and Country Club. Quite a few are directly descended<br />
from the original pair from 1957.<br />
A-19 Fiscal Year <strong>2010</strong> Annual Budget
History <strong>of</strong> <strong>Lakeland</strong><br />
<strong>Lakeland</strong> is home to the nation’s second largest experimental aircraft<br />
convention, the Sun n Fun Fly-In (1973), which attracts aviation enthusiasts<br />
from around the world every April.<br />
Mayfaire-by-the-Lake (1970) art festival is another<br />
notable event held every Mother’s Day weekend<br />
and draws thousands <strong>of</strong> visitors each year.<br />
Hollis Garden (2000) is a formal<br />
1.2 acre botanical garden<br />
located on historic Lake Mirror.<br />
The garden contains several<br />
water features and displays<br />
thousands <strong>of</strong> flowering plants,<br />
ornamental shrubs, historic<br />
trees, herbs and vegetables. It<br />
was voted one <strong>of</strong> the “Best <strong>of</strong><br />
Class Gardens” by the Gulfcoast Research and Education Center.<br />
One <strong>of</strong> the jewels in the <strong>City</strong>’s impressive array <strong>of</strong> parks is Barnett Family Park. Barnett<br />
Family Park is designed to attract children and families from throughout the community.<br />
The elaborate sculptures <strong>of</strong> native Florida animals and beautiful hand-cut Byzantine tiles<br />
make the park unique.<br />
Common Ground Park (2009) is Polk County’s first “inclusive play experience”<br />
designed for children <strong>of</strong> varying abilities to play side-by-side. The park was<br />
community developed and funded with many volunteers and donations. Play<br />
zones such as Adventure Canyon, Butterfly Meadow and Gopher Mountain<br />
provide easy, intermediate and challenging play opportunities.<br />
Notable <strong>Lakeland</strong>ers (to list a few):<br />
Lawton Chiles<br />
Dr. John S. Jackson, 1st Black Mayor<br />
Forrest Sawyer, ABC and NBC news anchor<br />
Frances Langford, Actress and Band singer<br />
George W. Jenkins, founder <strong>of</strong> Publix<br />
Howard Marshall, NASA scientist<br />
Joe Nemechek, NASCAR Nextel Cup driver<br />
Lawton Chiles, Senator & Governor <strong>of</strong> Florida<br />
Lee Janzen, PGA Tour golfer (won U.S. Open)<br />
Neva Jane Langley, Miss America<br />
Rod Smart, Running back, kick returner NFL<br />
Wayne Anderson, NASCAR Nextel Cup driver<br />
Forrest Sawyer<br />
Frances Langford<br />
Rod Smart<br />
A-20 Fiscal Year <strong>2010</strong> Annual Budget
History <strong>of</strong> <strong>Lakeland</strong><br />
Arts and Entertainment:<br />
Polk Theatre - built in 1927. It was restored in 1999 and is supported by revenue from films, its<br />
Performing Art Series, fundraising, rental income and memberships.<br />
Imperial Symphony Orchestra - in 1965 a group <strong>of</strong> musicians, led by Florida<br />
Southern College pr<strong>of</strong>essor Dr. Ken Anderson and <strong>Lakeland</strong> businessman Jay<br />
Erwin, organized an orchestra to provide classical music for the community.<br />
Today that small effort has grown into a highly polished, regional orchestra that<br />
plays 15 concerts each season.<br />
Polk Museum <strong>of</strong> Art - The Junior Welfare League founded the all-volunteer<br />
Imperial Youth Museum in 1966. In 1969, the museum was renamed Polk Public Museum to reflect<br />
the broadened emphasis on history and science. It functions as a cultural arts center for the general<br />
public.<br />
Pied Piper Players - <strong>Lakeland</strong> Community Theatre is known for its high production values and<br />
variety <strong>of</strong> repertoire. Now in its 22nd year, Pied Piper Players events each year include its Main<br />
Stage Series, Theatre For Youth Series, Alternative Stage Series and a<br />
number <strong>of</strong> special events throughout the year.<br />
In short, linking <strong>Lakeland</strong>’s past to present reveals that its natural resources,<br />
infrastructure development, favorable climate and location as a popular Florida<br />
destination will continue to attract the quality <strong>of</strong> people that have made it a<br />
historically rich and prosperous city.<br />
Music on the Promenade<br />
Interesting Facts…<br />
The <strong>Lakeland</strong> News was the first newspaper in <strong>Lakeland</strong> and<br />
second in the county.<br />
<strong>Lakeland</strong> inspired a song copyrighted in 1950 with words and<br />
music by Esther Chestnut.<br />
There are 13 named “natural” lakes in <strong>Lakeland</strong>.<br />
The first Red Lobster restaurant was opened in <strong>Lakeland</strong>.<br />
Elvis Presley performed at the Polk Theater on August 6,<br />
1956.<br />
Snow in <strong>Lakeland</strong>? Yes on the night <strong>of</strong> January 19, 1977!<br />
Sources:<br />
Dunn, H.; <strong>Lakeland</strong>: A Pictorial History; The Donning Company, Norfolk Virginia; 1990.<br />
<strong>City</strong> <strong>of</strong> <strong>Lakeland</strong>; <strong>Lakeland</strong> Room Special Collections: A Brief History <strong>of</strong> <strong>Lakeland</strong> Florida; 2007<br />
Wikipedia; History <strong>of</strong> <strong>Lakeland</strong> Florida; 2007<br />
Flekke, M. M. and MacDonald, R.M.; <strong>Lakeland</strong>: Postcard History Series; 2005<br />
Publix History<br />
The Ledger<br />
Various <strong>City</strong> documents and memoranda<br />
Brooke Pottery; History <strong>of</strong> the <strong>Lakeland</strong> Swans<br />
A-21 Fiscal Year <strong>2010</strong> Annual Budget
Table <strong>of</strong> Contents<br />
Budget Overview ................................................................................ Section—B<br />
Budget Highlights ................................................................................. B-2<br />
Budget Summary (Graphs/Charts)...................................................... B-3<br />
Ad Valorem Taxes ................................................................................ B-9<br />
Staffing Changes by Fund ................................................................. B-10<br />
Employee/Population Growth ........................................................... B-11<br />
Overview and Financial Policies ....................................................... B-12<br />
Budget Process Overview ................................................................. B-16<br />
B-1 Fiscal Year <strong>2010</strong> Annual Budget
Budget Highlights<br />
Introduction<br />
The FY<strong>2010</strong> Annual Budget, adopted on September<br />
21, 2009, is a numerical reflection <strong>of</strong> the FY<strong>2010</strong><br />
Business Plan. By allocating our resources through a<br />
balanced combination <strong>of</strong> Core Service prioritization and<br />
strategic alignment with the Commissioner’s thirty-six<br />
Outcomes, we believe this budget will successfully<br />
meet the challenges before us and set the stage for our<br />
continued success in the future.<br />
Budget in Brief<br />
The adopted net operating budget for FY<strong>2010</strong> for all<br />
funds totals $541,829,808. This represents a decrease<br />
<strong>of</strong> $61,889,683 or 10.25% less than the Fiscal Year<br />
2009 budget. The FY<strong>2010</strong> budget is balanced,<br />
prudent, and responsive to community needs as<br />
identified in the <strong>2010</strong> Strategic Plan.<br />
Budget Highlights<br />
Some factors that contributed to the changes in the<br />
budget are:<br />
<br />
<br />
<br />
<br />
Budget reductions and targets established based<br />
on prioritized Core Services.<br />
Eroding levels <strong>of</strong> revenue in the Half Cent Sales<br />
Tax, Communications and Utility Taxes, Charges<br />
for Services, Licenses and Permits and All Other<br />
Revenues.<br />
Adoption <strong>of</strong> the rolled-back property tax millage<br />
rate <strong>of</strong> 3.6538 - allowing the <strong>City</strong> <strong>of</strong> <strong>Lakeland</strong> to<br />
collect net receipts equal to the current year not<br />
including tax proceeds from new construction<br />
activities.<br />
Elimination <strong>of</strong> any General Fund subsidy’s to<br />
Enterprise Funds.<br />
Capital Improvements<br />
The Capital Improvement Program (CIP) elements for<br />
FY<strong>2010</strong> are programmed at $83,640,641. This amount<br />
consists <strong>of</strong> $42,452,457 in General Governmental<br />
capital and $41,188,184 in Proprietary Fund capital.<br />
Building the Foundation<br />
The Commission’s Annual Retreat in January 2009<br />
focused on:<br />
The Strategic Operating Plan<br />
<br />
<br />
<br />
Prioritizing the <strong>City</strong>’s Goal’s<br />
Identifying proper Outcomes and<br />
Laying the foundation for core service<br />
prioritization<br />
The Retreat included information gathering and<br />
participation from Citizens, <strong>City</strong> Management and<br />
Senior Leadership. The Retreat resulted in 36<br />
Outcomes being set, outlining how the operations <strong>of</strong><br />
the <strong>City</strong> should be reviewed and redeployed to bring<br />
the strategic vision to life.<br />
This Strategic Operating Plan and Core Service<br />
prioritization foundation were then reviewed with Senior<br />
Leadership who developed and prioritized Core<br />
Services as a first step in the development <strong>of</strong> the<br />
FY<strong>2010</strong> budget.<br />
True to the spirit <strong>of</strong> continuous improvement, the<br />
Strategic Operating Plan has evolved over the last<br />
several years, linking our day-to-day activities with the<br />
Mission that we aspire to achieve. The present<br />
Strategic Plan is on an annual cycle.<br />
Financial Forecasting<br />
One <strong>of</strong> the most effective tools we use to manage<br />
future financial risk and protect ourselves from the<br />
unintended consequences <strong>of</strong> short-term decisions is<br />
our Forecasting Model. Revenues are projected at<br />
conservative levels and compared to estimated cost<br />
increases in payroll, operating expenditures and capital<br />
outlay. The purpose <strong>of</strong> this financial exercise is to<br />
adequately prepare for future challenges, so it is<br />
always conservative in outlook. Using this tool helps<br />
keep us focused on long-term solutions, rather than<br />
short-term “fixes”, which could lead to negative<br />
financial impacts in future years. It is important to note<br />
that the <strong>City</strong>’s budget has always been balanced<br />
B-2 Fiscal Year <strong>2010</strong> Annual Budget
Budget Summary<br />
Fiscal Year <strong>2010</strong><br />
Revenue Sources<br />
Charges for Services $ 433,925,040<br />
All Other Revenue 31,756,989<br />
Public Service, Communication and Gasoline Taxes 20,549,125<br />
Intergovernmental 14,199,396<br />
Property Taxes 24,089,107<br />
Licenses and Permits 2,719,736<br />
Interest Income 6,885,542<br />
Prior Year Surplus 7,704,873<br />
Total Revenues $ 541,829,808<br />
Public Service,<br />
Communication<br />
and Gasoline<br />
Taxes<br />
3.8%<br />
All Other<br />
Revenue<br />
5.9%<br />
Intergovernmental<br />
2.6%<br />
Property Taxes<br />
4.4%<br />
Licenses and<br />
Permits<br />
0.5%<br />
Interest Income<br />
1.3%<br />
Prior Year<br />
Surplus<br />
1.4%<br />
Charges for<br />
Services<br />
80.1%<br />
B-3 Fiscal Year <strong>2010</strong> Annual Budget
Budget Summary<br />
Fiscal Year <strong>2010</strong><br />
Expenditures by Area<br />
Economic and Community Development $ 13,884,802<br />
Legislative Activities 1,322,945<br />
Community Safety 51,964,677<br />
Transportation Services 28,601,045<br />
Support Services 49,813,979<br />
Environmental and Utility Services 366,380,873<br />
Cultural and Community Services 6,130,905<br />
Parks, Recreation and Properties 23,730,582<br />
Total Expenditures $ 541,829,808<br />
B-4 Fiscal Year <strong>2010</strong> Annual Budget
Budget Summary<br />
Fiscal Year <strong>2010</strong><br />
Expenses by Account<br />
B-5 Fiscal Year <strong>2010</strong> Annual Budget
Summary <strong>of</strong> All Funds<br />
Fiscal Year <strong>2010</strong><br />
B-6 Fiscal Year <strong>2010</strong> Annual Budget
Summary <strong>of</strong> All Funds<br />
Fiscal Year <strong>2010</strong><br />
All Other<br />
Enterprise Funds<br />
5.4%<br />
General Fund<br />
16.4%<br />
All Other<br />
Governmental<br />
Funds<br />
8.1%<br />
Electric Utility<br />
61.3%<br />
Water /<br />
Wastewater<br />
Utilities<br />
8.8%<br />
B-7 Fiscal Year <strong>2010</strong> Annual Budget
Budget Summary by Fund<br />
Fiscal Year <strong>2010</strong><br />
<strong>City</strong> <strong>of</strong> <strong>Lakeland</strong><br />
Budget Summary by Fund<br />
Fiscal Year Ending September 30, <strong>2010</strong><br />
General Fund<br />
Special<br />
Revenue<br />
Funds<br />
Debt Service<br />
Fund<br />
Capital<br />
Project Funds<br />
Enterprise<br />
Funds Total<br />
Revenue<br />
Property Taxes 19,248,168 4,840,939 24,089,107<br />
Public Service, Communications and<br />
Gasoline Taxes 15,579,125 4,970,000 20,549,125<br />
Licenses and Permits 2,719,736 2,719,736<br />
Intergovernmental 8,819,618 3,259,384 1,028,367 1,092,027 14,199,396<br />
Charges for Services 3,449,801 300,000 430,175,239 433,925,040<br />
Interest Income 650,000 365,214 5,870,328 6,885,542<br />
All Other Revenue 1,295,483 50,000 29,163,597 1,247,909 31,756,989<br />
Total Revenue 51,761,931 3,309,384 - 40,668,117 438,385,503 534,124,935<br />
Expenditures<br />
Economic and Community Development 3,861,684 3,389,384 6,633,734 13,884,802<br />
Legislative Activities 1,322,945 1,322,945<br />
Community Safety 49,723,671 301,585 1,939,421 51,964,677<br />
Transportation Services 5,117,401 72,463 20,536,747 2,874,434 28,601,045<br />
Support Services 11,562,198 38,251,781 49,813,979<br />
Environmental and Utility Services 2,499,612 363,881,261 366,380,873<br />
Cultural and Community Services (53,514) 6,184,419 6,130,905<br />
Parks, Recreation and Properties 17,402,537 3,701,725 2,626,320 23,730,582<br />
Total Expenditures 88,936,922 3,389,384 374,048 35,311,239 413,818,215 541,829,808<br />
Transfers In 37,285,597 374,048 616,306 3,474,985 41,750,936<br />
Transfers Out (2,313,052) (7,141,218) (32,296,666) (41,750,936)<br />
34,972,545 - 374,048 (6,524,912) (28,821,681) (0)<br />
Addition to/(Reduction <strong>of</strong>) Fund Balance (2,202,446) (80,000) - (1,168,034) (4,254,393) (7,704,873)<br />
Beginning Fund Balance $12,752,861 $80,000 $0 $8,527,512 $55,822,952 $77,183,325<br />
Ending Fund Balance $10,550,415 $0 $0 $7,359,478 $51,568,559 $69,478,452<br />
B-8 Fiscal Year <strong>2010</strong> Annual Budget
Ad Valorem Taxes<br />
FY<strong>2010</strong><br />
The Operating Millage Rate for<br />
FY<strong>2010</strong> will be $3.6538<br />
Old <strong>City</strong> Hall<br />
Mills<br />
5.000<br />
CITY OF LAKELAND<br />
Property Tax Millage<br />
4.500<br />
4.000<br />
3.500<br />
3.000<br />
2.500<br />
2.000<br />
1.500<br />
1.000<br />
0.500<br />
0.000<br />
98 99 00 01 02 03 04 05 06 07 08 09 10<br />
Year<br />
B-9 Fiscal Year <strong>2010</strong> Annual Budget
Staffing Changes by Fund<br />
09‐10<br />
2008 2009 <strong>2010</strong> Net Changes<br />
Full‐Time Part‐Time Full‐Time Part‐Time Full‐Time Part‐Time Full‐Time Part‐Time<br />
<strong>City</strong> Commission 1 8 1 7 1 7 0 0<br />
<strong>City</strong> Manager 10 1 10 1 13 1 3 0<br />
Communications 6 0 6 0 6 1 0 1<br />
Legal 6 0 6 0 7 0 1 0<br />
Retirement 4 0 4 0 4 1 0 1<br />
Human Resources 25 5 23 4 23 3 0 ‐1<br />
Internal Audit 2 0 2 0 2 0 0 0<br />
Risk Management 15 0 15 0 15 0 0 0<br />
Finance 64 7 60 3 54 3 ‐6 0<br />
Community Development 58 8 56 5 47 5 ‐9 0<br />
Fire 151 2 151 2 148 1 ‐3 ‐1<br />
Police 363 38 344 23 341 20 ‐3 ‐3<br />
Public Works 103 2 102 1 101 2 ‐1 1<br />
Parks & Recreation 196 195 196 182 193 186 ‐3 4<br />
1004 266 976 228 955 230 ‐21 2<br />
Comm Development/Housing Program 11 1 10 1 10 1 0 0<br />
Fleet Management 35 0 32 0 32 0 0 0<br />
Purchasing & Stores 19 0 19 0 18 0 ‐1 0<br />
Facilities Maintenance 55 1 52 1 52 0 0 ‐1<br />
Information Technology 76 0 75 0 74 0 ‐1 0<br />
185 1 178 1 176 0 ‐2 ‐1<br />
Cleveland Heights Golf Course 22 64 18 55 17 56 ‐1 1<br />
<strong>Lakeland</strong> Center 36 200 34 199 34 199 0 0<br />
<strong>Lakeland</strong> Linder Regional Airport 21 2 21 0 13 0 ‐8 0<br />
Parking System 7 2 7 1 6 0 ‐1 ‐1<br />
Stormwater 5 0 5 0 5 0 0 0<br />
Solid Waste 85 0 85 0 85 0 0 0<br />
Water 120 2 124 3 122 2 ‐2 ‐1<br />
Wastewater 83 4 83 2 83 3 0 1<br />
<strong>Lakeland</strong> Electric 625 27 624 27 610 19 ‐14 ‐8<br />
1004 301 1001 287 975 279 ‐26 ‐8<br />
2204 569 2165 517 2116 510 ‐49 ‐7<br />
Count<br />
120<br />
100<br />
80<br />
60<br />
40<br />
20<br />
0<br />
‐20<br />
‐40<br />
‐60<br />
‐80<br />
FTE Changes in Headcount<br />
98.5<br />
72.5<br />
70.8<br />
37<br />
30<br />
24<br />
16<br />
18 17<br />
12<br />
6.5<br />
‐15.5<br />
‐52.5<br />
‐65<br />
1997 1998 1999 2000 2001 2002 2003 2004 2005 2006 2007 2008 2009 <strong>2010</strong><br />
Year<br />
Note: Chart shows a material increase in Fiscal Years 2000 and 2001 primarily due to the <strong>City</strong> acquiring the Cleveland Heights Golf Club and the addition <strong>of</strong> Firefighters, Policmen and Utility Workers.<br />
B-10 Fiscal Year <strong>2010</strong> Annual Budget
Employee/Population Growth<br />
46<br />
Population Per Full-Time Employee<br />
(IN THOUSANDS)<br />
45<br />
44<br />
43<br />
42<br />
41<br />
40<br />
39<br />
38<br />
37<br />
36<br />
1999 2000 2001 2002 2003 2004 2005 2006 2007 2008 2009 <strong>2010</strong><br />
Year<br />
*<strong>2010</strong> based on estimated population <strong>of</strong> 94,800.<br />
B-11 Fiscal Year <strong>2010</strong> Annual Budget
Overview and Financial Policies<br />
Overview:<br />
This section contains a summary <strong>of</strong> the FY<strong>2010</strong> Annual Operating Budget and Capital Improvement<br />
Program, along with a discussion <strong>of</strong> the process that goes into developing the budget.<br />
The first section details the Financial Policies <strong>of</strong> the <strong>City</strong> upon which all budgeting decisions are made.<br />
The policies provide guidance to the <strong>City</strong> Commission and staff in making financial decisions on a daily<br />
basis. Good policies help ensure that the <strong>City</strong>’s financial health is maintained and the community<br />
remains financially stable. Sound stewardship <strong>of</strong> public funds requires the establishment <strong>of</strong> written<br />
standards <strong>of</strong> fiscal responsibility. The State <strong>of</strong> Florida prescribes certain standards that apply to<br />
municipal government; however, The <strong>City</strong> <strong>of</strong> <strong>Lakeland</strong> has financial policies that, in many cases, expand<br />
upon the standards required by the State <strong>of</strong> Florida.<br />
Following that is a discussion <strong>of</strong> the budget process and how we create the Business Plan and budget<br />
documents.<br />
The next section provides a current look at the <strong>City</strong>’s finances with tables and charts detailing the<br />
current Fund Balances carried in the <strong>City</strong>’s main operating funds.<br />
The Net Combined Budget is the summary <strong>of</strong> all funds for FY<strong>2010</strong>. We also publish a copy <strong>of</strong> the “Truth<br />
in Millage” Notification in the newspaper prior to adopting the budget. This format varies slightly from<br />
the net budget, because State law requires showing some interfund transfers, which, in effect, double<br />
count some revenues and expenditures.<br />
Information on our Ad Valorem Taxes, a summary <strong>of</strong> Net Staffing Changes, and a diagram <strong>of</strong> our Fund<br />
Structure all precede the Fund Budget Overview, which summarizes the budget by individual fund.<br />
The last section is the Capital Improvement Program Overview. This section provides the impact on<br />
operating budget, major capital projects and capital project funding by department and funding source.<br />
Operating Budget Policies:<br />
The budget shall be balanced by fund. Balance by fund is defined as revenues plus Fund<br />
Balance being equal to or greater than expenditures. Fund Balance is normally reserved for<br />
capital projects/outlay or one-time expenditures and is not to be used for operational<br />
expenditures.<br />
The budget will provide for adequate maintenance <strong>of</strong> capital plant and equipment and for their<br />
orderly replacement.<br />
The <strong>City</strong> will maintain a budgetary control system to insure it adheres to the budget.<br />
Appropriations requests will be made by departments (i.e. <strong>City</strong> Manager, Police,...) in the<br />
General Fund and on a fund level in all other funds. These requests are approved by the <strong>City</strong><br />
Commission.<br />
Unreserved fund balance should be between 5% - 15% <strong>of</strong> the operating revenues <strong>of</strong> the<br />
General Fund to balance unforeseen items and events that occur during the course <strong>of</strong> a fiscal<br />
year. This fund balance will act as a cushion or “budget stabilization fund” for the expenditures<br />
financed within that fund.<br />
The <strong>City</strong> will protect itself against catastrophic losses through a combination <strong>of</strong> good risk<br />
management, traditional insurance and where prudent actuarially fund self-insurance programs.<br />
Recovery <strong>of</strong> the specific costs <strong>of</strong> municipal services will be allocated to the appropriate users<br />
wherever possible and practical and shall be accounted for within enterprise funds maintained<br />
by the <strong>City</strong> on a full accrual basis.<br />
Internal Service Funds shall be self-supporting and shall recover the cost <strong>of</strong> the services they<br />
provide based on a rational allocation <strong>of</strong> cost to the benefiting <strong>City</strong> departments.<br />
B-12 Fiscal Year <strong>2010</strong> Annual Budget
Overview and Financial Policies<br />
Operating Budget Policies (cont’d):<br />
The <strong>City</strong> will strive to have all Enterprise Funds be self-supporting to the extent practical,<br />
including debt service and capital improvements. All costs associated with these operations<br />
shall be fully accounted for within the Enterprise Fund and any subsidies required for these<br />
operations shall be documented as interfund transfers.<br />
Although not required by State Law, Internal Service and Enterprise Funds will be governed by<br />
legally adopted annual budgets for cost control and administrative purposes.<br />
In no case will any fund operate in a manner that results in a continuing annual deficit that could<br />
result in a negative “unappropriated surplus” (defined as current assets excluding inventories<br />
less current liabilities including the long-term portion <strong>of</strong> accrued payroll liabilities).<br />
Operating budgets are prepared on a modified accrual basis, insuring that budgeted<br />
expenditures within an annual planning period can be financed from available, spendable<br />
resources.<br />
Revenue Policies:<br />
As much as possible subject to State Law and voter approval, the <strong>City</strong> will seek to maintain a<br />
diversified and stable mix <strong>of</strong> revenue sources.<br />
The <strong>City</strong> will pursue collection <strong>of</strong> revenues levied against the users <strong>of</strong> public services.<br />
User fees and charges will be established with consideration <strong>of</strong> the recovery <strong>of</strong> the full cost <strong>of</strong><br />
providing the related service, to the extent practical.<br />
In preparing the budget, the <strong>City</strong> Manager will estimate revenues using a conservative, objective<br />
and analytical process.<br />
Non-recurring revenues and one-time revenues will not be relied upon to finance the cost <strong>of</strong><br />
recurring expenditures. Non-recurring revenues and one-time revenues should be used for nonrecurring<br />
expenditures.<br />
All grant applications will be prepared with full consideration matching costs and on-going<br />
recurring costs to be financed from local revenue sources. All grant applications shall be<br />
authorized by the <strong>City</strong> Commission.<br />
Capital Improvement Policies:<br />
The <strong>City</strong> develops a ten-year capital improvement plan.<br />
Capital project budgets will be adopted on a project basis at the inception <strong>of</strong> the project.<br />
The <strong>City</strong> will coordinate development <strong>of</strong> the capital improvement/replacement budget with the<br />
development <strong>of</strong> the annual operating budget. Each capital project is reviewed for its ongoing<br />
future impact on the operating budget.<br />
The <strong>City</strong> will use the following criteria to evaluate the relative merit <strong>of</strong> each capital project being<br />
considered for funding within its capital plan:<br />
Projects specifically included in an approved capital asset replacement schedule will<br />
receive priority consideration; and<br />
Capital Projects that will reduce recurring operating costs will receive priority<br />
consideration.<br />
B-13 Fiscal Year <strong>2010</strong> Annual Budget
Overview and Financial Policies<br />
Accounting, Auditing and Financial Reporting Policies:<br />
An independent audit will be performed annually.<br />
The <strong>City</strong> will produce an audited Comprehensive Annual Financial Report (CAFR) following<br />
Generally Accepted Accounting Principles (GAAP) as defined by the Governmental Accounting<br />
Standards Board (GASB) and the Financial Accounting Standards Board (FASB).<br />
All Automated Clearing House (ACH) and wire transfers shall follow guidelines as drafted in the<br />
adopted policy including:<br />
Compliance with established internal controls governing authorization and transaction<br />
processing<br />
Prompt recording and reporting <strong>of</strong> all ACH and wire transactions; and<br />
Compliance with all other purchasing requirements.<br />
The <strong>City</strong> will maintain a system <strong>of</strong> strong internal controls governing all financial transactions<br />
and shall promptly implement any changes to those controls recommended to the <strong>City</strong> in<br />
conjunction with the review <strong>of</strong> internal controls conducted with the annual independent audit <strong>of</strong><br />
the <strong>City</strong>.<br />
Investment Policies:<br />
As required by State Law, the <strong>City</strong> Commission shall establish an investment policy.<br />
The <strong>City</strong>’s investment objectives, as established in this policy, focus on Safety, Liquidity and<br />
Yield.<br />
Investments shall be commingled into a single, <strong>City</strong>-wide investment portfolio in order to provide<br />
for economies <strong>of</strong> scale with respect to liquidity requirements and maintaining the ability to<br />
purchase larger blocks <strong>of</strong> investments. The exception to this will be funds that are invested<br />
within the various pensions and selected other trust funds, which are governed by investment<br />
policies for longer term instruments.<br />
The portion <strong>of</strong> the investment portfolio that consists <strong>of</strong> fixed rate investments shall be structured<br />
so that investments mature in approximately equal amounts each quarter.<br />
Disbursement, collection and deposit <strong>of</strong> all funds will be managed to insure that cash is invested<br />
promptly until needed.<br />
All depositories shall meet the collateral requirements specified within state statute.<br />
Debt Policies:<br />
Debt may be issued only for the purposes <strong>of</strong> financing the cost <strong>of</strong> capital improvements. The<br />
proceeds <strong>of</strong> debt issuance can not be used for operations.<br />
The projected useful life <strong>of</strong> capital assets financed from debt issuance must equal or exceed the<br />
terms <strong>of</strong> the financing.<br />
The revenue stream used to finance the debt must be sufficient to cover all debt costs over the<br />
term <strong>of</strong> the financing and shall, to the extent practical, represent revenues to be generated by<br />
the same capital assets financed from the debt issuance.<br />
The <strong>City</strong> shall not pledge ad valorem revenues to the repayment <strong>of</strong> debt without the express,<br />
voted approval <strong>of</strong> the citizens <strong>of</strong> <strong>Lakeland</strong>.<br />
The <strong>City</strong> shall adopt a written policy governing the use <strong>of</strong> derivative financial instruments within<br />
its debt portfolio.<br />
The <strong>City</strong> follows all State and Federal regulations and requirements regarding debt issuance,<br />
arbitrage restrictions and continuing disclosure.<br />
B-14 Fiscal Year <strong>2010</strong> Annual Budget
Overview and Financial Policies<br />
Purchasing Policies:<br />
Purchases will follow all required Federal, State and Municipal requirements.<br />
Purchases will be made in an impartial, economical, competitive and efficient manner.<br />
Purchases under $500: Each department is responsible for obtaining the best price<br />
possible.<br />
Purchases $501 - $1,500: Each department is responsible for obtaining the best price<br />
possible using a departmental purchase order to solicit vendors for competitive pricing.<br />
Purchases over $1,500: Each department is responsible for obtaining the best price<br />
possible, requires a purchase order including solicitation <strong>of</strong> multiple quotations <strong>of</strong> price,<br />
prior to <strong>City</strong> Manager and <strong>City</strong> Commission authorization.<br />
Purchases over $10,000: Require formal sealed bids. All invitations for bids must be<br />
advertised in a newspaper in general circulation at least 5 days prior to the bid opening.<br />
Written contracts are required. All bid openings will be public. All bids must be awarded<br />
by the <strong>City</strong> Commission. Performance bids and/or bid bonds and insurance may be<br />
required on some projects and purchases.<br />
The <strong>City</strong> shall maintain a written policy regarding the use <strong>of</strong> procurement cards (credit cards) to<br />
enter into purchase transactions. All other purchasing requirements also apply to credit card<br />
purchases.<br />
Performance Measurement Policies:<br />
Annually the <strong>City</strong> shall review and update the Strategic Plan identifying the Strategic Priorities<br />
and Key Success Indicators (KSI’s) that measure appropriate results for each Outcome.<br />
Annually each department shall develop departmental performance measures that support<br />
achieving successful results in the <strong>City</strong>-Wide KSI’s. Goals should be related to core services <strong>of</strong><br />
the department and should reflect customer needs. The measures should be a mix <strong>of</strong> different<br />
types, including effectiveness, efficiency, demand and workload. Measures should be similar to<br />
other cities for benchmarking purposes but also have sufficiently aggressive goals to ensure<br />
continuous improvement.<br />
Department Directors shall establish performance measures for each division or program within<br />
their department to monitor and project program performance. Annual summaries <strong>of</strong> progress<br />
on KSI’s and departmental performance measures will be published and distributed.<br />
Did you know…<br />
<strong>Lakeland</strong> was ranked #22 nationally by the<br />
Milken Institute for 5-year job growth and<br />
#26 for salary and wage growth within the<br />
200 best performing cities in 2008.<br />
B-15 Fiscal Year <strong>2010</strong> Annual Budget
Budget Process Overview<br />
How the Budget Was Created<br />
Annually the <strong>City</strong> Commission begins a process <strong>of</strong> strategic planning designed to identify the issues that<br />
must be addressed to achieve our Mission and that will persist throughout the Strategic Plan. Reviewed and<br />
updated annually, the Strategic Plan creates a shared vision for the future <strong>of</strong> the community. These longrange<br />
Outcomes developed by the <strong>City</strong> Commission and reaffirmed in the Strategic Plan, emphasize the<br />
values <strong>of</strong> our customers. For a complete list <strong>of</strong> the FY<strong>2010</strong> Outcomes see pages C-4 to C-8. Through this<br />
process, Key Success Indicators (KSI’s) and the Business Plan were also developed.<br />
Business Plan<br />
With the Outcomes set, the operations <strong>of</strong> the <strong>City</strong> are reviewed and redirected<br />
to bring the strategic vision to life. Specific programs, capital purchases,<br />
staffing requirements and funding levels are developed in response to the<br />
needs identified in the Strategic Plan. The plan is an outgrowth <strong>of</strong> the<br />
Outcomes, capturing the <strong>City</strong>’s Vision in a quantifiable form, improving decision<br />
making and resource allocation.<br />
A benefit <strong>of</strong> using a Business Plan is the direct link between costs, Programs,<br />
Activities and Core Services. We will begin to use this model to monitor our<br />
performance by developing process maps that link budget items to activities<br />
and identify value-added and non-value-added services.<br />
In developing the Fiscal Year operating budget, departments analyze existing core services and potential<br />
services keeping in mind the Strategic Plan Outcomes. The Business Plan identifies added and removed<br />
services, which are then quantified in the line item budget. They reflect not only the Outcomes as set by the<br />
<strong>City</strong> Commission, but also incorporate feedback from customer surveys and policy initiatives that contribute<br />
to the long-term financial health <strong>of</strong> the <strong>City</strong>.<br />
Departments set goals to meet the needs identified by the Outcomes. To meet these goals, core services<br />
within the departments have specific performance measurements. Future enhancements to further this<br />
process will ensure each employee knows what the end result should be and how it contributes to the <strong>City</strong>’s<br />
Strategic Plan. In this way the budget becomes a tool for monitoring, rather than controlling operating<br />
performance.<br />
B-16 Fiscal Year <strong>2010</strong> Annual Budget
Budget Process Overview<br />
Budget Methodology<br />
The budget for the <strong>City</strong> <strong>of</strong> <strong>Lakeland</strong> is a performance based budgeting system. This type <strong>of</strong> budgeting<br />
system identifies a particular level <strong>of</strong> service performance for each type <strong>of</strong> service (program) and the<br />
resources needed to operate it, as well as describes the structure <strong>of</strong> the departments and the programs<br />
into which they are divided. The Performance Budget is separated into Programs and Activities which<br />
are broken down into the following components:<br />
COMPONENT<br />
Program Description<br />
DESCRIPTION<br />
The statement must identify the particular purpose for the activities<br />
and how they relate to the <strong>City</strong>’s overall mission.<br />
Core Services<br />
Performance Measurements<br />
(FY<strong>2010</strong> Development Year)<br />
A listing <strong>of</strong> the fundamental services that the activity is designed to<br />
provide.<br />
FTE’s: Number <strong>of</strong> full-time equivalents associated with<br />
the completion <strong>of</strong> the Activity.<br />
Personnel Costs: Salary and Benefits for the associated<br />
FTE’s.<br />
Operational Costs: All costs (other than personnel)<br />
attributed with completing the Activity.<br />
Debt Service: Acquired debt (if applicable)<br />
Net Cost: Total Activity Cost<br />
The performance measurements will focus on particular<br />
accomplishments that will be attained within the current year. All will<br />
be measurable by the performance indicator’s supplied. Each<br />
performance measure will include explicit links showing how<br />
objectives and their indicators are directly related to the Outcomes<br />
they support. Performance Measurements may be developed:<br />
Operationally<br />
<br />
<br />
As a specific <strong>City</strong>-wide Key Success Indicators<br />
From a Florida Benchmarking Consortium (FBC)<br />
measurement<br />
Approach to Budget Review Process<br />
Start Up<br />
We begin by reviewing all current services in light <strong>of</strong> the Strategic Plan. Are current services sufficient<br />
or necessary? What new initiatives should be undertaken to meet constituent requirements? A budget<br />
calendar is then developed driven in large part by the Truth in Millage (TRIM) dates. We then develop a<br />
list <strong>of</strong> recommended changes arising out <strong>of</strong> this analysis, forming the basis for the Business Plan.<br />
B-17 Fiscal Year <strong>2010</strong> Annual Budget
Budget Process Overview<br />
Pre-Budget Kick-Off Meeting:<br />
DATE RESPONSIBILITIES ACTION REQUIRED<br />
March 12-25 CMO, PE, Finance Core Service Department Review Meetings<br />
March 16-<br />
April 10<br />
Departments<br />
Core Service Toolkits (Grading)<br />
April 3 Finance Prepare FY2009 Projections<br />
April 2 – April<br />
30<br />
CMO, PE, Finance<br />
Non GF: Core Service Department Review Meetings and Grading<br />
April 13-17 PE Compile/Tabulate Core Service Grading Worksheets<br />
April 10 Finance CIP Worksheets to Departments<br />
April 16 Finance Prepare FY<strong>2010</strong> Projections – All Funds<br />
April 17<br />
CC, CMO, PE, Finance<br />
<strong>City</strong> Commission Workshop: Review Outcomes, Prioritization<br />
Process and Global Fiscal Issues<br />
April 22 Finance Line Item Budget Worksheets to Internal Service Funds<br />
April 22-24 Grading Review Committee Review/Finalize Core Services Grading<br />
April 24 Departments CIP Worksheets Returned to Finance<br />
April 27-30 PE Finalize Core Service Prioritization Charts<br />
April 27-May<br />
3<br />
April 30 –<br />
May 28<br />
May 1<br />
May 2 – May<br />
17<br />
May 4<br />
May 6<br />
May 14<br />
CMO<br />
Finance<br />
CC, CMO, PE, Finance<br />
PE, Grading Review Committee<br />
CC, CMO, PE, Finance<br />
Finance<br />
CMO, PE, Finance<br />
Determine FY<strong>2010</strong> Budget Adjustments (+/- Quartile Percentages)<br />
CIP Reviews<br />
<strong>City</strong> Commission Workshop: Present Prioritization <strong>of</strong> Core Services<br />
and Funds Analysis<br />
Non GF: Compile/Tabulate Core Service Grading and GRC Review/<br />
Finalize<br />
<strong>City</strong> Commission Workshop: Finalize Prioritization and Present<br />
Quadrant Assessments<br />
Internal Service Funds Return Completed Line Item Budget<br />
Worksheets to Finance<br />
Budget Kick-<strong>of</strong>f for Department Heads and Appropriate Staff:<br />
Tone-At-The-Top<br />
Overview <strong>of</strong> the Prioritization Process<br />
Financial Impact<br />
B-18 Fiscal Year <strong>2010</strong> Annual Budget
Budget Process Overview (cont’d)<br />
Post-Budget Kick-Off Meeting:<br />
DATE RESPONSIBILITIES ACTION REQUIRED<br />
May 18 Finance Release Line Item Worksheets<br />
May 19 Finance Budget System Training (10:00 and 10:30 - ER Conference Room)<br />
May 27<br />
Prior to the Day<br />
<strong>of</strong> Your <strong>City</strong><br />
Manager Review<br />
Meeting<br />
June 1<br />
June 6<br />
Performance Excellence<br />
Departments<br />
Departments<br />
Departments<br />
June 3 – 19 <strong>City</strong> Manager Review Proposed Budgets<br />
July 13<br />
July 14<br />
Departments<br />
<strong>City</strong> Manager, <strong>City</strong> Commission<br />
Optional: Budget Development/Core Services Template/<br />
Worksheets Technical Training (CC Conference Room - 1:30 or<br />
3:00)<br />
Return Meeting Deliverables (7 Copies) to Performance Excellence:<br />
Summary Worksheet<br />
Performance Measurements<br />
TO (Visio) Worksheets<br />
Departments with Budget Meetings Prior to June 8 th , Return Line<br />
Item Worksheets to Finance<br />
Departments with Budget Meetings June 8 th or later, Return Line<br />
Item Worksheets to Finance<br />
Complete Performance Budget Pages and Return to Performance<br />
Excellence<br />
Hold Budget Workshop With <strong>City</strong> Commission; Adopt Property Tax<br />
Millage Rate, Set Dates for Public Hearings<br />
June 29 Property Appraisers Office Delivers Tax Assessment to the <strong>City</strong><br />
July 13-17 CMO, Finance, PE <strong>City</strong> Commission One-on-Ones<br />
Deliver Proposed Tax Millage Rate, Roll-Back Rate, Public Hearing<br />
July 27 Finance<br />
Schedule to Property Appraiser<br />
August 17 Property Appraiser Publish TRIM Notice for 1 st Public Hearing<br />
August 21 <strong>City</strong> Clerk Publish Notice <strong>of</strong> Public Hearing on Mayor and Commission Salary<br />
August 24<br />
September 8<br />
6:00 p.m.<br />
PE, Finance<br />
<strong>City</strong> Commission<br />
Provide <strong>City</strong> Commission FY<strong>2010</strong> Proposed Budget for Review<br />
Prior to Public Hearings<br />
Submit Performance Budget Document to <strong>City</strong> Commission and<br />
Hold First Public Hearing on Tentative Budget, Proposed Millage<br />
Rate, Adopt Proposed Millage Rate<br />
September 11 <strong>City</strong> Clerk Publish Notice <strong>of</strong> Public Hearing on Final Budget<br />
September 21<br />
6:00 p.m.<br />
<strong>City</strong> Commission<br />
Second Public Hearing to Adopt Final Budget and Millage Rate<br />
B-19 Fiscal Year <strong>2010</strong> Annual Budget
Budget Process Overview<br />
Beginning with each Program, which is a driving force behind the Activity’s budget and should set the<br />
direction <strong>of</strong> the department, we develop a projected budget based on the previous year’s budget with<br />
any new Core Services appended and any discontinued Core Services removed.<br />
From there, Key Success Indicators are developed that relate to the <strong>City</strong>’s Strategic Plan. Goals and<br />
objectives should be realistic and quantifiable and improvements should support the efficiency and<br />
effectiveness. Current goals and objectives may be used to establish a starting point for the future.<br />
In March, the Finance Department distributes to departments a target budget for the coming year,<br />
which is based on projections <strong>of</strong> current year expenditures and prioritized Core Service costs. For<br />
FY<strong>2010</strong>, budget targets were developed based on prioritized Core Services and their relationship to<br />
achieving the Goals <strong>of</strong> the Strategic Operating Plan. Operating costs are included in this target<br />
budget. At the same time, Capital Improvement Program and physical inventory worksheets are<br />
distributed for department input.<br />
Verification <strong>of</strong> all numbers and assumptions made in these categories is carried out by departmental<br />
staff. Personnel changes such as retirements, projected salary increases or changes in hours worked<br />
are then submitted.<br />
Operating Expenses<br />
The target budget contains operating expenses based on projections <strong>of</strong> the current year’s<br />
expenditures.<br />
The actual users <strong>of</strong> the supplies and services review their practices and habits involving daily<br />
expenditures for possible efficiencies. Departments review the line item account codes for accuracy <strong>of</strong><br />
description and determine if they reflect the actual types <strong>of</strong> expenditures.<br />
Lastly, they provide justification for any changes from the target budget with the use <strong>of</strong> information<br />
from current year expenditures or information obtained from other sources, such as trends in next<br />
year’s contracts or service costs provided by the Purchasing Division.<br />
Capital Expenses<br />
Departments evaluate all existing equipment, facilities and other capital items, to determine if useful<br />
life has been exceeded, or will be exceeded, in the coming budget year.<br />
They identify all recommended capital expenditures from this evaluation <strong>of</strong> equipment. Vehicle life<br />
expectancy information is provided by the Public Works Department - Fleet Services Division. Each<br />
department maintains a ten-year Capital Improvement Program plan for its equipment needs and<br />
submits for review.<br />
Business Plan<br />
Taking into account the market environment, customer expectations and<br />
emerging issues, the changes to service structure (discontinued<br />
services, new services, etc.) are outlined and cross-referenced to the<br />
Strategic Plan.<br />
<strong>City</strong>-wide financial strategies are identified to address the long-term<br />
needs <strong>of</strong> the <strong>City</strong> in relation to emerging issues that have been identified<br />
through the strategic planning process.<br />
Anticipated results are identified and linked to Key Success Indicators for<br />
inclusion in the <strong>City</strong>’s performance measurement system.<br />
B-20 Fiscal Year <strong>2010</strong> Annual Budget
Budget Process Overview<br />
Budget Format<br />
A Municipal budget document should provide sufficient, meaningful and useful information to elected<br />
<strong>of</strong>ficials, <strong>City</strong> staff and to the public. To that end, we have developed a budget document that serves<br />
four primary functions:<br />
<br />
<br />
<br />
<br />
Policy Document<br />
Financial Plan<br />
Operations Guide<br />
Communication Device<br />
Together, these budget elements define what the <strong>City</strong> <strong>of</strong> <strong>Lakeland</strong> has done, what it plans to do and<br />
how it will accomplish its objectives.<br />
The budget is a program/performance based plan that links prescribed organizational goals and<br />
objectives with the financial resources necessary to achieve them. Each <strong>of</strong> the budget’s programs<br />
represent a “product” <strong>of</strong> the <strong>City</strong>. Contained within each program are objectives and achievements. The<br />
program/performance budget is integrated with line item financial information to ensure optimal budget<br />
control.<br />
This program/performance budget enables the <strong>City</strong> Commission and the public to analyze the budget by<br />
priorities based on program goals and performance objectives rather than line item costs. In addition,<br />
this format provides information so that the <strong>City</strong> Commission and the public will have a better<br />
understanding <strong>of</strong> the allocation <strong>of</strong> resources among programs and the measurable work that each<br />
department will accomplish.<br />
The FY<strong>2010</strong> budget includes an Introduction section followed by Budget Overview, Long-Range<br />
Planning, Performance Budget, Line Item Budget, Capital Improvement Planning (CIP) and<br />
Supplementary Information sections.<br />
Approving The Process<br />
During the months <strong>of</strong> June - August, recommended operating and capital improvement program budget<br />
documents are prepared and presented to the <strong>City</strong> Manager, the Budget Review Team and ultimately to<br />
the <strong>City</strong> Commission for review. The <strong>City</strong> Commission either approves or makes changes in the<br />
recommended budgets and returns to staff for further study.<br />
Public hearings and final adoption <strong>of</strong> the budget occurs in mid-September.<br />
Monitoring The Budget<br />
The Finance Chief Accountants are authorized to transfer budget amounts within individual<br />
departments.<br />
Actual expenditures and operating transfers out may not exceed the adopted budget at the individual<br />
fund level.<br />
Appropriations which are neither expended, encumbered, nor specifically designated to be carried over<br />
lapse at the end <strong>of</strong> the fiscal year.<br />
B-21 Fiscal Year <strong>2010</strong> Annual Budget
Budget Process Overview<br />
Amending The Budget<br />
If, during the course <strong>of</strong> the fiscal year, it becomes evident that a particular fund is unable to provide the<br />
required level <strong>of</strong> services to the community due to unexpected higher costs <strong>of</strong> providing the service, the<br />
budget may be amended.<br />
The Director <strong>of</strong> Finance, through the <strong>City</strong> Manager, submits to the <strong>City</strong> Commission a request to amend<br />
the budget. The request contains explanations written by the Director(s) <strong>of</strong> the department(s) needing<br />
additional funds.<br />
The request also includes a proposal for financing the additional expenditures, usually either by<br />
appropriating from the fund balance or by submitting evidence <strong>of</strong> expected surplus current year<br />
revenues.<br />
<strong>City</strong> Commission approval is required for budget amendments which alter the budget <strong>of</strong> any fund.<br />
Did you know…<br />
In 2008 Florida Southern College was<br />
ranked 10th among the Nations Best<br />
Baccalaureate Colleges in the South<br />
by U.S. News and World Report.<br />
B-22 Fiscal Year <strong>2010</strong> Annual Budget
Table <strong>of</strong> Contents<br />
Long-Range Planning ........................................................................ Section—C<br />
Long-Range Planning Overview & Mission Statement ..................... C-2<br />
Core Values ........................................................................................... C-3<br />
Outcomes .............................................................................................. C-4<br />
Environmental Scan ............................................................................. C-9<br />
Financial Health and Strategy ........................................................... C-12<br />
Revenue Sources ............................................................................... C-18<br />
Debt Management Overview .............................................................. C-23<br />
C-1 Fiscal Year <strong>2010</strong> Annual Budget
Long-Range Planning Overview<br />
This section outlines the elements <strong>of</strong> our long-range<br />
financial planning process.<br />
First, we recap the Strategic Plan for FY<strong>2010</strong>. Our<br />
Mission Statement, Core Values and Outcomes are<br />
summarized over the next few pages.<br />
Following the FY<strong>2010</strong> Business Plan is the<br />
development <strong>of</strong> the Environmental Scan, which is an<br />
overview <strong>of</strong> the economic and developmental forces<br />
at work in the community also describing changes in<br />
the demographic, technological, legislative and<br />
service demand areas.<br />
We also look outside our organization at other cities<br />
and private sector competitors to see what levels <strong>of</strong><br />
service and operational strategies are being used<br />
throughout the world. We believe in using “best<br />
practices” to model our systems.<br />
Future enhancements to this document will provide<br />
reviews <strong>of</strong> the results from our Financial Trend<br />
Monitoring System, a tool we use to monitor our<br />
relative performance in some key financial measures.<br />
All <strong>of</strong> the tools noted are used in the development <strong>of</strong><br />
the Forecast. This is where we attempt to anticipate<br />
the impact <strong>of</strong> our changing environment, as well as<br />
plan for future operational and capital expenditures.<br />
A brief overview <strong>of</strong> our significant Revenue Sources<br />
follows on page C-18.<br />
Based on our forecasts, we have created a financial<br />
strategy for the short-term that positions us to best<br />
plan for the long-term trends and conditions.<br />
Lastly, a Debt Management Overview is provided<br />
with brief explanations <strong>of</strong> debt purposes and debt<br />
trends.<br />
Mission Statement<br />
A community working together to<br />
provide an exceptional quality <strong>of</strong> life.<br />
C-2 Fiscal Year <strong>2010</strong> Annual Budget
Core Values<br />
Leadership<br />
We will lead by example, learn from the past, provide<br />
direction for the present and plan for the future.<br />
Commitment to Excellence<br />
We will achieve measurable success and continuous<br />
improvement through investment <strong>of</strong> resources,<br />
accountability and high expectations for quality.<br />
Diversity<br />
We will utilize our differences to encourage participation,<br />
opportunity, equality, respect and responsiveness to our<br />
community.<br />
Integrity<br />
We will conduct ourselves in an honest and ethical manner<br />
to earn the trust <strong>of</strong> employees and citizens.<br />
Empowered Workforce<br />
We will cultivate a work environment which <strong>of</strong>fers employees the<br />
authority to act through supportive leadership, mutual respect,<br />
trust, personal responsibility and open communication.<br />
Social Responsibility<br />
We will enhance the quality <strong>of</strong> life for all citizens<br />
through partnerships and programs that embrace<br />
cultural diversity, safety and community involvement.<br />
C-3 Fiscal Year <strong>2010</strong> Annual Budget
Outcomes<br />
Arts and Cultural Enrichment<br />
Promote arts and culture throughout the <strong>City</strong>.<br />
Partner with art/cultural organizations in support<br />
<strong>of</strong>: public art, arts in<br />
public schools, historic<br />
and new architecture<br />
promotion and in<br />
celebrating diverse<br />
cultural activities.<br />
Reliable and Efficient Public Safety<br />
Programs<br />
Provide a high level <strong>of</strong> public safety, including<br />
police presence at recreational areas, street level,<br />
crime prevention through environmental design,<br />
safe neighborhoods, safe places for kids and<br />
pedestrian safety. Provide adequate fire service<br />
and staff, rapid response from emergency<br />
services and continued recognition <strong>of</strong> first<br />
responders.<br />
Continuous and Inclusive Public<br />
Engagement<br />
Improve communication and citizen participation<br />
in community priority setting. Involve citizens in<br />
quality <strong>of</strong> life issues and in identifying citizen<br />
concerns. Promote volunteerism, educational<br />
programs such as Citizens Academy,<br />
membership on city operating boards and on<br />
neighborhood associations. Engage citizens and<br />
all stakeholder groups as we work to improve<br />
communication.<br />
Enhanced Mobility Options<br />
Strengthen transportation options which include<br />
traffic controls congruent with new developments,<br />
extended hours <strong>of</strong> public transportation, new bike<br />
paths, pedestrian connections to activity centers<br />
and transportation for seniors.<br />
Economic, Cultural and Service Oriented<br />
Public/Private Partnerships<br />
Cultivate Public/Private partnerships to facilitate a<br />
cultural and service oriented community that leads<br />
to economic prosperity. These partnerships will<br />
help promote aesthetics, the arts and leverage<br />
public/private funds to help support direct services<br />
in neighborhoods.<br />
Diverse Recreational Opportunities and<br />
Quality Public Spaces<br />
Provide access to a wide range <strong>of</strong> recreational<br />
events and programs which address the needs <strong>of</strong><br />
a diverse community. Affordable recreation aimed<br />
at cultivating quality events which bring people<br />
together. Provide quality public spaces with<br />
accessible parks, libraries, diverse entertainment<br />
opportunities and<br />
downtown activities which<br />
cultivate a vibrant night life.<br />
Focus on a place where<br />
people can “work, live and<br />
play” in one community.<br />
Responsive, Efficient and Superior<br />
Standards <strong>of</strong> Municipal Services<br />
Provide effective municipal services with a high<br />
level <strong>of</strong> citizen/customer satisfaction. Maintain<br />
high standards for municipal service delivery<br />
through a highly trained staff working toward<br />
providing our citizens with an exceptional quality<br />
<strong>of</strong> life.<br />
Educational Training Achievements and<br />
Life Long Learning<br />
Support <strong>Lakeland</strong> Vision and Polk Vision in their<br />
efforts to elevate our school system; involve<br />
parents in education; provide educational<br />
opportunities at varying levels; career training; the<br />
continuation <strong>of</strong> city/school board projects; and<br />
programs aimed at life-long learning.<br />
C-4 Fiscal Year <strong>2010</strong> Annual Budget
Outcomes<br />
Vibrant Communities and Healthy<br />
Lifestyles<br />
Encourage and support providing access to high<br />
quality healthcare, promote healthy lifestyles,<br />
continue to work with major medical service<br />
providers and encourage city/business wellness<br />
programs and incentives. Continue to support<br />
affordable housing in safe neighborhoods, the<br />
HUD plan to address homelessness, more<br />
access/affordable mental healthcare and<br />
struggling families.<br />
Fiscal Responsibility and Shared<br />
Resources<br />
Support broader collaboration with community<br />
stakeholders, conduct a cost benefit analysis on<br />
all proposed regulation, treat cost as a prime<br />
factor for all new infrastructure and continue to<br />
support both short-term and long-term<br />
maintenance.<br />
Reliable, Adequate Infrastructure<br />
Provide reliable utilities (electric and water) to<br />
serve the current/future needs <strong>of</strong> our customers.<br />
Ensure a high quality infrastructure to provide<br />
services to existing citizens<br />
as well as police and fire<br />
resources with responsive<br />
emergency services to<br />
ensure safe neighborhoods.<br />
Quality Developments Consistent with<br />
Community Industry and Green Standards<br />
Establish dynamic standards to respond to the<br />
changing environment - conservation, landscaping<br />
design, green construction, etc. Continue to<br />
enhance the identity and character <strong>of</strong> all<br />
neighborhoods, supporting a high quality <strong>of</strong> life in<br />
<strong>Lakeland</strong>. Coordinate services with public/private<br />
and other government that considers citizens<br />
desires and supports sustainable communities.<br />
Safe Attractive Neighborhoods Across the<br />
Economic Spectrum<br />
Maintain attractive public spaces setting adequate<br />
construction codes and equitable enforcement.<br />
Encourage a variety <strong>of</strong><br />
housing types including<br />
affordable housing.<br />
Ensure that community<br />
gathering places are<br />
safe and there is safe<br />
access to schools and<br />
parks for our children.<br />
Regionally Adequate Transportation<br />
Systems<br />
Create regional networks, including adequate<br />
mass transit and efficient road networks which<br />
provide more effective connectivity to Tampa/<br />
Orlando. Foster greater transit choices, a regional<br />
transportation network for goods and people,<br />
which includes congestion management.<br />
Increase walk-ability <strong>of</strong> <strong>Lakeland</strong>'s neighborhoods,<br />
including sidewalks and bike paths.<br />
Comprehensive Integrated Approach to<br />
Land Use Decisions<br />
Establish balance in the control mix <strong>of</strong> land use,<br />
bring neighbors and city together as partners, use<br />
competitive utility service pricing, promote cross<br />
jurisdictional cooperation, encourage infill, density<br />
and provide long-range planning to invest in<br />
infrastructure needs necessary for growth. Plan<br />
smart so that growth does not consume reserve<br />
capacity or degrade service levels.<br />
Measurable Performance <strong>of</strong> Innovation,<br />
Efficiency and Effectiveness<br />
Continually monitor and evaluate cost<br />
effectiveness, creative core business<br />
enhancements, efficient and accountable with<br />
good environment <strong>of</strong> internal controls, best<br />
management practices while meeting/exceeding<br />
customer expectations.<br />
C-5 Fiscal Year <strong>2010</strong> Annual Budget
Outcomes<br />
New or Diversified Revenue Streams to<br />
Fund Priorities<br />
Continually look for opportunities for public/<br />
private partnerships, form strategic alliances,<br />
expand pr<strong>of</strong>itable services, look for areas that<br />
should be paying user fees and explore<br />
alternative sources <strong>of</strong> revenues.<br />
Effective and Timely Communication<br />
with Customers<br />
Create online surveys for public opinion, embrace<br />
new forms <strong>of</strong> technology to communicate with<br />
public, one-stop-shop for information (website) for<br />
citizens and residents, updated LGN<br />
programming, improve/upgrade our websites and<br />
utilize all available media means to inform the<br />
community.<br />
Strategic and<br />
Budgetary Planning and Prioritization <strong>of</strong><br />
Resources<br />
Financial resource allocations aligned with<br />
priorities, effectively redirect financial resources<br />
from ineffective uses to more effective and<br />
appropriate ones, conservative responsible longterm<br />
financial plan and invest/fund critical<br />
services <strong>of</strong> <strong>City</strong> government.<br />
Media Partnerships for Real Time<br />
Communication Feedback<br />
Develop partnership with Ledger for regular<br />
scheduled inserts for <strong>City</strong> events, form likeminded<br />
workgroups for special events external<br />
communications/internal communications, explore<br />
using traditional media partnerships, conduct<br />
community workshops in all corners <strong>of</strong> the<br />
community, formalize and expand volunteer<br />
program and include a training component "Love<br />
<strong>Lakeland</strong>" local On-line Volunteer Effort.<br />
Strategic, Accountable and Transparent<br />
Cost Management<br />
Collect and charge true cost <strong>of</strong> services,<br />
emphasize transparency <strong>of</strong> costs and improve<br />
productivity per employee and apply technology.<br />
Customer Experience Deemed<br />
Pr<strong>of</strong>essional, Responsive and Productive<br />
Respond to inquiries in timely fashion, easy<br />
access government,<br />
Citizens feedback - input,<br />
all Citizens involved and<br />
engaged, push<br />
communications to all<br />
segments <strong>of</strong> our<br />
community and open<br />
forums for information.<br />
Transparent and Understandable<br />
Message Content<br />
Shared, understood measures (Key Success<br />
Indicators), communicate success, be<br />
accountable to the public by sharing our<br />
performance goals and progress, Citizens/<br />
Employees - shared Vision and Goals and<br />
Transparency.<br />
Customer and Market Focus<br />
(Benchmarking)<br />
Open to new ideas and pro-active in looking for<br />
those ideas, oversight and support <strong>of</strong> performance<br />
management system, cost-effective business<br />
practices, insure that overhead cost are efficiently<br />
managed and are effective in providing support<br />
and eliminate service duplications.<br />
C-6 Fiscal Year <strong>2010</strong> Annual Budget
Outcomes<br />
Enriched, Informed and Engaged<br />
Workforce<br />
Ensure that procedures are in place in each<br />
department to keep all employees properly<br />
informed, provide engagement activities which<br />
motivate and encourage employee involvement,<br />
make best use <strong>of</strong> technology, especially new<br />
technology clearer expectations for all associates<br />
and increased stewardship <strong>of</strong> our organizational<br />
demographics.<br />
Results Oriented and Value Based<br />
Leadership<br />
Responsible, Citizen-focused, values driven,<br />
sensitive to Citizen’s needs and specify decision<br />
making authority and accountability.<br />
Strategic and Long Term Planning<br />
Strategic and long-term planning, accurate<br />
estimate and maintenance <strong>of</strong> addressing (911)<br />
and anticipating challenges and needs.<br />
Knowledge and Analysis Based<br />
Decision-Making<br />
Engage the skilled and knowledgeable in<br />
appropriate decisions. GIS mapping and<br />
database management, complete legislative<br />
history and provide a framework for decisionmaking.<br />
Transparent, Accountable and Efficient<br />
Business Processes<br />
Focus on internal process to support citizen facing<br />
goals, in-touch with the needs <strong>of</strong> the public.<br />
Strategic and long-term planning, great<br />
communication <strong>of</strong> roles and responsibilities.<br />
Safeguarding <strong>of</strong> Assets and Prudent<br />
Management <strong>of</strong> Fiscal Resources<br />
Data management, implement/update pension<br />
internal controls and procedures, study cutting<br />
edge opportunities/options for defined benefits/<br />
defined contribution plans, risk mitigation.<br />
Regulatory and Policy Compliance<br />
Manage compliance with federal, state and local<br />
laws. Policy review committee/process and<br />
consistency <strong>of</strong> services and occupational safety.<br />
C-7 Fiscal Year <strong>2010</strong> Annual Budget
Outcomes<br />
Partnering for Economic Connections,<br />
Collaboration and Creation<br />
Continue our strong partnership with LEDC,<br />
building partnerships regionally and strengthen<br />
our Tampa Bay partnerships. Develop<br />
partnerships amongst educational institutions and<br />
promote joint projects with Polk County. Focus on<br />
public/private partnerships and support global<br />
networking partnerships with aligned regions.<br />
Generationally-Diverse and Attractive<br />
Environment<br />
Develop and foster an inclusive environment for<br />
young pr<strong>of</strong>essionals, promote expansion <strong>of</strong><br />
healthcare/community options for the growing<br />
"boomers" segment <strong>of</strong> the population. Establish<br />
strong arts support and related creative class<br />
amenities such as the availability <strong>of</strong> diverse<br />
housing, education and lifestyle opportunities.<br />
Downtown Focus and Vibrancy<br />
Collaborate with business interests to continue to<br />
focus on the "core" downtown by acquiring<br />
property. Developing land by the Civic Center.<br />
Encouraging mixed use developments.<br />
establishing green zones<br />
downtown. Focusing on<br />
downtown residential;<br />
encouraging interesting<br />
retail and more mixed-use<br />
downtown which will<br />
support downtown retail<br />
and <strong>of</strong>fice employment.<br />
Sustainable Business Environment and<br />
Tourism<br />
Promote area economic development initiatives by<br />
improving the connection between education,<br />
training and business recruitment. Establish<br />
business development initiatives improving our<br />
processes focused on providing more targeted<br />
service.<br />
Enriched Community Workforce/<br />
Creative Class Jobs<br />
Attract greater opportunities for the community's<br />
"under-employed" talent, bridge workforce loss in<br />
current economy to meet aging workforce<br />
challenge, develop stronger relationships and<br />
understanding with workforce resources and<br />
maintain employment opportunities for all<br />
educational levels. Increase the level <strong>of</strong><br />
understanding <strong>of</strong> our economic opportunities to<br />
our "hard to reach" and "under-served" community<br />
sectors and continue to provide access to <strong>City</strong><br />
employment. Cultivate high skill/high wage jobs<br />
and continue to support the high technology<br />
initiative drawing new companies to our area.<br />
Provide programs to tap into semi-retired "aging<br />
boomers" who still want to contribute.<br />
C-8 Fiscal Year <strong>2010</strong> Annual Budget
Environmental Scan<br />
Economic Analysis<br />
After several years <strong>of</strong> continued uninterrupted<br />
economic growth, the fundamental stability <strong>of</strong> the U.S.<br />
economy is in a current state flux. Negative growth<br />
looms and many economic forecasters believe the<br />
U.S. has already entered into a recession. Real<br />
annual Gross Domestic Product (GDP) in the U.S.<br />
grew by 2.9% in calendar year 2005, 2.8% in 2006 and<br />
2.0% in 2007. With the close <strong>of</strong> the 2008 fiscal year,<br />
the annual GDP is forecasted to hover around 1%<br />
based on 2008 quarterly averages. This decreased<br />
rate further underscores the longer term prognosis <strong>of</strong> a<br />
potential national recession.<br />
The slowing economy, which began in 2007, is in<br />
direct relation to the struggles created within the<br />
housing industry as it is associated with consumer<br />
lending and borrowing. In October <strong>of</strong> 2008, the<br />
second phase <strong>of</strong> this global downturn was initiated with<br />
the $700 billion rescue plan for the fragmented U.S.<br />
financial system. With the creation <strong>of</strong> the Emergency<br />
Economic Stabilization Act <strong>of</strong> 2008, the U.S. Treasury<br />
was given the authority to purchase distressed assets,<br />
especially mortgage-backed securities, from the<br />
nation's failing financial service institutions in an<br />
attempt to reduce uncertainty regarding the worth <strong>of</strong><br />
the remaining assets and to restore confidence in the<br />
nation’s credit markets.<br />
The U.S. labor market continues to slow as<br />
unemployment rates have reached their highest level<br />
in 14 years, resulting in a marked decline in payroll<br />
spending. Job losses have begun to accumulate. The<br />
national unemployment rate was 6.5% in October <strong>of</strong><br />
2008 and analysts are expecting it to reach 7.0% in<br />
2009 before peaking at 7.5% later that same year.<br />
This negative job creation reflects longer periods <strong>of</strong><br />
unemployment which directly impacts the foreseeable<br />
wage growth for current and future workers.<br />
Job losses have occurred across most industries. The<br />
increase in unemployment can be partially attributed to<br />
the spillover effects <strong>of</strong> the stagnant U.S. housing<br />
market and the failed financial system. Construction<br />
and manufacturing jobs have accounted for a<br />
substantial portion <strong>of</strong> the jobs lost. However, with<br />
decreased consumer spending and weak retail sales,<br />
both the service and retail sectors are beginning to<br />
show signs <strong>of</strong> vulnerability. Only the health care<br />
industry and the government continue to generate<br />
positive job growth. With over 1.2 million jobs shed in<br />
2008, industry wide, health care and government have<br />
provided the only bright spot by adding over 450,000<br />
jobs during this same period.<br />
Consumer spending, which once accounted for more<br />
than two-thirds <strong>of</strong> all economic activity in the U.S.,<br />
declined for a record fourth consecutive month as the<br />
2008 holiday season approached. Not surprisingly,<br />
the slowdown in economic growth has had a direct<br />
effect on consumer spending. Despite the heights <strong>of</strong><br />
2007, consumer spending has begun to decline with<br />
rising unemployment rates, unstable financial lending<br />
and high energy prices. The third quarter <strong>of</strong> 2008<br />
marked the most significant fall in consumer spending<br />
in over a decade. As predicted by many economists,<br />
this accelerated decline was a direct result <strong>of</strong> the<br />
quickly spent one-time government stimulus checks<br />
that were distributed in the second quarter <strong>of</strong> 2008. As<br />
domestic demand begins to wane, the U.S. economy<br />
may also be hit by a slowdown in economies abroad,<br />
eroding the export gains that have helped prop up the<br />
existing growth and employment.<br />
As economic growth begins to decline, core inflation<br />
remains a noteworthy concern. The U.S. Consumer<br />
Price Index (CPI) rose by 4.5% for the 12 months<br />
ending in September 2008, indicating a steady<br />
increase in the prices paid for consumer goods.<br />
Looking to the future, analysts foresee a moderating<br />
affect <strong>of</strong> the prices <strong>of</strong> consumer goods which should<br />
help to keep inflation in check. Prices for consumer<br />
goods are expected to drop <strong>of</strong>f from their current level<br />
to around 3%, which is much more consistent with<br />
previous years.<br />
Oil prices spiked to over $155 a barrel in the summer<br />
<strong>of</strong> 2008 only to pull back below $60 in November <strong>of</strong> the<br />
same year. With these rapid changes, inflation<br />
indicators continue to stoke fears <strong>of</strong> continuing<br />
increases and fluctuations, consistent with the CPI.<br />
Also affecting the price index, are the prevalent<br />
increases in unemployment figures. Though the<br />
increase should continue to help compensation levels,<br />
it will also contribute to a tighter job market. It is clear<br />
that financial lending has emerged as the biggest issue<br />
facing the economy. As the global financial systems<br />
address the disorder created by sub-prime lending, the<br />
weak dollar may continue to increase global<br />
competitiveness. On balance, forecasters are<br />
anticipating weak growth or actual economic declines<br />
throughout the balance <strong>of</strong> 2009, with marked<br />
improvements beginning to resurface in <strong>2010</strong>.<br />
C-9 Fiscal Year <strong>2010</strong> Annual Budget
Environmental Scan<br />
Land Development Trends<br />
Residential<br />
In 2008, the <strong>City</strong> <strong>of</strong> <strong>Lakeland</strong>’s residential market<br />
began to see a drop in activity similar to the rest <strong>of</strong><br />
Florida and the nation. Single family permits have<br />
remained consistent with several large multi-phase<br />
residential developments continuing to grow, while<br />
the boom <strong>of</strong> multi-family development has slowed<br />
considerably. Though this activity has dropped<br />
dramatically from the record setting years in 2005<br />
and 2006, statistically, residential development<br />
activities remained in line with <strong>Lakeland</strong>’s most<br />
recent 10 year average.<br />
Geographically, the city limits continue to expand<br />
through annexation. With an estimated size <strong>of</strong> 74.34<br />
square miles as <strong>of</strong> November 2008 and population at<br />
93,508, <strong>Lakeland</strong> is the 22 nd largest city in Florida<br />
with densities much smaller than other cities <strong>of</strong> this<br />
size. With the voluntary annexation (between 2001<br />
and 2008) <strong>of</strong> more than 1,650 acres <strong>of</strong> vacant land in<br />
southwest <strong>Lakeland</strong>, the <strong>City</strong> is poised to experience<br />
a great deal <strong>of</strong> new residential and commercial<br />
activity. While developers in southwest <strong>Lakeland</strong><br />
have slowed their aggressive plans to construct more<br />
than 4,000 single and multi-family units, commercial<br />
activities that will eventually support the residential<br />
population, continue on. Northeast <strong>Lakeland</strong><br />
continues to gain momentum with the ongoing<br />
construction <strong>of</strong> the Bridgewater Development <strong>of</strong><br />
Regional Impact (DRI) and the future plans for the<br />
Williams DRI which will include the new USF<br />
<strong>Lakeland</strong> Polytechnic campus.<br />
Complementing the <strong>City</strong>’s well-rounded growth in<br />
southwest and northeast <strong>Lakeland</strong>, residential and<br />
commercial redevelopment activities in central<br />
<strong>Lakeland</strong> have surfaced as an emerging trend. In-fill<br />
lots and consolidated building projects, though<br />
currently account for only a small percentage <strong>of</strong> new<br />
activity, are gaining momentum with the potential for<br />
larger residential redevelopment activities on the<br />
horizon. As a whole, redevelopment activities<br />
continue to provide a solid economic foundation for<br />
the <strong>City</strong>’s local economy.<br />
As growth continues to follow the high-tech corridor<br />
<strong>of</strong> I-4, the city <strong>of</strong> <strong>Lakeland</strong> has become the center <strong>of</strong><br />
a mega-geographic area. At just over 30 miles from<br />
Tampa and 50 miles to Orlando, an estimated 8.5<br />
million people live within a 100 mile radius <strong>of</strong><br />
<strong>Lakeland</strong>.<br />
Industrial<br />
While <strong>Lakeland</strong>’s industrial market remains stable, it<br />
has shown recent signs <strong>of</strong> slowing in a consistent<br />
fashion with the residential market. With the close <strong>of</strong><br />
2008, vacancy rates have increased slightly, pointing<br />
to an overall s<strong>of</strong>tening <strong>of</strong> the market. Third quarter<br />
2008 vacancy rates ticked down slightly to 4.5%,<br />
marking a .4% decrease from the historically low rate<br />
established in the same quarter <strong>of</strong> 2007. Despite this<br />
increase in total vacant space, <strong>Lakeland</strong>’s overall<br />
vacancy rate remains one <strong>of</strong> the lowest throughout all<br />
<strong>of</strong> Florida’s major industrial markets.<br />
<strong>Lakeland</strong>’s ideal logistical location makes it a natural<br />
hub for industrial real estate. New companies<br />
continue to relocate to <strong>Lakeland</strong> while many existing<br />
businesses remain poised to expand. Though<br />
leasing activities have decreased in 2008, overall<br />
absorption rates are positive, placing <strong>Lakeland</strong><br />
number one in the state with a positive 286,592<br />
square feet. Despite the decrease in vacancy rates<br />
and demand, rental rates for industrial space<br />
continue to rise. Rental rates for industrial property<br />
closed out the 2008 fiscal year averaging $5.70 per<br />
square foot (psf), representing an approximate<br />
increase <strong>of</strong> 1.6% per quarter to their market wide<br />
average. Even as leasing rates remain below their<br />
normal levels, rates for <strong>Lakeland</strong>’s most abundant<br />
property type, warehouse/distribution, continue to<br />
hover well above $5.00 psf.<br />
The national and local economy has cast a shadow<br />
over <strong>Lakeland</strong>’s industrial market. Though<br />
performing below its historic average, development<br />
interests in <strong>Lakeland</strong> remain strong. As vacancy<br />
rates continue to decline, lease rates will eventually<br />
drop as tenants are given greater options <strong>of</strong> premium<br />
space. The <strong>City</strong> <strong>of</strong> <strong>Lakeland</strong> expects industrial<br />
market conditions to continue to waiver below recent<br />
expectations. However, despite the current<br />
fluctuation, the long-term future outlook for<br />
<strong>Lakeland</strong>’s market remains strong as the area<br />
continues to develop into the state’s leading area for<br />
industrial and distribution developments.<br />
C-10 Fiscal Year <strong>2010</strong> Annual Budget
Environmental Scan<br />
Emerging and Legislative Issues<br />
The <strong>City</strong>’s legislative concerns, especially in the longterm,<br />
fall into two basic categories. First, is the issue<br />
<strong>of</strong> “home rule”, where the authority <strong>of</strong> the <strong>City</strong>’s elected<br />
<strong>of</strong>ficials is being usurped by other, higher levels <strong>of</strong><br />
government. The ability <strong>of</strong> the <strong>City</strong> to collectively<br />
bargain, govern and regulate such issues as zoning<br />
and land usage is under constant threat. Second,<br />
unfunded mandates are a significant financial threat to<br />
the <strong>City</strong>. These mandates may appear in the form <strong>of</strong><br />
requiring additional services or additional benefits to<br />
employees, without a corresponding funding source.<br />
Also, negative impacts occur when legislation and<br />
regulatory requirements are changed that reduce the<br />
<strong>City</strong>’s revenue sources with no provision for<br />
replacement funding.<br />
Customer Expectations<br />
The most important element <strong>of</strong> the strategic planning<br />
process, which precedes the Business Plan, is<br />
identifying and understanding customer requirements.<br />
We use several sources <strong>of</strong> data, including:<br />
Comprehensive Citizen Surveys - Beginning in<br />
2001, surveys have been used to measure satisfaction<br />
and solicit opinions on a variety <strong>of</strong> service and policy<br />
issues.<br />
Stakeholder Group Meetings - An intensive<br />
workshop for community stakeholders aimed at<br />
determining the critical long-term issues facing the<br />
<strong>City</strong>. In addition to facilitated meetings designed to<br />
solicit input from stakeholders and experts on narrow<br />
topics selected for their strategic value.<br />
Neighborhood Meetings - Meetings held throughout<br />
the <strong>City</strong> in an open forum.<br />
C-11 Fiscal Year <strong>2010</strong> Annual Budget
Financial Health and Strategy<br />
The <strong>City</strong> <strong>of</strong> <strong>Lakeland</strong> provides a wide variety <strong>of</strong> services to the citizens <strong>of</strong> <strong>Lakeland</strong>. In many cases, the<br />
nature <strong>of</strong> these services accommodate recovery <strong>of</strong> the operating and capital costs associated with those<br />
services in the form <strong>of</strong> a user charge levied against the users based on actual consumption. Examples <strong>of</strong><br />
these are electric, water, wastewater and solid waste management services, stormwater management, a<br />
parking system and a public golf course. These are referred to as “enterprise” services. Other services, such<br />
as provision <strong>of</strong> public safety, transportation systems and leisure activities do not lend themselves to recovery<br />
<strong>of</strong> the underlying costs directly from the users <strong>of</strong> those services. Accordingly, the day to day operating costs<br />
associated with these services are generally financed from generic revenue sources such as property and<br />
sales taxes. These are referred to as “general governmental” services.<br />
The <strong>City</strong> has a long-held strategy <strong>of</strong> establishing user fees for enterprise services that will attempt to recover<br />
the underlying costs directly from users whenever practical to do so. To the extent these services can be<br />
performed by the <strong>City</strong> at costs that are competitive with rates and charges for the same services <strong>of</strong>fered by<br />
other local governments in the state or by the private sector, the <strong>City</strong> has adopted the practice <strong>of</strong> marking up<br />
the prices levied for those services to accommodate a payment in lieu <strong>of</strong> taxes or a dividend from those<br />
enterprise operations to the General Fund. These “transfers” help to finance a portion <strong>of</strong> the operating costs<br />
<strong>of</strong> those general governmental services that are financed from property and sales taxes. The percentage <strong>of</strong><br />
the gross revenues earned by these utility operations that is transferred to the General Fund for FY<strong>2010</strong> is<br />
budgeted as follows:<br />
Electric 6.9%<br />
Water 16.4%<br />
Wastewater 9.3%<br />
Solid Waste 9.4%<br />
In the aggregate, this represents approximately 35 percent <strong>of</strong> the total General Fund budget for FY<strong>2010</strong>.<br />
This represents a decrease from an aggregate 40 percent for the 1999 fiscal year and 45 percent in fiscal<br />
year 1989.<br />
As with any enterprise, a major concern is cost control. The <strong>City</strong> <strong>of</strong> <strong>Lakeland</strong> is committed to providing quality<br />
services at a reasonable cost. One <strong>of</strong> the best measures <strong>of</strong> whether or not that goal is being attained is a<br />
comparison <strong>of</strong> fees charged by <strong>Lakeland</strong>, in the form <strong>of</strong> utility rates AND tax rates, compared to other<br />
municipalities. The following represents a comparison <strong>of</strong> the total amount paid in FY2009 by a typical<br />
residential homeowner to their local governments, based on a typical “basket <strong>of</strong> services” <strong>of</strong>fered by those<br />
municipalities.<br />
Annual Cost<br />
6,000<br />
5,500<br />
5,000<br />
4,500<br />
4,000<br />
3,500<br />
3,000<br />
2,500<br />
2,000<br />
1,500<br />
1,000<br />
500<br />
-<br />
Comparative Annual Cost <strong>of</strong> Services<br />
Sales Tax<br />
Municipal Property Taxes<br />
Utilities<br />
C-12 Fiscal Year <strong>2010</strong> Annual Budget
Financial Health and Strategy<br />
In each case, the category <strong>of</strong> “Utilities” represents the cost <strong>of</strong> electric, water, wastewater and solid waste<br />
service, based on consumption volumes typical for the average residential customer <strong>of</strong> <strong>Lakeland</strong>. In cases<br />
where the electric utility in a compared municipality is NOT owned by the local government, the rates charged<br />
by the private company that serves that municipality are used.<br />
In the aggregate, <strong>Lakeland</strong> compares favorably to the other cities in this survey. At a property tax millage rate<br />
<strong>of</strong> 3.6538 mills (based on the FY<strong>2010</strong> property tax levy) and an average residential taxable value <strong>of</strong><br />
approximately $83,000, <strong>Lakeland</strong>’s property tax burden is amongst the lowest in the state <strong>of</strong> Florida. In<br />
addition, <strong>Lakeland</strong>’s relative cost <strong>of</strong> electric power has us positioned as one <strong>of</strong> the cheapest utilities in the state<br />
given the significant decrease in the cost <strong>of</strong> natural gas. For the municipalities in this sample, the combined<br />
annual cost <strong>of</strong> services in <strong>Lakeland</strong> is 15% lower than the average for the group.<br />
The capital cost <strong>of</strong> providing general governmental services are generally financed from a combination <strong>of</strong><br />
impact fees, grants, gasoline taxes and the proceeds from the lease <strong>of</strong> a <strong>City</strong>-owned hospital to a private, notfor-pr<strong>of</strong>it<br />
corporation. The latter revenue source has grown an average <strong>of</strong> 7.5% per anum <strong>of</strong> the past 15 years<br />
– approximately double the growth rate <strong>of</strong> the other revenue sources. It represents approximately 50 percent <strong>of</strong><br />
the total funds available to finance the capital cost <strong>of</strong> general governmental services.<br />
Starting in FY2000, the <strong>City</strong> began transferring a portion <strong>of</strong> the lease revenues to the General Fund to help<br />
finance the ongoing operating costs associated with construction <strong>of</strong> new fire stations and funding for police<br />
<strong>of</strong>ficers under expiring Federal Grants. The ten year capital improvement program for fiscal years <strong>2010</strong> thru<br />
2019 shows that over 50% <strong>of</strong> that revenue source will be diverted to financing operating costs.<br />
The following chart demonstrates growth in general governmental operating expenses in the <strong>City</strong> <strong>of</strong> <strong>Lakeland</strong><br />
(total spending within the General Fund) since 1991, compared to an “index” based on historical increases in<br />
property values from new construction and the percentage growth in state-wide per capita income:<br />
General Fund Expenditures - Compared to increase<br />
new construction/growth in per capita income<br />
Annual Spending<br />
115,000,000<br />
110,000,000<br />
105,000,000<br />
100,000,000<br />
95,000,000<br />
90,000,000<br />
85,000,000<br />
80,000,000<br />
75,000,000<br />
70,000,000<br />
65,000,000<br />
60,000,000<br />
55,000,000<br />
50,000,000<br />
45,000,000<br />
40,000,000<br />
35,000,000<br />
30,000,000<br />
Annual Spending Index<br />
Annual Spending-Actual<br />
C-13 Fiscal Year <strong>2010</strong> Annual Budget
Financial Health and Strategy<br />
This chart demonstrates that overall, the growth in the rate <strong>of</strong> spending within <strong>Lakeland</strong>’s General Fund has<br />
generally tracked below the index for the past ten years. This suggests that <strong>Lakeland</strong> has done a reasonable<br />
job in managing increases in spending rates, assuming the index adopted by the state legislature is a realistic<br />
benchmark <strong>of</strong> “acceptable” rates <strong>of</strong> spending growth.<br />
However, the primary revenue sources available to <strong>Lakeland</strong> to finance this growth in spending have<br />
(generally) not kept pace with this index:<br />
55,000,000<br />
50,000,000<br />
45,000,000<br />
Combined Utility Transfers - Compared to<br />
increase new construction/growth in per capita<br />
income<br />
Annual Revenues<br />
40,000,000<br />
35,000,000<br />
30,000,000<br />
25,000,000<br />
20,000,000<br />
15,000,000<br />
1991<br />
1992<br />
1993<br />
1994<br />
1995<br />
1996<br />
1997<br />
1998<br />
1999<br />
2000<br />
2001<br />
2002<br />
2003<br />
2004<br />
2005<br />
2006<br />
2007<br />
2008<br />
2009<br />
<strong>2010</strong><br />
Annual Transfer Growth Index<br />
Annual Transfer - Actual<br />
This source <strong>of</strong> revenue has not kept pace with the growth index. The temporary decreases in fiscal years<br />
2005 thru 2008 were the result <strong>of</strong> decreases in the annual transfer from the <strong>City</strong>-owned electric utility system<br />
to the General Fund, in response to significant reductions in net revenues <strong>of</strong> the electric system available to<br />
accommodate those transfers during that period <strong>of</strong> time. Overall, the inability <strong>of</strong> these utility-based<br />
enterprise operations to generate pr<strong>of</strong>its necessary to keep pace with spending growth is due primarily to<br />
the need to keep the utility rates assessed within those operations reasonable in relation to the rates and<br />
charges levied for the same services within comparable city’s in the state.<br />
Non-ad valorem taxes - Compared to increase<br />
new construction/growth in per capita income<br />
28,000,000<br />
Annual Revenue<br />
23,000,000<br />
18,000,000<br />
13,000,000<br />
8,000,000<br />
1991<br />
1992<br />
1993<br />
1994<br />
1995<br />
1996<br />
1997<br />
1998<br />
1999<br />
2000<br />
2001<br />
2002<br />
2003<br />
2004<br />
2005<br />
2006<br />
2007<br />
2008<br />
2009<br />
<strong>2010</strong><br />
Annual Growth Index Non advalorem tax growth-Actual<br />
C-14 Fiscal Year <strong>2010</strong> Annual Budget
Financial Health and Strategy<br />
These revenues, which consist <strong>of</strong> taxes on electric and water utilities, taxes on communications services and a<br />
portion <strong>of</strong> a one-half sales tax levied by Polk County, have not kept pace with the growth in the index –<br />
primarily since FY2003. The period from 2001 thru 2003 was marked by significant increases in tax revenues<br />
from telecommunication services sold within <strong>Lakeland</strong>, mostly the result <strong>of</strong> changes in the taxing methodology<br />
adopted state-wide during that period <strong>of</strong> time. Since that time, sales <strong>of</strong> those services have been relatively flat.<br />
Revenues from half cent sales taxes increased an average <strong>of</strong> 7 percent annually during the five year period<br />
2002 thru 2006, however revenues have decreased state-wide since then, due to some extent by the much<br />
slower pace <strong>of</strong> new building construction.<br />
Property Taxes - Compared to increase new<br />
construction/growth in per capita income<br />
19,000,000<br />
17,000,000<br />
Annual Revenues<br />
15,000,000<br />
13,000,000<br />
11,000,000<br />
3.545 mills<br />
9,000,000<br />
7,000,000<br />
2.995 mills<br />
5,000,000<br />
1991<br />
1992<br />
1993<br />
1994<br />
1995<br />
1996<br />
1997<br />
1998<br />
1999<br />
2000<br />
2001<br />
2002<br />
2003<br />
2004<br />
2005<br />
2006<br />
2007<br />
2008<br />
2009<br />
<strong>2010</strong><br />
Property Tax Growth Index<br />
Property Taxes - Actual<br />
Property taxes are the only significant source <strong>of</strong> revenue available to finance the cost <strong>of</strong> general governmental<br />
services that has kept pace with the growth index adopted by the State <strong>of</strong> Florida. In recent years, this<br />
revenue source has exceeded the index – primarily because <strong>of</strong> a .55 mill increase in the tax rate adopted in<br />
FY2004 to finance significant increases in the cost <strong>of</strong> public safety that occurred during that year. Fiscal years<br />
2006 and 2007 saw further increases in that revenue source, resulting from double-digit percentage growth in<br />
property appreciation during those years. <strong>Lakeland</strong> experienced property appreciation <strong>of</strong> approximately 9.5<br />
percent for FY2008, however the impact <strong>of</strong> mandated tax roll-back rates negated that increase. For FY 2009<br />
there was zero net growth in this revenue source, and a 7.4 percent decline for FY <strong>2010</strong>.<br />
Strategically, the <strong>City</strong> <strong>of</strong> <strong>Lakeland</strong> is at a cross-road with respect to determining the best approach toward<br />
financing the operating costs <strong>of</strong> local government. <strong>Lakeland</strong> is relatively unique in that it owns pr<strong>of</strong>itable utility<br />
operations (electric, water, wastewater, solid waste) which have been able to provide dividend transfers to the<br />
General Fund. These transfers have historically enabled <strong>Lakeland</strong> to maintain low property tax rates. As<br />
demonstrated, this source <strong>of</strong> revenue is not growing at the pace necessary to sustain the level <strong>of</strong> subsidy<br />
necessary to maintain the lower than average ad valorem tax rate – absent increasing reliance on other<br />
revenue sources. In recent years, the relative slow growth rate from this source <strong>of</strong> revenue has been <strong>of</strong>fset by<br />
slower than indexed rates <strong>of</strong> spending growth, and higher than index rates <strong>of</strong> property tax growth. Given the<br />
impacts <strong>of</strong> property tax reform and the continued shortfall in financing available to pay for capital<br />
improvements, <strong>Lakeland</strong> will need to consider some fundamental changes in its approach.<br />
<strong>Lakeland</strong> has historically balanced its annual budget without reliance on formal, written policies that determine<br />
the dollar value <strong>of</strong> transfers to the General Fund from utility operations. Instead, <strong>Lakeland</strong> has simply<br />
performed an annual “balancing” <strong>of</strong> the need for revenues within the General Fund versus the financial ability<br />
<strong>of</strong> these operations to make larger annual transfers while still maintaining competitive rates. <strong>Lakeland</strong> will<br />
most likely need to address the adoption <strong>of</strong> more formal policies regarding the dollar value <strong>of</strong> these transfers –<br />
not necessarily for the purpose <strong>of</strong> increasing the level <strong>of</strong> reliance on those sources <strong>of</strong> funds – but to better<br />
identify the extent to which changes in property tax rates will be needed to finance the continued cost <strong>of</strong><br />
government at it’s current levels <strong>of</strong> service.<br />
C-15 Fiscal Year <strong>2010</strong> Annual Budget
Financial Health and Strategy<br />
Cash Reserves<br />
The following chart shows the historical dollar value <strong>of</strong> cash reserves held by the <strong>City</strong> at the end <strong>of</strong> each fiscal<br />
year since 2000. This represents the amount <strong>of</strong> working capital on hand within the General Fund (which<br />
finances general governmental operating costs) and the combined working capital balances in the Public<br />
Improvement, Transportation, Stormwater and Community Redevelopment Funds (which finance general<br />
governmental capital costs) at the start <strong>of</strong> each fiscal year.<br />
Working Capital - General Governmental Activities<br />
Operating<br />
Capital<br />
12,000,000<br />
10,000,000<br />
8,000,000<br />
6,000,000<br />
4,000,000<br />
2,000,000<br />
Sep-00<br />
Sep-01<br />
Sep-02<br />
Sep-03<br />
Sep-04<br />
Sep-05<br />
Sep-06<br />
Sep-07<br />
Sep-08<br />
Sep-09<br />
-<br />
The total value <strong>of</strong> working capital within the General Fund at the start <strong>of</strong> FY<strong>2010</strong> represents just under 10<br />
percent <strong>of</strong> the FY<strong>2010</strong> budgeted expenditures for these activities. By comparison the total value <strong>of</strong> working<br />
capital on hand at the start <strong>of</strong> FY 2000 represented approximately 6.3 percent <strong>of</strong> budgeted expenditures. The<br />
<strong>City</strong>’s target for operating working capital is 7.5%. This percentage is expected to fall to the 6 percent level<br />
over the course <strong>of</strong> the next two or three years as a result <strong>of</strong> the general flattening <strong>of</strong> revenue collections<br />
attributable to the slow economy.<br />
C-16 Fiscal Year <strong>2010</strong> Annual Budget
Financial Health and Strategy<br />
The following chart shows similar information for the enterprise funds maintained by the <strong>City</strong> <strong>of</strong> <strong>Lakeland</strong>:<br />
Working Capital - Enterprise Funds<br />
50,000,000<br />
<strong>Lakeland</strong> Electric<br />
All Other Enterprise Funds<br />
45,000,000<br />
40,000,000<br />
35,000,000<br />
30,000,000<br />
25,000,000<br />
20,000,000<br />
15,000,000<br />
10,000,000<br />
5,000,000<br />
-<br />
Sep-00<br />
Sep-01<br />
Sep-02<br />
Sep-03<br />
Sep-04<br />
Sep-05<br />
Sep-06<br />
Sep-07<br />
Sep-08<br />
Sep-09<br />
The dollar values shown above for <strong>Lakeland</strong> Electric represent unrestricted working capital. Of the<br />
approximately $45 million in net working capital on hand at the end <strong>of</strong> 2009, approximately $28 million is in<br />
cash.<br />
These numbers exclude approximately $15 million set aside in an unrestricted account to pay down debt<br />
obligations in FY<strong>2010</strong> thru 2012 and also exclude approximately $28 million in working capital set aside to<br />
fund capital projects.<br />
The dollar amount shown for the other enterprise funds represents total net working capital <strong>of</strong> those<br />
operations, combined.<br />
C-17 Fiscal Year <strong>2010</strong> Annual Budget
Revenue Sources<br />
The <strong>City</strong> <strong>of</strong> <strong>Lakeland</strong> relies on a variety <strong>of</strong> revenue sources in order to finance the cost <strong>of</strong> services provided<br />
to its citizens. Some <strong>of</strong> these revenues can be directly associated with the cost <strong>of</strong> specific services.<br />
Examples include the user fees charged for electricity, water, wastewater and solid waste collection<br />
services, use <strong>of</strong> parking facilities, and certain fees for recreational facilities including the <strong>City</strong>-owned golf<br />
course. The amount charged increases or decreases based on the volume <strong>of</strong> services provided (i.e. electric<br />
revenues are based on an amount per kWh). For these services, the intent is that 100 percent <strong>of</strong> the cost <strong>of</strong><br />
providing that service is recovered thru the imposition <strong>of</strong> this user fee.<br />
Other governmental revenues sources can not be related directly to underlying services, primarily because<br />
the services do not lend themselves to cost recovery using a direct user charge. Examples are police and<br />
fire services, maintenance <strong>of</strong> roadways and parks, libraries, etc. These public services are financed through<br />
a variety <strong>of</strong> “generic” revenue sources including property, sales and utilities taxes, and state and local<br />
grants. The <strong>City</strong> <strong>of</strong> <strong>Lakeland</strong> also relies on the pr<strong>of</strong>its earned by the Electric, Water, Wastewater and Solid<br />
Waste utility operations as a source <strong>of</strong> revenue to finance these same general governmental functions.<br />
Property Tax Revenues as a percent <strong>of</strong> General Fund Revenue<br />
23.00%<br />
22.00%<br />
21.00%<br />
20.00%<br />
19.00%<br />
Percent<br />
t 18.00%<br />
n<br />
e<br />
rc<br />
e<br />
P17.00%<br />
16.00%<br />
15.00%<br />
14.00%<br />
13.00%<br />
12.00%<br />
1997 1998 1999 2000 2001 2002 2003 2004 2005 2006 2007 2008 2009 <strong>2010</strong><br />
Year<br />
Because <strong>of</strong> the relatively large annual percent increases in taxable values, the significance <strong>of</strong> this revenue<br />
source as a percentage <strong>of</strong> the General Fund budget had been growing. The impact <strong>of</strong> property tax reform<br />
starting in FY 2008 and the subsequent reduction in property values has reversed that trend somewhat.<br />
Values <strong>of</strong> existing property fell by 10 percent from fiscal 2009 to <strong>2010</strong>. The <strong>City</strong> Commission increased the<br />
millage rate to <strong>of</strong>fset a portion <strong>of</strong> that decrease - increasing the rate from 3.4031 to 3.6538 mills, an increase<br />
<strong>of</strong> 7.4 percent.<br />
C-18 Fiscal Year <strong>2010</strong> Annual Budget
Revenue Sources<br />
Public Service Taxes, Franchise Fees and Communications Services Tax<br />
The <strong>City</strong> levies:<br />
A 10 percent Public Services Tax on the sale <strong>of</strong> electricity, water and natural gas (metered or bottled) within<br />
the <strong>City</strong> limits.<br />
A tax on fossil fuel oil in the amount <strong>of</strong> 4 cents per gallon.<br />
A Communications Services Tax on telephone service, (including local, long distance and mobile services),<br />
and on cable TV service. The <strong>City</strong>’s share <strong>of</strong> this tax is 6.43 percent. This rate was subsequently increased<br />
to 7.03 percent by the state <strong>of</strong> Florida representing the additional discretionary surtax <strong>of</strong> .60 percent that is<br />
remitted to the county school board.<br />
The <strong>City</strong> has extended a franchise agreement to Peoples Gas System (a division <strong>of</strong> Tampa Electric<br />
Company) to distribute metered gas within the <strong>City</strong> limits. The franchise agreement calls for a payment to<br />
the <strong>City</strong> equal to 6 percent <strong>of</strong> monthly gross revenues.<br />
Half Cent Sales Tax Revenues<br />
County and Municipal governments in Florida are entitled to a distribution equal to 9.653 percent <strong>of</strong> total sales<br />
tax proceeds attributable to sales within each county. Those revenues are shared between the County<br />
government and each <strong>of</strong> the Municipal governments within the County. Effective July 1, 2004, this revenue<br />
source decreased by approximately 8.7 percent, based on the State <strong>of</strong> Florida’s change in funding procedures<br />
related to the state-run court system. This decrease was intended to be <strong>of</strong>fset by increases in the amount <strong>of</strong><br />
State Revenue Sharing funds disbursed to cities and counties.<br />
State Revenue Sharing Revenues<br />
The State <strong>of</strong> Florida distributes revenues to each county and municipal government based on a Revenue Sharing<br />
act adopted in 1972. At one time, this distribution was based on the dollar value <strong>of</strong> cigarette taxes collected<br />
within each county, however the methodology was changed in FY2000 to remove the cigarette taxes as the basis<br />
for the distribution and now the basis for this distribution consists <strong>of</strong> a stated percentage <strong>of</strong> the general state-wide<br />
sales, use and other taxes. This calculation is performed by the State Department <strong>of</strong> Revenue, based on<br />
population data provided by each county. This revenue source has been relatively flat over the past ten years.<br />
The portion <strong>of</strong> the general state-wide sales and use tax dedicated to the Revenue Sharing fund increased from<br />
1.0715 percent to 1.3409 percent in July 2004.<br />
Business Tax Revenues<br />
The <strong>City</strong> issues receipts (licenses) to all commercial business enterprises located within the <strong>City</strong> limits. A fee is<br />
assessed to each user, based on a predefined fee schedule that considers the type <strong>of</strong> business conducted and<br />
the volume <strong>of</strong> business conducted. By state law, the rates charged per the adopted fee schedule may be<br />
increased every other year, in an amount that does not exceed 5 percent per receipt.<br />
The last change to the rate structure was a 5 percent increase adopted by the <strong>City</strong> in 2005.<br />
Building Permit and Inspection Fees<br />
Permit fees are issued for construction/renovation occurring within the <strong>City</strong> limits. Separate permit fees are<br />
levied for landscaping, building, plumbing, electrical and other mechanical improvements. This fee is intended to<br />
cover the cost <strong>of</strong> inspections performed by building inspectors employed by the <strong>City</strong>. This fee structure was<br />
increased by 10 percent for FY<strong>2010</strong>.<br />
C-19 Fiscal Year <strong>2010</strong> Annual Budget
Revenue Sources<br />
Federal, State and Local Grant Revenues<br />
The <strong>City</strong> applies for grants from various federal, state and local agencies to help finance specific operating<br />
costs. In recent history, the majority <strong>of</strong> these grants have been to hire additional police <strong>of</strong>ficers. These grant<br />
programs typically reimburse the <strong>City</strong> for a stated percentage <strong>of</strong> specific program costs. This revenue source<br />
has been declining rapidly as the federal government scales back it’s funding for law enforcement.<br />
Charges for Service Revenues<br />
Charges for Services represent user fees assessed directly against the users <strong>of</strong> municipal services. The most<br />
significant <strong>of</strong> these are parks and recreation fees, which generated approximately $1.6 million last year against<br />
total operating expenses <strong>of</strong> $13.3 million (excluding capital). These revenues consist <strong>of</strong> facility rental fees,<br />
recreational class/program fees, tennis and swimming fees and parking and expense recovery fees related to<br />
the Detroit Tigers major and minor league activities at Marchant Stadium. This category <strong>of</strong> revenues also<br />
includes a variety <strong>of</strong> other fees, as follows:<br />
<br />
<br />
<br />
<br />
<br />
<br />
<br />
<br />
<br />
Lot clearing and cleaning<br />
Building demolition<br />
Sale <strong>of</strong> fire inspection permits<br />
False alarm fees<br />
Reimbursement for overtime services provided by the <strong>Lakeland</strong> Police Department, established in<br />
conjunction with the collective bargaining agreement with the police union<br />
Wrecker service permitting fees<br />
Public records copying<br />
Zoning fees<br />
Cemetery fees<br />
C-20 Fiscal Year <strong>2010</strong> Annual Budget
Revenue Sources<br />
Fines and Forfeits Revenues<br />
This category consists primarily <strong>of</strong> the proceeds from fines issued for motor vehicle traffic infractions. Also<br />
included in this category:<br />
<br />
<br />
<br />
Revenues that pass-thru the <strong>City</strong> and are paid to police <strong>of</strong>ficers who have achieved certain levels <strong>of</strong><br />
higher education as supplemental compensation.<br />
Proceeds from confiscated cash and property seized by law enforcement agencies.<br />
Collection <strong>of</strong> fines levied by the <strong>City</strong>’s Code Enforcement Board.<br />
Miscellaneous Revenues<br />
The majority <strong>of</strong> the revenue included in this category represents investment income earned on working capital<br />
held by the General Fund and the various restricted sub-funds maintained within the General Fund:<br />
<br />
<br />
<br />
<br />
Hollis Gardens Maintenance Trust Fund<br />
Law Enforcement Trust Fund (confiscated property)<br />
Recreation Facilities<br />
Cultural Activities Reserve<br />
This category also includes:<br />
Proceeds from the sale <strong>of</strong> cemetery lots<br />
Contributions and donations from private entities<br />
Cost reimbursements collected from other <strong>City</strong> funds/departments for the use <strong>of</strong> radio equipment<br />
maintained by the Radio Shop<br />
Gasoline Tax (1 Cent Municipal Fuel Tax) Revenues<br />
The amount <strong>of</strong> this tax is equal to 1 cent per gallon <strong>of</strong> gasoline sold within the municipal limits, less an<br />
administrative fee (retained by the state) not exceeding 2 percent <strong>of</strong> the gross proceeds <strong>of</strong> the tax.<br />
The proceeds <strong>of</strong> this tax shall be used for the purchase <strong>of</strong> transportation facilities, roads and street rights-<strong>of</strong>-way;<br />
construction, reconstruction and maintenance <strong>of</strong> roads, streets, bicycle paths and pedestrian pathways;<br />
adjustment <strong>of</strong> <strong>City</strong>-owned utilities as required by road and street construction; and construction, reconstruction,<br />
transportation-related public safety activities, maintenance and operation <strong>of</strong> transportation facilities. Municipalities<br />
are authorized to expend the funds received under this section in conjunction with other cities, counties, the state<br />
or federal government in joint projects.<br />
Gasoline Tax (9th Cent Fuel Tax) Revenues<br />
This is an optional tax, levied by the county and shared with municipalities within the county based on an<br />
interlocal agreement. Per that interlocal agreement the distribution formula is weighted 50 percent towards the<br />
ratio <strong>of</strong> each municipality’s population to total county population and 50 percent towards the ratio <strong>of</strong> each<br />
municipality’s lane miles to total county lane miles.<br />
C-21 Fiscal Year <strong>2010</strong> Annual Budget
Revenue Sources<br />
6 Cents Local Option Fuel Tax Revenues<br />
This is an optional tax, levied by the county and shared with municipalities within the county based on an interlocal<br />
agreement. The distribution formula is identical to that used for the 9th cent fuel tax. The eligible uses <strong>of</strong> these<br />
funds are also identical to those <strong>of</strong> the 9th cent fuel tax.<br />
5 Cents Additional Local Option Fuel Tax Revenues<br />
This is an optional tax, levied by the county and shared with municipalities within the county based on an interlocal<br />
agreement. The distribution formula is identical to that used for the 9th cent fuel tax. The proceeds <strong>of</strong> this tax shall<br />
be used for “transportation expenditures” needed to meet the requirements <strong>of</strong> the capital improvements element <strong>of</strong><br />
an adopted comprehensive plan or for expenditures needed to meet immediate local transportation problems and<br />
for other transportation-related expenditures that are critical for building comprehensive roadway networks by local<br />
governments. Expenditures for the construction <strong>of</strong> new roads, the reconstruction or resurfacing <strong>of</strong> existing paved<br />
roads, or the paving <strong>of</strong> existing graded roads shall be deemed to increase capacity and such projects shall be<br />
included in the capital improvements element <strong>of</strong> an adopted comprehensive plan. Expenditures <strong>of</strong> this revenue<br />
source shall not include routine maintenance <strong>of</strong> roads.<br />
C-22 Fiscal Year <strong>2010</strong> Annual Budget
Debt Management Overview<br />
The <strong>City</strong> <strong>of</strong> <strong>Lakeland</strong> (the “<strong>City</strong>”) incurs long-term<br />
debt – either in the form <strong>of</strong> bonds issued directly in<br />
the name <strong>of</strong> the <strong>City</strong> or other loans obtained from<br />
pooled debt programs managed by third parties – for<br />
the purpose <strong>of</strong> funding capital improvements to <strong>City</strong><br />
facilities and infrastructure. The <strong>City</strong> also funds a<br />
significant amount <strong>of</strong> capital improvements through<br />
“pay-as-you-go” cash financing. Pay-as-you-go<br />
financing comes from cash outlays <strong>of</strong> various<br />
revenues including state and federal grants, impact<br />
fees, certain lease payments and other operating<br />
revenues. As <strong>of</strong> September 30, 2008, the <strong>City</strong> had<br />
outstanding long-term debt <strong>of</strong> $733.3 million.<br />
Purpose <strong>of</strong> Debt<br />
Debt issued by the <strong>City</strong> was incurred to fund capital<br />
improvements to three major categories <strong>of</strong> assets:<br />
the electric system, the water and wastewater system<br />
and all other projects. Three-quarters <strong>of</strong> the <strong>City</strong>’s<br />
outstanding debt funded electric system<br />
improvements. Water and wastewater projects make<br />
up another 15 percent, while all other uses account<br />
for the remaining 10 percent <strong>of</strong> outstanding debt.<br />
Water & Wastewater<br />
System, $109.5M<br />
15%<br />
<strong>City</strong> <strong>of</strong> <strong>Lakeland</strong><br />
Outstanding Debt by Use<br />
FY2008<br />
All Other Uses, $75.3M<br />
10%<br />
and/or expansion <strong>of</strong> the <strong>Lakeland</strong> Linder Regional<br />
Airport, the <strong>Lakeland</strong> Center, the Cleveland Heights<br />
Golf Course, public safety facilities and parks and<br />
recreation facilities.<br />
As shown, the bulk <strong>of</strong> debt incurred by the <strong>City</strong> is for<br />
the provision <strong>of</strong> basic utilities, i.e., electricity, water<br />
and wastewater. The <strong>City</strong> operates a municipally<br />
owned electric system, including power generation,<br />
as well as transmission and distribution. In many<br />
communities, these services are provided through<br />
investor-owned (private) utility companies. In those<br />
communities, the debt (or equity) used to finance<br />
electric utilities would appear in the financial<br />
statements <strong>of</strong> the private corporations, not the <strong>City</strong> or<br />
town. Because the <strong>City</strong> <strong>of</strong> <strong>Lakeland</strong> owns and<br />
operates the electric utility, it incurs a much larger<br />
amount <strong>of</strong> debt than most other cities <strong>of</strong> comparable<br />
size.<br />
Debt Trends<br />
Overall Debt: Over the last decade the <strong>City</strong>’s<br />
outstanding debt has increased by about 25 percent<br />
($149 million). The increase is largely the result <strong>of</strong><br />
the issuance <strong>of</strong> a significant amount <strong>of</strong> debt ($120<br />
million) in FY2001, which was used to fund the<br />
conversion <strong>of</strong> one <strong>of</strong> the Electric Department’s major<br />
generating assets and $60 million <strong>of</strong> issuance in<br />
FY2008, which was used to fund environmental<br />
remediation improvements to the <strong>City</strong>’s coal-fired<br />
electric generation plant.<br />
Electric System, $548.4M<br />
75%<br />
Electric system improvements include: construction<br />
and conversion <strong>of</strong> generating assets; environmental<br />
projects; renewal, replacement and expansion <strong>of</strong> the<br />
transmission and distribution network; and numerous<br />
other projects. Water and wastewater improvements<br />
include construction and improvements to water and<br />
wastewater treatment systems and replacement and<br />
expansion <strong>of</strong> distribution and collection networks. All<br />
other projects encompass a variety <strong>of</strong> governmental<br />
and development projects, including improvements to<br />
C-23 Fiscal Year <strong>2010</strong> Annual Budget
Debt Management Overview<br />
During FY2009, overall debt is expected to decline<br />
by about $32 million, due to scheduled principal<br />
repayments. Outstanding debt should decline by<br />
an additional $12 million in FY<strong>2010</strong>.<br />
Other Measures <strong>of</strong> Debt: Over the last decade, the<br />
<strong>Lakeland</strong> area has experienced substantial<br />
development and population growth. Although the<br />
dollar volume <strong>of</strong> debt outstanding is important,<br />
other normative measures, such as debt per capita<br />
(per person) and debt as a percentage <strong>of</strong> personal<br />
income, provide a more accurate gauge <strong>of</strong> an<br />
area’s debt burden. Debt per capita measures<br />
debt against the size and growth <strong>of</strong> the population<br />
served, by projects being financed. While debt as<br />
a percentage <strong>of</strong> personal income measures<br />
outstanding debt against an area’s ability to pay for<br />
projects. As shown below, <strong>Lakeland</strong>’s debt per<br />
capita has remained relatively flat over the last ten<br />
years, reaching $7,842 per person in 2008. Debt<br />
as a percentage <strong>of</strong> the area’s annual personal<br />
income has declined, dropping to 23.5 percent as<br />
<strong>of</strong> 2007 (the last year for which data is available).<br />
As noted, most <strong>of</strong> the <strong>City</strong>’s debt has been incurred<br />
to finance electric system improvements. In other<br />
communities, these type <strong>of</strong> projects are financed<br />
through investor-owned utility companies. As<br />
such, any debt incurred to finance projects would<br />
not appear on that <strong>City</strong>’s books. If <strong>Lakeland</strong>’s<br />
electric system debt is excluded from the<br />
calculations, debt per capita would drop to $1,977<br />
and debt as a percentage <strong>of</strong> personal income<br />
would be about 6.3 percent.<br />
45%<br />
40%<br />
<strong>City</strong> <strong>of</strong> <strong>Lakeland</strong><br />
Debt Trends<br />
Types <strong>of</strong> Debt<br />
The <strong>City</strong>’s long-term debt consists primarily <strong>of</strong><br />
bonds ($682.5 million – 93 percent) along with<br />
certain loans ($50.8 million – 7 percent). Bonds<br />
are formal borrowings issued through Wall Street<br />
to investors under trust indentures that specify the<br />
security for and source <strong>of</strong> repayment for the debt.<br />
The <strong>City</strong> has several different types <strong>of</strong> bond debt,<br />
which are detailed below. The <strong>City</strong>’s loans consist<br />
almost exclusively <strong>of</strong> monies borrowed through<br />
various State programs.<br />
Bonds: The <strong>City</strong> <strong>of</strong> <strong>Lakeland</strong> has four distinct<br />
revenue bond programs which are summarized in<br />
the table on page C-25. Revenue debt consists <strong>of</strong><br />
a promise to repay bonds from a specified revenue<br />
stream. In contrast, general obligation debt entails<br />
a promise <strong>of</strong> the “full faith and credit” <strong>of</strong> a<br />
governmental entity and a requirement to repay<br />
any such debt from all available revenues,<br />
including the use <strong>of</strong> the entity’s taxing power. In<br />
Florida, local general obligation debt requires voter<br />
approval through a referendum. Florida Statute<br />
does not provide any limits on the amount <strong>of</strong> debt a<br />
city may issue. The <strong>City</strong>’s Charter does provide for<br />
a limit on the issuance <strong>of</strong> general obligation debt<br />
equal to 17 percent <strong>of</strong> the assessed value <strong>of</strong> the<br />
taxable real estate in the <strong>City</strong>. For FY2008, that<br />
limit would be approximately $1.028 billion.<br />
However, the <strong>City</strong> has not had any general<br />
obligation debt outstanding since 1971. As shown,<br />
the overwhelming portion <strong>of</strong> the <strong>City</strong>’s bonds<br />
($626.1 million - 92 percent) are utility system<br />
revenue bonds. They are user based debt: the<br />
bonds are issued for utility system improvements<br />
and repaid from the fees<br />
charged to the users <strong>of</strong> those<br />
utilities.<br />
$7,842<br />
$8,500<br />
$8,000<br />
Personal Income<br />
35%<br />
30%<br />
25%<br />
20%<br />
23.5%<br />
1998 1999 2000 2001 2002 2003 2004 2005 2006 2007 2008<br />
$7,500<br />
$7,000<br />
$6,500<br />
$6,000<br />
Per Capita<br />
Fiscal Year<br />
C-24 Fiscal Year <strong>2010</strong> Annual Budget
Debt Management Overview<br />
<strong>City</strong> <strong>of</strong> <strong>Lakeland</strong><br />
Revenue Bond Programs<br />
9/30/2008<br />
Amount<br />
Source <strong>of</strong> Repayment Outstanding<br />
Type<br />
Outstanding<br />
Through<br />
Interest Rate<br />
Energy System<br />
Water and Wastewater<br />
System<br />
Dedicated Tax<br />
Capital Improvement<br />
Rates, fees, charges and other<br />
operating revenues <strong>of</strong> the<br />
electric system – primarily<br />
payments from electricity<br />
customers<br />
Rates, fees, charges (including<br />
impact fees) and other<br />
operating revenues <strong>of</strong> the<br />
electric system – primarily<br />
payments from water and<br />
wastewater users<br />
Specified taxes, including: (a)<br />
taxes imposed by the <strong>City</strong> on<br />
utility services (electricity,<br />
water, gas and local<br />
communications); and (b)<br />
certain tourism taxes collected<br />
by Polk County on behalf <strong>of</strong> the<br />
<strong>City</strong><br />
Non-ad valorem revenues from<br />
any source legally available<br />
(not including ad valorem taxes<br />
on real and personal property),<br />
subject to availability and<br />
appropriation<br />
* includes $200.0 million <strong>of</strong> variable rate debt<br />
$565.9 M 2037 3.05% to 6.55%*<br />
60.2 M 2033 3.50% to 5.00%<br />
28.5 M 2022 3.50% to 4.50%<br />
27.8 M 2017 3.85% to 5.00%<br />
Loans: As noted, the <strong>City</strong>’s debt includes loans,<br />
primarily from the State <strong>of</strong> Florida under two<br />
programs. These include $18.1 million in loans<br />
through the Sunshine State Government Financing<br />
Commission for various <strong>City</strong> projects and $31.8 million<br />
through the State Revolving Loan Program for<br />
wastewater projects. The security for the Sunshine<br />
State loans consists <strong>of</strong> a pledge <strong>of</strong> non-ad valorem<br />
revenues similar to the <strong>City</strong>’s Capital Improvement<br />
Bonds. The State Revolving Loans are repaid from<br />
excess revenues <strong>of</strong> the wastewater system and are<br />
subsidized by the State at below market rates. The<br />
<strong>City</strong> also has a small amount ($0.9 million) <strong>of</strong> other<br />
miscellaneous loans.<br />
Recent Debt Management Activities<br />
During FY2008, the <strong>City</strong> issued an additional $60<br />
million in electric system revenue bonds. The <strong>City</strong><br />
increased its net borrowings for wastewater<br />
improvements under the State’s Revolving Loan<br />
Program by $10.1 million.<br />
C-25 Fiscal Year <strong>2010</strong> Annual Budget
Debt Management Overview<br />
On July 30, 2008, the <strong>City</strong> issued $200 million <strong>of</strong><br />
Energy System Revenue and Refunding bonds on<br />
behalf <strong>of</strong> <strong>Lakeland</strong> Electric. Some $140.0 million <strong>of</strong><br />
the proceeds were used to refund a like amount <strong>of</strong><br />
variable rate auction reset bonds that had been<br />
outstanding. Due to significant problems in the<br />
municipal bond insurance industry, auction reset<br />
bonds, including those issued by the <strong>City</strong>, had<br />
been trading at unacceptably high rates. The<br />
balance <strong>of</strong> the proceeds from the <strong>City</strong>’s new bond<br />
issue were used primarily to fund environmental<br />
control projects at the <strong>City</strong>’s coal-fired electric<br />
generating facility.<br />
Debt Service Requirements<br />
The debt service requirements for all <strong>of</strong> the <strong>City</strong>’s<br />
outstanding long-term debt - including both bonds<br />
and loans is shown on the table below.<br />
A more detailed explanation <strong>of</strong> the <strong>City</strong>’s debt and<br />
debt management activities can be found in the<br />
<strong>City</strong>’s Comprehensive Annual Financial Report and<br />
its Annual Report to Bondholders, both <strong>of</strong> which<br />
are available on the <strong>City</strong>’s website.<br />
<strong>City</strong> <strong>of</strong> <strong>Lakeland</strong><br />
Outstanding Debt Summary<br />
(As <strong>of</strong> 9/30/08)<br />
YEAR PRINCIPAL INTEREST TOTAL<br />
2009 31,685,289 32,949,310 64,634,599<br />
<strong>2010</strong> 37,670,370 33,867,288 71,537,658<br />
2011 34,249,793 32,678,154 66,927,947<br />
2012 35,526,186 31,526,225 67,052,411<br />
2013 36,812,516 30,259,490 67,072,006<br />
2014 - 2018 157,640,982 111,070,004 268,710,986<br />
2019 - 2023 103,638,404 74,196,838 177,835,242<br />
2024 - 2028 99,336,669 54,119,417 153,456,086<br />
2029 - 2033 92,650,000 32,980,155 125,630,155<br />
2034 - 2038 104,070,000 9,921,991 113,991,991<br />
TOTAL 733,280,209 443,568,872 1,176,849,081<br />
C-26 Fiscal Year <strong>2010</strong> Annual Budget
Table <strong>of</strong> Contents<br />
Performance Budget ......................................................................... Section—D<br />
Performance Budget Overview .................................................................................... D-2<br />
Measuring Results ......................................................................................................... D-3<br />
Key Success Indicators (KSI’s).................................................................................... D-4<br />
Service & Operations Strategy ................................................................................... D-13<br />
Process Improvement Teams .................................................................................... D-14<br />
Department Performance Levels ............................................................................... D-16<br />
Core Services by Program.......................................................................................... D-35<br />
D-1 Fiscal Year <strong>2010</strong> Annual Budget
Performance Budget Overview<br />
Introduction<br />
This chapter details how, based on the Strategic<br />
Plan and Business Plan, we will allocate our<br />
resources to prioritized goals and core services.<br />
The Service and Operations Strategy section<br />
provides a complete list <strong>of</strong> the Outcomes<br />
developed at the <strong>City</strong> Commissions Annual Retreat<br />
in January.<br />
The Measuring Results section provides an<br />
overview <strong>of</strong> how the performance measurement<br />
system is being developed to provide results for<br />
the <strong>City</strong> once benchmarking data has been<br />
compiled.<br />
Operational Costs: All costs (other<br />
than personnel) attributed with<br />
completing the Activity.<br />
Debt Service: Acquired debt (if<br />
applicable)<br />
Net Cost: Total Activity Cost<br />
Common Ground Park<br />
The Department Performance Levels section<br />
consists <strong>of</strong> significant accomplishments for each<br />
department in Fiscal Year 2009.<br />
Orange Cup Regatta<br />
Understanding Departmental<br />
Performance Budgets<br />
The Performance budget is separated into the<br />
following components:<br />
Program Description - The statement identifies the<br />
particular purpose for the activities and how they<br />
relate to the <strong>City</strong>’s overall mission.<br />
Performance Measurements - Performance<br />
measurements are being developed for each Core<br />
Service. The performance measurements will<br />
focus on particular accomplishments that will be<br />
attained within the current year. All will be<br />
measurable by the performance indicator’s<br />
supplied and measurement results provided on a<br />
specified time period. Each performance measure<br />
will include explicit links showing how objectives<br />
and their indicators are directly related to the Core<br />
Service, Program and Outcomes they support.<br />
Measurements may be derived operationally, a<br />
specific Key Success Indicator (KSI) or a Florida<br />
Benchmarking Consortium (FBC) measurement.<br />
The FY<strong>2010</strong> Performance Budget will provide <strong>City</strong>wide<br />
KSI’s and a few examples <strong>of</strong> the Core Service<br />
performance measurements being developed.<br />
Future Performance Budget publications will show<br />
the developed measurements, their continued<br />
refinement and measurement results.<br />
Core Services - A listing <strong>of</strong> the fundamental<br />
services that the activity is designed to provide.<br />
FTE’s: Number <strong>of</strong> full-time equivalents<br />
associated with the completion <strong>of</strong> the<br />
Activity.<br />
Personnel Costs: Salary and Benefits<br />
for the associated FTE’s.<br />
Did you know…..<br />
<strong>Lakeland</strong>’s first hospital was built in<br />
1916 as the result <strong>of</strong> a will left by Mrs.<br />
Jane Morrell, who donated property on<br />
S. Missouri Avenue for the specific<br />
purpose <strong>of</strong> building a hospital.<br />
D-2 Fiscal Year <strong>2010</strong> Annual Budget
Measuring Results<br />
Overview<br />
The <strong>City</strong> has developed a performance<br />
measurement and management system to align<br />
department services and programs with the <strong>City</strong><br />
Commission’s Outcomes identified in the FY<strong>2010</strong><br />
Strategic Plan. In time the system will enable<br />
departments to systematically measure results and<br />
make adjustments when results fall short <strong>of</strong><br />
expected performance levels. Two components<br />
make up the system:<br />
Core Service Performance Indicators<br />
Organizational Outcome-Based Key<br />
Success Indicators (KSIs)<br />
These elements play an important part in the <strong>City</strong>’s<br />
overall Business Plan and help keep the<br />
organization on target.<br />
Core Service Performance Reporting<br />
Each <strong>of</strong> the Core Services are strategically aligned<br />
to the <strong>City</strong>’s Vision/Mission/Goals and Outcomes.<br />
Reporting data consisting <strong>of</strong> progress updates,<br />
labor hours and non-labor costs will be used by all<br />
departments to adjust their operations as needed.<br />
KSI Measurements<br />
FY<strong>2010</strong> performance measures (key success<br />
indicators) have been established to measure<br />
results achieved through services and programs<br />
provided by the <strong>City</strong>’s operating and support<br />
departments. Each <strong>of</strong> the measurements support<br />
at least one <strong>of</strong> the Outcomes. Where possible, the<br />
indicator measures a community outcome - the<br />
actual condition <strong>of</strong> the quality <strong>of</strong> life (e.g. the crime<br />
rate). Alternatively, it measures an outcome <strong>of</strong> the<br />
community’s response to an issue (e.g. police<br />
response time) rather than the input <strong>of</strong> the<br />
response itself (e.g. number <strong>of</strong> police <strong>of</strong>ficers).<br />
Indicators provide a vehicle to understand and<br />
address community issues from a holistic and<br />
outcomes-oriented perspective. They are useful,<br />
within the context <strong>of</strong> an overall communityimprovement<br />
process, both as a planning tool,<br />
based on a community’s vision and as an<br />
evaluation tool to measure progress on steps taken<br />
toward improvement. Their usefulness is<br />
maximized when they are both directly tied to<br />
public-policy and budget decision-making and<br />
when the community feels a sense <strong>of</strong> ownership <strong>of</strong><br />
the indicators through direct citizen involvement.<br />
The data gathered will result in performance<br />
measurements that drive the organization on its<br />
road to efficiency and excellence. Future Business<br />
Plan publications will provide descriptive charts for<br />
each indicator, along with summary information<br />
describing the current years trends.<br />
Key Success Indicators<br />
Percent <strong>of</strong> Water<br />
Capacity<br />
Utilized<br />
Number <strong>of</strong><br />
Annual<br />
Cultural Events<br />
Percentage <strong>of</strong> Divisions Tracking<br />
Monthly Performance Indicators<br />
Citizens<br />
Satisfaction Survey<br />
Responses<br />
Average Time to<br />
Answer <strong>Lakeland</strong><br />
Electric Customer<br />
Calls<br />
D-3 Fiscal Year <strong>2010</strong> Annual Budget
Key Success Indicators (KSI’s)<br />
Quality <strong>of</strong> Life<br />
(Goal) Outcome Example Indicators<br />
2006<br />
Actual<br />
2007<br />
Actual<br />
Actual Data Collection<br />
2008<br />
Actual<br />
2009<br />
Projected<br />
<strong>2010</strong><br />
Target<br />
Outcome: Arts and Cultural Enrichment<br />
Number <strong>of</strong> Annual Cultural Events – Public Information<br />
n/a n/a n/a n/a n/a<br />
Outcome: Continuous and Inclusive Public<br />
Engagement<br />
Number <strong>of</strong> Neighborhood Meetings Facilitated –<br />
Community Development/Planning 165 119 135 126 132<br />
Outcome: Enhanced Mobility Options<br />
Number <strong>of</strong> Newsletters/Communications Facilitated –<br />
Community Development/Planning<br />
130 93 97 100 108<br />
Bookmobile Circulation Statistics (contract to Polk County)<br />
– Parks & Recreation/Library 20,787 23,979 30,882 27,000 29,000<br />
Traffic Rating- Community Development n/a n/a n/a<br />
Outcome: Economic, Cultural and Service<br />
Oriented Public/Private Partnerships<br />
Number <strong>of</strong> Business Watch Programs – Police<br />
Department/Programs n/a n/a n/a n/a n/a<br />
Number <strong>of</strong> Neighborhood Watch Programs – Police<br />
Department/Programs n/a n/a n/a n/a n/a<br />
Outcome: Reliable and Efficient Public Safety<br />
Programs<br />
Number <strong>of</strong> EMS Call Response Times less than 5 Minutes<br />
– Fire Department/Operations n/a n/a n/a n/a n/a<br />
School Safety Score/Total <strong>City</strong> – Police<br />
Department/Juvenile n/a n/a n/a n/a n/a<br />
Number <strong>of</strong> Neighborhood Watch Programs – Police<br />
Department/Programs n/a n/a n/a n/a n/a<br />
D-4 Fiscal Year <strong>2010</strong> Annual Budget
Key Success Indicators (KSI’s)<br />
(Goal) Outcome Example Indicators<br />
2006<br />
Actual<br />
2007<br />
Actual<br />
Actual Data Collection<br />
2008<br />
Actual<br />
2009<br />
Projected<br />
<strong>2010</strong><br />
Target<br />
Citizen Satisfaction Rating – Public Information<br />
n/a n/a n/a n/a n/a<br />
Participants at Recreation Facilities – Parks &<br />
Recreation/Recreation n/a n/a n/a n/a n/a<br />
Acres <strong>of</strong> Active Parks Maintained/Cost per Acre – Parks &<br />
Recreation/Parks $3,501 $4,730 $4,374 $4,300 $4,300<br />
Number <strong>of</strong> Field Rentals for Games and Practices – Parks &<br />
Recreation/Parks 4,297 4,449 4,465 4,471 4,480<br />
Number <strong>of</strong> Open Activity Transactions at Simpson Park<br />
Community Center – Parks & Recreation/Recreation n/a n/a n/a n/a n/a<br />
Outcome: Responsive, Efficient and Superior<br />
Standards <strong>of</strong> Municipal Services<br />
Citizen Satisfaction Rating – Public Information<br />
n/a n/a n/a n/a n/a<br />
Outcome: Educational Training Achievements<br />
and Life Long Learning<br />
Partnerships with Education – Human Resources<br />
n/a n/a n/a n/a n/a<br />
Outcome: Vibrant Communities and Healthy<br />
Lifestyles<br />
Number <strong>of</strong> Programs and Participants in Cultural/Education<br />
Adult Programs at Main Library – Public Parks & &<br />
Recreation/Library<br />
Number <strong>of</strong> Programs and Participants in Cultural/Education<br />
Youth Programs at Main Library – Parks &<br />
Recreation/Library<br />
39<br />
972<br />
174<br />
8,599<br />
97<br />
1,724<br />
234<br />
10,805<br />
18<br />
633<br />
298<br />
11,593<br />
54<br />
995<br />
259<br />
10,788<br />
55<br />
1,100<br />
246<br />
10,249<br />
Number <strong>of</strong> Patrons Served in Athletic Leagues – Parks &<br />
Recreation/Recreation n/a n/a n/a n/a n/a<br />
Number <strong>of</strong> Attendees at Coleman Bush Building Special<br />
Events – Parks & Recreation/Recreation n/a n/a n/a n/a n/a<br />
Number <strong>of</strong> Transactions at Aquatic Center Open Activities –<br />
Parks & Recreation/Recreation n/a n/a n/a n/a n/a<br />
D-5 Fiscal Year <strong>2010</strong> Annual Budget
Key Success Indicators (KSI’s)<br />
Economic Opportunity<br />
(Goal) Outcome Example Indicators<br />
2006<br />
Actual<br />
2007<br />
Actual<br />
Actual Data Collection<br />
2008<br />
Actual<br />
2009<br />
Projected<br />
<strong>2010</strong><br />
Target<br />
Outcome: Partnering for Economic<br />
Connections, Collaboration and Creation<br />
Outcome: Downtown Focus and Vibrancy<br />
Commercial Property Maintenance Code Compliance Rate<br />
– CD/Code Enforcement<br />
73.39% 85.34% 73.27% 77.33% 77.33%<br />
Number <strong>of</strong> Architectural Plans Reviewed by Historical<br />
Preservation Administration – Community<br />
Development/Planning<br />
225 226 224 155 175<br />
Number <strong>of</strong> Commercial Site Plans Reviewed – Community<br />
Development/Planning<br />
255 243 161<br />
84 100<br />
Outcome: Enriched Community<br />
Workforce/Creative Class Jobs<br />
Annual High School Graduation Rate – Community<br />
Development n/a n/a n/a n/a n/a<br />
Net New Jobs Created – Community Development<br />
n/a n/a n/a n/a n/a<br />
Outcome: Generationally Diverse and Attractive<br />
Environment<br />
Lake Water Quality <strong>of</strong> Life- Public Information<br />
-1.91 -0.75 0.67 tbd tbd<br />
Outcome: Sustainable Business Environment<br />
and Tourism<br />
Number <strong>of</strong> Structures Inspected/Maintained – Public<br />
Works/Lakes<br />
7,513 9,495 10,158 10,200 10,300<br />
Local Cost <strong>of</strong> Living Index – Community Development<br />
n/a n/a n/a n/a n/a<br />
D-6 Fiscal Year <strong>2010</strong> Annual Budget
Key Success Indicators (KSI’s)<br />
Growth Management<br />
(Goal) Outcome Example Indicators<br />
Total Number <strong>of</strong> Business Tax Receipts Issued –<br />
Community Development/Building Inspection<br />
2006<br />
Actual<br />
2007<br />
Actual<br />
Actual Data Collection<br />
2008<br />
Actual<br />
2009<br />
Projected<br />
<strong>2010</strong><br />
Target<br />
5,150 5,755 6,598 6,834 6,970<br />
Outcome: Fiscal Responsibility and Shared<br />
Resources<br />
Outcome: Reliable, Adequate Infrastructure<br />
Number <strong>of</strong> Enterprise Zone Incentives Processed –<br />
Community Development/Planning<br />
Not tracked<br />
9 36 35 30<br />
R&R Budget/System Value as Percentage for Water –<br />
Water Utility/Administration<br />
15% 10% 10% 11% 13%<br />
R&R Budget/System Value as Percentage for Wastewater –<br />
Water Utility/Administration<br />
46% 53% 57% 44% 32%<br />
Water System Replacement Footage – Water<br />
Utility/Treatment & Distribution 5,406 11,162 30,015 10,000 12,000<br />
Outcome: Comprehensive Integrated Approach<br />
to Land Use Decisions<br />
Number <strong>of</strong> Grants Applied for – Community<br />
Development/Planning Not tracked Not tracked Not tracked<br />
3 4<br />
Number <strong>of</strong> New Transit Facilities Committed – Community<br />
Development/Planning Not tracked Not tracked Not tracked 6 6<br />
Outcome: Quality Developments Consistent<br />
with Community Industry and Green Standards<br />
Change in Net Taxable Value Percent – <strong>City</strong> Manager<br />
Office/Community Redevelopment Agency<br />
24.51% 16.37% 3.68% -17.60% -5.00%<br />
D-7 Fiscal Year <strong>2010</strong> Annual Budget
Key Success Indicators (KSI’s)<br />
(Goal) Outcome Example Indicators<br />
Median Home Price – Community Development<br />
2006<br />
Actual<br />
2007<br />
Actual<br />
Actual Data Collection<br />
2008<br />
Actual<br />
2009<br />
Projected<br />
<strong>2010</strong><br />
Target<br />
n/a n/a n/a n/a n/a<br />
Outcome: Safe Attractive Neighborhoods<br />
Across the Economic Spectrum<br />
Home Owner Satisfaction Regarding Growth – Public<br />
Information<br />
Number <strong>of</strong> Amendments Initiated/Approved on Land<br />
Development Regulations by <strong>City</strong> Commission – Community<br />
Development/Planning<br />
Number <strong>of</strong> MegaWatt PV Installs; Number <strong>of</strong> SHW Installs:<br />
Number <strong>of</strong> Customers Assisted with Conservation Program<br />
– <strong>Lakeland</strong> Electric<br />
n/a n/a n/a n/a n/a<br />
15/15 14/14 4/4 18/18 30/30<br />
n/a n/a n/a n/a n/a<br />
<strong>City</strong> Crime Rate (Part 1 Crimes) – Police Department<br />
n/a n/a n/a n/a n/a<br />
Number <strong>of</strong> Fires Inside <strong>City</strong> Limits – Fire Department<br />
n/a n/a n/a n/a n/a<br />
Amount <strong>of</strong> Property Loss from Fire (in Dollars) – Fire<br />
Department n/a n/a n/a n/a n/a<br />
Total Households Assisted – Community<br />
Development/Affordable Housing 51 48 25 16 10<br />
Tons <strong>of</strong> Debris Removed in Neighborhood Clean-ups –<br />
Community Development/Code Enforcement 71 155 118 111 114<br />
Rate <strong>of</strong> Crashes per 100 Million Miles Traveled – Police<br />
Department/Patrol n/a n/a n/a n/a n/a<br />
Outcome: Regionally Adequate Transportation<br />
Systems<br />
Number <strong>of</strong> Traffic Studies Performed – Public Works/Traffic 377 232 279 304 380<br />
D-8 Fiscal Year <strong>2010</strong> Annual Budget
Key Success Indicators (KSI’s)<br />
Fiscal Management<br />
(Goal) Outcome Example Indicators<br />
2006<br />
Actual<br />
2007<br />
Actual<br />
Actual Data Collection<br />
2008<br />
Actual<br />
2009<br />
Projected<br />
<strong>2010</strong><br />
Target<br />
Outcome: New or Diversified Revenue Streams<br />
to Fund Priorities<br />
Annual Grants Dollars - Finance<br />
n/a n/a n/a n/a n/a<br />
Outcome: Strategic, Accountable and<br />
Transparent Cost Management<br />
New Net Income Sources Dollars - Finance<br />
n/a n/a n/a n/a n/a<br />
Total Cost <strong>of</strong> Municipal Services and Tax - Finance<br />
n/a n/a n/a n/a n/a<br />
Departmental Expenditures per Capita - Finance<br />
n/a n/a n/a n/a n/a<br />
Outcome: Measurable Performance <strong>of</strong><br />
Innovation, Efficiency and Effectiveness<br />
Inventory Error Percentage – Risk Management/Purchasing<br />
n/a n/a n/a n/a n/a<br />
Total Fleet Average Cost per Mile – Public Works/Fleet<br />
.30/mile .55/.32/.23 .71/.42/.29 .63/.46/.17 .64/.45/.19<br />
Percent <strong>of</strong> Performance Indicator Targets Achieved <strong>City</strong>-<br />
Wide n/a n/a n/a n/a n/a<br />
Percent <strong>of</strong> Projects Completed within Budget and on<br />
Schedule – <strong>Lakeland</strong> Electric/Production n/a n/a n/a n/a n/a<br />
Number <strong>of</strong> MegaWatts Sold – <strong>Lakeland</strong> Electric<br />
n/a n/a n/a n/a n/a<br />
Number <strong>of</strong> MegaWatts Purchased – <strong>Lakeland</strong> Electric<br />
n/a n/a n/a n/a n/a<br />
D-9 Fiscal Year <strong>2010</strong> Annual Budget
Key Success Indicators (KSI’s)<br />
(Goal) Outcome Example Indicators<br />
Outcome: Strategic and Budgetary Planning<br />
and Prioritization <strong>of</strong> Resources<br />
2006<br />
Actual<br />
2007<br />
Actual<br />
Actual Data Collection<br />
2008<br />
Actual<br />
2009<br />
Projected<br />
<strong>2010</strong><br />
Target<br />
<strong>Lakeland</strong> Electric Rate Analysis, by Cost <strong>of</strong> Service, Total<br />
Price by Customer Class, and Residential Base Rate<br />
n/a n/a n/a n/a n/a<br />
Comparisons – <strong>Lakeland</strong> Electric<br />
Maintain Sufficient Cash Flow for Payment <strong>of</strong> Dividend –<br />
<strong>Lakeland</strong> Electric n/a n/a n/a n/a n/a<br />
Communications<br />
Outcome: Customer Experience Deemed<br />
Pr<strong>of</strong>essional, Responsive and Productive<br />
Citizen Satisfaction Survey Responses – Public Information n/a n/a n/a n/a n/a<br />
Outcome: Media Partnerships for Real Time<br />
Communication Feedback<br />
Number <strong>of</strong> Board Meetings Airing on LGN – Public<br />
Information n/a n/a n/a n/a n/a<br />
Number <strong>of</strong> Public Education Shows Airing on LGN – Public<br />
Information n/a n/a n/a n/a n/a<br />
Outcome: Transparent and Understandable<br />
Message Content<br />
TBD n/a n/a n/a n/a n/a<br />
Outcome: Effective and Timely Communication<br />
with Customers<br />
Citizen Communication Satisfaction Rating – Public<br />
Information n/a n/a n/a n/a n/a<br />
Average Time to Answer <strong>Lakeland</strong> Electric Customer Calls<br />
– <strong>Lakeland</strong> Electric/Customer Service n/a n/a n/a n/a n/a<br />
D-10 Fiscal Year <strong>2010</strong> Annual Budget
Key Success Indicators (KSI’s)<br />
(Goal) Outcome Example Indicators<br />
2006<br />
Actual<br />
2007<br />
Actual<br />
Actual Data Collection<br />
2008<br />
Actual<br />
2009<br />
Projected<br />
<strong>Lakeland</strong> Electric Customer Satisfaction Rating – <strong>Lakeland</strong><br />
Electric/Customer Service n/a n/a n/a n/a n/a<br />
<strong>2010</strong><br />
Target<br />
Governance<br />
Outcome: Customer and Market Focus<br />
(Benchmarking)<br />
Percent <strong>of</strong> Divisions Tracking Monthly Performance<br />
Indicators – <strong>City</strong> Manager Office/Performance Excellence n/a n/a n/a n/a n/a<br />
Number <strong>of</strong> Customers Billed and Number <strong>of</strong> New Assets<br />
Reviewed for Service – Finance/Customer Billing n/a n/a n/a n/a n/a<br />
Outcome: Enriched, Informed and Engaged<br />
Workforce<br />
Diversity <strong>of</strong> the <strong>City</strong> <strong>of</strong> <strong>Lakeland</strong> Employees – Human<br />
Resources<br />
Employee Job Satisfaction – Human Resources<br />
n/a n/a n/a n/a n/a<br />
n/a n/a n/a n/a n/a<br />
Number <strong>of</strong> Employees using Tuition Assistance Program –<br />
Human Resources/Employee Relations<br />
Number <strong>of</strong> Employees Completing Each <strong>City</strong> University<br />
Level – Human Resources/Employee Relations<br />
A. 121 A. 109 A. 116 A. 106 A. 110<br />
no data<br />
(F)26, (1)27,<br />
(2)15, (3)9<br />
(F)63, (1)35,<br />
(2)17, (3)4<br />
(F)55, (1)55,<br />
(2)27, (3)12<br />
(F)50, (1)50,<br />
(2)25,<br />
(3)10<br />
Outcome: Safeguarding <strong>of</strong> Assets and Prudent<br />
Management <strong>of</strong> Fiscal Resources<br />
Building Maintenance per Square Foot – Public<br />
Works/Facilities Maintenance n/a $1.12 $1.09 $1.10 $1.05<br />
Average Decrease in Medical Claims per Participant in<br />
Wellness Program – Risk Management<br />
All Invoices Processed within Prompt Payment Guidelines –<br />
Finance/<strong>Lakeland</strong> Electric<br />
n/a<br />
n/a<br />
n/a<br />
n/a<br />
1.41%<br />
$317,664<br />
NA<br />
NA<br />
1.61%<br />
$349,430<br />
n/a n/a n/a n/a n/a<br />
D-11 Fiscal Year <strong>2010</strong> Annual Budget
Key Success Indicators (KSI’s)<br />
(Goal) Outcome Example Indicators<br />
Outcome: Results Oriented and Value Based<br />
Leadership<br />
2006<br />
Actual<br />
2007<br />
Actual<br />
Actual Data Collection<br />
2008<br />
Actual<br />
2009<br />
Projected<br />
<strong>2010</strong><br />
Target<br />
Number <strong>of</strong> Values in Progress (VIP) Awards Given –<br />
Human Resources/Employee Relations<br />
n/a n/a 73 153 100<br />
Outcome: Transparent, Accountable and<br />
Efficient Business Processes<br />
Number <strong>of</strong> Process Improvement Events Completed – <strong>City</strong><br />
Manager Office/Performance Excellence n/a n/a n/a n/a n/a<br />
Outcome: Knowledge and Analysis Based<br />
Decision-Making<br />
Percent <strong>of</strong> Water Capacity Utilized – Water<br />
Utility/Administration<br />
Network Uptime Percentage – Information Technology<br />
.927 .882 .761 .66 .70<br />
99.99% 99.99% 99.99% 99.900% 99.900%<br />
Outcome: Regulatory and Policy Compliance<br />
Percent <strong>of</strong> Scheduled Financial Audits Completed – Internal<br />
Audit<br />
100% <strong>of</strong><br />
scheduled<br />
completed;<br />
80% <strong>of</strong><br />
recommendati<br />
ons<br />
implemented<br />
88% <strong>of</strong><br />
scheduled<br />
completed;<br />
100% <strong>of</strong><br />
recommendati<br />
ons<br />
implemented<br />
100% <strong>of</strong><br />
scheduled<br />
completed;<br />
87% <strong>of</strong><br />
recommendat<br />
ions<br />
implemented<br />
100% <strong>of</strong><br />
scheduled<br />
completed;<br />
Number <strong>of</strong> Legal Contracts processed in Support <strong>of</strong> <strong>City</strong><br />
n/a n/a n/a n/a n/a<br />
Departments – <strong>City</strong> Attorney<br />
No Audit Findings during Annual Audit – Finance/Central<br />
Accounting n/a n/a n/a n/a n/a<br />
Outcome: Strategic and Long Term Planning<br />
Internal Customer Satisfaction Rating on Strategic Planning<br />
Process and Budget Development Process – <strong>City</strong> Manager<br />
Office/Performance Excellence<br />
n/a n/a n/a n/a n/a<br />
D-12 Fiscal Year <strong>2010</strong> Annual Budget
Service and Operations Strategy<br />
The Strategic Plan is updated in a series <strong>of</strong> Senior<br />
Leadership workshops and a Commission Retreat<br />
workshop where the environmental issues<br />
impacting the <strong>City</strong>, customer requirements and<br />
past performance are explored. The resulting plan<br />
communicates the shared vision and direction for<br />
the <strong>City</strong>, which all subsequent tactical and financial<br />
planning supports. The 36 Outcomes identified by<br />
the <strong>City</strong> Commission for this strategic planning<br />
cycle are as follows:<br />
Arts and Cultural Enrichment<br />
Continuous and Inclusive Public<br />
Engagement<br />
Enhanced Mobility Options<br />
Economic, Cultural and Service<br />
Oriented Public/Private Partnerships<br />
Reliable and Efficient Public Safety<br />
Programs<br />
Diverse Recreational Opportunities<br />
and Quality Public Spaces<br />
Responsive, Efficient and Superior<br />
Standards <strong>of</strong> Municipal Services<br />
Educational Training Achievements<br />
and Life Long Learning<br />
Vibrant Communities and Healthy<br />
Lifestyles<br />
Fiscal Responsibility and Shared<br />
Resources<br />
Reliable, Adequate Infrastructure<br />
Comprehensive Integrated Approach<br />
to Land Use Decisions<br />
Quality Developments Consistent with<br />
Community Industry and Green<br />
Standards<br />
Safe Attractive Neighborhoods Across<br />
the Economic Spectrum<br />
Regionally Adequate Transportation<br />
Systems<br />
Partnering for Economic Connections,<br />
Collaboration and Creation<br />
Downtown Focus and Vibrancy<br />
Enriched Community Workforce/<br />
Creative Class Jobs<br />
Generationally Diverse and Attractive<br />
Environment<br />
Sustainable Business Environment<br />
and Tourism<br />
New or Diversified Revenue Streams<br />
to fund Priorities<br />
Strategic, Accountable and<br />
Transparent Cost Management<br />
Measurable Performance <strong>of</strong><br />
Innovation, Efficiency and<br />
Effectiveness<br />
Strategic and Budgetary Planning and<br />
Prioritization <strong>of</strong> Resources<br />
Customer Experience Deemed<br />
Pr<strong>of</strong>essional, Responsive and<br />
Productive<br />
Media Partnerships for Real Time<br />
Communication Feedback<br />
Transparent and Understandable<br />
Message Content<br />
Effective and Timely Communication<br />
with Customers<br />
Customer and Market Focus<br />
Enriched, Informed and Engaged<br />
Workforce<br />
Safeguarding <strong>of</strong> Assets and Prudent<br />
Management <strong>of</strong> Fiscal Resources<br />
Results Oriented and Value Based<br />
Leadership<br />
Transparent, Accountable and Efficient<br />
Business Processes<br />
Knowledge and Analysis Based<br />
Decision-Making<br />
Regulatory and Policy Compliance<br />
Strategic and Long Term Planning<br />
While the Strategic Plan sets out the Vision, the<br />
Business Plan outlines tangible plans for making<br />
the Vision a reality. In each <strong>of</strong> the Outcome areas,<br />
Department Directors have connected Core<br />
Services that will direct the way the <strong>City</strong> operates<br />
in order to address the Outcomes and implement<br />
the Vision expressed in the Strategic Plan.<br />
Lake Wire<br />
D-13 Fiscal Year <strong>2010</strong> Annual Budget
Process Improvement Teams<br />
Quality is achieved by giving customer (internal and<br />
external) concerns top priority and by studying and <br />
constantly improving key work processes so the final<br />
product or service meets or exceeds customer<br />
expectations while maintaining a cost-competitive<br />
position.<br />
<br />
Many different improvement methods are used to<br />
achieve quality. The first step in any improvement<br />
method is to understand the process. Then, as<br />
processes are improved, productivity goes up and<br />
inefficiencies are reduced, giving customers better<br />
products and services, increasing their satisfaction <br />
and ultimately the organizations success.<br />
Our organization has a Process Improvement<br />
workshop available to all employees through the<br />
<strong>City</strong>U program. The workshop is designed to guide<br />
each participant in defining their processes and<br />
analyzing them to determine opportunities for<br />
improved efficiencies and cost reductions. Any<br />
workgroup may request a workshop session or<br />
assistance in facilitating a team.<br />
Throughout the years the <strong>City</strong> <strong>of</strong> <strong>Lakeland</strong> has gained<br />
improvements through many Process Improvement<br />
Project Teams. The following is a list <strong>of</strong> those teams:<br />
Process - Development Review Process (DRT).<br />
Production Maximo Work Order - Reduced<br />
Maximo Work Order backlog by 50% and defined<br />
and implemented an improved process to<br />
maintain reduction.<br />
Meter Data Cradle to Grave - Identified the life<br />
process <strong>of</strong> an electric meter. Established<br />
process to reconcile all meters, ensuring every<br />
active meter is billed and every inactive meter is<br />
accounted for.<br />
Plant Training and Qualification - Identified all<br />
Plant Training & Qualifications for Power Island,<br />
Coal Yard, Water Operations, Maintenance/<br />
Crafts, Unit 5 and Unit 8.<br />
<strong>Lakeland</strong> Police Department (LPD) Hiring -<br />
Identified and improved the selection and<br />
recruitment processes for the Sworn Officers,<br />
Sponsorships, PSA, ECS and Civilian positions<br />
within LPD.<br />
<br />
Facilities Charges - Established a process in<br />
which all facilities charges are tracked,<br />
maintained and billed. Created a central<br />
repository for all facilities charge documentation.<br />
<br />
Customer Office Project - Identified gap between<br />
current performance and the customer<br />
requirements <strong>of</strong> Walk-In clientele. Proposed<br />
changes to eliminate the performance gap by<br />
maximizing the use <strong>of</strong> our staffing resources and<br />
facilities, along with recommendations to reduce<br />
operating costs. Communicated and approved<br />
changes were implemented October 1, 2009.<br />
Strategic Planning and Performance<br />
Measurement - Identify and improve the Strategic<br />
Planning and Performance Measurement<br />
Process.<br />
<br />
Collections Project - Identified the cause and<br />
effect between the collection timeline and arrears<br />
and uncollectibles. Proposed changes to the<br />
timeline that streamlined the process and<br />
reduced <strong>Lakeland</strong> Electric arrears and debt.<br />
Communicated and implemented changes.<br />
<br />
<br />
<br />
Customer Numbers in the Utility Management<br />
System (UMS) - Identified a process for assigning<br />
and maintaining accurate customer numbers<br />
within the current UMS billing system.<br />
Pole Attachment - Developed a process to<br />
support (manage, track and bill) the proposed<br />
POLE ATTACHMENT LICENSE AGREEMENT.<br />
Water Master Meter - Identified the processes for<br />
capturing data as it relates to commercial and<br />
residential water master meter removal,<br />
installation, recording, documentation and<br />
database<br />
<br />
<br />
Subdivision Review Team (SRT) – To identify<br />
and improve the Subdivision Review Process - In<br />
process.<br />
Development Review Team - Identified and<br />
improved the Commercial Site Plan Review<br />
maintenance.<br />
The <strong>Lakeland</strong> Center RPI Event<br />
D-14 Fiscal Year <strong>2010</strong> Annual Budget
Process Improvement Teams<br />
Rapid Process Improvement (RPI)<br />
In an effort to further pursue efficiency and<br />
effectiveness. Last year the <strong>City</strong>, through the<br />
Performance Excellence Division, introduced the<br />
Rapid Process Improvement (RPI) methodology for<br />
projects meeting criteria that enable project<br />
completion within one week. RPI is designed to<br />
utilize employee expertise to quickly reduce or<br />
eliminate waste in work processes focusing on low<br />
cost or no cost solutions.<br />
There are several methods in which processes<br />
are traditionally identified for areas <strong>of</strong><br />
improvement Strategic Planning, Project Pipeline,<br />
Task Teams and Problem Identification.<br />
The <strong>City</strong> <strong>of</strong> <strong>Lakeland</strong> chose to have the Senior<br />
Leadership Team submit processes for<br />
improvement for the kick<strong>of</strong>f <strong>of</strong> the pilot RPI Plan.<br />
A group <strong>of</strong> ten employees from five departments<br />
within the <strong>City</strong>, were trained to become facilitators<br />
in a week long session held in June <strong>of</strong> 2008.<br />
Several RPI events were scheduled between July<br />
and January 2009.<br />
<br />
<br />
<br />
<br />
<br />
<br />
<br />
<br />
<br />
The <strong>Lakeland</strong> Center – Shipping & Receiving<br />
Process<br />
Risk Management – Annual Benefits<br />
Enrollment<br />
Human Resources – Mapping <strong>of</strong> the<br />
Disciplinary Process<br />
Parks and Recreation – Special Events<br />
Process<br />
Information Technology – Employee<br />
Termination Security Access Removal Process<br />
Risk Management (Purchasing) – Inventory<br />
Issues at Storage Yard<br />
Finance – Accounts Payable Process<br />
<strong>Lakeland</strong> Electric – Contracts Process<br />
Mapping<br />
<strong>Lakeland</strong> Electric – Web Self Service Process<br />
Mapping<br />
Three <strong>of</strong> the four departments outside <strong>of</strong><br />
Performance Excellence trained in facilitating RPI<br />
events are moving forward in utilizing the tools,<br />
two <strong>of</strong> which are conducting their own RPI’s.<br />
We are currently in the process <strong>of</strong> identifying<br />
viable projects, recruiting potential RPI facilitators<br />
from non-participating departments and<br />
scheduling upcoming events.<br />
Act<br />
•Make Adjustments<br />
• I.D. Lessons Learned<br />
• Standardize<br />
•Replicate<br />
• Communicate Remaining Issues<br />
• Develop Next Steps<br />
Check<br />
• Track Implementation<br />
•Adjust Plan<br />
• Evaluate Results<br />
RPI Process Wheel<br />
7. Remaining<br />
Issues and<br />
Future Plans<br />
6. Ensure Results<br />
5. Implement<br />
Start<br />
Excellence<br />
4. Identify<br />
and<br />
Select<br />
Solutions<br />
• Next Steps from “Act”<br />
•Identify Process<br />
• Develop Scope<br />
• Develop Mission<br />
• Identify & Secure Resources<br />
• Develop the Project Charter<br />
• Form the Team<br />
1. Set Direction<br />
2. Understand<br />
Process<br />
3. Identify<br />
& Analyze<br />
Barriers<br />
Plan<br />
• Develop Baseline Process Map<br />
• Identify High Level Issues & Barriers<br />
• I.D. Root Causes<br />
• Select Solutions<br />
Do<br />
• Redesign Process & Tools<br />
• Develop Implementation Plan<br />
• Implement the Plan<br />
Step 1 is a planning session held with the<br />
Champion/Sponsor and the Project/<br />
Implementation Leader.<br />
Steps 2, 3 & 4 are accomplished by the team<br />
during the RPI event week.<br />
Steps 5, 6 & 7 are facilitated by the Project/<br />
Implementation Leader, following the event.<br />
Characteristics <strong>of</strong> a viable RPI candidate:<br />
No known “best performers” to benchmark.<br />
Process to be improved is known.<br />
Problems are within the process – not outside<br />
Finance - Accounts Payable RPI Event<br />
D-15 Fiscal Year <strong>2010</strong> Annual Budget
Department Performance Levels<br />
Each <strong>of</strong> the <strong>City</strong>’s departments develop a work plan<br />
and new initiatives based on the current Strategic<br />
Plan. The Business Plan then summarizes the new<br />
initiatives and the Performance Budget summarizes<br />
the resources allocated to each Activity and the<br />
performance measures negotiated to define<br />
acceptable results. The Program section <strong>of</strong> this book<br />
(beginning on page D-35) gives a brief overview <strong>of</strong> the<br />
Program Area summaries.<br />
Significant Accomplishments for<br />
Fiscal Year 2009<br />
<strong>City</strong> Manager’s Office<br />
Organizational Leadership/Administration<br />
The <strong>City</strong> Manager’s Office (CMO) facilitated regular<br />
and ongoing discussion forums <strong>of</strong> organization related<br />
issues throughout the year with Department Heads,<br />
senior leadership staff, and employees. The<br />
organization’s value <strong>of</strong> employee engagement is<br />
supported through a philosophy <strong>of</strong> open, two-way<br />
communication practiced through regular staff and<br />
employee meetings, interactive web information<br />
exchange, staff committees and task forces, Annual<br />
Employee Meetings and other opportunities that<br />
encourage active participation and communication in<br />
administrative decision-making. <strong>City</strong> Administration<br />
took a high pr<strong>of</strong>iled lead early in Fiscal Year 2009 to<br />
prepare the organization for long term fiscal challenges<br />
being faced by the organization, community, county,<br />
state and nation. The CMO engaged the senior<br />
leadership staff in workshops focused on the <strong>City</strong>’s<br />
fiscal health and wellness which led to the<br />
identification and prioritization <strong>of</strong> Municipal Core<br />
Services provided by the organization to the<br />
community and in support <strong>of</strong> its governance<br />
responsibilities. We will continue to use this efficiency<br />
and process improvement model to streamline and<br />
ensure a level <strong>of</strong> community services that meets the<br />
highest demand and quality.<br />
Strategic Planning, Budget Development and Financial<br />
Oversight<br />
For the 2009 Fiscal Year, the <strong>City</strong> <strong>of</strong> <strong>Lakeland</strong> was<br />
awarded a Distinguished Budget Presentation Award<br />
from the Government Finance Officers Association<br />
(GFOA) in recognition <strong>of</strong> the budget document’s<br />
layout, planning, content and overall presentation and<br />
conformance as a policy document, financial plan,<br />
operation s guide, and communications device. In<br />
development <strong>of</strong> this year’s budget that was challenged<br />
by tax reform and declining revenue sources from a<br />
multi-faceted economic downturn, integration <strong>of</strong> the<br />
budget and the 5 year strategic planning initiative was<br />
a key focus. The Annual <strong>City</strong> Commission Retreat<br />
emphasized fiscal health and wellness principles in<br />
combination with a new “Budget by Priorities” Model<br />
and resulted in the weighting <strong>of</strong> Strategic Operating<br />
Plan’s 5 goals by the Commission, redefining expected<br />
outcomes from collaboration with community<br />
stakeholders, and the establishment <strong>of</strong> a governance<br />
goal and its related outcomes. Core Municipal<br />
Services were aligned to strategic planning results,<br />
graded and prioritized for budgetary allocation.<br />
The GFOA also awarded a Certificate <strong>of</strong> Achievement<br />
for Excellence in Financial Reporting for the<br />
Comprehensive Annual Financial Report for the year<br />
ended September 30, 2008. The compilation <strong>of</strong><br />
financial reports satisfied both generally accepted<br />
accounting principles and applicable legal<br />
requirements. This year’s financial audit implemented<br />
enhanced governmental standards including new<br />
governance planning and review requirements. A<br />
comprehensive review <strong>of</strong> information technology<br />
controls for key financial related applications was<br />
conducted with recommendations implemented.<br />
Labor Relations<br />
The CMO has been actively engaged during the year<br />
through its management and negotiating teams with<br />
the Utilities Workers Union <strong>of</strong> America (UWUA) Local<br />
604. Negotiations for their first collective bargaining<br />
agreement have been ongoing from August 2007 to<br />
March 2009. The <strong>City</strong> and the Union had reached<br />
agreement on 49 articles, although the union declared<br />
impasse over wages in April 2009. At the time <strong>of</strong> this<br />
writing, the matter has been heard in a hearing before<br />
a Special Master and could come before the <strong>City</strong><br />
Commission for a final determination or imposition<br />
after exhausting all other remedies. A majority <strong>of</strong><br />
employees in the Water Utilities Department voted<br />
“No” in a June 2009 election when the UWUA sought<br />
to represent them as a collective bargaining agent.<br />
Negotiations for new collective bargaining agreements<br />
have commenced with the International Association <strong>of</strong><br />
Firefighters (IAFF) whose contracts expired on<br />
October 1, 2008 and the Police Benevolent<br />
Association (PBA) whose contracts expire on<br />
September 30, 2009. The organization also completed<br />
the successful separation <strong>of</strong> the Police Retirement<br />
System from the <strong>City</strong> General Retirement Plan in<br />
accordance with PBA Collective Bargaining Agreement<br />
terms and state standards. Work commenced on<br />
companion pension separation plan involving<br />
Firefighters in conjunction with the negotiation <strong>of</strong> the<br />
IAFF successor Collective Bargaining Agreement. The<br />
successful separation <strong>of</strong> the Civil Service Board from the<br />
D-16 Fiscal Year <strong>2010</strong> Annual Budget
Department Performance Levels<br />
<strong>City</strong> Manager’s Office (cont’d)<br />
General Employee Pension Board in accordance with<br />
enactment <strong>of</strong> Legislative Local Bill also occurred.<br />
Implementation <strong>of</strong> new Civil Service Rules and<br />
Procedures which were used effectively in the <strong>City</strong>’s<br />
first recorded lay<strong>of</strong>fs involving personnel in the<br />
Building Inspection Division, which were administered<br />
in the absence <strong>of</strong> any related appeals to the Civil<br />
Service Board.<br />
Economic Development<br />
The <strong>City</strong> continues to work closely in partnership with<br />
the <strong>Lakeland</strong> Economic Development Council (LEDC)<br />
on high-skill, high-wage jobs to improve <strong>Lakeland</strong>’s<br />
economic opportunity and quality <strong>of</strong> life goals. The<br />
initiative is focused on recruiting and retaining<br />
companies with enabling technologies which support<br />
high-skill and high-wage employees and manufacture<br />
complex research-oriented products. Progressive<br />
developments <strong>of</strong> the past year in concert with the<br />
LEDC included the construction and opening <strong>of</strong><br />
WellDyne RX, a pharmaceutical company providing<br />
mail order presciptions; opening <strong>of</strong> a new instant-ticket<br />
printing facility by GTECH, an international producer<br />
<strong>of</strong> scratch <strong>of</strong>f lottery tickets; progress on the<br />
development <strong>of</strong> the new University <strong>of</strong> South Florida<br />
(USF) Polytechnic University campus including the<br />
CMO’s participation in the facility construction<br />
management firm selection process; negotiations in<br />
conjunction with the Downtown Community<br />
Redevelopment Agency (CRA) in support <strong>of</strong> the USF<br />
“Blue Sky West” business incubator in downtown<br />
<strong>Lakeland</strong>; and expansions by Saddle Creek Corp., a<br />
warehousing and transportation logistics company,<br />
Firmenich, a Swiss flavor and fragrance company, and<br />
baked-goods giant Pepperidge Farm.<br />
Community/Downtown Redevelopment<br />
CRA activities continued on a methodical and brisk<br />
pace within the Dixieland, Downtown, and Mid-Town<br />
areas <strong>of</strong> <strong>Lakeland</strong>. The activities in each area are<br />
outlined in redevelopment plans and guided by<br />
constituent-represented Advisory Boards that make<br />
budget, program and project recommendations to the<br />
<strong>City</strong> Commission who make up the CRA’s Governing<br />
Board. While the CMO has always overseen and<br />
been involved with CRA staff activities and<br />
recommendations, in 2009, the CRA division was<br />
<strong>of</strong>ficially restructured reporting to the CMO.<br />
Accomplishments <strong>of</strong> 2009 are highlighted under the<br />
separate CRA’s section. Also during 2009, the <strong>City</strong><br />
retained pr<strong>of</strong>essional consultants, Glatting Jackson, to<br />
lead a collaborative discussion between the <strong>Lakeland</strong><br />
Downtown Development Authority (LDDA),<br />
Community Redevelopment Agency Board, <strong>City</strong> Staff,<br />
Community Stakeholders and the general public<br />
regarding important community and downtown<br />
redevelopment initiatives over the next 10 years. A<br />
Strategic Direction Plan under the <strong>Lakeland</strong><br />
Downtown CRA Vision was developed and designed<br />
to balance the dual goals <strong>of</strong> economic development<br />
and the retention <strong>of</strong> community character recognizing<br />
the partnerships and number <strong>of</strong> projects already in<br />
place that have produced significant<br />
accomplishments. The purpose <strong>of</strong> the ongoing plan is<br />
to identify initiatives that will require additional or new<br />
focus by the CRA/LDDA in order to assist downtown<br />
<strong>Lakeland</strong> in continued physical, social and economic<br />
enhancement.<br />
Policy Formulation, Recommendations and<br />
Implementation<br />
Policy statements help ensure clear, concise and<br />
consistent performance guidelines and practices<br />
throughout the organization towards fulfillment <strong>of</strong> <strong>City</strong><br />
goals including federal and state legislation as well as<br />
local ordinances and administrative policies.<br />
Intergovernmental policy initiatives required a high<br />
level <strong>of</strong> attention by the <strong>City</strong> <strong>of</strong> <strong>Lakeland</strong> during the<br />
past year with highlights including legislation<br />
authorizing Polk County to become eligible to<br />
advance a tax levy referendum for consideration <strong>of</strong> the<br />
Charter County Transit System Surtax as a means to<br />
expand mass transit services; funding in the State<br />
budget for the new University <strong>of</strong> South Florida (USF)<br />
Polytechnic campus; Senate Bill 532 providing for a<br />
constitutional amendment to be on the November<br />
<strong>2010</strong> ballot reducing the limit on the maximum annual<br />
increase in the assessed value <strong>of</strong> non-homestead<br />
property from 10% to 5% and providing an additional<br />
homestead exemption for first-time homebuyers;<br />
legislation to limit local government’s ability to<br />
establish and collect impact fees; and state legislation<br />
that did not pass involving a uniform Red Light<br />
Camera Enforcement Program. Extensive legislative<br />
and administrative work was also involved in<br />
advancing the <strong>City</strong>’s local and regional concerns with<br />
the implications <strong>of</strong> the proposed SunRail commuter<br />
rail service and the CSX Winter Haven Integrated<br />
Logistics Center (ILC). Efforts involved meetings and<br />
negotiations with state and local elected <strong>of</strong>ficials,<br />
testifying before House and Senate Committees,<br />
presentations to area stakeholder organizations and<br />
serving as liaison with Central Florida municipalities,<br />
organizations and their respective lobbyists. The<br />
legislative vehicle for the issue in the Senate (SB<br />
1212) which cleared three committees in the Senate,<br />
D-17 Fiscal Year <strong>2010</strong> Annual Budget
Department Performance Levels<br />
<strong>City</strong> Manager’s Office (cont’d)<br />
but ultimately was defeated on the Senate Floor, was<br />
intended to finalize the Central Florida Commuter Rail<br />
agreement between the Florida Department <strong>of</strong><br />
Transportation (FDOT) and CSX. The bill also<br />
included language negotiated between the <strong>City</strong> and<br />
the FDOT to allow for an alternate freight route away<br />
from downtown <strong>Lakeland</strong> and required a Preliminary<br />
Design & Engineering (PDE). Additional related work<br />
on the issue involved considerable planning and<br />
coordination for the <strong>City</strong>-sponsored Regional<br />
Connectivity Summit, ongoing representation<br />
throughout the FDOT District I Alternative Rail Study<br />
and assistance with the legal strategies associated<br />
with the legal review <strong>of</strong> the Winter Haven CSX ILC<br />
Development <strong>of</strong> Regional Impact (DRI).<br />
Administratively, major city-wide policies regarding<br />
disciplinary management and emergency conditions<br />
management were revised and distributed to<br />
employees. The CMO also established the<br />
Retirement and Health Insurance Task Force to<br />
involve cross-representational interests in achieving a<br />
solution to Governmental Accounting Standards Board<br />
(GASB) 45 impact involving the associated retirement<br />
health insurance subsidy challenge. The Task Force<br />
is currently finalizing their recommendations regarding<br />
Deferred Retirement Option Plan (DROP) and will<br />
soon begin work on exploring options for other<br />
pension-related issues.<br />
Intergovernmental Relations<br />
The CMO in conjunction with the Community<br />
Development Department secured a $1.0 million<br />
Office <strong>of</strong> Tourism, Trade and Economic Development<br />
(OTTED) grant in conjunction with the GTECH<br />
economic development project to finance future<br />
signalization <strong>of</strong> the east and west on/<strong>of</strong>f ramps at I-4<br />
and County Line Road. Additionally, legislative efforts<br />
also assisted in the award <strong>of</strong> a $27.6 million federal<br />
stimulus funds in conjunction with the Florida<br />
Department <strong>of</strong> Transportation for the construction <strong>of</strong><br />
the East-West Road Project to service the USF<br />
Polytechnic Campus and Williams DRI.<br />
discharge resources. The final arrangement assured<br />
the <strong>City</strong> the long-term ability to pump a minimum <strong>of</strong> 9<br />
MGD from the Northeast Wellfield for raw water<br />
supply to the Combee Water Treatment Plant. The<br />
initiative also resulted in a rare 20-year CUP solely<br />
from groundwater sources. Lastly, the CMO worked<br />
closely with the <strong>Lakeland</strong> Police Department in the<br />
development <strong>of</strong> creative Public-Private partnership<br />
with the Drug Resource Prevention Center to maintain<br />
drug awareness training in local schools following<br />
elimination <strong>of</strong> the <strong>Lakeland</strong> Police Department DARE<br />
program due to budget cutbacks.<br />
Community Redevelopment Areas (CRA’s)<br />
Downtown: In FY2009, the Downtown CRA Plan<br />
Update was completed with the help <strong>of</strong> Glatting<br />
Jackson. The update allowed for a complete<br />
reevaluation <strong>of</strong> the community’s vision for Downtown.<br />
The resulting vision, “Downtown <strong>Lakeland</strong> as a<br />
regional center with a vibrant mix <strong>of</strong> high quality<br />
residential, retail, pr<strong>of</strong>essional, civic and entertainment<br />
activities within a continuously enhanced urban and<br />
historic setting,” has been illustrated in a new<br />
document which should serve to guide the work <strong>of</strong> the<br />
LCRA in Downtown over the course <strong>of</strong> the next ten<br />
years.<br />
Mid Town: Several housing-related initiatives have<br />
continued in FY2009. The Acquisition and Relocation<br />
Pilot Program in the medical area near the hospital<br />
has resulted in the application <strong>of</strong> relocation assistance<br />
to four transactions and has allowed for the successful<br />
negotiation to purchase 21 properties since program<br />
inception in FY2007. Implementation <strong>of</strong> the Parker<br />
Street Conceptual Development Plan continues with<br />
the use <strong>of</strong> the Home Buyer Assistance Program for<br />
families who want to live in the target area, as well as<br />
the construction <strong>of</strong> two new homes. The CRA is also<br />
branching out into rehabilitation <strong>of</strong> CRA-owned<br />
structures for resale, as well as releasing CRA-owned<br />
lots to not-for-pr<strong>of</strong>its in order to allow them to build<br />
new, affordable units.<br />
Design and construction drawings for roadway<br />
The CMO also assisted the Water Utilities Department enhancements which will convert E. Parker Street<br />
and <strong>City</strong> Attorney’s Office in the coordination <strong>of</strong> from N. Massachusetts Avenue to N. Lake Parker<br />
negotiation strategies and related efforts associated Avenue from the current four-lane roadway section to<br />
with the <strong>City</strong>’s award <strong>of</strong> a successor 35.03 Million a two-lane roadway section with an intermittent turning<br />
Gallons per Day (MGD) Consumptive Use Permit lane, medians and bike lanes are in the process <strong>of</strong><br />
(CUP) from the Southwest Florida Water Management development by the <strong>City</strong>’s Engineering Division. This<br />
District (SWFWMD) and in the companion <strong>City</strong>- project, which is slated for construction in FY<strong>2010</strong>, is<br />
SWFWMD-Tampa Electric Company (TECO) made possible by a matching grant from the Florida<br />
Reclaimed Partnership Initiative agreement securing Department <strong>of</strong> Transportation (FDOT) Enhancement<br />
value for wetlands water<br />
Funds.<br />
D-18 Fiscal Year <strong>2010</strong> Annual Budget
Department Performance Levels<br />
Community Redevelopment Areas (cont’d)<br />
Dixieland: FDOT completed major roadway<br />
improvements in the district in FY2009. This included<br />
the milling, resurfacing and striping <strong>of</strong> the SR 37<br />
roadway and some curb and sidewalk repairs. At the<br />
signalized intersections, pedestrian countdown timers<br />
were installed to replace push button poles. In<br />
addition, where there was sufficient right-<strong>of</strong>-way FDOT<br />
took the opportunity to upgrade ramps and curb cuts<br />
to meet the Americans with Disabilities Act.<br />
The CRA also began aggressive implementation <strong>of</strong><br />
the marketing and branding initiatives which were<br />
introduced in FY2008. These included a continuation<br />
<strong>of</strong> cluster branding to promote existing identified<br />
business clusters as well as educational workshops to<br />
provide business tips and techniques. Property<br />
owners continue to be <strong>of</strong>fered financial incentives<br />
intended to encourage investment through Design<br />
Assistance and Façade Improvement matching<br />
grants.<br />
The CRA shifted its focus from SR 37 to the alleys<br />
behind the commercial properties by making the<br />
decision to complete design prototypes for three alleys<br />
within the district. These prototypes outline proposed<br />
improvements to the alleys with a focus on both<br />
function and aesthetics. It is intended for these<br />
improvements to be made in FY<strong>2010</strong>.<br />
Performance Excellence<br />
The Performance Excellence Team became a Division<br />
<strong>of</strong> the <strong>City</strong> Manager’s Office, formed to take the lead<br />
on “Managing the Journey” from Strategic Plan to<br />
Budget. This Journey is defined as assisting<br />
departments in determining what is important to the<br />
Citizens <strong>of</strong> <strong>Lakeland</strong> and measuring results to provide<br />
a clear understanding as to whether we are meeting<br />
their objectives. The following individual pieces make<br />
up the Journey and affect every organization in the<br />
<strong>City</strong> <strong>of</strong> <strong>Lakeland</strong>:<br />
<br />
<br />
<br />
<br />
<br />
<br />
<br />
<br />
Commission Retreat<br />
Sr. Leadership Workshops<br />
Core Service Prioritization<br />
Integrated Strategic Planning & Budget<br />
Calendar<br />
Budget Kick-Off Meeting<br />
Budget Review/Proposal Process<br />
Table <strong>of</strong> Organization Review/Proposal<br />
Process<br />
Manage/Integrate Performance<br />
Measurements:<br />
Operational<br />
<br />
Key Success Indicators<br />
Florida Benchmarking Consortium<br />
Process Improvement<br />
The Baldrige/Sterling Criteria, encompassed in the<br />
outlined above, provides guidance, tools and support<br />
to the organization in taking the necessary steps to<br />
achieve meaningful results and assists in:<br />
<br />
<br />
<br />
<br />
Strategically considering current and future<br />
challenges<br />
Aligns people, resources and processes to<br />
achieve goals<br />
Measures performance and adapts plans in a<br />
changing environment<br />
Aligns resources with approaches such as<br />
‘Process Improvement’ initiatives<br />
Improves communication, productivity and<br />
effectiveness<br />
In FY2009 the Performance Excellence Team worked<br />
diligently to introduce the Core Service Prioritization<br />
Process to the <strong>City</strong> <strong>of</strong> <strong>Lakeland</strong>. This new process.<br />
entailed working with each department to develop a<br />
listing <strong>of</strong> their Core Services and connectivity to the<br />
Strategic Operating Plan. This information was used<br />
as the basis for the FY<strong>2010</strong> Budget Development.<br />
FY10 will continue the Core Service Prioritization<br />
process with further development, refinement and<br />
connectivity <strong>of</strong> performance measurements and citywide<br />
key success measurements.<br />
Police<br />
The department continued the process <strong>of</strong> recruiting<br />
qualified minority and protected class employees to<br />
ensure its diversity levels reflect those <strong>of</strong> the city it<br />
serves. Overall, department levels changed from 82%<br />
white, 12% African-American, 5% Hispanic, and 1%<br />
other to 79% white, 15% African-American, 5%<br />
Hispanic and 1% other.<br />
The department experienced significant budget and<br />
personnel cuts in the summer <strong>of</strong> 2008. The budget<br />
was reduced by over $1.5 million and a total <strong>of</strong> 39<br />
positions were permanently removed from the<br />
department’s table <strong>of</strong> organization. This included 10<br />
full-time sworn <strong>of</strong>ficer positions, 9 full-time civilian<br />
positions, and 20 part-time employees. Sworn<br />
personnel previously assigned to the DARE and<br />
GREAT programs were reassigned to other duties.<br />
The cuts continued in the FY<strong>2010</strong> budget. The<br />
department’s budget reduction target <strong>of</strong> over $600,000<br />
was met through such measures as the elimination <strong>of</strong><br />
D-19 Fiscal Year <strong>2010</strong> Annual Budget
Department Performance Levels<br />
Police (cont’d)<br />
the aviation unit, reduction in overtime and personnel<br />
and other operating expense reductions.<br />
The department continued its commitment to serve<br />
the citizens <strong>of</strong> the city through its community-oriented<br />
policing philosophy and its problem-oriented policing<br />
concept. It also continued to encourage and empower<br />
neighborhoods to work in partnership with the<br />
department and to take a more active role in their own<br />
safety and security.<br />
The department continued its commitment to the<br />
children <strong>of</strong> the city through its support <strong>of</strong> the various<br />
activities (athletics, mentoring and tutoring) <strong>of</strong> the<br />
Police Athletic League.<br />
The department met the challenges <strong>of</strong> reduced<br />
revenue due to the economic downturn and various<br />
property tax initiatives without significant service cuts<br />
(DARE and GREAT being the notable exceptions).<br />
Airport<br />
Central Florida Aerospace Academy opened its<br />
doors with the 2008-2009 school year at the<br />
Airport on the Sun ‘n Fun leasehold thus<br />
furthering the joint effort to bring aviation related<br />
training to the airport and the community.<br />
LAL was successful in recruiting NetJets’ base <strong>of</strong><br />
operations for Super Bowl 2009. With over 100<br />
jets on the airport during the event, LAL gained<br />
the reputation as a first class and convenient<br />
airport.<br />
The airport completed enhanced taxiway<br />
<br />
<br />
<br />
<br />
centerline markings for FAA compliance.<br />
Several FDOT/FAA Grant projects have been<br />
completed or are nearing completion. These<br />
include the installation <strong>of</strong> new security fencing and<br />
access control systems on the Airport that gives<br />
us heightened security on the field.<br />
A new lease was completed that includes <strong>of</strong>fice<br />
and warehouse space <strong>of</strong> 30,000 sq. ft. at<br />
<strong>Lakeland</strong> Airside Center with At Your Door Moving<br />
and Storage, LLC.<br />
The Airport hosted a very safe and successful 35 th<br />
Annual Sun ‘n Fun Fly-in, named Spring Break for<br />
Pilots!<br />
New programs hosted in 2009 included United<br />
Flying Octogenarians (UFO) in January and a<br />
very successful Cirrus Pilot Pr<strong>of</strong>iciency Program<br />
in February. The airport again hosted Wings ‘n<br />
Things, the Beechcraft Pilot Pr<strong>of</strong>iciency Program<br />
<br />
<br />
and the remote control aircraft events Top Gun<br />
and Florida Jets.<br />
Successfully began implementation <strong>of</strong> the Maximo<br />
Work Order System to enhance better response<br />
for support <strong>of</strong> our tenant’s facility issues.<br />
Installation <strong>of</strong> Property Management s<strong>of</strong>tware to<br />
enhance leasehold management and airport<br />
accountability.<br />
Designed and purchased runway marking<br />
banners for use during Sun ‘n Fun 2009. They<br />
are highly visible and double as threshold<br />
markings, eliminating the required future removal<br />
<strong>of</strong> paint and preserving airport pavement.<br />
Electric Utility<br />
Implement Compliance Division; identify<br />
applicable NERC/FERC compliance standards for<br />
<strong>Lakeland</strong> Electric in preparation <strong>of</strong> audit to be<br />
conducted in December <strong>of</strong> <strong>2010</strong>. Completed spot<br />
audit in June 2009. Conducted a Compliance<br />
Awareness training program for targeted<br />
workgroups. Continue work on RFP for on-site<br />
Compliance Program Audit Consultant.<br />
Install 0.5 Mw <strong>of</strong> Photovolatics by end <strong>of</strong> 2009.<br />
Contract approved for Installation <strong>of</strong> Residential<br />
Solar Hot Water Heaters.<br />
G-Tech New 3 MW Industrial load energized.<br />
Ongoing initiatives <strong>of</strong> the Transmission and<br />
Distribution Expansion plans.<br />
Implement Visual Job Planner for Transmission<br />
and Distribution.<br />
Optimize our current fuel status and consistently<br />
manage our fuel inventory for premium efficiency.<br />
Continuous workforce management plan, that<br />
addresses the aging workforce and identifies<br />
critical specific positions that will benefit from<br />
cross-training and succession planning.<br />
Rapid Process Improvement Initiatives for<br />
optimum performance.<br />
Implemented a new safety program/task force for<br />
production.<br />
Major units available for generation Equivalent<br />
Availability Factor 81.95%.<br />
Achieved by-product revenue <strong>of</strong> $243,328.<br />
Design and implement web-based customer<br />
transaction capabilities.<br />
Design and propose SmartGrid Solution<br />
Re-established 230 KV tie.<br />
Implement Production’s Maximo PM Program.<br />
Selective Catalytic Reduction (SCR) project<br />
completed.<br />
D-20 Fiscal Year <strong>2010</strong> Annual Budget
Department Performance Levels<br />
Retirement Services<br />
Employees’ Pension System<br />
December 2008 the Board replaced Asset Consulting<br />
Group with Bogdahn Consulting. Bogdahn<br />
Consulting produced a revised Investment Policy<br />
Statement which was adopted by the Board in March<br />
2009. Bogdahn Consulting recommended the<br />
replacement <strong>of</strong> four investment managers along with<br />
a new investment strategy.<br />
An Investment Committee was formed and began<br />
meeting in April 2009. The Committee is comprised<br />
<strong>of</strong> three members <strong>of</strong> the Employees’ Pension Board.<br />
These members are tasked with reviewing the plan’s<br />
asset allocation and each investment manager.<br />
January 2009 the plan’s actuary began certifying<br />
benefit calculations as an added layer <strong>of</strong> control.<br />
Police Officers’ Pension System<br />
The Police Officers’ Supplemental Pension Plan is<br />
now a stand-alone retirement system dedicated to<br />
the singular pension benefit <strong>of</strong> sworn <strong>of</strong>ficers. The<br />
establishment <strong>of</strong> a pension ordinance, board <strong>of</strong><br />
trustees, summary plan description, Investment<br />
Policy Statement and renewal <strong>of</strong> contracts with<br />
current providers was among the items required to<br />
ensure the plan is operating legally. A new asset<br />
allocation model was implemented as assets and<br />
liabilities from the Employees’ Pension Plan were<br />
transitioned.<br />
All benefit calculations are now certified by the plan’s<br />
actuary. After careful scrutiny <strong>of</strong> current police retiree<br />
benefits, it was discovered some members had been<br />
underpaid and corrective actions were taken to make<br />
them whole.<br />
Firefighters’ Supplemental Pension Plan<br />
A workgroup has been established to begin work on<br />
a new Firefighter Pension Plan. The plan’s actuary<br />
will be costing out the state’s minimum benefits.<br />
Deferred Compensation Plan and Defined<br />
Contribution Plan<br />
Monitored by Allen & Company’s Investment Team.<br />
Allen & Company meets with Retirement Services at<br />
least once per quarter to discuss due diligence<br />
performed on the plans. October 2008 the<br />
department kicked <strong>of</strong>f its first annual National Save<br />
for Retirement Week to increase the awareness <strong>of</strong><br />
the importance <strong>of</strong> saving adequately for retirement<br />
and the availability <strong>of</strong> tax-deferred employer<br />
sponsored retirement savings vehicles.<br />
Retirement Health Savings Plan<br />
Implemented the program in conjunction with ICMA-<br />
RC, allowing members to accumulate assets to pay<br />
for medical expenses on a tax-free basis. The plan is<br />
mandatory for non-union employees hired after<br />
January 1, 2003. The department administers the<br />
new plan and ensures timely automatic enrollment <strong>of</strong><br />
all new hires.<br />
General Office<br />
Implemented new death audit procedure utilizing a<br />
third party company saving <strong>City</strong> staff time and effort.<br />
Implemented the process to become a paperless<br />
<strong>of</strong>fice. A part time employee is working to scan all <strong>of</strong><br />
the retiree files.<br />
Communications<br />
Deferred Retirement Option Plan (DROP) members<br />
now receive quarterly statements showing payments<br />
and accrued interest. Members <strong>of</strong> the Employees’<br />
Pension Plan now receive personalized benefit<br />
statements annually. The department now produces<br />
a semi-annual Retiree Newsletter.<br />
Parks & Recreation<br />
Parks<br />
The Parks Division had various landscaping projects<br />
that impacted the <strong>City</strong> in many different areas.<br />
These landscaping projects include Common<br />
Ground, Kelly Recreation Complex, Kryger Park,<br />
areas <strong>of</strong> Lake Mirror Park, Coleman Bush building<br />
and other right <strong>of</strong> way projects that enhanced the<br />
entrance ways into <strong>Lakeland</strong>.<br />
Current projects in development or construction<br />
include restroom renovations for Dobbins Park, Lake<br />
Parker Park and Southwest and Westside<br />
Complexes. A new boiler unit will be installed in the<br />
Minor League Clubhouse at Tigertown and all <strong>of</strong> the<br />
outfield wall pads at Marchant Stadium will be<br />
replaced. Another much needed project currently in<br />
progress is the structural repairs to Henley Field.<br />
D-21 Fiscal Year <strong>2010</strong> Annual Budget
Department Performance Levels<br />
Parks & Recreation (cont’d)<br />
Spring Training with the Detroit Tigers was highlighted<br />
with teams from other nations training at Tigertown for<br />
the World Baseball Classic. Tigertown played host to<br />
the Chinese National Team, Team Venezuela and<br />
Team Panama. Also, two weeks after Spring Training,<br />
Tigertown was host to Team Sweden for two weeks.<br />
Recreation<br />
Technology continues to be an important aspect <strong>of</strong> the<br />
Recreation Division’s success. Implementation <strong>of</strong><br />
online registration for tennis camp and swim lesson for<br />
the Beerman Family Tennis Center and the Aquatic<br />
Operations provided a higher level <strong>of</strong> customer service<br />
for our patrons and has been a huge success. 15% <strong>of</strong><br />
tennis participants registered on line, The Recreation<br />
division continues to improve the website. Video<br />
coverage <strong>of</strong> our facilities available for rent are now<br />
online.<br />
Newly renovated Kelly Recreation Center and Coleman<br />
Bush Building will provide additional space to<br />
accommodate increased customer usage and program<br />
opportunities for many years to come.<br />
Libraries<br />
Library staff strives to meet the needs <strong>of</strong> customers<br />
through delivery <strong>of</strong> library materials in a variety <strong>of</strong><br />
formats to include free access to online audio books<br />
and an expanded online video collection. Library use<br />
and Circulation statistics continue to rise system wide.<br />
Public access computers are consistently in high<br />
demand at all facilities and the elibrary South <strong>Lakeland</strong><br />
and the Main Library <strong>of</strong>fer free adult computer classes<br />
which focus on a range <strong>of</strong> basic computer skills to more<br />
in depth s<strong>of</strong>tware program instruction.<br />
FY2009, Library capital Improvement projects focused<br />
on technology through the replacement <strong>of</strong> current<br />
public access computers at both the Main Library and<br />
Larry R. Jackson Branch Library. Because the Friends<br />
<strong>of</strong> the Library <strong>of</strong> <strong>Lakeland</strong> purchased new computer<br />
furniture for the branch, a total <strong>of</strong> 24 public access<br />
workstations is now realized. The Library<br />
implemented a reservation s<strong>of</strong>tware system for<br />
computer sign up which helps monitor limits <strong>of</strong> time per<br />
user and allows customers to sign themselves up<br />
without staff intervention.<br />
Cemeteries<br />
The Cemeteries Division continues to provide a well<br />
maintained burial park for the citizens <strong>of</strong> <strong>Lakeland</strong>.<br />
Will continue successful maintenance contract for the<br />
Roselawn Cemetery Complex. Completed a land swap<br />
<strong>of</strong> 4.9 acres with Rogers Brothers <strong>of</strong> Highland <strong>City</strong>.<br />
Purchased a new 48 niche columbarium.<br />
Cleveland Heights Golf Club<br />
Activity at Cleveland Heights was down due to the<br />
economy for the current fiscal year as individuals<br />
experienced discretionary spending. Public play was<br />
down, but tournaments were down 40% from 2008.<br />
Memberships were down 20% from 2008 due to<br />
attrition and the economy.<br />
Eliminated the Accountant III position and under-filled<br />
with Office Associate II in the middle <strong>of</strong> the 2009<br />
budget.<br />
Higher fuel costs have impacted cost <strong>of</strong> goods and<br />
these costs are being passed on through higher menu<br />
prices.<br />
Human Resources<br />
Employee Relations<br />
114 employees graduated from the <strong>City</strong> University<br />
(<strong>City</strong>U) in FY2009; 111 <strong>City</strong>U classes were <strong>of</strong>fered, to<br />
which 1,320 employees attended. The 3rd and 4th<br />
Certified Public Manager classes will graduate 39<br />
employees in September <strong>of</strong> 2009. A COL CPM Alumni<br />
group was formed from the total <strong>of</strong> 60 CPM graduates<br />
to promote process and policy improvements and to<br />
serve as an internal “think tank” on citywide issues.<br />
Pay for Performance launched in its Beta Year<br />
citywide, with the exception <strong>of</strong> <strong>Lakeland</strong> Electric (LE)<br />
union positions although their evaluation materials are<br />
in development. Training has been provided to more<br />
than 159 supervisors to date through on-going P4P and<br />
Performance Evaluation Training. <strong>City</strong>wide briefings<br />
were provided prior to the “go live” date for all<br />
interested employees and through the Employee<br />
Association. <strong>City</strong>U School <strong>of</strong> Pr<strong>of</strong>essional Studies<br />
Office Pr<strong>of</strong>essional Certificate programs will launch in<br />
the fall <strong>of</strong> 2009 to support the training needs <strong>of</strong> our<br />
clerical staff citywide. Briefings and advisement<br />
D-22 Fiscal Year <strong>2010</strong> Annual Budget
Department Performance Levels<br />
Human Resources (cont’d)<br />
Information Technology (IT)<br />
sessions for those staff have been held and/or<br />
scheduled. Three Municipal Internships were provided<br />
and 5 COL participants were placed in the LEDC<br />
Summer Leadership Program.<br />
The Policy review team has reviewed and rewritten five<br />
policies which will be eventually submitted to<br />
management for approval. Support has been provided<br />
for every major <strong>City</strong> department during the year as well<br />
as the Rapid Process Improvement team. The support<br />
has included: meeting and/or department retreat<br />
facilitation; Individual Development Plan (IDP) training<br />
and development; presentation/video communication<br />
support; In-Site resource development; PeopleS<strong>of</strong>t and<br />
Pay for Performance (P4P) consultation, research and<br />
support; and specialized training.<br />
Two HR department retreats have been conducted to<br />
assist in uniting the department, improving upon<br />
service delivery and process improvement.<br />
Civil Service<br />
Civil Service continues in its effort to make our<br />
operation world class by updating, standardizing, and<br />
utilizing best practices with regards to our core<br />
responsibilities <strong>of</strong> selection, examination, qualification,<br />
registration, employment, promotion, as well as the<br />
oversight <strong>of</strong> the removal, suspension, demotion,<br />
reduction and discharge <strong>of</strong> employees within the Civil<br />
Service. Progress has been made towards our internal<br />
goals; our core service performance scores compare<br />
rather well in the Florida Benchmarking Consortium’s<br />
FY2008 report on Human Resources measures.<br />
Examples include top tier scores in average number <strong>of</strong><br />
days it takes to fill positions, employee retention and<br />
efficiency/cost <strong>of</strong> HR services. Additionally, we have<br />
instituted a new online/electronic application system<br />
with the help <strong>of</strong> our IT Department. The system is<br />
currently in use and allows efficient and accurate<br />
application processes without the need for labor<br />
intensive data entry, recovery, or analysis by our staff<br />
in Employment Services. Additionally, we move all<br />
newly generated Civil Service documents to electronic<br />
versions and moved approximately 15% <strong>of</strong> existing<br />
employee records to LibertyNet for ease <strong>of</strong> review and<br />
retrieval. Lastly, we have revamped several portions <strong>of</strong><br />
our website, have recruited more talent into our<br />
Assessment Services workgroup, are in the process <strong>of</strong><br />
reviewing how to best service our internal customers<br />
with a recruiting “toolkit”.<br />
There was a focus on project delivery in FY2009 with<br />
163 projects on the approved project plan as the<br />
FY2009 year began. As <strong>of</strong> July 2009 the plan has<br />
grown to 262 projects. 106 <strong>of</strong> these projects are<br />
complete, 63 are currently active, 13 were cancelled<br />
and 80 are pending. We are working closely with our<br />
business area customers to plan, schedule and<br />
complete work based on priority and business value.<br />
Our project management focus this year will be to<br />
ensure all available IT resources are focused on the<br />
highest priority work. Priority and work assignment will<br />
improve based on the quality <strong>of</strong> our plans early in the<br />
year. To ensure high quality, timely project delivery the<br />
IT Development Team is now led by three managers<br />
each focused on supporting their business customers.<br />
There are two Systems and Programming Managers<br />
and the Public Safety Manager. Project metrics were<br />
introduced with the goal <strong>of</strong> completing 22.5% <strong>of</strong> the<br />
base 163 planned projects each quarter. As <strong>of</strong> the end<br />
<strong>of</strong> the third quarter FY2009 74.8% <strong>of</strong> the base 163<br />
planned projects were complete. A productivity metric<br />
<strong>of</strong> 65% was introduced into the Application<br />
Development Division. At the end <strong>of</strong> the third quarter<br />
FY2009 this metric was tracking at 60%.<br />
Some very notable project implementations this year<br />
include the Tiburon 911 Computer Aided Dispatch<br />
system for both Police and Fire. This project went live<br />
in May 2009. The next phase for Records<br />
Management is planned to go live in early <strong>2010</strong>. As <strong>of</strong><br />
July, over 1400 phones have been converted to the<br />
new Voice over Internet Protocol (VoIP) switch and the<br />
remaining 400 phones should be complete by the end<br />
<strong>of</strong> August. Critical Data Center infrastructure<br />
improvements were completed including the installation<br />
<strong>of</strong> a new Uninterruptible Power Source (UPS) and new<br />
air conditioning (HVAC) systems. Upgrades to Oracle<br />
Financials, Colors and PeopleS<strong>of</strong>t were completed and<br />
the Maximo upgrade should be 60% complete by year<br />
end. UMS Dashboard was implemented as were<br />
numerous new UMS reports. New on-line functionality<br />
Did you know….<br />
<strong>Lakeland</strong> is ranked 20th by Bizjournals.com<br />
among the 2008 Growth Center Rankings<br />
measuring 5-year population, employment<br />
and income growth for the top 100 metro<br />
areas in the US<br />
D-23 Fiscal Year <strong>2010</strong> Annual Budget
Department Performance Levels<br />
IT (cont’d)<br />
for job applicants and on-line registration for Parks and<br />
Recreation programs, classes and activities were<br />
implemented. Infrastructure set-up, testing and support<br />
was provided for the red light camera (ATS) project.<br />
These are just a few <strong>of</strong> the 106 completed projects as<br />
<strong>of</strong> July.<br />
A significant concern for the Department <strong>of</strong> Information<br />
Technology is demand management. Our resources<br />
are limited and demand from our business customers<br />
for business automation and efficiencies from<br />
technology is growing. We are challenged to provide<br />
Key Service Indicators to our business customers, <strong>City</strong><br />
Management and our community that show quality<br />
work on the high priority items. Unfortunately we will<br />
not be staffed to meet all requests and many projects<br />
must be placed in the back-log. Another concern is the<br />
development <strong>of</strong> a financial planning process that<br />
establishes fair and transparent IT rates and IT<br />
expense allocation to all business departments. Every<br />
department is looking for efficiencies and we want to be<br />
a key player in finding solutions that work. We need to<br />
clearly show when additional investment in IT will<br />
provide an overall financial return for the <strong>City</strong>. And we<br />
must provide clear justification for required IT<br />
maintenance and support to prevent unnecessary risk<br />
and technology failure. This requires a trained and<br />
qualified staff and use <strong>of</strong> IT suppliers and contractors<br />
when necessary to supplement for unique skills and/or<br />
available hours to complete high priority work.<br />
The Department <strong>of</strong> Information Technology is<br />
committed to continue to raise the bar <strong>of</strong> our own<br />
performance and to provide high quality, timely support<br />
to our business customers. We understand the need to<br />
increase our efficiencies by teaming with other<br />
municipalities, using standard technologies and best<br />
practices and eliminating any waste through process<br />
improvement.<br />
Internal Audit<br />
During fiscal year 2009, the Internal Audit Department<br />
completed its significant commitment to the external<br />
auditors in the completion <strong>of</strong> the <strong>City</strong> <strong>of</strong> <strong>Lakeland</strong>’s<br />
annual CAFR audit. The department has scheduled<br />
and is in the process <strong>of</strong> reviewing several <strong>of</strong> the <strong>City</strong>’s<br />
operating processes including the UMS billing system,<br />
the Electric Department’s fuel hedging program and the<br />
unmetered street lighting system. Follow-up reviews<br />
have been scheduled for the Electric Department’s coal<br />
inventory and Public Works Construction and<br />
Maintenance’s supplies inventory. The Internal Audit<br />
Department served on the <strong>City</strong> <strong>of</strong> <strong>Lakeland</strong>’s Core<br />
Services Grading Committee, is a participating member<br />
<strong>of</strong> the Fleet Utilization Task Force and is serving as a<br />
resource in the conversion and implementation <strong>of</strong> the<br />
new purchasing card and asset management systems.<br />
The <strong>Lakeland</strong> Center (TLC)<br />
Through “Superior Events and Quality Entertainment”<br />
The <strong>Lakeland</strong> Center Management team continues<br />
efforts toward developing an event mix that will provide<br />
the community an entertaining and diverse mixture <strong>of</strong><br />
events for the entire <strong>Lakeland</strong> and Polk County<br />
community. As we deal with negative impacts from the<br />
sagging economy, we have continued to embrace a<br />
conservative business approach in order to eliminate or<br />
reduce most <strong>of</strong> the difficulties we could experience in<br />
developing new events. We are focusing on growing<br />
and maintaining returning events. Our approach<br />
presents an event schedule that considers the mood <strong>of</strong><br />
the community as well as the economy. We strive to<br />
bring some “life” into our mix and the community at the<br />
same time.<br />
An increase in rental rates and parking fees has had a<br />
very positive impact for TLC. While our total arena and<br />
theater events occupancy has decreased almost 19%<br />
for the past year from 514 days to 410 we have<br />
increased average revenue per event (for these two<br />
facilities) by 40%. This reflects our effort towards<br />
maximizing our revenue potential for each individual<br />
event. During the same period we experienced a<br />
reduction <strong>of</strong> almost 23% for occupancy / utilization <strong>of</strong><br />
the meeting and conference facilities. With the<br />
increase in rates we were successful in increasing the<br />
average rate for these facilities by almost 80%<br />
from .026 cents per sq. ft. to .047 cents per sq. ft.<br />
Despite the reduction in total events, we attracted<br />
slightly greater than 500,000 guests to TLC during the<br />
year. As a result <strong>of</strong> these efforts we increased total<br />
departmental income by almost 50%. Actual gross<br />
operating pr<strong>of</strong>it (before utilities) improved slight over<br />
$773,000. For the year, our operating loss (including<br />
utilities) was decreased by $928,000 over the previous<br />
year.<br />
TLC Marketing team has increased our email mailing<br />
list to a new high. At this point over 100,000 addresses<br />
are included in our data list. This provides us<br />
unprecedented exposure to present clients and<br />
potentially new clients like never before. The<br />
D-24 Fiscal Year <strong>2010</strong> Annual Budget
Department Performance Levels<br />
The <strong>Lakeland</strong> Center (cont’d)<br />
opportunity to turn past customers into repeating<br />
customers greatly enhances the chance for success<br />
for our shows as well as those <strong>of</strong> outside producers.<br />
The use <strong>of</strong> email, face book, tweeter and other similar<br />
social networks provides us an ongoing opportunity for<br />
sales and success. We continue to commit our<br />
resources to Marketing and Promotion at a level we<br />
feel will give us the required exposure to the West<br />
Central Florida and Polk County Market. Last year<br />
TLC received 3 ADDY awards recognizing their<br />
superior Marketing programs. Included was a Silver<br />
Award for the Series brochure. As a result <strong>of</strong><br />
economic conditions, meetings / conference planners<br />
continue to struggle with the “AIG effect”. In order to<br />
<strong>of</strong>fset this we developed a plan to focus our sales<br />
marketing on a regional level. This effort resulted in<br />
several new tradeshow and community events for the<br />
Center. Among these were: Spirit Sports Sunshine<br />
Shoot Out 2009 ( the largest cheer event the <strong>Lakeland</strong><br />
Center has booked to date). Previously held in<br />
Orlando, they are making their home in <strong>Lakeland</strong> for<br />
the next 5 years. The <strong>Lakeland</strong> Women’s Show – The<br />
first annual show was held in February 2009 and drew<br />
over 2,000 women who enjoyed over 80 exhibits,<br />
fashion shows, cooking and gardening demonstrations<br />
and more. This event is booked again for <strong>2010</strong> and<br />
2011 and has expanded to a 2-day show. The<br />
Pampered Chef will hold their Florida Regional<br />
Meeting in February <strong>2010</strong>, International<br />
Choreographed Ballroom Dance Association event will<br />
bring over 1,000 delegates to the <strong>Lakeland</strong> Center<br />
during their 4-day events in July 2011 and July 2014.<br />
Our website at www.thelakelandcenter.com has been<br />
overhauled in order to provide the latest and most<br />
accurate, information for our clients and patrons. 90%<br />
<strong>of</strong> the work to accomplish this renovation was<br />
provided by in-house staff at a considerable savings in<br />
time and budget.<br />
Our partnerships with Feld Entertainment to host,<br />
design, and build future Disney on Ice shows has<br />
been extended. We will continue to host this<br />
prestigious event through 2012. We also have hosted<br />
two openings for Disney Live shows during the past<br />
year in the Youkey Theater.<br />
Some significant event highlights for the past year<br />
were; the first appearance <strong>of</strong> Cirque Du Solei here in<br />
<strong>Lakeland</strong> for eight shows. We were asked to host an<br />
extended rehearsal for the national tour <strong>of</strong> Yannivoices.<br />
Return engagements by Larry the Cable Guy,<br />
Ron White and Bill Engval brought the blue collar<br />
comedy tours to our stage for six shows. Our<br />
entertainment events have provided us a viable hedge<br />
against the reduction in meetings and conference<br />
business.<br />
The TLC partnership with Polk County Sports<br />
Marketing continues to grow. During the past year we<br />
hosted a variety <strong>of</strong> sporting events including Florida<br />
Sunshine State games, the Southeast Fencing<br />
championships and a large number <strong>of</strong> smaller sports<br />
events. Co-op advertising with PCSM saved us<br />
$54,000 in our marketing budget. Our relationship with<br />
the Florida High School Athletic Association continues<br />
to expand with the addition <strong>of</strong> the state high school<br />
cheerleading championships set for <strong>2010</strong>. This<br />
reflects the positive experience FHSAA members, as<br />
well as their athletes, are finding here in <strong>Lakeland</strong>.<br />
Our operations team and engineers completed a wide<br />
variety <strong>of</strong> projects that serve to improve the readiness<br />
<strong>of</strong> our facilities as well as provide budget saving<br />
throughout the year. Among these has been the<br />
completion <strong>of</strong> the video security system, enhanced<br />
lighting systems in the Youkey Theater and overhaul<br />
<strong>of</strong> the sound system in the Jenkins Arena. In an effort<br />
to support the Green initiatives <strong>of</strong> the <strong>City</strong>, as well as<br />
TLC, we have partnered with Public Works in order to<br />
replace all <strong>of</strong> the inefficient commodes, urinals and<br />
sinks, within the TLC facilities.<br />
Finance<br />
After restructuring the <strong>City</strong>’s pooled investment<br />
portfolio in FY2007 and FY2008 the Finance<br />
Department has continued to actively manage these<br />
funds consistent with investment guidelines adopted<br />
by the <strong>City</strong> Commission. During FY2008 and FY2009,<br />
returns on the pooled investment portfolio have<br />
exceeded the mandated benchmark target by over<br />
$20 million, generating significant additional resources<br />
to help support <strong>City</strong> operations.<br />
Participated in the selection <strong>of</strong> new banking vendor.<br />
The scope <strong>of</strong> this project was to identify a vendor that<br />
could provide the necessary banking services to fit the<br />
needs to the <strong>City</strong> at the most economical price.<br />
D-25 Fiscal Year <strong>2010</strong> Annual Budget
Department Performance Levels<br />
Finance (cont’d)<br />
Participated with <strong>Lakeland</strong> Electric Customer Service<br />
as part <strong>of</strong> a project to develop, plan and implement<br />
additional payment processes and options for Electric<br />
customers. The scope <strong>of</strong> this project was to identify<br />
and implement alternative payment options for<br />
<strong>Lakeland</strong> Electric customers due to the closing <strong>of</strong> the<br />
walk-in payment operation.<br />
Completed audit requirements associated with the<br />
issuance <strong>of</strong> the <strong>City</strong>’s Comprehensive Annual<br />
Financial Report along with the audit requirements<br />
associated with state and federal assistance awarded<br />
to the <strong>City</strong>. The <strong>City</strong> was awarded a Certificate <strong>of</strong><br />
Excellence in Financial Reporting from the<br />
Government Finance Officers’ Association (GFOA).<br />
The process <strong>of</strong> billing and collecting insurance benefit<br />
premiums has moved from the Payroll Office to<br />
Finance-Customer Billing. There was a great deal <strong>of</strong><br />
work involved in moving this function including<br />
reconciliation and verification <strong>of</strong> dollars owed for an<br />
individual and the proper coverage that should be<br />
billed. The customer now receives a formal monthly<br />
invoice indicating coverage. All customers were<br />
informed that penalties and possible third party<br />
collection would result in securing payment.<br />
Automation has been put in place allowing reminder<br />
letters to be sent to the customer after day 30.<br />
Implemented and deployed Dashboard to the Water<br />
Department. This system allows for a view <strong>of</strong> the<br />
various statistics that Water Management requested<br />
to see on their display. It is graphical in nature and<br />
allows the various individuals to see a variety <strong>of</strong><br />
information including: meter sets, revenue dollars,<br />
impact fees, backflows, etc. The Dashboard<br />
implementation and design for Water is the most<br />
complex thus far and pushed the limits <strong>of</strong> the<br />
application. It is hopeful that we will have Dashboard<br />
implemented for Finance Customer Billing in the<br />
coming year.<br />
improvements were made that increased efficiency<br />
and will continue to save time in the processing <strong>of</strong> AP<br />
related documents.<br />
In the past fiscal year, AP assisted in the<br />
implementation <strong>of</strong> a new Purchasing Card (P-Card)<br />
system which is an internet-based product <strong>of</strong> Bank <strong>of</strong><br />
America. The new system provides enhanced<br />
monitoring and control over the <strong>City</strong>’s P-Cards and<br />
<strong>of</strong>fers reporting capabilities that are near “real time”<br />
allowing Finance to better monitor P-Card activity and<br />
to reconcile more quickly.<br />
Public Works (PW)<br />
Directors Office<br />
Completed construction <strong>of</strong> Fairbanks Street<br />
Improvements project.<br />
Completed property acquisition for the Lake<br />
Gibson Southwest Outfall project.<br />
Acquired parcel for Pond Site K on the Lake<br />
Parker Southwest Drainage Basin project.<br />
Commenced the Wabash Avenue PD&E Study.<br />
Commenced study on signal improvements to the<br />
County Line Road/I-4 interchange.<br />
Commenced design for the four-lane widening <strong>of</strong><br />
SR 33 between Jenkins Nissan and Melody Lane.<br />
Finance Customer Billing is the contact for customers<br />
wishing to come into the <strong>of</strong>fice to request an appeal <strong>of</strong><br />
a red light ticket or to ask general questions. It is<br />
anticipated that we may become involved in<br />
collections and lien assessment <strong>of</strong> personal property.<br />
There is an average <strong>of</strong> 52 per month.<br />
Did you know…..<br />
<strong>Lakeland</strong> was ranked #17 by MSN.com<br />
Real Estate “66 Cities where buying<br />
makes sense”, July 2008<br />
Accounts Payable (AP) participated in a Rapid<br />
Process Improvement (RPI) associated with the<br />
processing <strong>of</strong> requisitions. As a result, several<br />
D-26 Fiscal Year <strong>2010</strong> Annual Budget
Department Performance Levels<br />
Public Works (cont’d)<br />
Directors Office<br />
Implemented RouteSmart automated batch<br />
process used daily by Bulk waste collection<br />
drivers. Organizes collection order based on<br />
location and drive time previously performed<br />
manually.<br />
Developed applications for Lakes and<br />
Stormwater and Engineering to track NPDES<br />
and Stormwater Inspection details.<br />
Implemented iMaint (Fleet’s work order<br />
application) for the <strong>Lakeland</strong> Fire Department.<br />
Engineering Division<br />
<br />
<br />
<br />
<br />
<br />
<br />
<br />
<br />
<br />
Completed design and permitting services for the<br />
improvements <strong>of</strong> Carpenters Way from<br />
Corporate Avenue to Wedgewood Estates<br />
Boulevard.<br />
Completed design <strong>of</strong> the following sidewalk<br />
projects: W. Highland Drive from S. Florida<br />
Avenue to Old Road 37, Central Avenue from<br />
Sikes Boulevard to Ruby Street and Crystal Lake<br />
Drive from New Jersey Road to Lake<br />
Hollingsworth Drive.<br />
Developed conceptual plan/preliminary design <strong>of</strong><br />
the Lake Hollingsworth Shoreline Restoration<br />
Project at the <strong>Lakeland</strong> Yacht Club.<br />
Completed an audit with FEMA improving the<br />
<strong>City</strong>’s rating from Class 8 to Class 7 in the<br />
National Flood Insurance Program Community<br />
Rating System.<br />
Processed and issued 274 right-<strong>of</strong>-way use<br />
permits.<br />
Reviewed 50 conceptual site plans for the<br />
Development Review Team (DRT).<br />
Reviewed 114 commercial site plan submittals<br />
and 6 subdivision plats and site construction plan<br />
submittals.<br />
Inspected and recertified 20 SWFWMD permits<br />
for 20 <strong>City</strong> stormwater retention facilities.<br />
Completed neighborhood coordination, design,<br />
public meetings and surveys <strong>of</strong> the following<br />
traffic calming projects: W. Henderson Circle<br />
from Lincoln Avenue to Oppitz Lane, Elgin Street<br />
from Main Street to Fern Road and Crawford<br />
Street from MLK Boulevard to N. Florida Avenue.<br />
Construction and Maintenance<br />
<br />
Construction projects completed: Lake Parker<br />
Avenue Outfall; Lime Street Streetscape and two<br />
-way Conversion; Ingraham Avenue Brick Street<br />
Restoration; Massachusetts Avenue and Plum<br />
Street storm sewer retr<strong>of</strong>it; North Florida Avenue<br />
median and streetscape installation at Oak Street<br />
New sidewalk construction (linear feet) – 1256<br />
Lakeshore Drive (Parker Street to Memorial<br />
Boulevard), W. Highland Drive (S. Florida<br />
Avenue to Old Road 37) and N. Missouri<br />
Avenue (adjacent to Citrus Connection bus<br />
terminal)<br />
Paving <strong>of</strong> dirt alleys (sq. yards) – 4,665<br />
Resurfacing (sq. yards) – 391,112<br />
Street sweeping (lane miles) – 8070<br />
Sidewalk repairs (sq. feet) – 68,140<br />
Storm sewer pipe cleaning (linear feet) – 28,212<br />
Traffic Operations<br />
<br />
<br />
<br />
<br />
<br />
<br />
<br />
<br />
Rebuilt traffic signal at Edgewood Drive and<br />
<strong>Lakeland</strong> Highlands Road.<br />
Rebuilt traffic signal at Lime Street and S. Florida<br />
Avenue.<br />
Upgraded 13 and installed 1 new solar powered,<br />
pager controlled school zone flashers.<br />
Upgraded 9 intersections in the CBD with new<br />
cable and rigid mounted signals.<br />
Upgraded 128 pedestrian signals within the CBD<br />
to new countdown pedestrian signals.<br />
Upgraded pedestrian crosswalk flashers on<br />
Edgewood Drive and Gary Road to solar<br />
powered, dual flashers.<br />
Installed new external UPS at Edgewood Drive<br />
and Cleveland Heights Boulevard traffic signal.<br />
Completed upgrade <strong>of</strong> street name signage on<br />
185 intersections to new ADA standards for<br />
lettering height.<br />
Did you know….<br />
The Atlantic Coast Line Railroad<br />
team from <strong>Lakeland</strong> were declared<br />
state baseball champions in 1909.<br />
<br />
Brick crosswalk construction - Kentucky and<br />
Tennessee Avenue at Oak and Lemon Street<br />
intersections.<br />
D-27 Fiscal Year <strong>2010</strong> Annual Budget
Department Performance Levels<br />
Public Works (cont’d)<br />
Traffic Operations<br />
<br />
<br />
Commenced upgrade <strong>of</strong> warning and regulatory<br />
signage to new Federal Highway Administration<br />
standards; 710 signs replaced.<br />
Completed traffic studies at 289 locations.<br />
Facilities Maintenance<br />
Completed the Coleman Bush Community Center<br />
remodeling/addition project.<br />
Added an additional examination room at the<br />
HealthStat facility.<br />
Completed the concrete protective coating<br />
warranty work on the seating area at Joker<br />
Marchant Stadium.<br />
Installed guard rails, completed sidewalk repairs<br />
and recoated the stands at Bryant Stadium.<br />
Painted the interior and exterior <strong>of</strong> the Kelly<br />
Recreation Center.<br />
Painted the interior and exterior <strong>of</strong> the <strong>Lakeland</strong><br />
Train Station.<br />
Painted Bryant Stadium and Henley Field<br />
facilities.<br />
Completed structural and coating repairs at the<br />
<br />
<br />
<br />
Main and Orange Street Parking Garages.<br />
Replaced the chiller units and upgraded the<br />
building automation system at the <strong>Lakeland</strong><br />
Electric Administration Building.<br />
Completed the LPD Impound remodeling project.<br />
Replaced the main Uninterrupted Power Supply<br />
(UPS) unit at <strong>City</strong> Hall Data Center.<br />
Lakes and Stormwater<br />
Commenced construction <strong>of</strong> the Lake<br />
Hollingsworth Westside Stormwater Treatment<br />
Project.<br />
<br />
Continued NPDES-MS4 Permit compliance with<br />
no deficiencies found during annual report review.<br />
Secured grant funding in the amount <strong>of</strong> $562,896<br />
for Lakes and Stormwater projects.<br />
Conducted environmental presentations for 4700<br />
students from <strong>Lakeland</strong> area schools.<br />
<br />
<br />
Launched the “Don’t Feed the Algae” stormwater<br />
pollution prevention awareness campaign.<br />
Completed in-house assessment <strong>of</strong> the <strong>City</strong>’s<br />
lakes sampling SOPs and laboratory QA/QC<br />
program. Recommendations for changes will<br />
have pr<strong>of</strong>ound impacts on both the accuracy and<br />
precision <strong>of</strong> the data generated.<br />
Solid Waste<br />
<br />
<br />
<br />
Completed Solid Waste Collection Alternatives<br />
Assessment Study; findings and<br />
recommendations presented to <strong>City</strong> Commission<br />
in June, 2009.<br />
Completed renovations to the Solid Waste Wash<br />
Bay project.<br />
Continued to enhance the financial stability <strong>of</strong> the<br />
Solid Waste Management Fund adding to the<br />
FY2008 unappropriated surplus balance with no<br />
fee increases for service anticipated in FY<strong>2010</strong>.<br />
Fleet Management<br />
Established a Fleet Utilization Management<br />
Program and associated committee to administer<br />
vehicle replacement, policy and fleet size for<br />
maximum cost and operational effectiveness.<br />
<br />
<br />
Established a <strong>City</strong> Hall Vehicle Pool to facilitate<br />
fleet right-sizing by providing city vehicle access<br />
to <strong>City</strong> Hall staff without making additional vehicle<br />
purchases.<br />
Applied utilization standards established within the<br />
Fleet Utilization Management Program <strong>City</strong>-wide<br />
to all Fleet Management maintained vehicles.<br />
Identified vehicles for disposal, which will result in<br />
a reduced vehicle fleet with no degradation <strong>of</strong> <strong>City</strong><br />
services.<br />
Risk Management<br />
<br />
<br />
Continue to reach out to the community and other<br />
entities to share and provide safety training<br />
opportunities. Additional outreach opportunities<br />
have been specific to the <strong>City</strong>’s on-site Employee<br />
Wellness Clinic, whose benefit and physical<br />
structure continues to be reviewed by other cities,<br />
school boards and private corporations.<br />
Continues to improve upon employee wellness<br />
initiatives through the <strong>City</strong>’s on-site wellness<br />
clinic, annual wellness calendar, seminars, free<br />
screenings and educational information which is<br />
distributed.<br />
D-28 Fiscal Year <strong>2010</strong> Annual Budget
Department Performance Levels<br />
Risk Management (cont’d)<br />
<br />
Held annual employees’ safety fair, which was<br />
attended by 712 employees. This fair affords<br />
employees the opportunity to maintain compliance<br />
with their safety training requirements. In addition,<br />
have provided 52 safety related classes for <strong>City</strong><br />
employees, local government entities and the<br />
Chamber <strong>of</strong> Commerce.<br />
Organized the formation <strong>of</strong> an Employees’<br />
Security Committee, whose focus is to improve the<br />
overall safety <strong>of</strong> the <strong>City</strong>’s employees both in and<br />
out <strong>of</strong> the workplace by providing awareness<br />
training, coordinating the overall implementation <strong>of</strong><br />
security devices, as well as other ongoing projects.<br />
<br />
<br />
<br />
<br />
Recovered $646,009 through the <strong>City</strong> Health<br />
Plan’s Pharmacy Rebate Program, Stop Loss<br />
Insurance, Medical Subsidy reimbursement, Third<br />
Party Liability Subrogation and Step Therapy<br />
Program.<br />
Maintained the same <strong>City</strong> Workers’ Compensation<br />
Experience Modification <strong>of</strong> 0.80, which was the<br />
lowest when compared to 5 other entities, who are<br />
similar in employee size and whose modifications<br />
ranged from 0.87 to 1.18.<br />
Lowered through the <strong>of</strong>fering <strong>of</strong> the <strong>City</strong>’s<br />
Employee Wellness Clinic as <strong>of</strong> August 2007,<br />
medical claims for each participant by 1.41%.<br />
Solicited and participated in two Rapid Process<br />
Improvement (RPI) projects, which have<br />
culminated in improvements in both the annual<br />
employee and retiree benefit enrollment process,<br />
as well as the control and disbursement <strong>of</strong> the<br />
<strong>City</strong>’s warehouse inventory.<br />
Managed 739 auto, general and workers’<br />
compensation claims.<br />
Purchasing<br />
<br />
<br />
Continued its improvement program with vendors<br />
and suppliers by conducting a Vendor Focus<br />
Group meeting in April, 2009.<br />
Conducted two bid solicitations utilizing the<br />
Reverse Auction process which resulted in a<br />
savings <strong>of</strong> over $48,000.<br />
Communications<br />
The <strong>City</strong> <strong>of</strong> <strong>Lakeland</strong> has a very large range <strong>of</strong><br />
responsibilities to its citizens and employees. Effective<br />
communication can help identify needs and provide<br />
solutions. A coordinated communication effort allows<br />
citizens and employees to gain a clearer<br />
understanding <strong>of</strong> the organization and the services<br />
provided by the <strong>City</strong> <strong>of</strong> <strong>Lakeland</strong>.<br />
The <strong>City</strong> <strong>of</strong> <strong>Lakeland</strong> has many audiences and<br />
reaching those audiences <strong>of</strong>ten requires a variety <strong>of</strong><br />
communication channels and techniques. For FY2009<br />
and continuing in FY<strong>2010</strong>, the <strong>City</strong> <strong>of</strong> <strong>Lakeland</strong> has<br />
focused heavily on electronic media through the<br />
operation <strong>of</strong> the <strong>City</strong>’s government access television<br />
station, the <strong>City</strong>’s website and the <strong>City</strong>’s intranet.<br />
LGN, the <strong>City</strong> <strong>of</strong> <strong>Lakeland</strong>’s government access<br />
television station produced and broadcast 96 live<br />
meetings on Bright House Networks channel 615 and<br />
on Verizon FiOS channel 43. These live meetings<br />
include <strong>City</strong> Commission, Utility Committee, Planning<br />
and Zoning, Code Enforcement, Code Enforcement<br />
Hearing Officers and Zoning Board <strong>of</strong> Adjustment and<br />
Appeals. The Communications Department produced<br />
and aired seven live specially called meetings that<br />
included Budget Workshops, the Citizens Academy<br />
series and the Connectivity Summit.<br />
The Communications Department produced and<br />
posted 47 separate video segments that have aired on<br />
LGN and for webcast on the internet. The <strong>City</strong>’s<br />
internet features a video on demand section where all<br />
live meetings and specially produced shows can be<br />
viewed in the comfort <strong>of</strong> one’s home or business. The<br />
<strong>City</strong> will launch an improved website for FY<strong>2010</strong> that<br />
will include many new features including imbedded<br />
video, interactive calendars, special call-out boxes and<br />
an area that will feature the latest news releases.<br />
The <strong>City</strong> <strong>of</strong> <strong>Lakeland</strong> launched In-Site, the <strong>City</strong>’s<br />
intranet in FY2008. The site has proven to be a very<br />
effective internal communications tool that is used<br />
quite heavily by <strong>City</strong> <strong>of</strong> <strong>Lakeland</strong> employees. The site<br />
includes the latest information regarding <strong>City</strong> initiatives<br />
targeting employees. It has received over 1.7 million<br />
visits during the past calendar year. A very popular<br />
area on the site that allows employees to ask <strong>City</strong><br />
Administration questions allows issues to be<br />
addressed directly by upper <strong>City</strong> management. This<br />
forum has received 187,578 hits and the job postings<br />
on In-Site have received 79,058 hits. New to In-Site<br />
for FY<strong>2010</strong> is an employee directory complete with<br />
photos and contact information.<br />
The <strong>City</strong> is in the process <strong>of</strong> launching its Face Book<br />
(FB) and Twitter pages. Social media is growing and<br />
this new form <strong>of</strong> media allows the <strong>City</strong> <strong>of</strong> <strong>Lakeland</strong> to<br />
share its message to those who choose to be fans and<br />
followers. Become a fan <strong>of</strong> the <strong>City</strong> <strong>of</strong> <strong>Lakeland</strong> by<br />
logging on to your FB page and searching: <strong>City</strong> <strong>of</strong><br />
<strong>Lakeland</strong>, FL.<br />
D-29 Fiscal Year <strong>2010</strong> Annual Budget
Department Performance Levels<br />
Fire<br />
Implemented EMD/Medical Priority Dispatch<br />
System to better identify and separate Advanced<br />
Life Support and Basic Life Support medical calls.<br />
The program has reduced emergency medical<br />
runs by approximately 30%.<br />
<br />
<br />
<br />
Graduated three firefighters from paramedic<br />
school. Ten additional firefighters have applied<br />
for FY<strong>2010</strong>. Five have been accepted and five<br />
are currently awaiting application acceptance.<br />
Facilitated installation and training <strong>of</strong> a new<br />
Tiburon computer-aided dispatch and fire records<br />
management system. The process included<br />
developing dispatch response protocols,<br />
apparatus selection and recommendation and file<br />
maintenance.<br />
Conducted a second Aircraft Rescue Firefighting<br />
(ARFF) class to address personnel changes at<br />
<strong>Lakeland</strong>-Linder Regional Airport. Transferred<br />
responsibility for ongoing ARFF training from the<br />
Administration Division to the Training Division.<br />
Placed three training lieutenants back on shift to<br />
better address minimum manning issues.<br />
The Training Division completed a departmentwide<br />
Emergency Vehicle Operations course on<br />
rescue units, fire engines and aerial apparatus<br />
(ladder trucks). This training satisfied both the<br />
Insurance Services Office, as well as the National<br />
Fire Protection 1002 requirements.<br />
Capital Improvement Project purchases for<br />
<br />
<br />
FY2009:<br />
<br />
<br />
55-foot Pierce Skyboom fire engine to<br />
replace a 1994 55-foot Pierce Tele-Squirt<br />
at our Beacon/South Florida Avenue fire<br />
station.<br />
A Pierce Contender rescue truck to<br />
replace a 2004 Pierce Contender rescue<br />
at Station 6 (5050 Highway 33).<br />
LFD Paramedic Preceptors, in a joint agreement<br />
with Polk State College, provided EMT/Paramedic<br />
training on duty for <strong>Lakeland</strong> Fire Department<br />
paramedic students.<br />
<strong>Lakeland</strong> Fire Department Pay for Performance<br />
Committee continued to work in FY2009, in<br />
partnership with Human Resources and <strong>City</strong> <strong>of</strong><br />
<strong>Lakeland</strong> Training, to ensure the value, quality<br />
and accuracy <strong>of</strong> the new PPR system be<br />
maintained.<br />
Water Utility<br />
The Water Utility provides drinking water, fire<br />
protection, water conservation and environmental<br />
protection services for approximately 165,000 people<br />
through 55,000 metered accounts and plans for the<br />
community’s future needs. Water services contribute<br />
to both the quality <strong>of</strong> life and the prosperity <strong>of</strong><br />
<strong>Lakeland</strong>’s economy.<br />
Water services are among the highest priority<br />
municipal programs and meets key objectives through<br />
its various services and projects including:<br />
<br />
Efficient water supply services at $3.04 per<br />
1,000 gallons (predicted average annual<br />
volume <strong>of</strong> 23.75 million gallons per day)<br />
Competitive wastewater management<br />
services at $5.19 per 1,000 gallons (predicted<br />
average annual volume <strong>of</strong> 10.5 million gallons<br />
per day)<br />
<br />
<br />
Continuing promotion <strong>of</strong> water conservation<br />
through retr<strong>of</strong>its, education and<br />
communication<br />
Maintenance <strong>of</strong> utility asset condition through<br />
ongoing replacement and rehabilitation<br />
Management <strong>of</strong> an estimated $38.6 million capital<br />
improvement budget which includes:<br />
<strong>2010</strong> completion <strong>of</strong> the Southwest <strong>Lakeland</strong><br />
Capacity Project (English Oaks)<br />
2009 startup <strong>of</strong> West <strong>Lakeland</strong> Pretreatment<br />
Plant<br />
Emergency electric generation improvements<br />
at Williams Water Plant<br />
Replacement <strong>of</strong> obsolete Williams Water<br />
Plant’s process control system<br />
Disinfection methods study for all treatment<br />
plants to resolve gas chlorine concerns<br />
Optimization <strong>of</strong> financial and other resources<br />
including:<br />
Initiate rate and impact fee study to fairly and<br />
adequately recover service costs<br />
Onsite power generation using waste<br />
methane gas at Glendale Plant<br />
Improved electric efficiency for Northeast well<br />
field pumps<br />
Prioritization <strong>of</strong> capital projects/spending<br />
Use <strong>of</strong> low-interest loans to minimize<br />
financing expenses<br />
Evaluation <strong>of</strong> sludge disposal methods and<br />
practices-lowered costs<br />
D-30 Fiscal Year <strong>2010</strong> Annual Budget
Department Performance Levels<br />
Community Development<br />
Planning (Current and Long-range)<br />
Staff reviewed and processed eight large scale<br />
comprehensive plan amendments including the <strong>City</strong>’s<br />
required annual update to the Capital Improvements<br />
Program and Capital Improvements Element. These<br />
changes addressed assigning land use to a key future<br />
gateway to the <strong>City</strong> <strong>of</strong>f Swindell Road and adjusting<br />
criteria for future business park land uses to allow<br />
hotels as a “by right” use not limited to the cap on<br />
associated retail. Staff worked with a consultant on<br />
Transportation Element updates that included a<br />
significant new Pathways Plan for the <strong>City</strong> with<br />
prioritized improvements to assist in future funding<br />
selection. Another update involved development <strong>of</strong><br />
roadway “typologies” which are essentially a typical<br />
cross section view <strong>of</strong> roadways that include multiple<br />
modes <strong>of</strong> transportation (bike, pedestrians, transit), onstreet<br />
parking and medians. These typologies vary by<br />
geographic area <strong>of</strong> the city and by roadway functional<br />
classification and will serve as a basis from which to<br />
work with the drafting <strong>of</strong> a citywide form-based land<br />
development code as discussed below.<br />
Several transportation related initiatives were begun<br />
including a Project Development & Environmental<br />
(PD&E) study for what has been known as the Wabash<br />
Extension from the Polk Parkway north to Ariana<br />
Street. A related study for a westward extension <strong>of</strong><br />
Beacon Rd was also initiated. A major PD&E study<br />
was initiated as relates to the federal stimulus dollar<br />
funded project for the East-West Williams/USF<br />
Connector Roadway, connecting SR 33 on the west<br />
with USF on the East. This PD&E must meet federal<br />
(NEPA) standards for public involvement and<br />
environmental analysis. Other transportation initiatives<br />
included extensive work with the transit provider, Citrus<br />
Connection, and the FDOT regarding transit shelter<br />
design standards especially in light <strong>of</strong> the city-transit<br />
provider cooperation for the installation <strong>of</strong> shelters<br />
under the corporate-sponsored bus shelter program.<br />
Staff also applied for state grant funding for a<br />
signalization project at County Line Rd. and Interstate 4<br />
and was awarded over $1 million. Similarly staff has<br />
submitted an application for State/TPO funding for a<br />
pathways project on Interlachen Blvd.<br />
Staff worked extensively last fiscal year with the<br />
<strong>Lakeland</strong> Vision non-pr<strong>of</strong>it group to promote public<br />
participation in an effort to update the 10 year old<br />
Vision document and to gather ideas and priorities on<br />
relevant topics to the comprehensive plan and future<br />
land development regulations such as public<br />
transportation, green building, water conservation,<br />
infrastructure and general growth management,<br />
downtown revitalization and economic development.<br />
<strong>Lakeland</strong> Vision’s six idea gathering meetings and<br />
several goal and priority setting meetings were held all<br />
over the <strong>Lakeland</strong> metro area and supplemented the<br />
Division’s on-line growth management survey, the<br />
results <strong>of</strong> which emerged in October 2008 at a table<br />
mapping exercise referred to as “Mapping the Future.”<br />
The public involvement and outreach process<br />
supported the drafting <strong>of</strong> the <strong>City</strong>’s second ever<br />
Evaluation and Appraisal Report (EAR) for the<br />
<strong>Lakeland</strong> Comprehensive Plan. In completing the<br />
EAR, staff performed an in-depth analysis and update<br />
<strong>of</strong> the Existing Land Use Map, Vacant Lands Analysis,<br />
Plan Objectives Analysis, Rule Change Analysis and<br />
an examination <strong>of</strong> Major Issues for the <strong>City</strong>.<br />
Recommendations were made for changes to the <strong>City</strong>’s<br />
Comprehensive Plan based upon the EAR analyses.<br />
The EAR will be formally adopted prior to the end <strong>of</strong> the<br />
fiscal year and be followed by a year or more process<br />
to update the <strong>City</strong>’s Comprehensive Plan to a <strong>2010</strong>-<br />
2020 plan document.<br />
In this fiscal year, work commenced on the second <strong>of</strong><br />
nine proposed sector plans. This plan, covering the<br />
greater Downtown area, will be coordinated with a<br />
separate plan update for the Downtown CRA. The<br />
sector plan will consolidate previous studies, reports<br />
and plans into a more meaningful whole and will<br />
express guiding principles and implementation steps<br />
focused on land use, physical vision, infrastructure and<br />
governance. Sector plans are intended to help avoid<br />
land use conflicts, promote quality urban design,<br />
develop estimates <strong>of</strong> future public infrastructure needs<br />
and update the <strong>City</strong>’s Comprehensive Plan.<br />
Significant progress was made in the effort to write a<br />
Form-Based Code. A synoptic survey <strong>of</strong> representative<br />
areas within each <strong>of</strong> the proposed design districts was<br />
completed and the framework <strong>of</strong> the hybrid code was<br />
taking shape as staff and the consultant work to<br />
integrate the land use rules <strong>of</strong> the existing zoning<br />
districts with the urban design criteria <strong>of</strong> the design<br />
districts. By the end <strong>of</strong> the fiscal year, we expect to<br />
have a detailed set <strong>of</strong> block-level and site-level<br />
development standards completed. Work on proposed<br />
street type standards for the Form-Based Code was<br />
coordinated with new roadway typologies proposed as<br />
part <strong>of</strong> the update <strong>of</strong> the Transportation Element <strong>of</strong> the<br />
Comprehensive Plan.<br />
D-31 Fiscal Year <strong>2010</strong> Annual Budget
Department Performance Levels<br />
Community Development (cont’d)<br />
Economic Development<br />
Since receiving Florida Enterprise Zone designation in<br />
January 2006, the <strong>City</strong>’s Economic Development<br />
Coordinator has been busy promoting this new<br />
program. In FY2009 approximately 50 sales tax refund<br />
applications were submitted to the Florida Department<br />
<strong>of</strong> Revenue on behalf <strong>of</strong> local businesses utilizing<br />
various incentives <strong>of</strong>fered through this State-funded<br />
initiative. Since receiving this designation, <strong>Lakeland</strong>’s<br />
Enterprise Zone development agency has processed<br />
more than $200,000 in financial incentives.<br />
Building Permitting and Inspection<br />
For the third year in a row new building activity declined<br />
from the record-setting year in FY2006. Based on the<br />
first six months <strong>of</strong> FY2009 it is estimated that the<br />
number <strong>of</strong> total building permits will be down 32% and<br />
the valuation <strong>of</strong> permits issued will be 67% less than<br />
last year, reflecting a notable shift from new<br />
construction to the expansion and remodel <strong>of</strong> existing<br />
buildings. During that same timeframe 80 new singlefamily<br />
permits have been issued, a decline <strong>of</strong><br />
approximately 25% from FY2008. The net result is<br />
anticipated to be a 51% decrease in total fees collected<br />
for permits and inspections, causing the Building<br />
Inspection Division to restructure its operations and<br />
downsize their staff. Additional operational efficiencies<br />
will continued to be explored in order to maintain an<br />
acceptable level <strong>of</strong> service in light <strong>of</strong> this continued<br />
downturn in building activity.<br />
Neighborhood Services<br />
Since May 2008 the formerly separate Housing and<br />
Code Enforcement Divisions have functioned as a<br />
single Neighborhood Services Division, focusing efforts<br />
on neighborhood redevelopment and capitalizing on<br />
technology and process improvements to deliver<br />
prompt, reliable service to customers. In February<br />
2009 renovation <strong>of</strong> the Division’s <strong>of</strong>fices at the<br />
Coleman-Bush Community Center was completed.<br />
Housing<br />
The housing crisis and state <strong>of</strong> the overall economy<br />
continued to impact the Housing Section’s budget and<br />
programs in FY2009. In late 2008, and in an effort to<br />
reduce the pr<strong>of</strong>ound impact <strong>of</strong> foreclosures and<br />
abandoned homes on neighborhoods, the U.S.<br />
Department <strong>of</strong> Housing and Urban Development (HUD)<br />
launched the Neighborhood Stabilization Program<br />
(NSP) as part <strong>of</strong> the Housing and Economic Recovery<br />
Act <strong>of</strong> 2008. The Housing Section submitted the plan<br />
application for approximately $2 million in NSP funding,<br />
and continues to work with HUD to begin the<br />
evaluation, appraisal and purchase components <strong>of</strong> the<br />
program.<br />
Faced with record revenue shortfalls during the 2009<br />
session the Florida Legislature appropriated<br />
approximately $123 million from the Sadowski<br />
Affordable Housing Trust Fund to general government,<br />
leaving the State Housing Initiatives Partnership (SHIP)<br />
unfunded for the first time since it was created in 1992.<br />
Locally, SHIP accounts for approximately $842,000, or<br />
40 percent <strong>of</strong> the <strong>City</strong>’s funding dedicated to<br />
development and preservation <strong>of</strong> affordable housing.<br />
Housing did not go completely unfunded by the State,<br />
however, as approximately $30 million ($95,280 to<br />
<strong>Lakeland</strong>) was appropriated for the Florida Homebuyer<br />
Opportunity Program (FHOP), which is designed to<br />
provide subordinate home purchase assistance to<br />
those eligible to claim the federal first-time homebuyer<br />
tax credit.<br />
In early Summer 2009 the <strong>City</strong> Commission approved<br />
reinvestment <strong>of</strong> $295,000 in Community Development<br />
Block Grant (CDBG) funding in the renovation <strong>of</strong> the<br />
132-unit Lakewood Terrace Apartments. Total<br />
development cost for the project is approximately $9.6<br />
million, which when completed will result in a 100<br />
percent project-based Section 8 family community with<br />
20 percent <strong>of</strong> the units set-aside for families whose<br />
incomes are at or below 45 percent <strong>of</strong> Area Median<br />
Income (AMI), and the remaining units reserved for<br />
families with incomes at or below 60 percent AMI. The<br />
<strong>City</strong>’s reinvestment will help assure that the units are<br />
maintained in good repair and will further ensure that<br />
the project remains affordable for the next 30 years.<br />
Despite funding challenges, the Housing Section<br />
continues to provide rehabilitation assistance to income<br />
qualified occupant-owners <strong>of</strong> single-family housing and<br />
in 2009 made several changes aimed at improving<br />
efficiency and saving program dollars.<br />
First, the staff automated the rehab bid process,<br />
posting jobs on the <strong>City</strong>’s website and notifying<br />
qualified contractors <strong>of</strong> those jobs via email. Second,<br />
the framework was developed to begin imaging the<br />
Housing Section’s program files into LibertyNET.<br />
Finally, and as direct result <strong>of</strong> reduced funding for<br />
rehabilitation activities, the staff adjusted the type and<br />
D-32 Fiscal Year <strong>2010</strong> Annual Budget
Department Performance Levels<br />
Community Development (cont’d)<br />
degree <strong>of</strong> rehabilitation which would necessitate<br />
client relocation assistance. Relocation benefits<br />
have historically constituted a significant portion <strong>of</strong><br />
the rehabilitation program and although discontinuing<br />
or limiting those benefits will increase the burden on<br />
clients, contractors and staff, the program simply<br />
cannot afford to operate as it once did.<br />
Code Enforcement<br />
Code Enforcement staff continued to feel the effects<br />
<strong>of</strong> increased foreclosures and overall economic<br />
decline during FY2009. In February the <strong>City</strong><br />
Commission amended the lot clearing ordinance to<br />
allow special assessments resulting from lot clearing<br />
activity against a property subject to an active<br />
foreclosure to survive the foreclosure. This change<br />
has allowed staff to act quickly in response to<br />
complaints <strong>of</strong> overgrowth against foreclosed and<br />
abandoned properties and will result in repayment <strong>of</strong><br />
the resulting charges, either through an eventual sale<br />
<strong>of</strong> the property or as part <strong>of</strong> a tax assessment.<br />
Sweeps <strong>of</strong> the Lake Hunter Terrace, Westgate,<br />
Central Avenue and South Lake Morton<br />
neighborhoods resulted in action against 636<br />
violations. Subsequent cleanups in those same<br />
neighborhoods, coordinated with Neighborhood<br />
Planning, Solid Waste and Construction and<br />
Maintenance, resulted in the removal <strong>of</strong> over 110<br />
tons <strong>of</strong> debris.<br />
Annie Pfeiffer Chapel was<br />
completed in 1942 and was the<br />
first <strong>of</strong> seven buildings personally<br />
designed by Frank Lloyd Wright at<br />
the Florida Southern College<br />
campus. Wright’s building<br />
prescription, “out <strong>of</strong> the ground<br />
and into the light, a child <strong>of</strong> the<br />
sun.”<br />
D-33 Fiscal Year <strong>2010</strong> Annual Budget
THIS PAGE IS INTENTIONALLY BLANK<br />
D-34 Fiscal Year <strong>2010</strong> Annual Budget
Table <strong>of</strong> Contents<br />
Core Services by Program<br />
Core Services by Program Overview ........................................................................ D-36<br />
Program Performance Levels<br />
Economic and Community Development .................................................... D-37<br />
Community Safety .......................................................................................... D-40<br />
Transportation Services ................................................................................ D-43<br />
Legislative Activities ...................................................................................... D-44<br />
Environmental & Utility Services .................................................................. D-46<br />
Cultural & Community Services .................................................................... D-48<br />
Parks, Recreation and Properties ................................................................. D-50<br />
Support Services ............................................................................................ D-52<br />
D-35 Fiscal Year <strong>2010</strong> Annual Budget
Performance Budget Overview<br />
494 Core Services<br />
Economic & Community<br />
Developm ent<br />
For FY10, budget targets were<br />
developed based on prioritized<br />
Core Services and their<br />
relationship to achieving the<br />
Goals <strong>of</strong> the Strategic<br />
Operating Plan. Core Services<br />
were then divided appropriately<br />
according to their connectivity<br />
to the <strong>City</strong>’s Programs and<br />
Activities.<br />
42.1%<br />
8.5%<br />
11.3%<br />
6.9%<br />
9.7%<br />
8.3%<br />
3.4%<br />
9.7%<br />
Community Safety<br />
Transportation Services<br />
Legislative Activities<br />
Environmental and Utiility<br />
Services<br />
Cultural and Community<br />
Services<br />
Parks, Recreation and<br />
Properties<br />
A total <strong>of</strong> 494 Core Services were defined during the<br />
FY<strong>2010</strong> budget development process totaling<br />
$92,617,749 in Program costs.<br />
Community Safety<br />
$41,754,165<br />
Support Services<br />
$19,294,962<br />
Parks, Recreation and Properties<br />
Economic & Community Development<br />
Environmental and Utiility Services<br />
Cultural and Community Services<br />
Transportation Services<br />
$13,703,296<br />
$4,406,727<br />
$4,222,372<br />
$4,114,695<br />
$3,798,587<br />
$ 92,617,749<br />
Total Program<br />
Costs<br />
Legislative Activities<br />
$1,322,945<br />
97.165 71.4457<br />
177.3446<br />
275.175<br />
11.835<br />
809.835<br />
Environmental and Utiility Services<br />
Support Services<br />
Community Safety<br />
Total Program Costs consist <strong>of</strong> personnel,<br />
operational, revenue generated and debt<br />
service. The <strong>City</strong>’s 2,371 full-time<br />
equivalents are allocated to each Core<br />
Service.<br />
447.196<br />
480.6028<br />
Parks, Recreation and Properties<br />
Cultural and Community Services<br />
Transportation Services<br />
Economic & Community Development<br />
2,371 Total FTE’s<br />
Legislative Activities<br />
D-36 Fiscal Year <strong>2010</strong> Annual Budget
Economic & Community Development Program<br />
Program Description Cost: $4,406,727<br />
This Program includes:<br />
Providing excellent long-range and current planning services used to guide future development <strong>of</strong> the <strong>City</strong><br />
as a quality urban environment. Proposed development adheres to all requirements and conditions<br />
including zoning, concurrency and engineering standards.<br />
Maintaining safe, attractive neighborhoods and commercial/industrial districts by ensuring compliance with<br />
the <strong>City</strong>’s codes and ordinances while ensuring the health, safety and welfare <strong>of</strong> the community is<br />
maintained within the construction or use <strong>of</strong> every public and private building by adhering to requirements<br />
established by law.<br />
Collection <strong>of</strong> revenue through a Local Business Tax in the form <strong>of</strong> a yearly receipt which certifies an<br />
individual or business to engage in commercial activities in conformance with applicable zoning, building<br />
and development codes.<br />
Provide adequate, safe and affordable housing to very low and low to moderate income homeowners while<br />
supporting the <strong>City</strong>’s redevelopment efforts and promoting self-sufficiency all the while, planning for and<br />
supporting the revitalization <strong>of</strong> <strong>Lakeland</strong> neighborhoods which are recognized as the fundamental building<br />
blocks <strong>of</strong> a quality city.<br />
Creating self-sustaining environments in an effort to grow, attract and retain a creative, talented, educated<br />
and technically qualified workforce; improving the economic vitality and enhancing the visual image <strong>of</strong><br />
Downtown <strong>Lakeland</strong>, Mid Town and Dixieland districts by creating and implementing a redevelopment plan,<br />
promoting economic growth, acting as a catalyst for change in some <strong>of</strong> <strong>Lakeland</strong>’s most distressed<br />
neighborhoods and encouraging the preservation <strong>of</strong> the area’s historic character.<br />
ACTIVITIES<br />
Planning Services<br />
D-37 Fiscal Year <strong>2010</strong> Annual Budget
Economic & Community Development Program<br />
ACTIVITIES (CONT’D)<br />
Development Review Services<br />
Code Enforcement<br />
Building Inspection and Permitting Services<br />
D-38 Fiscal Year <strong>2010</strong> Annual Budget
Economic & Community Development Program<br />
ACTIVITIES (CONT’D)<br />
Local Business Taxes<br />
Affordable Housing Programs<br />
Neighborhood Programs<br />
Economic Development<br />
D-39 Fiscal Year <strong>2010</strong> Annual Budget
Economic & Community Development Program<br />
ACTIVITIES CONT’D<br />
CRA Districts<br />
Community Safety Program<br />
Program Description Cost: $41,754,165<br />
This Program includes providing:<br />
<br />
<br />
<br />
<br />
<br />
Prompt, attentive and compassionate customer service in response to calls for police, emergency and<br />
non-emergency services from the residents and visitors <strong>of</strong> the <strong>City</strong> <strong>of</strong> <strong>Lakeland</strong>.<br />
Quality follow-up investigations <strong>of</strong> criminal incidents occurring within the <strong>City</strong> <strong>of</strong> <strong>Lakeland</strong> along with<br />
developing an informed and engaged community by providing education designed to help the public<br />
avoid becoming crime victims.<br />
Support for a vibrant, culturally diverse community by providing the youth <strong>of</strong> <strong>Lakeland</strong> with positive role<br />
models, mentors and educational lifestyle options, as alternatives to gang participation and drug use.<br />
Services to prevent and extinguish fires within the <strong>City</strong> and the greater <strong>Lakeland</strong> area by administering<br />
inspections and safety programs while providing the highest service standards <strong>of</strong> safety, suppression<br />
and disaster response.<br />
The most efficient and highest level emergency medical and rescue services to the citizens <strong>of</strong> <strong>Lakeland</strong><br />
in addition to providing pr<strong>of</strong>essional, high-quality, effective patrol services while reducing crime, ensuring<br />
public safety and providing responsive customer service.<br />
D-40 Fiscal Year <strong>2010</strong> Annual Budget
Community Safety Program<br />
ACTIVITIES CONT’D<br />
Firefighting Services<br />
Rescue Services<br />
Patrol Services<br />
D-41 Fiscal Year <strong>2010</strong> Annual Budget
Community Safety Program<br />
ACTIVITIES CONT’D<br />
Investigative Services<br />
Community Police Programs<br />
Dispatching Services<br />
D-42 Fiscal Year <strong>2010</strong> Annual Budget
Transportation Services Program<br />
Program Description Cost: $1,322,945<br />
This Program includes providing:<br />
<br />
<br />
<br />
<br />
For the construction <strong>of</strong> transportation facilities throughout the <strong>City</strong> <strong>of</strong> <strong>Lakeland</strong> and to acquire the<br />
necessary right-<strong>of</strong>-way (ROW) for transportation-related facilities proposed throughout the <strong>City</strong>.<br />
Support for safe and attractive neighborhoods and public spaces through the continuous maintenance <strong>of</strong><br />
all streets, sidewalks, drainage facilities and alleys within the <strong>City</strong>.<br />
Safe, convenient parking facilities to assist businesses within the Central Business District (CBD) by<br />
reducing parking issues through consistent enforcement.<br />
A safe, secure, self-sustaining and convenient airport that promotes compatible economic growth within<br />
a dynamic aviation market.<br />
ACTIVITIES<br />
Transportation– Facilities Maintenance<br />
<strong>Lakeland</strong> Linder Regional Airport - Operations<br />
D-43 Fiscal Year <strong>2010</strong> Annual Budget
Transportation Services Program<br />
ACTIVITIES CONT’D<br />
<strong>Lakeland</strong> Linder Regional Airport - Leasing Activities<br />
Parking Services<br />
Legislative Activities Program<br />
Program Description $1,322,945<br />
This Program includes:<br />
<br />
<br />
<br />
Protecting and promoting a quality <strong>of</strong> life in <strong>Lakeland</strong> that includes the health, safety and general welfare<br />
<strong>of</strong> the citizenry.<br />
Support for an informed and engaged citizenry and staff by maintaining a timely and complete legislative<br />
history record <strong>of</strong> the <strong>City</strong> Commission’s activities and those related documents.<br />
An effective communications and networking system with representatives <strong>of</strong> federal, state and municipal<br />
governments and other local government agencies in an effort to advance interests <strong>of</strong> importance to the<br />
<strong>City</strong> <strong>of</strong> <strong>Lakeland</strong>.<br />
D-44 Fiscal Year <strong>2010</strong> Annual Budget
Legislative Activities Program<br />
ACTIVITIES<br />
<strong>City</strong> Commission<br />
<strong>City</strong> Clerk<br />
Intergovernmental Relations<br />
Community Relations<br />
D-45 Fiscal Year <strong>2010</strong> Annual Budget
Environmental & Utility Services Program<br />
Program Description Cost: $4,222,372<br />
This Program includes providing:<br />
<br />
<br />
<br />
<br />
<br />
<br />
Reliable, cost effective and environmentally compliant electric generation in a safe work environment to<br />
service the needs <strong>of</strong> our customers and safely, reliably and efficiently deliver electric power from<br />
<strong>Lakeland</strong> Electric’s generation facilities and interconnections with other utilities to our customers<br />
throughout the utility service area.<br />
Quality utility billing and customer service in a customer focused and cost efficient environment which<br />
meets or exceeds customers needs and expectations.<br />
An adequate amount <strong>of</strong> potable water for domestic use and fire protection services while meeting or<br />
exceeding required governmental guidelines at a cost competitive with comparable communities<br />
throughout the state.<br />
The customers in the <strong>City</strong> <strong>of</strong> <strong>Lakeland</strong>’s service territory with a sufficient sewage collection and treatment<br />
system to treat and dispose <strong>of</strong> all wastewater and residual products.<br />
The citizens and businesses <strong>of</strong> <strong>Lakeland</strong> with efficient, reliable, cost effective residential, commercial and<br />
environmentally conscious recycling and solid waste collection services.<br />
Programs and services for the preservation and enhancement <strong>of</strong> surface water and other natural<br />
resources in the <strong>City</strong> including flood control and stormwater infrastructure.<br />
Electric Utility - Energy Production<br />
Electric Utility - Energy Transmission & Distribution<br />
Electric Utility - Utility Billing and Customer Service<br />
D-46 Fiscal Year <strong>2010</strong> Annual Budget
Environmental & Utility Services Program<br />
ACTIVITIES CONT’D<br />
Water Treatment and Distribution<br />
Wastewater Collection and Treatment<br />
Solid Waste - Residential<br />
Solid Waste - Commercial<br />
D-47 Fiscal Year <strong>2010</strong> Annual Budget
Environmental & Utility Services Program<br />
ACTIVITIES CONT’D<br />
Solid Waste Recycling<br />
Lakes and Stormwater Management<br />
Dividend Payment to General Fund<br />
Cultural and Community Services Program<br />
Program Description Cost: $4,114,695<br />
This Program includes providing:<br />
<br />
<br />
<br />
<br />
Residents, employees and the media educational information regarding the <strong>City</strong> <strong>of</strong> <strong>Lakeland</strong>’s functions,<br />
challenges and achievements by building and maintaining open channels <strong>of</strong> communication.<br />
Customers with high quality public library services in response to the pursuit <strong>of</strong> their education,<br />
recreation and information needs.<br />
Improved quality <strong>of</strong> life for our citizens through cultural activities and community based programs that<br />
enrich <strong>Lakeland</strong> by providing a stimulus for education, culture, community service and entertainment.<br />
Superior facilities and outstanding events at the venue <strong>of</strong> choice for the greater <strong>Lakeland</strong> and Polk<br />
County area.<br />
D-48 Fiscal Year <strong>2010</strong> Annual Budget
Cultural and Community Services Program<br />
ACTIVITIES<br />
Library Services<br />
Cultural Support Services<br />
The <strong>Lakeland</strong> Center<br />
D-49 Fiscal Year <strong>2010</strong> Annual Budget
Cultural & Community Services Program<br />
ACTIVITIES (CONT’D)<br />
Public Information Services<br />
Parks, Recreation and Properties Program<br />
Program Description Cost: $13,703,296<br />
This Program includes providing:<br />
Citizens with safe, visually pleasing and enjoyable experiences utilizing public facilities parks, athletic<br />
complexes and public rights-<strong>of</strong>-ways.<br />
A variety <strong>of</strong> activities, programs, athletic leagues, day camps and special events.<br />
Publicly funded space and maintained and improved facilities and parks eligible for renting and reserving<br />
with the goal <strong>of</strong> improving the quality <strong>of</strong> life for <strong>Lakeland</strong> residents.<br />
Both Family oriented safe and secure aquatics facilities and superior golf-related recreation and leisure<br />
opportunities <strong>of</strong>fering instructional classes and specialized programs for both recreational and competitive<br />
participants.<br />
<strong>Lakeland</strong> citizens with respectful, attractive and well maintained burial parks.<br />
D-50 Fiscal Year <strong>2010</strong> Annual Budget
Parks, Recreation and Properties Program<br />
ACTIVITIES (CONT’D)<br />
Parks<br />
Recreation and Facilities Services<br />
Aquatics<br />
D-51 Fiscal Year <strong>2010</strong> Annual Budget
Parks, Recreation and Properties Program<br />
ACTIVITIES CONT’D<br />
Cleveland Heights Golf Course<br />
Cemeteries<br />
Support Services Program<br />
Program Description Cost: $19,294,962<br />
To provide the administrative overhead and structure to enable the <strong>City</strong> <strong>of</strong> <strong>Lakeland</strong>’s Departments and<br />
operational Divisions to effectively carry out their respective missions by:<br />
Maintaining and constructing safe, clean and secure <strong>City</strong> facilities for visitors and <strong>City</strong> employees in a<br />
cost effective and efficient manner.<br />
Acquiring and maintaining safe, reliable, cost effective vehicles and equipment which meet the specific<br />
needs <strong>of</strong> <strong>City</strong> Departments.<br />
Ensuring the acquisition <strong>of</strong> quality goods and services at the best value for the <strong>City</strong> in addition to<br />
providing a readily available supply <strong>of</strong> required items for immediate pick-up by <strong>City</strong> Departments as a<br />
support for their respective services.<br />
Working together to provide planning, implementation and support <strong>of</strong> information technologies enabling<br />
efficient <strong>City</strong> operations.<br />
D-52 Fiscal Year <strong>2010</strong> Annual Budget
Support Services Program<br />
ACTIVITIES<br />
Facilities Maintenance<br />
Fleet Management<br />
Purchasing and Stores<br />
D-53 Fiscal Year <strong>2010</strong> Annual Budget
Support Services Program<br />
ACTIVITIES CONT’D<br />
Information Technology<br />
Governance Administration<br />
D-54 Fiscal Year <strong>2010</strong> Annual Budget
Support Services Program<br />
ACTIVITIES CONT’D<br />
Governance Administration (cont’d)<br />
D-55 Fiscal Year <strong>2010</strong> Annual Budget
Support Services Program<br />
ACTIVITIES CONT’D<br />
Governance Administration (cont’d)<br />
D-56 Fiscal Year <strong>2010</strong> Annual Budget
Support Services Program<br />
ACTIVITIES CONT’D<br />
Governance Administration (cont’d)<br />
Departmental Administration<br />
D-57 Fiscal Year <strong>2010</strong> Annual Budget
Support Services Program<br />
ACTIVITIES (CONT’D)<br />
Departmental Administration (cont’d)<br />
D-58 Fiscal Year <strong>2010</strong> Annual Budget
Table <strong>of</strong> Contents<br />
Line Item Budget ........................................................................................................... Section—E<br />
Funds Overview ............................................................................................................. E-2<br />
<strong>City</strong>-Wide Funds Totals ................................................................................................ E-5<br />
General Fund ................................................................................................................. E-7<br />
Community Development - Affordable Housing ...................................................... E-77<br />
Community Redevelopment Agency ......................................................................... E-81<br />
Debt Service ................................................................................................................. E-87<br />
Fleet Management ....................................................................................................... E-89<br />
Purchasing & Stores ................................................................................................... E-95<br />
Facilities Maintenance ................................................................................................ E-99<br />
Information Technology ........................................................................................... E-105<br />
Wastewater Utility ..................................................................................................... E-119<br />
Water Utility ................................................................................................................ E-133<br />
Parking ....................................................................................................................... E-147<br />
<strong>Lakeland</strong> Center......................................................................................................... E-155<br />
Cleveland Heights Golf Course ................................................................................ E-165<br />
<strong>Lakeland</strong> Linder Regional Airport ............................................................................ E-171<br />
Solid Waste ................................................................................................................ E-181<br />
Lakes and Stormwater .............................................................................................. E-187<br />
Electric Utility ............................................................................................................. E-191<br />
E-1 Fiscal Year 2009 Annual Budget
Funds Overview<br />
The financial transactions <strong>of</strong> the <strong>City</strong> are reported in individual funds within the <strong>City</strong>’s accounting system.<br />
Each fund is accounted for by providing a separate, self-balancing set <strong>of</strong> accounts comprised <strong>of</strong> the assets,<br />
liabilities, reserves, fund equity, revenues and expenditures/expenses <strong>of</strong> each fund. GASB 34 sets forth the<br />
minimum criteria used to determine whether the individual funds are considered major versus non-major.<br />
The criteria are based on the value <strong>of</strong> assets, liabilities, revenues and expenditures/expenses <strong>of</strong> each fund<br />
in relation to all funds taken as a whole. Based on these criteria, the <strong>City</strong>’s major funds are the General<br />
Fund, Electric Utility Fund and Water/Wastewater Utility Funds. Detailed information on these funds is<br />
provided in the basic financial statements.<br />
Within the fund financial statements, funds are also classified into fund types. A different basis <strong>of</strong><br />
accounting is applied to the various fund types, based on the nature <strong>of</strong> the financial information needed to<br />
sustain the types <strong>of</strong> services provided.<br />
General Fund: Used to account for day to day operations that are NOT financed and operated in a<br />
manner similar to private business enterprises because <strong>of</strong> the impracticality <strong>of</strong> recovering costs based on a<br />
per usage charge. Examples include the costs <strong>of</strong> providing public safety, community planning and zoning,<br />
governance <strong>of</strong> the general government and the majority <strong>of</strong> costs associated with parks and recreation<br />
facilities and programs.<br />
Enterprise Funds: Used to account for operations that are financed and operated in a manner similar<br />
to private business enterprises. The primary customer <strong>of</strong> enterprise funds is the general public and the<br />
intent is that the costs relating to providing certain goods or services are primarily recovered through user<br />
fees and charges.<br />
<br />
<br />
<br />
<br />
<br />
<br />
<br />
<br />
The Department <strong>of</strong> Electric Utilities Fund accounts for operating and maintaining generation,<br />
distribution and customer support functions associated with the <strong>City</strong>-owned electric utility.<br />
The Water Utilities Fund accounts for operating and maintaining the treatment and distribution<br />
functions associated with the <strong>City</strong>-owned water utility.<br />
The Wastewater Utilities Fund accounts for operating and maintaining the treatment and collection<br />
functions associated with the <strong>City</strong>-owned wastewater water utility.<br />
The Parking System Fund accounts for operating and maintaining parking facilities throughout the<br />
<strong>City</strong>, including three municipal parking garages.<br />
The <strong>Lakeland</strong> Center Fund accounts for operating and maintaining the <strong>Lakeland</strong> Center for public<br />
shows, civic and cultural events, entertainment and other activities.<br />
The Cleveland Heights Golf Course Fund accounts for operating and maintaining the <strong>City</strong>-owned<br />
golf course.<br />
The <strong>Lakeland</strong> Linder Regional Airport Fund accounts for revenues and leases <strong>of</strong> buildings and<br />
land, commissions on the sale <strong>of</strong> gasoline, related operating expenses and capital outlays<br />
necessary for maintaining a general aviation facility and an industrial park.<br />
The Solid Waste Management Fund accounts for all activities necessary to provide refuse<br />
collection, disposal services and recycling to residents <strong>of</strong> the <strong>City</strong>.<br />
Internal Service Funds: Used to account for the financing <strong>of</strong> goods or services provided by<br />
one department to other departments <strong>of</strong> the <strong>City</strong> on a cost reimbursement basis.<br />
<br />
<br />
The Purchasing and Stores Fund accounts for the cost <strong>of</strong> purchasing and maintaining custody <strong>of</strong><br />
supplies and materials. Services provided are billed based on an estimate <strong>of</strong> actual cost, including<br />
operating expenses and overhead.<br />
The Fleet Management Fund accounts for renting and maintaining automotive equipment used by<br />
other <strong>City</strong> departments. User charges are assessed to cover actual costs, including operating<br />
expenses, overhead and depreciation.<br />
E-2 Fiscal Year 2009 Annual Budget
Funds Overview<br />
Internal Service Funds (Cont’d):<br />
<br />
<br />
<br />
<br />
The Internal Loan Fund accounts for internal loans that are made to other funds <strong>of</strong> the <strong>City</strong> for<br />
the purpose <strong>of</strong> financing capital acquisition costs <strong>of</strong> a relatively short term nature. The cash<br />
flows in and out <strong>of</strong> this fund are budgeted only to the extent those transactions impact other,<br />
budgeted funds.<br />
The Self Insurance Fund accounts for the cost <strong>of</strong> claims and management fees incurred in<br />
providing employee health insurance, workers’ compensation, general liability, public <strong>of</strong>ficials’<br />
liability, airport general liability, automobile liability and trustee and fiduciary liability for the<br />
<strong>City</strong>. The cash flows in and out <strong>of</strong> this fund are budgeted only to the extent those transactions<br />
impact other, budgeted funds.<br />
The Information Technology Fund accounts for the cost <strong>of</strong> the information services incurred in<br />
providing network services, telephone, radio communications and general computer services<br />
and supplies. User charges are assessed to cover actual costs including operating expenses,<br />
overhead and depreciation.<br />
The Facilities Maintenance Fund accounts for the cost <strong>of</strong> maintenance and janitorial services<br />
for all <strong>City</strong>-owned buildings. User charges are assessed to cover the actual costs, including<br />
operating expenses and overhead.<br />
Fiduciary Funds: Used to report assets held in a trustee or agency capacity for others and<br />
therefore can not be used to support the government’s own programs. Fiduciary funds include both<br />
pension trust funds and agency funds. Fiduciary Funds are measured by the Finance Department but<br />
are included in the budgeting process only to the extent that related transactions affect other, budgeted<br />
funds.<br />
<br />
<br />
<br />
<br />
<br />
<br />
The Employees’ Pension and Retirement Fund accounts for the accumulation <strong>of</strong> resources<br />
used for retirement payments for <strong>City</strong> employees.<br />
The Police Officers’ Supplemental Pension and Retirement System Fund accounts for the<br />
accumulation <strong>of</strong> resources used for retirement annuity payments to police <strong>of</strong>ficers. Resources<br />
are contributed by police <strong>of</strong>ficers at a rate <strong>of</strong> 1% <strong>of</strong> their salary and by the State <strong>of</strong> Florida from<br />
the proceeds <strong>of</strong> an excise tax imposed by the <strong>City</strong> on casualty insurance companies.<br />
The Firefighters’ Supplemental Pension Plan Fund accounts for the accumulation <strong>of</strong> resources<br />
used for retirement annuity and death benefit payments for firefighters. Resources are<br />
contributed by firefighters at a rate <strong>of</strong> 3% <strong>of</strong> their salary and by the State <strong>of</strong> Florida from<br />
proceeds <strong>of</strong> an excise tax imposed by the <strong>City</strong> on fire insurance companies. The tax is<br />
collected by the State <strong>of</strong> Florida and remitted to the fund.<br />
The Alternate Employee Pension Plan Fund accounts for the accumulation <strong>of</strong> assets<br />
designated for providing post-employment benefits for certain eligible employees enrolled in<br />
the plan. The assets <strong>of</strong> the <strong>City</strong>’s Alternate Pension Plan were transferred to a third part<br />
administrator in the name <strong>of</strong> the participants. The <strong>City</strong> no longer has any fiduciary<br />
responsibilities concerning the plan. The <strong>City</strong>’s involvement in the plan is limited to remitting<br />
the amounts paid by the participants to a third party.<br />
The Death Benefit Fund accounts for the accumulation <strong>of</strong> resources used to provide continued<br />
life insurance to certain <strong>City</strong> employees after retirement. The maximum liability at year-end is<br />
completely funded.<br />
The Survivor’s Benefit Trust Fund accounts for the accumulation <strong>of</strong> resources used for<br />
payment <strong>of</strong> a death benefit to surviving spouses <strong>of</strong> certain retired employees.<br />
E-3 Fiscal Year 2009 Annual Budget
Funds Overview<br />
Special Revenue Funds: Used to account for proceeds from certain specific revenue sources. These<br />
funds are recorded separately as directed by legal requirements, regulatory provisions, or administrative<br />
action. As with the General Fund, the primary accounting focus is on the sources <strong>of</strong> available funds and the<br />
financial activity is reported using the modified accrual basis accounting.<br />
<br />
<br />
<br />
<br />
<br />
<br />
The Transportation Funds’ major sources <strong>of</strong> revenues include taxes levied on motor fuels and<br />
impact fees. These revenues are used for projects approved by the <strong>City</strong> Commission, such as<br />
street improvements.<br />
The Public Improvement Fund consists <strong>of</strong> revenues primarily received from an agreement to lease<br />
a <strong>City</strong>-owned hospital facility to a not-for-pr<strong>of</strong>it corporation. The revenues are used to finance a<br />
variety <strong>of</strong> capital improvement projects not assignable to an enterprise operation and to pay debt<br />
service on long-term debt issued for the same purpose.<br />
The Community Development and Affordable Housing Fund accounts for the various federal and<br />
state grant programs for improvement projects and economic development assistance in low to<br />
moderate-income areas.<br />
The Stormwater Fund accounts for revenues received primarily through the collection <strong>of</strong> residential<br />
and commercial fees as well as transfers from the Transportation Fund for drainage and lake<br />
projects and are used for projects approved by the <strong>City</strong> Commission for stormwater capital<br />
activities.<br />
The <strong>Lakeland</strong> Community Redevelopment Agency accounts for revenues received primarily from<br />
the tax increment <strong>of</strong> the special taxing district established for the purpose <strong>of</strong> revitalizing the<br />
downtown <strong>Lakeland</strong> area.<br />
The Impact Fee Fund accounts for impact fees collected for transportation, law enforcement, fire<br />
protection and parks and recreation. Impact Fee Revenues are monitored by the Finance<br />
Department but are not budgeted until funds are actually disbursed to finance capital projects<br />
Debt Service Fund: Used to account for the accumulation <strong>of</strong> resources for, and the payment <strong>of</strong>,<br />
general long-term debt principal and interest.<br />
Permanent Funds: Used to report resources that are legally restricted to the extent that only earnings,<br />
not principal, may be used for purposes that support the reporting government’s programs. Cash flows in<br />
and out <strong>of</strong> The Permanent Funds are measured by the Finance Department but are not included in the<br />
budgeting process except to the extent those cash flows affect other, budgeted funds.<br />
<br />
<br />
<br />
<br />
<br />
The Oak Hill Burial Park Fund accounts for the accumulation <strong>of</strong> resources used to finance<br />
improvements to the Oak Hill Burial Park.<br />
The Cemetery Perpetual Care Fund, when the corpus <strong>of</strong> this fund is sufficient, it will be used to<br />
account for the accumulation <strong>of</strong> resources used to maintain all <strong>City</strong>-owned cemeteries.<br />
The Scott Morris Mausoleum Fund accounts for a contribution to provide maintenance <strong>of</strong> the Scott<br />
Morris Mausoleum.<br />
The Webster Book Fund accounts for a bequest received by the <strong>City</strong> to purchase nonfiction books<br />
and periodicals for the <strong>City</strong> <strong>of</strong> <strong>Lakeland</strong> Public Library.<br />
The Baldwin Book Fund accounts for a bequest received by the <strong>City</strong> to purchase general science<br />
and wholesome fiction books for the <strong>City</strong> <strong>of</strong> <strong>Lakeland</strong> Public Library.<br />
E-4 Fiscal Year 2009 Annual Budget
<strong>City</strong>-Wide Fund Totals<br />
REVENUE AND EXPENDITURE SUMMARY<br />
Experience Budget Experience 2009-10<br />
For Year For Year 2008-09 Proposed by<br />
EXPENSES 2008-09 2008-09 Estimated <strong>City</strong> Manager<br />
Personnel<br />
Salaries and Wages 97,120,321 103,149,364 98,482,360 102,891,282<br />
Fringe Benefits 21,390,487 25,999,078 25,590,091 30,106,904<br />
Total Personnel 118,510,809 129,148,442 124,072,450 132,998,187<br />
Non-Personnel<br />
Internal Service Charges 34,399,664 37,437,858 34,632,127 36,199,546<br />
Pr<strong>of</strong>essional and Contractual 18,198,214 23,011,168 17,666,745 19,935,084<br />
Utilities 13,869,508 15,576,232 14,059,148 15,291,001<br />
Insurance and Fixed Charges 5,449,739 5,081,799 5,490,995 5,226,922<br />
All Other Operations and Maintenance 249,007,263 267,856,971 231,118,759 208,575,738<br />
Capital Outlay 68,857,319 162,085,470 150,789,800 61,618,734<br />
Debt Service 59,933,087 70,984,514 73,663,218 70,655,990<br />
Total Non-Personnel 449,714,795 582,034,012 527,420,791 417,503,015<br />
Total Expenditures 568,225,603 711,182,455 651,493,241 550,501,202<br />
Transfers<br />
Allocations to other funds 8,259,223 8,933,382 8,933,190 8,671,394<br />
Transfers In 38,646,692 41,039,101 41,038,601 41,750,936<br />
Transfers Out (38,646,637) (41,039,101) (41,038,601) (41,750,936)<br />
Net Transfers 8,259,277 8,933,382 8,933,190 8,671,394<br />
Revenue Sources<br />
Taxes 44,708,378 45,371,461 45,649,804 44,638,232<br />
Licenses and Permits 3,258,073 3,503,464 2,584,306 2,719,736<br />
Intergovernmental 21,329,890 33,208,541 32,003,237 14,199,396<br />
Charges for Services 460,843,815 499,032,551 452,340,321 433,925,040<br />
Interest Income 8,774,671 8,290,734 9,528,689 6,885,542<br />
All Other Revenue 35,113,604 78,495,873 79,128,395 31,756,989<br />
Total Revenue 574,028,430 667,902,624 621,234,752 534,124,935<br />
Funding to be Provided (14,062,104) 34,346,448 21,325,299 7,704,873<br />
E-5 Fiscal Year 2009 Annual Budget
THIS PAGE IS INTENTIONALLY BLANK<br />
E-6 Fiscal Year 2009 Annual Budget
REVENUE AND EXPENDITURE SUMMARY<br />
GENERAL FUND<br />
Experience Budget Experience 2009-10<br />
For Year For Year 2008-09 by<br />
EXPENSES 2007-08 2008-09 Estimated <strong>City</strong> Manager<br />
Personnel<br />
Salaries and Wages 51,042,236 53,017,234 51,712,281 53,140,723<br />
Fringe Benefits 12,183,709 13,659,450 12,425,341 15,367,795<br />
Total Personnel 63,225,944 66,676,684 64,137,622 68,508,518<br />
Non-Personnel<br />
Internal Service Charges 10,443,959 11,468,093 10,472,474 10,820,711<br />
Pr<strong>of</strong>essional and Contractual 806,644 875,230 888,339 791,140<br />
Utilities 7,243,721 7,643,798 7,664,648 7,749,341<br />
Insurance and Fixed Charges 1,910,194 1,690,706 1,670,481 1,695,492<br />
All Other Operations and Maintenance 8,470,495 9,414,797 9,136,420 7,922,260<br />
Capital Outlay 193,763 743,333 748,332 120,854<br />
Debt Service<br />
Total Non-Personnel 29,068,775 31,835,957 30,580,694 29,099,798<br />
Total Expenditures 92,294,719 98,512,641 94,718,316 97,608,316<br />
Transfers<br />
Allocations to Other Funds 8,259,223 8,933,382 8,933,190 8,671,394<br />
Transfers In 34,721,641 36,175,543 36,175,543 37,285,597<br />
Transfers Out (2,192,789) (2,308,844) (2,308,844) (2,313,052)<br />
Net Transfers 40,788,075 42,800,081 42,799,889 43,643,939<br />
Revenue Sources<br />
Taxes 33,875,629 34,383,959 35,096,384 34,827,293<br />
Licenses and Permits 3,258,073 3,503,464 2,584,306 2,719,736<br />
Intergovernmental 9,778,860 9,661,646 8,741,139 8,819,618<br />
Charges for Services 3,774,390 3,292,095 3,496,316 3,449,801<br />
Interest Income 1,213,150 889,392 1,354,830 650,000<br />
All Other Revenue 1,970,276 1,599,504 1,801,178 1,295,483<br />
Total Revenue 53,870,378 53,330,060 53,074,153 51,761,931<br />
Funding to be Provided (2,363,734) 2,382,500 (1,155,726) 2,202,446<br />
E – 7
GENERAL FUND REVENUES<br />
Experience Budget Projected Proposed<br />
For FY For FY For FY For FY<br />
REVENUES 2008 2009 2009 <strong>2010</strong><br />
TAXES<br />
Ad Valorem Taxes 18,893,301 19,313,959 19,503,306 19,248,168<br />
Communications / Utility Tax 14,720,615 14,770,000 15,318,078 15,300,000<br />
Franchise Taxes 261,713 300,000 275,000 279,125<br />
LICENSES & PERMITS<br />
Business Tax Receipts 1,425,421 1,516,785 1,493,236 1,493,236<br />
Building Permits 1,832,652 1,986,679 1,091,070 1,226,500<br />
INTERGOVERNMENTAL REVENUES<br />
Federal Grants 66,081 101,775 101,775<br />
State Grants 608,706 299,905 299,905 299,835<br />
Local Grants 653,656 505,845 501,545 440,893<br />
State Shared Revenues 7,455,653 7,570,000 6,664,972 6,864,572<br />
County Shared Revenues 967,374 1,184,121 1,172,942 1,214,318<br />
Payments in Lieu <strong>of</strong> Taxes 27,391<br />
CHARGES FOR SERVICES<br />
General Government 291,310 287,278 172,497 187,497<br />
Public Safety 987,648 538,936 881,172 881,172<br />
Cemetery Fees 527,447 590,170 516,501 590,170<br />
Lot Mowing/Demolition 115,972 143,000 120,334 143,000<br />
Transportation 6,668 6,782 3,073 3,000<br />
Library 35 200 201 200<br />
Parks & Recreation Activities 1,097,053 1,051,780 1,116,087 957,700<br />
Stadiums 420,478 354,324 357,013 359,762<br />
Auditoriums 257,940 249,675 257,718 284,800<br />
Other Parks & Recreation 69,840 69,950 71,719 42,500<br />
FINES & FORFEITS<br />
Court Cases 635,106 574,063 596,046 510,000<br />
Library Fines 40,454 40,000 41,459 40,000<br />
Local Ordinance Violation 288,342 210,000 300,000 385,000<br />
Other 1,962 1,500 1,222 1,000<br />
MISCELLANEOUS REVENUE<br />
Interest Earnings 1,213,150 889,392 1,354,830 650,000<br />
Rents and Royalties 98,613 143,551 148,743 148,300<br />
Sales for Loss <strong>of</strong> Fixed Assets 15,748 5,401 9,138 5,000<br />
Contributions & Donations 268,687 63,904 118,029<br />
Refund <strong>of</strong> Prior Year Expense 804 580<br />
Reimbursements 286,678 157,661 216,810 6,500<br />
Other (43,349) 141,500 107,226 70,000<br />
NON-OPERATING REVENUES<br />
Interfund Transfers 4,583,417 5,355,438 5,355,438 5,340,897<br />
Dividend from Enterprise<br />
Operations 30,568,969 31,135,543 31,135,543 32,127,897<br />
SURPLUS - PRIOR YEARS (2,363,734) 2,382,500 (1,155,726) 2,202,446<br />
TOTAL REVENUES 86,281,799 91,941,617 88,147,484 91,303,488<br />
E – 8
GENERAL FUND EXPENSES<br />
Experience Budget Projected Proposed<br />
For Year For Year For Year For Year<br />
EXPENSES 2008 2009 2009 <strong>2010</strong><br />
CITY COMMISSION 122,411 84,741 89,431 89,856<br />
CITY MANAGER 321,750 305,489 308,867 308,280<br />
PERFORMANCE EXCELLENCE 386,773 181,608 186,898 184,848<br />
COMMUNICATIONS 305,262 341,649 348,852 347,197<br />
LEGAL 215,666 232,312 268,667 202,278<br />
RETIREMENT SERVICES 140,062 152,558 110,057 179,494<br />
WORKFORCE DEVELOPMENT &<br />
LABOR RELATIONS 124,014 639,121 558,415 697,307<br />
CIVIL SERVICE, STAFFING, &<br />
COMPENSATION 448,834 382,548 341,343 398,633<br />
COMMUNITY DEVELOPMENT<br />
Planning 2,258,154 2,354,778 2,305,798 2,073,456<br />
Code Enforcement 897,080 925,489 926,103 822,190<br />
Building Inspection 1,839,545 1,875,184 1,830,687 1,450,244<br />
Business Tax Office 156,525 198,196 177,522 216,430<br />
RISK MANAGEMENT 471,108 610,457 547,813 541,108<br />
INTERNAL AUDIT 54,321 52,673 56,602 55,248<br />
FINANCE DEPARTMENT<br />
Central Accounting 863,959 861,591 786,394 917,328<br />
<strong>City</strong> Clerk 493,785 387,826 382,867 444,499<br />
<strong>City</strong> Treasurer 17,777 12,875 (90,940) 74,068<br />
Electric & Water Finance 17,163 (31,231)<br />
Utilities Billing 105,776 73,486 30,264 116,833<br />
FIRE DEPARTMENT 12,573,371 13,064,996 12,906,034 13,817,521<br />
POLICE DEPARTMENT 31,087,191 33,107,151 32,108,836 32,880,511<br />
PUBLIC WORKS<br />
Director 424,918 487,648 418,706 489,114<br />
Engineering 1,048,606 1,310,676 1,195,655 1,405,963<br />
Construction and Maintenance 2,694,972 2,510,913 1,960,642 2,231,786<br />
Traffic Engineering 1,059,005 993,316 960,777 990,537<br />
PARKS AND RECREATION<br />
Director 327,038 365,707 334,510 362,265<br />
Parks 7,504,170 8,379,288 7,934,130 8,411,697<br />
Recreation 4,209,807 4,972,180 4,478,785 4,899,840<br />
Library 2,793,014 3,145,651 3,008,014 3,046,470<br />
Branch Library 396,148 430,655 421,295 437,152<br />
Cemeteries 724,450 768,881 740,199 790,340<br />
NON-DEPARTMENTAL 12,199,145 12,731,974 12,545,493 12,420,995<br />
TOTAL EXPENSES 86,281,799 91,941,617 88,147,484 91,303,488<br />
E – 9
GENERAL FUND<br />
REVENUES<br />
Experience Budget Projected Proposed<br />
For Year For Year For Year For Year<br />
2008 2009 2009 <strong>2010</strong><br />
TAXES<br />
Property Taxes<br />
Current Ad Valorem Taxes 19,461,484 20,253,852 20,090,875 20,147,368<br />
Ad Valorem Tax Discounts & Costs (659,427) (1,012,693) (674,828) (1,007,368)<br />
Delinquent Ad ValoremTaxes 46,637 46,800 45,504 50,000<br />
Interest On Delinquent Ad Valorem Taxes 44,607 26,000 41,755 58,168<br />
18,893,301 19,313,959 19,503,306 19,248,168<br />
Franchise Fees<br />
Gas Companies - Franchise 261,713 300,000 275,000 279,125<br />
Utility Taxes<br />
Utility Tax -Propane 198,671 245,000 249,938 250,000<br />
Utililty Tax - Fuel 91,707<br />
Utility Tax-Water 1,186,935 1,275,000 1,240,894 1,260,000<br />
Utility Tax-Electric 7,324,452 7,500,000 7,353,057 7,460,000<br />
Telecommunication Revenues 5,918,850 5,750,000 6,136,728 6,150,000<br />
Telecommunications Revenues - Prior Year Catch Up 337,461 180,000<br />
14,720,615 14,770,000 15,318,078 15,300,000<br />
TOTAL TAXES AND FEES 33,875,629 34,383,959 35,096,384 34,827,293<br />
LICENSE AND PERMITS<br />
Business Tax Licenses<br />
Occupational License Tax 1,406,034 1,500,000 1,473,211 1,473,211<br />
Penalties-Occupational License 17,607 15,000 18,623 18,623<br />
Transfer & Dup Fees-Occupational License 1,428 1,500 1,219 1,219<br />
Collection Fees-Occupational License 153 210 30 30<br />
All Other Occupational License Taxes 200 75 153 153<br />
1,425,421 1,516,785 1,493,236 1,493,236<br />
Building Inspection Fees<br />
Landscape Inspection Fees 1,570 2,220 1,022 1,000<br />
Building Inspection Fees 988,698 1,075,000 605,000 690,000<br />
Other Building Inspection Fees 443,801 500,000 247,500 270,000<br />
Plumbing Inspection Fees 147,450 150,000 82,500 90,000<br />
Mechanical Inspection Fees 131,638 130,000 82,500 90,000<br />
Electrical Inspection Fees 117,663 125,000 71,500 85,000<br />
Building Permit Surcharge Administration Fees 1,831 4,459 1,048 500<br />
1,832,652 1,986,679 1,091,070 1,226,500<br />
TOTAL LICENSE AND PERMITS 3,258,073 3,503,464 2,584,306 2,719,736<br />
E – 10
GENERAL FUND<br />
REVENUES<br />
Experience Budget Projected Proposed<br />
For Year For Year For Year For Year<br />
2008 2009 2009 <strong>2010</strong><br />
INTERGOVERNMENTAL REVENUE<br />
State Revenue Sharing<br />
Alcoholic Beverage License Tax 68,974 50,000 72,000 72,000<br />
Municipal Revenue Sharing 2,115,087 2,200,000 1,898,000 2,197,600<br />
Mobile Home License Fees 188,990 195,000 189,002 189,002<br />
Local Government Half-Cent Sales Tax 5,068,350 5,100,000 4,475,000 4,375,000<br />
Firefighters Compensation Tax 14,251 25,000 30,970 30,970<br />
7,455,653 7,570,000 6,664,972 6,864,572<br />
Other Local Units Revenue Sharing<br />
County Occupation License Tax 41,737 56,000 44,821 44,821<br />
County-Wide Library Cooperative 673,839 745,465 745,465 782,689<br />
County-wide Bookmobile Program 98,108 100,401 282,255 288,251<br />
County-Wide Library Cooperative 153,690 282,255 100,401 98,557<br />
Payments From Other Local units in Lieu <strong>of</strong> Taxes<br />
Payment in Lieu <strong>of</strong> Taxes - LHA 27,391<br />
967,374 1,184,121 1,172,942 1,214,318<br />
Federal Grants<br />
BJA - Bulletpro<strong>of</strong> Vest Program 17,797 41,816 41,816<br />
DOJ - Justice Assistance 48,284 59,959 59,959<br />
66,081 101,775 101,775<br />
State Grants<br />
FDOT-Hwy Lighting & Traffic Signal Maint. Ageements 157,104<br />
JAG/BYRNE (DART) 08/09 41,224 13,670 13,670 13,600<br />
FOAG-Victim Assistance (VOCA) 96,602 89,742 89,742 89,742<br />
FDOT-Parks R/W Maintenance WPI#1610823 202,317 196,493 196,493 196,493<br />
U&CF-Tree Inventory - Northside 14,257<br />
U&CF-Tree Inventory - Southside 23,089<br />
U&CF-Tree Remediation - SE Quadrant 64,113<br />
U&CF-Cemetery Tree Planting 10,000<br />
608,706 299,905 299,905 299,835<br />
Local Grants<br />
Polk County School Board-SRO 496,052 393,802 393,802 415,393<br />
High Intensity Drug Trafficking Area 27,558 17,886 12,886 25,500<br />
FIRE Training 913<br />
Neighborhood Clean Up Project 108,655 92,257 92,257<br />
PCCVB-Reimbursable Expenses 6,750 1,900 2,600<br />
Fireman's Fund Heritage Program 13,729<br />
653,656 505,845 501,545 440,893<br />
TOTAL INTERGOVERNMENTAL 9,778,860 9,661,646 8,741,139 8,819,618<br />
E – 11
GENERAL FUND<br />
REVENUES<br />
Experience Budget Projected Proposed<br />
For Year For Year For Year For Year<br />
2008 2009 2009 <strong>2010</strong><br />
CHARGES FOR SERVICES<br />
General Government Charges for Serv<br />
Zoning & Subdivision Fees - Planning 141,013 100,000<br />
Zoning & Subdivision Fees - Building Inspection 350 75,000 75,000<br />
Appeal Board - Zoning & Subdivision Fees 15,000<br />
Sales- Maps & Publication - Planning 2,111 2,780 2,976 2,976<br />
Sales- Maps & Publication - Building Inspection 177<br />
Certification Copying, Research Fees - Gen. Govt. 1,588 838 1,858 1,858<br />
Certification Copying, Research Fees - Code 26<br />
Sales-Yesterday's <strong>Lakeland</strong> 9 346 346<br />
County Impact Fees-Administration 6,000 10,000 3,103 3,103<br />
Garnishment Fees 9,331 9,000 9,966 9,966<br />
Fire Union Dues Administration Fees 950 800 950 950<br />
LPD Union Dues Administration Fees 1,699 1,510<br />
School Impact Fees Admin. Charges 12,514 28,000 8,887 8,887<br />
Zoning Verification Letters 2,740 3,450 2,068 2,068<br />
Special Assessment/Application Fees/All other 6,680 5,900 4,645 4,645<br />
Construction Plan Review Fee 106,122 125,000 62,698 62,698<br />
291,310 287,278 172,497 187,497<br />
Public Safety Charges for Services<br />
Police Services Reimbursement 596,213 322,336 532,356 532,356<br />
Court Witness Fees 2,405 3,000 2,237 2,237<br />
Other Public Safety Charges - Police 89,518 80,000 94,225 94,225<br />
Chauffeurs Permits 425 600 342 342<br />
Other Public Safety Charges - Fire 128,612 10,000 62,870 62,870<br />
Permitted Fire Inspections 28,565 15,000 47,305 47,305<br />
One Time Fire Permits Fee 57,910 28,000 61,837 61,837<br />
Polk Community College IPS Coordinator 83,960 80,000 80,000 80,000<br />
Training Project 39<br />
987,648 538,936 881,172 881,172<br />
Other Physical Environment Revenue<br />
Lot Clearing 114,208 105,000 86,801 105,000<br />
Demolition <strong>of</strong> Condemned Buildings 1,763 38,000 33,533 38,000<br />
115,972 143,000 120,334 143,000<br />
Cemetery Charges for Services<br />
Opening Graves-Oakhill 190,741 190,000 196,965 190,000<br />
Opening Graves-Roselawn 2,789 3,500 1,855 3,500<br />
Opening Graves-Laurel Hill 5,862 4,000 6,959 4,000<br />
All Other Revenues-Oakhill 35,501 30,870 34,607 30,870<br />
All Other Revenues -Laurel Hill 2,106 500 902 500<br />
All Other Revenues -Roselawn 63 105<br />
Cemetery Lots-Oak Hill 286,291 360,000 271,855 360,000<br />
Cemetery Lots-Laurel Hill 4,094 1,300 3,252 1,300<br />
527,447 590,170 516,501 590,170<br />
E – 12
GENERAL FUND<br />
REVENUES<br />
Experience Budget Projected Proposed<br />
For Year For Year For Year For Year<br />
2008 2009 2009 <strong>2010</strong><br />
Transportation<br />
Other Transportation Receipts 6,668 6,782 3,073 3,000<br />
Culture-Recreation/Libraries<br />
Library Non-Resident Fees 35 200 201 200<br />
Parks and Recreation<br />
Recreation:<br />
Program Activity Fees - <strong>City</strong> Hall 6,587 557,500 1,191 1,250<br />
Program Activity Fees - Simpson Park 17,111 18,119 20,000<br />
Program Activity Fees - Simpson Pool 12<br />
Program Activity Fees - Kelly Rec 101,997 86,571 88,000<br />
Program Activity Fees - Tennis Courts 10,931 6,157 6,500<br />
Program Activity Fees - Gandy Pool 9,480 10,460 10,500<br />
Program Activity Fees - Lake Mirror Complex 16,959 18,635 19,000<br />
Program Activity Fees - Summer Recreation 170,950 174,792 176,000<br />
Program Activity Fees - Teen Camp 38,136 39,789 41,000<br />
Program Activity Fees - Great Escape Program 3,101 1,005 1,250<br />
Program Activity Fees - Coleman Bush 2,499 1,512 1,500<br />
Program Activity Fees - Athletics 121,093 144,012 145,000<br />
Program Activity Fees - Tennis Camp 9,724<br />
Swimming Pools - Simpson Park 11,022 15,000 13,079 15,000<br />
Swimming Pools - Gandy Pool 68,802 70,000 74,532 70,000<br />
Swimming Classes - Simpson Park 5,062 4,000 5,214 5,000<br />
Swimming Classes - Gandy Pool 23,686 25,000 24,695 25,000<br />
Tennis Courts 20,506 12,000 19,270 19,000<br />
Tennis Courts - Kelly Rec 807 522<br />
Tournament Fees - Kelly Rec 17,640 18,000 19,809 20,000<br />
Tournament Fees - Athletics 1,000<br />
Weight Room Fees - Simpson Park 6,964 8,000 7,601 8,000<br />
Weight Room Fees - Kelly Rec 72,960 89,000 74,642 75,000<br />
Recreation Fees - Reserve for New Recreational Facilities 117,288 104,000 104,000 104,000<br />
X-MAS Parade Entry Fee 3,925 2,500 2,137 2,000<br />
Martin Luther King Parade 1,240 1,100 1,100 1,100<br />
Personal Trainer Facility Use Fees - Kelly Rec 1,692 2,601 2,600<br />
All Other Park & Rec Fees - Parks 96,631 50,000 104,218 100,000<br />
All Other Park & Rec Fees - Athletics 339 1,000<br />
All Other Revenue - Gandy Pool 1,191 1,000 1,112 1,000<br />
Overtime Charges - Parks 140,408 90,988 159,313<br />
1,097,053 1,051,780 1,116,087 957,700<br />
E – 13
GENERAL FUND<br />
REVENUES<br />
Experience Budget Projected Proposed<br />
For Year For Year For Year For Year<br />
2008 2009 2009 <strong>2010</strong><br />
Special Recreation Facilities - Stadiums<br />
Tigertown Dorm Rental 17,000 15,324 32,762 32,762<br />
Marchant Stadium Parking 227,276 207,000 192,251 195,000<br />
Marchant Stadium-Training - Minor 166,519 132,000 132,000 132,000<br />
Marchant Stadium-Training - Major 9,684<br />
420,478 354,324 357,013 359,762<br />
Special Recreation Facilities - Auditoriums<br />
Lake Mirror Center 77,651 69,000 93,848 90,000<br />
Lake Mirror Theater 3,531 1,000 4,992 5,000<br />
Lake Mirror Loggia 250 1,000 750 1,000<br />
Lake Mirror Glass Lounge 1,514 1,000 1,222 1,000<br />
Magnolia Building 94,018 92,000 84,514 85,000<br />
Tigertown Hanger Rental 10,112 9,000 10,200 10,000<br />
Coleman-Bush Building-East 4,920 6,000 1,111 12,000<br />
Coleman-Bush Building-West 5,980 9,000 1,931 18,000<br />
Coleman-Bush Building-Other 300 300<br />
Simpson Park - Facility Rentals 1,240 2,235 2,200<br />
Peggy Brown Building - Upstairs 58,496 61,000 56,616 60,000<br />
Peggy Brown Building - Downstairs 228 375 300 300<br />
257,940 249,675 257,718 284,800<br />
Special Recreation Facilities - Other<br />
Lake Parker Park-Pavilions 9,569 11,000 9,373 10,000<br />
Bowling Greens 2,975 3,000 3,064 3,000<br />
Shuffleboard Club 439 950 512 500<br />
Lake Mirror Park Fees 15,454 13,000 15,241 15,000<br />
Hollis Gardens Rentals 41,404 42,000 36,479 4,000<br />
Common Ground Park-Pavillions 7,050 10,000<br />
69,840 69,950 71,719 42,500<br />
TOTAL CHARGES FOR SERVICES 3,774,390 3,292,095 3,496,316 3,449,801<br />
FINES AND FORFEITS<br />
Fines and Forfiets<br />
Court Cases 413,673 455,000 476,983 475,000<br />
Confiscated Property-Statute 932 95,472 18,591 18,592<br />
Confiscated Cash-Statute 932 90,173 65,472 65,472<br />
Red Light Violations 175,000<br />
Police Education 35,788 35,000 35,000 35,000<br />
Library Fines 40,454 40,000 41,459 40,000<br />
Code Enforcement Board 288,342 210,000 300,000 210,000<br />
Bad Check Charges 1,962 1,500 1,222 1,000<br />
TOTAL FINES AND FORFEITS 965,863 825,563 938,727 936,000<br />
E – 14
GENERAL FUND<br />
REVENUES<br />
Experience Budget Projected Proposed<br />
For Year For Year For Year For Year<br />
2008 2009 2009 <strong>2010</strong><br />
MISCELLANEOUS REVENUE<br />
Other<br />
Insurance Proceeds - Workers Comp Claims 50,912 20,000<br />
Penalties on Assessments 20 2,607<br />
All Other Misc Revenue (95,429) 141,500 84,424 70,000<br />
Concessions-Contractual - Simpson Park 238 120<br />
Concessions-Contractual - Kelly Rec 146 48<br />
Concessions-Contractual - Gandy Pool 74 69<br />
Concessions-Contractual - Coleman Bush 64 15<br />
Concessions-Contractual - Simpson Pool 31 28<br />
Concessions-Contractual - Athletics 549<br />
Cash Over And Short 46 (85)<br />
(43,349) 141,500 107,226 70,000<br />
Sales <strong>of</strong> Fixed Assets<br />
Surplus Furniture & Equipment Sales 1,995<br />
Proceeds - Sale Of Rights 873<br />
Scrap Sales 13,753 5,401 8,265 5,000<br />
15,748 5,401 9,138 5,000<br />
Contributions & Donations<br />
Contributions & Donations 171,687 37,574 91,699<br />
Basketball Uniforms (Mid Florida Contribution 5,500<br />
Music on the Promenade 25,000<br />
Red, White, & Kaboom Celebration 25,000<br />
Simulated Impaired Driving Experience (SIDNE) 19,798 19,798<br />
Sculpture Competition 24,500<br />
Movies on the Promenade (Funded through Contributions) 12,000 6,532 6,532<br />
Expanded Cultural Opportunities 5,000<br />
268,687 63,904 118,029<br />
Refund <strong>of</strong> Prior Year Expenditures<br />
Refund <strong>of</strong> Prior Year Expenses - Gen. Govt. 351 580<br />
Refund <strong>of</strong> Prior Year Expenses - LPD 48<br />
Refund <strong>of</strong> Prior Year Expenses - Law Enforcement Trust 405<br />
804 580<br />
E – 15
GENERAL FUND<br />
REVENUES<br />
Experience Budget Projected Proposed<br />
For Year For Year For Year For Year<br />
2008 2009 2009 <strong>2010</strong><br />
Reimbursements:<br />
Miscellaneous Reimbursements 9<br />
Reimbursements / Loss Recovery 119,856 56,592 100,198<br />
Employee Computer Purchase Plan 7,778 6,700 7,704 6,000<br />
Tree And Palm Program 1,125 710 710<br />
Landscape Renovations 390<br />
Investigative Cost Reimbursement 154,841 93,559 107,698<br />
Historic Preservation Board 1,687 100 500 500<br />
Neighborhood Leadership Summit 205<br />
Facility Maintenance Reimbursements 683<br />
Park Maintenance Reimbursements 104<br />
286,678 157,661 216,810 6,500<br />
Rental <strong>of</strong> Buildings<br />
Mortgage-Church <strong>of</strong> God Gospel Tabernacle 1,473 1,474 1,492 1,500<br />
Magnolia Building - Garden Bistro 19,308 19,308 16,689 17,000<br />
20,781 20,782 18,180 18,500<br />
All Other Rents and Royalties<br />
Nextel - Antenna Tower Rent 34,385 31,740 32,137 32,000<br />
Tower Space Rental 13,239 12,288 13,637 13,500<br />
Train Station-Maintenance (10,808) 33,501 31,619 32,000<br />
Federal Bldg Maintenance 7,715 11,940<br />
Sun Trust Parking Garage - Lease 21,300 21,300 21,300 21,300<br />
Leases - Sprintcom.Inc - Bryant Stadium 12,000 12,000 31,870 31,000<br />
77,831 122,769 130,563 129,800<br />
Investment Income<br />
Interest on Pooled Investments:<br />
General Fund 1,167,106 800,791 1,150,000 485,000<br />
Hollis Gardents Maintenance Trust 37,616 30,000 40,000 35,000<br />
Cultural Activities 87,380 75,000 60,000<br />
DOJ Grant 512 210 500<br />
Law Enforcement Trust Fund 13,327 8,717 15,000 12,000<br />
Federally Forfeited Property 28,498 20,000 25,000 20,000<br />
New Recreation Facilities 26,659 14,674 30,000 20,000<br />
Other Interest Revenue 408 236<br />
Interest From County 22,911 13,000 10,578 10,000<br />
Interest from Registry Of Court 10,021 2,000 8,516 8,000<br />
Market Value Restatement (181,289)<br />
1,213,150 889,392 1,354,830 650,000<br />
E – 16
GENERAL FUND<br />
REVENUES<br />
Experience Budget Projected Proposed<br />
For Year For Year For Year For Year<br />
2008 2009 2009 <strong>2010</strong><br />
TOTAL MISCELLANEOUS REVENUE 1,840,331 1,401,409 1,955,357 879,800<br />
Transfers from Other Fund<br />
Transfer from General Fund 137,869<br />
Transfer from Transportation Fund 415,928<br />
Transfer from Public Improvement Fund 3,550,000 5,040,000 5,040,000 5,157,700<br />
Transfer from WW Operations 1,965,102 2,100,000 2,100,000 2,250,000<br />
Transfer from Solid Waste Management 1,314,720 1,314,720 1,314,720 1,275,754<br />
Transfer from Water Operations 3,902,143 4,102,143 4,102,143 4,102,143<br />
Transfer from Electric Operations 23,387,004 23,618,680 23,618,680 24,500,000<br />
Transfer from Employee Pension 54,962 54,962 54,962 54,962<br />
Transfer from Hollis Grnds. Maint. Trust 53,514 53,514 53,514 53,514<br />
Transfer from CRA 186,744<br />
Transfer from Trust Funds 138,186 176,962 176,962 44,721<br />
Transfer from Impact Fees 43,549 30,000 30,000 30,000<br />
Transfer from Disaster Fund 2,665<br />
35,152,386 36,490,981 36,490,981 37,468,794<br />
SUB-TOTAL 88,645,533 89,559,117 89,303,210 89,101,042<br />
PRIOR YEAR SURPLUS (2,363,734) 2,382,500 (1,155,726) 2,202,446<br />
TOTAL REVENUES 86,281,799 91,941,617 88,147,484 91,303,488<br />
E – 17
GENERAL FUND<br />
CITY COMMISSION<br />
Experience Budget Projected Proposed<br />
For Year For Year For Year For Year<br />
2008 2009 2009 <strong>2010</strong><br />
EXPENSES<br />
Personal Services 214,111 181,205 198,161 207,170<br />
Utilities<br />
Water Utility Service 154 165 160 167<br />
Electric Utility Service 7,877 7,934 7,807 7,879<br />
Wastewater Services 193 209 204 217<br />
Interdepartmental Solid Waste Service 362 366 363 475<br />
8,586 8,674 8,534 8,738<br />
Inter-<strong>City</strong> Services<br />
Purchasing & Stores Service 556 585 536 544<br />
Intra-dept Charges - PC & Network Support 21,048 19,749 19,749 20,211<br />
Intra-Departmental Charges - Telephone 4,290 4,957 4,957 5,054<br />
Intra-Departmental Charges - Facilities 5,808 6,075 6,075 5,985<br />
Intra-Departmental Charges - Janitorial 4,483 4,831 4,831 4,879<br />
Intra-Departmental Charges - IT Operations 987 1,039 1,039 1,019<br />
Intra-Departmental Charges/Training Ctr 49 49 45 49<br />
37,221 37,285 37,232 37,741<br />
All Other O&M<br />
Pensions 13,316 13,316 15,317 13,316<br />
Contractual Services 2,500 3,000 2,575 3,000<br />
Advertising 500 250 500<br />
Office Supplies 693 2,990 1,869 2,990<br />
Equipment - Noncapital 535 500 500<br />
Repair Of Equipment 200 500 500<br />
Printing & Photography 377 710 725 710<br />
Postage & Mailing 195 300 235 300<br />
Subscription & Membership 22,997 22,317 19,113 17,217<br />
Telephone, Communications 60 45 54 45<br />
Travel 11,482 10,000 9,550 10,000<br />
Training 35 50 35 50<br />
All Other Sundry Charges 7,545 6,000 4,341 6,000<br />
Expense Allowance 13,961 13,800 13,890 13,800<br />
Ridge League Meeting Expenses 5,021 6,000 6,000<br />
78,916 80,028 67,954 74,928<br />
E – 18
GENERAL FUND<br />
CITY COMMISSION<br />
Experience Budget Projected Proposed<br />
For Year For Year For Year For Year<br />
2008 2009 2009 <strong>2010</strong><br />
Projects<br />
<strong>City</strong> Commission Retreat 23,128 20,000 20,000 18,356<br />
Allocations<br />
Cost Allocated-Fleet Mgmt (3,233) (3,272) (3,272) (3,469)<br />
Cost Allocated-Purchasing (3,233) (3,272) (3,272) (3,469)<br />
Cost Allocated-<strong>Lakeland</strong> Center (9,699) (9,816) (9,816) (10,408)<br />
Cost Allocated-Solid Waste Management (6,466) (6,544) (6,544) (6,939)<br />
Cost Allocated-Airport (12,931) (13,088) (13,088) (13,877)<br />
Cost Allocated-Parking (3,233) (3,272) (3,272) (3,469)<br />
Cost Allocated-Wastewater (16,164) (16,360) (16,360) (17,347)<br />
Cost Allocated- Electric (161,639) (163,596) (163,596) (173,467)<br />
Cost Allocated - Water (19,720) (19,959) (19,959) (21,163)<br />
Cost Allocated - Facilities Maintenance Fund (3,233) (3,272) (3,272) (3,469)<br />
(239,551) (242,451) (242,451) (257,077)<br />
GRAND TOTAL 122,411 84,741 89,431 89,856<br />
E – 19
GENERAL FUND<br />
CITY MANAGER<br />
Experience Budget Projected Proposed<br />
For Year For Year For Year For Year<br />
2008 2009 2009 <strong>2010</strong><br />
EXPENSES<br />
Personal Services<br />
Payroll 514,682 539,013 532,937 516,642<br />
Overtime 337 10<br />
Payroll Accrual 2,139 2,926<br />
Reserve for Accumulated Benefits 624 (20,067)<br />
Medicare Contribution 7,587 10,238 7,793 10,570<br />
Pension Reserve 29,690 63,483 31,826 55,053<br />
Retirement Part-Time/Temp 318 322 291 334<br />
Defined Contribution Deduction - <strong>City</strong> Share 44,394 47,000 47,154 77,515<br />
Insurance-Group Life 959 1,333 849 502<br />
Insurance-Group Hospital 26,151 44,587 25,898 50,762<br />
Insurance-A,D & D 27 27 34 27<br />
Insurance-Disability 1,145 2,521 1,055 1,960<br />
Payroll - Auto Allowance 16,345 16,200 15,911 16,200<br />
Pension & Benefits Transfers to Projects (48,745) (63,361)<br />
Personal Services 642,259 658,051 663,760 669,130<br />
Insurance<br />
Uninsured Loss Reimbursement 250 250 270<br />
Utilities<br />
Water Utility Service 266 240 277 250<br />
Electric Utility Service 11,827 11,925 11,721 11,829<br />
Wastewater Services 289 314 306 326<br />
Interdepartmental Solid Waste Service 544 542 545 713<br />
12,925 13,021 12,849 13,118<br />
Inter-<strong>City</strong> Services<br />
Purchasing & Stores Service 1,651 1,738 1,593 1,616<br />
Intra-dept Charges - PC & Network Support 19,313 19,231 19,231 17,172<br />
Intra-Departmental Charges - Telephone 4,458 5,051 5,051 4,520<br />
Intra-Departmental Charges - Radios 322 320 320 321<br />
Intra-Departmental Charges - Facilities 8,363 8,529 8,529 8,986<br />
Intra-Departmental Charges - Janitorial 6,455 6,782 6,782 7,325<br />
Intra-Departmental Charges - IT Operations 19,978 21,029 21,029 20,617<br />
Intra-Departmental Charges/Training Ctr 246 246 226 246<br />
60,786 62,926 62,761 60,803<br />
All Other O&M<br />
Office Supplies 5,777 6,000 8,397 6,000<br />
Equipment - Noncapital 200<br />
Printing & Photography 181 400 186<br />
Postage & Mailing 1,535 1,000 14 1,000<br />
Subscription & Membership 12,399 9,379 6,764 9,379<br />
Telephone, Communications 4,268 3,000 4,665 3,000<br />
Travel 5,522 7,000 6,739 7,000<br />
Training 60 1,500<br />
All Other Sundry Charges 2,109 1,000 719 1,000<br />
31,850 29,479 27,485 27,379<br />
E – 20
GENERAL FUND<br />
CITY MANAGER<br />
Experience Budget Projected Proposed<br />
For Year For Year For Year For Year<br />
2008 2009 2009 <strong>2010</strong><br />
Allocations<br />
Cost Allocated-Fleet Mgmt (7,101) (7,637) (7,637) (7,707)<br />
Cost Allocated-Purchasing (21,304) (22,912) (22,912) (23,121)<br />
Cost Allocated-<strong>Lakeland</strong> Center (14,202) (15,275) (15,275) (15,414)<br />
Cost Allocated-Solid Waste Management (21,304) (22,912) (22,912) (23,121)<br />
Cost Allocated-Airport (56,809) (22,912) (22,912) (23,121)<br />
Cost Allocated-Parking (14,202) (15,275) (15,275) (15,414)<br />
Cost Allocated-Wastewater (71,012) (76,373) (76,373) (77,070)<br />
Cost Allocated- Electric (142,023) (152,745) (152,745) (154,140)<br />
Cost Allocated-Golf Course (7,101) (7,637) (7,637) (7,707)<br />
Cost Allocated - Water (35,506) (76,373) (76,373) (77,070)<br />
Cost Allocated - Facilities Maintenance Fund (14,202) (15,275) (15,275) (15,414)<br />
Cost Allocated - Information Technology (21,304) (22,912) (22,912) (23,121)<br />
(426,070) (458,238) (458,238) (462,420)<br />
GRAND TOTAL 321,750 305,489 308,867 308,280<br />
E – 21
GENERAL FUND<br />
PERFORMANCE EXCELLENCE<br />
Experience Budget Projected Proposed<br />
For Year For Year For Year For Year<br />
2008 2009 2009 <strong>2010</strong><br />
EXPENSES<br />
Personal Services 354,036 398,065 408,719 421,855<br />
Utilities<br />
Water Utility Service 10 5 10<br />
Electric Utility Service 487 400 483<br />
Wastewater Services 13 7 13<br />
Interdepartmental Solid Waste Service 22 11 29<br />
532 423 535<br />
Inter-<strong>City</strong> Services<br />
Purchasing & Stores Service 738 677 686<br />
Intra-dept Charges - PC & Network Support 8,118 7,125 7,125 8,904<br />
Intra-Departmental Charges - Telephone 1,093 835 835 1,329<br />
Intra-Departmental Charges - Facilities 220 220 368<br />
Intra-Departmental Charges - Janitorial 175 175 177<br />
Intra-Departmental Charges - IT Operations 3,732 3,732 3,695<br />
Intra-Departmental Charges/Training Ctr 246 226 246<br />
9,212 13,071 12,989 15,405<br />
All Other O&M<br />
Annual Audit 660 660 680 690<br />
Office Supplies 505 1,400 1,162 1,473<br />
Equipment - Noncapital 492<br />
Printing & Photography 1,328 1,550 1,509 1,400<br />
Subscription & Membership 509 1,425 1,349 1,670<br />
Telephone, Communications 1,802 2,400 2,414 1,800<br />
Travel 7,194 6,010 6,238 4,515<br />
Training 3,570<br />
All Other Sundry Charges 249 200 220 200<br />
12,738 13,645 13,572 15,318<br />
Projects<br />
Strategic Planning & Implementation 10,029 1,000 1,000<br />
RPI Event 758 27,700 23,600 8,000<br />
10,787 28,700 23,600 9,000<br />
E – 22
GENERAL FUND<br />
PERFORMANCE EXCELLENCE<br />
Experience Budget Projected Proposed<br />
For Year For Year For Year For Year<br />
2008 2009 2009 <strong>2010</strong><br />
Allocations<br />
Cost Allocated-Fleet Mgmt (4,540) (4,540) (4,621)<br />
Cost Allocated-Purchasing (13,620) (13,620) (13,863)<br />
Cost Allocated-<strong>Lakeland</strong> Center (9,080) (9,080) (9,242)<br />
Cost Allocated-Solid Waste Management (13,620) (13,620) (13,863)<br />
Cost Allocated-Airport (13,620) (13,620) (13,863)<br />
Cost Allocated-Parking (9,080) (9,080) (9,242)<br />
Cost Allocated-Wastewater (45,401) (45,401) (46,211)<br />
Cost Allocated- Electric (90,803) (90,803) (92,423)<br />
Cost Allocated-Golf Course (4,540) (4,540) (4,621)<br />
Cost Allocated - Water (45,401) (45,401) (46,211)<br />
Cost Allocated - Facilities Maintenance Fund (9,080) (9,080) (9,242)<br />
Cost Allocated - Information Technology (13,620) (13,620) (13,863)<br />
(272,405) (272,405) (277,265)<br />
GRAND TOTAL 386,773 181,608 186,898 184,848<br />
E – 23
GENERAL FUND<br />
COMMUNICATIONS<br />
Experience Budget Projected Proposed<br />
For Year For Year For Year For Year<br />
2008 2009 2009 <strong>2010</strong><br />
EXPENSES<br />
Personal Services 411,142 443,852 443,562 487,480<br />
Utilities<br />
Water Utility Service 119 160 124 167<br />
Electric Utility Service 7,877 7,943 7,807 7,879<br />
Wastewater Services 193 209 204 217<br />
Interdepartmental Solid Waste Service 362 361 363 475<br />
8,551 8,673 8,498 8,738<br />
Inter-<strong>City</strong> Services<br />
Purchasing & Stores Service 1,917 2,018 1,850 1,877<br />
Rental-Fleet Mgmt Equipment 1,764 1,971 1,945 1,764<br />
Gasoline-Fleet Mgmt Equipment 205 2,151 226 160<br />
Maintenance-Fleet Mgmt Equipment 14 1,595 569 1,993<br />
Intra-dept Charges - PC & Network Support 21,596 25,211 25,211 23,388<br />
Intra-Departmental Charges - Telephone 4,928 5,526 5,526 3,722<br />
Intra-Departmental Charges - Facilities 6,165 6,484 6,484 5,985<br />
Intra-Departmental Charges - Janitorial 4,759 5,140 5,140 4,879<br />
Intra-Departmental Charges - IT Operations 10,212 10,750 10,750 10,539<br />
Intra-Departmental Charges/Training Ctr 345 345 316 345<br />
51,905 61,191 58,017 54,652<br />
All Other O&M<br />
Contractual Services 25,905 21,500 22,999 20,500<br />
Advertising 500 175<br />
Talent Fees-Promotions 35 500<br />
Office Supplies 6,601 6,000 7,873 5,200<br />
Equipment - Noncapital 9,124 6,000 6,636 5,000<br />
Food Purchases 500 5<br />
Leases 4,151 4,200 3,639 2,200<br />
Repair Of Equipment 2,318 500 1,965 1,500<br />
Printing & Photography 1,967 1,000 2,982 2,000<br />
Postage & Mailing 382 700 858 700<br />
Subscription & Membership 1,139 1,175 1,145 1,175<br />
Telephone, Communications 1,403 3,000 1,814 2,000<br />
Travel 500 500<br />
Training 500<br />
All Other Sundry Charges 1,135 1,300 1,954 1,000<br />
Car Washing 100 50<br />
Gift Certificates 100 500<br />
54,259 48,475 52,546 41,325<br />
Capital Equipment<br />
Equipment - Capital 24,869 2,300<br />
E – 24
GENERAL FUND<br />
COMMUNICATIONS<br />
Experience Budget Projected Proposed<br />
For Year For Year For Year For Year<br />
2008 2009 2009 <strong>2010</strong><br />
Projects<br />
<strong>Lakeland</strong>gov.net Website Maintenance 18,717 6,282 12,374 15,000<br />
Boards & Committee Dinner 4,515 9,500 6,500<br />
Employee / <strong>City</strong> Manager Annual Meeting 2,203 3,000 3,000 3,000<br />
Citizens' Academy 1,036 2,000 2,000 1,000<br />
Red, White, & Kaboom Celebration 25,000 6,178<br />
Commission Chamber A/V Upgrade 28,500 32,500<br />
51,471 49,282 56,052 25,500<br />
Allocations<br />
Cost Allocated-Fleet Mgmt (5,900) (6,132) (6,132) (6,200)<br />
Cost Allocated-Purchasing (5,900) (6,132) (6,132) (6,200)<br />
Cost Allocated-<strong>Lakeland</strong> Center (5,900) (6,132) (6,132) (6,200)<br />
Cost Allocated-Solid Waste Management (11,800) (12,265) (12,265) (12,400)<br />
Cost Allocated-Airport (5,900) (6,132) (6,132) (6,200)<br />
Cost Allocated-Parking (5,900) (6,132) (6,132) (6,200)<br />
Cost Allocated-Wastewater (29,501) (24,530) (24,530) (24,800)<br />
Cost Allocated- Electric (177,005) (159,443) (159,443) (161,199)<br />
Cost Allocated-Golf Course (5,900)<br />
Cost Allocated - Water (29,501) (24,530) (24,530) (24,800)<br />
Cost Allocated - Stormwater Utility (6,132) (6,132) (6,200)<br />
Cost Allocated - Facilities Maintenance Fund (5,900) (6,132) (6,132) (6,200)<br />
Cost Allocated - Information Technology (5,900) (6,132) (6,132) (6,200)<br />
Recoveries-From Outside <strong>City</strong> (1,927)<br />
(296,934) (269,824) (269,824) (272,799)<br />
GRAND TOTAL 305,262 341,649 348,852 347,197<br />
E – 25
GENERAL FUND<br />
LEGAL<br />
Experience Budget Projected Proposed<br />
For Year For Year For Year For Year<br />
2008 2009 2009 <strong>2010</strong><br />
EXPENSES<br />
Personal Services 602,823 671,329 648,810 813,563<br />
Utilities<br />
Water Utility Service 269 281 281 292<br />
Electric Utility Service 13,801 13,916 13,678 13,804<br />
Wastewater Services 337 366 357 380<br />
Interdepartmental Solid Waste Service 635 633 636 832<br />
15,042 15,196 14,952 15,308<br />
Inter-<strong>City</strong> Services<br />
Purchasing & Stores Service 239 252 231 234<br />
Intra-dept Charges - PC & Network Support 16,394 16,396 16,396 15,475<br />
Intra-Departmental Charges - Telephone 4,931 5,641 5,641 4,254<br />
Intra-Departmental Charges - Facilities 10,176 10,644 10,644 10,487<br />
Intra-Departmental Charges - Janitorial 7,855 8,464 8,464 8,549<br />
Intra-Departmental Charges - IT Operations 2,939 3,094 3,094 3,033<br />
Intra-Departmental Charges/Training Ctr 296 296 271 296<br />
42,830 44,787 44,741 42,328<br />
All Other O&M<br />
Contractual Services 6,137 3,500 1,260 3,500<br />
Legal Fees 115,654 87,500 142,968 50,000<br />
Pr<strong>of</strong>essional Services 8,140 5,348 14,000 5,348<br />
Advertising 509<br />
Office Supplies 4,603 4,473 4,772 4,473<br />
Equipment - Noncapital 940 1,492 940<br />
Repair Of Equipment 648 908 905 200<br />
Printing & Photography 589 450 340 450<br />
Postage & Mailing 1,501 1,200 1,479 1,200<br />
Subscription & Membership 21,272 19,186 17,543 17,186<br />
Telephone, Communications 1,143 1,020 1,194 1,020<br />
Travel 4,979 6,675 4,540 6,675<br />
Training 70<br />
All Other Sundry Charges 80 150 20<br />
165,325 131,350 190,514 90,992<br />
Capital Equipment<br />
Equipment - Capital 15,000<br />
E – 26
GENERAL FUND<br />
LEGAL<br />
Experience Budget Projected Proposed<br />
For Year For Year For Year For Year<br />
2008 2009 2009 <strong>2010</strong><br />
Allocations<br />
Cost Allocated-Purchasing (33,398) (34,493) (34,493) (39,088)<br />
Cost Allocated-<strong>Lakeland</strong> Center (16,699) (17,246) (17,246) (19,544)<br />
Cost Allocated-Solid Waste Management (19,204) (19,833) (19,833) (22,475)<br />
Cost Allocated-Airport (133,594) (137,970) (137,970) (156,351)<br />
Cost Allocated-Parking (8,350) (8,623) (8,623) (9,772)<br />
Cost Allocated-Wastewater (83,495) (86,231) (86,231) (97,719)<br />
Cost Allocated- Electric (267,187) (275,940) (275,940) (351,789)<br />
Cost Allocated-Golf Course (16,699) (17,246) (17,246) (19,544)<br />
Cost Allocated - Water (31,728) (32,768) (32,768) (58,632)<br />
(610,354) (630,350) (630,350) (774,914)<br />
GRAND TOTAL 215,666 232,312 268,667 202,278<br />
E – 27
GENERAL FUND<br />
RETIREMENT SERVICES<br />
Experience Budget Projected Proposed<br />
For Year For Year For Year For Year<br />
2008 2009 2009 <strong>2010</strong><br />
EXPENSES<br />
Personal Services 277,516 315,202 266,823 310,857<br />
Utilities<br />
Water Utility Service 114 151 69 68<br />
Electric Utility Service 1,200 1,111 1,259 1,163<br />
Wastewater Services 44 46 44 48<br />
Interdepartmental Solid Waste Service 229 228 229 228<br />
1,586 1,536 1,602 1,507<br />
Inter-<strong>City</strong> Services<br />
Intra-dept Charges - PC & Network Support 8,437 8,574 8,574 8,056<br />
Intra-Departmental Charges - Telephone 1,051 1,174 1,174 1,064<br />
Intra-Departmental Charges - Facilities 3,030 3,174 3,174 1,351<br />
Intra-Departmental Charges - Janitorial 2,325 2,524 2,524 1,101<br />
Intra-Departmental Charges - IT Operations 2,717 2,860 2,860 2,804<br />
Intra-Departmental Charges/Training Ctr 246 246 226 246<br />
17,805 18,552 18,532 14,622<br />
All Other O&M<br />
Pr<strong>of</strong>essional Services 1,829<br />
Advertising 200<br />
Recruitment Expenses 12,188 350<br />
Office Supplies 6,658 1,250 3,619 2,511<br />
Equipment - Noncapital 451 490<br />
Leases 72 500 295 250<br />
Repair Of Equipment 338 250 87 100<br />
Printing & Photography (1,851) 700 250 100<br />
Postage & Mailing 800 500 987 100<br />
Subscription & Membership 495 1,050 1,135 500<br />
Telephone, Communications 171 350 1,081 750<br />
Travel 11,763 5,000 6,009 750<br />
Training 200 35<br />
All Other Sundry Charges 40 150 166<br />
31,123 10,150 15,983 5,411<br />
E – 28
GENERAL FUND<br />
RETIREMENT SERVICES<br />
Experience Budget Projected Proposed<br />
For Year For Year For Year For Year<br />
2008 2009 2009 <strong>2010</strong><br />
Allocations<br />
Cost Allocated-Fleet Mgmt (6,163) (6,406) (6,406) (10,637)<br />
Cost Allocated-Purchasing (2,054) (2,135) (2,135) (1,662)<br />
Cost Allocated-<strong>Lakeland</strong> Center (7,191) (8,541) (8,541) (5,983)<br />
Cost Allocated-Solid Waste Management (13,695) (14,946) (14,946) (4,321)<br />
Cost Allocated-Airport (1,068) (1,068) (3,324)<br />
Cost Allocated-Parking (1,027) (1,068) (1,068) (1,330)<br />
Cost Allocated-Wastewater (11,983) (13,523) (13,523) (8,642)<br />
Cost Allocated- Electric (105,797) (108,896) (108,896) (99,719)<br />
Cost Allocated-Golf Course (3,082) (3,203) (3,203) (665)<br />
Cost Allocated - Water (17,462) (14,946) (14,946) (8,975)<br />
Cost Allocated - Stormwater Fund (997)<br />
Cost Allocated - Facilities Maintenance Fund (8,217) (6,762) (6,762) (3,989)<br />
Cost Allocated - Information Technology (11,298) (11,388) (11,388) (2,659)<br />
(187,969) (192,882) (192,882) (152,903)<br />
GRAND TOTAL 140,062 152,558 110,057 179,494<br />
E – 29
GENERAL FUND<br />
CIVIL SERVICE, STAFFING AND COMPENSATION<br />
Experience Budget Projected Proposed<br />
For Year For Year For Year For Year<br />
2008 2009 2009 <strong>2010</strong><br />
EXPENSES<br />
Personal Services 738,129 685,684 667,296 674,826<br />
Utilities<br />
Water Utility Service 487 645 296 291<br />
Electric Utility Service 5,129 4,747 5,383 4,970<br />
Wastewater Services 189 198 189 195<br />
Interdepartmental Solid Waste Service 978 975 980 975<br />
6,783 6,565 6,848 6,431<br />
Inter-<strong>City</strong> Services<br />
Purchasing & Stores Service 379 399 366 371<br />
Rental-Fleet Mgmt Equipment 1,095 1,098 1,103 1,095<br />
Gasoline-Fleet Mgmt Equipment 279 1,335 219 255<br />
Maintenance-Fleet Mgmt Equipment 1,732 1,519 622 1,728<br />
Intra-dept Charges - PC & Network Support 27,229 24,870 24,870 26,616<br />
Intra-Departmental Charges - Telephone 5,008 4,556 4,556 3,988<br />
Intra-Departmental Charges - Facilities 5,386 3,174 3,174 5,777<br />
Intra-Departmental Charges - Janitorial 4,157 2,524 2,524 4,709<br />
Intra-Departmental Charges - IT Operations 6,113 6,435 6,435 6,371<br />
Intra-Departmental Charges/Training Ctr 493 493 452 493<br />
51,872 46,403 44,320 51,402<br />
All Other O&M<br />
Contractual Services 2,686 2,000 1,161 2,000<br />
Legal Fees 1,500 1,700 1,500<br />
Pr<strong>of</strong>essional Services 4,500 3,900 3,500<br />
Advertising 34,254 40,000 26,533 32,000<br />
Office Supplies 6,351 4,900 5,296 4,000<br />
Equipment - Noncapital 1,278 1,000 1,294 1,000<br />
Leases 2,947 5,188 2,104 5,000<br />
Repair Of Equipment 685 1,000 328 250<br />
Printing & Photography 136 150 98 150<br />
Postage & Mailing 2,332 4,500 1,830 3,000<br />
Subscription & Membership 808 1,300 1,093 1,300<br />
Telephone, Communications 1,308 1,200 1,641 1,200<br />
Travel 4,350 5,200 3,016 4,000<br />
Training 175 1,062 2,196 1,500<br />
All Other Sundry Charges 368 500 792 210<br />
57,678 74,000 52,982 60,610<br />
Capital Equipment<br />
Equipment - Capital 9,668 9,668 4,000<br />
E – 30
GENERAL FUND<br />
CIVIL SERVICE, STAFFING AND COMPENSATION<br />
Experience Budget Projected Proposed<br />
For Year For Year For Year For Year<br />
2008 2009 2009 <strong>2010</strong><br />
Projects<br />
RPI Event 1,129<br />
Allocations<br />
Cost Allocated-Fleet Mgmt (11,318) (14,605) (14,605) (13,554)<br />
Cost Allocated-Purchasing (5,659) (4,868) (4,868) (4,784)<br />
Cost Allocated-<strong>Lakeland</strong> Center (23,344) (19,473) (19,473) (37,472)<br />
Cost Allocated-Solid Waste Management (24,052) (34,078) (34,078) (23,918)<br />
Cost Allocated-Airport (7,973)<br />
Cost Allocated-Parking (2,122) (2,434) (2,434) (2,392)<br />
Cost Allocated-Wastewater (27,589) (30,833) (30,833) (30,296)<br />
Cost Allocated- Electric (229,198) (248,286) (248,286) (202,506)<br />
Cost Allocated-Golf Course (13,441) (7,303) (7,303) (11,162)<br />
Cost Allocated - Water (31,126) (34,078) (34,078) (27,107)<br />
Cost Allocated - Stormwater Utility (2,434) (2,434) (2,392)<br />
Cost Allocated - Facilities Maintenance Fund (16,271) (15,416) (15,416) (16,743)<br />
Cost Allocated - Information Technology (22,637) (25,964) (25,964) (18,337)<br />
(406,757) (439,772) (439,772) (398,636)<br />
GRAND TOTAL 448,834 382,548 341,343 398,633<br />
E – 31
GENERAL FUND<br />
WORKFORCE DEVELOPMENT AND LABOR RELATIONS<br />
Experience Budget Projected Proposed<br />
For Year For Year For Year For Year<br />
2008 2009 2009 <strong>2010</strong><br />
EXPENSES<br />
Personal Services 630,315 954,361 852,038 950,531<br />
Utilities<br />
Water Utility Service 278 298 290 301<br />
Electric Utility Service 44,224 42,790 46,652 48,354<br />
Wastewater Services 348 377 368 392<br />
Interdepartmental Solid Waste Service 1,240 1,832 655 11,691<br />
46,090 45,297 47,965 60,738<br />
Inter-<strong>City</strong> Services<br />
Purchasing & Stores Service 1,660 1,747 1,601 1,625<br />
Gasoline-Fleet Mgmt Equipment 532<br />
Maintenance-Fleet Mgmt Equipment 1,410<br />
Intra-dept Charges - PC & Network Support 23,514 9,980 11,980 60,781<br />
Intra-Departmental Charges - Telephone 5,569 7,246 7,246 5,849<br />
Intra-Departmental Charges - Facilities 10,486 10,968 10,968 10,805<br />
Intra-Departmental Charges - Janitorial 14,379 26,223 26,223 26,459<br />
Intra-Departmental Charges - IT Operations 36,292 38,202 36,202 43,773<br />
Intra-Departmental Charges/Training Ctr 887 887 813 887<br />
92,787 95,253 95,034 152,121<br />
All Other O&M<br />
Tuition Refund Program 91,276 100,000 117,871 100,000<br />
Contractual Services 6,274 5,000 2,837 5,000<br />
Legal Fees 6,688 7,000 4,864 7,000<br />
Advertising 1,316<br />
Office Supplies 5,453 7,000 6,798 7,000<br />
Equipment - Noncapital 1,059 1,500 1,000<br />
Service Awards & Plaques 14,389 20,000 16,578 20,000<br />
Repair Of Equipment 1,136 2,000 240 2,000<br />
Printing & Photography 3,506 4,000 3,084 5,626<br />
Postage & Mailing 275 900 290 1,000<br />
Subscription & Membership 5,877 5,100 6,399 5,100<br />
Telephone, Communications 2,451 3,900 2,565 900<br />
Travel 11,264 8,485 7,302 10,000<br />
Training 1,602 3,000 1,637<br />
All Other Sundry Charges 904 1,800 412 500<br />
Gift Certificates 6,169 2,000 5,704 2,000<br />
159,640 171,685 176,581 167,126<br />
E – 32
GENERAL FUND<br />
WORKFORCE DEVELOPMENT AND LABOR RELATIONS<br />
Experience Budget Projected Proposed<br />
For Year For Year For Year For Year<br />
2008 2009 2009 <strong>2010</strong><br />
Projects<br />
Computer Laboratory 47,706 40,213 46,674 40,000<br />
CPM Training Program 9,681 11,000 14,309<br />
Mini-Perc 3,280 10,000 10,000 10,000<br />
Employee Picnic 39,850<br />
Employee Programs 735 5,000 3,000 5,000<br />
Training Program (30,007) 21,000 21,000 21,000<br />
Internship Program 50,926 50,500 50,500 31,235<br />
Employee Computer Purchase Pla 2,145 6,700 13,203<br />
Space Study Needs Assessment 14,525 14,525<br />
124,315 158,938 173,211 107,235<br />
Allocations<br />
Cost Allocated-Fleet Mgmt (25,854) (22,469) (22,469) (20,129)<br />
Cost Allocated-Purchasing (12,927) (11,234) (11,234) (10,064)<br />
Cost Allocated-<strong>Lakeland</strong> Center (53,324) (32,299) (32,299) (64,699)<br />
Cost Allocated-Solid Waste Management (54,940) (66,003) (66,003) (50,321)<br />
Cost Allocated-Airport (14,378)<br />
Cost Allocated-Parking (4,848) (4,213) (4,213) (4,313)<br />
Cost Allocated-Wastewater (63,019) (61,790) (61,790) (60,386)<br />
Cost Allocated- Electric (523,547) (421,293) (421,293) (362,313)<br />
Cost Allocated-Golf Course (30,702) (15,447) (15,447) (20,129)<br />
Cost Allocated - Water (71,099) (64,598) (64,598) (54,635)<br />
Cost Allocated - Stormwater Utility (4,213) (4,213) (4,313)<br />
Cost Allocated - Facilities Maintenance Fund (37,165) (32,299) (32,299) (34,506)<br />
Cost Allocated - Information Technology (51,708) (50,555) (50,555) (40,257)<br />
(929,133) (786,413) (786,413) (740,443)<br />
GRAND TOTAL 124,014 639,121 558,415 697,307<br />
E – 33
GENERAL FUND<br />
COMMUNITY DEVELOPMENT - PLANNING<br />
Experience Budget Projected Proposed<br />
For Year For Year For Year For Year<br />
2008 2009 2009 <strong>2010</strong><br />
EXPENSES<br />
Personal Services 1,718,366 1,646,421 1,612,183 1,734,326<br />
Utilities<br />
Water Utility Service 617 642 592 552<br />
Electric Utility Service 31,594 31,857 28,841 26,075<br />
Wastewater Services 772 839 754 734<br />
Interdepartmental Solid Waste Service 1,453 1,448 1,342 1,198<br />
34,435 34,786 31,529 28,559<br />
Inter-<strong>City</strong> Services<br />
Purchasing & Stores Service 185 195 179 181<br />
Rental-Fleet Mgmt Equipment 3,583 3,454 3,493 3,583<br />
Gasoline-Fleet Mgmt Equipment 1,772 4,368 1,258 1,527<br />
Maintenance-Fleet Mgmt Equipment 4,366 2,979 4,129 4,263<br />
Intra-dept Charges - PC & Network Support 56,457 55,100 55,100 51,132<br />
Intra-Departmental Charges - Telephone 10,113 11,074 11,074 8,778<br />
Intra-Departmental Charges - Facilities 21,110 22,083 22,083 19,807<br />
Intra-Departmental Charges - Janitorial 16,293 17,560 17,560 16,146<br />
Intra-Departmental Charges - IT Operations 138,697 142,633 142,633 139,836<br />
Intra-Departmental Charges/Training Ctr 1,232 739 677 739<br />
253,808 260,185 258,187 245,992<br />
All Other O&M<br />
Contractual Services 9,000 2,486 9,600<br />
Advertising 8,813 8,550 6,529 7,500<br />
Office Supplies 25,433 20,000 23,074 20,000<br />
Equipment - Noncapital 1,688 2,500 1,711 1,500<br />
Printing & Photography 2,625<br />
Postage & Mailing 6,645 8,894 5,006 8,894<br />
Subscription & Membership 4,335 4,462 4,936 4,562<br />
Telephone, Communications 3,326 2,500 2,884 2,500<br />
Travel 4,895 8,230 5,405 6,000<br />
Training 5,017 3,000 2,787 3,000<br />
All Other Sundry Charges 87<br />
60,239 67,136 57,443 63,556<br />
E – 34
GENERAL FUND<br />
COMMUNITY DEVELOPMENT - PLANNING<br />
Experience Budget Projected Proposed<br />
For Year For Year For Year For Year<br />
2008 2009 2009 <strong>2010</strong><br />
Projects<br />
Neighborhood Leadership Summit 4,404 5,000 5,000<br />
Land Development Regulation Update 100,500 100,500 70,000<br />
Annexation Referendum 750 750 170<br />
Impact Fee Study Updates 21,376 13,624 13,624<br />
Transportation & Planning Consultant 81,583 62,879 62,879 8,000<br />
Title Clearing Expense - Foreclosed Property 1,695 13,305 13,305<br />
Neighborhood Preservation 207<br />
Historic Preservation Board 5,135 9,600 9,600 7,000<br />
Comprehensive Plan Update & Reprint 30,936 84,094 84,094<br />
Planning-Affordable Housing Incentive Plan 9,618 82,882 82,882<br />
Lklnd Interstate Industrial Park Buffer 82,264<br />
Sign Code Revisions 10,852 10,852<br />
Office Renovation 1,800 1,800<br />
Carillon Lakes Noise Study 12,711<br />
Enterprise Zone 70 1,000 1,000<br />
Movies on the Promenade (Funded through Contributions) 11,427 7,105 7,105<br />
Ear Vision 190 14,810 14,810<br />
Regional Connectivity Summit 20,000 20,000<br />
261,411 428,201 428,408 85,170<br />
Allocations<br />
Cost Allocated- Electric (70,105) (81,951) (81,951) (84,147)<br />
GRAND TOTAL 2,258,154 2,354,778 2,305,798 2,073,456<br />
E – 35
GENERAL FUND<br />
COMMUNITY DEVELOPMENT - CODE ENFORCEMENT<br />
Experience Budget Projected Proposed<br />
For Year For Year For Year For Year<br />
2008 2009 2009 <strong>2010</strong><br />
EXPENSES<br />
Personal Services 522,601 520,518 536,889 558,349<br />
Utilities<br />
Water Utility Service 72 128 128 131<br />
Stormwater Utility Fees 465 680 92 906<br />
Electric Utility Service 5,842 3,618 5,003 4,333<br />
Interdepartmental Solid Waste Service 69 119 119 119<br />
6,448 4,545 5,341 5,489<br />
Inter-<strong>City</strong> Services<br />
Purchasing & Stores Service 12,790 13,463 12,341 12,521<br />
Rental-Fleet Mgmt Equipment 10,517 11,620 11,489 10,517<br />
Gasoline-Fleet Mgmt Equipment 18,846 15,297 13,065 13,866<br />
Maintenance-Fleet Mgmt Equipment 10,846 15,574 16,459 18,443<br />
Intra-dept Charges - PC & Network Support 28,399 30,901 30,901 27,172<br />
Intra-Departmental Charges - Telephone 2,681 3,427 3,427 3,988<br />
Intra-Departmental Charges - Radios 3,216 3,200 3,200 3,214<br />
Intra-Departmental Charges - Facilities 1,761 1,761 4,683<br />
Intra-Departmental Charges - Janitorial 3,243 3,131 3,131 3,944<br />
Intra-Departmental Charges - IT Operations 47,389 49,883 49,883 48,905<br />
Intra-Departmental Charges/Training Ctr 591 591 542 591<br />
138,517 148,848 146,198 147,844<br />
All Other O&M<br />
Contractual Services 12,769 17,000 8,729 8,100<br />
Office Supplies 6,043 9,500 7,360 9,678<br />
Equipment - Noncapital 2,921 2,580 1,000<br />
Uniforms 1,332 1,500 1,275 800<br />
Leases 2,079 2,079<br />
Printing & Photography 2,999 3,250 2,397 3,250<br />
Postage & Mailing 5,675 7,500 6,806 7,500<br />
Subscription & Membership 578 360 375 300<br />
Telephone, Communications 12,061 12,500 10,619 10,500<br />
Travel 3,245 5,812 3,593 4,580<br />
Training 3,355 1,650 3,626 3,800<br />
48,058 64,072 49,439 49,508<br />
Projects<br />
Lot Clearing 1,417 300 1,029 1,500<br />
Demolition <strong>of</strong> Condemned Buildings 25,801 55,999 55,999 23,000<br />
Neighborhood Clean Up Project 108,655 91,957 91,957<br />
Code Enforcement Board 35,634 36,000 36,000 34,000<br />
Orangewood Land Maintenance 2,750 3,250 3,250 2,500<br />
Lease - Telecom/Code Enforcement 7,200<br />
181,456 187,506 188,235 61,000<br />
GRAND TOTAL 897,080 925,489 926,103 822,190<br />
E – 36
EXPENSES<br />
GENERAL FUND<br />
COMMUNITY DEVELOPMENT - BUILDING INSPECTION<br />
Experience Budget Projected Proposed<br />
For Year For Year For Year For Year<br />
2008 2009 2009 <strong>2010</strong><br />
Building Inspection<br />
Personal Services 1,471,580 1,522,195 1,511,496 1,125,934<br />
Insurance<br />
Uninsured Loss Reimbursement 525 525 567<br />
Utilities<br />
Water Utility Service 473 493 494 513<br />
Electric Utility Service 24,241 24,443 24,025 24,247<br />
Wastewater Services 593 644 627 683<br />
Interdepartmental Solid Waste Service 1,114 1,112 1,117 1,114<br />
26,421 26,692 26,263 26,557<br />
Inter-<strong>City</strong> Services<br />
Purchasing & Stores Service 1,119 1,178 925 1,016<br />
Rental-Fleet Mgmt Equipment 19,141 23,201 20,709 19,916<br />
Gasoline-Fleet Mgmt Equipment 24,565 30,392 16,293 20,961<br />
Maintenance-Fleet Mgmt Equipment 33,361 31,083 31,046 34,839<br />
Intra-dept Charges - PC & Network Support 60,111 59,422 59,422 56,468<br />
Intra-Departmental Charges - Telephone 8,541 13,245 12,045 9,059<br />
Intra-Departmental Charges - Facilities 20,056 21,370 18,220 18,419<br />
Intra-Departmental Charges - Janitorial 15,480 16,993 14,518 15,096<br />
Intra-Departmental Charges - IT Operations 51,271 53,969 44,255 46,580<br />
Intra-Departmental Charges/Training Ctr 1,232 1,232 964 1,232<br />
234,878 252,085 218,398 223,586<br />
All Other O&M<br />
Contractual Services 30,453 14,000 14,000 10,000<br />
Office Supplies 16,121 18,596 12,550 16,000<br />
Equipment - Noncapital 70 1,500 128 1,000<br />
Uniforms 4,181 2,000 2,968 1,800<br />
Repair Of Equipment 873 600 490 600<br />
Printing & Photography 3,326 1,450 685 750<br />
Postage & Mailing 4,777 2,470 5,591 3,500<br />
Subscription & Membership 2,720 3,352 1,721 3,000<br />
Telephone, Communications 17,966 10,000 16,421 9,000<br />
Travel 5,675 9,697 5,369 7,000<br />
Training 10,504 5,890 9,734 4,000<br />
96,665 69,555 69,657 56,650<br />
Capital Equipment<br />
Equipment - Capital 1,142 1,142 15,000<br />
E – 37
GENERAL FUND<br />
COMMUNITY DEVELOPMENT - BUILDING INSPECTION<br />
Experience Budget Projected Proposed<br />
For Year For Year For Year For Year<br />
2008 2009 2009 <strong>2010</strong><br />
Projects<br />
Appeal Board Expense 2,133 2,000 2,215 1,950<br />
Reconstruct Inspection Area 7,868 990 990<br />
10,001 2,990 3,205 1,950<br />
SUB-TOTAL 1,839,545 1,875,184 1,830,687 1,450,244<br />
Business Tax Office<br />
Personal Services 138,491 176,909 142,258 181,598<br />
Utilities<br />
Water Utility Service 62 63<br />
Electric Utility Service 2,934 2,963<br />
Wastewater Services 77 83<br />
Interdepartmental Solid Waste Service 136 136<br />
3,209 3,245<br />
Inter-<strong>City</strong> Services<br />
Purchasing & Stores Service 141 138<br />
Rental-Fleet Mgmt Equipment 2,296 2,296 2,220 2,400<br />
Gasoline-Fleet Mgmt Equipment 1,864 1,635 1,304 1,226<br />
Maintenance-Fleet Mgmt Equipment 2,894 6,572 1,805 4,326<br />
Intra-dept Charges - PC & Network Support 5,562 5,484 5,484 6,351<br />
Intra-Departmental Charges - IT Operations 6,476 6,310<br />
Intra-Departmental Charges - Telephone 923 400 1,600 1,782<br />
Intra-Departmental Charges - Facilities 2,100 2,250<br />
Intra-Departmental Charges - Janitorial 1,650 1,752<br />
Intra-Departmental Charges/Training Ctr 150 312<br />
13,540 16,387 22,930 26,847<br />
All Other O&M<br />
Office Supplies 1,572 700 1,797 600<br />
Equipment - Noncapital<br />
Uniforms 311 400 301 350<br />
Printing & Photography 776 500 428 500<br />
Postage & Mailing 1,745 3,300 6,600 3,200<br />
Subscription & Membership 90 90<br />
4,494 4,900 9,125 4,740<br />
SUB-TOTAL 156,525 198,196 177,522 216,430<br />
GRAND TOTAL 1,996,070 2,073,380 2,008,209 1,666,674<br />
E – 38
GENERAL FUND<br />
RISK MANAGEMENT<br />
Experience Budget Projected Proposed<br />
For Year For Year For Year For Year<br />
2008 2009 2009 <strong>2010</strong><br />
EXPENSES<br />
Personal Services 976,393 1,026,786 1,023,502 1,066,939<br />
Insurance<br />
Uninsured Loss Reimbursement 1,000 1,000 1,128<br />
Utilities<br />
Water Utility Service 157 162 192 179<br />
Electric Utility Service 8,597 7,632 8,486 7,486<br />
Wastewater Services 289 310 351 334<br />
Interdepartmental Solid Waste Service 1,449 1,445 1,452 1,445<br />
10,492 9,549 10,481 9,444<br />
Inter-<strong>City</strong> Services<br />
Purchasing & Stores Service 6,417 6,755 6,192 6,620<br />
Rental-Fleet Mgmt Equipment 9,307 10,094 10,009 9,307<br />
Gasoline-Fleet Mgmt Equipment 12,487 12,831 8,883 12,800<br />
Maintenance-Fleet Mgmt Equipment 9,180 17,535 13,159 18,077<br />
Intra-dept Charges - PC & Network Support 32,223 30,719 30,719 30,105<br />
Intra-Departmental Charges - Telephone 11,434 11,993 11,993 11,753<br />
Intra-Departmental Charges - Radios 2,251 2,251 2,251 2,206<br />
Intra-Departmental Charges - Facilities 8,458 7,483 7,483 7,362<br />
Intra-Departmental Charges - Janitorial 6,528 5,951 5,951 6,001<br />
Intra-Departmental Charges - IT Operations 26,027 27,397 27,397 26,849<br />
Intra-Departmental Charges/Training Ctr 739 739 677 739<br />
125,051 133,748 124,715 131,819<br />
All Other O&M<br />
Contractual Services 7,133 7,291 3,930 7,991<br />
Pr<strong>of</strong>essional Services 41,160 72,830 35,532 72,830<br />
Office Supplies 11,537 9,950 10,050 9,730<br />
Equipment - Noncapital 1,250 981 1,250<br />
All Other Materials & Supplies 5,341 14,685 1,369 4,050<br />
Uniforms 296 300 295 300<br />
Leases 3,428 3,500 3,132 5,800<br />
Repair Of Equipment 2,181 2,500 440 200<br />
Printing & Photography 1,589 3,290 1,509 3,290<br />
Postage & Mailing 2,613 3,391 2,742 3,391<br />
Subscription & Membership 1,425 1,569 1,054 1,439<br />
Telephone, Communications 4,855 3,900 4,206 3,900<br />
Travel 47 3,225 100 1,700<br />
Training 1,530 3,000 2,893 3,000<br />
All Other Sundry Charges 70 125 72 125<br />
Licenses & Permits 90 180 150 180<br />
83,293 130,986 68,456 119,176<br />
E – 39
GENERAL FUND<br />
RISK MANAGEMENT<br />
Experience Budget Projected Proposed<br />
For Year For Year For Year For Year<br />
2008 2009 2009 <strong>2010</strong><br />
Projects<br />
Safety Program 49,947 63,500 63,500 33,500<br />
Emergency Management 26,908 15,986 26,881 15,000<br />
Safety Incentive Program 375<br />
HealthStat Clinic Services 54,500 54,500 54,500<br />
76,855 133,986 145,256 103,000<br />
Allocations<br />
Cost Allocated-Fleet Mgmt (24,519) (25,534) (25,534) (24,336)<br />
Cost Allocated-Purchasing (8,173) (8,511) (8,511) (7,158)<br />
Cost Allocated-<strong>Lakeland</strong> Center (21,795) (22,697) (22,697) (21,473)<br />
Cost Allocated-Solid Waste Management (32,693) (36,882) (36,882) (85,890)<br />
Cost Allocated-Airport (12,260) (12,767) (12,767) (21,473)<br />
Cost Allocated-Parking (2,725) (2,837) (2,837) (2,863)<br />
Cost Allocated-Wastewater (36,779) (39,720) (39,720) (57,260)<br />
Cost Allocated- Electric (520,362) (529,121) (529,121) (536,815)<br />
Cost Allocated-Golf Course (9,535) (8,511) (8,511) (4,295)<br />
Cost Allocated - Water (85,819) (85,113) (85,113) (83,027)<br />
Cost Allocated - Stormwater Utility (5,674) (5,674) (2,863)<br />
Cost Allocated - Facilities Maintenance Fund (20,434) (21,278) (21,278) (20,041)<br />
Cost Allocated - Information Technology (25,882) (26,953) (26,953) (22,904)<br />
(800,976) (825,598) (825,598) (890,398)<br />
GRAND TOTAL 471,108 610,457 547,813 541,108<br />
E – 40
GENERAL FUND<br />
INTERNAL AUDIT<br />
Experience Budget Projected Proposed<br />
For Year For Year For Year For Year<br />
2008 2009 2009 <strong>2010</strong><br />
EXPENSES<br />
Personal Services 156,327 158,476 163,561 168,444<br />
Utilities<br />
Water Utility Service 73 76 76 79<br />
Electric Utility Service 3,718 3,749 3,685 3,719<br />
Wastewater Services 91 99 96 102<br />
Interdepartmental Solid Waste Service 171 170 171 224<br />
4,052 4,094 4,028 4,124<br />
Inter-<strong>City</strong> Services<br />
Purchasing & Stores Service 46 48 44 45<br />
Intra-dept Charges - PC & Network Support 4,991 5,227 5,227 4,686<br />
Intra-Departmental Charges - Telephone 808 929 929 798<br />
Intra-Departmental Charges - Facilities 2,742 2,868 2,868 2,826<br />
Intra-Departmental Charges - Janitorial 2,117 2,281 2,281 2,304<br />
Intra-Departmental Charges - IT Operations 4,519 4,757 4,757 4,664<br />
Intra-Departmental Charges/Training Ctr 99 99 91 99<br />
15,322 16,209 16,197 15,422<br />
All Other O&M<br />
Office Supplies 964 1,000 692 800<br />
Subscription & Membership 320 525 225 450<br />
Telephone, Communications 1 20 2 20<br />
Travel 79 100 50<br />
Training 1,200 1,200 849 1,200<br />
2,564 2,845 1,767 2,520<br />
Allocations<br />
Cost Allocated-Fleet Mgmt (8,729) (9,081) (9,081) (9,526)<br />
Cost Allocated-Purchasing (6,982) (7,265) (7,265) (7,620)<br />
Cost Allocated-<strong>Lakeland</strong> Center (8,729) (9,081) (9,081) (9,526)<br />
Cost Allocated-Solid Waste Management (3,491) (3,632) (3,632) (3,810)<br />
Cost Allocated-Airport (8,729) (9,081) (9,081) (9,526)<br />
Cost Allocated-Wastewater (3,491) (3,632) (3,632) (3,810)<br />
Cost Allocated- Electric (69,828) (72,650) (72,650) (76,204)<br />
Cost Allocated-Golf Course (3,491) (3,632) (3,632) (3,810)<br />
Cost Allocated - Water (5,237) (5,449) (5,449) (5,715)<br />
Cost Allocated - Facilities Maintenance Fund (1,746) (1,816) (1,816) (1,905)<br />
Cost Allocated - Information Technology (3,491) (3,632) (3,632) (3,810)<br />
(123,944) (128,951) (128,951) (135,262)<br />
GRAND TOTAL 54,321 52,673 56,602 55,248<br />
E – 41
GENERAL FUND<br />
FINANCE - CENTRAL ACCOUNTING<br />
Experience Budget Projected Proposed<br />
For Year For Year For Year For Year<br />
2008 2009 2009 <strong>2010</strong><br />
Personal Services 1,615,334 1,677,213 1,614,832 1,683,645<br />
Utilities<br />
Water Utility Service 442 450 456 469<br />
Electric Utility Service 22,624 22,325 22,022 22,146<br />
Wastewater Services 553 588 579 624<br />
Interdepartmental Solid Waste Service 1,040 1,015 1,031 1,017<br />
24,658 24,378 24,088 24,256<br />
Inter-<strong>City</strong> Services<br />
Purchasing & Stores Service 1,098 1,156 1,060 1,075<br />
Intra-dept Charges - PC & Network Support 54,363 53,800 53,800 50,438<br />
Intra-Departmental Charges - Telephone 9,628 10,221 10,221 9,310<br />
Intra-Departmental Charges - Facilities 16,680 17,075 17,075 16,823<br />
Intra-Departmental Charges - Janitorial 12,874 13,578 13,578 13,713<br />
Intra-Departmental Charges - IT Operations 183,565 193,226 193,226 189,437<br />
Intra-Departmental Charges/Training Ctr 1,183 1,183 1,084 1,183<br />
279,391 290,239 290,044 281,979<br />
All Other O&M<br />
Contractual Services 46<br />
Banking Service 10,538 11,000 11,079 11,000<br />
Pr<strong>of</strong>essional Services 800 1,000 1,000<br />
Advertising 1,734 2,000 2,000<br />
Annual Audit 34,042 34,000 32,982 35,020<br />
Office Supplies 20,786 18,512 15,221 18,250<br />
Equipment - Noncapital 800 1,000 921 1,000<br />
Repair Of Equipment 1,728 1,200 1,952 1,800<br />
Printing & Photography 1,876 3,000 2,719 3,000<br />
Postage & Mailing 22,544 21,500 23,683 22,000<br />
Subscription & Membership 2,793 5,400 3,011 5,000<br />
Telephone, Communications 1,906 1,600 1,430 1,600<br />
Travel 4,387 5,300 2,124 4,000<br />
Training 1,541 3,500 2,108 3,500<br />
All Other Sundry Charges 600 51 100<br />
Fines & Penalties 6,273<br />
111,794 109,612 97,282 109,270<br />
Projects<br />
Maximo Upgrade <strong>City</strong> Wide 214<br />
E – 42
GENERAL FUND<br />
FINANCE - CENTRAL ACCOUNTING<br />
Experience Budget Projected Proposed<br />
For Year For Year For Year For Year<br />
2008 2009 2009 <strong>2010</strong><br />
Allocations<br />
Cost Allocated-Fleet Mgmt (112,390) (102,971) (102,971) (113,354)<br />
Cost Allocated-Purchasing (55,092) (48,333) (48,333) (35,686)<br />
Cost Allocated-<strong>Lakeland</strong> Center (77,130) (69,348) (69,348) (58,776)<br />
Cost Allocated-Solid Waste Management (90,353) (63,043) (63,043) (69,272)<br />
Cost Allocated-Airport (37,463) (35,725) (35,725) (54,578)<br />
Cost Allocated-Parking (28,648) (29,420) (29,420) (25,190)<br />
Cost Allocated-Wastewater (88,149) (77,753) (77,753) (75,569)<br />
Cost Allocated- Electric (370,224) (477,027) (477,027) (407,235)<br />
Cost Allocated-Golf Course (81,001) (56,739) (56,739) (52,479)<br />
Cost Allocated - Water (72,722) (90,362) (90,362) (98,660)<br />
Cost Allocated - Stormwater Utility (35,725) (35,725) (29,388)<br />
Cost Allocated - Facilities Maintenance Fund (66,111) (56,739) (56,739) (67,173)<br />
Cost Allocated - Information Technology (88,149) (96,666) (96,666) (94,462)<br />
(1,167,432) (1,239,851) (1,239,851) (1,181,822)<br />
GRAND TOTAL 863,959 861,591 786,394 917,328<br />
E – 43
GENERAL FUND<br />
FINANCE - CITY CLERK<br />
Experience Budget Projected Proposed<br />
For Year For Year For Year For Year<br />
2008 2009 2009 <strong>2010</strong><br />
EXPENSES<br />
Personal Services 282,463 294,624 291,322 304,906<br />
Utilities<br />
Water Utility Service 235 255 239 358<br />
Electric Utility Service 19,477 19,096 17,824 16,578<br />
Wastewater Services 349 367 356 200<br />
Interdepartmental Solid Waste Service 3,137 3,355 3,189 438<br />
23,198 23,073 21,608 17,574<br />
Inter-<strong>City</strong> Services<br />
Purchasing & Stores Service 1,301 1,370 1,256 1,274<br />
Intra-dept Charges - PC & Network Support 15,891 16,147 16,147 15,226<br />
Intra-Departmental Charges - Telephone 2,098 2,600 2,600 1,862<br />
Intra-Departmental Charges - Facilities 27,766 29,446 29,446 28,612<br />
Intra-Departmental Charges - Janitorial 33,780 36,742 36,742 36,764<br />
Intra-Departmental Charges - IT Operations 23,914 25,173 25,173 24,679<br />
Intra-Departmental Charges/Training Ctr 246 246 226 246<br />
104,996 111,724 111,589 108,663<br />
All Other O&M<br />
Advertising 14,402 10,300 14,818 13,000<br />
Office Supplies 1,657 1,700 1,603 1,200<br />
All Other Materials & Supplies 233 600 153 250<br />
Repair Of Equipment 4,514 5,891 4,511 4,641<br />
Printing & Photography 22 50 50<br />
Postage & Mailing 206 800 281 500<br />
Subscription & Membership 983 1,035 854 850<br />
Telephone, Communications 50 71 46 71<br />
Travel 5,505 7,163 5,148 6,200<br />
Training 304 700 763 500<br />
All Other Sundry Charges 112 188<br />
27,875 28,422 28,364 27,262<br />
Capital Equipment<br />
Equipment - Capital 4,475 1,219<br />
E – 44
GENERAL FUND<br />
FINANCE - CITY CLERK<br />
Experience Budget Projected Proposed<br />
For Year For Year For Year For Year<br />
2008 2009 2009 <strong>2010</strong><br />
Projects<br />
Code Enforcement Board 2<br />
Election Expense 92,898 3,517 3,517 95,000<br />
Document Shredding 1,552 3,000 3,000 1,000<br />
94,452 6,517 6,517 96,000<br />
Allocations<br />
Cost Allocated-Purchasing (2,229) (13,915) (13,915) (16,669)<br />
Cost Allocated-<strong>Lakeland</strong> Center (16,235) (16,235) (19,447)<br />
Cost Allocated-Airport (3,565) (4,638) (4,638) (5,556)<br />
Cost Allocated-Wastewater (4,456) (19,447)<br />
Cost Allocated- Electric (28,968) (25,511) (25,511) (30,559)<br />
Cost Allocated - Water (4,456) (16,235) (16,235) (19,447)<br />
(43,674) (76,534) (76,534) (111,125)<br />
GRAND TOTAL 493,785 387,826 382,867 444,499<br />
E – 45
GENERAL FUND<br />
FINANCE - TREASURER<br />
Experience Budget Projected Proposed<br />
For Year For Year For Year For Year<br />
2008 2009 2009 <strong>2010</strong><br />
EXPENSES<br />
Personal Services 611,569 583,686 492,516 439,061<br />
Inter-<strong>City</strong> Services<br />
Purchasing & Stores Service 1,364 1,436 1,316 1,335<br />
Intra-dept Charges - PC & Network Support 24,954 27,189 27,189 14,302<br />
Intra-Departmental Charges - Telephone 3,849 3,989 3,989 3,988<br />
Intra-Departmental Charges - IT Operations 46,497 48,944 48,944 47,984<br />
Intra-Departmental Charges/Training Ctr 641 641 588 641<br />
77,305 82,199 82,026 68,250<br />
All Other O&M<br />
Contractual Services 12,603 12,450 7,976 7,550<br />
Office Supplies 9,021 11,234 8,170 8,000<br />
Equipment - Noncapital 1,174 1,400 302 500<br />
Repair Of Equipment 17,055 19,200 17,241 17,000<br />
Printing & Photography 2,353 1,750 1,236 1,750<br />
Postage & Mailing 1,743 2,140 1,558 2,100<br />
Subscription & Membership 52 200 100<br />
Telephone, Communications 1,044 900 509 300<br />
Travel 24 100<br />
Training 70 90<br />
45,140 49,464 36,992 37,300<br />
Allocations<br />
Cost Allocated-Fleet Mgmt (741) (715) (715) (1,089)<br />
Cost Allocated-Purchasing (545)<br />
Cost Allocated-<strong>Lakeland</strong> Center (11,981)<br />
Cost Allocated-Solid Waste Management (20,760) (18,599) (18,599) (16,338)<br />
Cost Allocated-Airport (11,122) (7,869) (7,869) (9,803)<br />
Cost Allocated-Parking (741) (715) (715) (8,714)<br />
Cost Allocated-Wastewater (33,365) (30,045) (30,045) (21,784)<br />
Cost Allocated- Electric (607,246) (608,763) (608,763) (359,444)<br />
Cost Allocated- Cleveland Heights (8,169)<br />
Cost Allocated - Water (42,263) (35,768) (35,768) (32,677)<br />
(716,238) (702,474) (702,474) (470,544)<br />
GRAND TOTAL 17,777 12,875 (90,940) 74,068<br />
E – 46
GENERAL FUND<br />
FINANCE - ELECTRIC UTILITY FINANCE<br />
Experience Budget Projected Proposed<br />
For Year For Year For Year For Year<br />
2008 2009 2009 <strong>2010</strong><br />
EXPENSES<br />
Personal Services 856,617 889,413 858,242 896,034<br />
Inter-<strong>City</strong> Services<br />
Purchasing & Stores Service 147 155 142 10,535<br />
Intra-dept Charges - PC & Network Support 25,217 26,693 25,993 21,944<br />
<strong>Lakeland</strong> Electric Charges 135,443 135,443 135,443<br />
Intra-Departmental Charges - Telephone 3,810 5,129 5,129 3,988<br />
Intra-Departmental Charges - IT Operations 41,222 43,392 43,392 42,541<br />
Intra-Departmental Charges/Training Ctr 542 542 497 542<br />
70,938 211,354 210,596 214,993<br />
All Other O&M<br />
Subscription & Membership 750 714 1,290 1,310<br />
Travel 1,315 1,700 1,910 1,635<br />
Training 585 700 611 280<br />
2,650 3,114 3,812 3,225<br />
Projects<br />
Maximo Upgrade <strong>City</strong> Wide 1,716<br />
Allocations<br />
Cost Allocated- Electric (896,463) (1,081,803) (1,081,803) (1,114,252)<br />
Cost Allocated - Water (18,295) (22,078) (22,078)<br />
(914,758) (1,103,881) (1,103,881) (1,114,252)<br />
GRAND TOTAL 17,163 (31,231)<br />
E – 47
GENERAL FUND<br />
FINANCE - CUSTOMER BILLING<br />
Experience Budget Projected Proposed<br />
For Year For Year For Year For Year<br />
2008 2009 2009 <strong>2010</strong><br />
Personal Services 617,794 651,502 621,262 641,176<br />
Utilities<br />
Water Utility Service 164 170 171 177<br />
Electric Utility Service 8,382 8,451 8,307 8,383<br />
Wastewater Services 205 223 217 231<br />
Interdepartmental Solid Waste Service 385 384 386 505<br />
9,135 9,228 9,081 9,296<br />
Inter-<strong>City</strong> Services<br />
Purchasing & Stores Service 4,421 4,654 4,266 4,328<br />
Intra-dept Charges - PC & Network Support 21,023 20,231 20,231 19,803<br />
Intra-Departmental Charges - Telephone 7,474 7,290 7,290 6,384<br />
Intra-Departmental Charges - Facilities 6,181 6,464 6,464 6,368<br />
Intra-Departmental Charges - Janitorial 4,770 5,140 5,140 5,191<br />
Intra-Departmental Charges - IT Operations 60,428 63,608 63,608 62,361<br />
Intra-Departmental Charges/Training Ctr 591 591 542 591<br />
104,888 107,978 107,541 105,026<br />
All Other O&M<br />
Contractual Services 24,219 28,000 23,679<br />
Office Supplies 3,614 5,500 2,871 4,500<br />
Repair Of Equipment 808 1,000 806 1,000<br />
Printing & Photography 2,467 2,500 1,326 1,800<br />
Postage & Mailing 4,314 4,000 3,555 4,000<br />
Subscription & Membership 87 100 90 100<br />
Telephone, Communications 286 300 259 300<br />
Travel 3,767 5,400 1,963 4,000<br />
Training 743 1,000 854 1,000<br />
40,304 47,800 35,403 16,700<br />
Capital Equipment<br />
Equipment - Capital 6,700<br />
Allocations<br />
Cost Allocated-Solid Waste Management (200,706) (146,971) (146,971) (155,780)<br />
Cost Allocated-Wastewater (136,481) (187,797) (187,797) (194,725)<br />
Cost Allocated- Electric (72,254) (114,311) (114,311) (38,945)<br />
Cost Allocated - Water (184,650) (220,457) (220,457) (194,725)<br />
Cost Allocated - Stormwater Utility (72,254) (73,486) (73,486) (77,890)<br />
(666,345) (743,022) (743,022) (662,065)<br />
GRAND TOTAL 105,776 73,486 30,264 116,833<br />
E – 48
GENERAL FUND<br />
FIRE<br />
Experience Budget Projected Proposed<br />
For Year For Year For Year For Year<br />
2008 2009 2009 <strong>2010</strong><br />
EXPENSES<br />
Administration<br />
Personal Services<br />
Personal Services 11,322,315 11,751,420 11,663,400 2,267,188<br />
Insurance<br />
Uninsured Loss Reimbursement 1,000 750 750 840<br />
Utilities<br />
Water Utility Service 24,544 25,389 26,785 5,708<br />
Electric Utility Service 134,444 135,379 126,878 34,975<br />
Wastewater Services 25,714 26,680 28,646 12,028<br />
Interdepartmental Solid Waste Service 13,489 13,480 13,594 1,532<br />
198,192 200,928 195,902 54,243<br />
Inter-<strong>City</strong> Services<br />
Purchasing & Stores Service 10,589 11,146 10,217 10,366<br />
Maintenance-Fleet Mgmt Equipment 48<br />
Intra-dept Charges - PC & Network Support 128,915 101,543 101,543 17,739<br />
Intra-Departmental Charges - Telephone 11,285 13,132 13,132 4,520<br />
Intra-Departmental Charges - Radios 29,904 29,904 29,904 29,888<br />
Intra-Departmental Charges - Facilities 171,731 179,881 179,881 13,694<br />
Intra-Departmental Charges - Janitorial 30,244 32,638 32,638 11,163<br />
Intra-Departmental Charges - IT Operations 60,701 63,896 63,896 62,643<br />
Intra-Departmental Charges/Training Ctr 7,440 7,440 6,820 7,440<br />
450,857 439,580 438,031 157,453<br />
All Other O&M<br />
Contractual Services 912 1,200 881 240<br />
Office Supplies 8,710 9,500 7,499 2,375<br />
Equipment - Noncapital 14,478 16,000 10,561 1,600<br />
All Other Materials & Supplies 4,033 4,000 2,085 800<br />
Uniforms 28,488 30,000 27,844 900<br />
Chemicals 6,477 6,500 7,449<br />
Tools & Implements 2,416 2,500 3,104<br />
Auto/Heavy Equipment Fuel 162,749 182,784 114,892<br />
License Tags 226 300 83<br />
Fire Fighting Accessories 50,261 50,400 50,400<br />
Leases 6,322 5,500 6,382 2,750<br />
Rentals 350<br />
Repair Of Equipment 19,116 25,000 22,787<br />
Printing & Photography 1,695 1,800 1,816 540<br />
Postage & Mailing 1,730 1,917 925 1,917<br />
Subscription & Membership 1,290 2,375 1,220 1,093<br />
Telephone, Communications 29,246 26,000 27,911 2,080<br />
Travel 3,152 5,000 3,066 1,200<br />
Laundry & Dry Cleaning 33,053 40,000 31,712 1,200<br />
All Other Sundry Charges 1,846 2,300 1,499 2,300<br />
Repair Of Motor Equipment 65,625 60,335 87,229<br />
S<strong>of</strong>tware License & Maintenance 1,350 1,350 1,025<br />
443,173 475,111 410,369 18,995<br />
E – 49
GENERAL FUND<br />
FIRE<br />
Experience Budget Projected Proposed<br />
For Year For Year For Year For Year<br />
2008 2009 2009 <strong>2010</strong><br />
Capital Equipment<br />
Equipment - Capital 28,649 44,918 44,918<br />
Operating Projects<br />
Florida EMS County Award Grant 2,771<br />
SUB-TOTAL 12,446,957 12,912,707 12,753,369 2,498,719<br />
Operations<br />
Personal Services 9,298,170<br />
Utilities<br />
Water Utility Service 16,042<br />
Electric Utility Service 82,012<br />
Wastewater Services 18,413<br />
Interdepartmental Solid Waste Service 8,186<br />
124,653<br />
Inter-<strong>City</strong> Services<br />
Intra-dept Charges - PC & Network Support 71,347<br />
Intra-Departmental Charges - Telephone 8,242<br />
Intra-Departmental Charges - Facilities 137,083<br />
Intra-Departmental Charges - Janitorial 10,590<br />
227,262<br />
All Other O&M<br />
Contractual Services 720<br />
Office Supplies 2,850<br />
Equipment - Noncapital 9,600<br />
All Other Materials & Supplies 800<br />
Uniforms 26,700<br />
Chemicals 6,500<br />
Fire Fighting Accessories 50,400<br />
Printing & Photography 360<br />
Telephone, Communications 23,400<br />
Travel 3,800<br />
Laundry & Dry Cleaning 34,930<br />
160,060<br />
Capital Equipment<br />
Equipment - Capital 10,000<br />
E – 50
GENERAL FUND<br />
FIRE<br />
Experience Budget Projected Proposed<br />
For Year For Year For Year For Year<br />
2008 2009 2009 <strong>2010</strong><br />
Operating Projects<br />
Hydrant Markers 1,409 1,500 1,500 1,500<br />
Intersection Control Equipment 7,652 4,000 4,000 4,000<br />
Maintenance & Replacement <strong>of</strong> Fire Hose 8,209 7,500 7,500 7,500<br />
EMS Operations 10,144 10,500 10,575 10,500<br />
Urban Search and Rescuse Team (USAR) 13,792 20,000 20,000 15,000<br />
ARFF Training 4,052 15,000 15,000 15,000<br />
Brevard County Wildland Fires 3,999<br />
Fireman's Fund Heritage Program 13,728<br />
62,983 58,500 58,575 53,500<br />
SUB-TOTAL 62,983 58,500 58,575 9,873,645<br />
Training<br />
Personal Services 91,828<br />
Utilities<br />
Water Utility Service 6,963<br />
Electric Utility Service 1,178<br />
Wastewater Services 187<br />
Interdepartmental Solid Waste Service 3,852<br />
12,180<br />
Inter-<strong>City</strong> Services<br />
Intra-dept Charges - PC & Network Support 1,502<br />
Intra-Departmental Charges - Telephone 266<br />
Intra-Departmental Charges - Facilities 12,501<br />
14,269<br />
All Other O&M<br />
Contractual Services 240<br />
Office Supplies 950<br />
Equipment - Noncapital 1,600<br />
All Other Materials & Supplies 800<br />
Uniforms 300<br />
Printing & Photography 360<br />
Subscription & Membership 95<br />
Telephone, Communications 260<br />
Laundry & Dry Cleaning 400<br />
5,005<br />
Operating Projects<br />
Training Project 30,241 30,723 30,723 27,000<br />
Paramedic Training 4,018 25,000 25,000 25,000<br />
<strong>City</strong> University 4,720 8,000 8,000 3,500<br />
FIRE Training 913<br />
Police Standards for New Fire Inspectors 834 2,666 2,666<br />
40,726 66,389 66,389 55,500<br />
SUB-TOTAL 40,726 66,389 66,389 178,782<br />
E – 51
GENERAL FUND<br />
FIRE<br />
Experience Budget Projected Proposed<br />
For Year For Year For Year For Year<br />
2008 2009 2009 <strong>2010</strong><br />
Fire Safety Management<br />
Personal Services 707,599<br />
Inter-<strong>City</strong> Services<br />
Intra-dept Charges - PC & Network Support 11,935<br />
Intra-Departmental Charges - Telephone 2,127<br />
Intra-Departmental Charges - Facilities 13,694<br />
Intra-Departmental Charges - Janitorial 11,163<br />
38,919<br />
All Other O&M<br />
Office Supplies 2,850<br />
Equipment - Noncapital 1,600<br />
All Other Materials & Supplies 800<br />
Uniforms 1,800<br />
Leases 2,750<br />
Printing & Photography 360<br />
Subscription & Membership 1,187<br />
Laundry & Dry Cleaning 2,400<br />
Capital Equipment<br />
Equipment - Capital<br />
13,747<br />
Operating Projects<br />
Fire Safety Management 19,698 24,300 24,600 24,300<br />
Fire Prevention Week 3,007 3,100 3,100 3,100<br />
22,705 27,400 27,700 27,400<br />
SUB-TOTAL 22,705 27,400 27,700 787,665<br />
E – 52
GENERAL FUND<br />
FIRE<br />
Experience Budget Projected Proposed<br />
For Year For Year For Year For Year<br />
2008 2009 2009 <strong>2010</strong><br />
Maintenance<br />
Personal Services 212,189<br />
Inter-<strong>City</strong> Services<br />
Intra-dept Charges - PC & Network Support 1,505<br />
Intra-Departmental Charges - Telephone 266<br />
1,771<br />
All Other O&M<br />
Office Supplies 475<br />
Equipment - Noncapital 1,600<br />
All Other Materials & Supplies 800<br />
Uniforms 300<br />
Tools & Implements 2,500<br />
Auto/Heavy Equipment Fuel 160,000<br />
License Tags 300<br />
Rentals 350<br />
Repair Of Equipment 25,000<br />
Printing & Photography 180<br />
Telephone, Communications 260<br />
Laundry & Dry Cleaning 800<br />
Repair Of Motor Equipment 60,335<br />
S<strong>of</strong>tware License & Maintenance 1,350<br />
254,250<br />
Capital Equipment<br />
Equipment - Capital 10,500<br />
SUB-TOTAL 478,710<br />
GRAND TOTAL 12,573,371 13,064,996 12,906,034 13,817,521<br />
E – 53
GENERAL FUND<br />
POLICE<br />
Experience Budget Projected Proposed<br />
For Year For Year For Year For Year<br />
2008 2009 2009 <strong>2010</strong><br />
Personal Services 23,317,549 24,351,019 23,717,602 25,399,287<br />
Insurance<br />
Uninsured Loss Reimbursement (145) 1,500 1,500 1,960<br />
Utilities<br />
Water Utility Service 8,641 11,331 6,239 7,098<br />
Stormwater Utility Fees 226 171 443 446<br />
Electric Utility Service 382,814 386,590 386,061 382,568<br />
Wastewater Services 6,361 6,881 6,948 7,020<br />
Interdepartmental Solid Waste Service 8,306 8,260 8,468 8,498<br />
406,349 413,233 408,159 405,630<br />
Inter-<strong>City</strong> Services<br />
Purchasing & Stores Service 23,401 24,633 22,580 22,909<br />
Rental-Fleet Mgmt Equipment 770,717 669,887 701,209 754,468<br />
Gasoline-Fleet Mgmt Equipment 838,198 1,122,263 604,579 718,379<br />
Maintenance-Fleet Mgmt Equipment 976,377 800,400 902,622 923,546<br />
Intra-dept Charges - PC & Network Support 473,522 569,780 569,780 648,207<br />
Intra-Departmental Charges - Telephone 91,816 104,643 104,643 122,302<br />
Intra-Departmental Charges - Radios 191,964 191,964 191,964 192,503<br />
Intra-Departmental Charges - Facilities 189,429 218,418 218,418 215,209<br />
Intra-Departmental Charges - Janitorial 145,917 157,464 157,464 158,808<br />
Intra-Departmental Charges - IT Operations 1,274,910 1,342,011 1,342,011 1,222,270<br />
Intra-Departmental Charges/Training Ctr 18,280 18,280 16,757 18,280<br />
4,994,530 5,219,743 4,832,027 4,996,881<br />
E – 54
GENERAL FUND<br />
POLICE<br />
Experience Budget Projected Proposed<br />
For Year For Year For Year For Year<br />
2008 2009 2009 <strong>2010</strong><br />
All Other O&M<br />
Contractual Services 16,456 45,490 39,897 43,930<br />
Pr<strong>of</strong>essional Services 15,422 15,580 20,762 15,580<br />
Advertising 389 1,200 816 1,200<br />
Office Supplies 82,477 86,200 73,556 88,927<br />
Equipment - Noncapital 26,491 42,959 43,234 39,095<br />
All Other Materials & Supplies 35,778 40,508 42,007 39,584<br />
Uniforms 97,890 114,917 114,917 114,917<br />
Auto/Heavy Equipment Fuel 1,000<br />
License Tags 1,144 1,250 1,139 1,500<br />
Crime Prevention Material 3,222 4,000 2,214 4,000<br />
Food & Supplies for Animals 6,498 6,000 5,490 6,500<br />
Training - Ammunition 11,008 12,300 9,103 12,300<br />
Leases 99,331 103,973 103,742 141,400<br />
Repair Of Equipment 60,926 65,114 54,638 57,142<br />
Printing & Photography 13,306 20,500 20,500 17,500<br />
Postage & Mailing 13,515 13,500 9,604 13,500<br />
Subscription & Membership 15,383 17,483 18,089 17,458<br />
Telephone, Communications 55,401 56,120 50,661 27,120<br />
Travel 1,761<br />
Laundry & Dry Cleaning 120,667 116,500 124,398 116,500<br />
Training 6,111<br />
All Other Sundry Charges 2,372 4,140 1,735 4,140<br />
Confidential Informants 25,000 25,000 20,554<br />
Gift Certificates 660 1,100 1,100 660<br />
686,207 794,834 762,600 783,507<br />
Capital Equipment<br />
Equipment - Capital 3,771 3,476 3,476<br />
SUB-TOTAL 29,408,260 30,783,805 29,725,364 31,587,265<br />
Grants<br />
DOJ - Justice Assistance 48,281 18,575 18,575<br />
Polk County School Board-SRO 643,524 672,325 701,626 725,328<br />
FOAG-Victim Assistance (VOCA) 143,036 149,354 132,252 153,915<br />
JAG/BYRNE (DART) 44,719 47,698 42,311 50,100<br />
High Intensity Drug Trafficking Area (HIDTA) 29,746 38,966 38,966 25,500<br />
BJA - Bulletpro<strong>of</strong> Vest Program 35,595 74,933 74,933<br />
SUB-TOTAL 944,901 1,001,851 1,008,663 954,843<br />
E – 55
GENERAL FUND<br />
POLICE<br />
Experience Budget Projected Proposed<br />
For Year For Year For Year For Year<br />
2008 2009 2009 <strong>2010</strong><br />
Projects<br />
Polk Community College IPS Coordinator 83,960 92,268 92,268 91,473<br />
Police Activities League and DARE 3,000<br />
School Resource Officers - Donations 12,654 25,061 25,261<br />
Do the Right Thing - Donations 4,926 7,614 7,114<br />
Investigative Cost Reimbursement 115,218 181,388 231,589<br />
Canine Training - Donations 22,068 28,912 28,912<br />
Police Education 35,788 35,000 36,506 35,000<br />
Emergency Preparedness 2,078 2,500 2,500 2,500<br />
Recruitment 28,446 31,845 32,113 31,138<br />
Aircraft Operations 123,829 100,000 100,000<br />
Victim Assistance Program 25,000 25,000 25,188 25,000<br />
Training Center 48,192 53,892 53,892 58,892<br />
Crime Watch 13,211 11,963 12,416 8,400<br />
Special Overtime 89,195 47,000 47,000 40,000<br />
<strong>Lakeland</strong> Night Out Program 870 1,000 1,000 1,000<br />
LPD Dive Team Donations 1,600 1,600<br />
Drug Prevention Resource Center 42,000 42,000 45,000<br />
LPD Property & Evidence Expansion 12,500 12,500<br />
<strong>Lakeland</strong> Police SWAT Weapons 47,500 47,500<br />
Simulated Impaired Driving Experience (SIDNE) 19,798 19,798<br />
LPD Community Room Trophy Case 5,275 6,274<br />
SUB-TOTAL 608,434 772,116 825,430 338,403<br />
LAW ENFORCEMENT TRUST FUND<br />
All Other O&M<br />
All Other Administrative 73,050 45,059 45,059<br />
Capital Equipment<br />
Equipment - Capital 205,490 205,490<br />
SUB-TOTAL 73,050 250,549 250,549<br />
FEDERALLY FORFEITED PROPERTY<br />
All Other O&M<br />
All Other Administrative 39,004 39,004<br />
Capital Equipment<br />
Equipment - Capital 34,424 259,826 259,826<br />
Transfers To Other Funds<br />
Transfer To Fleet Mgmt Reserve 18,123<br />
SUB-TOTAL 52,547 298,830 298,830<br />
GRAND TOTAL 31,087,191 33,107,151 32,108,836 32,880,511<br />
E – 56
GENERAL FUND<br />
PUBLIC WORKS - DIRECTOR<br />
Experience Budget Projected Proposed<br />
For Year For Year For Year For Year<br />
2008 2009 2009 <strong>2010</strong><br />
EXPENSES<br />
Personal Services 498,658 546,562 490,860 556,665<br />
Utilities<br />
Water Utility Service 170 177 178 185<br />
Electric Utility Service 8,718 8,790 8,640 8,720<br />
Wastewater Services 213 231 226 246<br />
Interdepartmental Solid Waste Service 401 400 402 401<br />
9,502 9,598 9,445 9,552<br />
Inter-<strong>City</strong> Services<br />
Purchasing & Stores Service 11,443 12,045 11,041 11,202<br />
Rental-Fleet Mgmt Equipment 4,971 2,432 3,905 3,314<br />
Gasoline-Fleet Mgmt Equipment 4,920 3,006 966 180<br />
Maintenance-Fleet Mgmt Equipment 3,140 5,245 2,363 4,860<br />
Intra-dept Charges - PC & Network Support 16,233 16,665 16,665 15,470<br />
Intra-Departmental Charges - Telephone 3,869 4,451 4,451 3,190<br />
Intra-Departmental Charges - Radios 643 643 643 643<br />
Intra-Departmental Charges - Facilities 6,428 6,724 6,724 6,624<br />
Intra-Departmental Charges - Janitorial 4,961 5,347 5,347 5,400<br />
Intra-Departmental Charges - IT Operations 37,684 39,667 39,667 38,889<br />
Intra-Departmental Charges/Training Ctr 345 345 316 345<br />
94,637 96,570 92,088 90,117<br />
All Other O&M<br />
Office Supplies 6,502 4,800 4,847 4,500<br />
Uniforms 247 500 250<br />
Repair Of Equipment 660 900 933 900<br />
Printing & Photography 200 28 200<br />
Postage & Mailing 525 500 833 500<br />
Subscription & Membership 767 1,520 1,013 1,500<br />
Telephone, Communications 1,999 1,800 1,504 1,800<br />
Travel 2,130 3,000 167 2,500<br />
Training 3,708 4,500 981 3,000<br />
All Other Sundry Charges 752 1,500 308 1,300<br />
Licenses & Permits 53<br />
17,343 19,220 10,615 16,450<br />
Allocations<br />
Cost Allocated-Fleet Mgmt (64,831) (51,983) (51,983) (51,804)<br />
Cost Allocated-Solid Waste Management (82,314) (62,784) (62,784) (62,569)<br />
Cost Allocated-Parking (8,741) (5,401) (5,401) (5,382)<br />
Cost Allocated - Stormwater Utility (35,105) (35,105) (34,985)<br />
Cost Allocated - Facilities Maintenance Fund (39,336) (29,029) (29,029) (28,930)<br />
(195,222) (184,302) (184,302) (183,670)<br />
GRAND TOTAL 424,918 487,648 418,706 489,114<br />
E – 57
GENERAL FUND<br />
PUBLIC WORKS - ENGINEERING<br />
Experience Budget Projected Proposed<br />
For Year For Year For Year For Year<br />
2008 2009 2009 <strong>2010</strong><br />
EXPENSES<br />
Personal Services 849,243 1,129,340 1,052,450 1,182,182<br />
Utilities<br />
Water Utility Service 294 307 307 319<br />
Electric Utility Service 15,083 15,208 14,948 15,086<br />
Wastewater Services 369 401 390 425<br />
Interdepartmental Solid Waste Service 693 691 695 693<br />
16,439 16,607 16,340 16,523<br />
Inter-<strong>City</strong> Services<br />
Purchasing & Stores Service 8,304 8,741 8,013 8,129<br />
Rental-Fleet Mgmt Equipment 12,789 21,138 14,687 18,913<br />
Gasoline-Fleet Mgmt Equipment 16,000 24,718 13,105 18,945<br />
Maintenance-Fleet Mgmt Equipment 11,683 16,916 10,210 19,846<br />
Intra-dept Charges - PC & Network Support 30,055 30,003 30,003 29,144<br />
Intra-Departmental Charges - Telephone 3,908 4,524 4,524 4,254<br />
Intra-Departmental Charges - Radios 2,572 2,572 2,572 2,571<br />
Intra-Departmental Charges - Facilities 11,121 12,022 12,022 11,459<br />
Intra-Departmental Charges - Janitorial 8,583 9,560 9,560 9,341<br />
Intra-Departmental Charges - IT Operations 46,531 48,980 48,980 48,020<br />
Intra-Departmental Charges/Training Ctr 936 936 858 936<br />
152,483 180,110 154,533 171,558<br />
All Other O&M<br />
Contractual Services 56 3,000 260<br />
Advertising 400 400<br />
Office Supplies 8,532 7,399 6,805 7,000<br />
Equipment - Noncapital 1,639 2,000 1,708 2,000<br />
All Other Materials & Supplies 56 300 66 300<br />
Uniforms 2,411 4,000 3,552 4,000<br />
Tools & Implements 942 2,250 1,467 2,250<br />
Repair Of Equipment 1,000 1,000<br />
Printing & Photography 184 200 176 200<br />
Postage & Mailing 437 500 512 500<br />
Subscription & Membership 1,492 3,000 2,334 3,000<br />
Telephone, Communications 4,901 5,300 4,988 5,300<br />
Travel 2,911 3,000 343 3,000<br />
Training 2,848 2,500 1,440 2,500<br />
All Other Sundry Charges 204 250 84 250<br />
S<strong>of</strong>tware License & Maintenance 3,831 4,000 3,076 4,000<br />
30,441 39,099 26,812 35,700<br />
Allocations<br />
Cost Allocated - Stormwater Utility (54,480) (54,480)<br />
GRAND TOTAL 1,048,606 1,310,676 1,195,655 1,405,963<br />
E – 58
GENERAL FUND<br />
PUBLIC WORKS - CONSTRUCTION AND MAINTENANCE<br />
Experience Budget Projected Proposed<br />
For Year For Year For Year For Year<br />
2008 2009 2009 <strong>2010</strong><br />
EXPENSES<br />
Personal Services 1,516,956 1,086,399 879,055 1,124,621<br />
Insurance<br />
Uninsured Loss Reimbursement 1,000 2,000 2,000 2,240<br />
Utilities<br />
Water Utility Service 10,311 10,644 11,351 12,126<br />
Electric Utility Service 34,530 35,214 33,488 33,429<br />
Wastewater Services 9,081 8,425 9,794 10,278<br />
Interdepartmental Solid Waste Service 58,595 67,548 53,378 39,748<br />
112,517 121,831 108,012 95,581<br />
Inter-<strong>City</strong> Services<br />
Purchasing & Stores Service 18,296 19,259 17,654 17,911<br />
Rental-Fleet Mgmt Equipment 78,631 231,109 231,109 142,486<br />
Gasoline-Fleet Mgmt Equipment 235,480 258,029 110,039 167,522<br />
Maintenance-Fleet Mgmt Equipment 190,518 360,497 209,101 258,652<br />
Intra-dept Charges - PC & Network Support 24,586 26,295 26,295 22,992<br />
Intra-Departmental Charges - Telephone 3,374 3,646 3,646 4,254<br />
Intra-Departmental Charges - Radios 12,540 12,541 12,541 13,176<br />
Intra-Departmental Charges - Facilities 86,033 90,116 90,116 88,658<br />
Intra-Departmental Charges - Janitorial 16,707 18,029 18,029 18,183<br />
Intra-Departmental Charges - IT Operations 39,237 41,302 41,302 40,492<br />
Intra-Departmental Charges/Training Ctr 3,203 3,203 2,936 3,203<br />
708,604 1,064,026 762,768 777,529<br />
E – 59
GENERAL FUND<br />
PUBLIC WORKS - CONSTRUCTION AND MAINTENANCE<br />
Experience Budget Projected Proposed<br />
For Year For Year For Year For Year<br />
2008 2009 2009 <strong>2010</strong><br />
All Other O&M<br />
Contractual Services 791 6,000 1,581 8,000<br />
Office Supplies 4,662 6,300 6,283 6,300<br />
Equipment - Noncapital 4,551 4,366 4,568 4,330<br />
All Other Materials & Supplies 13,809 21,401 17,189 21,401<br />
Uniforms 18,589 18,500 19,350 18,500<br />
Construction Material 21,784 28,470 17,213 28,470<br />
Chemicals 4,500 4,500<br />
Tools & Implements 6,527 10,000 4,475 10,000<br />
Auto/Heavy Equipment Fuel 1,088 1,650 350 1,650<br />
Personal Safety Equipment 8,231 7,000 4,823 7,000<br />
Parts For Equipment 13,610 10,000 10,976 10,000<br />
Leases 209,011 37,160 45,070 37,160<br />
Rentals 13 35 663 500<br />
Repair Of Equipment 13,084 15,826 13,612 14,732<br />
Printing & Photography 30 500 500<br />
Postage & Mailing 48 400 87 400<br />
Subscription & Membership 810 1,000 1,267 1,000<br />
Telephone, Communications 2,912 2,900 2,645 2,900<br />
Travel 3,534 3,922 4,672 3,922<br />
Training 1,265 4,460 2,408 4,460<br />
All Other Sundry Charges 1,396 2,000 1,308<br />
325,745 186,390 158,540 185,725<br />
Capital Equipment<br />
Equipment - Capital 7,331 16,675 16,675 13,225<br />
Projects<br />
Office Furniture (238) 3,000<br />
Cleaning & Painting Downtown Streetscape 15,692 19,827 19,827 21,000<br />
Downtown Painting <strong>of</strong> Ornamental Streetscape 6,000 6,000 6,000<br />
CSX Right-<strong>of</strong>-Way 365 365 365 365<br />
Overhead Projector and Screen Unit 7,000 7,400 7,400 2,500<br />
22,819 33,592 33,592 32,865<br />
GRAND TOTAL 2,694,972 2,510,913 1,960,642 2,231,786<br />
E – 60
GENERAL FUND<br />
TRAFFIC<br />
Experience Budget Projected Proposed<br />
For Year For Year For Year For Year<br />
2008 2009 2009 <strong>2010</strong><br />
EXPENSES<br />
Personal Services 741,214 680,807 655,767 694,726<br />
Insurance<br />
Uninsured Loss Reimbursement 500 500 500 560<br />
Utilities<br />
Water Utility Service 1,610 2,335 1,250 1,048<br />
Electric Utility Service 19,258 18,354 18,260 17,310<br />
Wastewater Services 307 354 352 425<br />
Interdepartmental Solid Waste Service 1,445 1,445 1,503 1,548<br />
22,620 22,488 21,365 20,331<br />
Inter-<strong>City</strong> Services<br />
Purchasing & Stores Service 8,471 8,917 8,174 8,293<br />
Rental-Fleet Mgmt Equipment 28,886 28,024 28,312 28,886<br />
Gasoline-Fleet Mgmt Equipment 21,055 33,544 15,212 21,760<br />
Maintenance-Fleet Mgmt Equipment 19,404 17,475 18,933 25,667<br />
Intra-dept Charges - PC & Network Support 23,571 24,801 24,801 22,109<br />
Intra-Departmental Charges - Radios 3,859 3,840 3,840 3,856<br />
Intra-Departmental Charges - Facilities 17,877 18,726 18,726 18,423<br />
Intra-Departmental Charges - Janitorial 12,242 13,211 13,211 13,323<br />
Intra-Departmental Charges - IT Operations 16,930 17,821 17,821 17,472<br />
Intra-Departmental Charges/Training Ctr 591 591 542 591<br />
152,885 166,950 149,572 160,380<br />
All Other O&M<br />
Contractual Services<br />
Office Supplies 2,617 3,647 1,935 2,500<br />
Equipment - Noncapital 3,104 3,500 4,714 3,500<br />
All Other Materials & Supplies 93,680 82,055 88,960 75,000<br />
Uniforms 3,574 3,500 2,609 3,000<br />
Tools & Implements 1,388 1,500 677 1,500<br />
Auto/Heavy Equipment Fuel 89 100 138 100<br />
Rentals 1,555 1,500 1,095 1,500<br />
Repair Of Equipment 4,139 4,500 6,317 4,500<br />
Printing & Photography 18 250 69 100<br />
Postage & Mailing 284 300 310 300<br />
Subscription & Membership 1,743 1,240 1,240 1,240<br />
Telephone, Communications 3,559 2,300 2,868 2,300<br />
Travel 1,939 395 395 2,000<br />
Training 1,162 2,748 4,020 2,000<br />
All Other Sundry Charges 50<br />
Annual Railroad Maintenance 14,559 12,986 16,226 15,000<br />
133,411 120,571 131,572 114,540<br />
Capital Equipment<br />
Equipment - Capital 7,518 2,000 2,000<br />
Projects<br />
Other Projects - <strong>City</strong> Departments 857<br />
GRAND TOTAL 1,059,005 993,316 960,777 990,537<br />
E – 61
GENERAL FUND<br />
PARKS AND RECREATION - DIRECTOR<br />
Experience Budget Projected Proposed<br />
For Year For Year For Year For Year<br />
2008 2009 2009 <strong>2010</strong><br />
EXPENSES<br />
Personal Services 311,278 351,720 322,519 325,824<br />
Utilities<br />
Water Utility Service 96 100 101 104<br />
Electric Utility Service 4,937 4,978 4,892 4,938<br />
Wastewater Services 121 131 128 139<br />
Interdepartmental Solid Waste Service 227 226 227 227<br />
5,380 5,435 5,348 5,408<br />
Inter-<strong>City</strong> Services<br />
Purchasing & Stores Service 12,622 11,948 10,952 11,112<br />
Rental-Fleet Mgmt Equipment 1,428 1,586 1,567 1,428<br />
Gasoline-Fleet Mgmt Equipment 359 549 230 407<br />
Maintenance-Fleet Mgmt Equipment 807 447 1,230<br />
Intra-dept Charges - PC & Network Support 8,681 8,989 8,989 8,354<br />
Intra-Departmental Charges - Telephone 3,584 3,641 3,641 2,915<br />
Intra-Departmental Charges - Facilities 3,639 3,808 3,808 3,750<br />
Intra-Departmental Charges - Janitorial 2,809 3,028 3,028 3,057<br />
Intra-Departmental Charges - IT Operations 3,038 3,198 3,198 3,135<br />
Intra-Departmental Charges/Training Ctr 197 197 181 197<br />
36,356 37,751 36,041 35,585<br />
All Other O&M<br />
Office Supplies 2,221 1,500 2,646 2,300<br />
Equipment - Noncapital 244 500 271 500<br />
Repair Of Equipment 11 495 495 500<br />
Printing & Photography 118 200 87 1,500<br />
Postage & Mailing 232 500 326 500<br />
Subscription & Membership 954 1,490 1,513 1,800<br />
Telephone, Communications 2,009 1,989 1,965 2,000<br />
Travel 1,422 2,541 1,471 2,600<br />
Training 94 226 276 600<br />
7,306 9,441 9,051 12,300<br />
Projects<br />
Advertising & Promotions 1,078 3,028 3,028 6,500<br />
Sculpture Competition 20,160 6,810 6,810 2,500<br />
Maximo Upgrade <strong>City</strong> Wide 214<br />
Volunteers in Public Service 14,400<br />
21,452 9,838 9,838 23,400<br />
Allocations<br />
Cost Allocated-Golf Course (54,734) (48,478) (48,286) (40,252)<br />
GRAND TOTAL 327,038 365,707 334,510 362,265<br />
E – 62
GENERAL FUND<br />
PARKS AND RECREATION - PARKS<br />
Experience Budget Projected Proposed<br />
For Year For Year For Year For Year<br />
2008 2009 2009 <strong>2010</strong><br />
Personal Services 4,840,914 5,350,882 5,108,099 5,403,424<br />
All Other O&M<br />
Contractual Services 129,512 144,728 216,728 170,000<br />
Office Supplies 7,597 7,347 8,555 7,347<br />
Equipment - Noncapital 10,854 6,200 14,893 6,100<br />
All Other Materials & Supplies 16,264 18,509 16,602 16,790<br />
Uniforms 16,264 17,795 14,328 17,795<br />
Cleaning & Janitor Supply 31,570 37,191 25,546 42,485<br />
Construction Material 1,570 2,855 1,079 2,500<br />
Chemicals 67,570 66,458 64,246 78,412<br />
Tools & Implements 7,350 10,200 7,315 10,200<br />
Electrical, Hardware & Plumbing Supplies 49,760 13,520 75,619 15,020<br />
Agricultural & Horticultural Supplies 61,398 87,094 79,836 104,855<br />
Auto/Heavy Equipment Fuel 2,616 1,500 2,060 2,000<br />
Recreational Supplies 8,776 11,272 8,063 15,700<br />
Food & Supplies for Animals 7,194 6,000 3,376 10,000<br />
Irrigation Supplies 19,635 20,800 23,573 21,300<br />
Rentals 1,000 1,000<br />
Maintenance Of Facilities 8,976 9,300 15,865 25,000<br />
Repair Of Equipment 40,843 41,000 41,540 41,220<br />
Printing & Photography 2,031 1,500 1,086 1,500<br />
Postage & Mailing 705 268 134 250<br />
Subscription & Membership 1,730 815 187 500<br />
Telephone, Communications 13,443 12,626 9,129 12,626<br />
Travel 3,748 1,271 3,050 1,271<br />
Training 4,397 3,436 3,570 3,200<br />
All Other Sundry Charges 4,915 4,625 4,917 4,600<br />
Ad Valorem Taxes 2,950 3,492 3,123<br />
521,667 530,802 644,419 611,671<br />
E – 63
GENERAL FUND<br />
PARKS AND RECREATION - PARKS<br />
Experience Budget Projected Proposed<br />
For Year For Year For Year For Year<br />
2008 2009 2009 <strong>2010</strong><br />
Capital Equipment<br />
Equipment - Capital 6,400 6,400 19,560<br />
Projects<br />
Hollis Gardens 9,036 12,000 14,000 20,000<br />
Install Master Key System - Tigertown, Peterson Park 2,033 1,000<br />
Spring Training Preparation 16,884 15,463 40,543 20,000<br />
Tree And Palm Program 5,831 21,278 27,278 15,000<br />
Landscape Renovations 12,467 11,000 16,000 20,000<br />
Irrigation Modernization 5,670 10,000 12,000 15,000<br />
Resigning Of Parks (752) 3,000 3,000 3,000<br />
Replace Swan Pens 780 1,000 1,301 1,000<br />
Replace Park Equipment 7,666 10,000 23,000 30,000<br />
Christmas Decorations 8,467 12,932 9,980 5,000<br />
Orange Cup Regatta 1,209<br />
Sportsfield Lighting 24,912 25,000 35,000 25,000<br />
Landscape Renovations - FDOT 31,623 15,000 15,000 25,000<br />
U&CF-Tree Inventory - Northside 9,302<br />
U&CF-Tree Inventory - Southside 9,083<br />
U&CF-Tree Remediation - SE Quadrant 603<br />
U&CF-Cemetery Tree Planting 489<br />
Tigertown Additional Parking Area 32,000<br />
Tigertown Warning Track Material 3,866<br />
Henley Field PA System Wiring Improvements 2,760<br />
Special Overtime 42,000 53,260 53,500<br />
Tigertown Shop Shelving for Parts Room 5,000<br />
<strong>City</strong> Nursery Aluminum Tables 6,000<br />
Westside Complex Concrete Repair 2,500<br />
Lake Parker Park Repair and Repaint Nature Trails 10,000<br />
Parks Systems Maintenance 240,000 113,887<br />
Sub-Total 183,928 418,673 250,362 370,887<br />
Allocations<br />
Cost Allocated-Fleet Mgmt (6,226) (8,683) (8,683) (8,873)<br />
Cost Allocated-Purchasing (24,906) (26,050) (26,050) (26,619)<br />
Cost Allocated-<strong>Lakeland</strong> Center (217,930) (234,446) (234,446) (239,574)<br />
Cost Allocated-Parking (37,360) (43,416) (43,416) (44,365)<br />
Cost Allocated- Electric (93,398) (104,198) (104,198) (106,477)<br />
Cost Allocated-Golf Course (12,454) (17,366) (17,366) (17,746)<br />
Cost Allocated - Water (18,680) (17,366) (17,366) (17,746)<br />
(410,954) (451,525) (451,525) (461,400)<br />
GRAND TOTAL 7,504,170 8,379,288 7,934,130 8,411,697<br />
E – 64
GENERAL FUND<br />
PARKS AND RECREATION - RECREATION<br />
Experience Budget Projected Proposed<br />
For Year For Year For Year For Year<br />
2008 2009 2009 <strong>2010</strong><br />
EXPENSES<br />
Personal Services 2,474,316 3,006,167 2,600,385 2,983,317<br />
Insurance<br />
Uninsured Loss Reimbursement 250 500 500 560<br />
Utilities<br />
Water Utility Service 35,036 34,301 47,777 53,040<br />
Electric Utility Service 380,839 376,024 344,191 359,607<br />
Stormwater Utility 150 141<br />
Wastewater Services 23,914 24,417 25,356 25,547<br />
Interdepartmental Solid Waste Service 28,782 28,851 30,782 29,889<br />
468,572 463,593 448,256 468,224<br />
Inter-<strong>City</strong> Services<br />
Purchasing & Stores Service 21,270 22,389 20,523 20,822<br />
Rental-Fleet Mgmt Equipment 11,981 13,160 13,023 11,981<br />
Gasoline-Fleet Mgmt Equipment 7,391 15,229 4,486 4,842<br />
Maintenance-Fleet Mgmt Equipment 9,725 14,841 5,859 17,687<br />
Intra-dept Charges - PC & Network Support 55,461 56,677 58,080 57,917<br />
Intra-Departmental Charges - Telephone 3,632 4,913 4,913 4,520<br />
Intra-Departmental Charges - Facilities 307,374 321,955 321,955 325,071<br />
Intra-Departmental Charges - Janitorial 2,809 3,028 3,028 3,057<br />
Intra-Departmental Charges - IT Operations 50,621 53,284 53,284 52,751<br />
Intra-Departmental Charges/Training Ctr 2,119 2,119 1,942 2,119<br />
472,384 507,595 487,093 500,767<br />
E – 65
GENERAL FUND<br />
PARKS AND RECREATION - RECREATION<br />
Experience Budget Projected Proposed<br />
For Year For Year For Year For Year<br />
2008 2009 2009 <strong>2010</strong><br />
All Other O&M<br />
Contractual Services 85,038 91,090 84,793 94,438<br />
Office Supplies 13,919 16,592 12,273 16,792<br />
Equipment - Noncapital 16,114 12,520 7,492 14,500<br />
Uniforms 13,201 13,320 9,612 13,320<br />
Cleaning & Janitor Supply 37,626 56,375 43,641 82,775<br />
Chemicals 41,546 39,350 45,380 46,000<br />
Tools & Implements 1,552 2,270 2,004 1,770<br />
Electrical, Hardware & Plumbing Supplies 827 1,550 1,157 1,550<br />
Recreational Supplies 7,080 8,573 6,078 8,000<br />
Fuel-Pool Operations 17,558 30,000 26,386 30,000<br />
Maintenance Of Facilities 1,410 2,645 2,898 2,645<br />
Repair Of Equipment 39,436 61,621 45,888 61,720<br />
Postage & Mailing 125 200 94 200<br />
Subscription & Membership 720 1,000 646 1,000<br />
Telephone, Communications 15,039 17,425 9,416 17,625<br />
Travel 8,772 4,782 3,580 4,500<br />
Training 1,886 2,900 2,000 2,900<br />
Licenses & Permits 750 500 883 625<br />
Gift Certificates 50 50<br />
Recoveries-Intra Departmental Charges (7,888)<br />
302,650 362,713 304,221 392,522<br />
Capital Equipment<br />
Equipment - Capital 11,064 35,940 35,940 10,250<br />
Projects<br />
Wood Floor Refinishing - Simpson Park & Kelly Rec 25,000 25,000<br />
Resurface Tennis Courts 8,700 12,000 14,911 12,000<br />
Christmas Parade 5,720 5,800 5,800 5,800<br />
Special Events 52,075 61,000 61,000 47,400<br />
Program Activity Costs 336,659 422,342 421,744 322,000<br />
Program Activity Costs - Electric Utilities 60,000<br />
Program Activity Costs 336,659 422,342 421,744 382,000<br />
Tournament Costs 18,589 19,900 20,600 18,000<br />
Martin Luther King Parade 3,550 4,000 4,000 4,000<br />
Weight Room Equipment Replacement 26,267 26,692 30,397 25,000<br />
Expanded Cultural Opportunities 3,504 4,938 4,938<br />
Coin Meters for Tennis Lights 8,533 25,000<br />
Computer Equipment Upgrade 16,973 14,000 14,000<br />
Pool Blanket Reels and Blankets 25,000<br />
480,572 595,672 602,390 544,200<br />
GRAND TOTAL 4,209,807 4,972,180 4,478,785 4,899,840<br />
E – 66
GENERAL FUND<br />
PARKS AND RECREATION - MAIN LIBRARY<br />
Experience Budget Projected Proposed<br />
For Year For Year For Year For Year<br />
2008 2009 2009 <strong>2010</strong><br />
EXPENSES<br />
MAIN LIBRARY<br />
Personal Services 1,341,489 1,424,837 1,350,935 1,459,363<br />
Utilities<br />
Water Utility Service 2,771 2,823 2,805 2,873<br />
Electric Utility Service 69,490 65,559 67,374 61,782<br />
Wastewater Services 1,877 2,075 1,929 2,109<br />
Interdepartmental Solid Waste Service 2,889 2,889 2,904 2,889<br />
77,027 73,346 75,012 69,653<br />
Inter-<strong>City</strong> Services<br />
Purchasing & Stores Service 29,539 31,094 28,503 28,917<br />
Rental-Fleet Mgmt Equipment 1,764 3,911 1,735 1,764<br />
Gasoline-Fleet Mgmt Equipment 514 4,569 244 500<br />
Maintenance-Fleet Mgmt Equipment 493 2,411 1,428 2,627<br />
Intra-dept Charges - PC & Network Support 62,763 57,572 57,572 56,157<br />
Intra-Departmental Charges - Telephone 8,470 9,749 9,749 10,901<br />
Intra-Departmental Charges - Facilities 78,840 82,581 82,581 81,246<br />
Intra-Departmental Charges - IT Operations 17,529 18,452 18,452 18,090<br />
Intra-Departmental Charges/Training Ctr 1,133 1,133 1,039 1,133<br />
201,045 211,472 201,303 201,336<br />
All Other O&M<br />
Contractual Services 12,964 14,780 2,721 9,000<br />
Office Supplies 12,294 12,098 7,216 12,050<br />
Equipment - Noncapital 1,585 2,000 1,982 2,000<br />
Cleaning & Janitor Supply 3,907 5,000 3,649 5,000<br />
Electrical, Hardware & Plumbing Supplies 107 100 28 100<br />
Library Materials 133,049 108,671 109,432 103,892<br />
Repair Of Equipment 2,502 7,600 1,402 4,000<br />
Postage & Mailing 2,282 2,500 1,714 2,500<br />
Subscription & Membership 810 500 490<br />
Telephone, Communications 499 500 486 500<br />
Binding & Processing 7,043 7,500 7,266 7,500<br />
177,041 161,249 136,387 146,542<br />
Capital Equipment<br />
Equipment - Capital 2,120<br />
SUB-TOTAL 1,798,723 1,870,904 1,763,636 1,876,894<br />
E – 67
GENERAL FUND<br />
PARKS AND RECREATION - MAIN LIBRARY<br />
Experience Budget Projected Proposed<br />
For Year For Year For Year For Year<br />
2008 2009 2009 <strong>2010</strong><br />
E-LIBRARY<br />
Personal Services 145,920 174,529 172,043 180,316<br />
Utilities<br />
Water Utility Service 113 113 129 134<br />
Electric Utility Service 6,477 5,622 6,720 5,765<br />
Interdepartmental Solid Waste Service 287 287 292 295<br />
Wastewater Services 553 545 635 650<br />
7,430 6,567 7,777 6,844<br />
Inter-<strong>City</strong> Services<br />
Intra-Dept Charges - Facilities 9,509 9,960 9,960 9,798<br />
9,509 9,960 9,960 9,798<br />
All Other O&M<br />
Contractual Services 2,003 3,000 2,583 3,000<br />
Office Supplies 3,745 3,000 3,773 2,500<br />
Equipment - Noncapital 1,000 614 1,000<br />
Uniforms 132 350 72<br />
Cleaning & Janitor Supply 668 1,000 697 1,000<br />
Leases 62,087 80,000 92,952 82,000<br />
Telephone, Communications 3,185 2,800 2,572 2,880<br />
71,820 91,150 103,261 92,380<br />
SUB-TOTAL 234,679 282,206 293,041 289,338<br />
COUNTY-WIDE LIBRARY COOPERATIVE<br />
Personal Services 305,652 307,917 292,780 328,539<br />
All Other O&M<br />
Contractual Services 21,172 23,000 23,000 23,000<br />
Office Supplies 14,554 17,000 17,000 19,000<br />
Equipment - Noncapital 3,066 5,000 5,000 5,000<br />
Uniforms 473 1,500 250 250<br />
Cleaning & Janitor Supply 4,179 3,500 3,500 5,000<br />
Library Materials 323,988 366,398 366,398 380,000<br />
Repair <strong>of</strong> Equipment 1,811 1,500 1,500 1,700<br />
Printing & Photography 250<br />
Subscription & Membership 905 1,200 1,200 1,200<br />
Travel 716 1,200 1,200 1,500<br />
Training 500 500 500<br />
Binding & Processing 14,985 16,500 16,500 17,000<br />
385,849 437,548 436,048 454,150<br />
SUB-TOTAL 691,501 745,465 728,828 782,689<br />
E – 68
GENERAL FUND<br />
PARKS AND RECREATION - MAIN LIBRARY<br />
Experience Budget Projected Proposed<br />
For Year For Year For Year For Year<br />
2008 2009 2009 <strong>2010</strong><br />
COUNTY BOOKMOBILE<br />
Personal Services 80,550 66,918 87,057<br />
Inter-<strong>City</strong> Services<br />
Gasoline-Fleet Mgmt Equipment 3,300 2,344 1,992<br />
Maintenance-Fleet Mgmt Equipment 5,501 1,716 3,500<br />
8,801 4,060 5,492<br />
All Other O&M<br />
Administrative Services 3,000<br />
All Other Materials & Supplies 7,000 4,000 4,000<br />
Repair <strong>of</strong> Equipment 100 100<br />
Printing & Photography 50<br />
Telephone, Communications 900 900 900<br />
11,050 4,900 5,000<br />
SUB-TOTAL 100,401 75,878 97,549<br />
Projects<br />
Library Foundation:<br />
Reference Section 1,373 1,373<br />
Special Collections Section 1,364 1,364<br />
Fine Arts Collections Section 3,057 3,057<br />
E-Library 46,277 11,970 11,926<br />
Serena Bailey Foundation:<br />
Reference Section 8,170 17,830 17,830<br />
Special Collections Section 16,580 16,580<br />
Fine Arts Collections Section 9,480 16,520 16,520<br />
Louise K Padar Bequest 4,185 77,981 77,981<br />
68,112 146,675 146,631<br />
GRAND TOTAL 2,793,014 3,145,651 3,008,014 3,046,470<br />
E – 69
GENERAL FUND<br />
BRANCH LIBRARY<br />
Experience Budget Projected Proposed<br />
For Year For Year For Year For Year<br />
2008 2009 2009 <strong>2010</strong><br />
EXPENSES<br />
Personal Services 280,471 308,149 289,760 324,393<br />
Utilities<br />
Water Utility Service 823 903 816 843<br />
Electric Utility Service 35,162 31,089 42,686 43,922<br />
Wastewater Services 1,043 1,201 1,043 1,083<br />
Interdepartmental Solid Waste Service 963 963 968 963<br />
37,991 34,156 45,513 46,811<br />
Inter-<strong>City</strong> Services<br />
Purchasing & Stores Service 535 563 516 524<br />
Rental-Fleet Mgmt Equipment 1,984 2,192 2,167 1,984<br />
Gasoline-Fleet Mgmt Equipment 436 2,130 298 1,062<br />
Maintenance-Fleet Mgmt Equipment 331 1,235 503 1,630<br />
Intra-dept Charges - PC & Network Support 15,146 20,145 20,145 8,031<br />
Intra-Departmental Charges - Telephone 2,231 2,567 2,567 2,925<br />
Intra-Departmental Charges - Facilities 33,126 34,699 34,699 34,138<br />
Intra-Departmental Charges/Training Ctr 246 246 226 246<br />
54,036 63,777 61,122 50,540<br />
All Other O&M<br />
Contractual Services 1,456 2,060 2,496 3,460<br />
Office Supplies 2,399 3,150 3,227 2,000<br />
Equipment - Noncapital 861 990 966<br />
Cleaning & Janitor Supply 1,562 1,660 1,659 1,700<br />
Electrical, Hardware & Plumbing Supplies 40 100<br />
Library Materials 15,847 15,713 15,795 7,648<br />
Repair Of Equipment 886 400 260 100<br />
Telephone, Communications 594 500 498 500<br />
23,644 24,573 24,901 15,408<br />
Projects<br />
County-Wide Library Cooperative 6<br />
GRAND TOTAL 396,148 430,655 421,295 437,152<br />
E – 70
GENERAL FUND<br />
PARKS AND RECREATION - CEMETERIES<br />
Experience Budget Projected Proposed<br />
For Year For Year For Year For Year<br />
2008 2009 2009 <strong>2010</strong><br />
EXPENSES<br />
Personal Services 472,509 516,106 484,604 521,787<br />
Utilities<br />
Water Utility Service 29,619 26,576 31,760 32,285<br />
Electric Utility Service 16,814 16,368 20,238 20,812<br />
Wastewater Services 8,193 5,727 7,018 7,938<br />
Interdepartmental Solid Waste Service 9,669 9,234 9,926 8,622<br />
64,295 57,905 68,942 69,657<br />
Inter-<strong>City</strong> Services<br />
Purchasing & Stores Service 1,394 1,467 1,345 1,364<br />
Rental-Fleet Mgmt Equipment 16,387 16,167 16,285 16,387<br />
Gasoline-Fleet Mgmt Equipment 15,054 20,293 11,918 19,731<br />
Maintenance-Fleet Mgmt Equipment 22,571 19,398 23,887 24,326<br />
Intra-dept Charges - PC & Network Support 5,140 4,029 4,029 4,481<br />
Intra-Departmental Charges - Facilities 12,284 12,867 12,867 12,659<br />
Intra-Departmental Charges - Janitorial 3,419 3,689 3,689 3,721<br />
Intra-Departmental Charges - IT Operations 4,169 4,388 4,388 4,302<br />
Intra-Departmental Charges/Training Ctr 493 493 452 493<br />
80,911 82,791 78,860 87,464<br />
All Other O&M<br />
Contractual Services 69,402 74,000 73,426 74,000<br />
Office Supplies 1,597 1,400 1,663 753<br />
Equipment - Noncapital 3,776 4,420 4,259 4,420<br />
All Other Materials & Supplies 1,501 1,502 1,522 1,502<br />
Uniforms 1,972 2,000 1,772 2,000<br />
Construction Material 582 1,000 1,047 1,000<br />
Tools & Implements 492 800 709 800<br />
Agricultural & Horticultural Supplies 8,571 7,798 7,636 7,798<br />
Merchandise 200 200<br />
Maintenance Of Facilities 16<br />
Repair Of Equipment 5,795 5,822 3,062 5,822<br />
Printing & Photography 577 600 776 600<br />
Postage & Mailing 341 700 540 700<br />
Subscription & Membership 49 49 49 49<br />
Telephone, Communications 2,629 2,000 2,072 2,000<br />
Training 35 170 35 170<br />
All Other Sundry Charges 118 118<br />
97,335 102,579 98,569 101,932<br />
Capital Equipment<br />
Equipment - Capital 4,420 5,000 5,000 5,000<br />
Projects<br />
Funeral Set-Ups 4,547<br />
Roselawn Landscape Improvements 433<br />
Fire Ant Control 2,000 2,000<br />
Replace Street Signs 2,500 2,225<br />
Portable Chapel Tent Renovation 4,500<br />
4,980 4,500 4,225 4,500<br />
GRAND TOTAL 724,450 768,881 740,199 790,340<br />
E – 71
GENERAL FUND<br />
NON-DEPARTMENTAL<br />
Experience Budget Projected Proposed<br />
For Year For Year For Year For Year<br />
2008 2009 2009 <strong>2010</strong><br />
EXPENSES<br />
Personal Services<br />
Reserve for Accumulated Benefits 40,000 198,655 40,000<br />
Insurance-Work Comp-Excess 225,216 242,375 252,644 242,375<br />
Unemployment Compensation 14,676 30,000 30,000 30,000<br />
Retiree Health Insurance Subsidy 607,242<br />
Retiree Health Insurance Subsidy adjustments 617,572 617,572 625,526<br />
887,135 1,088,602 900,216 937,901<br />
Insurance<br />
Uninsured Loss Reimbursement 128,178<br />
Insurance - Fire 157,865 170,562 155,005 188,168<br />
Insurance - Position Bond 707 5,668 1,000 5,668<br />
Insurance Consultant 29,416 28,923 28,923 23,453<br />
Self-Insurance Services 1,618,839 1,504,951 1,504,951 1,490,731<br />
1,935,005 1,710,104 1,689,879 1,708,020<br />
Utilities<br />
Water Utility Service 677 638 656 674<br />
Stormwater Utility Fees 680 680 906 906<br />
Electric Utility Service 1,803 59,663 1,709 1,787<br />
Fire Hydrants 440,533 453,683 453,683 462,757<br />
Utility Connection Fee 100<br />
Traffic Signals 129,187 135,744 128,979 131,559<br />
Street Lights & Xmas 3,659,429 3,976,596 4,068,424 4,149,792<br />
Interdepartmental Solid Waste Service 305 304 304 304<br />
4,232,613 4,627,408 4,654,661 4,747,779<br />
Inter-<strong>City</strong> Services<br />
Rental-Fleet Mgmt Equipment 5,362 5,362 5,864 5,747<br />
Gasoline-Fleet Mgmt Equipment 2,563 2,002 1,810 1,810<br />
Maintenance-Fleet Mgmt Equipment 6,502 4,621 4,621 4,529<br />
Intra-Departmental Charges - Facilities 28,500 10,000 10,000 10,000<br />
Intra-Departmental Charges - Janitorial 16,512<br />
42,926 21,985 22,295 38,598<br />
E – 72
GENERAL FUND<br />
NON-DEPARTMENTAL<br />
Experience Budget Projected Proposed<br />
For Year For Year For Year For Year<br />
2008 2009 2009 <strong>2010</strong><br />
All Other O&M<br />
Other General Governmental Services<br />
Appraisal Fees 7,150<br />
Ad Valorem Taxes 12,057 13,041 13,040 13,040<br />
Downtown CRA Tax Increment 419,943 459,651 476,340 432,105<br />
Refund Of Prior Years Revenue 35,588 35,588 35,588<br />
Bad Checks 1,483 2,000 2,000 2,000<br />
Midtown CRA Tax Increment 1,130,821 1,206,466 1,216,217 1,054,916<br />
Dixieland CRA Tax Increment 92,289 109,477 105,037 102,556<br />
Payphone Expense 1,287 2,100 1,100 2,100<br />
Williams CRA Tax Increment 4,589 4,707 4,707 6,376<br />
Hardin CRA 181,189 219,069 217,370 228,234<br />
Polk County Vision 10,000 10,000 10,000 10,000<br />
Polk County Day at the Capitol 1,250 1,250 1,250<br />
Florida Economic Development Trust Fund 61,500 61,500 65,500<br />
Contribution to CSX Legal Fund 10,000<br />
Legislative Advisory Services 54,325 53,000 55,490 55,000<br />
Retiree's Association Expenses 500 1,100 750 750<br />
Sun Trust Parking Garage - Lease 21,300 21,300 21,300 21,300<br />
Chamber <strong>of</strong> Commerce - Maintenance 15,222<br />
Federal Bldg Maintenance 83,171 11,401 12,773 12,000<br />
Train Station-Maintenance 41,725 67,273 44,720 44,720<br />
Community Visioning Project 38,600 38,600 38,600 38,600<br />
Contingency 574 100,000<br />
2,118,501 2,325,247 2,317,782 2,226,035<br />
Cultural Agencies<br />
Platform Florida 5,000 5,000<br />
Education and Enlightenment Group, Inc 5,000 5,000<br />
Florida Dance Theatre 9,289 9,289 9,289<br />
<strong>Lakeland</strong> Community Band 12,000 12,000<br />
Explorations, Inc., 17,210 17,210 17,210<br />
Senior Olympics-<strong>Lakeland</strong> Center 1,200<br />
Mayfair Purchase Award 500 500<br />
Polk Theatre 36,060 36,060 36,060<br />
Polk Museum Of Art 81,955 81,955 81,955<br />
<strong>Lakeland</strong> Imperial Symphony 44,744 47,768 47,768<br />
Arts On The Park 10,927 10,927 10,927<br />
Undesignated 185,000<br />
200,185 225,709 226,909 185,000<br />
E – 73
GENERAL FUND<br />
NON-DEPARTMENTAL<br />
Experience Budget Projected Proposed<br />
For Year For Year For Year For Year<br />
2008 2009 2009 <strong>2010</strong><br />
Social Agencies<br />
Coalition For Homeless 7,500 7,500<br />
VISTE 9,000 11,000 11,000<br />
Salvation Army - Homeless 7,500 7,500 7,500<br />
Polk County - Aging Services 13,000 13,000 13,000<br />
Girls, Incorporated 5,000 4,000 4,000<br />
Sunrise Communities 1,460 10,000 10,000<br />
Catholic Social Services 5,000 6,000 6,000<br />
Central Florida Deaf Services 8,500 7,500 7,500<br />
<strong>Lakeland</strong> Community Band 9,800<br />
NAMI 6,000 7,500 7,500<br />
Talbot House Ministries 9,000 9,000 9,000<br />
Writers, Inc. 5,000 5,000 5,000<br />
<strong>Lakeland</strong> Volunteers In Medicine, Inc. 7,500<br />
Wilson House 7,500 5,000 5,000<br />
Lake Mirror Classic Car Show 1,842<br />
Contribution to <strong>Lakeland</strong> Futures Classic Tournament 15,000<br />
Education and Enlightenment Group, Inc 5,000<br />
Platform Florida 5,000<br />
Faith In Action - North 4,000<br />
Family Fundamentals 3,500<br />
First Tee Program 50,000<br />
Women's Resource Center 2,500<br />
181,102 93,000 93,000<br />
Other<br />
Citrus Commission -Electric Subsidy 7,825 20,800 20,800<br />
Leases<br />
Armory Lease - Airport 11,854<br />
Game/Fresh Water Fish-Airport 15,124<br />
<strong>Lakeland</strong> Center:<br />
Drug Prevention Center-Say No Walk 4,210<br />
Senior Olympics-<strong>Lakeland</strong> Center 1,200<br />
Economic Expo - <strong>Lakeland</strong> Center 2,495<br />
<strong>Lakeland</strong> Community Band 9,800<br />
44,683<br />
Sub Total - All Other O&M 2,552,296 2,664,756 2,658,491 2,411,035<br />
E – 74
GENERAL FUND<br />
NON-DEPARTMENTAL<br />
Experience Budget Projected Proposed<br />
For Year For Year For Year For Year<br />
2008 2009 2009 <strong>2010</strong><br />
Transfers To Other Funds<br />
Transfer To Fleet Mgmt Reserve 15,000 37,200 37,200 8,100<br />
Transfer To <strong>Lakeland</strong> Center 2,192,789 2,308,844 2,308,844 2,313,052<br />
Transfer To Disaster Fund - Frances 18<br />
Transfer To Cultural Activities Fund 137,869<br />
Transfer To Trust Funds - Cemetery Perpetual Care 49,980 46,393 46,393 43,996<br />
Hollis Gdns Maint Trust - Transfer To Gen Fund 53,514 53,514 53,514 53,514<br />
Hollis Gdns Maint Trust - Inc in Reserve Balance 54,494 40,000 35,000<br />
Reserve for New Rec Facilities - Inc in Reserve Balance 118,674 134,000 124,000<br />
Cultural Activities Reserve - Increase in Reserve Balance 100,000<br />
2,549,170 2,619,119 2,619,951 2,577,662<br />
TOTAL NON-DEPARTMENTAL 12,199,145 12,731,974 12,545,493 12,420,995<br />
GRAND TOTAL 86,281,799 91,941,617 88,147,484 91,303,488<br />
E – 75
THIS PAGE IS INTENTIONALLY BLANK<br />
E – 76
REVENUE AND EXPENDITURE SUMMARY<br />
COMMUNITY DEVELOPMENT - AFFORDABLE HOUSING<br />
Experience Budget Experience 2009-10<br />
For Year For Year 2008-09 Proposed by<br />
EXPENSES 2007-08 2008-09 Estimated <strong>City</strong> Manager<br />
Personnel<br />
Salaries and Wages 543,021 415,068 434,581 615,000<br />
Fringe Benefits<br />
Total Personnel 543,021 415,068 434,581 615,000<br />
Non-Personnel<br />
Internal Service Charges<br />
Pr<strong>of</strong>essional and Contractual<br />
Utilities<br />
Insurance and Fixed Charges<br />
All Other Operations and Maintenance 2,531,869 2,713,507 1,825,589 2,774,384<br />
Capital Outlay 124,541 124,438 124,438<br />
Debt Service<br />
Total Non-Personnel 2,656,410 2,837,945 1,950,027 2,774,384<br />
Total Expenditures 3,199,431 3,253,014 2,384,607 3,389,384<br />
Transfers<br />
Transfers In<br />
Transfers Out<br />
Net Transfers<br />
Revenue Sources<br />
Taxes<br />
Licenses and Permits<br />
Intergovernmental 2,816,923 2,883,780 2,279,729 3,259,384<br />
Charges for Services<br />
Interest Income 61,897 43,800<br />
All Other Revenue 339,123 42,757 68,850 50,000<br />
Total Revenue 3,217,942 2,926,537 2,392,379 3,309,384<br />
Funding to be Provided (18,511) 326,476 (7,772) 80,000<br />
E – 77
COMMUNITY DEVELOPMENT - AFFORDABLE HOUSING<br />
Experience Budget Projected Proposed<br />
For Year For Year For Year For Year<br />
2008 2009 2009 <strong>2010</strong><br />
REVENUE<br />
Intergovernmental Revenue<br />
Federal Grants<br />
HUD - Home 339,245 809,780 391,868 474,806<br />
CDBG-Grant Activities 965,592 720,656 692,972 778,797<br />
Neighborhood Stabilization Program 2,005,781<br />
1,304,837 1,530,437 1,084,840 3,259,384<br />
State Grants<br />
FDOS-SHIP 936,672 1,218,012 1,063,442<br />
My Florida Safe Home 121,782 126,996 124,238<br />
HHR - Affordable Housing Program 453,632 8,336 7,210<br />
1,512,085 1,353,343 1,194,890<br />
Total Intergovernmental Revenue 2,816,923 2,883,780 2,279,729 3,259,384<br />
Miscellaneous Revenue<br />
Interest<br />
CDBG-Grant Activities<br />
DCA Grant 687 750<br />
FDOS-SHIP 46,522 35,000<br />
HUD-Rental Rehabilitation-Grant Activities 725 1,200<br />
Dixieland 14,938 18,000<br />
HHR 7,440 500<br />
My Florida Safe Home 2,550<br />
Market Value Restatement<br />
DCA Grant (116) (200)<br />
HUD-Rental Rehabilitation-Grant Activities (138) (150)<br />
Dixieland (3,836) (4,000)<br />
FDOS-SHIP (7,854) (8,000)<br />
HHR 769 500<br />
My Florida Safe Home 209 200<br />
Total Interest 61,897 43,800<br />
Loans<br />
CDBG-Grant Activities 25,032 42,757 25,000 25,000<br />
HUD - Home 115,260 3,000 25,000<br />
Rehab <strong>Lakeland</strong> Presbyterian Apartments 10,360 10,000<br />
Dixieland-Affordable Housing Program 2,076 1,500<br />
Dixieland-Rehabilitation 150,018 3,750<br />
FDOS-SHIP 35,012 25,000<br />
337,758 42,757 68,250 50,000<br />
Reimbursements<br />
Dixieland-Affordable Housing Program 165<br />
DCA Grant-Elderly Homeowner Rehab Program 1,200 600<br />
1,365 600<br />
Total Miscellaneous Revenue 401,019 42,757 112,650 50,000<br />
REVENUE TOTAL 3,217,942 2,926,537 2,392,379 3,309,384<br />
SURPLUS PRIOR YEARS (18,511) 326,476 (7,772) 80,000<br />
TOTAL REVENUES 3,199,431 3,253,014 2,384,607 3,389,384<br />
E – 78
COMMUNITY DEVELOPMENT - AFFORDABLE HOUSING<br />
Experience Budget Projected Proposed<br />
For Year For Year For Year For Year<br />
2008 2009 2009 <strong>2010</strong><br />
EXPENSES<br />
Operating<br />
CDBG-Administration 115,081 81,362 81,362 135,000<br />
CDBG-Housing Division 294,713 230,322 249,835 330,000<br />
CDBG-Code Enforcement 133,227 103,384 103,384 150,000<br />
CDBG-Rehabilitation <strong>of</strong> Private Property 200,307 233,956 188,971 152,857<br />
743,328 649,024 623,552 767,857<br />
Projects<br />
CDBG Programs:<br />
Simpson Park - Art Classes 2,000 1,760 1,760 2,150<br />
Swimming Lessons - NW Area 2,800 3,600<br />
CDBG - Simpson Park - Cultural Dance 1,640 1,610 1,640 1,860<br />
Summer Rec Prog - Simpson Park/Lincoln Academy 18,840 21,550<br />
Coleman Bush Bldg - After School Program 4,124 4,745 4,745 4,950<br />
CDBG-Coleman Bush Tutoring Program 7,960 8,447 8,447 9,410<br />
CDBG - Coleman Bush Summer Tutoring Program 2,365 2,420<br />
VISTE - Hot Meals for the Elderly 10,000 10,000 10,000 10,000<br />
Homeless Coalition <strong>of</strong> Polk County 7,500 7,500 7,500<br />
Big Brothers & Big Sisters, Inc. 3,333<br />
CDBG-Boys & Girls Club - Summer Day Camp 10,000 10,000<br />
CDBG-Talbot House 9,000 9,000<br />
CDBG - Wilson House - Partial Wages for Counselor 8,000 5,000<br />
CDBG - Salv Army - Ranges for Trans Housing Apts 5,000<br />
CDBG - Sunrise Comm - Access Shwr for Grp Home 9,338<br />
CDBG - 10YR Plan to end chronic Homelessness 12,500<br />
CDBG - Faith In Action - Central <strong>Lakeland</strong> 1,000 4,000 4,000<br />
CDBG - Faith In Action - North <strong>Lakeland</strong> 400 4,600 4,600<br />
CDBG - Women's Resource Center 4,673 2,828 2,828<br />
CDBG - Salvation Army - Homeless Intervention Worker 8,000 8,000<br />
CDBG - Sunrise Comm - Hydraulic Lift Equip for Grp Home 4,000 4,000<br />
CDBG - Neighborhood Stablization Program 10,000 10,000<br />
CDBG - Sidewalk 6th Street 17,042<br />
CDBG - Drainage Hull Street 141,282<br />
CDBG - Consultant for Housing Study 15,400 15,400<br />
CDBG - Sunrise Comm - Spec Workstation Phys Challenged 7,500<br />
CDBG - Salv Army - Furn & Sup for Homeless Providers 12,000<br />
CDBG - Polk Museum <strong>of</strong> Art - Summer Art Prog Youth 5,000<br />
CDBG - Natl Alliance on Mental Illness - Op Assist Homeless Providers 5,000<br />
CDBG - Lkld Vol in Medicine - Hlth Care Working Uninsured 10,000<br />
CDBG - Freedom Center - Summer Camp Transportation 5,000<br />
CDBG - Family Fund - Rental Cost Back School Bash 3,000<br />
Rental Rehabilitation Program:<br />
HUD-Rental Rehabilitation-Grant Activities 3,919 17,583 17,583<br />
E – 79
COMMUNITY DEVELOPMENT - AFFORDABLE HOUSING<br />
Experience Budget Projected Proposed<br />
For Year For Year For Year For Year<br />
2008 2009 2009 <strong>2010</strong><br />
Dixieland Program:<br />
Dixieland-Affordable Housing Program 137,219 284,078 25,000<br />
Dixieland-Rehabilitation 126 6,527 100<br />
My Florida Safe Home 4,502 5,498 5,498<br />
DCA Elderly Homeowner Rehab:<br />
DCA Grant-Elderly Homeowner Rehab Program 11,801 10,497 10,497<br />
SHIP Program:<br />
FDOS-SHIP 55,065 173,875 43,329<br />
FDOS-SHIP- Affordable Housing Program 945,286 1,037,113 1,037,113<br />
My Florida Safe Home 10,000<br />
CDBG - Consultant for Housing Study 11,900<br />
HOME Program:<br />
HUD - Home - Administration 38,007 51,037 36,804 47,480<br />
HUD - Home - Affordable Housing Program 412,683 583,531 251,638 369,106<br />
HUD - Home - Keystone Challenge 3,815 167,613 106,426 83,220<br />
CDBG - Consultant for Housing Study 7,700<br />
Neighborhood Stabilization Program 2,005,781<br />
Hurricane Housing Recovery Program:<br />
HHR - Administration 25,390<br />
HHR - Affordable Housing Program 338,319 8,210 8,210<br />
HHR - Special Needs Rental Housing 98,132<br />
My Florida Safe Home 124,541 124,438 124,438<br />
2,456,103 2,603,990 1,761,055 2,621,527<br />
GRAND TOTAL 3,199,431 3,253,014 2,384,607 3,389,384<br />
E – 80
REVENUE AND EXPENDITURE SUMMARY<br />
LAKELAND COMMUNITY REDEVELOPMENT AREAS<br />
Experience Budget Experience 2009-10<br />
For Year For Year 2008-09 Proposed by<br />
EXPENSES 2007-08 2008-09 Estimated <strong>City</strong> Manager<br />
Personnel<br />
Salaries and Wages 43,259 406,191 473,991 547,551<br />
Fringe Benefits 13,174<br />
Total Personnel 56,433 406,191 473,991 547,551<br />
Non-Personnel<br />
Internal Service Charges 7,035 18,500 11,000 12,300<br />
Pr<strong>of</strong>essional and Contractual 411,844 2,311,968 557,138 1,346,736<br />
Utilities<br />
Insurance and Fixed Charges<br />
All Other Operations and Maintenance 268,796 216,001 171,021 141,000<br />
Capital Outlay 2,140,271 5,483,300 2,508,448 2,666,147<br />
Debt Service 1,236,013 1,073,449 1,059,886 805,000<br />
Total Non-Personnel 4,063,959 9,103,218 4,307,493 4,971,183<br />
Total Expenditures 4,120,392 9,509,409 4,781,484 5,518,734<br />
Transfers<br />
Transfers In 70,000 70,000 70,000 70,000<br />
Transfers Out (186,744) (250,000) (250,000) (350,000)<br />
Net Transfers (116,744) (180,000) (180,000) (280,000)<br />
Revenue Sources<br />
Taxes 5,589,536 5,543,000 5,634,615 4,840,939<br />
Licenses and Permits<br />
Intergovernmental (638)<br />
Charges for Services<br />
Interest Income 259,751 66,990 150,000 75,878<br />
All Other Revenue 309,010 226,118 200,000<br />
Total Revenue 6,157,659 5,609,990 6,010,733 5,116,817<br />
Funding to be Provided (1,920,523) 4,079,419 (1,049,249) 681,917<br />
E – 81
LAKELAND COMMUNITY REDEVELOPMENT AREAS<br />
Experience Budget Projected Proposed<br />
For Year For Year For Year For Year<br />
2008 2009 2009 <strong>2010</strong><br />
REVENUES<br />
Property Taxes<br />
Current Ad Valorem Taxes-Downtown 1,603,863 1,636,000 1,675,609 1,483,803<br />
Current Ad Valorem Taxes-MidTown 3,684,937 3,600,000 3,644,029 3,059,773<br />
Current Ad Valorem Taxes-Dixieland 300,736 307,000 314,977 297,363<br />
5,589,536 5,543,000 5,634,615 4,840,939<br />
Other Miscellaneous Revenue<br />
Reimbursements / Loss Recovery 202<br />
Charges for Services<br />
Rental Income 11,511<br />
Residential Redevelopment - Property Management 197,297 226,118 200,000<br />
208,808 226,118 200,000<br />
Investment Income<br />
Interest on Pooled Investments-Downtown 80,897 23,790 45,000 14,878<br />
Interest on Pooled Investments-MidTown 221,929 41,000 170,000 59,000<br />
Interest on Pooled Investments-Dixieland 44,138 2,200 32,000 2,000<br />
Market Value Restatement-Downtown (19,239) (25,000)<br />
Market Value Restatement-MidTown (57,333) (60,000)<br />
Market Value Restatement-Dixieland (10,641) (12,000)<br />
259,751 66,990 150,000 75,878<br />
State Grants<br />
FDOT-MLK-Myrtle to Memorial (638)<br />
Transfers from Other Fund<br />
Transportation Fund - Contribution to HOPE VI Improvements 70,000 70,000 70,000 70,000<br />
Transportation Fund - Corridor Beautification 100,000<br />
170,000 70,000 70,000 70,000<br />
SUB-TOTAL 6,227,659 5,679,990 6,080,733 5,186,817<br />
PRIOR YEAR SURPLUS (1,920,523) 4,079,419 (1,049,249) 681,917<br />
TOTAL REVENUE 4,307,135 9,759,409 5,031,484 5,868,734<br />
E – 82
LAKELAND COMMUNITY REDEVELOPMENT AREAS<br />
Experience Budget Projected Proposed<br />
For Year For Year For Year For Year<br />
2008 2009 2009 <strong>2010</strong><br />
EXPENSES<br />
DOWNTOWN CRA<br />
Personal Services 38,257 27,967 41,070<br />
Utilities<br />
Water Utility Service 21<br />
Electric Utility Service 988<br />
Wastewater Services 27<br />
Interdepartmental Solid Waste Service 60<br />
1,096<br />
Inter-<strong>City</strong> Services<br />
Maintenance <strong>of</strong> Facilities 376<br />
Janitorial Services 312<br />
Intra-dept Charges - PC & Network Support 831<br />
Intra-Departmental Charges - Telephone 133<br />
Intra-Departmental Charges/Training Ctr 252<br />
Other <strong>City</strong> Department Charges 3,500 800<br />
3,500 2,704<br />
All Other O&M<br />
Pr<strong>of</strong>essional Services 3,585 120,263 50,000<br />
Annual Audit 979 6,120 1,685 5,000<br />
Tax Increment Financing Agreements 134,209 168,761 101,636 140,000<br />
138,773 295,144 103,321 195,000<br />
Sub-Total 138,773 336,901 131,288 239,870<br />
MID-TOWN CRA<br />
Personal Services 143,959 112,906 196,943<br />
Utilities<br />
Water Utility Service 21<br />
Electric Utility Service 988<br />
Wastewater Services 27<br />
Interdepartmental Solid Waste Service 60<br />
1,096<br />
Inter-<strong>City</strong> Services<br />
Maintenance <strong>of</strong> Facilities 376<br />
Janitorial Services 312<br />
Intra-dept Charges - PC & Network Support 3,314<br />
Intra-Departmental Charges - Telephone 532<br />
Intra-Departmental Charges/Training Ctr 504<br />
Other <strong>City</strong> Department Charges 7,500 2,500<br />
7,500 7,538<br />
E – 83
LAKELAND COMMUNITY REDEVELOPMENT AREAS<br />
Experience Budget Projected Proposed<br />
For Year For Year For Year For Year<br />
2008 2009 2009 <strong>2010</strong><br />
All Other O&M<br />
Pr<strong>of</strong>essional Services 4,628 135,635 135,000 135,000<br />
Advertising 1,796 500 500 500<br />
Annual Audit 1,685 1,685 1,736<br />
Office Supplies 55 500 500 500<br />
Food Purchases 430 400 1,000 1,000<br />
Travel 366 500 500<br />
Training 1,918 1,500 500 500<br />
All Other Sundry Charges 115 80 100 100<br />
9,308 140,300 139,785 139,836<br />
Sub-Total 9,308 291,759 252,691 345,413<br />
DIXIELAND CRA<br />
Personal Services 39,113<br />
Utilities<br />
Water Utility Service 21<br />
Electric Utility Service 988<br />
Wastewater Services 27<br />
Interdepartmental Solid Waste Service 60<br />
1,096<br />
Inter-<strong>City</strong> Services<br />
Maintenance <strong>of</strong> Facilities 376<br />
Janitorial Services 312<br />
Intra-dept Charges - PC & Network Support 831<br />
Intra-Departmental Charges - Telephone 133<br />
Intra-Departmental Charges/Training Ctr 252<br />
Other <strong>City</strong> Department Charges 7,500 5,000<br />
7,500 6,904<br />
All Other O&M<br />
Pr<strong>of</strong>essional Services 7,310 17,565 15,000 15,000<br />
Annual Audit 1,685 1,685 1,736<br />
Food Purchases 291 510 500 500<br />
Subscription & Membership 750 500 500<br />
Training 870 500 500<br />
8,471 20,510 18,185 18,236<br />
Sub-Total 8,471 28,010 18,185 65,349<br />
Debt Service<br />
Residential Redevelopment-Downtown 856,730 837,471 837,471 680,000<br />
Residential Redevelopment-Mid-Town 32,018<br />
Downtown Streetscape 125,000 125,000 125,000 125,000<br />
Corridor Beautification 10,733 110,978 97,415<br />
Downtown Signage 211,532<br />
1,236,013 1,073,449 1,059,886 805,000<br />
E – 84
LAKELAND COMMUNITY REDEVELOPMENT AREAS<br />
Experience Budget Projected Proposed<br />
For Year For Year For Year For Year<br />
2008 2009 2009 <strong>2010</strong><br />
Projects<br />
Downtown:<br />
Purchase - Container Gardens 1,000 1,000<br />
Maintenance Container Gardens 96,382 79,568 35,000 81,955<br />
Downtown Signage 284,132 100,000<br />
Residential Redevelopment 35,686 245,057 5,000<br />
LCRA Downtown Plan 50,000 50,000<br />
Mowing 7,286 16,714 15,000 12,360<br />
Cleaning & Painting Downtown Streetscape 21,500 22,000 20,000 22,500<br />
Downtown Streetscape 250,000 250,000<br />
Lemon Street Streetscape (Pedestrian Connector) 1,425<br />
Mass Ave Streetscape - Cedar St to RR tracks 1,063<br />
Massachusetts Ave Brick Crosswalks 39,375 66,858 2,000<br />
Streetscape on S. Fla Ave in front <strong>of</strong> Pilot Bank 99,758 116,469 20,000<br />
USF Polytechnic Incubator 28,787<br />
Midtown:<br />
Landscape/Pedestrian Enhancements:<br />
Massachusetts Improvements - In Town Bypass to Memorial 100,000<br />
Parker Street 3-lane conversion 720,000<br />
FDOT - Parker Street 3-Lane Conversion 80,000 80,000<br />
Other Pedestrian Enhancements (Sidewalks & Enhancements) 150,000 150,000 150,000<br />
Landscaping Maintenance by Other <strong>City</strong> Departments 16,745 64,407 64,407 40,000<br />
Model Blocks:<br />
N. Lake Wire - land acquisition 500,000<br />
Parker St. - land acquisition 1,153,651 559,287 100,000<br />
Stella Ave Renovations 100,000 100,000<br />
Missouri Ave Demo 2,580 2,580<br />
Other Model Blocks 118,653 47,420 50,000 50,000<br />
Residential Buffers:<br />
Residential Buffer - N Lake Wire Interface w/N. Fla Ave 100,000 100,000 30,000<br />
Kathleen Rd. - Memorial to I-4 100,000<br />
Corridor Enhancements:<br />
Corridor Enhancements - TEAM BRICK 36,647 149,415 149,415 100,000<br />
Corridor Enhancements - US 98 / N Fla Ave - Memorial to Griffin Rd 300,000<br />
Crossroads Motor Lodge Demolition 214,047 85,953<br />
FDOT-MLK-Myrtle to Memorial 411<br />
E – 85
LAKELAND COMMUNITY REDEVELOPMENT AREAS<br />
Experience Budget Projected Proposed<br />
For Year For Year For Year For Year<br />
2008 2009 2009 <strong>2010</strong><br />
Miscellaneous:<br />
Community Visioning Project 1,800<br />
Project Manager Workstation and Equipment 54<br />
Planning-Affordable Housing Incentive Plan 42,500 42,500 42,500<br />
Infill Downpayment Assistance 123,081 250,000 80,000 250,000<br />
Infill Housing Construction Incentive 300,000 200,000<br />
Metro <strong>Lakeland</strong> Community Housing Strategy 500,000 500,000<br />
Owner-Occupant Acquisition and Relocation Program 80,000 724,000 100,000 200,000<br />
Residential Redevelopment 54,515 54,515<br />
Residential Redevelopment - Property Management 279,395 200,000 200,000 200,000<br />
Small Project Assistance 50,000 5,000 50,000<br />
Commercial Property Acquisition 1,000,000 1,000,000 500,000<br />
Lake Parker Stormwater BMP's (Parker Street Neighborhood) 50,000 50,000<br />
Memorial Blvd Median Enhancements 22,938<br />
In Town Bypass Sidewalk 20,000<br />
Lakeshore Drive Sidewalk (Memorial to Parker) 15,000 14,594<br />
Parkview Place Sidewalk (<strong>Lakeland</strong> Hills Blvd. to W. Lake Parker) 50,000 3,430<br />
Ingraham Avenue Enhancements 400,000<br />
Dixieland:<br />
Small Project Assistance 7,500 182,000 35,000 60,000<br />
Design Assistance 2,100 71,950 12,000 15,000<br />
Alley Project - Alley Maintenance & Improvements 262,972 200,000 200,000<br />
Corridor Improvements-Medians & Gateway Features - Construction 215,000<br />
Parking and Access Program 50,000 25,000<br />
Landscape Matching Grants 15,000<br />
Engineering and Architectural Design 45,000 9,500<br />
Enhancements 17,623 10,000 10,000 10,000<br />
Publications and Promotions 7,774 12,000 5,000 10,000<br />
Park/E Belmar Alley 331<br />
Street Improvement Project - S. Florida Ave/Dixieland Drainage Improvements<br />
1,397<br />
Park Street Parking Lot 1,234<br />
Mosswood Stormwater Improvements 20,467<br />
SR 37 Stormwater Improvements 100,000<br />
2,528,324 7,575,797 3,115,941 3,893,102<br />
Transfers To Other Funds<br />
General Fund-Downtown 53,000<br />
General Fund-MidTown 133,744<br />
Public Improvement Fund - Lake Mirror Park 250,000 250,000 350,000<br />
LDDA 199,503 203,493 203,493 170,000<br />
386,247 453,493 453,493 520,000<br />
GRAND TOTAL 4,307,135 9,759,409 5,031,484 5,868,734<br />
E – 86
REVENUE AND EXPENDITURE SUMMARY<br />
DEBT SERVICE FUND<br />
Experience Budget Experience 2009-10<br />
For Year For Year 2008-09 Proposed by<br />
EXPENSES 2007-08 2008-09 Estimated <strong>City</strong> Manager<br />
Personnel<br />
Salaries and Wages<br />
Fringe Benefits<br />
Total Personnel<br />
Non-Personnel<br />
Internal Service Charges<br />
Pr<strong>of</strong>essional and Contractual<br />
Utilities<br />
Insurance and Fixed Charges<br />
All Other Operations and Maintenance<br />
Capital Outlay<br />
Debt Service 359,898 367,898 367,898 374,048<br />
Total Non-Personnel 359,898 367,898 367,898 374,048<br />
Total Expenditures 359,898 367,898 367,898 374,048<br />
Transfers<br />
Transfers In 354,954 367,898 367,398 374,048<br />
Transfers Out<br />
Net Transfers 354,954 367,898 367,398 374,048<br />
Revenue Sources<br />
Taxes<br />
Licenses and Permits<br />
Intergovernmental<br />
Charges for Services<br />
Interest Income 4,943 500<br />
All Other Revenue<br />
Total Revenue 4,943 500<br />
Funding to be Provided<br />
E – 87
DEBT SERVICE<br />
Experience Budget Projected Proposed<br />
For Year For Year For Year For Year<br />
2008 2009 2009 <strong>2010</strong><br />
REVENUE<br />
Investment Income<br />
Interest on Pooled Investments 8,663 4,500<br />
Market Value Restatement (3,720) (4,000)<br />
4,943 500<br />
Transfers from Other Fund<br />
Transfer from <strong>Lakeland</strong> Airport 70,638 74,263 73,480 72,463<br />
Transfer from Public Improvement Fund 284,316 293,635 293,918 301,585<br />
354,954 367,898 367,398 374,048<br />
PRIOR YEAR SURPLUS<br />
REVENUE TOTAL 359,898 367,898 367,898 374,048<br />
EXPENSES<br />
Debt Service<br />
Interest Expense 79,898 72,898 72,898 64,048<br />
Principal Retirement 280,000 295,000 295,000 310,000<br />
359,898 367,898 367,898 374,048<br />
GRAND TOTAL 359,898 367,898 367,898 374,048<br />
E – 88
REVENUE AND EXPENDITURE SUMMARY<br />
FLEET MANAGEMENT<br />
Experience Budget Experience 2009-10<br />
For Year For Year 2008-09 Proposed by<br />
EXPENSES 2007-08 2008-09 Estimated <strong>City</strong> Manager<br />
Personnel<br />
Salaries and Wages 1,574,858 1,605,549 1,569,518 1,630,782<br />
Fringe Benefits 503,479 474,259 415,731 519,815<br />
Total Personnel 2,078,337 2,079,808 1,985,249 2,150,597<br />
Non-Personnel<br />
Internal Service Charges 525,333 568,707 533,446 577,419<br />
Pr<strong>of</strong>essional and Contractual 462,287 495,146 236,872 384,222<br />
Utilities 74,522 82,975 90,479 92,129<br />
Insurance and Fixed Charges 75,891 72,167 72,100 62,177<br />
All Other Operations and Maintenance 5,283,341 6,410,856 3,833,063 5,011,007<br />
Capital Outlay 4,138,490 6,387,591 8,816,851 5,164,399<br />
Debt Service<br />
Total Non-Personnel 10,559,864 14,017,442 13,582,811 11,291,353<br />
Total Expenditures 12,638,201 16,097,250 15,568,060 13,441,951<br />
Transfers<br />
Transfers In<br />
Transfers Out (4,737)<br />
Net Transfers (4,737)<br />
Revenue Sources<br />
Taxes<br />
Licenses and Permits<br />
Intergovernmental 147,250 148,000 148,000 125,000<br />
Charges for Services 11,550,683 13,175,369 10,274,321 11,535,429<br />
Interest Income 949,741 880,451 1,358,000 788,000<br />
All Other Revenue 415,038 1,447,617 994,501 429,600<br />
Total Revenue 13,062,712 15,651,437 12,774,822 12,878,029<br />
Funding to be Provided (419,774) 445,813 2,793,238 563,922<br />
E – 89
FLEET MANAGEMENT<br />
Experience Budget Projected Proposed<br />
For Year For Year For Year For Year<br />
2008 2009 2009 <strong>2010</strong><br />
REVENUES<br />
State Revenue Sharing<br />
Motor Fuel Tax Rebate 147,250 148,000 148,000 125,000<br />
Other Miscellaneous Revenue<br />
Sale Of Rental Equipment 205,723 225,000 205,000 200,000<br />
Insurance Proceeds 1,200<br />
Scrap Sales 3,167 1,350 1,356 1,500<br />
Insurance Proceeds - Workers Comp Claims 500 250<br />
Refund <strong>of</strong> Prior Year Expenses 2,609<br />
Reimbursements / Loss Recovery 3,706 6,900 2,750 4,500<br />
212,596 237,559 209,356 206,000<br />
Charges for Services<br />
Depreciation Reserve Billings 3,428,260 3,660,714 3,705,040 3,421,053<br />
Maintenance <strong>of</strong> Fleet Mgmt Equipment 3,884,025 4,386,199 3,793,095 4,268,811<br />
Repair Of Fleet Mgmt Equipment 341,720 350,000 350,000 343,000<br />
Fleet Mgmt Fuel Billings 3,896,678 4,778,456 2,426,186 3,502,565<br />
11,550,683 13,175,369 10,274,321 11,535,429<br />
Investment Income<br />
Interest on Pooled Investments 25,763 41,926 38,000 38,000<br />
Interest on Pooled Investments 1,223,950 838,525 1,320,000 750,000<br />
Market Value Restatement (4,375)<br />
Market Value Restatement (295,596)<br />
949,741 880,451 1,358,000 788,000<br />
Transfers from Other Fund<br />
Transfer from General Fund 15,000 113,371 63,577 8,100<br />
Transfer from Stormwater Utility Fund 46,000<br />
Transfer from Transportation Fund 250,000 228,267<br />
Transfer from Uninsured Loss Fund 23,778 23,778<br />
Transfer from WW Operations 199,000 92,000<br />
Transfer from WW R&R 25,000 84,000<br />
Transfer from <strong>Lakeland</strong> Airport 13,441<br />
Transfer from Water R&R 36,231 124,000 158,165<br />
Transfer from Facilities Maintenance Fund 51,852 20,148 21,500<br />
Transfer from Electric Operations 42,796 479,761 219,358 64,000<br />
Transfer from Law Enforcement Trust 18,123<br />
202,443 1,210,058 785,145 223,600<br />
SUB-TOTAL 13,062,712 15,651,437 12,774,822 12,878,029<br />
PRIOR YEAR SURPLUS<br />
Operating Fund 209,088 70,222 2,974,145 23,891<br />
Depreciation Reserve (628,862) 375,591 (180,907) 540,031<br />
TOTAL REVENUES 12,642,938 16,097,250 15,568,060 13,441,951<br />
E – 90
FLEET MANAGEMENT<br />
Experience Budget Projected Proposed<br />
For Year For Year For Year For Year<br />
2008 2009 2009 <strong>2010</strong><br />
EXPENSES<br />
OPERATIONS<br />
Personal Services 477,787 330,070 315,079 364,272<br />
Insurance<br />
Insurance - Fire 3,452 3,682 3,615 3,763<br />
Insurance - Position Bond 191 191 191<br />
Self-Insurance Services 72,439 68,294 68,294 58,223<br />
75,891 72,167 72,100 62,177<br />
Utilities<br />
Water Utility Service 1,343 1,357 1,425 1,454<br />
Electric Utility Service 55,235 65,159 68,585 69,957<br />
Wastewater Services 2,190 2,283 2,339 2,538<br />
Interdepartmental Solid Waste Service 13,663 12,726 16,680 16,680<br />
72,430 81,525 89,029 90,629<br />
Inter-<strong>City</strong> Services<br />
Purchasing & Stores Service 45,437 47,828 47,828 46,871<br />
General Fund Services 277,005 275,162 263,239 275,299<br />
Rental-Fleet Mgmt Equipment 16,668 23,716 17,496 22,030<br />
Gasoline-Fleet Mgmt Equipment 42,559 47,124 24,125 53,361<br />
Maintenance-Fleet Mgmt Equipment 80,849 111,445 118,390 118,225<br />
Intra-dept Charges - PC & Network Support 27,043 26,353 26,676 26,281<br />
Intra-Departmental Charges - Telephone 5,818 7,285 5,898 5,583<br />
Intra-Departmental Charges - Radios 2,894 2,894 2,894 2,892<br />
Intra-Departmental Charges - Facilities 17,226 16,424 16,424 16,158<br />
Intra-Departmental Charges - Janitorial 8,109 8,751 8,751 8,994<br />
Intra-Departmental Charges/Training Ctr 1,725 1,725 1,725 1,725<br />
525,333 568,707 533,446 577,419<br />
E – 91
FLEET MANAGEMENT<br />
Experience Budget Projected Proposed<br />
For Year For Year For Year For Year<br />
2008 2009 2009 <strong>2010</strong><br />
All Other O&M<br />
Contractual Services 15,597 6,100 5,000 6,100<br />
Banking Service 1,049 1,055 1,055 1,055<br />
Insurance Consultant 1,196 2,366 2,410 1,817<br />
Annual Audit 4,047 4,125 3,407 4,250<br />
Office Supplies 3,037 3,200 2,800 3,200<br />
Equipment - Noncapital 3,106 6,500 4,500 4,800<br />
All Other Materials & Supplies 5,113 6,600 4,500 6,200<br />
Uniforms 16,004 14,425 16,000 16,000<br />
Personal Safety Equipment 8,672 9,200 4,500 9,200<br />
Leases 1,982 9,045 4,500 4,500<br />
Repair Of Equipment 8,424 9,500 5,000 7,500<br />
Printing & Photography 942 640 400 940<br />
Postage & Mailing 376 220 220 360<br />
Subscription & Membership 899 1,495 1,495 1,495<br />
Telephone, Communications 2,092 1,450 1,450 1,500<br />
Travel 5,168 5,270 2,500 2,600<br />
Training 2,141 3,475 4,200 4,400<br />
All Other Sundry Charges 118 650 650 500<br />
S<strong>of</strong>tware License & Maintenance 11,496 3,992 3,992 4,300<br />
91,460 89,308 68,579 80,717<br />
Capital Equipment<br />
Equipment - Capital 73,930 55,000 25,762<br />
Motor Equipment 4,135,917 5,834,278 5,834,278 4,634,684<br />
Contingency 476,810 500,000<br />
4,135,917 6,385,018 5,889,278 5,160,446<br />
Projects<br />
Recruitment Expenses 10,800 3,000<br />
Gainesville Regional Utilities - Mutual Aid Assistance 3,894<br />
Custom Grill 5,362<br />
9,257 10,800 3,000<br />
SUB-TOTAL 5,388,075 7,537,595 6,970,511 6,335,660<br />
E – 92
FLEET MANAGEMENT<br />
Experience Budget Projected Proposed<br />
For Year For Year For Year For Year<br />
2008 2009 2009 <strong>2010</strong><br />
MAINTENANCE<br />
Personal Services 1,600,550 1,749,738 1,670,170 1,786,326<br />
All Other O&M<br />
Contractual Services 440,398 481,500 225,000 371,000<br />
All Other Materials & Supplies 55,287 42,000 42,000 42,000<br />
Chemicals 4,785 8,200 4,200 7,000<br />
Paints & Paint Supplies 3,113 8,000 4,000 6,500<br />
Tools & Implements 22,610 24,300 24,300 25,300<br />
Tires & Tubes 407,457 395,000 425,000 426,000<br />
Parts For Equipment 701,357 932,950 800,000 850,000<br />
Lubricants 55,366 60,000 53,636 55,000<br />
Transmission 46,319 45,000 40,000 45,000<br />
Body Shop Services 121,176 150,000 105,000 130,000<br />
Towing 32,346 45,000 38,000 45,000<br />
Maintenance Of Facilities 22,040 24,200 10,094 18,746<br />
Licenses & Permits 5,201 7,500 4,614 5,500<br />
Car Washing 20,000 23,000 22,000<br />
1,917,455 2,243,650 1,798,844 2,049,046<br />
All Other O&M<br />
Auto/Heavy Equipment Fuel 3,612,220 4,563,694 2,200,962 3,266,966<br />
Increase/Decrease In Inventory 117,328<br />
3,729,548 4,563,694 2,200,962 3,266,966<br />
SUB-TOTAL 7,247,553 8,557,082 5,669,976 7,102,338<br />
Transfers To Other Funds<br />
Transfer To General Fund 4,737<br />
Radio System Expansion - Public Safety 2,573 2,573 2,573 2,573<br />
PIF - Heritage Town Center - Training Center 1,380<br />
Fleet Mgmt Reserve Loan to Internal Loan Fund 2,925,000<br />
7,310 2,573 2,927,573 3,953<br />
GRAND TOTAL 12,642,938 16,097,250 15,568,060 13,441,951<br />
E – 93
THIS PAGE IS INTENTIONALLY BLANK<br />
E – 94
REVENUE AND EXPENDITURE SUMMARY<br />
PURCHASING AND STORES<br />
Experience Budget Experience 2009-10<br />
For Year For Year 2008-09 Proposed by<br />
EXPENSES 2007-08 2008-09 Estimated <strong>City</strong> Manager<br />
Personnel<br />
Salaries and Wages 921,180 919,177 905,632 914,048<br />
Fringe Benefits 346,293 263,382 242,551 293,555<br />
Total Personnel 1,267,473 1,182,559 1,148,183 1,207,602<br />
Non-Personnel<br />
Internal Service Charges 463,917 514,214 488,199 516,949<br />
Pr<strong>of</strong>essional and Contractual 6,845 4,339 3,922 4,700<br />
Utilities 76,315 86,518 63,912 64,877<br />
Insurance and Fixed Charges 44,405 20,729 20,626 38,802<br />
All Other Operations and Maintenance 1,035,299 1,130,539 901,483 1,128,889<br />
Capital Outlay 14,157 26,079 26,079 3,308<br />
Debt Service<br />
Total Non-Personnel 1,640,938 1,782,418 1,504,221 1,757,525<br />
Total Expenditures 2,908,411 2,964,977 2,652,404 2,965,127<br />
Transfers<br />
Transfers In<br />
Transfers Out<br />
Net Transfers<br />
Revenue Sources<br />
Taxes<br />
Licenses and Permits<br />
Intergovernmental<br />
Charges for Services 2,717,284 2,916,184 2,678,522 2,930,578<br />
Interest Income 18,358 24,359 23,000 24,846<br />
All Other Revenue 30,118 13,000 11,000 13,000<br />
Total Revenue 2,765,760 2,953,543 2,712,522 2,968,424<br />
Funding to be Provided 142,650 11,434 (60,118) (3,297)<br />
E – 95
PURCHASING AND STORES<br />
Experience Budget Projected Proposed<br />
For Year For Year For Year For Year<br />
2008 2009 2009 <strong>2010</strong><br />
REVENUES<br />
Other Miscellaneous Revenue<br />
Scrap Sales 30,118 13,000 11,000 13,000<br />
Charges for Services<br />
Purchasing and Stores Services<br />
Allocation - Airport 8,335 8,774 8,774 8,774<br />
Allocation - CDBG 19,598 20,629 12,622 20,629<br />
Allocation - Cleveland Heights Golf Course 12,169 12,810 12,810 12,810<br />
Allocation - Electric 1,191,152 1,253,844 1,253,844 1,253,844<br />
Allocation - Facilities Maintenance 23,987 25,250 25,250 24,745<br />
Allocation - Fleet Mgmt 45,437 47,828 47,828 46,871<br />
Allocation - General Fund 187,952 197,844 197,245 214,361<br />
Allocation - Information Services 31,410 33,063 33,063 32,402<br />
Allocation - <strong>Lakeland</strong> Center 10,788 11,356 11,356 11,356<br />
Allocation - Parking 1,258 1,324 1,324 1,324<br />
Allocation - Solid Waste 6,706 7,059 7,059 7,059<br />
Allocation - Stormwater Utility Fund 2,674 2,815 2,815 2,815<br />
Allocation - Wastewater 47,108 49,587 49,587 49,587<br />
Allocation - Water Utilities Fund 130,727 137,607 137,607 137,607<br />
1,719,301 1,809,790 1,801,184 1,824,184<br />
Central Stores Services - Sales to <strong>City</strong> Funds<br />
Sales - Facilities Maintenance 7,564 14,935 6,059 14,935<br />
Sales - Hurricane Housing Assistance Plan 24<br />
Sales - Information Technology Fund 4,077 4,635 1,453 4,635<br />
Sales - Stormwater Utilities 19 185 213 185<br />
Sales - Water 698,521 797,735 635,374 797,735<br />
Sales - Water Impact Fees 90,181 101,455 45,376 101,455<br />
Sales-CDBG 285 314 227 314<br />
Sales-Cleveland Heights Golf Club 37 77 26 77<br />
Sales-Electric Utilities 51,958 30,591 50,089 30,591<br />
Sales-Fleet Mgmt 4,873 5,768 3,108 5,768<br />
Sales-General Fund 102,326 102,662 86,300 102,662<br />
Sales-Home 42 300 149 300<br />
Sales-<strong>Lakeland</strong> Center 1,119 1,780 910 1,780<br />
Sales-<strong>Lakeland</strong> Regional Airport 1,221 4,120 3,053 4,120<br />
Sales-LCRA 57 57<br />
Sales-Parking System 1,098 1,022 1,855 1,022<br />
Sales-Public Improvement 1,030 724 1,030<br />
Sales-Purchasing & Stores (1,498) 3,115 366 3,115<br />
Sales-Ship 218 480 183 480<br />
Sales-Solid Waste Mgmt 6,041 6,695 8,934 6,695<br />
Sales-Transportation Fund 3,212 1,587 1,587<br />
Sales-Wastewater 26,665 27,254 32,939 27,254<br />
Sales-Wastewater R & R 597 597<br />
997,983 1,106,394 877,338 1,106,394<br />
Investment Income<br />
Interest on Pooled Investments 24,502 24,359 23,000 24,846<br />
Market Value Restatement (6,144)<br />
18,358 24,359 23,000 24,846<br />
SUB-TOTAL 2,765,760 2,953,543 2,712,522 2,968,424<br />
PRIOR YEAR SURPLUS 142,650 11,434 (60,118) (3,297)<br />
TOTAL REVENUES 2,908,411 2,964,977 2,652,404 2,965,127<br />
E – 96
EXPENSES<br />
PURCHASING AND STORES<br />
Experience Budget Projected Proposed<br />
For Year For Year For Year For Year<br />
2008 2009 2009 <strong>2010</strong><br />
ADMINISTRATION<br />
Personal Services 816,366 680,575 733,234 704,780<br />
Insurance<br />
Uninsured Loss Reimbursement 250<br />
Insurance - Fire 17,708 5,667 5,564 20,698<br />
Insurance - Position Bond 191 191 117<br />
Self-Insurance Services 15,371 14,871 14,871 17,987<br />
33,329 20,729 20,626 38,802<br />
Utilities<br />
Water Utility Service 1,450 1,450 1,499 1,532<br />
Electric Utility Service 57,919 65,849 43,291 44,157<br />
Wastewater Services 812 825 781 847<br />
Interdepartmental Solid Waste Service 13,298 14,335 14,282 14,282<br />
73,479 82,459 59,853 60,818<br />
Inter-<strong>City</strong> Services<br />
General Fund Services 181,857 202,290 202,290 196,548<br />
Rental-Fleet Mgmt Equipment 16,228 17,284 17,284 16,228<br />
Gasoline-Fleet Mgmt Equipment 2,495 17,784 3,270 14,716<br />
Maintenance-Fleet Mgmt Equipment 22,182 24,605 16,405 25,911<br />
Intra-dept Charges - PC & Network Support 42,150 43,799 41,255 38,829<br />
Intra-Departmental Charges - Telephone 8,309 9,198 8,441 8,242<br />
Intra-Departmental Charges - Facilities 38,047 36,276 36,276 29,015<br />
Intra-Departmental Charges - Janitorial 94,809 102,312 102,312 105,154<br />
Intra-Departmental Charges - IT Operations 53,689 56,515 56,515 78,156<br />
Intra-Departmental Charges/Training Ctr 936 936 936 936<br />
460,702 510,999 484,984 513,735<br />
All Other O&M<br />
Contractual Services 2,770<br />
Banking Service 784 789 789 789<br />
Insurance Consultant 586 719 786 1,074<br />
Advertising 7 50 50<br />
Annual Audit 2,698 2,781 2,297 2,837<br />
Office Supplies 7,627 7,650 7,650 7,650<br />
Equipment - Noncapital 2,415 700 700 700<br />
All Other Materials & Supplies 1,416 700 700 700<br />
Uniforms 2,246 2,200 2,200 2,200<br />
Tools & Implements 299 300 300 300<br />
Merchandise 991,987 1,106,394 877,338 1,106,394<br />
Rentals 760 760 760<br />
Repair Of Equipment 6,801 4,278 4,278 4,278<br />
Postage & Mailing 1,455 1,957 1,957 1,957<br />
Subscription & Membership 466 1,175 1,175 1,175<br />
Telephone, Communications 2,836 4,059 4,059 4,059<br />
Travel 3,039 4,020 4,020 2,370<br />
Training 1,845 405 405 405<br />
1,029,276 1,138,937 909,464 1,137,648<br />
Capital Equipment<br />
Equipment - Capital 5,778<br />
E – 97
PURCHASING AND STORES<br />
Experience Budget Projected Proposed<br />
For Year For Year For Year For Year<br />
2008 2009 2009 <strong>2010</strong><br />
Projects<br />
Maximo Upgrade <strong>City</strong> Wide 3,646 22,771 22,771<br />
Optio Upgrade 1,425<br />
5,071 22,771 22,771<br />
SUB-TOTAL 2,424,001 2,456,470 2,230,932 2,455,782<br />
WAREHOUSE<br />
Personal Services 462,183 501,984 414,949 502,823<br />
Inter-<strong>City</strong> Services<br />
Intra-Departmental Charges - Radios 3,216 3,215 3,215 3,214<br />
All Other O&M<br />
Increase/Decrease In Inventory 15,703<br />
SUB-TOTAL 481,102 505,199 418,164 506,037<br />
Transfer To Other Funds<br />
Radio System Expansion - Public Safety 3,308 3,308 3,308 3,308<br />
GRAND TOTAL 2,908,411 2,964,977 2,652,404 2,965,127<br />
E – 98
REVENUE AND EXPENDITURE SUMMARY<br />
FACILITIES MAINTENANCE<br />
Experience Budget Experience 2009-10<br />
For Year For Year 2008-09 Proposed by<br />
EXPENSES 2007-08 2008-09 Estimated <strong>City</strong> Manager<br />
Personnel<br />
Salaries and Wages 1,900,777 1,887,619 1,872,259 1,864,815<br />
Fringe Benefits 571,036 559,987 530,766 622,905<br />
Total Personnel 2,471,814 2,447,606 2,403,025 2,487,721<br />
Non-Personnel<br />
Internal Service Charges 442,254 430,300 430,826 456,786<br />
Pr<strong>of</strong>essional and Contractual 102,365 150,421 152,165 144,662<br />
Utilities 31,831 27,417 29,801 29,517<br />
Insurance and Fixed Charges 72,699 71,580 71,846 68,380<br />
All Other Operations and Maintenance 674,140 890,559 744,293 751,758<br />
Capital Outlay 92,644 9,500 9,500 3,528<br />
Debt Service<br />
Total Non-Personnel 1,415,933 1,579,777 1,438,431 1,454,631<br />
Total Expenditures 3,887,746 4,027,383 3,841,456 3,942,352<br />
Transfers<br />
Transfers In<br />
Transfers Out<br />
Net Transfers<br />
Revenue Sources<br />
Taxes<br />
Licenses and Permits<br />
Intergovernmental<br />
Charges for Services 3,867,613 4,084,611 3,991,319 3,988,351<br />
Interest Income 22,281 21,000 25,000 25,000<br />
All Other Revenue 6,849 579 12,316 1,000<br />
Total Revenue 3,896,743 4,106,190 4,028,635 4,014,351<br />
Funding to be Provided (8,997) (78,807) (187,179) (71,999)<br />
E – 99
FACILITIES MAINTENANCE<br />
Experience Budget Projected Proposed<br />
For Year For Year For Year For Year<br />
2008 2009 2009 <strong>2010</strong><br />
REVENUES<br />
Other Miscellaneous Revenue<br />
Insurance Proceeds - Workers Comp Claims 6,097 11,616<br />
Reimbursements / Loss Recovery 752 579 700 1,000<br />
Charges for Services<br />
6,849 579 12,316 1,000<br />
Facility Maintenance Services to <strong>City</strong> Funds<br />
Allocation - Cleveland Heights Golf Course 38,631 36,832 36,832 36,236<br />
Allocation - General Fund 1,567,785 1,645,013 1,585,276 1,608,740<br />
Allocation - Fleet Mgmt 17,226 16,424 16,424 16,158<br />
Allocation - Wastewater 37,737 35,980 40,980 35,397<br />
Allocation - Parking 13,302 12,684 12,684 12,479<br />
Allocation - Airport 37,318 37,318 38,269<br />
Allocation - <strong>Lakeland</strong> Center 18,659 18,659 19,134<br />
Allocation - Solid Waste 7,305 6,965 6,965 6,852<br />
Allocation - Electric 759,311 730,549 726,834 641,290<br />
Allocation - Water Utilities Fund 46,908 44,724 44,724 43,999<br />
Allocation - Facilities Maintenance 17,436 16,624 16,624 16,355<br />
Allocation - Purchasing & Stores 38,047 36,276 36,276 29,015<br />
Allocation - Information Services 15,654 14,925 14,925 20,143<br />
Allocation - Self Insurance Fund 140,319 165,792 165,792 173,639<br />
Allocation - Stormwater Utility Fund 2,101 2,201 2,201 2,914<br />
Allocation - Housing 4,683<br />
Allocation - Downtown CRA 376<br />
Allocation - Mid-Town 376<br />
Allocation - Dixieland 376<br />
2,701,762 2,820,966 2,762,514 2,706,431<br />
Janitorial Services to <strong>City</strong> Funds<br />
Allocation - Cleveland Heights Golf Course 20,759 22,403 22,403 23,025<br />
Allocation - General Fund 413,886 457,723 422,883 470,186<br />
Allocation - Fleet Mgmt 8,109 8,751 8,751 8,994<br />
Allocation - Wastewater 26,726 33,812 33,812 35,181<br />
Allocation - Airport 56,951 59,682 59,682 46,273<br />
Allocation - Solid Waste 6,017 6,493 6,493 6,674<br />
Allocation - Electric 517,440 544,561 544,561 552,009<br />
Allocation - Water Utilities Fund 4,231 4,593 4,593 4,778<br />
Allocation - Facilities Maintenance 2,518 2,718 2,718 2,794<br />
Allocation - Purchasing & Stores 94,809 102,312 102,312 105,154<br />
Allocation - Information Services 12,782 18,847 18,847 22,308<br />
Allocation - Stormwater Utility Fund 1,623 1,750 1,750 2,421<br />
Allocation - Self Insurance Fund 1,187<br />
Allocation - Downtown CRA 312<br />
Allocation - Mid-Town 312<br />
Allocation - Dixieland 312<br />
1,165,851 1,263,645 1,228,805 1,281,920<br />
Investment Income<br />
Interest on Pooled Investments 32,555 21,000 25,000 25,000<br />
Market Value Restatement (10,274)<br />
22,281 21,000 25,000 25,000<br />
SUB-TOTAL 3,896,743 4,106,190 4,028,635 4,014,351<br />
PRIOR YEAR SURPLUS<br />
Operating Fund (8,997) (78,807) (187,179) (71,999)<br />
TOTAL REVENUES 3,887,746 4,027,383 3,841,456 3,942,352<br />
E – 100
FACILITIES MAINTENANCE<br />
Experience Budget Projected Proposed<br />
For Year For Year For Year For Year<br />
2008 2009 2009 <strong>2010</strong><br />
EXPENSES<br />
FACILITIES MAINTENANCE<br />
Personal Services 1,162,350 1,072,015 1,186,340 1,101,836<br />
Insurance<br />
Uninsured Loss Reimbursement 500 250 250 280<br />
Insurance - Fire 1,856 1,685 1,951 1,882<br />
Insurance - Position Bond 327 327 327<br />
Self-Insurance Services 70,343 69,318 69,318 65,891<br />
72,699 71,580 71,846 68,380<br />
Utilities<br />
Water Utility Service 482 524 560 577<br />
Electric Utility Service 15,965 14,188 15,350 14,225<br />
Wastewater Services 506 583 632 686<br />
Interdepartmental Solid Waste Service 1,096 66 1,973 1,973<br />
18,049 15,361 18,515 17,461<br />
Inter-<strong>City</strong> Services<br />
Purchasing & Stores Service 23,987 25,250 25,250 24,745<br />
General Fund Services 212,615 195,701 195,701 207,612<br />
Rental-Fleet Mgmt Equipment 28,468 38,067 32,665 29,253<br />
Gasoline-Fleet Mgmt Equipment 47,350 36,983 32,524 42,995<br />
Maintenance-Fleet Mgmt Equipment 52,002 51,038 60,833 65,947<br />
Intra-dept Charges - PC & Network Support 19,825 12,272 23,471 20,017<br />
Intra-Departmental Charges - Telephone 5,209 5,993 5,189 6,647<br />
Intra-Departmental Charges - Radios 1,286 1,286 1,286 1,285<br />
Intra-Departmental Charges - Facilities 17,436 16,624 16,624 16,355<br />
Intra-Departmental Charges - Janitorial 2,518 2,718 2,718 2,794<br />
Intra-Departmental Charges - IT Operations 14,503 15,266 15,266 14,961<br />
Intra-Departmental Charges/Training Ctr 2,956 2,956 2,956 2,956<br />
Contingency 25,000<br />
428,154 404,154 414,483 435,567<br />
E – 101
FACILITIES MAINTENANCE<br />
Experience Budget Projected Proposed<br />
For Year For Year For Year For Year<br />
2008 2009 2009 <strong>2010</strong><br />
All Other O&M<br />
Contractual Services 82,609 99,580 99,580 99,580<br />
Insurance Consultant 980 541 511 743<br />
Annual Audit 1,266 1,300 1,074 1,339<br />
Office Supplies 4,810 5,000 3,000 4,500<br />
Equipment - Noncapital 2,978 5,000 5,000 3,500<br />
Uniforms 2,692 3,690 3,686 4,000<br />
Tools & Implements 4,027 4,000 4,000 3,000<br />
Agricultural & Horticultural Supplies 313 2,630 2,630 2,000<br />
Parts For Equipment 39,359 65,000 45,000 63,000<br />
Rentals 1,195 4,500 4,500 1,800<br />
Maintenance Of Facilities 192,675 229,109 205,000 225,000<br />
Repair Of Equipment 382 1,500 1,500 1,000<br />
Printing & Photography 1,856 2,000 2,000 2,000<br />
Postage & Mailing 165 300 300 300<br />
Subscription & Membership 500 700 700 500<br />
Telephone, Communications 11,298 9,786 9,786 9,786<br />
Travel 1,216 1,500 1,500 1,500<br />
Training 2,773 5,000 5,000 3,500<br />
All Other Sundry Charges 555 1,000 1,000<br />
Licenses & Permits 112 642 1,000 500<br />
351,760 442,778 395,767 428,548<br />
Capital Equipment<br />
Equipment - Capital 22,798 6,500 6,500<br />
Projects<br />
Generator/UPS Maintenance 13,690 15,000 15,000 15,000<br />
Security Systems Controls Maintenance 191 75,000 50,600 50,000<br />
Electric Chiller HVAC Maintenance 45,401 55,000 35,000 10,000<br />
HVAC Maintenance - Various Bldgs 91,799 97,908 97,908 97,908<br />
Air Quality Investigations - <strong>City</strong> Buildings 22,065 10,000 10,000 10,000<br />
Garage Door/Operator Maintenance 24,708 25,000 25,000 20,000<br />
Pluming Repairs / Replacement 11,206 10,000 10,000 10,000<br />
Investment Grade Energy Savings Audit 20,000 20,000 20,000<br />
Elevator Maintenance 35,000 47,200 25,000 48,700<br />
Pinnacle Threshold Card Reader Database S<strong>of</strong>tware 17,994<br />
282,053 355,108 288,508 261,608<br />
SUB-TOTAL 2,337,864 2,392,496 2,381,959 2,313,400<br />
E – 102
FACILITIES MAINTENANCE<br />
Experience Budget Projected Proposed<br />
For Year For Year For Year For Year<br />
2008 2009 2009 <strong>2010</strong><br />
JANITORIAL SERVICES<br />
Personal Services 1,057,037 1,120,095 937,954 1,120,842<br />
Inter-<strong>City</strong> Services<br />
Gasoline-Fleet Mgmt Equipment 550<br />
Maintenance-Fleet Mgmt Equipment 764<br />
1,314<br />
All Other O&M<br />
Contractual Services 8,000 10,000 2,000<br />
Uniforms 3,220 4,255 5,000 4,100<br />
Cleaning & Janitor Supply 117,064 126,045 129,962 125,000<br />
Repair Of Equipment 1,434 2,400 1,500 1,500<br />
Telephone, Communications 276 350 350 350<br />
Training 635 1,000 1,000 500<br />
122,630 142,050 147,812 133,450<br />
SUB-TOTAL 1,179,667 1,263,459 1,085,766 1,254,292<br />
FIRE SAFETY<br />
Personal Services 252,427 255,496 278,731 265,042<br />
Inter-<strong>City</strong> Services<br />
Rental-Fleet Mgmt Equipment 5,781 8,907 8,080 9,000<br />
Gasoline-Fleet Mgmt Equipment 4,901 4,763 4,763 4,227<br />
Maintenance-Fleet Mgmt Equipment 3,418 10,705 3,500 7,992<br />
Intra-Departmental Charges - Telephone 457<br />
14,100 24,832 16,343 21,219<br />
All Other O&M<br />
Contractual Services 17,510 41,000 41,000 41,000<br />
Office Supplies 727 800 1,000 500<br />
Equipment - Noncapital 1,182 2,330 200 2,000<br />
Uniforms 521 750 750 750<br />
Tools & Implements 3,168 1,500 2,682 1,000<br />
Parts For Equipment 13,485 15,000 15,000 15,000<br />
Materials 6,302 15,000 7,800 15,000<br />
Repair Of Equipment 17 1,300 500 1,500<br />
Subscription & Membership 350 600 1,000 500<br />
Telephone, Communications 2,208 1,920 1,150 1,920<br />
Training 5,565 6,200 4,500 5,000<br />
S<strong>of</strong>tware License & Maintenance 1,000<br />
Licenses & Permits 805 700 75 700<br />
51,837 88,100 75,657 84,870<br />
Capital Equipment<br />
Equipment - Capital 3,000 3,000<br />
SUB-TOTAL 318,364 371,428 373,731 371,131<br />
Transfers To Other Funds<br />
Transfer To Fleet Mgmt Reserve 51,852<br />
PIF - Heritage Town Center - Training Center 3,528<br />
51,852 3,528<br />
GRAND TOTAL 3,887,746 4,027,383 3,841,456 3,942,352<br />
E – 103
THIS PAGE IS INTENTIONALLY BLANK<br />
E – 104
REVENUE AND EXPENDITURE SUMMARY<br />
INFORMATION TECHNOLOGY<br />
Experience Budget Experience 2009-10<br />
For Year For Year 2008-09 Proposed by<br />
EXPENSES 2007-08 2008-09 Estimated <strong>City</strong> Manager<br />
Personnel<br />
Salaries and Wages 4,585,566 4,804,925 4,677,525 4,975,308<br />
Fringe Benefits 1,360,826 1,269,870 1,155,422 1,432,323<br />
Total Personnel 5,946,392 6,074,795 5,832,948 6,407,632<br />
Non-Personnel<br />
Internal Service Charges 1,149,815 1,227,661 1,187,647 993,304<br />
Pr<strong>of</strong>essional and Contractual 418,782 479,668 356,350 743,005<br />
Utilities 200,649 190,744 193,104 242,589<br />
Insurance and Fixed Charges 85,822 94,970 85,661 109,021<br />
All Other Operations and Maintenance 2,335,841 2,505,939 2,526,775 2,529,015<br />
Capital Outlay 1,860,639 4,367,003 3,985,624 1,468,784<br />
Debt Service<br />
Total Non-Personnel 6,051,549 8,865,985 8,335,160 6,085,718<br />
Total Expenditures 11,997,940 14,940,780 14,168,108 12,493,350<br />
Transfers<br />
Transfers In<br />
Transfers Out (1,172)<br />
Net Transfers (1,172)<br />
Revenue Sources<br />
Taxes<br />
Licenses and Permits<br />
Intergovernmental<br />
Charges for Services 10,209,601 10,825,306 10,972,230 11,629,211<br />
Interest Income 159,593 83,852 250,000 150,000<br />
All Other Revenue 1,067,615 2,371,385 2,116,040 706,824<br />
Total Revenue 11,436,809 13,280,543 13,338,270 12,486,035<br />
Funding to be Provided 562,302 1,660,237 829,838 7,315<br />
E – 105
INFORMATION TECHNOLOGY<br />
Experience Budget Projected Proposed<br />
For Year For Year For Year For Year<br />
2008 2009 2009 <strong>2010</strong><br />
REVENUES<br />
Charges for Services<br />
Radio's<br />
Allocation - Cleveland Heights Golf Course 1,285<br />
Allocation - General Fund 270,100 270,099 270,099 271,561<br />
Allocation - CDBG 643 643 643 643<br />
Allocation - Fleet Mgmt 2,894 2,894 2,894 2,892<br />
Allocation - Wastewater 18,972 18,971 18,971 20,568<br />
Allocation - Parking 322 322 322 321<br />
Allocation - Airport 4,180 4,180 4,180 4,178<br />
Allocation - Solid Waste 16,720 16,720 16,720 20,568<br />
Allocation - Electric 126,224 126,047 126,047 137,974<br />
Allocation - Water Utilities Fund 32,476 32,476 32,476 31,495<br />
Allocation - Facilities Maintenance 1,286 1,286 1,286 1,285<br />
Allocation - Purchasing & Stores 3,216 3,215 3,215 3,214<br />
Allocation - Information Services 2,572 2,572 2,572 2,571<br />
Allocation - Stormwater Utility Fund 965 965 965 965<br />
480,569 480,390 480,390 499,520<br />
Telecommunications<br />
Allocation - General Fund 230,310 263,221 263,221 255,569<br />
Allocation - CDBG 2,089 2,276 2,276 3,190<br />
Allocation - Fleet Mgmt 5,818 7,285 7,285 5,583<br />
Allocation - Wastewater 7,045 8,912 8,912 8,508<br />
Allocation - Parking 270 310 310 532<br />
Allocation - <strong>Lakeland</strong> Center 40,752 47,085 47,085 48,388<br />
Allocation - Solid Waste 5,541 6,078 6,078 5,583<br />
Allocation - Electric 273,605 311,029 311,029 274,713<br />
Allocation - Water Utilities Fund 24,000 26,317 26,317 24,726<br />
Allocation - Facilities Maintenance 5,209 6,449 6,449 6,647<br />
Allocation - Purchasing & Stores 8,309 9,197 9,197 8,242<br />
Allocation - Information Services 40,968 48,247 48,247 43,336<br />
Allocation - Stormwater Utility Fund 724 1,280 1,280 1,329<br />
Non-Utility Rev - Telephone 25,302 20,829 20,412<br />
Fiber Charges to <strong>Lakeland</strong> Electric 884,251<br />
669,940 737,686 758,515 1,591,009<br />
E – 106
INFORMATION TECHNOLOGY<br />
Experience Budget Projected Proposed<br />
For Year For Year For Year For Year<br />
2008 2009 2009 <strong>2010</strong><br />
Application Development<br />
Allocation - Cleveland Heights Golf Course 9,908 10,458 10,458 10,249<br />
Allocation - General Fund 1,195,637 1,250,700 1,250,700 1,225,686<br />
Allocation - Wastewater 86,602 91,160 91,160 234,645<br />
Allocation - Parking 2,273 2,393 2,393 2,345<br />
Allocation - Airport 8,654 9,109 9,109 8,927<br />
Allocation - <strong>Lakeland</strong> Center 21,867 23,018 23,018 22,558<br />
Allocation - Solid Waste 9,772 10,286 10,286 78,999<br />
Allocation - Electric 2,558,927 2,765,003 2,765,003 2,741,891<br />
Allocation - Water Utilities Fund 104,239 109,725 109,725 249,135<br />
Allocation - Facilities Maintenance 14,503 15,266 15,266 14,961<br />
Allocation - Purchasing & Stores 53,689 56,515 56,515 55,385<br />
Allocation - Information Services 150,404 158,320 158,320 86,526<br />
Allocation - Telecommunications 103,291 108,727 108,727 55,138<br />
4,319,766 4,610,680 4,610,680 4,786,445<br />
Network Support<br />
Allocation - Cleveland Heights Golf Course 3,496 3,340 3,340 3,952<br />
Allocation - General Fund 637,361 611,832 611,832 605,561<br />
Allocation - CDBG 6,302 6,680 6,680 5,928<br />
Allocation - Fleet Mgmt 11,001 10,689 10,689 11,197<br />
Allocation - Wastewater 29,544 28,876 28,876 33,743<br />
Allocation - Parking 657 668 668 659<br />
Allocation - Airport 7,977 8,208 8,208 8,054<br />
Allocation - <strong>Lakeland</strong> Center 26,130 24,867 24,867 27,189<br />
Allocation - Solid Waste 6,569 6,012 6,012 6,587<br />
Allocation - Electric 399,354 398,071 398,071 458,118<br />
Allocation - Water Utilities Fund 51,705 49,125 49,125 52,277<br />
Allocation - Facilities Maintenance 8,092 6,162 6,162 8,563<br />
Allocation - Purchasing & Stores 17,130 17,519 17,519 16,467<br />
Allocation - Information Services 80,167 75,694 75,694 60,911<br />
Allocation - Telecommunications 11,459 11,807 11,807 12,306<br />
Allocation - Stormwater Utility Fund 4,748 4,826 4,826 4,611<br />
Network Connections Revenues 2,254<br />
1,303,946 1,264,376 1,264,376 1,316,123<br />
E – 107
INFORMATION TECHNOLOGY<br />
Experience Budget Projected Proposed<br />
For Year For Year For Year For Year<br />
2008 2009 2009 <strong>2010</strong><br />
PC Support<br />
Allocation - Cleveland Heights Golf Course 8,378 8,520 8,520 7,590<br />
Allocation - General Fund 505,185 478,570 604,665 571,243<br />
Allocation - CDBG 6,698 7,100 7,100 5,693<br />
Allocation - Fleet Mgmt 11,692 11,361 11,361 10,753<br />
Allocation - Wastewater 31,300 27,692 27,692 32,259<br />
Allocation - Parking 698 710 710 633<br />
Allocation - Airport 7,976 8,523 8,523 6,958<br />
Allocation - <strong>Lakeland</strong> Center 26,816 25,561 25,561 24,668<br />
Allocation - Solid Waste 6,982 6,390 6,390 6,325<br />
Allocation - Electric 410,990 408,983 408,983 366,229<br />
Allocation - Water Utilities Fund 52,661 51,807 51,807 48,072<br />
Allocation - Facilities Maintenance 8,080 6,390 6,390 7,590<br />
Allocation - Purchasing & Stores 17,349 17,751 17,751 15,180<br />
Allocation - Information Services 73,814 70,294 70,294 45,541<br />
Allocation - Telecommunications 11,776 12,071 12,071 10,120<br />
Allocation - Stormwater Utility Fund 4,887 4,970 4,970 4,427<br />
Support Services Revenues 2,130<br />
PC Rental Revenues 1,293<br />
1,188,704 1,146,693 1,272,788 1,163,281<br />
PC Rental<br />
Allocation - Cleveland Heights Golf Course 1,804 1,780 1,780 1,837<br />
Allocation - General Fund 250,881 361,574 361,574 309,445<br />
Allocation - CDBG 1,759 1,840 1,840 1,731<br />
Allocation - Fleet Mgmt 4,350 4,304 4,304 4,331<br />
Allocation - Wastewater 25,023 20,028 20,028 28,674<br />
Allocation - Parking 353 493 493 347<br />
Allocation - Airport 3,236 4,067 4,067 3,205<br />
Allocation - <strong>Lakeland</strong> Center 11,242 10,641 10,641 11,264<br />
Allocation - Solid Waste 3,245 2,496 2,496 3,966<br />
Allocation - Electric 233,259 244,047 244,047 227,150<br />
Allocation - Water Utilities Fund 31,571 26,999 26,999 32,273<br />
Allocation - Facilities Maintenance 3,653 3,076 3,076 3,864<br />
Allocation - Purchasing & Stores 7,672 8,529 8,529 7,182<br />
Allocation - Information Services 52,535 59,333 59,333 34,997<br />
Allocation - Telecommunications 7,049 7,555 7,555 6,079<br />
Allocation - Stormwater Utility Fund 3,022 3,112 3,112 2,781<br />
640,654 759,874 759,874 679,126<br />
GIS<br />
Allocation - General Fund 166,226 174,975 174,975 171,476<br />
Allocation - Wastewater 31,897 33,576 33,576 32,904<br />
Allocation - Electric 404,344 425,625 425,625 417,113<br />
Allocation - Water Utilities Fund 41,011 43,169 43,169 42,306<br />
Allocation - Information Services 6,005 6,321 6,321 6,195<br />
Allocation - Telecommunications 6,075 6,395 6,395 6,267<br />
Allocation - Stormwater Utility Fund 18,407 19,376 19,376 18,988<br />
Allocation - Wastewater - GIS Upgrade 22,472 22,472<br />
Allocation - Electric - GIS Upgrade 292,135 292,135<br />
Allocation - Water Utilities Fund - GIS Upgrade 60,313 60,313<br />
673,965 1,084,357 1,084,357 695,249<br />
E – 108
INFORMATION TECHNOLOGY<br />
Experience Budget Projected Proposed<br />
For Year For Year For Year For Year<br />
2008 2009 2009 <strong>2010</strong><br />
Public Safety<br />
Allocation - General Fund 932,056 718,479 718,479 875,687<br />
Allocation - Purchasing & Stores 22,771 22,771 22,771<br />
Transfer from Public Improvement Fund - LPD Laptops and Servers 36,854<br />
968,910 741,250 741,250 898,458<br />
Other Miscellaneous Revenue<br />
Refund <strong>of</strong> Prior Year Expenses 1,430 2,400<br />
Miscellaneous Reimbursements 4,455<br />
Reimbursements / Loss Recovery 322,549 287,406 5,624<br />
328,434 287,406 8,024<br />
Investment Income<br />
Interest on Pooled Investments-Reserve 215,734 83,852 250,000 100,000<br />
Interest on Pooled Investments-Operations 50,000<br />
Market Value Restatement (56,140)<br />
159,593 83,852 250,000 150,000<br />
Transfers from Other Fund<br />
Transfer from Public Improvement Fund - Radio System Upgrade174,104 174,104 174,104<br />
Transfer from Other Funds Radio System Expansion 476,375 476,375 476,375 476,375<br />
Transer from Other Funds - VOIP 230,449<br />
Transfer from Internal Loan Fund - Voice Over IP Project 1,425,000 1,449,037<br />
Transfer from Wastewater R&R 50,400<br />
Transfer from Solid Waste Management - Routesmart S<strong>of</strong>tware Application 8,500 8,500<br />
Transfer from Uninsured Loss Fund 1,449<br />
702,328 2,083,979 2,108,016 706,824<br />
SUB-TOTAL 11,436,809 13,280,543 13,338,270 12,486,035<br />
PRIOR YEAR SURPLUS-PC Reserve (238,474) (354,798) (645,971) (49,662)<br />
PRIOR YEAR SURPLUS-Operations 800,776 2,015,035 1,475,809 56,977<br />
TOTAL REVENUES 11,999,112 14,940,780 14,168,108 12,493,350<br />
E – 109
INFORMATION TECHNOLOGY<br />
Experience Budget Projected Proposed<br />
For Year For Year For Year For Year<br />
2008 2009 2009 <strong>2010</strong><br />
EXPENSES<br />
Personal Services<br />
ADMINISTRATION<br />
Personal Services 1,101,248 405,866 507,527 483,708<br />
Insurance<br />
Insurance - Fire 8,048 8,160 8,415 9,408<br />
Insurance - Position Bond 444 444 444<br />
Insurance - Data Processing 36,244 44,326 34,762 46,542<br />
Self-Insurance Services 41,530 42,040 42,040 52,627<br />
85,822 94,970 85,661 109,021<br />
Inter-<strong>City</strong> Services<br />
Purchasing & Stores Service 31,410 33,063 33,063 32,402<br />
General Fund Services 230,369 255,343 255,343 225,613<br />
Intra-dept Charges - PC & Network Support 25,947 20,856 12,838 10,295<br />
<strong>Lakeland</strong> Electric Charges 249,253 249,253 249,253 238,551<br />
Intra-Departmental Charges - Telephone 4,569 4,537 4,537 3,722<br />
Intra-Departmental Charges - IT Operations 156,409 164,641 164,641 92,721<br />
Intra-Departmental Charges/Training Ctr 3,794 3,786 3,786 3,862<br />
701,751 731,479 723,461 607,166<br />
All Other O&M<br />
Contractual Services<br />
Insurance Consultant 1,219 2,347 2,347 3,551<br />
Advertising 884<br />
Annual Audit 2,532 2,371 2,371 2,442<br />
Office Supplies 4,864 8,500 7,500 6,000<br />
Equipment - Noncapital 400 1,000 380<br />
Repair Of Equipment 921 1,530 1,530 1,530<br />
Postage & Mailing 241 75 75 75<br />
Subscription & Membership 1,393 175 175 175<br />
Telephone, Communications 2,471 1,380 1,172 1,290<br />
Travel 1,233 1,530 1,200 400<br />
Training 3,832 6,000 5,000 1,250<br />
All Other Sundry Charges 168<br />
19,990 25,076 21,750 16,713<br />
SUB-TOTAL 1,908,811 1,257,391 1,338,399 1,216,607<br />
E – 110
INFORMATION TECHNOLOGY<br />
Experience Budget Projected Proposed<br />
For Year For Year For Year For Year<br />
2008 2009 2009 <strong>2010</strong><br />
RADIO COMMUNICATIONS<br />
Personal Services 180,963 191,521 189,395 198,256<br />
Utilities<br />
Electric Utility Service 28,849 28,493 28,493 27,995<br />
Inter-<strong>City</strong> Services<br />
Rental-Fleet Mgmt Equipment 1,138 1,169 1,169 1,138<br />
Gasoline-Fleet Mgmt Equipment 2,298 1,221 1,496 576<br />
Maintenance-Fleet Mgmt Equipment 3,486 1,530 3,500 1,500<br />
Intra-dept Charges - PC & Network Support 5,152 4,907 5,227 5,066<br />
Intra-Departmental Charges - Telephone 1,623 1,868 1,868 2,127<br />
Intra-Departmental Charges - Facilities 7,673 7,316 7,316 7,198<br />
Intra-Departmental Charges - Janitorial 2,634 2,842 2,842 2,921<br />
24,005 20,853 23,418 20,526<br />
All Other O&M<br />
Contractual Services 928 2,550 2,550 2,550<br />
Office Supplies 341<br />
Equipment - Noncapital 4,976 765 765 750<br />
All Other Materials & Supplies 100 100<br />
Uniforms 240 256 256 256<br />
Tools & Implements 161 204 204 200<br />
Parts For Equipment 50,562 45,400 45,400 45,000<br />
Materials 775 900 900 900<br />
Repair Of Equipment 127,995 152,862 152,862 157,398<br />
Postage & Mailing 325 325 325<br />
Subscription & Membership 622 867 866 866<br />
Telephone, Communications 1,135 522 522 492<br />
Travel 1,545 1,545<br />
Training 3,935 3,276 3,276<br />
191,329 209,913 209,571 208,737<br />
Capital Equipment<br />
Equipment - Capital 12,891<br />
SUB-TOTAL 438,037 450,780 450,877 455,514<br />
E – 111
INFORMATION TECHNOLOGY<br />
Experience Budget Projected Proposed<br />
For Year For Year For Year For Year<br />
2008 2009 2009 <strong>2010</strong><br />
TELECOMMUNICATIONS<br />
Personal Services 958,452 1,027,354 992,693 1,168,016<br />
Utilities<br />
Water Utility Service 226 179 278 291<br />
Stormwater Utility Fees 1,101 952 2,200 1,999<br />
Electric Utility Service 6,670 5,065 7,677 7,594<br />
Interdepartmental Solid Waste Service 217 166 277 267<br />
8,214 6,362 10,432 10,151<br />
Inter-<strong>City</strong> Services<br />
Rental-Fleet Mgmt Equipment 16,979 18,569 18,569 26,279<br />
Gasoline-Fleet Mgmt Equipment 12,842 17,783 8,140 13,411<br />
Maintenance-Fleet Mgmt Equipment 7,355 33,118 12,000 26,686<br />
Intra-dept Charges - PC & Network Support 30,209 31,433 29,321 28,506<br />
Intra-Departmental Charges - Telephone 12,495 16,853 16,853 11,964<br />
Intra-Departmental Charges - Radios 2,572 2,560 2,560 2,571<br />
Intra-Departmental Charges - Janitorial 4,541 8,401 8,401 8,634<br />
Intra-Departmental Charges - IT Operations 109,366 115,120 115,120 61,405<br />
196,359 243,837 210,964 179,456<br />
All Other O&M<br />
Contractual Services 78 1,815 1,815 290,000<br />
Office Supplies 1,048 530 700<br />
Equipment - Noncapital 2,676 2,000 1,600 1,632<br />
All Other Materials & Supplies 3,391 7,500 6,500 7,000<br />
Uniforms 1,377 1,535 1,535 500<br />
Tools & Implements 271 1,224 400 1,224<br />
Parts For Equipment 413 1,020 250 800<br />
Materials 2,254 1,500 1,500 1,500<br />
Repair Of Equipment 6,461 2,500 1,200 2,500<br />
Postage & Mailing 250 100 250<br />
Subscription & Membership 2,943 2,947 2,947 300<br />
Telephone, Communications 4,103 3,546 3,546 3,256<br />
Travel 50 965 965<br />
Training 6,003 10,000 9,899<br />
All Other Sundry Charges 204<br />
31,069 37,536 32,957 308,962<br />
Capital Equipment<br />
Equipment - Capital 1,800 1,600<br />
SUB-TOTAL 1,194,095 1,316,889 1,248,646 1,666,585<br />
E – 112
INFORMATION TECHNOLOGY<br />
Experience Budget Projected Proposed<br />
For Year For Year For Year For Year<br />
2008 2009 2009 <strong>2010</strong><br />
APPLICATION DEVELOPMENT<br />
Personal Services 1,870,156 2,459,264 2,188,592 2,511,957<br />
Inter-<strong>City</strong> Services<br />
Intra-dept Charges - PC & Network Support 76,510 69,198 80,869 59,715<br />
Intra-Departmental Charges - Telephone 5,613 6,543 5,725 7,444<br />
82,123 75,741 86,594 67,159<br />
All Other O&M<br />
Contractual Services 53,091 64,509 64,509<br />
Office Supplies 783<br />
Equipment - Noncapital 832 1,025 1,025<br />
Parts For Equipment 11<br />
Computer S<strong>of</strong>tware 1,300 1,050 1,050<br />
Repair Of Equipment 273 510 510<br />
Printing & Photography 75 75<br />
Postage & Mailing 25 25<br />
Subscription & Membership 838 900 900 500<br />
Telephone, Communications 4,952 5,880 5,880 5,700<br />
Travel 12 3,570 3,570 2,000<br />
Training 14,832 25,003 21,845 10,000<br />
All Other Sundry Charges 398<br />
S<strong>of</strong>tware License & Maintenance 812,170 891,675 891,675 1,033,169<br />
889,094 994,620 991,064 1,051,369<br />
SUB-TOTAL 2,841,373 3,529,625 3,266,250 3,630,485<br />
E – 113
INFORMATION TECHNOLOGY<br />
Experience Budget Projected Proposed<br />
For Year For Year For Year For Year<br />
2008 2009 2009 <strong>2010</strong><br />
NETWORK SUPPORT<br />
Personal Services 623,791 647,077 623,181 740,853<br />
Utilities<br />
Water Utility Service 333 351 348 361<br />
Electric Utility Service 17,036 17,178 16,259 17,040<br />
Wastewater Services 417 452 441 469<br />
Interdepartmental Solid Waste Service 783 790 781 1,027<br />
18,568 18,771 17,829 18,897<br />
Inter-<strong>City</strong> Services<br />
Rental-Fleet Mgmt Equipment 2,059 2,288 2,288 2,059<br />
Gasoline-Fleet Mgmt Equipment 846 2,210 403 911<br />
Maintenance-Fleet Mgmt Equipment 914 852 750 800<br />
Intra-dept Charges - PC & Network Support 44,366 51,158 44,948 25,117<br />
Intra-Departmental Charges - Telephone 9,152 9,543 9,543 10,901<br />
Intra-Departmental Charges - Facilities 7,981 7,609 7,609 12,945<br />
Intra-Departmental Charges - Janitorial 5,607 7,604 7,604 10,753<br />
70,925 81,264 73,145 63,486<br />
All Other O&M<br />
Contractual Services 252,367 234,758 234,758 237,026<br />
Office Supplies 1,066<br />
Equipment - Noncapital 10,376 51,000 48,000 51,000<br />
All Other Materials & Supplies 540 3,060<br />
Uniforms 922 1,020 1,020 500<br />
Parts For Equipment 53,183 8,241 12,000 8,000<br />
Materials - Default Purchasing Card (1,350) 2,681<br />
Computer S<strong>of</strong>tware 551 5,000 2,500<br />
Repair Of Equipment 1,512 70,193 70,193 62,570<br />
Postage & Mailing 100 100<br />
Subscription & Membership 100 149<br />
Telephone, Communications 5,868 6,129 5,500 5,500<br />
Travel 51 702 702<br />
Training 9,570 12,155 12,155<br />
All Other Sundry Charges 120<br />
S<strong>of</strong>tware License & Maintenance 332,723 161,183 161,183 154,018<br />
667,380 553,761 550,941 518,614<br />
Capital Equipment<br />
Equipment - Capital 266,263 153,903 153,903 99,639<br />
SUB-TOTAL 1,646,928 1,454,776 1,418,999 1,441,489<br />
E – 114
INFORMATION TECHNOLOGY<br />
Experience Budget Projected Proposed<br />
For Year For Year For Year For Year<br />
2008 2009 2009 <strong>2010</strong><br />
PC SUPPORT<br />
Personal Services 529,531 630,935 596,297 663,724<br />
Inter-<strong>City</strong> Services<br />
Rental-Fleet Mgmt Equipment 2,199 1,897 1,897 2,199<br />
Gasoline-Fleet Mgmt Equipment 1,369 2,057 862 844<br />
Maintenance-Fleet Mgmt Equipment 5,226 789 2,589 800<br />
Intra-dept Charges - PC & Network Support 31,345 28,846 31,839 23,430<br />
Intra-Departmental Charges - Telephone 4,371 5,214 5,214 4,520<br />
44,510 38,803 42,401 31,793<br />
All Other O&M<br />
Contractual Services 2,195 3,100<br />
Office Supplies 4,340 1,020 1,054 1,000<br />
Equipment - Noncapital 37,202 8,000 16,000 4,000<br />
All Other Materials & Supplies 2,734 3,000 3,000 1,500<br />
Uniforms 1,120 1,272 1,272 636<br />
Parts For Equipment 7,406 25,000 25,000 18,000<br />
Computer S<strong>of</strong>tware 140 13,000 13,000<br />
Repair Of Equipment 19,387 23,330 23,330 26,000<br />
Postage & Mailing 100 100 100<br />
Subscription & Membership 279 250 250 150<br />
Telephone, Communications 6,021 4,503 4,503 4,368<br />
Travel 24 877 877<br />
Training 2,835 13,793 6,904<br />
All Other Sundry Charges 88 135<br />
S<strong>of</strong>tware License & Maintenance 330,218 346,729 343,730 344,739<br />
413,989 441,009 442,120 400,493<br />
Allocations<br />
Recoveries-Other Funds (20,844) (1,000)<br />
SUB-TOTAL 967,187 1,110,747 1,079,818 1,096,010<br />
E – 115
INFORMATION TECHNOLOGY<br />
Experience Budget Projected Proposed<br />
For Year For Year For Year For Year<br />
2008 2009 2009 <strong>2010</strong><br />
GIS<br />
Personal Services 288,282 344,171 314,389 263,976<br />
Inter-<strong>City</strong> Services<br />
Rental-Fleet Mgmt Equipment 1,565 1,758 1,758 1,565<br />
Gasoline-Fleet Mgmt Equipment 924 1,680 700 869<br />
Maintenance-Fleet Mgmt Equipment 22 813 800 800<br />
Intra-dept Charges - PC & Network Support 16,723 16,874 15,236 11,606<br />
Intra-Departmental Charges - Telephone 1,699 1,913 1,913 1,595<br />
20,933 23,038 20,407 16,435<br />
All Other O&M<br />
Contractual Services 50,000<br />
Office Supplies 766<br />
Equipment - Noncapital 2,013 2,000 1,000<br />
All Other Materials & Supplies 176 1,000 100 500<br />
Uniforms 370 640 640 300<br />
Parts For Equipment 441 2,000 1,000<br />
Computer S<strong>of</strong>tware 2,000 1,000<br />
Repair Of Equipment 431 2,000 300 1,000<br />
Postage & Mailing 25 25<br />
Subscription & Membership 18 300 300<br />
Telephone, Communications 269 321 300 246<br />
Travel 430 300<br />
Training 5,420 8,000 3,800 3,000<br />
All Other Sundry Charges 75<br />
S<strong>of</strong>tware License & Maintenance 142,188 182,212 182,564 115,761<br />
Capital Equipment<br />
Equipment - Capital<br />
152,091 201,003 188,029 174,107<br />
SUB-TOTAL 461,307 568,212 522,825 454,518<br />
E – 116
INFORMATION TECHNOLOGY<br />
Experience Budget Projected Proposed<br />
For Year For Year For Year For Year<br />
2008 2009 2009 <strong>2010</strong><br />
PUBLIC SAFETY<br />
Personal Services 393,968 368,607 420,873 377,143<br />
Inter-<strong>City</strong> Services<br />
Intra-dept Charges - PC & Network Support 7,709 11,179 5,790 6,220<br />
Intra-Departmental Charges - Telephone 1,500 1,467 1,467 1,063<br />
9,209 12,646 7,257 7,283<br />
All Other O&M<br />
Contractual Services 72,682 141,318 18,000 25,480<br />
Office Supplies 220 351 1,200 350<br />
Equipment - Noncapital 430<br />
Parts For Equipment 7,333 15,000 12,000 15,000<br />
Repair Of Equipment 3,065 19,000 19,000 19,000<br />
Subscription & Membership 753 753 753<br />
Telephone, Communications 126,219 119,340 119,430 169,062<br />
Travel 1,100 1,326 1,326<br />
Training 4,627 8,191 7,456<br />
S<strong>of</strong>tware License & Maintenance 82,688 98,647 98,647 197,061<br />
298,364 403,926 277,812 426,706<br />
SUB-TOTAL 701,541 785,179 705,942 811,132<br />
E – 117
INFORMATION TECHNOLOGY<br />
Experience Budget Projected Proposed<br />
For Year For Year For Year For Year<br />
2008 2009 2009 <strong>2010</strong><br />
Projects<br />
Security Management 177,427 0<br />
Vulnerability Assessment 30,000 30,000 0<br />
IT Architectural Study 35,000 0<br />
Major PeopleS<strong>of</strong>t Upgrade 131,956<br />
Standard (Type II) Radio Replacement 100,000 0<br />
Radio Tower Microwave Replacement Link 281,782 0<br />
Radio System Upgrade 184,287 174,104 174,104<br />
Radio System Expansion - Public Safety 476,375 476,375 476,375 476,375<br />
Telephone Switch Maintenance 175,247 406,216 406,216 0<br />
Maximo Upgrade <strong>City</strong> Wide 2,574 7,705 7,705 0<br />
Outside Vendor Recoveries (347) 0<br />
LEE8255 West Substation Rebuild (Fire) 110 0<br />
Lease - Telecom/Code Enforcement 38,400 46,800 52,800<br />
Voice Over IP Project 288,050 1,426,214 1,449,037 0<br />
LDS8255 Glendale Substation Restoration (Fire) 2,192 0<br />
Voice Over IP Project - Debt Service 42,023 251,733<br />
Maximo Upgrade <strong>City</strong> Wide (287,879) 538,101 538,101 0<br />
Business Continuity Roadmap 110,000 0<br />
UPS Replacement 100,000 100,000 0<br />
Routesmart S<strong>of</strong>tware Application 70,390 61,310 61,310 0<br />
RPI Event 4,395 3,550 0<br />
Firewall Replacement 60,000 60,000 0<br />
Security Management 159,213 159,213 167,109<br />
HVAC system replacement - <strong>City</strong> Hall Data Center 305,250 305,250 0<br />
PC Replacements 351,651 335,025 210,000 629,825<br />
Aerial Photography 66,668 66,668 0<br />
LPD Laptops and Servers 36,854 0<br />
LPD - CAD Reporting System 111,000 0<br />
1,836,509 4,467,181 4,136,352 1,709,798<br />
All Other<br />
U&CF-Tree Inventory - Northside 1,077<br />
U&CF-Tree Inventory - Southside 1,077<br />
2,154<br />
Transfers To Other Funds<br />
PIF - Heritage Town Center - Training Center 11,212<br />
Transfer To <strong>Lakeland</strong> Center 1,172<br />
1,172 11,212<br />
GRAND TOTAL 11,999,112 14,940,780 14,168,108 12,493,350<br />
E – 118
REVENUE AND EXPENDITURE SUMMARY<br />
WASTEWATER UTILITY<br />
Experience Budget Experience 2009-10<br />
For Year For Year 2008-09 Proposed by<br />
EXPENSES 2007-08 2008-09 Estimated <strong>City</strong> Manager<br />
Personnel<br />
Salaries and Wages 3,568,865 3,661,613 3,402,620 3,741,129<br />
Fringe Benefits 1,101,138 1,019,620 831,215 1,136,684<br />
Total Personnel 4,670,002 4,681,233 4,233,835 4,877,813<br />
Non-Personnel<br />
Internal Service Charges 2,399,437 2,720,728 2,552,209 2,846,673<br />
Pr<strong>of</strong>essional and Contractual 1,667,813 1,872,576 1,414,321 1,718,442<br />
Utilities 1,845,523 2,633,009 1,870,571 2,591,756<br />
Insurance and Fixed Charges 324,426 253,113 251,127 264,031<br />
All Other Operations and Maintenance 1,735,551 2,528,193 2,459,217 2,586,916<br />
Capital Outlay 15,982,459 48,983,901 48,983,901 4,239,249<br />
Debt Service 2,652,611 3,181,582 3,181,582 5,157,204<br />
Total Non-Personnel 26,607,821 62,173,102 60,712,928 19,404,271<br />
Total Expenditures 31,277,823 66,854,335 64,946,763 24,282,084<br />
Transfers<br />
Transfers In<br />
Transfers Out (1,965,102) (2,100,000) (2,100,000) (2,261,082)<br />
Net Transfers (1,965,102) (2,100,000) (2,100,000) (2,261,082)<br />
Revenue Sources<br />
Taxes<br />
Licenses and Permits<br />
Intergovernmental<br />
Charges for Services 21,312,828 23,063,342 22,479,170 23,999,480<br />
Interest Income 877,126 224,516 440,181 414,000<br />
All Other Revenue 6,400,673 38,230,450 38,246,286 29,282<br />
Total Revenue 28,590,627 61,518,308 61,165,637 24,442,762<br />
Funding to be Provided 4,652,298 7,436,027 5,881,126 2,100,404<br />
E – 119
REVENUES<br />
WASTEWATER UTILITY<br />
Experience Budget Projected Proposed<br />
For Year For Year For Year For Year<br />
2008 2009 2009 <strong>2010</strong><br />
Other Miscellaneous Revenue<br />
All Other Misc Revenue 1,500 1,500<br />
Refund <strong>of</strong> Prior Year Expenses 3,796<br />
Penalties on Assessments 18<br />
Proceeds from Earthen Sales / Wetland Improvements 19,814 11,318<br />
23,610 1,500 11,336 1,500<br />
Charges for Services<br />
Sewer Utility Revenues:<br />
Wastewater Service Charges 16,675,817 18,133,000 17,595,128 19,104,000<br />
Pretreatment Surcharge 2,203,741 2,643,000 2,620,867 3,044,000<br />
Connection Fees 46,656 46,000 27,466 46,000<br />
Wastewater Re-use water charges 279,907 250,067 251,297 250,000<br />
<strong>City</strong> Services:<br />
General Fund -WW Service 191,648 191,082 205,997 221,000<br />
Fleet Mgmt-WW Service 2,190 2,268 2,339 3,000<br />
Purchasing-WW Service 812 845 781 1,000<br />
<strong>Lakeland</strong> Center-WW Service 33,447 32,874 31,061 33,000<br />
Airport-WW Service 3,707 3,876 4,001 4,000<br />
Parking System-WW Service 4,418 4,806 4,873 5,000<br />
Electric Utilities-WW Service 56,465 59,581 42,632 46,000<br />
Solid Waste - WW Service 5,179 5,370 5,560 6,000<br />
<strong>Lakeland</strong> Airside Center - WW Service 24,342 27,702 26,414 28,000<br />
Cleveland Heights Golf Course - WW Service 7,414 8,559 5,860 6,000<br />
Water Utilities - WW Service 938 1,008 1,008 1,000<br />
Facilities & Construction Management - WW Service 506 568 632 1,000<br />
Information Technology - WW Service 417 446 480<br />
Stormwater Utility - WW Service 24 26<br />
Self Insurance Fund - WW Service 47 47<br />
19,537,675 21,410,606 20,826,434 22,799,480<br />
Fines and Forfiets<br />
Bad Check Charges 7,041 6,000 6,000<br />
Investment Income<br />
Interest on Pooled Investments 182,347 100,623 316,373 200,000<br />
Market Value Restatement (56,398)<br />
WW 2002 Bond Sinking Interest 6,276 5,893 4,050 4,000<br />
WW 2002 Bond Sinking Principal 35,698 13,000 9,964 10,000<br />
WW 2006 SRL Sinking Interest 2,663 2,672<br />
WW 2006 SRL Sinking Principal 3,327 2,122<br />
173,913 119,516 335,181 214,000<br />
Transfers from Other Fund<br />
2002 Debt Service Sinking Interest from<br />
Wastewater Impact Fees 526,368 526,368 526,368 526,368<br />
2002 Debt Service Sinking Principal from<br />
Wastewater Impact Fees 526,368 526,368 526,368 526,368<br />
1,052,736 1,052,736 1,052,736 1,052,736<br />
SUB-TOTAL 20,794,974 22,584,358 22,231,687 24,073,716<br />
PRIOR YEAR SURPLUS (1,289,381) (74,684) (1,629,585) 894,119<br />
TOTAL REVENUES 19,505,593 22,509,674 20,602,102 24,967,835<br />
E – 120
EXPENSE<br />
WASTEWATER UTILITY<br />
Experience Budget Projected Proposed<br />
For Year For Year For Year For Year<br />
2008 2009 2009 <strong>2010</strong><br />
Collection Administration<br />
Personal Services 376,892 427,055 377,531 436,785<br />
Inter-<strong>City</strong> Services<br />
Rental-Fleet Mgmt Equipment 6,203 5,452 6,794 6,207<br />
Gasoline-Fleet Mgmt Equipment 2,821 6,606 1,200 1,122<br />
Maintenance-Fleet Mgmt Equipment 569 3,904 201 7,025<br />
Intra-dept Charges - PC & Network Support 16,927 15,549 17,249 15,726<br />
Intra-Departmental Charges - Telephone 1,088 1,326 1,326 1,329<br />
Intra-Departmental Charges - Radios 2,251 2,560 2,560 2,736<br />
29,860 35,397 29,330 34,145<br />
All Other O&M<br />
Contractual Services 14,520 14,000 14,000 14,000<br />
Office Supplies 1,066 1,850 1,850 1,850<br />
Uniforms 359 530 300 300<br />
Materials 269 300 300 300<br />
Repair Of Equipment 2,079 3,100 3,100 3,100<br />
Postage & Mailing 1,450 1,000 1,300 1,600<br />
Subscription & Membership 240 465 300 300<br />
Telephone, Communications 1,416 1,300 1,300 1,400<br />
Travel 1,125 500 500<br />
Training 140 850 350 350<br />
All Other Sundry Charges 400 200 200<br />
21,539 24,920 23,500 23,900<br />
SUB-TOTAL 428,291 487,372 430,361 494,830<br />
System Administration<br />
Personal Services 482,422 267,683 239,623 276,927<br />
Insurance<br />
Uninsured Loss Reimbursement 37,521<br />
Insurance - Position Bond 351 351 351<br />
Self-Insurance Services 198,233 158,083 158,083 150,779<br />
235,754 158,434 158,434 151,130<br />
Utilities<br />
Stormwater Utility Fees 3,035<br />
E – 121
WASTEWATER UTILITY<br />
Experience Budget Projected Proposed<br />
For Year For Year For Year For Year<br />
2008 2009 2009 <strong>2010</strong><br />
Inter-<strong>City</strong> Services<br />
Purchasing & Stores Service 47,108 49,587 49,587 49,587<br />
General Fund Services 605,484 707,466 707,466 735,065<br />
Rental-Fleet Mgmt Equipment 1,657 1,831 1,831 1,657<br />
Gasoline-Fleet Mgmt Equipment 481 2,070 228 314<br />
Maintenance-Fleet Mgmt Equipment 202 1,630 400 1,180<br />
Utility Billing Service 385,056 286,711 286,716 280,977<br />
Intra-dept Charges - PC & Network Support 3,466 3,807 3,156 3,115<br />
Intra-Departmental Charges - Telephone 2,061 2,380 2,045 2,659<br />
Intra-Departmental Charges - Radios 322 320 322 541<br />
Intra-Departmental Charges - IT Operations 118,499 124,736 124,736 267,549<br />
Allocation Shared Cost - Water Util 186,602 281,254 219,010 316,291<br />
Intra-Departmental Charges/Training Ctr 4,336 4,326 4,326 4,326<br />
1,355,274 1,466,118 1,399,823 1,663,261<br />
All Other O&M<br />
Contractual Services<br />
Banking Service 2,651 2,667 2,667 2,667<br />
Insurance Consultant 4,506 6,178 6,178 5,038<br />
Advertising 100 100 100<br />
Annual Audit 12,928 12,900 12,900 12,900<br />
Paying Agent,Trustee Fees 475<br />
Office Supplies 345 1,600 1,500 1,500<br />
All Other Materials & Supplies (15,354) 50 50 50<br />
Materials 36 50 50 50<br />
Materials - Default Purchasing Card (0)<br />
Increase/Decrease In Inventory 53,719<br />
Rentals 1,162 2,800 2,800 2,800<br />
Repair Of Equipment 3,920 3,230 3,000 3,000<br />
Printing & Photography 150 100 100<br />
Postage & Mailing 158 400 400 400<br />
Subscription & Membership 120 710 600 600<br />
Telephone, Communications 249 200 300 300<br />
Travel 76 1,000 500 500<br />
Training 430 500 400 400<br />
All Other Sundry Charges 570 300 300<br />
Licenses & Permits 8,000 8,900 8,900 8,900<br />
Bad Debt Expense 66,040 84,000 84,000 84,000<br />
Easement & Rights-Of-Way 275<br />
139,735 126,005 124,745 123,605<br />
SUB-TOTAL 2,216,221 2,018,240 1,922,625 2,214,923<br />
E – 122
WASTEWATER UTILITY<br />
Experience Budget Projected Proposed<br />
For Year For Year For Year For Year<br />
2008 2009 2009 <strong>2010</strong><br />
Glendale Sewage Treatment Plant<br />
Personal Services 1,186,947 876,763 867,997 907,888<br />
Insurance<br />
Insurance - Fire 88,672 94,679 92,693 112,901<br />
Utilities<br />
Water Utility Service 8,172 8,409 9,419 9,895<br />
Stormwater Utility Fees 3,960 4,047 4,047<br />
Electric Utility Service 697,631 778,757 744,757 780,000<br />
Interdepartmental Solid Waste Service 19,512 24,567 16,340 16,044<br />
725,314 815,693 774,563 809,986<br />
Inter-<strong>City</strong> Services<br />
Rental-Fleet Mgmt Equipment 25,004 10,522 8,147 7,585<br />
Gasoline-Fleet Mgmt Equipment 19,705 24,214 4,043 6,400<br />
Maintenance-Fleet Mgmt Equipment 22,361 6,298 12,298 11,216<br />
Intra-dept Charges - PC & Network Support 11,181 10,134 10,008 9,886<br />
Intra-Departmental Charges - Telephone 1,088 1,326 1,088 1,329<br />
Intra-Departmental Charges - Radios 3,537 3,840 1,608 1,088<br />
Intra-Departmental Charges - Facilities 32,852 30,438 30,438 29,945<br />
Intra-Departmental Charges - Janitorial 26,726 28,625 28,625 30,009<br />
142,454 115,397 96,255 97,458<br />
All Other O&M<br />
Contractual Services 99,985 90,250 90,250 90,500<br />
Sludge Disposal 1,107,568 852,500 852,500 852,500<br />
Office Supplies 4,953 4,900 4,000 4,000<br />
All Other Materials & Supplies 4,977 2,500 3,000 3,000<br />
Uniforms 2,760 2,300 2,900 2,900<br />
Cleaning & Janitor Supply 426 800 100 100<br />
Construction Material 930 600 100 100<br />
Chemicals 525,756 5,000 3,000 3,000<br />
Tools & Implements 3,167 4,000 2,000 2,000<br />
Laboratory Supplies 10,199 13,000 15,000 15,000<br />
Auto/Heavy Equipment Fuel 55,002 41,000 55,000 45,000<br />
Materials 24,434 5,400 7,000 5,400<br />
Chemicals - Effluent Disinfection 106,187 106,100 106,100<br />
Chemicals - Odor \ Corrosion Control 133,520 133,520 133,520<br />
Chemicals - Sludge Thickening 53,130 53,130 53,130<br />
Chemicals - Sludge Bacterial Control 15,400 15,400 15,400<br />
Chemicals - Methane Treatment 42,500 42,500 42,500<br />
Chemicals - Upset Stabilization 27,900 27,900 27,900<br />
Rentals 4,092 2,700 2,000 2,000<br />
Maintenance Of Facilities 161 750 750 250<br />
Repair Of Equipment 134,250 31,800 31,800 31,800<br />
Subscription & Membership 408 1,200 1,400 1,200<br />
Telephone, Communications 1,379 966 1,000 1,000<br />
Travel 470 300 300 300<br />
Training 17,185 12,000 16,000 12,000<br />
All Other Sundry Charges 43 200 200 200<br />
Solid Waste Disposal Charges 21,000 21,000 21,000<br />
1,998,143 1,471,803 1,487,850 1,471,800<br />
SUB-TOTAL 4,141,531 3,374,335 3,319,358 3,400,033<br />
E – 123
WASTEWATER UTILITY<br />
Experience Budget Projected Proposed<br />
For Year For Year For Year For Year<br />
2008 2009 2009 <strong>2010</strong><br />
Northside Sewage Treatment Plant<br />
Personal Services 828,803 867,794 822,778 903,997<br />
Utilities<br />
Water Utility Service 6,088 7,128 5,877 6,159<br />
Stormwater Utility Fees 924 1,200 1,233 1,233<br />
Electric Utility Service 567,193 611,596 553,644 590,547<br />
Interdepartmental Solid Waste Service 5,559 5,974 4,852 4,887<br />
579,764 625,898 565,606 602,826<br />
Inter-<strong>City</strong> Services<br />
Rental-Fleet Mgmt Equipment 5,678 6,413 6,413 5,678<br />
Gasoline-Fleet Mgmt Equipment 3,745 6,694 2,684 3,840<br />
Maintenance-Fleet Mgmt Equipment 4,682 5,225 5,920 7,727<br />
Intra-dept Charges - PC & Network Support 6,838 6,676 6,603 6,522<br />
Intra-Departmental Charges - Telephone 1,695 2,674 2,260 1,861<br />
Intra-Departmental Charges - Radios 965 960 965 1,314<br />
Intra-Departmental Charges - Facilities 4,885 5,542 5,542 5,452<br />
Intra-Departmental Charges - Janitorial 5,187 5,187 5,172<br />
28,488 39,371 35,574 37,566<br />
All Other O&M<br />
Contractual Services 24,505 32,000 36,000 28,500<br />
Sludge Disposal 152,458 157,300 157,300 157,300<br />
Office Supplies 1,053 3,750 3,000 3,000<br />
All Other Materials & Supplies 116 700 1,000 1,000<br />
Uniforms 758 1,700 1,700 1,700<br />
Cleaning & Janitor Supply 1,026 1,500 500 500<br />
Construction Material 39 300 100 100<br />
Chemicals 109,484 3,200 3,200 3,200<br />
Tools & Implements 116 1,000 900 900<br />
Laboratory Supplies 10,752 7,900 7,900 7,900<br />
Auto/Heavy Equipment Fuel 10,508 2,500 6,000 2,500<br />
Materials 7,911 3,200 3,000 3,000<br />
Chemicals - Effluent Disinfection 42,152 42,152 42,152<br />
Chemicals - Odor \ Corrosion Control 68,350 68,350 68,350<br />
Chemicals - Sludge Thickening 25,256 25,256 25,256<br />
Chemicals - Upset Stabilization 3,800 3,800 3,800<br />
Rentals 2,733 7,750 7,000 7,000<br />
Repair Of Equipment 71,821 9,300 9,300 9,300<br />
Subscription & Membership 620 900 900 900<br />
Telephone, Communications 213 200 250 250<br />
Travel 200 100 100<br />
Training 3,689 6,400 8,500 6,400<br />
All Other Sundry Charges 9 100 100 100<br />
397,809 379,458 386,308 373,208<br />
SUB-TOTAL 1,834,864 1,912,521 1,810,266 1,917,597<br />
E – 124
WASTEWATER UTILITY<br />
Experience Budget Projected Proposed<br />
For Year For Year For Year For Year<br />
2008 2009 2009 <strong>2010</strong><br />
Sewage Pumping Stations<br />
Personal Services 483,989 459,516 437,095 472,239<br />
Utilities<br />
Water Utility Service 10,212 10,697 12,512 12,762<br />
Electric Utility Service 507,501 572,138 497,106 507,048<br />
517,713 582,835 509,618 519,810<br />
Inter-<strong>City</strong> Services<br />
Rental-Fleet Mgmt Equipment 19,221 20,176 20,176 20,758<br />
Gasoline-Fleet Mgmt Equipment 33,427 21,338 16,670 22,400<br />
Maintenance-Fleet Mgmt Equipment 34,617 24,432 29,790 29,742<br />
Intra-dept Charges - PC & Network Support 14,110 15,549 15,640 7,429<br />
Intra-Departmental Charges - Telephone 222 330 330 266<br />
Intra-Departmental Charges - Radios 3,216 3,520 3,520 2,799<br />
104,813 85,345 86,126 83,394<br />
All Other O&M<br />
Contractual Services 13,857 65,000 5,000 5,000<br />
Contract Labor 24,967 39,023 21,000 3,076<br />
Office Supplies 815 1,200 1,200 1,200<br />
Equipment - Noncapital 1,500 1,000 1,000<br />
All Other Materials & Supplies 627 500 300 300<br />
Uniforms 3,091 2,000 2,500 2,500<br />
Cleaning & Janitor Supply 31 200 100 100<br />
Construction Material 27 500 200 200<br />
Chemicals 282,000 285,842 285,842 285,842<br />
Tools & Implements 2,970 5,800 3,000 3,000<br />
Auto/Heavy Equipment Fuel 14,071 14,000 1,500 14,000<br />
Materials 70,885 66,500 46,500 46,500<br />
Rentals 475 500 500 500<br />
Maintenance Of Facilities 500 500 500<br />
Repair Of Equipment 124,043 37,500 40,000 50,000<br />
Subscription & Membership 20 20 20<br />
Telephone, Communications 4,512 3,700 3,700 3,700<br />
Travel 200 200 200<br />
Training 550 5,000 3,000 3,000<br />
All Other Sundry Charges 39 500 500 500<br />
542,960 529,985 416,562 421,138<br />
SUB-TOTAL 1,649,475 1,657,681 1,449,401 1,496,581<br />
E – 125
WASTEWATER UTILITY<br />
Experience Budget Projected Proposed<br />
For Year For Year For Year For Year<br />
2008 2009 2009 <strong>2010</strong><br />
Sewer Line Maintenance<br />
Personal Services 696,842 825,948 676,207 840,101<br />
Inter-<strong>City</strong> Services<br />
Rental-Fleet Mgmt Equipment 69,199 107,454 87,859 108,721<br />
Gasoline-Fleet Mgmt Equipment 60,407 154,793 42,934 57,600<br />
Maintenance-Fleet Mgmt Equipment 111,485 74,275 121,087 67,997<br />
Intra-dept Charges - PC & Network Support 23,644 23,344 25,168 26,152<br />
Intra-Departmental Charges - Telephone 222 330 330 266<br />
Intra-Departmental Charges - Radios 6,109 6,400 6,400 6,572<br />
271,067 366,596 283,778 267,308<br />
All Other O&M<br />
Contractual Services 2,110 9,000 9,000 9,000<br />
Contract Labor 154 3,000 21,000 32,000<br />
Office Supplies 2,621 3,500 2,000 2,000<br />
Equipment - Noncapital 769 2,000 1,000 1,000<br />
All Other Materials & Supplies 490 500 300 300<br />
Uniforms 3,340 3,400 3,200 3,200<br />
Construction Material 853 9,000 9,000 9,000<br />
Chemicals 4,000 4,000 4,000<br />
Tools & Implements 2,735 5,000 4,000 4,000<br />
Auto/Heavy Equipment Fuel 3,084 1,500 1,500 1,500<br />
Materials 49,216 39,000 39,000 39,000<br />
Rentals 1,157 500 1,300 500<br />
Repair Of Equipment 4,793 6,000 6,000 6,000<br />
Subscription & Membership 200 200 200<br />
Telephone, Communications 5,776 3,500 4,000 4,000<br />
Travel 300 300 300<br />
Training 35 2,000 2,000 2,000<br />
All Other Sundry Charges 500 300<br />
77,132 92,900 107,800 118,300<br />
SUB-TOTAL 1,045,041 1,285,444 1,067,785 1,225,710<br />
E – 126
WASTEWATER UTILITY<br />
Experience Budget Projected Proposed<br />
For Year For Year For Year For Year<br />
2008 2009 2009 <strong>2010</strong><br />
Pretreatment Program<br />
Personal Services 109,205 163,209 80,968 159,909<br />
Inter-<strong>City</strong> Services<br />
Rental-Fleet Mgmt Equipment 4,156 4,921 2,037 4,565<br />
Gasoline-Fleet Mgmt Equipment 7,036 5,209 3,407 5,760<br />
Maintenance-Fleet Mgmt Equipment 2,491 4,382 2,500 6,432<br />
Intra-dept Charges - PC & Network Support 1,736 1,693 1,643 7,032<br />
Intra-Departmental Charges - Radios 965 960 965 1,247<br />
16,383 17,165 10,552 25,036<br />
All Other O&M<br />
Contractual Services 14,874 8,745 8,745 8,745<br />
Advertising 224 400 300 300<br />
Office Supplies 226 600 600 600<br />
All Other Materials & Supplies 100 100 100<br />
Uniforms 141 700 700 700<br />
Tools & Implements 645 700 700 700<br />
Laboratory Supplies 2,756 3,400 3,400 3,400<br />
Materials 890 1,800 1,800 1,800<br />
Rentals 100 100 100<br />
Repair Of Equipment 100 100 100<br />
Postage & Mailing 41 100 100 100<br />
Subscription & Membership 150 150 150<br />
Telephone, Communications 25 100 100 100<br />
Travel 325 300 300<br />
Training 65 1,250 1,400 1,400<br />
All Other Sundry Charges 50 50 50<br />
19,886 18,620 18,645 18,645<br />
SUB-TOTAL 145,474 198,994 110,165 203,590<br />
E – 127
WASTEWATER UTILITY<br />
Experience Budget Projected Proposed<br />
For Year For Year For Year For Year<br />
2008 2009 2009 <strong>2010</strong><br />
Engineering<br />
Inter-<strong>City</strong> Services<br />
Allocation Shared Cost - Water Util 373,899 451,540 451,540 461,991<br />
SUB-TOTAL 373,899 451,540 451,540 461,991<br />
Maintenance Support<br />
Personal Services 605 118,791 209,392 117,078<br />
Inter-<strong>City</strong> Services<br />
Rental-Fleet Mgmt Equipment 4,569 5,463 6,330<br />
Gasoline-Fleet Mgmt Equipment 5,893 4,711 10,772<br />
Maintenance-Fleet Mgmt Equipment 5,625 29,235 18,369<br />
Intra-dept Charges - PC & Network Support 6,438 6,401 15,686<br />
Intra-Departmental Charges - Telephone 256 266<br />
Intra-Departmental Charges - Radios 2,560 2,560 2,800<br />
25,341 48,370 54,223<br />
All Other O&M<br />
Office Supplies 900 700 700<br />
All Other Materials & Supplies 100 100 100<br />
Uniforms 2,000 2,000 2,000<br />
Tools & Implements 1,200 1,000 1,000<br />
Materials 2,000 4,000 2,400<br />
Repair Of Equipment 1,500 1,500 1,500<br />
Telephone, Communications 2,900 2,900 2,900<br />
Training 9,700 9,700 9,700<br />
All Other Sundry Charges 200 200 200<br />
20,500 22,100 20,500<br />
SUB-TOTAL 605 164,632 279,862 191,801<br />
E – 128
WASTEWATER UTILITY<br />
Experience Budget Projected Proposed<br />
For Year For Year For Year For Year<br />
2008 2009 2009 <strong>2010</strong><br />
Wetlands Management<br />
Personal Services 221,082 257,867 215,779 270,271<br />
Inter-<strong>City</strong> Services<br />
Rental-Fleet Mgmt Equipment 28,470 31,012 30,363 30,754<br />
Gasoline-Fleet Mgmt Equipment 8,758 31,412 3,543 19,200<br />
Maintenance-Fleet Mgmt Equipment 28,667 26,874 58,664 34,838<br />
Intra-dept Charges - PC & Network Support 3,311 3,284 3,120 3,079<br />
Intra-Departmental Charges - Telephone 222 256 222 266<br />
Intra-Departmental Charges - Radios 1,608 1,920 1,608 1,836<br />
71,037 94,758 97,520 89,973<br />
All Other O&M<br />
Contractual Services 16,861 20,416 20,416 20,416<br />
Office Supplies 753 1,500 1,000 750<br />
All Other Materials & Supplies 1,333 1,600 1,000 1,000<br />
Uniforms 1,141 1,500 1,500 1,500<br />
Construction Material 487 600 900 900<br />
Chemicals 3,779 3,800 3,800 3,800<br />
Tools & Implements 756 2,000 2,000 2,000<br />
Laboratory Supplies 1,182 2,700 2,900 2,900<br />
Auto/Heavy Equipment Fuel 3,424 1,500 1,500 1,500<br />
Materials 313 600 600 600<br />
Rentals 3,356 2,500 2,500 2,500<br />
Maintenance Of Facilities 630 1,750 1,500 2,000<br />
Repair Of Equipment 4,735 8,500 11,500 9,000<br />
Subscription & Membership 145 360 360 360<br />
Telephone, Communications 579 584 584 584<br />
Travel 100 100 100<br />
Training 169 2,750 2,000 2,000<br />
All Other Sundry Charges 5 100 100 100<br />
Electric Service - TECO 5,497 9,500 9,500 9,500<br />
45,146 62,360 63,760 61,510<br />
SUB-TOTAL 337,265 414,985 377,059 421,754<br />
E – 129
WASTEWATER UTILITY<br />
Experience Budget Projected Proposed<br />
For Year For Year For Year For Year<br />
2008 2009 2009 <strong>2010</strong><br />
Laboratory Analysis<br />
Personal Services 283,217 316,152 286,070 324,327<br />
Inter-<strong>City</strong> Services<br />
Intra-dept Charges - PC & Network Support 5,716 5,547 5,547 5,458<br />
Intra-Departmental Charges - Telephone 445 512 445 532<br />
6,161 6,059 5,992 5,990<br />
All Other O&M<br />
Contractual Services 1,531 1,400 1,400 1,400<br />
Office Supplies 300 1,200 1,000 1,000<br />
Uniforms 375 500 400 400<br />
Laboratory Supplies 30,617 25,100 25,100 25,100<br />
Materials 29 1,100 1,600 1,600<br />
Rentals 2,154 1,500 1,300 1,300<br />
Repair Of Equipment 7,049 19,600 19,600 19,600<br />
Subscription & Membership 2,985 2,795 2,795 2,795<br />
Telephone, Communications 49 50 50 50<br />
Training 35 100 100 100<br />
All Other Sundry Charges 28 100 100 100<br />
45,153 53,445 53,445 53,445<br />
SUB-TOTAL 334,530 375,656 345,507 383,762<br />
West <strong>Lakeland</strong> Roughing Plant<br />
Personal Services 100,455 20,395 159,990<br />
Utilities<br />
Water Utility Service 7,000 7,000<br />
Electric Utility Service 575,233 625,000<br />
Interdepartmental Solid Waste Service 6,000 6,000<br />
588,233 638,000<br />
Inter-<strong>City</strong> Services<br />
Rental-Fleet Mgmt Equipment 5,308 1,200 7,607<br />
Gasoline-Fleet Mgmt Equipment 1,647 412 2,432<br />
Maintenance-Fleet Mgmt Equipment 2,950 738 8,496<br />
Intra-dept Charges - PC & Network Support 1,516 2,400<br />
Intra-Departmental Charges - Telephone 260 266<br />
Intra-Departmental Charges - Radios 960 227<br />
Intra-Departmental Charges - Facilities 5,000 5,000 4,900<br />
17,641 7,349 26,328<br />
E – 130
WASTEWATER UTILITY<br />
Experience Budget Projected Proposed<br />
For Year For Year For Year For Year<br />
2008 2009 2009 <strong>2010</strong><br />
All Other O&M<br />
Sludge Disposal 320,000 320,000<br />
Office Supplies 1,200 1,200<br />
Equipment - Noncapital 3,500 3,500<br />
All Other Materials & Supplies 1,000 1,000<br />
Uniforms 600 600<br />
Tools & Implements 2,000 2,000<br />
Laboratory Supplies 1,200 1,200<br />
Auto/Heavy Equipment Fuel 2,500 2,500<br />
Materials 2,000 2,000<br />
Chemicals - Odor \ Corrosion Control 25,000 25,000<br />
Rentals 500 500<br />
Repair Of Equipment 2,000 2,000<br />
Telephone, Communications 250 250<br />
Training 2,500 400 2,500<br />
All Other Sundry Charges 500 500<br />
364,750 400 364,750<br />
SUB-TOTAL 1,071,079 28,144 1,189,068<br />
Projects<br />
Administration/Other:<br />
Contingency 78,800 78,800 100,000<br />
TMDL Developments 25,000<br />
Acqusition <strong>of</strong> Easements / Recording Fees 28 435<br />
Wastewater Management Study 40,000 40,000<br />
Safety Incentive Program 1,949 2,000 1,961 2,000<br />
Glendale:<br />
Operational Technical Assistance - Glendale 60,000 24,700 25,000<br />
NPDES Permit Renewal 31,254<br />
Maintenance General Support - Glendale 701 482,141 485,641 485,641<br />
Northside:<br />
NPDES Permit Renewal 21,935 4,865 4,865<br />
Maintenance General Support - Northside 61 211,451 211,451 211,451<br />
Pumping Stations:<br />
Master Pump Station Rebuilds 85,637 45,000 45,000 50,000<br />
Maintenance General Support - Pumping Stations 203 139,423 139,423 214,591<br />
E – 131
WASTEWATER UTILITY<br />
Experience Budget Projected Proposed<br />
For Year For Year For Year For Year<br />
2008 2009 2009 <strong>2010</strong><br />
Sewer Maintenance:<br />
System Maintenance & Repairs - Reimbursable 4,072 5,000 5,000 5,000<br />
Utility Relocation Engineering & Surveying 25 61,397 15,000 50,000<br />
Root Treatment Of Sewer System 28,001 30,000 30,000 30,000<br />
Manhole Adjustments 5,659 25,000 25,000 25,000<br />
Maintenance General Support - Sewer Maintenance 92 13,207 12,208 12,208<br />
Pretreatment:<br />
Reimbursable Sampling Analysis (80,469) 1,000 1,000 1,000<br />
Maintenance General Support - Pretreatment 6,664 3,332 6,664<br />
Wetlands:<br />
Wetlands Algae Solids Reduction 33,077 25,000 25,000 30,000<br />
Mowing Services - Reimbursable 1,923<br />
Proceeds from Earthen Sales / Wetland Improvements 19,814 19,814<br />
Maintenance General Support - Wetlands 288 6,364 3,200 6,364<br />
Wetlands Emergency Action Plan 50,000<br />
Summer College Intern 8,300<br />
Laboratory:<br />
Lab Analysis Reimbursement - Laboratory 289 1,685 1,000 1,000<br />
Westside:<br />
Maintenance General Support - Westside 17,812 16,812 16,812<br />
135,834 1,276,373 1,189,207 1,355,031<br />
Debt Service<br />
Internal Loan - Wetlands Mowing Facility 63,482 63,482 63,482 63,482<br />
2002 Wastewater Bond Interest 667,494 622,338 622,338 547,838<br />
2002 Wastewater Bond Principal 1,445,000 1,490,000 1,490,000 1,565,000<br />
2006 SRL Interest 314,362 1,005,762 1,005,762 2,980,884<br />
2006 SRL Principal 646,517<br />
Capitalized Interest Expense (484,243)<br />
2,652,611 3,181,582 3,181,582 5,157,204<br />
Transfers To Other Funds<br />
Transfer to IT - (VOIP) 3,960<br />
Transfer To General Fund 1,965,102 2,100,000 2,100,000 2,250,000<br />
Transfer To Wastewater R&R 2,244,851 2,539,240 2,539,240 2,600,000<br />
4,209,953 4,639,240 4,639,240 4,853,960<br />
GRAND TOTAL 19,505,593 22,509,674 20,602,102 24,967,835<br />
E – 132
REVENUE AND EXPENDITURE SUMMARY<br />
WATER UTILITY<br />
Experience Budget Experience 2009-10<br />
For Year For Year 2008-09 by<br />
EXPENSES 2007-08 2008-09 Estimated <strong>City</strong> Manager<br />
Personnel<br />
Salaries and Wages 3,527,723 3,818,117 3,452,208 4,018,261<br />
Fringe Benefits 1,075,082 996,861 818,996 1,263,916<br />
Total Personnel 4,602,805 4,814,978 4,271,204 5,282,177<br />
Non-Personnel<br />
Internal Service Charges 2,904,091 3,451,317 3,132,475 3,715,306<br />
Pr<strong>of</strong>essional and Contractual 406,189 863,481 811,800 602,326<br />
Utilities 1,736,634 2,081,754 1,625,874 1,686,650<br />
Insurance and Fixed Charges 327,378 253,598 253,058 279,433<br />
All Other Operations and Maintenance 1,780,468 2,488,995 2,760,477 2,445,487<br />
Capital Outlay 3,371,157 15,571,597 15,571,597 5,157,990<br />
Debt Service 3,857,478 4,401,842 4,404,342 4,399,052<br />
Total Non-Personnel 14,383,395 29,112,584 28,559,623 18,286,244<br />
Total Expenditures 18,986,200 33,927,562 32,830,827 23,568,421<br />
Transfers<br />
Transfers In<br />
Transfers Out (3,902,143) (4,102,143) (4,102,143) (4,113,225)<br />
Net Transfers (3,902,143) (4,102,143) (4,102,143) (4,113,225)<br />
Revenue Sources<br />
Taxes<br />
Licenses and Permits<br />
Intergovernmental 12,744 319,757 319,757 50,000<br />
Charges for Services 22,473,144 23,742,414 23,225,700 24,418,766<br />
Interest Income 1,534,871 1,069,755 1,216,644 1,097,000<br />
All Other Revenue 2,977,206 2,008,164 2,027,104 767,000<br />
Total Revenue 26,997,965 27,140,090 26,789,205 26,332,766<br />
Funding to be Provided (4,109,622) 10,889,615 10,143,764 1,348,880<br />
E – 133
WATER UTILITY<br />
Experience Budget Projected Proposed<br />
For Year For Year For Year For Year<br />
2008 2009 2009 <strong>2010</strong><br />
REVENUES<br />
Other Miscellaneous Revenue<br />
Scrap Sales 24,022 14,000 10,000<br />
Insurance Proceeds - Workers Comp Claims 4,576 2,000<br />
Refund <strong>of</strong> Prior Year Expenses 3,232<br />
Commissions 8,295 6,610 6,610 6,000<br />
Penalties on Assessments 872<br />
All Other Revenue 24,163 26,000 12,500 12,000<br />
Cash Over And Short (969)<br />
60,086 32,610 39,214 28,000<br />
Charges for Services<br />
Water Utility Revenues:<br />
Water Sales 15,342,713 16,199,693 15,999,603 16,524,000<br />
Water Sales-Commercial 3,197,493 3,458,240 3,158,265 3,527,000<br />
Water Sales-Industrial 504,323 475,508 455,195 535,000<br />
Water Sales-Sprinklers 1,372,503 1,404,910 1,530,339 1,583,000<br />
Water Sales-Fire Hydrant-Flat Fee 16,989 18,912 14,255 19,000<br />
Water Sales-Fire Protection 365,008 374,556 383,133 382,000<br />
Water Sales-Fire Protection 440,533 476,084 453,683 486,000<br />
Intra-<strong>City</strong> Sales:<br />
Water Utility Service - General Fund 485,025 520,811 526,016 520,811<br />
Water Utility Service - Fleet Management 1,343 1,417 1,390 1,417<br />
Water Utility Service - Purchasing & Stores 1,450 1,514 1,463 1,514<br />
Water Utility Service - Cleveland Heights 21,058 23,270 19,804 23,270<br />
Water Utility Service - Parking Fund 5,778 5,998 6,752 5,998<br />
Water Utility Service - <strong>Lakeland</strong> Center 30,943 32,270 34,713 32,270<br />
Water Utility Service - <strong>Lakeland</strong> Linder Regional Airport 7,832 7,462 18,052 7,462<br />
Water Utility Service - <strong>Lakeland</strong> Airside Center 26,041 30,477 29,673 30,477<br />
Water Utility Service - Solid Waste 3,627 3,790 3,873 3,790<br />
Water Utility Service - Wastewater Fund 24,472 27,393 27,562 27,393<br />
Water Utility Service - Water Operations 701 1,614 677 1,614<br />
Water Utility Service - Electric Operations 128,936 148,653 106,943 148,653<br />
Water Utility Service - Facilities Maintenace 482 547 552 547<br />
Water Utility Service - Information Technology 506 550 604 550<br />
Water Utility Service - Stormwater Utility Fund 19 10<br />
Water Utility Service - Self Insurance Fund 121 166 35<br />
E – 134
WATER UTILITY<br />
Experience Budget Projected Proposed<br />
For Year For Year For Year For Year<br />
2008 2009 2009 <strong>2010</strong><br />
Other Water Operating Revenues:<br />
Customer Late Charges 91,529 87,183 94,000 114,000<br />
Connection Fees 258,487 283,143 240,000 275,000<br />
Connection Fees-Delinquent Accounts 112,773 125,643 100,000 150,000<br />
22,440,686 23,709,804 23,206,590 24,400,766<br />
Fines and Forfiets<br />
Bad Check Charges 8,801 8,164 7,000 7,000<br />
Intergovernmental<br />
SWFWMD Grants:<br />
Low Flow Toilet Rebate 300,000 300,000 50,000<br />
Low Flow Dish Sprayer Valves 12,744 8,757 8,757<br />
Plumbing Retr<strong>of</strong>it Kits 11,000 11,000<br />
12,744 319,757 319,757 50,000<br />
Investment Income<br />
Water Operating Fund:<br />
Interest on Pooled Investments 318,914 280,000 396,000 295,000<br />
Market Value Restatement (83,226)<br />
Debt Service Sinking Funds:<br />
99A Sr Lien Sinking - Principal 1,680 1,006 69 70<br />
99A Sr Lien Sinking - Interest 7,025 2,500 3,347 1,930<br />
2002 Bond Sinking - Interest 9,585 18,867 13,466 20,000<br />
2002 Bond Sinking - Principal 16,489 23,059 8,763 16,000<br />
Bond Reserve Fund 369,460 150,000 153,000 140,000<br />
Meter Deposit Fund 75,003 72,323 120,000 102,000<br />
714,929 547,755 694,644 575,000<br />
PRIOR YEAR SURPLUS (420,061) 1,140,018 394,167 451,808<br />
REVENUE TOTAL 22,817,186 25,758,108 24,661,373 25,512,574<br />
E – 135
EXPENSES<br />
WATER UTILITY<br />
Experience Budget Projected Proposed<br />
For Year For Year For Year For Year<br />
2008 2009 2009 <strong>2010</strong><br />
WATER PRODUCTION - GENERAL<br />
Personal Services 1,501,427 1,574,330 1,469,258 1,788,404<br />
Utilities<br />
Water Utility Service 701 766 677 700<br />
Stormwater Utility Fees 2,271 2,271 3,028 3,000<br />
Electric Utility Service 1,122,972 1,391,808 1,075,805 1,100,000<br />
Wastewater Services 938 1,014 1,008 1,100<br />
Interdepartmental Solid Waste Service 2,122 2,122 2,363 2,500<br />
1,129,005 1,397,981 1,082,881 1,107,300<br />
Inter-<strong>City</strong> Services<br />
Rental-Fleet Mgmt Equipment 8,025 10,945 9,213 16,656<br />
Gasoline-Fleet Mgmt Equipment 9,169 11,429 5,499 11,620<br />
Maintenance-Fleet Mgmt Equipment 6,942 11,182 8,276 13,140<br />
Intra-dept Charges - PC & Network Support 16,934 16,743 16,804 16,609<br />
Intra-Departmental Charges - Telephone 4,088 4,359 3,818 4,520<br />
Intra-Departmental Charges - Radios 4,180 4,160 4,180 4,077<br />
Intra-Departmental Charges - Facilities 15,217 14,508 14,508 14,497<br />
64,554 73,326 62,298 81,119<br />
All Other O&M<br />
Contractual Services 6,169 10,000 10,000 10,500<br />
Advertising 300 300 200<br />
Office Supplies 5,637 8,334 8,334 8,500<br />
Equipment - Noncapital 765 1,000 1,000 1,000<br />
All Other Materials & Supplies 2,559 4,100 4,100 6,000<br />
Uniforms 5,831 6,366 6,366 7,000<br />
Tools & Implements 2,047 1,750 1,750 2,500<br />
Electrical, Hardware & Plumbing Supplies 3,914 3,800 3,800 8,500<br />
Personal Safety Equipment 403 1,300 1,300 2,500<br />
Parts For Equipment 6,616 5,600 5,600 18,000<br />
Materials 26,905 26,200 26,200 30,000<br />
#2 Oil 9,331 7,000 7,000 15,000<br />
Rentals 879 1,500 1,500 2,000<br />
Repair Of Equipment 80 600 600 1,000<br />
Postage & Mailing 121 300 400 500<br />
Telephone, Communications 13,895 12,000 13,000 14,000<br />
Contingency 8,691 8,691 60,000<br />
Telephone-Long Distance 97 100 100 163<br />
Licenses & Permits 1,060 2,765 2,765 2,800<br />
86,309 101,706 102,806 190,163<br />
E – 136
WATER UTILITY<br />
Experience Budget Projected Proposed<br />
For Year For Year For Year For Year<br />
2008 2009 2009 <strong>2010</strong><br />
Projects<br />
MWP1011 Emergency Generator Service 8,245 9,100 9,100 20,000<br />
Risk Management Process 8,250 6,800 6,800 6,800<br />
MWP1518 Contract Wtr Plt Op/Maint 12,000 18,000<br />
MTR1708 Technical Training-Wtr Prod 2,000 2,000<br />
MWP2018 Water Facilities Security 102,049 120,000 115,000 140,000<br />
MWP2035 Consumer Confidence Report 1,840 2,200 2,200 2,800<br />
MWP2036 Environmental Mitigation at Williams Water Plant 20,000 20,000 25,000<br />
MWP1002 PICS Expendables (620) 7,710 6,800 6,800 6,500<br />
MWP1005 Painting Of Structures 47 5,000 5,000 7,000<br />
MWP1519 PSM / RMP Internal Audit 7,000 7,000 7,000<br />
128,141 190,900 171,900 235,100<br />
SUB TOTAL 2,909,436 3,338,243 2,889,143 3,402,086<br />
WATER PRODUCTION - PUMPING<br />
Projects<br />
MWP1008 Well Preventative Maintenance 104,751 105,000 95,000 105,000<br />
Utilities<br />
Electric Utility Service 65,824 65,000 58,841 65,000<br />
SUB TOTAL 170,575 170,000 153,841 170,000<br />
WATER PRODUCTION - WATER TREATMENT<br />
Utilities<br />
Electric Utility Service 181,473 198,830 139,956 140,000<br />
Inter-<strong>City</strong> Services<br />
Rental-Fleet Mgmt Equipment 3,343 3,863 3,863 3,343<br />
Gasoline-Fleet Mgmt Equipment 3,923 5,480 2,441 6,096<br />
Maintenance-Fleet Mgmt Equipment 2,639 6,998 2,332 4,238<br />
9,905 16,341 8,636 13,677<br />
All Other O&M<br />
Contractual Services 3,977 5,800 5,800 6,000<br />
Chemicals 391,034 475,000 475,000 504,176<br />
Tools & Implements 1,847 1,500 1,500 1,500<br />
Parts For Equipment 19,304 26,000 26,000 32,000<br />
Materials 34,438 32,280 32,280 39,000<br />
Rentals 173 800 800 800<br />
Licenses & Permits 1,525 2,300 2,300 2,400<br />
452,298 543,680 543,680 585,876<br />
E – 137
WATER UTILITY<br />
Experience Budget Projected Proposed<br />
For Year For Year For Year For Year<br />
2008 2009 2009 <strong>2010</strong><br />
Projects<br />
MWP1012 Mandatory Certification Require 6,723 5,500 5,000 5,000<br />
MWP1014 Caco3 Transport (642) 2,361 9,125 9,000 10,000<br />
MWP1015 Cleaning Of Upflow Internals (652) 10,956 59,000 58,800 65,000<br />
20,040 73,625 72,800 80,000<br />
SUB TOTAL 663,716 832,476 765,072 819,553<br />
WATER PRODUCTION - LABORATORY<br />
Projects<br />
MWP1013 Outside Laboratory Services 13,987 22,000 20,000 15,000<br />
SUB TOTAL 13,987 22,000 20,000 15,000<br />
WATER PRODUCTION - COMBEE WATER TREATMENT PLANT<br />
Personal Services 786,229 946,932 693,621 852,718<br />
Utilities<br />
Water Utility Service 780 17 100<br />
Stormwater Utility Fees 1,183 1,183 1,578 1,600<br />
Electric Utility Service 337,106 397,660 321,664 350,000<br />
Wastewater Services 866 24 500<br />
Interdepartmental Solid Waste Service 996 1,029 963 1,000<br />
339,285 401,518 324,246 353,200<br />
Inter-<strong>City</strong> Services<br />
Rental-Fleet Mgmt Equipment 3,256 3,508 3,588 3,256<br />
Gasoline-Fleet Mgmt Equipment 3,626 4,069 2,148 3,386<br />
Maintenance-Fleet Mgmt Equipment 1,195 2,801 1,502 3,260<br />
Intra-dept Charges - PC & Network Support 11,908 11,906 11,418 11,310<br />
Intra-Departmental Charges - Telephone 5,166 5,943 5,166 6,913<br />
Intra-Departmental Charges - Radios 2,572 2,560 2,572 2,509<br />
Intra-Departmental Charges - Facilities 16,235 15,480 15,480 15,229<br />
43,958 46,267 41,874 45,863<br />
E – 138
WATER UTILITY<br />
Experience Budget Projected Proposed<br />
For Year For Year For Year For Year<br />
2008 2009 2009 <strong>2010</strong><br />
All Other O&M<br />
Contractual Services 2,607 4,794 4,800 4,800<br />
Advertising 1,500 300 300<br />
Office Supplies 2,436 3,500 3,900 4,000<br />
Equipment - Noncapital 929 1,750 1,750 1,750<br />
All Other Materials & Supplies 8,412 7,986 8,000 15,000<br />
Uniforms 4,965 4,359 4,500 5,000<br />
Chemicals 142,788 164,333 175,000 198,000<br />
Tools & Implements 3,435 3,000 3,000 3,000<br />
Electrical, Hardware & Plumbing Supplies 1,384 2,500 2,500 5,000<br />
Personal Safety Equipment 839 1,500 1,500 2,000<br />
Parts For Equipment 4,118 3,675 3,750 12,000<br />
Materials 19,266 20,548 20,548 28,000<br />
Use Tax Allocation (4)<br />
#2 Oil 3,666 7,000 7,000 12,000<br />
Rentals 22 538 550 550<br />
Repair Of Equipment 2,139 4,100 4,000 4,000<br />
Postage & Mailing 45 200 200 200<br />
Telephone, Communications 1,029 1,500 1,000 1,200<br />
Contingency 3,000 3,000 30,000<br />
Telephone-Long Distance 54 190 175 175<br />
Licenses & Permits 1,050 3,500 2,000 2,000<br />
199,183 239,473 247,473 328,975<br />
Projects<br />
MWP2022 Delta V Operations S<strong>of</strong>tware Maintenance 15,998 16,605 16,605 18,000<br />
MWP1001 NE Wellfield Monitoring 43,176 92,435 92,435 119,000<br />
MWP1002 PICS Expendables (620) 1,752 1,500 1,500 3,000<br />
MWP1006 Maintenance Of NE Wellfield 18,030 29,500 29,500 45,000<br />
MWP1009 Emergency Well Maintenance (633) 3,070 11,000 11,000 25,000<br />
MWP1011 Emergency Generator Service 4,068 4,068 12,000<br />
MWP1012 Mandatory Certification Require 6,298 5,170 5,170 6,300<br />
MWP1014 Caco3 Transport (642) 1,650 3,900 3,900 4,000<br />
Risk Management Process 3,200 3,200 3,200<br />
MWP2018 Water Facilities Security 117,265 117,239 110,000 120,000<br />
207,238 284,617 277,378 355,500<br />
SUB TOTAL 1,575,893 1,918,807 1,584,592 1,936,256<br />
TOTAL WATER PRODUCTION 5,333,608 6,281,526 5,412,648 6,342,896<br />
E – 139
WATER UTILITY<br />
Experience Budget Projected Proposed<br />
For Year For Year For Year For Year<br />
2008 2009 2009 <strong>2010</strong><br />
WATER T & D - GENERAL<br />
Personal Services<br />
Payroll 652,843 618,758 681,071 617,497<br />
Overtime 1,815 9,450 513 10,000<br />
Payroll Accrual 9,878<br />
Medicare Contribution 28,592 78,793 27,317 30,913<br />
Pension Reserve 351,170 403,346 347,070 452,813<br />
Insurance-Group Life 3,599 4,335 3,050 2,997<br />
Insurance-Group Hospital 226,587 242,691 217,012 301,791<br />
Insurance-Disability 6,017 8,782 5,447 6,721<br />
Pension Reserve adjustments (14,383)<br />
Pension & Benefits Transfers to Projects (522,724) (630,140) (484,940) (561,555)<br />
Personal Services 733,515 736,015 796,541 871,055<br />
Inter-<strong>City</strong> Services<br />
Rental-Fleet Mgmt Equipment 5,453 24,066 5,722 26,636<br />
Gasoline-Fleet Mgmt Equipment 4,822 36,523 2,446 64,549<br />
Maintenance-Fleet Mgmt Equipment 4,172 28,978 3,365 143,350<br />
Other <strong>City</strong> Department Charges 1,000 1,100<br />
Intra-dept Charges - PC & Network Support 43,477 41,695 44,002 43,790<br />
<strong>Lakeland</strong> Electric Charges 52,250 39,760 30,346 38,965<br />
Intra-Departmental Charges - Telephone 5,324 6,071 5,150 4,520<br />
Intra-Departmental Charges - Radios 18,650 19,200 18,650 18,816<br />
Intra-Departmental Charges - Facilities 15,456 14,736 14,736 14,273<br />
Intra-Departmental Charges - Janitorial 4,231 4,593 4,593 4,778<br />
154,835 216,722 129,011 359,677<br />
All Other O&M<br />
Contractual Services 1,203 1,100 1,000 1,000<br />
Contract Labor 10,719 12,000 12,000 13,000<br />
Office Supplies 5,767 4,000 5,000 5,000<br />
Equipment - Noncapital 4,586 3,500 3,000 3,000<br />
All Other Materials & Supplies 1,830 2,000 2,300 2,300<br />
Uniforms 14,129 15,000 12,000 15,000<br />
Tools & Implements 15,692 11,000 11,000 11,500<br />
Personal Safety Equipment 3,779 2,700 3,600 3,600<br />
Parts For Equipment 279 1,390 1,300 1,300<br />
Materials 1,894 1,820 1,300 1,500<br />
Use Tax Allocation<br />
Materials - Default Purchasing Card (1,634)<br />
Repair Of Equipment 1,750<br />
Postage & Mailing 24 50 50 50<br />
Subscription & Membership 195 150 150 150<br />
Telephone, Communications 2,716 1,375 2,400 2,400<br />
Travel 2,358 1,800 500<br />
Training 984 2,500 1,000 1,000<br />
Telephone-Long Distance 223 200 200 200<br />
Licenses & Permits 400 400<br />
Recoveries-From Outside <strong>City</strong> (2,391) (1,265)<br />
62,354 61,470 56,300 61,900<br />
E – 140
WATER UTILITY<br />
Experience Budget Projected Proposed<br />
For Year For Year For Year For Year<br />
2008 2009 2009 <strong>2010</strong><br />
Projects<br />
MWD0687 Trans/Dist Mt-Services 281,712 287,840 300,000 297,000<br />
MWD0688 Trans/Dist Mt-Mains 368,946 334,100 337,100 680,554<br />
MWD0696 Dist Mt-Hydrants 23,344 22,775 23,775 24,800<br />
Purchasing Card - Default Liability 885<br />
MWD1001 Medical Asbestos Screening 12,602 12,700 12,700 12,050<br />
MWD1003 A/C Pipe Handling Training 6,102 11,320 11,320 11,760<br />
MWD1004 Wtr Dist-Skills Training 12,939 18,580 18,580 18,600<br />
MWD1005 Disposal/Dumping Fees 2,000 1,000 2,000<br />
MWD1006 Equipment Maintenance (662) 8,889 6,650 7,000 6,900<br />
MWD1007 Sunshine One-Call Locates (662) 157,290 151,740 145,000 153,177<br />
MWD1012 Leak Detection/Main Repair (673) 26,537 53,000 45,000 44,450<br />
MWD1014 Valve Maintenance Program 57,799 67,795 65,000 63,600<br />
MWD1021 Hydrant Maintenance Program (696) 144,050 152,200 160,000 159,000<br />
MWD1022 <strong>City</strong> Parks & Rec Maintenance Support 1,603 3,125 2,000 2,595<br />
MWD1100 Traffic Control Support O&M 1,398 2,000 1,500 2,000<br />
MWP2018 Water Facilities Security 10,230 2,500 2,500<br />
1,104,094 1,136,055 1,132,475 1,480,986<br />
SUB TOTAL 2,054,799 2,150,262 2,114,327 2,773,618<br />
WATER T & D - METERS<br />
Personal Services 296,390 284,700 284,309 284,700<br />
Insurance<br />
Damage Claims Paid 253<br />
Inter-<strong>City</strong> Services<br />
Rental-Fleet Mgmt Equipment 12,371 12,000 13,893<br />
Gasoline-Fleet Mgmt Equipment 27,509 19,500 18,102<br />
Maintenance-Fleet Mgmt Equipment 14,157 18,000 16,119<br />
Other <strong>City</strong> Department Charges 6,650 6,800 6,800 6,664<br />
60,687 56,300 54,914 6,664<br />
All Other O&M<br />
Contractual Services 1,404 2,000 2,500 2,000<br />
Contract Labor 536 5,270 3,500 4,000<br />
All Other Materials & Supplies 118 200 200 200<br />
Tools & Implements 7,256 9,500 7,000 7,000<br />
Personal Safety Equipment 1,517 700 2,000 2,000<br />
Parts For Equipment 3,255 4,000 3,000 3,000<br />
Materials 86,354 94,000 97,000 97,000<br />
Use Tax Allocation (2)<br />
Repair Of Equipment 2,750<br />
Construction Advances (5,469) (5,230)<br />
94,968 113,190 115,200 115,200<br />
Projects<br />
MWD1019 Rebuild Water Meters 174,625 225,350 160,000 215,350<br />
Operations - Polk <strong>City</strong> 130<br />
174,625 225,480 160,000 215,350<br />
SUB TOTAL 626,924 679,670 614,423 621,914<br />
E – 141
WATER UTILITY<br />
Experience Budget Projected Proposed<br />
For Year For Year For Year For Year<br />
2008 2009 2009 <strong>2010</strong><br />
WATER T & D - CROSS CONNECTION CONTROL<br />
Personal Services 134,333 105,500 110,601 111,800<br />
Inter-<strong>City</strong> Services<br />
Rental-Fleet Mgmt Equipment 1,652 4,400 1,856<br />
Gasoline-Fleet Mgmt Equipment 6,371 6,500 3,488<br />
Maintenance-Fleet Mgmt Equipment 1,260 3,000 2,224<br />
Other <strong>City</strong> Department Charges 7,862 5,000 6,273 8,000<br />
17,145 18,900 13,841 8,000<br />
All Other O&M<br />
Contractual Services 500 1,500 2,500 2,000<br />
Contract Labor 137 500<br />
All Other Materials & Supplies 251<br />
Materials 20,733 12,000 12,000 12,000<br />
Use Tax Allocation (5)<br />
Repair Of Equipment 922 750 500 750<br />
22,537 14,750 15,000 14,750<br />
SUB TOTAL 174,016 139,150 139,442 134,550<br />
TOTAL WATER T&D 2,855,739 2,969,082 2,868,192 3,530,082<br />
E – 142
WATER UTILITY<br />
Experience Budget Projected Proposed<br />
For Year For Year For Year For Year<br />
2008 2009 2009 <strong>2010</strong><br />
WATER UTILITIES ENGINEERING - SHARED<br />
Personal Services 676,981 835,993 695,107 863,784<br />
Inter-<strong>City</strong> Services<br />
Rental-Fleet Mgmt Equipment 1,095 5,832 1,098 1,095<br />
Gasoline-Fleet Mgmt Equipment 336 5,714 320 7,665<br />
Maintenance-Fleet Mgmt Equipment 625 4,030 2,000 1,930<br />
Intra-dept Charges - PC & Network Support 47,915 46,182 46,182 45,644<br />
Intra-Departmental Charges - Telephone 7,297 7,814 7,814 7,178<br />
Intra-Departmental Charges - Radios 7,074 5,440 7,074 6,933<br />
64,343 75,012 64,488 70,445<br />
All Other O&M<br />
Contractual Services 550<br />
Engineering - Basic 2,500 2,500<br />
Contract Labor 30,268 32,500 32,500 32,500<br />
Office Supplies 7,682 12,000 12,000 12,000<br />
Equipment - Noncapital 808 2,000 2,000 2,000<br />
All Other Materials & Supplies 7,780 4,000 4,000 4,000<br />
Uniforms 1,847 2,000 1,500 2,000<br />
Tools & Implements 145 500 275 500<br />
Personal Safety Equipment 72<br />
Repair Of Equipment 17,486 20,450 20,450 20,450<br />
Printing & Photography 500 500 500<br />
Postage & Mailing 801 650 500 650<br />
Subscription & Membership 1,695 2,818 2,800 2,818<br />
Telephone, Communications 2,526 3,000 3,000 3,000<br />
Travel 2,163 1,000 1,000 1,000<br />
Training 5,852 6,000 6,000 6,000<br />
Telephone-Long Distance 598 500 500 500<br />
Licenses & Permits 2,014 2,000 2,200 2,000<br />
82,288 92,418 89,225 92,418<br />
Allocations<br />
Cost Allocated-Wastewater (373,899) (451,540) (381,969) (461,991)<br />
Cost Allocated - Water (456,988) (551,883) (466,851) (564,656)<br />
(830,887) (1,003,423) (848,820) (1,026,647)<br />
SUB TOTAL (7,275) 0 0<br />
E – 143
WATER UTILITY<br />
Experience Budget Projected Proposed<br />
For Year For Year For Year For Year<br />
2008 2009 2009 <strong>2010</strong><br />
WATER ENGINEERING<br />
Inter-<strong>City</strong> Services<br />
Allocation Shared Cost - Water Util 456,988 551,883 466,851 564,656<br />
SUB TOTAL 456,988 551,883 466,851 564,656<br />
WATER UTILITIES ADMINISTRATION - SHARED<br />
Personal Services 363,133 570,205 396,612 596,683<br />
Inter-<strong>City</strong> Services<br />
Intra-dept Charges - PC & Network Support 15,790 13,294 14,935 15,269<br />
Intra-Departmental Charges - Telephone 2,238 2,130 2,090 1,595<br />
Intra-Departmental Charges - IT Operations 2,465 2,856 2,856 2,799<br />
20,493 18,280 19,881 19,663<br />
All Other O&M<br />
Legal Fees 50,000<br />
Pr<strong>of</strong>essional Services 1,768 2,500 2,500 2,500<br />
Advertising 1,604 3,000 3,000 3,000<br />
Office Supplies 3,680 2,200 2,200 2,200<br />
Equipment - Noncapital 500 500 500<br />
All Other Materials & Supplies 1,395 2,700 2,700 2,700<br />
Postage & Mailing 200 200 200<br />
Subscription & Membership 17,726 18,473 18,473 18,473<br />
Telephone, Communications 881 550 550 550<br />
Travel 863 2,000 2,000 2,000<br />
Training 1,840 1,000 1,000 1,000<br />
All Other Sundry Charges 3,300 3,300 3,300<br />
Telephone-Long Distance 84 100 100 100<br />
29,840 36,523 36,523 86,523<br />
Allocations<br />
Cost Allocated-Wastewater (186,602) (281,254) (203,857) (316,291)<br />
Cost Allocated - Water (228,069) (343,754) (249,159) (386,578)<br />
(414,672) (625,008) (453,016) (702,869)<br />
SUB TOTAL (1,206) 0 0<br />
E – 144
WATER UTILITY<br />
Experience Budget Projected Proposed<br />
For Year For Year For Year For Year<br />
2008 2009 2009 <strong>2010</strong><br />
WATER ADMINISTRATION<br />
Personal Services 612,219 151,503 220,065 309,532<br />
Insurance<br />
Insurance - Fire 27,964 29,828 29,288 33,870<br />
Insurance - Position Bond 795 795 795<br />
Self-Insurance Services 228,462 222,975 222,975 244,768<br />
256,426 253,598 253,058 279,433<br />
Inter-<strong>City</strong> Services<br />
Purchasing & Stores Service 130,727 137,607 137,607 137,607<br />
General Fund Services 668,264 764,176 764,176 770,588<br />
Rental-Fleet Mgmt Equipment 1,095 5,965 1,231 1,858<br />
Gasoline-Fleet Mgmt Equipment 613 4,369 123 1,406<br />
Maintenance-Fleet Mgmt Equipment 1,515 4,030 1,753<br />
Intra-Departmental Charges - IT Operations 142,785 165,329 165,329 288,642<br />
Allocation Shared Cost - Water Util 228,069 343,754 249,159 386,578<br />
Intra-Departmental Charges/Training Ctr 6,110 6,110 6,110 6,110<br />
1,179,179 1,431,340 1,323,735 1,594,542<br />
All Other O&M<br />
Contractual Services<br />
Banking Service 9,320 9,376 9,376 9,376<br />
Insurance Consultant 4,016 6,137 6,051 7,763<br />
Annual Audit 12,928 12,900 10,654 13,287<br />
Travel 87 500 500 500<br />
Training 500 500 500<br />
All Other Sundry Charges 67 500 500 500<br />
Contingency 24,000 24,000 25,000<br />
Bad Debt Expense 96,904 110,000 100,000 100,000<br />
123,321 163,913 151,581 156,926<br />
Projects<br />
MWA1208 Water Customer Statistics - Rates Div 3,595 6,425 2,500 2,500<br />
MWA1209 Master Meter Updating - Rates Div 1,832 2,570 2,570 2,500<br />
MWA1211 Other Water Projects & Recoveries 108 500 500 0<br />
MWA1225-CROW Retainer Work (250) 1,000 1,000 1,000<br />
MWA1301 Water Environmental Affairs 25,500 25,500 25,500 25,500<br />
MWA1751 Water Building Maintenance Support 203,832 214,024 214,024 216,000<br />
MWA0902 Water Billing Services 628,170 732,922 732,922 735,000<br />
MWA1131 Water Support <strong>of</strong> COL-Training-Parker St 1,920 2,000 1,961 2,000<br />
Salaries Students 21,812 21,812<br />
MWA1154 Water Conservation / Enforcement 6,117 70,388 70,388 0<br />
MWA1155 Bond Holders Report 12,465 15,000 13,000 15,000<br />
MWA1203 Water Forecast - Rates Div 4,058 12,421 5,000 5,000<br />
MWA1204 Water Rate Survey - Rates Div 86<br />
MWA1218 100 Years <strong>of</strong> Water Utility 5,000<br />
MWA1219 Water Conservation Program 8,795 185,379 185,379 5,000<br />
MWA1997 SWFWMD Low Flow Toilet Rebate 600,000 600,000 100,000<br />
MWA1998 SWFWMD Low Flow Dish Sprayer Valves 27,486 17,514 17,514<br />
MWA1999 SWFWMD Plumbing Retr<strong>of</strong>it Kits 22,000 22,000<br />
MWA1304 Recruitment - Water Director 2,590<br />
MWA1305 Permitting Support 50,000 50,000<br />
MWA1306 Rates & Fees Study 50,000 50,000<br />
MWA1307 Efficiencies & Performance Measures 44,500 44,500<br />
926,303 2,078,955 2,038,758 1,131,312<br />
SUB TOTAL 3,097,447 4,079,309 3,987,197 3,471,745<br />
TOTAL WATER ADMINISTRATION 3,545,954 4,631,192 4,454,049 4,036,402<br />
E – 145
WATER UTILITY<br />
Experience Budget Projected Proposed<br />
For Year For Year For Year For Year<br />
2008 2009 2009 <strong>2010</strong><br />
Debt Service and Other Expenses<br />
Interest on Long-term Debt 3,028,482 2,990,744 2,993,244 2,923,994<br />
Principal on Long-term Debt 1,328,319 1,385,000 1,385,000 1,445,000<br />
Capitalized Interest Expense (525,421)<br />
Interest Paid on Customer Deposits 22,264 72,323 120,000 102,000<br />
3,853,644 4,448,067 4,498,244 4,470,994<br />
Transfers To Other Funds<br />
Transfer To General Fund 3,902,143 4,102,143 4,102,143 4,102,143<br />
Transfer to DoIT (VOIP Project) 3,960<br />
Radio System Expansion - Public Safety 26,098 26,098 26,098 26,098<br />
Transfer to Water Renewal and Replacement 3,300,000 3,300,000 3,300,000 3,000,000<br />
7,228,241 7,428,241 7,428,241 7,132,201<br />
GRAND TOTAL 22,817,186 25,758,108 24,661,373 25,512,574<br />
E – 146
REVENUE AND EXPENDITURE SUMMARY<br />
PARKING<br />
Experience Budget Experience 2009-10<br />
For Year For Year 2008-09 Proposed by<br />
EXPENSES 2007-08 2008-09 Estimated <strong>City</strong> Manager<br />
Personnel<br />
Salaries and Wages 211,249 211,312 190,835 197,779<br />
Fringe Benefits 79,771 76,216 65,885 78,623<br />
Total Personnel 291,020 287,528 256,720 276,402<br />
Non-Personnel<br />
Internal Service Charges 143,614 164,247 159,454 166,143<br />
Pr<strong>of</strong>essional and Contractual 8,400 5,348 6,133 6,702<br />
Utilities 111,442 124,789 115,071 96,640<br />
Insurance and Fixed Charges 32,767 38,213 32,564 37,200<br />
All Other Operations and Maintenance 66,509 68,210 60,940 21,400<br />
Capital Outlay 35,615 480,325 449,387 298,735<br />
Debt Service 88,933 88,933 88,933 88,933<br />
Total Non-Personnel 487,280 970,065 912,482 715,753<br />
Total Expenditures 778,300 1,257,593 1,169,202 992,155<br />
Transfers<br />
Transfers In 120,236 537,585 537,585 386,933<br />
Transfers Out (230)<br />
Net Transfers 120,236 537,585 537,585 386,703<br />
Revenue Sources<br />
Taxes<br />
Licenses and Permits<br />
Intergovernmental<br />
Charges for Services 532,971 531,163 518,352 525,962<br />
Interest Income 5,038 7,000 1,000 1,000<br />
All Other Revenue 80,562 74,000 58,136 59,762<br />
Total Revenue 618,572 612,163 577,488 586,724<br />
Funding to be Provided 39,492 107,845 54,129 18,728<br />
E – 147
PARKING<br />
Experience Budget Projected Proposed<br />
For Year For Year For Year For Year<br />
2008 2009 2009 <strong>2010</strong><br />
REVENUES<br />
Property Taxes<br />
Current Ad Valorem Taxes - Main St Garage 1,024 4,000 4,000 4,000<br />
Current Ad Valorem Taxes - Orange St Garage 3,950 4,000 4,000 4,000<br />
4,974 8,000 8,000 8,000<br />
Other Miscellaneous Revenue<br />
All Other Misc Revenue 7,293 50<br />
Refund <strong>of</strong> Prior Year Expenses 45<br />
Reimbursements / Loss Recovery 405<br />
Penalties on Assessments 45 1,000<br />
7,788 1,050<br />
Charges for Services<br />
Rental <strong>of</strong> Buildings<br />
Parking Garage- Main Street-Daily 9,495 11,000 7,463 7,850<br />
Parking Garage- Main Street-Leased 268,942 268,907 259,037 260,000<br />
Parking Garage- Orange Street-Publix 49,015 49,016 49,016 49,016<br />
Parking Garage- Orange Street-Watkins 62,903 62,904 62,903 62,903<br />
390,356 391,827 378,419 379,769<br />
Rental <strong>of</strong> Land<br />
Parking Lot-Bay Street 2,620 3,100 2,588 2,750<br />
Parking Lot-Bay Street (Leased) 8,555 8,290 8,200 8,200<br />
Parking Lot-Chamber Comm-Citrus Mutual 13,020 13,020 11,300 11,300<br />
Parking Lot-Dixieland 420 420 420 420<br />
Parking Lot-Munn Park / Cedar St. Lot 12,738 13,000 11,272 11,400<br />
Parking Lot-Lot C / N. Florida Avenue 6,946<br />
Parking Lot-Publix-Citrus Mutual Lot 20,045 20,044 20,045 20,045<br />
Parking Lot-South Massachusetts Ave. 10,378 10,378 10,378 10,378<br />
Parking Lot-South Tennessee - Leased 26,712 27,000 25,060 25,700<br />
Parking Lot-Cedar St./Massachusetts Ave 4,620 4,620 4,620 4,620<br />
Parking Lots - Missouri Ave 8,880 8,880 8,880 8,880<br />
114,935 108,752 102,763 103,693<br />
SUB-TOTAL 505,290 500,579 481,182 483,462<br />
E – 148
PARKING<br />
Experience Budget Projected Proposed<br />
For Year For Year For Year For Year<br />
2008 2009 2009 <strong>2010</strong><br />
All Other Rents and Royalties<br />
Mass. & Main Temp Parking Lot 18,888 21,744 3,430 3,360<br />
Parking Garage - State Garage 2,500 840 21,600 27,000<br />
Parking Lot - Federal Building 1,320 4,140 4,140<br />
22,708 22,584 29,170 34,500<br />
Fines and Forfiets<br />
Court Ordered Restitution 1,429 472 472<br />
Bad Check Charges 80 60 60<br />
Parking Fines 71,266 74,000 56,554 59,230<br />
72,775 74,000 57,086 59,762<br />
Investment Income<br />
Interest on Pooled Investments 6,543 7,000 1,000 1,000<br />
Market Value Restatement (1,504)<br />
5,038 7,000 1,000 1,000<br />
Transfers from Other Funds<br />
Transportation Fund:<br />
Verizon Property Purchase 88,933 88,933 88,933 88,933<br />
Munn Park - Parking Lot Resurfacing 13,500 13,500<br />
Pay By Space Machines 16,400 16,400<br />
Structural Inspections 10,000<br />
Deck Coating Sealant 11,248 418,752 418,752<br />
Gate Replacement 20,055<br />
Lighting Retr<strong>of</strong>it - Main and Orange St. Garage 173,000<br />
Main St. Parking Garage - Ext. Coating 115,000<br />
120,236 537,585 537,585 386,933<br />
Sub-Total 738,808 1,149,748 1,115,073 973,657<br />
PRIOR YEAR SURPLUS 39,492 107,845 54,129 18,728<br />
REVENUE TOTAL 778,300 1,257,593 1,169,202 992,385<br />
E – 149
PARKING<br />
Experience Budget Projected Proposed<br />
For Year For Year For Year For Year<br />
2008 2009 2009 <strong>2010</strong><br />
EXPENSES<br />
MAIN STREET GARAGE<br />
Personal Services 130,475 115,470 106,297 122,312<br />
Inter-<strong>City</strong> Services<br />
Rental-Fleet Mgmt Equipment 3,078 2,001 3,329 2,934<br />
Gasoline-Fleet Mgmt Equipment 114 2,993 122 151<br />
Maintenance-Fleet Mgmt Equipment 2,825 2,196 3,160<br />
Intra-dept Charges - PC & Network Support 1,708 1,872 1,659 1,639<br />
Intra-Departmental Charges - Radios 322 322 322 321<br />
Intra-Departmental Charges - Facilities 2,862 3,236 3,236 3,183<br />
Intra-Departmental Charges - IT Operations 2,273 2,393 2,393 2,345<br />
Intra-Departmental Charges/Training Ctr 296 296 296 296<br />
10,653 15,938 13,553 14,029<br />
All Other O&M<br />
Contractual Services 2,276 1,500 1,500 2,500<br />
Office Supplies 2,525 2,500 1,400 1,500<br />
All Other Materials & Supplies 3,747 3,200 1,800 2,000<br />
Uniforms 958 1,000 1,000 1,000<br />
Repair Of Equipment 420 750<br />
Subscription & Membership 360 750 750 750<br />
Travel 490 250 250 250<br />
Training 200 300 300 300<br />
All Other Sundry Charges 37 300 250 250<br />
Ad Valorem Taxes 3,718 4,000 4,000 4,000<br />
14,731 14,550 11,250 12,550<br />
Sub-Total 155,859 145,958 131,100 148,891<br />
E – 150
PARKING<br />
Experience Budget Projected Proposed<br />
For Year For Year For Year For Year<br />
2008 2009 2009 <strong>2010</strong><br />
ORANGE STREET GARAGE<br />
Personal Services 50,733 67,930 56,768 42,637<br />
Inter-<strong>City</strong> Services<br />
Rental-Fleet Mgmt Equipment 941 1,205 1,123 941<br />
Gasoline-Fleet Mgmt Equipment 223 1,151 53 145<br />
Maintenance-Fleet Mgmt Equipment 739 876 1,894 1,230<br />
Intra-Departmental Charges - Telephone 270 311 270 532<br />
Intra-Departmental Charges - Facilities 6,911 5,459 5,459 5,371<br />
9,084 9,002 8,799 8,219<br />
All Other O&M<br />
Contractual Services 500 500 500<br />
Equipment - Noncapital 50 50 50<br />
All Other Materials & Supplies 1,069 1,500 1,040 1,500<br />
Uniforms 410 500 240 500<br />
Repair Of Equipment 100 100 100<br />
Telephone, Communications 2,200 700 987<br />
All Other Sundry Charges 100 100 100<br />
Ad Valorem Taxes 3,950 4,000 4,000 4,000<br />
7,629 7,450 7,017 6,750<br />
Sub-Total 67,446 84,382 72,584 57,606<br />
IOWA AVENUE GARAGE<br />
Personal Services 66,804 68,515 43,388 18,277<br />
Inter-<strong>City</strong> Services<br />
Intra-Departmental Charges - Facilities 3,529 3,989 3,989 3,925<br />
All Other O&M<br />
Contractual Services 500 500 500<br />
All Other Materials & Supplies 250 250 250<br />
Uniforms 111 500 250 250<br />
111 1,250 1,000 1,000<br />
Allocations<br />
Cost Allocated- Electric (70,444) (73,754) (48,377) (23,202)<br />
Sub-Total<br />
E – 151
PARKING<br />
Experience Budget Projected Proposed<br />
For Year For Year For Year For Year<br />
2008 2009 2009 <strong>2010</strong><br />
PARKING ENFORCEMENT<br />
Personal Services 88,944 92,643 83,650 98,101<br />
Inter-<strong>City</strong> Services<br />
Rental-Fleet Mgmt Equipment 929 1,246<br />
Maintenance-Fleet Mgmt Equipment 264 959<br />
1,193 2,205<br />
All Other O&M<br />
Contractual Services<br />
Agency Commission 1,857 600<br />
Office Supplies 190 300 300 300<br />
Uniforms 582 600 300 600<br />
Repair Of Equipment 90 200 200<br />
Printing & Photography 3,134 3,500 500 3,500<br />
Leases 25,560 25,560 25,560<br />
31,413 30,160 27,260 4,600<br />
Sub-Total 121,550 125,008 110,910 102,701<br />
STATE GARAGE<br />
Personal Services 24,507 16,724 14,994 18,277<br />
All Other O&M<br />
Uniforms 238<br />
Leases 18,000 18,000 18,000<br />
18,238 18,000 18,000<br />
Sub-Total 42,745 34,724 32,994 18,277<br />
OTHER CASH DISBURSEMENTS<br />
Insurance<br />
Insurance - Fire 21,866 28,550 22,901 26,344<br />
Insurance - Position Bond 43 43 43<br />
Self-Insurance Services 10,901 9,620 9,620 10,813<br />
32,767 38,213 32,564 37,200<br />
Utilities<br />
Water Utility Service 5,778 5,744 6,921 7,059<br />
Stormwater Utility Fees 3,117 3,071 4,218 4,218<br />
Electric Utility Service 94,679 109,165 96,773 78,773<br />
Wastewater Services 4,418 4,859 4,922 5,340<br />
Interdepartmental Solid Waste Service 1,250 1,250 1,250 1,250<br />
109,243 124,089 114,084 96,640<br />
E – 152
PARKING<br />
Experience Budget Projected Proposed<br />
For Year For Year For Year For Year<br />
2008 2009 2009 <strong>2010</strong><br />
Inter-<strong>City</strong> Services<br />
Purchasing & Stores Service 1,258 1,324 1,324 1,324<br />
General Fund Services 117,897 131,789 131,789 138,646<br />
119,155 133,113 133,113 139,970<br />
All Other O&M<br />
Banking Service 646 650 650 650<br />
Insurance Consultant 530 198 226 330<br />
Annual Audit 3,090 2,000 2,157 2,222<br />
Bad Debt Expense 721 500<br />
4,987 2,848 3,533 3,202<br />
Sub-Total 266,152 298,263 283,294 277,012<br />
Projects<br />
Security Cameras - Main St Garage 9,248<br />
Deck Coating Sealant - Main St Garage 5,632 111,357 111,357<br />
Gate Replacement - Main St Garage 23,623<br />
Exterior Coating - Main St. Garage 115,000<br />
Parking Garage Structural Inspection 5,500 10,000<br />
Deck Coating Sealant - Orange St Garage 5,625 264,114 264,114<br />
Garage Elevator Repair - Orange St Garage 75,124 65,934<br />
Store Front Window Replacement - Iowa Street Garage 7,000<br />
Munn Park - Parking Lot Resurfacing 7,247 7,247<br />
Lighting Retr<strong>of</strong>it - Main and Orange Street Garage 173,000<br />
34,880 479,590 448,652 298,000<br />
Debt Service<br />
Verizon Property Purchase 88,933 88,933 88,933 88,933<br />
88,933 88,933 88,933 88,933<br />
Transfers To Other Funds<br />
Radio System Expansion - Public Safety 735 735 735 735<br />
PIF - Heritage Town Center - Training Center 230<br />
735 735 735 965<br />
GRAND TOTAL 778,300 1,257,593 1,169,202 992,385<br />
E – 153
THIS PAGE IS INTENTIONALLY BLANK<br />
E – 154
REVENUE AND EXPENDITURE SUMMARY<br />
THE LAKELAND CENTER<br />
Experience Budget Experience 2009-10<br />
For Year For Year 2008-09 Proposed by<br />
EXPENSES 2007-08 2008-09 Estimated <strong>City</strong> Manager<br />
Personnel<br />
Salaries and Wages 2,343,896 2,619,862 2,443,085 2,486,043<br />
Fringe Benefits 542,178 494,467 487,703 550,453<br />
Total Personnel 2,886,073 3,114,329 2,930,788 3,036,496<br />
Non-Personnel<br />
Internal Service Charges 606,684 624,461 618,780 715,147<br />
Pr<strong>of</strong>essional and Contractual 2,041,220 1,277,428 1,355,553 1,279,166<br />
Utilities 939,350 1,056,189 791,419 1,062,732<br />
Insurance and Fixed Charges 114,121 112,244 113,087 124,294<br />
All Other Operations and Maintenance 818,441 841,215 732,963 707,784<br />
Capital Outlay 364,133 794,231 794,231 363,152<br />
Debt Service 1,410,590 1,406,376 1,406,375 1,400,776<br />
Total Non-Personnel 6,294,539 6,112,144 5,812,409 5,653,051<br />
Total Expenditures 9,180,612 9,226,473 8,743,197 8,689,547<br />
Transfers<br />
Transfers In 3,039,861 3,213,075 3,213,075 2,888,052<br />
Transfers Out (4,233)<br />
Net Transfers 3,039,861 3,213,075 3,213,075 2,883,819<br />
Revenue Sources<br />
Taxes<br />
Licenses and Permits<br />
Intergovernmental 503,410 506,004 494,004 494,004<br />
Charges for Services 5,227,989 5,918,071 5,286,667 5,330,820<br />
Interest Income 30,690 43,100 39,900 39,900<br />
All Other Revenue 78,137 35,000 105,894 5,000<br />
Total Revenue 5,840,225 6,502,175 5,926,465 5,869,724<br />
Funding to be Provided 300,526 (488,777) (396,343) (63,997)<br />
E – 155
THE LAKELAND CENTER<br />
Experience Budget Projected Proposed<br />
For Year For Year For Year For Year<br />
2008 2009 2009 <strong>2010</strong><br />
State Revenue Sharing<br />
Tourist Development Tax 440,004 440,004 440,004 440,004<br />
Local Grants<br />
PCCVB-Visitor Information Office 17,000 17,000<br />
PCCVB-Reimbursement <strong>of</strong> Expenses 46,406 49,000 54,000 54,000<br />
63,406 66,000 54,000 54,000<br />
Other Miscellaneous Revenue<br />
All Other Reimbursements & Recoveries 1,965<br />
Arena Scoreboard Contributions 25,000 10,000 5,000 5,000<br />
Arena Improvements Contributions 50,000 25,000 100,000<br />
Insurance Proceeds - Workers Comp Claims 894<br />
76,965 35,000 105,894 5,000<br />
Charges for Services<br />
Commissions 35,685 89,031 81,123 82,000<br />
Conference Hall 209,116 273,965 249,535 288,028<br />
Exhibit Hall 114,484 201,509 154,918 171,392<br />
Arena 320,444 365,969 391,598 404,380<br />
Theater 252,589 270,490 287,242 276,675<br />
Catering 163,869 194,207 155,676 158,800<br />
Concessions 248,302 226,957 240,853 245,700<br />
Beverage Sales 56,797 64,805 65,885 67,300<br />
Program Sales 42,374 34,212 46,188 47,200<br />
Set Up Charges 47,523 10,000 22,000 22,500<br />
Forfeited Deposits 17,169 12,000 19,987 20,400<br />
Vending Machines & Sales 10,019 6,000 10,921 11,200<br />
Facility Surcharge & Service Charge 148,914 142,385 150,819 157,950<br />
Box Office Charges 6,793 21,358 11,601 12,150<br />
Net Income/Loss on Promotion (639,975) 50,000 (200,000) (200,000)<br />
Payroll Recovery - Other 1,016,768 1,121,878 1,047,271 1,068,300<br />
Ticket Recovery 28,935 28,477 27,070 28,350<br />
All Other Fixed Revenue 76,571 75,000 40,561 40,000<br />
State Sales Tax Collection Fee - Client Services 360 360 360 400<br />
State Sales Tax Collection Fee - Box Office 270 281 270 270<br />
Equipment Rental & Misc Supply 342,847 325,000 284,094 289,800<br />
Telephone Charges-Long Dist 2,996 3,413 3,000 3,100<br />
Telephone Charges-Equipment 26,305 17,751 27,754 28,400<br />
Products For Resale 8,868 8,500 100 200<br />
Personal Food Service Recovery 86,487 110,000 45,627 46,600<br />
Contract Labor Revenue 260,314 335,106 174,915 178,500<br />
Piano Tuner 1,645 1,000 757 800<br />
Advertising Charges 453,317 406,000 363,835 371,200<br />
E – 156
THE LAKELAND CENTER<br />
Experience Budget Projected Proposed<br />
For Year For Year For Year For Year<br />
2008 2009 2009 <strong>2010</strong><br />
TM Ticket Commissions 11,913 11,000 14,500 14,500<br />
Talent Fees - Promotions 1,018,329 563,000 638,000 563,000<br />
Parking 459,303 580,500 640,920 632,100<br />
Energy and Utility Hookup 80,732 47,273 67,815 69,200<br />
Packaging and Shipping - Client Services 8,782 6,848 6,587 6,800<br />
Packaging and Shipping - Box Office 27,519 21,358 14,180 14,850<br />
Over Sized Vehicle Parking 10,856 16,830 16,812 16,830<br />
Overnight Parking 9,872 5,608 12,703 14,020<br />
Pre-Paid Parking 261,443 270,000 171,333 177,926<br />
Cash Over And Short (545) (142)<br />
5,227,989 5,918,071 5,286,667 5,330,820<br />
Investment Income<br />
Interest From S.B.A:<br />
03A Utility Tax Reserve 2,309 7,500<br />
03A TDT Reserve 5,468 15,500<br />
Interest on Pooled Investments:<br />
Operations (5,103) 4,100 20,000 20,000<br />
03A Utility Tax Sinking 20,525 9,500 9,500 9,500<br />
03C TDT Sinking Fund 10,389 6,500 5,800 5,800<br />
Interest on Money Market Account:<br />
03A Utility Tax Reserve 3,658 1,100 1,100<br />
03A TDT Reserve 8,661 3,500 3,500<br />
Market Value Restatement:<br />
Operations (1,822)<br />
03A Utility Tax Sinking (8,932)<br />
03C TDT Sinking Fund (4,464)<br />
30,690 43,100 39,900 39,900<br />
Transfers from Other Fund<br />
Transfer from General Fund - Operating 1,253,908 1,381,472 1,381,472 1,372,180<br />
Transfer from General Fund - UT Debt Service Sk 914,317 903,253 903,253 904,553<br />
Transfer from General Fund - TDT Debt Service Sk 24,563 24,119 24,119 36,319<br />
Transfer from Public Improvement Fund - Operating 500,000 225,000 225,000 225,000<br />
Transfer from Public Improvement Fund - Projects 347,072 679,231 679,231 350,000<br />
Transfer from Information Technology 1,172<br />
Transfer from UT Debt Service Reserve Fund-Interest 5,967 7,500 1,100 1,100<br />
Transfer from TDT Debt Service Reserve Fund-Interest 14,130 15,500 3,500 3,500<br />
3,061,129 3,236,075 3,217,675 2,892,652<br />
SUB - TOTAL 8,900,182 9,738,250 9,144,140 8,762,376<br />
PRIOR YEAR SURPLUS 300,526 (488,777) (396,343) (63,997)<br />
TOTAL REVENUES 9,200,709 9,249,473 8,747,797 8,698,380<br />
E – 157
EXPENSES<br />
THE LAKELAND CENTER<br />
Experience Budget Projected Proposed<br />
For Year For Year For Year For Year<br />
2008 2009 2009 <strong>2010</strong><br />
ADMINISTRATION<br />
Personal Services 840,547 721,815 770,998 795,946<br />
Insurance<br />
Uninsured Loss Reimbursement 250<br />
Insurance - Fire 44,086 48,940 49,986 58,332<br />
Insurance - Position Bond 203 203<br />
44,336 49,143 49,986 58,535<br />
Inter-<strong>City</strong> Services<br />
Rental-Fleet Mgmt Equipment 1,609 1,778 1,778 1,609<br />
Gasoline-Fleet Mgmt Equipment 1,530 1,726 1,048 1,839<br />
Maintenance-Fleet Mgmt Equipment 1,180 1,529 1,529 1,968<br />
Intra-dept Charges - PC & Network Support 64,252 61,070 62,650 63,121<br />
Intra-Departmental Charges - Telephone 36,130 41,767 34,000 48,388<br />
Intra-Departmental Charges - Facilities 18,659 18,659 19,134<br />
Intra-Departmental Charges - IT Operations 21,867 23,018 23,018 22,558<br />
Intra-Departmental Charges/Training Ctr 1,922 1,922 961 1,922<br />
128,490 151,469 143,643 160,539<br />
All Other O&M<br />
Contractual Services 2,983 659 1,635 500<br />
Banking Service 1,563 1,572 1,320 1,572<br />
Insurance Consultant 1,897 1,922 1,922 2,147<br />
Advertising 300 100 100<br />
Annual Audit 6,514 2,945 3,770 3,770<br />
Promotions/Public Relations 41 500 500<br />
Paying Agent, Trustee Fees 2,400 3,400 3,400 3,400<br />
Office Supplies 8,897 9,000 13,000 9,000<br />
Equipment - Noncapital 505<br />
Leases 2,563 1,637 3,276 2,700<br />
Rentals 402 500 879 500<br />
Repair Of Equipment 1,319 1,500 1,526 1,500<br />
Printing & Photography 2,809 2,585 4,000 4,000<br />
Postage & Mailing 3,235 5,350 5,350 5,350<br />
Subscription & Membership 5,111 5,334 5,334 5,334<br />
Telephone, Communications 10,008 11,324 11,324 11,324<br />
Travel 9,754 6,556 7,000 6,556<br />
Training 1,780 105<br />
All Other Sundry Charges 1,122 853 1,288 853<br />
S<strong>of</strong>tware License & Maintenance 12,938 16,000 11,036 17,000<br />
Telephone-Long Distance 577 2,197 2,197 2,197<br />
Licenses & Permits 1,839 360 360 360<br />
Sales Expenses 17,827 17,000 17,000 17,000<br />
Marketing Committee-<strong>Lakeland</strong> Center 46,415 33,750 33,750 33,750<br />
PCCVB-Reimbursable Expenses 42,406 52,915 54,000 54,000<br />
PCCVB-Visitor Information Office 17,000 17,000<br />
202,205 194,959 183,472 183,413<br />
SUB-TOTAL 1,215,577 1,117,386 1,148,099 1,198,433<br />
E – 158
THE LAKELAND CENTER<br />
Experience Budget Projected Proposed<br />
For Year For Year For Year For Year<br />
2008 2009 2009 <strong>2010</strong><br />
PROPERTY<br />
Personal Services 602,998 948,199 660,618 740,373<br />
Inter-<strong>City</strong> Services<br />
Rental-Fleet Mgmt Equipment 1,401 1,573 1,573 1,401<br />
Gasoline-Fleet Mgmt Equipment 1,910 1,504 1,504 3,027<br />
Maintenance-Fleet Mgmt Equipment 3,529 1,088 3,700 3,446<br />
Intra-Departmental Charges - Radios 300 300 321<br />
6,841 4,465 7,077 8,195<br />
All Other O&M<br />
Contractual Services 39,806 44,506 44,506 44,506<br />
Contract Labor 13,076 6,000 6,000 6,000<br />
Office Supplies 2,322 500 1,000 500<br />
Equipment - Noncapital 10,178 6,775 5,000<br />
All Other Materials & Supplies 26,998 21,000 32,000 21,000<br />
Uniforms 4,619 3,000 3,000 3,000<br />
Cleaning & Janitor Supply 52,250 53,000 53,000 53,000<br />
Paints & Paint Supplies 6,008 10,000 10,000 10,000<br />
Tools & Implements 3,164 4,200 4,200 4,200<br />
Electrical, Hardware & Plumbing Supplies 63,370 70,000 70,000 70,000<br />
Auto/Heavy Equipment Fuel 7,438 7,500 7,500 7,500<br />
Rentals 14,186 3,500 3,500 3,500<br />
Maintenance Of Facilities 96,175 120,000 120,000 96,000<br />
Repair Of Equipment 42,190 35,000 35,000 35,000<br />
Postage & Mailing 435 300<br />
Telephone, Communications 4,520 4,500 4,500 4,500<br />
Travel 34 125<br />
Training 175 1,000 1,000 1,000<br />
386,942 383,706 402,406 364,706<br />
SUB-TOTAL 996,780 1,336,370 1,070,101 1,113,274<br />
E – 159
THE LAKELAND CENTER<br />
Experience Budget Projected Proposed<br />
For Year For Year For Year For Year<br />
2008 2009 2009 <strong>2010</strong><br />
CLIENT SERVICES<br />
Personal Services 1,105,644 1,137,014 1,170,916 1,171,533<br />
All Other O&M<br />
Contractual Services 9,166 1,000 1,000<br />
Contractual Services - Non-Billable Expenses 696<br />
Advertising 518,530 349,950 359,000 349,950<br />
Advertising - Non-Billable Expenses 50 50 50<br />
Piano Tuner 1,490 1,000 600 1,000<br />
Talent Fees-Promotions 1,018,202 563,000 638,000 563,000<br />
Talent Fees-Promotions - Non-Billable Expenses 2,000 2,000 2,000<br />
Visa/MasterCard Bank Charges 13,551 13,260 9,940 13,260<br />
Contract Labor 343,309 225,000 225,000 225,000<br />
Contract Labor - Non-Billable Expenses 462<br />
Costs <strong>of</strong> Goods Sold 2,247 315 315 315<br />
Office Supplies 7,199 3,685 2,000 3,685<br />
Uniforms 588 1,500 500 1,500<br />
Food Purchases 89,003 105,208 49,000 47,532<br />
Rentals 46,245 78,563 40,000 50,000<br />
Repair Of Equipment 1,164 3,500 1,164<br />
Printing & Photography 40,291 36,404 48,000 36,404<br />
Printing & Photography - Non-Billable Expenses 600 596 600 596<br />
Postage & Mailing 22,183 15,000 18,000 15,000<br />
Travel 36,986 28,537 18,000 14,000<br />
Travel - Non-Billable Expenses 117 1,463 1,463 1,463<br />
Licenses & Permits 5,102 188 5,527 188<br />
Other Reimbursable Event Costs 26,634 25,000 7,000 25,000<br />
Bad Debt Expense 6,932 5,000 5,000<br />
2,191,533 1,457,883 1,426,495 1,357,107<br />
SUB-TOTAL 3,297,177 2,594,897 2,597,410 2,528,640<br />
E – 160
THE LAKELAND CENTER<br />
Experience Budget Projected Proposed<br />
For Year For Year For Year For Year<br />
2008 2009 2009 <strong>2010</strong><br />
PARKING<br />
Personal Services 180,487 133,916 174,500 171,286<br />
All Other O&M<br />
Office Supplies 2,139 1,500 547 500<br />
All Other Materials & Supplies 49 3,000 114 3,000<br />
Uniforms 82 2,000 1,500 500<br />
Repair Of Equipment 1,638 4,500 1,385 5,000<br />
Printing & Photography 5,206 3,900 3,900 4,000<br />
All Other Sundry Charges 500 100 500<br />
9,114 15,400 7,546 13,500<br />
SUB-TOTAL 189,601 149,316 182,046 184,786<br />
BOX OFFICE<br />
Personal Services 156,398 173,385 153,757 157,357<br />
All Other O&M<br />
Contractual Services 3,223 3,096 3,096 3,096<br />
Visa/MasterCard Bank Charges 59,765 57,153 57,000 58,000<br />
Office Supplies 4,055 5,000 5,000 5,000<br />
Uniforms 750 750<br />
Leases 254 1,100<br />
Repair Of Equipment 1,236 1,300 1,300 1,000<br />
Printing & Photography 133<br />
Postage & Mailing 1,230 1,605 1,605 1,750<br />
Subscription & Membership 300 300 350<br />
Travel 700 700 700<br />
Ticket Commissions- $0.10 3,310 1,847 2,289 2,398<br />
Other Reimbursable Event Costs 4,454 2,000 2,000 1,457<br />
77,659 74,851 74,040 73,751<br />
SUB-TOTAL 234,056 248,236 227,797 231,108<br />
E – 161
THE LAKELAND CENTER<br />
Experience Budget Projected Proposed<br />
For Year For Year For Year For Year<br />
2008 2009 2009 <strong>2010</strong><br />
COMMUNICATIONS<br />
Inter-<strong>City</strong> Services<br />
Intra-Departmental Charges - Telephone 4,622 5,318 4,851 5,318<br />
All Other O&M<br />
TLC Communications - Other Costs 7,294 3,715 7,656 7,656<br />
Telephone, Communications (207) 2,806 1,200 1,200<br />
Telephone-Long Distance 886 636 720 636<br />
7,974 7,157 9,576 9,492<br />
SUB-TOTAL 12,596 12,475 14,427 14,810<br />
NON-DEPARTMENTAL<br />
Utilities<br />
Water Utility Service 30,943 30,905 34,713 36,293<br />
Storm water Utility Fees 13,111 12,488 18,312 18,312<br />
Electric Utility Service 821,982 936,214 669,459 936,214<br />
Wastewater Services 33,447 35,516 31,061 34,039<br />
Interdepartmental Solid Waste Service 18,253 18,721 13,194 13,194<br />
917,735 1,033,844 766,739 1,038,052<br />
Insurance<br />
Self-Insurance Services 69,785 63,101 63,101 65,759<br />
Inter-<strong>City</strong> Services<br />
Purchasing & Stores Service 10,788 11,356 11,356 11,356<br />
General Fund Services 455,943 451,853 451,853 529,739<br />
466,731 463,209 463,209 541,095<br />
All Other O&M<br />
Rentals 5,850 7,032 9,662 9,662<br />
Capital Equipment<br />
Equipment - Capital 1,435<br />
SUB-TOTAL 1,461,536 1,567,186 1,302,711 1,654,568<br />
E – 162
THE LAKELAND CENTER<br />
Experience Budget Projected Proposed<br />
For Year For Year For Year For Year<br />
2008 2009 2009 <strong>2010</strong><br />
Projects<br />
<strong>Lakeland</strong> Center Capital Contingency 108,991 103,991 350,000<br />
Theatre Sound Equipment Upgrade 86,000 86,000<br />
Exhibit Hall & Sikes Hall Wall Covering 27,100<br />
Upgrade CCTV System 52,918 4,937 4,937<br />
Fixtures & Equipment 10,740 43,993 43,993<br />
TLC - Cooling Towers 269,310 269,310<br />
Sound Board 4,355<br />
Restroom Partitions 26,054<br />
Super Trouper Spotlight Rebuild 15,574<br />
Sikes Ro<strong>of</strong> Replacement 200,000 200,000<br />
Wireless Customer Network 5,000<br />
Resurfacing <strong>of</strong> Parking Lots 220,533 81,000 81,000<br />
Electronic Gate Operator for Parking Lots 5,425<br />
362,699 794,231 794,231 350,000<br />
Debt Service<br />
Interest Expense - 03A UT 266,878 250,253 250,253 230,153<br />
Interest Expense - 03C TD 144,623 136,123 136,123 125,623<br />
Capitalized Interest Expense (5,910)<br />
Principal Retirement - 03A UT 665,000 670,000 670,000 685,000<br />
Principal Retirement - 03C TD 340,000 350,000 350,000 360,000<br />
1,410,590 1,406,376 1,406,375 1,400,776<br />
Transfers To Other Funds<br />
DOIT - Voice Over IP 13,152<br />
PIF - Heritage Town Center - Training Center 4,233<br />
Transfer to UT Sinking Fund - Interest 5,967 7,500 1,100 1,100<br />
Transfer to TDT Sinking Fund - Interest 14,130 15,500 3,500 3,500<br />
20,097 23,000 4,600 21,985<br />
GRAND TOTAL 9,200,709 9,249,473 8,747,797 8,698,380<br />
E – 163
THIS PAGE IS INTENTIONALLY BLANK<br />
E – 164
REVENUE AND EXPENDITURE SUMMARY<br />
CLEVELAND HEIGHTS GOLF COURSE<br />
Experience Budget Experience 2009-10<br />
For Year For Year 2008-09 Proposed by<br />
EXPENSES 2007-08 2008-09 Estimated <strong>City</strong> Manager<br />
Personnel<br />
Salaries and Wages 816,797 798,077 741,477 786,468<br />
Fringe Benefits 232,750 198,937 180,782 209,456<br />
Total Personnel 1,049,547 997,014 922,259 995,924<br />
Non-Personnel<br />
Internal Service Charges 373,417 330,932 319,748 335,197<br />
Pr<strong>of</strong>essional and Contractual 101,390 89,823 83,365 93,790<br />
Utilities 158,016 162,489 152,137 171,088<br />
Insurance and Fixed Charges 36,542 27,464 26,290 33,830<br />
All Other Operations and Maintenance 667,291 712,609 669,267 696,282<br />
Capital Outlay 16,696 148,166 48,166<br />
Debt Service 414,209 300,209 299,362 300,209<br />
Total Non-Personnel 1,767,560 1,771,692 1,598,335 1,630,396<br />
Total Expenditures 2,817,107 2,768,706 2,520,594 2,626,320<br />
Transfers<br />
Transfers In 240,000 325,000 325,000 200,000<br />
Transfers Out (1,472)<br />
Net Transfers 240,000 325,000 325,000 198,528<br />
Revenue Sources<br />
Taxes<br />
Licenses and Permits<br />
Intergovernmental<br />
Charges for Services 2,364,528 2,661,825 2,182,500 2,379,000<br />
Interest Income 4,861 3,000 5,000 3,000<br />
All Other Revenue 137,092 50,300 72,126 36,550<br />
Total Revenue 2,506,480 2,715,125 2,259,626 2,418,550<br />
Funding to be Provided 70,627 (271,419) (64,032) 9,242<br />
E – 165
CLEVELAND HEIGHTS GOLF COURSE<br />
Experience Budget Projected Proposed<br />
For Year For Year For Year For Year<br />
2008 2009 2009 <strong>2010</strong><br />
REVENUES<br />
Other Miscellaneous Revenue<br />
Surplus Furniture & Equipment Sales 1,283<br />
Contributions & Donations 6,000<br />
Insurance Proceeds - Workers Comp Claims 477<br />
All Other Misc Revenue 95,323 21,000 17,000 10,250<br />
Refund <strong>of</strong> Prior Year Expenses 211<br />
Reimbursements / Loss Recovery 710<br />
103,793 21,000 26,391 10,250<br />
Charges for Services<br />
Cart Fees 1,055,307 1,168,000 991,000 1,095,000<br />
Green Fees 45,736 46,000 25,000 40,000<br />
Range Fees 23,390 28,000 22,000 30,000<br />
Program Activity Fees - Golf Clinic 6,000<br />
Membership Dues 238,564 255,000 217,000 250,000<br />
Food Sales 433,119 524,275 479,000 515,000<br />
Summer Memberships 5,000<br />
Merchandise Sales 159,519 175,000 130,000 140,000<br />
Tournament Fees 137,031 162,000 77,000 50,000<br />
Facility Rentals 20,479 26,400 11,500 10,000<br />
Beverage Sales - Beer 115,484 127,000 114,000 120,000<br />
Beverage Sales - Liquor 119,527 121,150 106,500 120,000<br />
Beverage Sales - Wine 16,371 18,000 9,500 9,000<br />
Cash Over And Short 8,240 5,000 1,900 2,000<br />
2,372,768 2,666,825 2,184,400 2,381,000<br />
Rental <strong>of</strong> Buildings<br />
Alltel Tower Rent 25,029 24,300 43,780 24,300<br />
Fines and Forfiets<br />
Bad Check Charges 30 55<br />
Investment Income<br />
Interest on Pooled Investments 2,269 3,000 5,000 3,000<br />
Market Value Restatement 2,592<br />
4,861 3,000 5,000 3,000<br />
Transfers from Other Fund<br />
Transfer from Public Improvement Fund 240,000 325,000 325,000 200,000<br />
SUB-TOTAL 2,746,480 3,040,125 2,584,626 2,618,550<br />
PRIOR YEAR SURPLUS 70,627 (271,419) (64,032) 9,242<br />
TOTAL REVENUES 2,817,107 2,768,706 2,520,594 2,627,792<br />
E – 166
EXPENSES<br />
CLEVELAND HEIGHTS GOLF COURSE<br />
Experience Budget Projected Proposed<br />
For Year For Year For Year For Year<br />
2008 2009 2009 <strong>2010</strong><br />
ADMINISTRATION<br />
Personal Services 211,050 169,502 150,244 172,537<br />
Insurance<br />
Insurance - Fire 6,683 3,181 2,618 8,826<br />
Insurance - Position Bond 111 111<br />
Self-Insurance Services 29,003 23,672 23,672 24,893<br />
35,686 26,964 26,290 33,830<br />
Utilities<br />
Water Utility Service 21,058 22,974 22,250 23,433<br />
Stormwater Utility Fees 6,078 6,078 8,414 8,386<br />
Electric Utility Service 99,174 101,639 91,925 110,210<br />
Wastewater Services 7,414 8,502 7,711 6,422<br />
Interdepartmental Solid Waste Service 16,988 16,796 16,637 16,637<br />
150,712 155,989 146,937 165,088<br />
Inter-<strong>City</strong> Services<br />
Purchasing & Stores Service 12,169 12,810 12,810 12,810<br />
General Fund Services 238,140 189,348 189,348 190,579<br />
Intra-dept Charges - PC & Network Support 13,679 13,641 13,717 13,379<br />
Intra-Departmental Charges - Facilities 38,631 36,832 36,832 36,236<br />
Intra-Departmental Charges - Janitorial 20,759 22,403 22,403 23,025<br />
Intra-Departmental Charges - Radios 1,285 1,285<br />
Intra-Departmental Charges - IT Operations 9,935 10,458 10,458 10,249<br />
Intra-Departmental Charges/Training Ctr 1,084 1,084 1,084 1,084<br />
334,397 286,576 287,937 288,647<br />
All Other O&M<br />
Contractual Services 3,459 5,750 3,460 5,750<br />
Banking Service 28,942 26,000 28,950 30,000<br />
Pr<strong>of</strong>essional Services 7,144 4,862 5,000<br />
Insurance Consultant 607 601 661 600<br />
Advertising 10,255 11,000 11,000 10,000<br />
Annual Audit 7,037 3,170 3,994 4,000<br />
Office Supplies 2,681 3,000 3,000 3,000<br />
All Other Materials & Supplies 6,393 3,000 3,700 3,000<br />
Parts For Equipment 256<br />
Repair Of Equipment 446 500 500 500<br />
Printing & Photography 2,371 3,400 1,800 2,000<br />
Postage & Mailing 104 500 200 250<br />
Subscription & Membership 1,135 5,496 5,646 5,500<br />
Telephone, Communications 6,437 5,800 4,500 5,000<br />
Bad Checks 130 130 200<br />
Training 1,235 813 1,000 1,000<br />
78,632 74,022 68,611 75,600<br />
Capital Equipment<br />
Equipment - Capital 4,500<br />
Transfers to Other Funds<br />
PIF - Heritage Town Center - Training Center 1,472<br />
SUB-TOTAL 814,977 713,053 680,019 737,174<br />
1,472<br />
E – 167
CLEVELAND HEIGHTS GOLF COURSE<br />
Experience Budget Projected Proposed<br />
For Year For Year For Year For Year<br />
2008 2009 2009 <strong>2010</strong><br />
COURSE OPERATIONS<br />
Personal Services 182,223 180,779 158,023 161,828<br />
Insurance<br />
Uninsured Loss Reimbursement 856 500<br />
All Other O&M<br />
Contractual Services 7,881 7,500 6,500 7,500<br />
All Other Materials & Supplies 1,919 1,100 1,000 500<br />
Merchandise 122,013 131,250 110,000 110,000<br />
Tires & Tubes 2,000 250 1,000<br />
Parts For Equipment 318 461 661 1,500<br />
Increase/Decrease In Inventory (6,986)<br />
Leases 6,470 77,650 77,650 77,650<br />
Repair Of Equipment 2,477 2,514 1,000 2,000<br />
Printing & Photography 222 500 280 300<br />
Postage & Mailing 19 100<br />
Subscription & Membership 25 25 100<br />
Telephone, Communications 867 700 700 1,000<br />
Tournament Expenses 862 2,000 1,150 1,594<br />
Capital Equipment<br />
Equipment - Capital<br />
136,061 225,700 199,216 203,244<br />
SUB-TOTAL 319,141 406,979 357,239 365,072<br />
E – 168
CLEVELAND HEIGHTS GOLF COURSE<br />
Experience Budget Projected Proposed<br />
For Year For Year For Year For Year<br />
2008 2009 2009 <strong>2010</strong><br />
COURSE MAINTENANCE<br />
Personal Services 351,999 373,908 336,971 380,736<br />
Inter-<strong>City</strong> Services<br />
Rental-Fleet Mgmt Equipment 8,718 9,311 9,311 10,551<br />
Gasoline-Fleet Mgmt Equipment 26,643 22,000 14,000 13,302<br />
Maintenance-Fleet Mgmt Equipment 3,660 13,045 8,500 22,697<br />
39,021 44,356 31,811 46,550<br />
All Other O&M<br />
Contractual Services 10,688 10,300 8,800 10,300<br />
All Other Materials & Supplies 5,872 3,000 2,500 2,500<br />
Uniforms 325 500 500<br />
Chemicals 86,583 56,000 66,000 63,500<br />
Tools & Implements 469 3,000 750 1,000<br />
Electrical, Hardware & Plumbing Supplies 3,267 2,500 500 1,500<br />
Agricultural & Horticultural Supplies 6,813 12,000 3,500 3,000<br />
Parts For Equipment 30,388 30,000 29,000 20,000<br />
Soil and Sand 7,410<br />
Fertilizer 25,349 46,000 53,000 63,038<br />
Leases 1,028 10,000 3,000 5,000<br />
Rentals 3,116 4,675 1,000 1,000<br />
Maintenance <strong>of</strong> Lakes 3,255 5,800 3,720 6,000<br />
184,564 183,775 172,270 176,838<br />
Capital Equipment<br />
Equipment - Capital 2,500 50,000<br />
SUB-TOTAL 578,083 652,039 541,052 604,124<br />
FOOD & BEVERAGE<br />
Personal Services 304,275 272,825 277,021 280,824<br />
All Other O&M<br />
Contractual Services 25,376 20,640 20,000 20,640<br />
All Other Materials & Supplies 3,785 1,500 1,360 1,500<br />
Uniforms 182 221 221 250<br />
Tools & Implements 4,029 3,500 850 1,000<br />
Food Purchases 211,120 183,708 190,000 200,000<br />
Food Purchases - Gosh 16,704<br />
Beverage Purchases - Beer 50,265 48,260 45,000 52,000<br />
Beverage Purchases - Liquor 49,661 52,877 45,000 52,000<br />
Increase/Decrease In Inventory 3,794<br />
Natural Gas Consumption - <strong>City</strong> Facilities 8,494 9,000 13,000 8,000<br />
Repair Of Equipment 392 1,779 319 1,000<br />
Miscellaneous Tax Expense 689 750<br />
Licenses & Permits 2,235 3,200 1,985 4,000<br />
376,727 325,435 317,735 340,390<br />
SUB-TOTAL 681,002 598,260 594,756 621,214<br />
E – 169
CLEVELAND HEIGHTS GOLF COURSE<br />
Experience Budget Projected Proposed<br />
For Year For Year For Year For Year<br />
2008 2009 2009 <strong>2010</strong><br />
Debt Service<br />
Interest Expense-Textron Leases 22,120 (847)<br />
Interest Expense - GE Capital Leases 1,019<br />
Principal Payments-Textron Leases 55,378<br />
Principal Payments - GE Capital 16,916<br />
Capitalized Interest Expense (412)<br />
Driving Range 13,710 13,710 13,710 13,710<br />
Clubhouse 284,355 265,376 265,376 265,376<br />
Restroom Renovations on Golf Course 21,123 21,123 21,123 21,123<br />
414,209 300,209 299,362 300,209<br />
Projects<br />
Repair Cart Paths 902 50,000<br />
Demolition <strong>of</strong> Maintenance Building 8,794 48,166 48,166<br />
9,696 98,166 48,166<br />
GRAND TOTAL 2,817,107 2,768,706 2,520,594 2,627,792<br />
E – 170
REVENUE AND EXPENDITURE SUMMARY<br />
LAKELAND LINDER REGIONAL AIRPORT<br />
Experience Budget Experience 2009-10<br />
For Year For Year 2008-09 Proposed by<br />
EXPENSES 2007-08 2008-09 Estimated <strong>City</strong> Manager<br />
Personnel<br />
Salaries & Wages 1,043,520 1,113,565 1,070,360 655,549<br />
Fringe Benefits 324,641 304,762 281,993 218,777<br />
Total Personnel 1,368,160 1,418,327 1,352,353 874,325<br />
Non-Personnel<br />
Internal Service Charges 477,818 550,303 545,776 578,130<br />
Pr<strong>of</strong>essional & Contractual 345,854 370,339 349,958 366,842<br />
Utilities 357,895 386,271 361,395 427,599<br />
Insurance and Fixed Charges 135,530 160,342 145,807 168,158<br />
All Other Operations and Maintenance 201,596 1,062,931 939,432 589,662<br />
Capital Outlay 545,356 1,639,923 1,331,851 655,970<br />
Debt Service 1,553,050 1,076,824 1,076,824 1,072,823<br />
Total Non-Personnel 3,617,099 5,246,933 4,751,043 3,859,184<br />
Total Expenditures 4,985,260 6,665,260 6,103,396 4,733,509<br />
Transfers<br />
Transfers In<br />
Transfers Out (70,638) (74,263) (73,480) (73,322)<br />
Net Transfers (70,638) (74,263) (73,480) (73,322)<br />
Revenue Sources<br />
Taxes<br />
Licenses & Permits<br />
Intergovernmental 1,047,478 1,406,574 1,095,312 548,023<br />
Charges for Services 3,520,652 3,481,661 3,349,162 3,324,748<br />
Interest Income 130,173 121,500 132,733 50,000<br />
All Other Revenue 63,573 2,500 35,650 62,500<br />
Total Revenue 4,761,877 5,012,235 4,612,857 3,985,271<br />
Funding to be Provided 294,021 1,727,288 1,564,019 821,560<br />
E – 171
LAKELAND LINDER REGIONAL AIRPORT<br />
Experience Budget Projected Proposed<br />
For Year For Year For Year For Year<br />
2008 2009 2009 <strong>2010</strong><br />
REVENUES<br />
Federal Grants<br />
FAA-Air Traffic Controllers 560,755 560,000 560,755<br />
FAA/FDOT Airport Master Plan Update 1,265 188,738 188,738<br />
FAA/FDOT Runway 5-23 Rehabilitation - 2005 4,876 218,971 30,495<br />
FAA/FDOT Realign and Construct Taxiway G - Design 109,526 109,526<br />
566,895 1,077,235 889,514<br />
State Grants<br />
FAA/FDOT Airport Master Plan Update 1,265 4,996 4,996<br />
FDOT - Land Acquisition West <strong>of</strong> Airport 344,823 147,158 5,425<br />
FAA/FDOT Runway 5-23 Rehabilitation - 2005 4,876 12,303 30,495<br />
FDOT-Airport Perimeter Fencing 23,242<br />
FDOT-Gates & Bldg Access Control System, Ph I & II 54,400 50,000 50,000<br />
Construct ATC Facility Site Study 32,000 32,000<br />
FDOT Construct APRON; Terminal Ramp Expansion 51,977 148,023<br />
FDOT Install Taxiway Lighting System South Section 80,000 80,000<br />
FAA/FDOT Realign and Construct Taxiway G - Design 2,882 2,882<br />
FDOT ARFF Vehicle 200,000<br />
FDOT Install AWOS 200,000<br />
480,583 329,339 205,798 548,023<br />
Other Miscellaneous Revenue<br />
All Other Misc Revenue 27,556 2,500 26,138 62,500<br />
Refund <strong>of</strong> Prior Year Expenses 9,512<br />
Reimbursements / Loss Recovery 1,230<br />
Prior Years Revenue 28,287<br />
Airpark Land Sale - Phase I 6,500<br />
Miscellaneous Storage 2,972 10,000 8,536 10,000<br />
66,545 12,500 44,186 72,500<br />
Charges for Services<br />
Gasoline Sales 84,433 93,000 61,429 75,000<br />
All Other Airport Revenue 3,515 3,000 3,000<br />
Sun 'N Fun Service Charge 9,000 9,000 9,000 20,000<br />
Concessions 11,819 10,800 7,999 11,000<br />
Driving Courses 600<br />
108,766 116,400 78,428 109,000<br />
E – 172
LAKELAND LINDER REGIONAL AIRPORT<br />
Experience Budget Projected Proposed<br />
For Year For Year For Year For Year<br />
2008 2009 2009 <strong>2010</strong><br />
Rental <strong>of</strong> Buildings<br />
Buildings-Miscellaneous Office 6,694<br />
Building Leases - Other 208,205 216,000 220,000 220,000<br />
Building Leases - Other 5,535 10,000 2,240 10,000<br />
Building Lease - Dayjet 11,000 12,000<br />
Columbia 46,082 47,172 19,606<br />
3610 Drane Field 43,200<br />
S & S Development 239,090 256,055 256,000 259,980<br />
CDG Management 104,149 77,184 38,592<br />
John J Jerue Truck Broker Inc 140,384 137,457 122,103 75,000<br />
All Wood Cabinetry LLC 139,729 76,216<br />
3515 Aviation Drive 225,000 225,000 225,000<br />
3330 Flightline-<strong>Lakeland</strong> Electric- Kidron Bld 91,800 91,800 91,800 91,800<br />
POD's 43,863 105,270<br />
Neighborhood Svcs-Housing 9,203 4,086<br />
955,789 1,113,810 1,089,448 1,045,248<br />
Land Leases<br />
Lease - Champagne Investments LLC 6,858 6,995 6,930 7,170<br />
Lease-JBS Equities LLC 20,011 20,500 21,047 21,047<br />
Lease - Publix-3505 Aviation Drive 10,065 10,160 10,377 10,364<br />
Lease - Everett 1,904<br />
Lease - Gulf Coast Aviation 194,948 209,000 205,104 215,260<br />
Lease - Knight Aviation 6,758 6,780 6,912 6,916<br />
Lease - JRW Company 1,632 1,632 1,632 1,802<br />
Lease - <strong>Lakeland</strong> Executive Hangars 5,685 6,000 6,180 6,180<br />
Lease - Anheuser Busch 25,582 26,071 25,582 26,572<br />
Lease - Lance Aviation 862<br />
Lease - Game & Fresh Water Fish 15,124 15,124 15,124 15,124<br />
Lease - Armory Board 11,854 11,854 11,854 11,854<br />
Lease - Sun N' Fun 300,201 300,202 300,202 300,201<br />
Lease - Flight Safety International 9,436 9,436 10,000 10,418<br />
Lease - Watkins Motor Lines (9,140) 25,898 25,598 25,598<br />
Lease - Globe Aero 8,315 8,315 8,315<br />
Lease - Piedmont Hawthorne 141,497 141,497 141,497 148,307<br />
E – 173
LAKELAND LINDER REGIONAL AIRPORT<br />
Experience Budget Projected Proposed<br />
For Year For Year For Year For Year<br />
2008 2009 2009 <strong>2010</strong><br />
Lease - Tony's Airside Restaurant 25,790 24,000<br />
Lease-Wing Waxers <strong>of</strong> South Florida Inc 20,985 24,100 20,985 20,985<br />
Lease - Columbia 74,283 27,014 27,014 27,014<br />
Hotel Land 45,833 50,000 50,000 50,000<br />
Hanger 4 - Dixie Jet & Rotor 60,310 72,000 72,000 73,440<br />
Lease - Parkland Properties 5,353 5,353 5,549 5,549<br />
Lease - Telecom/Code Enforcement 42,348 43,200 52,800<br />
KLAL Holdings, LLC 8,315<br />
Lease - Specialized Vehicles Corp. 281,520 332,295 321,849 319,392<br />
Lease - Foster's Aircraft Refinishing, Inc 60,653 64,817 33,929 33,929<br />
Lease - Nextran Corporation (1,075)<br />
Lease - <strong>Lakeland</strong> Electric-3525 Aviation Drive 267,405 89,428 88,000 94,500<br />
Lease - National Flight Services, Inc. 43,119 53,316 47,436 47,436<br />
Lease - Keiser School (22,986)<br />
Lease - Globe Fiberglass 38,698 38,225 39,266 19,633<br />
Lease - LPD 25,000 25,000 25,000 25,000<br />
Lease - LPD Aviation Unit 37,500 37,500 37,500 37,500<br />
Lease - Air Logic Solutions 71,960 71,960 26,023<br />
Lease - Bombardier Transportation (Holdings) USA Inc 5,474 5,693 5,840 5,840<br />
Lease - Publix-3505 Aviation Drive 247,574 243,750 252,082 249,844<br />
Lease - Publix 3525 Aviation Drive 165,750 170,723 170,724<br />
Lease- Training Center 3525 Aviation Drive 109,287 111,786 110,000 111,786<br />
Lease - Polk Community College 3515 Aviation Drive 262,500<br />
2,453,124 2,241,451 2,172,750 2,160,500<br />
Investment Income<br />
Interest From S.B.A. 554 1,500<br />
Interest on Pooled Investments 175,027 120,000 132,733 50,000<br />
Interest on Money Market Account 8<br />
Market Value Restatement (45,416)<br />
130,173 121,500 132,733 50,000<br />
SUB - TOTAL 4,761,877 5,012,235 4,612,857 3,985,271<br />
PRIOR YEAR SURPLUS 294,021 1,727,288 1,564,019 821,560<br />
TOTAL REVENUES 5,055,898 6,739,523 6,176,876 4,806,831<br />
E – 174
LAKELAND LINDER REGIONAL AIRPORT<br />
Experience Budget Projected Proposed<br />
For Year For Year For Year For Year<br />
2008 2009 2009 <strong>2010</strong><br />
EXPENSES<br />
Administation<br />
Personal Services 1,368,160 1,418,327 1,352,353 874,325<br />
Insurance<br />
Uninsured Loss Reimbursement 540<br />
Insurance - Fire 66,599 71,036 69,749 80,912<br />
Insurance - Airport Liability 35,350 47,910 35,350 50,306<br />
Insurance - Position Bond 123 123 123<br />
Self-Insurance Services 18,581 24,835 24,835 21,067<br />
120,530 144,444 130,057 152,408<br />
Utilities<br />
Water Utility Service 7,832 9,147 20,059 18,873<br />
Purchasing & Stores Service 8,335 8,774 8,774 8,774<br />
Stormwater Utility Fees 23,603 23,858 31,284 31,284<br />
General Fund Services 282,373 302,334 302,334 340,023<br />
Electric Utility Service 167,590 171,316 162,361 189,535<br />
Wastewater Services 3,707 3,673 4,086 4,122<br />
Interdepartmental Solid Waste Service 10,789 8,155 17,861 9,504<br />
504,230 527,257 546,759 602,115<br />
Inter-<strong>City</strong> Services<br />
Rental-Fleet Mgmt Equipment 20,929 23,437 23,437 21,792<br />
Gasoline-Fleet Mgmt Equipment 40,596 38,600 36,553 43,471<br />
Maintenance-Fleet Mgmt Equipment 31,143 39,492 39,677 42,103<br />
Intra-dept Charges - PC & Network Support 19,189 20,754 17,861 18,217<br />
Intra-Departmental Charges - Radios 4,180 4,180 4,180 4,178<br />
Intra-Departmental Charges - Facilities 37,318 37,318 38,269<br />
Intra-Departmental Charges - Janitorial 43,199 57,582 59,220 44,163<br />
Intra-Departmental Charges - IT Operations 7,463 7,855 7,855 7,673<br />
Intra-Departmental Charges/Training Ctr 985 985 985 985<br />
167,684 230,203 227,086 220,851<br />
E – 175
LAKELAND LINDER REGIONAL AIRPORT<br />
Experience Budget Projected Proposed<br />
For Year For Year For Year For Year<br />
2008 2009 2009 <strong>2010</strong><br />
All Other O&M<br />
Contractual Services 257,036 226,934 226,816 245,048<br />
Legal Fees 3,383 1,500 1,346 1,200<br />
Banking Service 214 215 1,000<br />
Insurance Consultant 2,203 1,236 1,280 1,239<br />
Advertising 380 500 2,634 2,500<br />
Annual Audit 4,327 3,200 3,148 3,200<br />
Promotions/Public Relations 103 3,600<br />
Agency Commission 22,047 26,443<br />
Office Supplies 4,460 8,500 5,232 7,500<br />
Equipment - Noncapital 5,251 4,200 1,708 4,000<br />
All Other Materials & Supplies 7,375 5,000 4,316 4,000<br />
Uniforms 3,163 3,500 1,000 4,200<br />
Cleaning & Janitor Supply 314 500 500<br />
Chemicals 2,000 2,000<br />
Tools & Implements 3,028 1,500<br />
LP Gas 48 300<br />
Leases 4,857 6,000<br />
Rentals 7,094 800 188 1,000<br />
Maintenance Of Facilities 42,988 46,118 48,454<br />
Repair Of Equipment 11,272 25,850 10,000 10,000<br />
Printing & Photography 2,949 1,500 5,082 7,000<br />
Postage & Mailing 2,084 2,000 1,083 2,200<br />
Subscription & Membership 6,389 5,675 4,058 5,675<br />
Telephone, Communications 13,343 10,000 9,717 12,400<br />
Travel 19,978 18,900 14,596 15,120<br />
Training 1,665 4,000 7,813 4,000<br />
All Other Sundry Charges 592 750 23<br />
Ad Valorem Taxes (1,828) 4,400 4,400<br />
Licenses & Permits 500<br />
Bad Debt Expense (226,169) 5,100 90,000 25,000<br />
176,396 390,678 463,144 390,725<br />
Capital Equipment<br />
Equipment - Capital 18,588 7,888<br />
SUB-TOTAL 2,355,588 2,718,797 2,719,399 2,240,424<br />
E – 176
LAKELAND LINDER REGIONAL AIRPORT<br />
Experience Budget Projected Proposed<br />
For Year For Year For Year For Year<br />
2008 2009 2009 <strong>2010</strong><br />
Airside<br />
Insurance<br />
Self-Insurance Services 15,000 15,750 15,750 15,750<br />
15,000 15,898 15,750 15,750<br />
Utilities<br />
Water Utility Service 26,041 29,188 27,156 31,022<br />
Stormwater Utility Fees 5,173 4,079 8,358 8,358<br />
Electric Utility Service 66,706 90,743 50,695 90,000<br />
Wastewater Services 24,342 28,019 24,835 27,212<br />
Interdepartmental Solid Waste Service 5,869 5,693 2,889 2,889<br />
128,132 157,722 113,933 159,481<br />
Inter-<strong>City</strong> Services<br />
Rental-Fleet Mgmt Equipment 1,413 1,587 1,587 1,413<br />
Gasoline-Fleet Mgmt Equipment 1,865 1,170 1,500<br />
Maintenance-Fleet Mgmt Equipment 3,069 2,186 1,471 2,205<br />
Intra-Departmental Charges - Janitorial 13,752 2,100 2,100 2,110<br />
Intra-Departmental Charges - IT Operations 1,191 1,254 1,254 1,254<br />
19,425 8,992 7,582 8,482<br />
All Other O&M<br />
Contractual Services 18,990 30,040 14,644 22,612<br />
Banking Service 213 214<br />
Advertising 158<br />
Promotions/Public Relations 128 4,000 2,782<br />
Agency Commission 21,048 27,500<br />
Office Supplies 3,022<br />
Equipment - Noncapital 750 3,016 3,960<br />
All Other Materials & Supplies 1,428 4,200 15,187 7,000<br />
Uniforms 303 750 1,660<br />
Cleaning & Janitor Supply 42 250 408 600<br />
Chemicals 500 314 2,000<br />
Tools & Implements 772 750 1,546 2,600<br />
Computer S<strong>of</strong>tware 10,000 5,000 4,000<br />
Rentals 1,606 600 3,887 5,667<br />
Maintenance Of Facilities 76,282 73,500 83,497 100,000<br />
Repair Of Equipment 5,409 10,300 4,895 8,240<br />
Printing & Photography 144 300<br />
Postage & Mailing 582<br />
Telephone, Communications 2,897 2,400 2,094 2,400<br />
Training 380<br />
Ad Valorem Taxes 92,643 175,000 15,000 135,000<br />
Bad Debt Expense 8,500 290<br />
221,904 349,554 158,362 294,079<br />
SUB-TOTAL 384,462 532,166 295,627 477,792<br />
E – 177
LAKELAND LINDER REGIONAL AIRPORT<br />
Experience Budget Projected Proposed<br />
For Year For Year For Year For Year<br />
2008 2009 2009 <strong>2010</strong><br />
Grants<br />
FDOT - Land Acquisition West <strong>of</strong> Airport 235,688 192,347<br />
FAA/FDOT Airport Master Plan Update 1,328 275,000 275,000<br />
FAA/FDOT Runway 5-23 Rehabilitation - 2005 5,000 242,579 34,870<br />
FDOT-1500 ARFF Vehicle 10,490 1,111<br />
FDOT-Gates & Bldg Access Control System, Ph I & II 68,133 62,502 62,502<br />
FDOT-Airport Perimeter Fencing 32,598<br />
FAA/FDOT Realign and Construct Taxiway G - Design 115,290 115,290<br />
FDOT Construct APRON; Terminal Ramp Expansion 64,971 135,028 135,028<br />
FDOT Install Taxiway Lighting System South Section 100,000 100,000<br />
FDOT - Reinvest $1.4mm 200,000 200,000<br />
FDOT Install AWOS 250,000<br />
Construct ATC Facility Site Study 40,000 40,000<br />
418,208 1,163,857 962,690 450,000<br />
Debt Service<br />
Airport Consolidation Loan 2 788,731 788,731 788,731 788,730<br />
FDOT - Airport Terminal Construction 164,554 148,093 148,093 144,093<br />
FDOT - Land Acquisition West <strong>of</strong> Airport 459,764<br />
<strong>Lakeland</strong> Airside Center Acquisition 140,000 140,000 140,000 140,000<br />
1,553,050 1,076,824 1,076,824 1,072,823<br />
Maintenance Projects<br />
Maintenance Of Facilities - Building N-1 885 1,000<br />
Maintenance Of Facilities - Building N-7 233 1,800<br />
Maintenance Of Facilities 338 1,500<br />
Lease-AET LLC 1,829<br />
Lease-Renaissance Aviation 933 1,000<br />
<strong>Lakeland</strong> Air Service, Inc. 202<br />
Lease - Piedmont Hawthorne 119 1,000<br />
Lease - Tony's Airside Restaurant 6,589 9,411<br />
Lease - Europa 1,911 2,000<br />
13,038 17,711<br />
E – 178
LAKELAND LINDER REGIONAL AIRPORT<br />
Experience Budget Projected Proposed<br />
For Year For Year For Year For Year<br />
2008 2009 2009 <strong>2010</strong><br />
Projects<br />
Air Traffic Control Tower Expenses 1,271 165 5,000<br />
Airfield Security and Access Control 15,043 20,000 20,000 10,000<br />
Airport Advertising / Promotions 37,935 75,000 75,000 60,000<br />
Ditch Spraying 1,455 5,000 5,000 5,000<br />
Hangar Maintenance Program 10,000 10,000 10,000<br />
Airside Warehouse Conversion to Office Space 55,718<br />
Airport Maintenance - Sun 'N Fun 23,589 25,000 35,931 29,000<br />
Drainage Maintenance - Ditches 8,256 16,744 16,744 25,000<br />
Airfield Pavement Maintenance 6,295 222,699 222,699 50,000<br />
Miscellaneous Maintenance Projects 7,635 64,868 64,868 35,000<br />
Repair <strong>of</strong> Fixtures - Airside 4,290 20,710 20,710 12,500<br />
T-Hangar Painting/Repair 115 19,124 19,124<br />
Paint Runway 5-23 and 9-27 30,012 30,012<br />
Hangar Door Repairs 6,241 36,759 36,759 35,000<br />
Fire System Maintenance 27,689 36,311 36,311<br />
Runway Markings Maintenance 45,000 25,872 10,000<br />
LAC Fire Sprinkler Upgrade 30,000 32,483 10,000<br />
Buildout & Maintenance Contingency 100,000 100,000 75,000<br />
Airpark Land Sale - Phase I 35,000<br />
LAC R&D Building - Ro<strong>of</strong> 8,000<br />
LAC Fire Suppression System Pump 90,000 90,000 24,000<br />
LAC - Install Electrical Submeters 50,000 50,000 25,000<br />
Keiser Tenant Buildout Payback 75,000 75,000<br />
Eastwood Development Roadway Improvements 34,023 10,500<br />
Building Repairs 48,000 50,000<br />
Renovate Tower Building 2,500 2,500<br />
Entrance Sign 600 14,400 14,400 15,000<br />
Deforestation - Runway 9 Approach 48,000 48,000<br />
Drainage Maintenance - Ditches 12,541 12,500 12,500<br />
242,693 1,151,127 1,044,078 485,500<br />
Transfers To Other Funds<br />
Radio System Expansion - Public Safety 4,778 4,778 4,778 4,778<br />
DOIT - Voice Over IP Project 2,192<br />
PIF - Heritage Town Center - Training Center 859<br />
Sinking Fund Transfers 70,638 74,263 73,480 72,463<br />
Transfer To Fleet Mgmt Reserve 13,441<br />
88,857 79,041 78,258 80,292<br />
GRAND TOTAL 5,055,898 6,739,523 6,176,876 4,806,831<br />
E – 179
THIS PAGE IS INTENTIONALLY BLANK<br />
E – 180
REVENUE AND EXPENDITURE SUMMARY<br />
SOLID WASTE<br />
Experience Budget Experience 2009-10<br />
For Year For Year 2008-09 Proposed by<br />
EXPENSES 2007-08 2008-09 Estimated <strong>City</strong> Manager<br />
Personnel<br />
Salaries and Wages 2,795,123 3,123,627 3,022,060 3,163,013<br />
Fringe Benefits 989,382 982,135 887,719 1,129,898<br />
Total Personnel 3,784,505 4,105,762 3,909,779 4,292,911<br />
Non-Personnel<br />
Internal Service Charges 3,609,431 3,685,087 3,477,438 3,571,865<br />
Pr<strong>of</strong>essional and Contractual 304,608 369,075 369,075 274,931<br />
Utilities 27,462 27,986 27,950 29,230<br />
Insurance and Fixed Charges 332,040 325,970 325,970 335,081<br />
All Other Operations and Maintenance 3,017,394 3,375,729 3,379,849 3,409,106<br />
Capital Outlay 91,122 361,760 361,760 118,773<br />
Debt Service 237,684 12,706 12,706<br />
Total Non-Personnel 7,619,740 8,158,313 7,954,748 7,738,986<br />
Total Expenditures 11,404,245 12,264,075 11,864,527 12,031,897<br />
Transfers<br />
Transfers In<br />
Transfers Out (1,314,720) (1,314,720) (1,314,720) (1,280,708)<br />
Net Transfers (1,314,720) (1,314,720) (1,314,720) (1,280,708)<br />
Revenue Sources<br />
Taxes<br />
Licenses and Permits<br />
Intergovernmental<br />
Charges for Services 13,303,770 13,550,006 13,349,606 13,152,106<br />
Interest Income 140,898 80,000 163,301 225,000<br />
All Other Revenue 322,356 238,800 140,647 125,000<br />
Total Revenue 13,767,024 13,868,806 13,653,554 13,502,106<br />
Funding to be Provided (1,048,059) (290,011) (474,307) (189,501)<br />
E – 181
SOLID WASTE<br />
Experience Budget Projected Proposed<br />
For Year For Year For Year For Year<br />
2008 2009 2009 <strong>2010</strong><br />
REVENUES<br />
Other Miscellaneous Revenue<br />
Recycling Proceeds 262,141 232,300 120,000 120,000<br />
Scrap Sales 3,693 6,500 5,000 5,000<br />
Insurance Proceeds - Workers Comp Claims 798 12,274<br />
Reimbursements / Loss Recovery 443<br />
267,075 238,800 137,274 125,000<br />
Charges for Services<br />
Solid Waste Collection Charges - Residential 5,973,958 6,102,000 6,042,000 6,102,000<br />
Roll-Off Container Franchise Fees 306,183 285,000 380,000 320,000<br />
Solid Waste Collection Charges - Commercial 5,520,608 5,620,000 5,450,000 5,250,000<br />
Solid Waste Recycling - Residential 726,223 742,300 742,300 742,300<br />
Roll-Off Container Rental Fees 8,193 7,600 7,600 7,600<br />
Roll-Off Container Delivery Fees 5,321 5,900 4,000 4,000<br />
Roll-Off Container Return / Replacement Fees 236,766 264,000 210,000 210,000<br />
R<strong>of</strong>f-Off Collection Surcharge 44,031 46,000 36,500 39,000<br />
Roll-Off Container Solid Waste Disposal Charges 189,648 177,206 177,206 177,206<br />
Inter<strong>City</strong> Solid Waste Billings 292,838 300,000 300,000 300,000<br />
13,303,770 13,550,006 13,349,606 13,152,106<br />
Fines and Forfiets<br />
Bad Check Charges 5,280 3,373<br />
Investment Income<br />
Interest on Pooled Investments 206,252 80,000 163,301 225,000<br />
Market Value Restatement (65,354)<br />
140,898 80,000 163,301 225,000<br />
Proceeds from Issuance <strong>of</strong> Debt<br />
Payment in lieu <strong>of</strong> waste disposal - McIntosh 3 50,000<br />
SUB-TOTAL 13,767,024 13,868,806 13,653,554 13,502,106<br />
PRIOR YEAR SURPLUS (1,048,059) (290,011) (474,307) (189,501)<br />
TOTAL REVENUES 12,718,965 13,578,795 13,179,247 13,312,605<br />
E – 182
SOLID WASTE<br />
Experience Budget Projected Proposed<br />
For Year For Year For Year For Year<br />
2008 2009 2009 <strong>2010</strong><br />
EXPENSES<br />
ADMINISTRATION<br />
Personal Services 551,655 405,513 387,172 414,112<br />
Insurance<br />
Insurance - Fire 767 817 817<br />
Insurance - Position Bond 505 505 505<br />
Self-Insurance Services 331,273 324,648 324,648 334,576<br />
332,040 325,970 325,970 335,081<br />
Utilities<br />
Water Utility Service 3,627 3,630 3,630 4,048<br />
Stormwater Utility Fees 156 156 208 208<br />
Electric Utility Service 12,600 13,396 13,396 13,396<br />
Wastewater Services 5,179 5,318 5,230 6,092<br />
Interdepartmental Solid Waste Service 3,852 3,852 3,852 3,852<br />
25,415 26,352 26,316 27,596<br />
Inter-<strong>City</strong> Services<br />
Rental-Fleet Mgmt Equipment 1,638 1,595 1,595 1,638<br />
Gasoline-Fleet Mgmt Equipment 869 2,013 1,035 1,111<br />
Maintenance-Fleet Mgmt Equipment 329 1,546 1,546 2,007<br />
General Fund Services 581,778 519,231 519,231 551,016<br />
Purchasing & Stores Service 6,706 7,059 7,059 7,059<br />
Utility Billing Service 157,524 157,524 157,524 157,524<br />
Intra-dept Charges - PC & Network Support 16,797 14,899 17,085 16,878<br />
Intra-Departmental Charges - Telephone 5,541 6,078 5,670 5,583<br />
Intra-Departmental Charges - Radios 16,720 16,720 16,720 20,568<br />
Intra-Departmental Charges - Facilities 7,305 6,965 6,965 6,852<br />
Intra-Departmental Charges - Janitorial 6,017 6,493 6,493 6,674<br />
Intra-Departmental Charges - IT Operations 9,772 10,286 10,286 78,999<br />
Intra-Departmental Charges/Training Ctr 4,188 4,188 4,188 4,188<br />
815,184 754,597 755,397 860,097<br />
E – 183
SOLID WASTE<br />
Experience Budget Projected Proposed<br />
For Year For Year For Year For Year<br />
2008 2009 2009 <strong>2010</strong><br />
All Other O&M<br />
Contractual Services 2,077 5,500 5,500 5,500<br />
Banking Service 1,586 1,676 1,676 1,700<br />
Pr<strong>of</strong>essional Services 150,000 150,000 55,000<br />
Insurance Consultant 4,837 2,389 2,389 3,221<br />
Advertising 510 1,010 1,010 1,010<br />
Annual Audit 4,497 4,500 4,500 4,500<br />
Office Supplies 4,678 5,320 5,320 5,320<br />
Equipment - Noncapital 48,587 75,655 75,655 75,655<br />
All Other Materials & Supplies 6,199 5,320 5,320 5,320<br />
Uniforms 29,608 29,700 29,700 29,700<br />
Chemicals 4,593 5,300 5,300 9,000<br />
Tools & Implements 4,327 5,150 5,150 5,150<br />
Personal Safety Equipment 4,208 4,240 4,240 4,240<br />
Parts For Equipment 9,467 9,700 9,700 9,700<br />
Toll Fees 11,042 4,880 9,000 9,000<br />
Repair Of Equipment 2,660 2,678 2,678 2,678<br />
Printing & Photography 485 2,530 2,530 2,530<br />
Postage & Mailing 94 1,100 1,100 1,100<br />
Subscription & Membership 334 424 424 424<br />
Telephone, Communications 2,047 1,634 1,634 1,634<br />
Travel 2,551 3,000 3,000 3,000<br />
Training 420 824 824 824<br />
All Other Sundry Charges 513 795 795 795<br />
S<strong>of</strong>tware License & Maintenance 4,000 4,000 4,000<br />
Bad Debt Expense 49,099 65,000 65,000 65,000<br />
194,419 392,325 396,445 306,001<br />
Capital Equipment<br />
Equipment - Capital 4,100<br />
SUB-TOTAL 1,918,712 1,904,757 1,891,300 1,946,987<br />
RECYCLING<br />
Personal Services 261,370 280,997 280,704 287,584<br />
Inter-<strong>City</strong> Services<br />
Rental-Fleet Mgmt Equipment 108,404 111,840 113,229 106,977<br />
Gasoline-Fleet Mgmt Equipment 96,042 133,876 75,858 122,742<br />
Maintenance-Fleet Mgmt Equipment 72,967 171,061 171,061 118,487<br />
277,413 416,777 360,148 348,206<br />
All Other O&M<br />
Advertising 1,000 1,000 1,000 1,000<br />
Office Supplies 488 515 515 515<br />
Equipment - Noncapital 11,762 15,650 15,650 15,650<br />
All Other Materials & Supplies 8,019 9,270 9,270 9,270<br />
Uniforms 326 655 655 655<br />
Printing & Photography 315 750 750 750<br />
Postage & Mailing 164 164 164<br />
Subscription & Membership 306 340 340 340<br />
Travel 795 750 750 750<br />
Training 140 333 333 333<br />
23,151 29,427 29,427 29,427<br />
SUB-TOTAL 561,933 727,201 670,279 665,217<br />
E – 184
SOLID WASTE<br />
Experience Budget Projected Proposed<br />
For Year For Year For Year For Year<br />
2008 2009 2009 <strong>2010</strong><br />
Inter-<strong>City</strong> Services<br />
Rental-Fleet Mgmt Equipment 2,564<br />
Maintenance-Fleet Mgmt Equipment 130<br />
RMPF<br />
All Other O&M<br />
Contractual Services<br />
2,694<br />
SUB-TOTAL 2,694<br />
RESIDENTIAL<br />
Personal Services 2,239,558 2,539,943 2,512,514 2,707,906<br />
Inter-<strong>City</strong> Services<br />
Rental-Fleet Mgmt Equipment 403,199 459,548 441,125 396,853<br />
Gasoline-Fleet Mgmt Equipment 497,452 530,432 350,443 463,684<br />
Maintenance-Fleet Mgmt Equipment 662,056 654,622 654,622 516,575<br />
1,562,707 1,644,602 1,446,190 1,377,112<br />
All Other O&M<br />
Contractual Services 240,178 153,000 153,000 153,000<br />
Solid Waste Disposal Charges 1,483,361 1,557,146 1,557,146 1,584,473<br />
1,723,540 1,710,146 1,710,146 1,737,473<br />
SUB-TOTAL 5,525,805 5,894,691 5,668,850 5,822,491<br />
COMMERCIAL<br />
Personal Services 626,148 761,851 618,871 762,255<br />
Inter-<strong>City</strong> Services<br />
Rental-Fleet Mgmt Equipment 270,697 203,374 288,402 188,166<br />
Gasoline-Fleet Mgmt Equipment 289,366 312,416 279,726 185,243<br />
Maintenance-Fleet Mgmt Equipment 316,266 246,784 246,784 489,527<br />
876,329 762,574 814,912 862,936<br />
All Other O&M<br />
Contractual Services 49,923 50,000 50,000 50,000<br />
Solid Waste Disposal Charges 1,143,651 1,357,300 1,357,300 1,385,564<br />
1,193,573 1,407,300 1,407,300 1,435,564<br />
SUB-TOTAL 2,696,051 2,931,725 2,841,083 3,060,755<br />
E – 185
SOLID WASTE<br />
Experience Budget Projected Proposed<br />
For Year For Year For Year For Year<br />
2008 2009 2009 <strong>2010</strong><br />
ROLL - OFF<br />
Personal Services 105,774 117,458 110,518 121,053<br />
Inter-<strong>City</strong> Services<br />
Rental-Fleet Mgmt Equipment 28,404 34,275 34,275 37,648<br />
Gasoline-Fleet Mgmt Equipment 26,979 34,626 28,880 43,220<br />
Maintenance-Fleet Mgmt Equipment 19,721 37,636 37,636 42,646<br />
75,104 106,537 100,791 123,514<br />
All Other O&M<br />
Solid Waste Disposal Charges 189,366 207,240 207,240 177,206<br />
SUB-TOTAL 370,244 431,235 418,549 421,773<br />
Debt Service<br />
Recyclable Materials Processing Facility 25,185 12,706 12,706<br />
Solid Waste rear-packing trucks 94,445<br />
Rear Packing Refuse Trucks 118,055<br />
237,684 12,706 12,706<br />
Projects<br />
Resurface Parking Lot 47,000<br />
GPS Units and Access Charges 30,000<br />
Radio System Expansion - Public Safety 8,500 8,500<br />
Wash Bay Construction 5,475<br />
Replace HVAC Solid Waste 5,916<br />
Replace OH Garage Door 3,995<br />
Wash Bay Repairs and Truck Wash Systems 12,545 319,455 319,455<br />
Routesmart S<strong>of</strong>tware Application 18,000 14,103 14,103<br />
Vertical Trash Compactors 29,018 3,529 3,529<br />
74,949 345,587 345,587 77,000<br />
Transfers To Other Funds<br />
Transfer To Fleet Management Reserve Fund 21,500<br />
Radio System Expansion - Public Safety 16,173 16,173 16,173 16,173<br />
PIF - Heritage Town Center - Training Center 4,954<br />
Transfer To General Fund 1,314,720 1,314,720 1,314,720 1,275,754<br />
1,330,893 1,330,893 1,330,893 1,318,381<br />
GRAND TOTAL 12,718,965 13,578,795 13,179,247 13,312,605<br />
E – 186
REVENUE AND EXPENDITURE SUMMARY<br />
LAKES AND STORMWATER<br />
Experience Budget Experience 2009-10<br />
For Year For Year 2008-09 Proposed by<br />
EXPENSES 2007-08 2008-09 Estimated <strong>City</strong> Manager<br />
Personnel<br />
Salaries and Wages 215,613 269,341 263,436 265,151<br />
Fringe Benefits 44,940 74,054 64,759 76,657<br />
Total Personnel 260,553 343,395 328,195 341,808<br />
Non-Personnel<br />
Internal Service Charges 131,502 283,570 218,745 229,953<br />
Pr<strong>of</strong>essional and Contractual 350 331 2,147<br />
Utilities 1,889 1,938 1,688 1,832<br />
Insurance and Fixed Charges 250 8,338 8,586 22,906<br />
All Other Operations and Maintenance 358,748 935,199 527,701 939,650<br />
Capital Outlay 2,118,382 9,832,295 9,365,875 3,185,000<br />
Debt Service<br />
Total Non-Personnel 2,610,771 11,061,690 10,122,926 4,381,488<br />
Total Expenditures 2,871,324 11,405,085 10,451,121 4,723,296<br />
Transfers<br />
Transfers In<br />
Transfers Out<br />
Net Transfers<br />
Revenue Sources<br />
Taxes<br />
Licenses and Permits<br />
Intergovernmental 175,737 3,474,008 3,474,008<br />
Charges for Services 3,313,960 4,458,817 4,381,648 4,415,000<br />
Interest Income 147,968 143,313 146,444 98,544<br />
All Other Revenue 1,790 27,794<br />
Total Revenue 3,639,455 8,076,138 8,029,894 4,513,544<br />
Funding to be Provided (768,131) 3,328,947 2,421,227 209,752<br />
E – 187
LAKES AND STORMWATER<br />
Experience Budget Projected Proposed<br />
For Year For Year For Year For Year<br />
2008 2009 2009 <strong>2010</strong><br />
REVENUES<br />
Federal Grants<br />
SOF/DEM-N <strong>Lakeland</strong> Drainage Imp-Basin A 629,000 629,000<br />
SOF/DEM-N <strong>Lakeland</strong> Drainage Imp-Basin B 56,233 56,233<br />
SOF/DEM-N <strong>Lakeland</strong> Drainage Imp-Basin C 144,806 803,765 803,765<br />
SOF/DEM-N <strong>Lakeland</strong> Drainage Imp-Basin D 19,752 19,752<br />
144,806 1,508,750 1,508,750<br />
State Grants<br />
SOF/DEM-N <strong>Lakeland</strong> Drainage Imp-Basin C (22,278)<br />
FDEP-Urban Restroration Initiative 8,618 8,618<br />
(22,278) 8,618 8,618<br />
Local Grants<br />
SWFWMD-Grant Westside Hollingworth Stormwater (13,451) 363,398 363,398<br />
SWFWMD - Lake Parker SW Basin Alternative Stormwater BMPs 2,366 843,110 843,110<br />
SWFWD LK Gibson SW Basin-Design & Permitting <strong>of</strong> LK Gibson 64,294 Retr<strong>of</strong>it 750,132 750,132<br />
53,209 1,956,640 1,956,640<br />
Other Miscellaneous Revenue<br />
All Other Misc Revenue 30 26,294<br />
Refund <strong>of</strong> Prior Year Expenses 200<br />
30 26,494<br />
Charges for Services<br />
Stormwater Fees - Commercial/Municipal 1,472,778 2,050,860 1,962,523 1,985,000<br />
Stormwater Fees - Residential 1,767,189 2,311,540 2,325,249 2,335,000<br />
Stormwater Fees - Interfund 73,993 96,417 93,876 95,000<br />
3,313,960 4,458,817 4,381,648 4,415,000<br />
Fines and Forfiets<br />
Bad Check Charges 1,760 1,300<br />
Investment Income<br />
Interest on Pooled Investments 198,482 143,313 196,444 98,544<br />
Market Value Restatement (50,515) (50,000)<br />
147,968 143,313 146,444 98,544<br />
SUB-TOTAL 3,639,455 8,076,138 8,029,894 4,513,544<br />
PRIOR YEAR SURPLUS (768,131) 3,328,947 2,421,227 209,752<br />
TOTAL REVENUES 2,871,324 11,405,085 10,451,121 4,723,296<br />
E – 188
LAKES AND STORMWATER<br />
Experience Budget Projected Proposed<br />
For Year For Year For Year For Year<br />
2008 2009 2009 <strong>2010</strong><br />
EXPENSES<br />
Personal Services 260,553 343,395 328,195 341,808<br />
Insurance<br />
Uninsured Loss Reimbursement 250 250<br />
Insurance - Position Bond 18 16 18<br />
Self-Insurance Services 8,320 8,320 22,888<br />
250 8,338 8,586 22,906<br />
Utilities<br />
Water Utility Service 19 21 21 21<br />
Electric Utility Service 987 996 966 988<br />
Wastewater Services 24 26 26 28<br />
Interdepartmental Solid Waste Service 45 45 45 45<br />
1,076 1,088 1,058 1,082<br />
Inter-<strong>City</strong> Services<br />
General Fund Services 72,254 218,132 163,652 159,028<br />
Purchasing & Stores Service 2,674 2,815 2,815 2,815<br />
Rental-Fleet Mgmt Equipment 6,066 6,009 4,300 9,783<br />
Gasoline-Fleet Mgmt Equipment 6,938 7,112 4,879 6,006<br />
Maintenance-Fleet Mgmt Equipment 6,427 9,287 3,500 13,589<br />
Intra-dept Charges - PC & Network Support 12,658 12,442 11,961 11,819<br />
Intra-Departmental Charges - Telephone 1,092 1,252 1,112 1,329<br />
Intra-Departmental Charges - Radios 965 960 965 965<br />
Intra-Departmental Charges - Facilities 2,101 2,201 2,201 2,914<br />
Intra-Departmental Charges - Janitorial 1,623 1,750 1,750 2,421<br />
Intra-Departmental Charges - IT Operations 18,407 21,314 21,314 18,988<br />
Intra-Departmental Charges/Training Ctr 296 296 296 296<br />
131,502 283,570 218,745 229,953<br />
All Other O&M<br />
Insurance Consultant 350 331 2,147<br />
Office Supplies 808 851 873 900<br />
Uniforms 750 750 600 750<br />
Tools & Implements 350 350 350<br />
Personal Safety Equipment 100 100 100<br />
Printing & Photography 90 250 270 250<br />
Telephone, Communications 812 850 630 750<br />
All Other Administrative 183 300 300<br />
Bad Debt Expense 8,990 10,208 6,000<br />
NPDES Permitting - Administration 6,499 1,598<br />
Stormwater Administration 15,307<br />
33,439 5,399 13,362 11,547<br />
E – 189
LAKES AND STORMWATER<br />
Experience Budget Projected Proposed<br />
For Year For Year For Year For Year<br />
2008 2009 2009 <strong>2010</strong><br />
Grants<br />
SOF/DEM-N <strong>Lakeland</strong> Drainage Imp-Basin A 16,590 711,373 711,656<br />
SOF/DEM-N <strong>Lakeland</strong> Drainage Imp-Basin B 7,255 57,345 57,385<br />
SOF/DEM-N <strong>Lakeland</strong> Drainage Imp-Basin C 35,961 1,176,002 1,176,326<br />
SOF/DEM-N <strong>Lakeland</strong> Drainage Imp-Basin D 3,207 19,752 19,752<br />
SWFWMD-Grant Westside Hollingworth Stormwater 1,131,163 1,131,163<br />
SWFWMD - Lake Parker SW Basin Alternative Stormwater BMPs25,521 2,164,213 2,164,213<br />
SWFWD LK Gibson SW Basin-Design & Permitting <strong>of</strong> LK Gibson 128,587 Retr<strong>of</strong>it 1,348,612 1,348,612 650,000<br />
FDEP-Urban Restroration Initiative 517,638 517,638<br />
217,121 7,126,098 7,126,745 650,000<br />
Projects<br />
Stormwater Projects<br />
Flood Control Automation Feasibility Study 49,372 75,000 75,000 200,000<br />
Install/Maintain Pollution Control Devices 63,779 87,000 52,000 88,000<br />
Lake Gibson SW Basin Retr<strong>of</strong>it 427,488 626,537 626,537 750,000<br />
Drainage Maintenance Operations 994 526,000 250,000 526,000<br />
Route Smart GIS 15,000<br />
Westside Hollingsworth Stormwater Retr<strong>of</strong>it 62,108 52,396 2,964<br />
Lake Hollingsworth - Shoreline Erosion Repair 11,998 83,547 83,547<br />
Lake Parker SW Basin - Alternative Stormwater Treatment Study214,263 224,386 75,000<br />
North <strong>Lakeland</strong> Stormwater Master Plan 37,238 415,949 260,000<br />
Lakes & Stormwater Move 59,218<br />
Lake John Erosion Control 4,593<br />
Drainage Projects<br />
GIS Storm Sewer Inventory 36,019 30,000 35,000 50,000<br />
TV & Clean Storm Drain Structures 94,608 125,000 85,000 125,000<br />
Retr<strong>of</strong>it Existing Storm Sewers 351,564 275,000 275,000 275,000<br />
Pinewood Avenue - Drainage Study 3,378 8,661 8,000 0<br />
Pinewood Avenue - Drainage Study 220,000 123,000 0<br />
Pinewood Avenue - Drainage Study 3,378 228,661 131,000<br />
Shore Acre Subdivision (Fern Road) - Drainage Study 57<br />
Mass Ave. & Plum St. Storm Sewer Retr<strong>of</strong>it 16,610 83,390 83,390 500,000<br />
Street Sweeping Disposal 98,968 12,713<br />
Street Sweeping Operations 255 452,000 475,000 611,000<br />
Undesignated Equipment Leases 40,000 40,000<br />
North Lake Parker Avenue - Drainage Improvements 36,869 32,331 11,979<br />
Lakeside Hills Estate Underdrain 25,961<br />
Morgan Avenue Outfall Pipe 401,523<br />
Lakes and Environmental Projects<br />
Contribution To LEAD 25,000 25,000 25,000 25,000<br />
General Lake Improvements 188,060 225,000 135,000 225,000<br />
Public Education Programs 17,460 30,000 20,300 30,000<br />
2,227,383 3,637,197 2,754,430 3,420,000<br />
Transfers to Other Funds<br />
Fleet Management Reserve Fund 46,000<br />
GRAND TOTAL 2,871,324 11,405,085 10,451,121 4,723,296<br />
E – 190
REVENUE AND EXPENDITURE SUMMARY<br />
ELECTRIC UTILITY<br />
Experience Budget Experience 2009-10<br />
For Year For Year 2008-09 Proposed by<br />
EXPENSES 2007-08 2008-09 Estimated <strong>City</strong> Manager<br />
Personnel<br />
Salaries and Wages 30,918,278 33,507,658 31,087,727 33,274,616<br />
Fringe Benefits 4,798,726 8,192,576 9,545,697 10,074,646<br />
Total Personnel 35,717,003 41,700,234 40,633,425 43,349,262<br />
Non-Personnel<br />
Internal Service Charges 13,302,677 14,140,620 13,124,027 13,208,121<br />
Pr<strong>of</strong>essional and Contractual 10,604,806 14,015,307 10,970,127 13,077,862<br />
Utilities 1,447,577 1,458,009 1,448,395 1,474,133<br />
Insurance and Fixed Charges 2,236,490 2,211,811 2,664,025 2,266,497<br />
All Other Operations and Maintenance 228,957,363 243,419,853 208,376,513 186,291,807<br />
Capital Outlay 18,216,552 34,863,602 28,082,001 24,565,490<br />
Debt Service 44,184,890 46,557,874 48,573,873 47,937,814<br />
Total Non-Personnel 318,950,356 356,667,076 313,238,960 288,821,724<br />
Total Expenditures 354,667,359 398,367,310 353,872,385 332,170,986<br />
Transfers<br />
Transfers In<br />
Transfers Out (23,387,004) (23,618,680) (23,618,680) (24,562,394)<br />
Net Transfers (23,387,004) (23,618,680) (23,618,680) (24,562,394)<br />
Revenue Sources<br />
Taxes<br />
Licenses and Permits<br />
Intergovernmental<br />
Charges for Services 384,645,877 417,959,451 373,697,493 352,629,357<br />
Interest Income 3,779,453 5,279,518 5,308,639 3,941,884<br />
All Other Revenue 608,608 147,460 174,924 162,815<br />
Total Revenue 389,033,937 423,386,429 379,181,057 356,734,056<br />
Funding to be Provided (10,979,574) (1,400,439) (1,689,992) (676)<br />
E – 191
ELECTRIC UTILITY<br />
Experience Budget 12 Month Proposed<br />
For Year For Year Actual Thru For Year<br />
2008 2009 March 31 <strong>2010</strong><br />
FULL-ACCRUAL FINANCIAL INFORMATION<br />
ELECTRIC REVENUE 384,645,877 417,959,451 373,697,493 352,629,357<br />
ELECTRIC EXPENSES:<br />
O&M Expenses<br />
Fuel and Purchased Power 218,254,499 234,858,410 200,930,156 177,612,764<br />
Production 21,357,512 24,770,550 22,615,616 24,121,249<br />
Transmission/Distribution 19,638,269 21,518,823 19,323,355 21,346,265<br />
Customer Service and Accounting 7,795,173 8,592,781 7,764,734 7,937,264<br />
Administrative and General 23,830,870 26,587,671 27,116,694 28,934,902<br />
Total O&M Expenses 290,876,323 316,328,235 277,750,555 259,952,444<br />
Depreciation 32,318,760 36,795,626 36,311,939 36,749,007<br />
TOTAL OPERATING EXPENSE 323,195,083 353,123,861 314,062,494 296,701,451<br />
OPERATING INCOME 61,450,794 64,835,590 59,635,000 55,927,906<br />
NON OPERATING INCOME/EXPENSE<br />
Investment Income 3,779,453 5,279,518 5,308,639 3,941,884<br />
Other Income 608,608 147,460 174,924 162,815<br />
Interest Expense 30,550,676 30,376,866 30,354,669 29,933,939<br />
Amortization 2,548,250 2,672,567 2,519,840 2,548,276<br />
Net Non-Operating Items (28,710,866) (27,622,455) (27,390,946) (28,377,516)<br />
INCOME BEFORE TRANSFERS 32,739,928 37,213,135 32,244,054 27,550,390<br />
OPERATING TRANSFERS<br />
<strong>City</strong> Dividend 23,387,004 24,000,000 23,259,897 24,500,000<br />
Other Operating Transfers 34,796 324,000 42,796 385,137<br />
NET INCOME 9,318,128 12,889,135 8,941,361 2,665,253<br />
E – 192
ELECTRIC UTILITY<br />
Experience Budget 12 Month Proposed<br />
For Year For Year Actual Thru For Year<br />
2008 2009 March 31 <strong>2010</strong><br />
CASH BASIS FINANCIAL INFORMATION<br />
NET INCOME - FULL ACCRUAL 9,318,128 12,889,135 8,941,361 2,665,253<br />
Adjustments to convert full accrual-based net income to Cash Available for Future Expansion:<br />
Add Back Non-cash Expenses:<br />
Depreciation, Amortization 34,896,358 39,531,914 38,831,779 39,326,631<br />
Interest Expense 2,471,766 2,590,162 2,590,162 2,233,343<br />
Production Expense (4,254,540) (3,000,000)<br />
Deduct Cash Disbursements Excluded<br />
From Expenses:<br />
Capitalized Interest Expense (1,014,076) (590,451) (2,599,299) (1,000,000)<br />
Non-cash Pension Cost Credit (197,485) (300,000) (300,000) (300,000)<br />
Capital Transfers to other Funds:<br />
Renewal & Replacement (17,655,501) (29,885,062) (27,639,205) (20,863,945)<br />
Fleet Management<br />
Postemployment Benefits Other Than Pensions 2,446,639 445,913 555,414<br />
Emergency Repair Fund (526,255) (400,000) (400,000) (378,802)<br />
Reserve Bond 10,000,000 10,000,000 5,000,000<br />
Over (Under) Recovery <strong>of</strong> Fuel Costs<br />
Bond Principal Payments (18,760,000) (28,180,719) (28,180,719) (24,237,218)<br />
Increase in Inventory<br />
Balance Available For<br />
Reserve For Future Expansion 10,979,574 1,400,439 1,689,992 676<br />
E – 193
ELECTRIC UTILITY<br />
Experience Budget Proposed<br />
For Year For Year For Year<br />
2008 2009 <strong>2010</strong><br />
RETAIL BUSINESS SEGMENT<br />
ELECTRIC REVENUE 168,380,826 180,633,577 173,631,621<br />
ELECTRIC EXPENSES:<br />
O&M Expenses (72,621,825) (81,469,825) (82,339,680)<br />
Depreciation (32,318,760) (36,795,626) (36,749,007)<br />
OPERATING INCOME 63,440,242 62,368,126 54,542,934<br />
NON OPERATING INCOME/EXPENSE<br />
Investment Income 3,779,453 5,279,518 3,941,884<br />
Other Income 608,608 147,460 162,815<br />
Interest Expense (30,550,676) (30,376,866) (29,933,939)<br />
Amortization (2,548,250) (2,672,567) (2,548,276)<br />
Net Non-Operating Items (28,710,866) (27,622,455) (28,377,516)<br />
INCOME BEFORE TRANSFERS 34,729,376 34,745,671 26,165,418<br />
Doit Transfer (321,137)<br />
Fleet Transfer (34,796) (324,000) (64,000)<br />
CITY DIVIDEND (23,387,004) (24,000,000) (24,500,000)<br />
NET INCOME 11,307,576 10,421,671 1,280,281<br />
FUEL COST RECOVERY BUSINESS SEGMENT<br />
ELECTRIC REVENUE 187,373,134 219,101,210 159,414,322<br />
ELECTRIC EXPENSES:<br />
O&M Expenses (187,343,786) (219,037,489) (159,384,974)<br />
Depreciation (29,348) (63,721) (29,348)<br />
OPERATING INCOME<br />
WHOLESALE BUSINESS SEGMENT<br />
ELECTRIC REVENUE 28,891,917 18,224,664 19,583,414<br />
ELECTRIC EXPENSES:<br />
O&M Expenses (30,881,365) (15,757,200) (18,198,442)<br />
OPERATING GAIN (LOSS) (1,989,448) 2,467,464 1,384,972<br />
E – 194
ELECTRIC UTILITY<br />
Experience Budget 12 MONTH Proposed<br />
For Year For Year Actual Thru For Year<br />
2008 2009 Mar 31 <strong>2010</strong><br />
ELECTRIC REVENUE<br />
Sales <strong>of</strong> Electricity<br />
Customer Charge 7,343,010 9,488,726 8,110,732 9,392,934<br />
Energy Charge 72,655,257 79,737,057 72,659,487 72,071,681<br />
Surcharge 5,455,991 6,174,916 5,627,876 5,726,315<br />
SUB-TOTAL 85,454,259 95,400,699 86,398,096 87,190,930<br />
Commercial & Industrial Sales<br />
General Service 14,607,473 15,408,869 14,198,980 14,736,551<br />
General Service Demand 24,760,133 24,197,977 24,507,680 24,198,997<br />
General Service Large Demand 13,346,059 11,677,887 13,479,120 13,528,102<br />
Interruptible 1,472,192 1,257,751 1,459,183 1,323,644<br />
Extra Large Demand 3,957 3,697,364 4,617 3,832,332<br />
Contract 2,032,992 1,401,199 1,785,085 202,616<br />
SUB-TOTAL 56,222,806 57,641,047 55,434,664 57,822,242<br />
Private Area Lights 2,813,762 2,795,166 2,803,458 2,617,190<br />
SUB-TOTAL 2,813,762 2,795,166 2,803,458 2,617,190<br />
Public Street & Highway Lighting<br />
Unmetered Lighting 2,906,064 3,163,206 3,063,337 3,341,009<br />
SUB-TOTAL 2,906,064 3,163,206 3,063,337 3,341,009<br />
Roadway Lighting 1,225,964 1,140,001 1,236,166 1,243,940<br />
SUB-TOTAL 1,225,964 1,140,001 1,236,166 1,243,940<br />
Fuel 187,373,134 219,101,210 188,694,058 159,414,322<br />
Environmental Costs 3,961,633 5,041,193 5,790,133 7,912,485<br />
Conservation 403,587 372,289 372,091 386,214<br />
SUB-TOTAL 191,738,354 224,514,692 194,856,282 167,713,021<br />
Sales for Resale 26,628,851 17,613,650 13,799,220 16,272,526<br />
Capacity Charges 835,742 143,651<br />
Accrued Electric Revenue 870,807 2,669,324<br />
Liquidated Damages<br />
SUB-TOTAL 28,335,400 17,613,650 13,942,871 18,941,850<br />
E – 195
ELECTRIC UTILITY<br />
Experience Budget 12 MONTH Proposed<br />
For Year For Year Actual Thru For Year<br />
2008 2009 Mar 31 <strong>2010</strong><br />
TOTAL SALES OF ELECTRICITY 368,696,609 402,268,461 357,734,874 338,870,182<br />
Other Electric Revenues<br />
PSC & Gross Receipts Tax 8,484,664 9,588,546 8,529,134 7,949,265<br />
Penalty Charges 1,541,294 1,451,360 1,582,475 1,441,723<br />
SUB-TOTAL 10,025,958 11,039,906 10,111,609 9,390,988<br />
Miscellaneous Service Revenue<br />
Pole Attachments 1,960,583 1,566,514 1,684,256 1,577,340<br />
Facilities Charges 598,777 611,220 605,438 631,658<br />
Connection Fees 499,095 520,000 477,464 490,000<br />
Wheeling Fees 556,517 611,014 582,495 641,564<br />
Electric portion <strong>of</strong> Bad Check Charges 153,133 155,243 139,102 125,000<br />
Byproduct Revenue 1,309,649 705,748 1,179,382 233,380<br />
All Other 353,021 574,953<br />
SUB-TOTAL 5,430,775 4,169,739 5,243,091 3,698,942<br />
TOTAL OTHER ELECTRIC<br />
REVENUES 15,456,733 15,209,645 15,354,700 13,089,930<br />
TOTAL ELECTRIC OPERATING<br />
REVENUES 384,153,342 417,478,106 373,089,574 351,960,112<br />
Other Retail Services<br />
Facilities-Tower Rental 89,302 101,811 95,079 131,845<br />
Surge Suppression 300,403 328,622 313,666 357,400<br />
Fiber Rental 102,831 50,912 199,174 180,000<br />
SUB-TOTAL 492,535 481,345 607,919 669,245<br />
TOTAL UTILITY OPERATING<br />
REVENUES 384,645,877 417,959,451 373,697,493 352,629,357<br />
E – 196
ELECTRIC UTILITY<br />
Experience Budget 12 MONTH Proposed<br />
For Year For Year Actual Thru For Year<br />
2008 2009 Mar 31 <strong>2010</strong><br />
PERSONNEL SERVICES 37,966,157 41,400,234 40,779,338 43,604,676<br />
OPERATING EXPENSES<br />
Rental-Fleet Mgmt Equipment 442,550 623,459 496,919 626,315<br />
Gasoline-Fleet Mgmt Equipment 548,248 736,761 492,127 520,338<br />
Maintenance-Fleet Mgmt Equipment 601,547 666,210 606,637 560,440<br />
Uninsured Loss Reimbursement 1,250 1,000 1,000 1,250<br />
Insurance - Fire 1,475,420 1,494,592 1,572,396 1,513,360<br />
Insurance - Position Bond 3,484 3,758 3,800<br />
Self-Insurance Services 756,336 712,461 1,090,629 748,087<br />
Water Utility Service 128,936 170,950 121,026 151,100<br />
Purchasing & Stores Service 1,191,152 1,253,844 1,191,152 1,253,844<br />
Stormwater Utility Fees 12,683 6,850 14,797 17,250<br />
General Fund Services 4,335,244 4,694,241 4,340,491 4,351,733<br />
Electric Utility Service 831,970 780,051 805,315 809,033<br />
Wastewater Services 56,465 57,535 56,177 62,000<br />
Other <strong>City</strong> Department Charges 226,615 147,076 148,378 42,860<br />
Legal Fees - <strong>City</strong> To Electric 3,035 2,500 4,369 3,100<br />
Intra Departmental Charges 269,658 148,928 219,577 142,790<br />
Intra-dept Charges - PC & Network Support 1,044,813 1,036,193 1,019,231 1,051,497<br />
Wastewater Re-use Charges 279,907 340,000 329,677 290,000<br />
Intra-Departmental Charges - Telephone 273,568 311,029 275,266 312,783<br />
Intra-Departmental Charges - Radios 126,224 126,037 126,136 137,974<br />
Intra-Departmental Charges - Facilities 759,311 730,549 723,091 641,290<br />
Intra-Departmental Charges - Janitorial 517,440 544,561 517,383 552,009<br />
Intra-Departmental Charges - IT Operations 2,963,271 3,119,232 2,963,271 3,011,148<br />
Contigency 884,251<br />
Contractual Services 8,331,130 11,811,653 8,011,041 10,426,243<br />
Legal Fees 156,085 334,172 180,010 313,692<br />
Engineering - Basic 35,815 148,350 58,142 74,400<br />
Banking Service 82,107 79,970 86,557 83,749<br />
Pr<strong>of</strong>essional Services 65,099 50,000 40,085 70,000<br />
Insurance Consultant<br />
Advertising 93,808 207,310 99,546 182,310<br />
Annual Audit 108 70,000 82,123 40,000<br />
Promotions/Public Relations 53,356 60,500 43,155 35,020<br />
Paying Agent,Trustee Fees 5,000 5,750<br />
Interdepartmental Solid Waste Service 137,617 101,573 121,403 143,700<br />
Debt Issue Costs 5,898 5,898<br />
Contract Labor 329,895 669,737 424,246 340,824<br />
Temporary Contract Labor 1,446,504 583,615 1,933,574 627,373<br />
Utility Service-Polk County 1,050 1,050<br />
Office Supplies 197,729 160,522 186,593 162,840<br />
E – 197
ELECTRIC UTILITY<br />
Experience Budget 12 MONTH Proposed<br />
For Year For Year Actual Thru For Year<br />
2008 2009 Mar 31 <strong>2010</strong><br />
Equipment - Noncapital 89,887 267,226 87,095 231,200<br />
All Other Materials & Supplies 264,320 308,652 429,154 309,122<br />
Uniforms 103,001 126,840 99,567 119,415<br />
Chemicals 670,850 886,480 784,947 2,092,880<br />
Tools & Implements 155,927 123,880 160,711 148,182<br />
Auto/Heavy Equipment Fuel 298,081 226,000 273,315 256,000<br />
Personal Safety Equipment 133,711 126,315 143,194 127,009<br />
Parts For Equipment 1,732,083 1,831,829 1,453,868 1,951,049<br />
Materials 3,288,426 2,202,806 3,305,530 2,085,286<br />
Use Tax Allocation 4,440 50,165 3,658 46,700<br />
Materials - Default Purchasing Card 0 5,093<br />
Lubricants 109,301 90,050 113,866 100,950<br />
Computer S<strong>of</strong>tware 1,134 55,311 1,099 45,225<br />
Truck Wire 182,968 75,022 163,453 75,022<br />
Sales <strong>of</strong> Pet Coke/Coal (6,866) 6,024<br />
Petroleum Coke 74,847 16,034<br />
Coal 80,545,887 90,121,783 84,329,028 93,223,756<br />
Commission/Fees - Fuel Hedges 24,099 25,000 11,934<br />
Fuel-Pool Operations 510,401 480,000 578,280 510,000<br />
#2 Oil 575,786 209,295 533,944 33,791<br />
#6 Oil 161,056 88,582<br />
Natural Gas 88,744,450 151,350,255 78,450,796 70,055,340<br />
Natural Gas Demand Charge 11,607,313 15,365,099 12,402,024 15,278,699<br />
Sale <strong>of</strong> Fuel -- NG 2,486,680 3,459,771<br />
Fuel Hedging Activity 6,572,954 (1,736,888) 4,402,324 10,023,137<br />
Limestone 1,034,312 1,500,000 1,272,742 1,500,000<br />
Purchased Power 57,101,678 11,877,160 49,351,239 22,954,922<br />
Leases 233,570 241,543 240,595 263,344<br />
Rentals 246,231 244,631 253,194 215,275<br />
Repair Of Equipment 664,045 797,084 507,803 766,120<br />
Printing & Photography 43,356 52,500 44,364 48,700<br />
Postage & Mailing 629,171 775,555 637,325 775,962<br />
Subscription & Membership 448,819 503,544 515,261 529,278<br />
Telephone, Communications 122,925 136,636 131,844 109,786<br />
Travel 41,049 115,689 36,479 99,270<br />
Contigency 375,000 711,429<br />
Training 257,796 363,638 277,173 371,234<br />
All Other Sundry Charges 30,838 36,295 28,670 31,876<br />
Ad Valorem Taxes 8,496 25,650 21,216 25,650<br />
Florida Public Service Commission 58,509 58,068 55,882 48,141<br />
Gross Receipts Tax Expense 8,715,910 9,530,478 8,758,082 7,901,124<br />
E – 198
ELECTRIC UTILITY<br />
Experience Budget 12 MONTH Proposed<br />
For Year For Year Actual Thru For Year<br />
2008 2009 Mar 31 <strong>2010</strong><br />
Miscellaneous Tax Expense<br />
S<strong>of</strong>tware License & Maintenance 434,106 756,452 462,491 508,414<br />
Licenses & Permits 316,163 452,801 352,418 476,581<br />
Car Washing 996 1,046<br />
Refund Of Prior Years Revenue 6,082<br />
Bad Debt Expense 2,001,922 1,370,825 1,952,370 1,490,000<br />
Gift Certificates 12,729 24,795 3,860 47,925<br />
Contribution to Chamber <strong>of</strong> Commerce 94,300 95,000 36,075 30,000<br />
Customer Rebates 15,100 128,500 22,800 128,500<br />
Analytical Services - Rating Agencies 28,575 38,036 18,575 15,839<br />
Interest Expense 25,216,053 26,911,483 30,345,331 28,684,757<br />
Capitalized Interest Expense (1,014,076) (590,451) (2,599,299) (1,000,000)<br />
Interest Accretion 2,471,760 2,590,162 2,590,162 2,233,343<br />
Remarketing Fees/Liquidity Fees 180,262 1,427,636 8,251<br />
Equipment - Capital 54,716 51,412<br />
Amortization 2,548,250 2,672,567 2,511,485 2,548,276<br />
Depreciation-Plant 32,348,108 35,375,660 35,341,291 36,778,355<br />
Depreciation-Negative Salvage Value A (0) 1,483,687 1,000,000<br />
Loss On Disposal <strong>of</strong> Fixed Assets 3,668,101<br />
Transfer To General Fund 23,387,004 24,000,000 23,259,897 24,500,000<br />
Tranfer to Public Improvement Fund 62,394<br />
Transfer to Fleet Mgmt Reserve 34,796 324,000 42,796 64,000<br />
Transfer To Information Technology 258,743<br />
Recoveries-Intra Department Charges (2,494,469) (268,500) (1,952,094) (274,400)<br />
Recoveries-Materials (73,993) (4,000) (75,147) (34,000)<br />
Recoveries-From Outside <strong>City</strong> (1,116,809) (334,932) (452,197) (328,327)<br />
Recoveries-Other Funds (1,515,471) (1,719,438) (1,518,710) (1,711,638)<br />
Recoveries-Fuel<br />
Recoveries-For Water Allocations (278,770) (315,901) (272,727) (291,395)<br />
Recoveries - Grant<br />
OUC Coal Expense (32,218,355) (36,048,713) (33,731,611) (37,289,502)<br />
OUC Other Fuel Expense (580,403) (600,000) (628,224) (600,000)<br />
OUC Expense (6,151,670) (8,052,069) (6,598,660) (7,756,700)<br />
OUC Admin & General Expense (1,381,077) (1,426,396) (1,323,304) (1,332,411)<br />
Fuel Costs Recovery (SCR (1,215,206)<br />
341,749,652 369,097,060 329,460,357 310,464,127<br />
E – 199
LAKELAND ELECTRIC UTILITY<br />
RENEWAL AND REPLACEMENT PROJECTS BUDGET FOR 2009-<strong>2010</strong><br />
Less OUC Total<br />
Project Or Recoveries Project<br />
Amount Amount Amount<br />
Energy Production<br />
CLP4034 Larsen Canal Seawall Replacement 300,000 300,000<br />
CLP4036 Larsen Compressed Air System Upgrade 78,000 78,000<br />
CLP4037 Larsen Fire Protection Upgrades 100,000 100,000<br />
CMP5200 JT U3 Underground Cable Rpl 80,000 32,000 48,000<br />
CMP5313 JT U3 CEMS Analyzer Repl 90,000 36,000 54,000<br />
CMP5318 U8 CEMS Analyzer Repl 30,000 30,000<br />
CMP5362 JT U3 Reheat Condenser Recovery Pump 70,000 28,000 42,000<br />
CMP5369 U5 HRSG Manual Header Drains 50,000 50,000<br />
CMP5370 U5 HRSG Pipe Penetrations Upgrade 30,000 30,000<br />
CMP5377 CM Control Room Ro<strong>of</strong> Upgrade 65,000 16,679 48,321<br />
CMP5407 U5 HRSG Superheater Damping System 200,000 200,000<br />
CMP5417 U5 CT Cooling Tower Fan Motor Rebuild 90,000 90,000<br />
CMP5431 Larsen GT Batteries Replacement 30,000 30,000<br />
CMP5432 U8 Build PM Program 75,000 75,000<br />
CMP5433 CM Control Room Upgrade 190,000 48,754 141,246<br />
CMP5436 U5 Cooling Tower Deck Water Supply 10,000 10,000<br />
CMP5438 U5 Build PM Program 100,000 100,000<br />
CMP5439 U2 Oil Yard Piping Supports 175,000 175,000<br />
CMP5440 JT U3 Bottom Ash Conveyor Replacement 250,000 100,000 150,000<br />
CMP5445 PCOM Gas Pipeline Isolation Valve Replacement 205,000 28,700 176,300<br />
CMP5446 PCOM Spill Prevention System 19,000 2,660 16,340<br />
CMP5447 PCOM Laser Shaft Alignment System 14,500 2,030 12,470<br />
CWP5449 Winston Station Service Reduction 100,000 100,000<br />
CPP6502 PCM Comm Equip/2-Way Radios 10,000 1,400 8,600<br />
CPP6503 PCM Plant Safety Equipment 10,000 1,400 8,600<br />
CPP6504 PCM Environmental Tools-Cptl 3,500 490 3,010<br />
CPP6506 PCM Lab Test Equipment 20,000 2,800 17,200<br />
CPP6509 PCM Plant A/C and Air Handler Contingency 50,000 7,000 43,000<br />
CPP6529 PCM Five Year Coatings Plan 1,000,000 140,000 860,000<br />
CPP7219 COL R&R Capital Resources 403,150 403,150<br />
Energy Production Sub-Total 3,848,150 447,913 3,400,237<br />
Energy Delivery<br />
CDE4001 Major Road Improv/Reloc 275,000 275,000<br />
CDG4003 Engineering Project Support 115,000 115,000<br />
CDS4006 Purchs New Electric Meters 200,000 200,000<br />
CDG6001 Lt Proj Resources 20,000 20,000<br />
CDG6138 R&R Capital Project Resources 4,800,145 4,800,145<br />
CDE4010 Transmission Pole Repl 35,000 35,000<br />
CDE4045 Transmission Wood Poles Inspection/Retreatment 20,000 20,000<br />
CDS6085 Various Breaker Replacements 67,000 67,000<br />
CDS6086 Various Regulator Controls Replacements 5,000 5,000<br />
CDS6117 69KV Switch Upgrades 18,000 18,000<br />
CDS6153 McIntosh P-744 69KV Breaker Upgrade 73,850 73,850<br />
CDS6154 Security Cameras & Motion Detection 20,000 20,000<br />
CDE4003 Transformer Repl-UG Dist 200,000 200,000<br />
CDE4004 Transformer Repl-UG Dist 175,000 175,000<br />
CDG4005 Major Line & Safety Equip 66,200 66,200<br />
CDE4006 Dist System Eq Replace 15,000 15,000<br />
CDE4007 Line Switch Installation 25,000 25,000<br />
CDE4008 Padmount Switch Install 60,000 60,000<br />
CDE4011 Distribution Pole Repl 110,000 110,000<br />
E – 200
LAKELAND ELECTRIC UTILITY<br />
RENEWAL AND REPLACEMENT PROJECTS BUDGET FOR 2009-<strong>2010</strong><br />
Less OUC Total<br />
Project Or Recoveries Project<br />
Amount Amount Amount<br />
CDE4020 Roadway Lighting Installations 90,000 15,000 75,000<br />
CDE4025 Public Works Lighting Projects Support 30,000 30,000<br />
CEE4033 Parks & Rec Lighting Project 20,000 20,000<br />
CDB4038 ED-Maximo Strategic Asset Management 127,500 127,500<br />
CDE4040 Private Area Lighting Installation 160,000 10,000 150,000<br />
CDE4045 Distribution Wood Poles Inspection/Retreatment 400,000 400,000<br />
CDP4112 CMA156 Current Amplifier 16,500 16,500<br />
CDP4113 Advanced TransPlay S<strong>of</strong>tware 2,600 2,600<br />
CDE4114 Dranefield D374 Extension 225,000 225,000<br />
CDE4115 New Socrum Circuit Q334 300,000 300,000<br />
CDE4117 Rebuild Existing Orangedale Circuit V374 250,000 250,000<br />
CDS4122 Substations Animal Protection 15,000 15,000<br />
CDS4123 Substations Fence Replacement & Upgrds 25,000 25,000<br />
CDS4124 Substations Grid Rock Addition 5,000 5,000<br />
CDB4126 Desktop Servers 8,000 8,000<br />
CDB4127 OMS Phase III 40,000 40,000<br />
CDO4128 Pole Yard Rd. Improvements 22,500 22,500<br />
CDS4129 Line Hose Tester for Apparatus Shop 17,000 17,000<br />
CDE4219 Phase Identification System Equipment 17,000 17,000<br />
CDS4222 Battery Bank Replacement 40,000 40,000<br />
CDS4225 GPS Receiver for Omicron Testers 4,200 4,200<br />
CDS4229 Portable Recording Meter 7,000 7,000<br />
CDE4232 Capacitor Station Installation 100,000 100,000<br />
CDE4500 Subdiv & Comm Development 267,500 67,500 200,000<br />
CDE4502 New OH Residential Svc 25,000 25,000<br />
CDE4503 New UG Residential Svc 82,000 7,000 75,000<br />
CDE4504 Upgr OH Residential Svc 10,000 10,000<br />
CDE4505 Upgr UG Residential Svc 5,000 5,000<br />
CDE4506 OH Line Extensions 25,000 25,000<br />
CDE4507 UG Line Extensions 15,000 15,000<br />
CDE4508 OH New Comm Svc GS 25,000 25,000<br />
CDE4509 UG New Comm Svc GS 45,000 45,000<br />
CDE4510 OH Upgr Comm Svc 35,000 35,000<br />
CDE4511 UG Upgr Comm Svc 50,000 10,000 40,000<br />
CDE4512 OH New Comm Svc GSD 32,000 2,000 30,000<br />
CDE4513 UG New Comm Svc GSD 260,000 10,000 250,000<br />
CDE4515 UG New Comm Svc GSLD 155,000 5,000 150,000<br />
CDE6251 Reliability-Recloser Installation 150,000 150,000<br />
CDE6260 Fault Indicator Installation 50,000 50,000<br />
CDE6268 General Reliability Improvements 60,000 60,000<br />
CDS6269 Replacement <strong>of</strong> Distribution Feeder Relays 44,000 44,000<br />
CEE6274 UG Cable Upgrade for Substation Exits 30,000 30,000<br />
CDS6282 Dist Substation Equip Replacement 35,000 35,000<br />
CDC6284 SCADA/EMS Upgrade 258,000 258,000<br />
ED6313 Voltage Complaints - Dist Upgrades 12,000 12,000<br />
CDE6340 Minor Line Extensions and Switch Installations 50,000 50,000<br />
CDS6346 Various 12KV Breaker Replacement FY 08 20,000 20,000<br />
CDC6384 EMS XA/21 Upgrade #3 29,000 29,000<br />
CDA5096 CROW Water Projects Easements 30,876 30,000 876<br />
Energy Delivery Sub-Total 10,022,871 531,500 9,491,371<br />
E – 201
LAKELAND ELECTRIC UTILITY<br />
RENEWAL AND REPLACEMENT PROJECTS BUDGET FOR 2009-<strong>2010</strong><br />
Less OUC Total<br />
Project Or Recoveries Project<br />
Amount Amount Amount<br />
Technical Support<br />
CTC5111 Fiber Services Connections 184,000 95,500 88,500<br />
CTR5702 Storm Panels Fifth Floor 5,000 5,000<br />
CTR5710 HVAC Equipment Replacement 100,000 100,000<br />
CIT4036 ED-Work Order System 39,600 39,600<br />
CGM1796 IT Contingency 50,000 50,000<br />
CIS4003 PC Systems Upgrade/Repl 40,000 40,000<br />
CSS7040 PCM Copy Machines 7,000 980 6,020<br />
CTS4701 Copy Machines 13,729 13,729<br />
CCO5746 McIntosh Power Plant Resource Center 68,000 68,000<br />
CCO4305 LE Admin Bldg - Ro<strong>of</strong> Repairs 100,000 100,000<br />
CTS5712 Major Equipment Purch 5,000 5,000<br />
CTS5720 Furniture Requirements - Capital 25,000 25,000<br />
SunEdison Partnership 30,000 30,000<br />
Elevator Upgrades 30,000 30,000<br />
CTS4651 Security Systems for E&W Building 10,000 10,000<br />
Technical Support Sub-Total 707,329 96,480 610,849<br />
Customer Service<br />
CCS4101 Phone Recording Equipment 40,000 40,000<br />
Web IVR Enhancement 100,000 100,000<br />
CIT4106 UMS (Upgrades & Add'l Functionality) 194,161 194,161<br />
CCS4114 UMS Upgvrade to V 7.4 119,271 119,271<br />
LE Energy Efficient Electric Car 50,000 50,000<br />
Customer Service Sub-Total 503,432 503,432<br />
General Manager<br />
CTR5001 - Power Academy 10,000 10,000<br />
CDO7001 PCM Equip for Training Instructor-Capital 23,790 3,331 20,459<br />
CDE4003 Transformer Repl-OH Dist 201,374 200,000 1,374<br />
CED6326 Safety Capital Equipment 3,300 3,300<br />
CFN4001 Forecasting S<strong>of</strong>tware 100,000 100,000<br />
General Manager Sub Total 338,464 203,331 135,133<br />
Grand Total 15,420,246 1,279,224 14,141,022<br />
E – 202
Table <strong>of</strong> Contents<br />
Capital Improvement Plan ............................................................................................ Section—F<br />
CIP Overview .................................................................................................................. F-2<br />
Transportation ................................................................................................................ F-5<br />
Public Improvement ..................................................................................................... F-10<br />
Downtown Community Redevelopment Area ........................................................... F-18<br />
Mid Town Community Redevelopment Area ............................................................ F-19<br />
Dixieland Community Redevelopment Area ............................................................. F-21<br />
Parking .......................................................................................................................... F-22<br />
<strong>Lakeland</strong> Center ........................................................................................................... F-23<br />
<strong>Lakeland</strong> Linder Regional Airport .............................................................................. F-24<br />
Stormwater ................................................................................................................... F-25<br />
Wastewater Utility ........................................................................................................ F-28<br />
Water Utility .................................................................................................................. F-35<br />
Electric Utility ............................................................................................................... F-39<br />
F-1 Fiscal Year 2009 Annual Budget
CIP Overview<br />
The <strong>City</strong>’s 10-year CIP includes various fund types and balances. They are listed below with their Fiscal<br />
Year <strong>2010</strong>-2019 budget request totals.<br />
The CIP was developed from departmental requests. These requests are based upon known<br />
operational and project needs. They are also based upon the <strong>City</strong>’s Comprehensive Master Plan as well<br />
as master plans developed for certain core services provided by the <strong>City</strong>.<br />
Ten Year Capital Improvement Funds<br />
Transportation Fund $ 85,125,243<br />
Public Improvement Fund 142,567,275<br />
<strong>Lakeland</strong> CRA Fund 16,327,000<br />
Mid Town CRA Fund 35,988,991<br />
Dixieland CRA Fund 3,701,727<br />
Parking Fund 1,361,551<br />
<strong>Lakeland</strong> Center Fund 3,550,000<br />
Airport Fund 6,754,757<br />
Stormwater Fund 47,536,504<br />
Wastewater Fund 92,736,358<br />
Water Fund 40,307,470<br />
<strong>Lakeland</strong> Electric Fund 438,956,945<br />
The CIP requests for Fiscal Year <strong>2010</strong> totals $83,640,641. This amount is comprised <strong>of</strong> the following<br />
amounts by Fund:<br />
Transportation Fund $ 21,093,680<br />
Public Improvement Fund 15,490,043<br />
<strong>Lakeland</strong> CRA Fund 1,710,472<br />
Mid Town CRA Fund 3,757,913<br />
Dixieland CRA Fund 400,349<br />
Parking Fund 386,933<br />
<strong>Lakeland</strong> Center Fund 400,000<br />
Airport Fund 816,871<br />
Stormwater Fund 4,723,296<br />
Wastewater Fund 5,828,067<br />
Water Fund 5,169,072<br />
<strong>Lakeland</strong> Electric Fund 23,863,945<br />
$ 83,640,641<br />
F-2 Fiscal Year 2009 Annual Budget
CIP Overview<br />
An informal CIP review committee was formed to review requests for changes or additions. This committee<br />
consists <strong>of</strong> representatives from the <strong>City</strong> Manager’s <strong>of</strong>fice, the Finance Department and the requesting<br />
department.<br />
The request process begins each year when all departments are asked to complete an automated needs<br />
assessment worksheet. This worksheet compiles information about the requesting party, justification for the<br />
project or equipment, the amount(s) required, dates(s) required, implications <strong>of</strong> not proceeding with the<br />
request and any sources <strong>of</strong> revenue associated with funding the request.<br />
The CIP is developed using the following guidelines:<br />
A capital improvement project is defined as a major construction expansion, purchase or major<br />
repair/replacement <strong>of</strong> buildings, infrastructure or other property which has an estimated total<br />
expenditure <strong>of</strong> $25,000 or more.<br />
Except for emergency repairs, capital improvements are programmed and scheduled based<br />
upon the <strong>City</strong>’s projected financial ability to purchase and maintain the capital project or<br />
equipment.<br />
Funding for capital expenditure items will come from the following sources:<br />
Current year revenues from the Public Improvement Fund, Transportation Fund, Stormwater<br />
Fund, Mid Town CRA Fund, Dixieland CRA Fund, <strong>Lakeland</strong> CRA Fund, Parking Fund, <strong>Lakeland</strong><br />
Electric Fund, Water Fund, Wastewater Fund, <strong>Lakeland</strong> Center Fund and Airport Funds.<br />
Electric, Water and Wastewater Revenue Bonds - the Electric and Water/Wastewater funds are<br />
operated by balancing total revenues and total expenditures. Revenue bonds are issued for<br />
reasons such as increasing plant capacity, expanding a distribution system or to upgrade the<br />
existing system. These bonds are always secured by the utility’s revenue stream.<br />
Variable Rate Debt - this source <strong>of</strong> revenue is used to purchase capital items or develop<br />
projects through the Sunshine State Governmental Financing Commission with a contractual<br />
obligation specifying payment terms, including principal and interest to be paid over a period <strong>of</strong><br />
time.<br />
Equity/Surplus Financing - This source <strong>of</strong> revenues are derived from surpluses generated in<br />
each fund annually. By using accumulated surpluses, the <strong>City</strong> avoids paying interest on monies<br />
borrowed.<br />
The adopted 10-year CIP provides the necessary components <strong>of</strong> a comprehensive plan. It is updated<br />
annually as needs and priorities change within the <strong>City</strong>’s large physical plant.<br />
In summary, the <strong>City</strong>’s capital improvement plan is an economical and responsible financial plan to ensure<br />
quality public services today and in the future.<br />
Major Capital Projects Changes for FY <strong>2010</strong><br />
Transportation Funds<br />
$173k added to Parking Fund Contribution for Lighting project in parking garage<br />
*Local Option Gas Taxes from Polk County are estimated to be approximately 10% lower than<br />
originally estimated by the County. This shortfall is approximately $550k in FY2009 and $550k in<br />
FY<strong>2010</strong>. This shortfall limits the <strong>City</strong>’s ability to add capital projects to the Transportation Fund in<br />
the immediate future.<br />
Public Improvement Fund<br />
$810k for remodel <strong>of</strong> Heritage Town Center for Training Facility<br />
The <strong>City</strong> <strong>of</strong> <strong>Lakeland</strong> owns and subsequently leases the <strong>Lakeland</strong> Regional Medical Center (LRMC)<br />
to a non-pr<strong>of</strong>it medical group. The <strong>City</strong> recognized a 5.5% reduction in FY2009 budgeted revenues<br />
associated with the lease and also plans for an additional reduction in lease revenues in FY<strong>2010</strong>.<br />
This reduction in revenues has limited the <strong>City</strong>’s ability to increase the project budget for FY<strong>2010</strong>.<br />
F-3 Fiscal Year 2009 Annual Budget
CIP Overview<br />
Major Capital Projects Changes for FY <strong>2010</strong> (cont’d)<br />
Mid Town CRA<br />
The <strong>City</strong> <strong>of</strong> <strong>Lakeland</strong> anticipates a 16% reduction in Tax Increment Revenues within the Mid Town<br />
CRA district in FY<strong>2010</strong>. This reduction is reflected through a reduction in miscellaneous landscape<br />
and model block improvements.<br />
Parking<br />
$173k for Lighting project in Main and Orange Street Parking Garages<br />
$115k for exterior coating <strong>of</strong> Main Street Garage<br />
Water and Wastewater<br />
As with many other municipalities around the country, the <strong>City</strong> <strong>of</strong> <strong>Lakeland</strong> has seen a substantial<br />
reduction in new construction. This reduction in new construction has caused the impact fee<br />
revenues for Wastewater projects to materially decrease in FY2009 and FY<strong>2010</strong>. This reduction<br />
directly impacts the <strong>City</strong>’s ability to start new impact fee projects in FY<strong>2010</strong>, which are reflected in<br />
the 10-year capital improvement fund.<br />
Electric<br />
The Electric Utility reduced its planned transfer <strong>of</strong> $37.1 million from its operating accounts to its<br />
capital fund in FY<strong>2010</strong> to $23.8 million. This reduction is primarily a result <strong>of</strong> a recessed economy<br />
within <strong>Lakeland</strong> Electric’s service territory. As noted within the other capital funds, this reduction will<br />
have a direct impact on the number <strong>of</strong> new projects the utility can start in FY<strong>2010</strong>.<br />
The prior year showed a capital improvement plan for the <strong>City</strong>’s Solid Waste Division. No qualifying capital<br />
projects are scheduled for this division within the next 10 years, subsequently removing the need for a<br />
supporting worksheet.<br />
The prior year showed a capital improvement plan for the <strong>City</strong>’s Cemetery Division. This Division’s capital<br />
requirements will now be funded and captured within the Public Improvement Fund.<br />
There are no material additional operating costs anticipated in direct relation to the completion <strong>of</strong> the noted<br />
capital projects. Because most <strong>of</strong> the projects are either Renewal & Replacement (R&R) or acquisition<br />
related, they will not have any identifiable efficiencies within FY<strong>2010</strong>.<br />
Did you know…<br />
Lake Mirror was first known as Deep<br />
Lake, then called Bushy Lake and<br />
finally named Lake Mirror because<br />
objects were so perfectly reflected in<br />
the waters.<br />
F-4 Fiscal Year 2009 Annual Budget
F – 5<br />
TRANSPORTATION<br />
CAPITAL IMPROVEMENT PLAN<br />
ADJUSTED<br />
2009 <strong>2010</strong> 2011 2012 2013 2014 2015 2016 2017 2018 2019<br />
BUDGET PROPOSED PROJECTED PROJECTED PROJECTED PROJECTED PROJECTED PROJECTED PROJECTED PROJECTED PROJECTED<br />
REVENUES:<br />
Local Option Gas Tax - 6 cents 2,276,308 2,300,000 2,307,000 2,314,000 2,321,000 2,328,000 2,335,000 2,342,000 2,349,000 2,356,000 2,363,000<br />
Local Option Gas Tax - 5 cents 1,456,815 1,458,000 1,462,000 1,466,000 1,470,000 1,474,000 1,478,000 1,482,000 1,486,000 1,490,000 1,494,000<br />
State Revenue Sharing Gas Tax - 8th cent 724,500 750,000 752,000 754,000 756,000 758,000 760,000 762,000 764,000 766,000 768,000<br />
Local Option Gas Tax - 9th cent 461,182 462,000 463,000 464,000 465,000 466,000 467,000 468,000 469,000 470,000 471,000<br />
Investments & Earnings 275,000 92,461 92,623 92,785 92,946 106,409 133,243 133,474 133,705 133,936 134,167<br />
Special Assessments - Alleys, Sts & Sidewalks 14,703 5,000 5,000 5,000 5,000 5,000 5,000 5,000 5,000 5,000 5,000<br />
Impact Fees - District 1 3,436,814 1,087,053 2,126,871 537,053 1,987,053 537,053 537,053 537,053 537,053 537,053 537,053<br />
Impact Fees - District 2 3,293,094 325,000 325,000 325,000 625,000 625,000 625,000 625,000 625,000 625,000 625,000<br />
Impact Fees - District 3 280,000 540,000 540,000 540,000 640,000 640,000 640,000 471,178<br />
Bond Issue - East-West Connector 2,200,000 6,800,000<br />
Internal Loan - East-West Connector 8,671,508<br />
County Grant - E-W Connector (Applied to prin) 2,200,000<br />
Fed Grant - E-W Connector (Applied to prin) 3,600,000<br />
Bond Issue - Waring Road 4,500,000<br />
Internal Loan - Carpenter's Way 2,000,000 2,000,000<br />
OTTED Grant - Fairbanks/Bella Vista 543,434<br />
OTTED Grant - Signalization <strong>of</strong> Ramps County Line/I-4 1,052,700<br />
FDOT Grants:<br />
Socrum Loop / I-4 Interchange 7,797<br />
Wabash / Sloan Sidewalk (GJ Blvd) 210,705<br />
Lime Street Two-Way Conversion 215,319<br />
Sidewalk Impr - Bartow Rd & Main St. 50,765<br />
USF Campus Development Agreement - SR33 5,096,906<br />
JPA for Intown Bypass Phase 2 149,764<br />
Robson St Neighborhood Sidewalk 31,664<br />
Transfer from CRA 24,221<br />
FDOT Traffic Signal Maintenance Reimbursement 164,091 169,014 174,084 179,307 184,686 190,226 195,933 201,811 207,866 214,102 220,525<br />
Transfer from PIF - N.Florida Ave Median Closure<br />
Developer Contributions 57,841<br />
Unappropriated Surplus 1,187,878 605,152 20,218 81,879 (29,523) (146,653) 47,271 195,497 (233,050) (196,340) (304,035)<br />
TOTAL REVENUES 39,683,009 21,093,680 8,267,796 6,759,023 8,517,162 6,983,036 7,223,500 7,223,012 6,343,574 6,400,751 6,313,710<br />
EXPENSES:<br />
Sidewalk Projects 2,083,020 1,016,075 856,237 863,004 834,394 856,426 879,119 902,493 926,567 951,365 889,215<br />
Street Resurfacing and Sealing 2,224,000 2,256,085 2,393,651 2,326,706 2,360,257 2,494,310 2,443,875 2,978,958 2,614,568 2,550,711 2,587,397<br />
Street Improvements 26,392,372 14,739,520 1,239,520 1,239,520 964,520 964,520 964,520 964,520 964,520 964,520 964,520<br />
Impact Fee Projects - District 1 3,436,814 1,087,053 2,126,871 537,053 1,987,053 537,053 537,053 537,053 537,053 537,053 537,053<br />
Impact Fee Projects - District 2 3,293,094 325,000 325,000 325,000 625,000 625,000 625,000 625,000 625,000 625,000 625,000<br />
Impact Fee Projects - District 3 280,000 540,000 540,000 540,000 640,000 640,000 640,000 471,178<br />
Traffic Operations Projects 520,542 392,014 411,584 417,807 424,186 570,726 403,933 546,811 551,866 573,102 586,525<br />
Miscellaneous Improvements 745,582 181,000 106,000 181,000 525,000 183,000 108,000 183,000 110,000 185,000 110,000<br />
Contributions to Other Funds 707,585 556,933 268,933 328,933 156,752 112,000 622,000 14,000 14,000 14,000 14,000<br />
TOTAL EXPENSES 39,683,009 21,093,680 8,267,796 6,759,023 8,517,162 6,983,036 7,223,500 7,223,012 6,343,574 6,400,751 6,313,710
TRANSPORTATION<br />
CAPITAL IMPROVEMENT PLAN<br />
ADJUSTED<br />
2009 <strong>2010</strong> 2011 2012 2013 2014 2015 2016 2017 2018 2019<br />
BUDGET PROPOSED PROJECTED PROJECTED PROJECTED PROJECTED PROJECTED PROJECTED PROJECTED PROJECTED PROJECTED<br />
F – 6<br />
UNAPPROPRIATED SURPLUS:<br />
Beginning Balance 2,841,791 1,653,913 1,048,760 1,028,542 946,664 976,187 1,122,840 1,075,569 880,072 1,113,122 1,309,462<br />
Sources/(Uses) (1,187,878) (605,152) (20,218) (81,879) 29,523 146,653 (47,271) (195,497) 233,050 196,340 304,035<br />
Ending Balance 1,653,913 1,048,760 1,028,542 946,664 976,187 1,122,840 1,075,569 880,072 1,113,122 1,309,462 1,613,497<br />
SIDEWALK PROJECTS:<br />
Sidewalk Repair & Replacement (includes ADA) 725,000 672,075 692,237 713,004 734,394 756,426 779,119 802,493 826,567 851,365 789,215<br />
George Jenkins Blvd. Sidewalk 377,138<br />
Sidewalk Contingency - Developer Contrib. 227,386<br />
Bartow Rd. & Main Street 51,599<br />
Highland Dr. from Old 37 to S. Florida Ave. 82,552<br />
SR 33 (Old Combee Rd/N. Socrum Loop Rd) 68,000<br />
Central Ave Sidewalk-Sikes Blvd. to Ruby St. 240,000<br />
Deter Rd. from Hallam Dr. to Lake Miriam Dr. 87,500<br />
Skipper Place, Glendale St. to Regency Apts. 17,000<br />
Pablo Street & Windsor Street Sidewalks 37,000<br />
Sidewalks for Collector Streets 100,000 100,000 100,000 100,000 100,000 100,000 100,000<br />
Crystal Lake Dr (New Jersey Rd. to Lake Hollingsworth 43,500 Dr) 246,500<br />
Lime Street Brick Crosswalks @ Massachusetts & Iowa 260,282<br />
Lake Parker Ave Sidewalk 1,500<br />
Robson Street Neighborhood Sidewalk 393<br />
Ariana Street from Unitah Ave. to S. Dakota Ave. 5,670 10,000 110,000<br />
Buckingham Avenue from Edgewood Drive to Carleton St 150,000<br />
TOTAL SIDEWALK PROJECTS 2,083,020 1,016,075 856,237 863,004 834,394 856,426 879,119 902,493 926,567 951,365 889,215<br />
STREET RESURFACING AND SEALING PROJECTS:<br />
Street Resurfacing and Sealing 2,139,000 2,171,085 2,203,651 2,236,706 2,270,257 2,304,310 2,338,875 2,373,958 2,409,568 2,445,711 2,482,397<br />
Pavement Markings 85,000 85,000 90,000 90,000 90,000 90,000 105,000 105,000 105,000 105,000 105,000<br />
Socrum Loop Road Resurfacing 500,000<br />
Pavement Management Information System 100,000 100,000 100,000<br />
TOTAL STREET RESURFACING PROJECTS 2,224,000 2,256,085 2,393,651 2,326,706 2,360,257 2,494,310 2,443,875 2,978,958 2,614,568 2,550,711 2,587,397
TRANSPORTATION<br />
CAPITAL IMPROVEMENT PLAN<br />
ADJUSTED<br />
2009 <strong>2010</strong> 2011 2012 2013 2014 2015 2016 2017 2018 2019<br />
BUDGET PROPOSED PROJECTED PROJECTED PROJECTED PROJECTED PROJECTED PROJECTED PROJECTED PROJECTED PROJECTED<br />
STREET IMPROVEMENT PROJECTS:<br />
Undesignated Projects 44,000 50,000 50,000 50,000 50,000 50,000 50,000 50,000 50,000 50,000 50,000<br />
Alley Maintenance & Improvements 50,000 50,000 50,000 50,000 75,000 75,000 75,000 75,000 75,000 75,000 75,000<br />
Edgewood Dr. Widening - Debt Service, <strong>City</strong> share (To'16) 100,000 100,000 100,000 100,000 100,000 100,000 100,000 100,000 100,000 100,000 100,000<br />
Intersection Impr - Beacon / Lincoln / Harden / S. Fl.309,848<br />
N. Combee Road Intersection Realignment 46,914<br />
Fairbanks Street Improvement 39,313<br />
Lime Street - Two Way Conversion 335,940<br />
Medulla / Waring Road Imps. 3,516<br />
Sleepy Hill Road - 98 to Kathleen Rd. (4-lane) 4,360<br />
FDOT-Rd Impr Socrum Loop Rd/I-4 Interchange 295<br />
FDOT- JPA for <strong>Lakeland</strong> In-Town By Pass Phase II 149,764<br />
Downtown Brick Crosswalks 85,511<br />
East-West Connector 10,872,983 6,800,000<br />
East-West Connector (Grant rev applied to principal) 5,800,000<br />
East-West Connector (Debt Service on Bond) to 2028 753,114 753,114 753,114 453,114 453,114 453,114 453,114 453,114 453,114 453,114<br />
N. Florida Ave. Median Imp. (Peachtree St & Oak St)122,360<br />
Waring Road Extension 4,500,000<br />
Waring Road Extension (<strong>City</strong> share <strong>of</strong> debt service) 286,406 286,406 286,406 286,406 286,406 286,406 286,406 286,406 286,406 286,406<br />
North <strong>Lakeland</strong> Stormwater Master Plan - Land Acquisition 182,910<br />
Ingraham Ave @ FSC Raised Brick Crosswalks 95,052<br />
USF Campus Development Agreement - SR33 5,096,906<br />
Carpenter's Way (D/S for $4.0 Million paid by Imp Fees) 2,000,000 2,000,000<br />
OTTED Grant - Signalization <strong>of</strong> Ramps County Line/I-4 1,052,700<br />
North Florida Ave Widening 200,000<br />
F – 7<br />
TOTAL STREET IMPROVEMENT PROJECTS 26,392,372 14,739,520 1,239,520 1,239,520 964,520 964,520 964,520 964,520 964,520 964,520 964,520
F – 8<br />
TRANSPORTATION<br />
CAPITAL IMPROVEMENT PLAN<br />
ADJUSTED<br />
2009 <strong>2010</strong> 2011 2012 2013 2014 2015 2016 2017 2018 2019<br />
BUDGET PROPOSED PROJECTED PROJECTED PROJECTED PROJECTED PROJECTED PROJECTED PROJECTED PROJECTED PROJECTED<br />
TRANSPORTATION IMPACT FEE PROJECTS:<br />
District 1:<br />
In-Town-By-Pass - Bartow Rd to George Jenkins Blvd.69,694<br />
Sleepy Hill - Debt Service on <strong>City</strong> Share 550,800 550,000 1,589,818 450,000<br />
Carpenter's Way Imp. (Corporate to Wedgewood) 459,564<br />
Carpenter's Way Debt Service (10 years) 537,053 537,053 537,053 537,053 537,053 537,053 537,053 537,053 537,053 537,053 537,053<br />
Fairbanks Street Improvement 1,754,703<br />
Signalization <strong>of</strong> Ramps County Line/I-4 15,000<br />
Highway 33 Road Improvements 50,000 1,000,000<br />
District 2:<br />
Waring Road Extension 1,443,652<br />
Waring Road Extension (Impact Fee share <strong>of</strong> debt service) 325,000 325,000 325,000 325,000 325,000 325,000 325,000 325,000 325,000 325,000<br />
Beacon Rd Extension 214,598<br />
Wabash Ave Extension 460,629<br />
East-West Connector 1,174,215 300,000 300,000 300,000 300,000 300,000 300,000 300,000<br />
District 3:<br />
Lk. Miriam Dr. (S.R. 37. - Cleveland Heights Blvd.) 140,000<br />
Debt Service - Edgewood Dr Widening (Paid in '16) 140,000 540,000 540,000 540,000 640,000 640,000 640,000 471,178<br />
TOTAL TRANS. IMPACT FEE PROJECTS 7,009,908 1,952,053 2,991,871 1,402,053 3,252,053 1,802,053 1,802,053 1,633,231 1,162,053 1,162,053 1,162,053<br />
TRAFFIC PROJECTS:<br />
Traffic Calming Projects 50,906 50,000 50,000 50,000 50,000 50,000 50,000 50,000 50,000 50,000 50,000<br />
Undesignated Projects 5,000 5,000 5,000 5,000 5,000 5,000 5,000 5,000 5,000 5,000 5,000<br />
Traffic Sign Rehabilitation 50,000 50,000 50,000 50,000 50,000 50,000 50,000 50,000 50,000 50,000 50,000<br />
Pedestrian Safety Awareness Campaign 10,000 10,000 10,000 10,000 10,000 10,000 10,000 10,000 10,000 10,000 10,000<br />
ITS Maintenance 13,254 15,000 15,000 15,000 15,000 15,000 15,000 15,000 15,000 15,000 15,000<br />
Flashing Signal Upgrades 66,000<br />
Painting <strong>of</strong> Traffic Signal Structures 15,000<br />
Victoria Manor Apts - Traffic Signal 60,000<br />
Light Emitting Diode (LED) Signal lamp replacement 26,746 25,500 50,000 51,000 52,000 53,000 53,000 55,000 57,000 59,000 61,000<br />
Socrum Loop Rd @ Old Combee Rd (Signal Re-Build) 132,000<br />
MLK @ 5th St Traffic Signal Re-Build 140,000<br />
Ingraham Av @ Parker St Traffic Signal Re-Build 145,000<br />
Ingraham Av @ Main St Traffic Signal Re-Build 150,000<br />
Traffic Studies and Analysis 25,000 25,000 25,000 25,000 25,000 25,000 25,000 25,000 25,000 25,000 25,000<br />
FHWA Regulatory and Warning Signage Upgrade 32,500 32,500 32,500 32,500 32,500 32,500<br />
Advanced Traffic Management System O & M 164,091 169,014 174,084 179,307 184,686 190,226 195,933 201,811 207,866 214,102 220,525<br />
Harden/Grasslands Traffic Signal 2,045<br />
Socrum Loop @ Daughtery Rd Traffic Signal Re-build 135,000<br />
Traffic Counter Replacement 10,000<br />
TOTAL TRAFFIC PROJECTS 520,542 392,014 411,584 417,807 424,186 570,726 403,933 546,811 551,866 573,102 586,525
F – 9<br />
TRANSPORTATION<br />
CAPITAL IMPROVEMENT PLAN<br />
ADJUSTED<br />
2009 <strong>2010</strong> 2011 2012 2013 2014 2015 2016 2017 2018 2019<br />
BUDGET PROPOSED PROJECTED PROJECTED PROJECTED PROJECTED PROJECTED PROJECTED PROJECTED PROJECTED PROJECTED<br />
MISCELLANEOUS IMPROVEMENT PROJECTS:<br />
Survey for <strong>City</strong>wide GIS Database 223<br />
Contingency 89,000 100,000 100,000 100,000 100,000 100,000 100,000 100,000 100,000 100,000 100,000<br />
Oxford Lumber Company purchase 321,968<br />
Replacement Cement Silo 10,704<br />
Concrete Crushing 75,000 75,000 75,000 75,000 75,000<br />
Tigertown - Resurface Parking Lot 225,000<br />
Upgrade Alarm System 32,343<br />
Office in C&M Warehouse 6,000<br />
C&M Restroom 30,000<br />
Sikes Blvd. Bridge Recoating 192,000<br />
Electric Surveys 5,344<br />
Concrete Truck 250,000<br />
Roadway System Permit Recertification 6,000 6,000 6,000 8,000 8,000 8,000 8,000 10,000 10,000 10,000<br />
TOTAL MISC. IMPROVEMENT PROJECTS 745,582 181,000 106,000 181,000 525,000 183,000 108,000 183,000 110,000 185,000 110,000<br />
CONTRIBUTIONS TO OTHER FUNDS:<br />
Parking System:<br />
Orange Street Garage 418,752 130,000 306,000<br />
Main Street Parking Garage 115,000 204,000<br />
Debt service - Verizon property (10 yr Int. loan @ 5%) 88,933 88,933 88,933 88,933 44,752<br />
Munn Park Surface Parking Lot Paving 13,500<br />
Multi Space Parking Meters 16,400<br />
Lighting Retr<strong>of</strong>it - Main and Orange Street Garage 173,000<br />
Structural Inspection <strong>of</strong> Parking Garages 10,000 10,000 10,000 12,000 12,000 12,000 14,000 14,000 14,000 14,000<br />
Debt Service - Lake Mirror Park 100,000 100,000 100,000 100,000 100,000 100,000 100,000<br />
Transfer to Mid-town CRA - Internal Loan Hope VI Project 70,000 70,000 70,000<br />
TOTAL CONTRIB. TO OTHER FUNDS 707,585 556,933 268,933 328,933 156,752 112,000 622,000 14,000 14,000 14,000 14,000<br />
TOTAL EXPENSES 39,683,009 21,093,680 8,267,796 6,759,023 8,517,162 6,983,036 7,223,500 7,223,012 6,343,574 6,400,751 6,313,710
F – 10<br />
PUBLIC IMPROVEMENT<br />
CAPITAL IMPROVEMENT PLAN<br />
ADJUSTED<br />
2009 <strong>2010</strong> 2011 2012 2013 2014 2015 2016 2017 2018 2019<br />
BUDGET PROPOSED PROJECTED PROJECTED PROJECTED PROJECTED PROJECTED PROJECTED PROJECTED PROJECTED PROJECTED<br />
REVENUES:<br />
LRMC Lease Payments 10,531,000 10,500,000 10,500,000 10,689,000 10,881,000 11,077,000 11,276,000 11,479,000 11,686,000 11,896,000 12,110,000<br />
Investment Earnings 250,717 196,875 196,875 200,419 204,019 207,694 211,425 258,278 262,935 267,660 272,475<br />
Miscellaneous Grant Revenues:<br />
Beautification Grants (50%) 13,835<br />
FRDAP Grants 150,000<br />
Rotary Club - Common Ground 300,000<br />
Kaliedescope / Common Ground 537,000<br />
FDOT JPA-Landscape 92 to Iowa (Memorial Blvd III)27,670<br />
FDOT JPA-Landscape Iowa-Lk Prkr (Memorial Blvd III) 33,435<br />
FDOT-LAP Landscape I-4 and Hwy 98 (100%) 23,547<br />
FDOT-I4 & Memorial Blvd Bridge Beautification 182,524<br />
FDOT-I4 & Kathleen Interchange Landscape 281,158<br />
Miscellaneous Internal Loans:<br />
Coleman Bush Renovation (10 years) 1,165,000<br />
USF Contribution / Loan through LEDC (7 yrs) 1,000,000 1,000,000<br />
LPD - CAD / Reporting System Replacement (7 Yrs) 1,080,000<br />
Heritage Town Center Training Facility 810,000<br />
Transfers From:<br />
Transportation Fund 100,000 100,000 100,000 100,000 100,000 100,000 100,000<br />
Impact Fee Fund:<br />
Parks & Recreation 1,029,832 109,532 250,000 2,000,000 750,000 1,250,000<br />
Police 500,000 500,000<br />
Lake Mirror Park:<br />
CRA contribution to debt service 250,000 350,000 350,000 350,000 350,000 350,000 350,000 250,000<br />
Marchant Stadium Expansion Revenues:<br />
State <strong>of</strong> Florida - Office <strong>of</strong> Tourism 466,668 466,668 466,668 466,668 466,668 466,668 466,668<br />
Polk County Tourist Development Council 192,685 192,685 192,685 192,685 192,685 192,685 192,685<br />
Detroit Tiger - Commissions 234,797 234,797 234,797 234,797 234,797 234,797 234,797<br />
Detroit Tiger - Commissions-seating loan (Paid '16) 62,792 55,470 55,470 55,470 55,470 55,470 55,470 55,470<br />
Detroit Tiger - Commissions-Fetzer loan (Paid '16) 140,625 140,625 140,625 140,625 140,625 140,625 140,625 140,625<br />
Library Revenues:<br />
County Library Cooperative 644,082 200,000 200,000 200,000 200,000 200,000 200,000 200,000 200,000 200,000 450,000<br />
Fire Department Revenues:<br />
Fire Protection Fees 373,706 300,000 250,000 250,000 200,000 200,000 175,000 175,000 175,000 175,000 175,000<br />
Transfer from Imp. Fee Fund 200,000 200,000 200,000 200,000 200,000 89,301 275,000 450,000 150,000<br />
Bonds Proceeds - Fire Station #7 3,000,000<br />
Nextel Antenna Tower Lease 30,000 30,000 30,000 30,000 30,000 30,000 30,000 30,000 30,000 30,000 30,000<br />
<strong>Lakeland</strong> Vision 90,000<br />
Oak Hill Cemetery - Fund Transfer 110,000<br />
Contributions & Donations - Bleacher Repairs 25,000<br />
Reimb. for Training Center D/S from User Depts (5 yrs) 112,426 112,426 112,426 112,426 112,426<br />
Unappropriated Surplus - Used / (Generated) 4,730,959 (119,035) 1,023,472 408,071 269,657 299,837 (44,179) (51,376) (945,855) 1,018,615 (583,118)<br />
TOTAL REVENUES 24,147,032 15,490,043 14,053,018 13,880,161 15,637,347 14,506,503 13,388,492 12,536,997 12,183,080 17,037,275 13,854,359
PUBLIC IMPROVEMENT<br />
CAPITAL IMPROVEMENT PLAN<br />
ADJUSTED<br />
2009 <strong>2010</strong> 2011 2012 2013 2014 2015 2016 2017 2018 2019<br />
BUDGET PROPOSED PROJECTED PROJECTED PROJECTED PROJECTED PROJECTED PROJECTED PROJECTED PROJECTED PROJECTED<br />
EXPENSES:<br />
Parks 6,540,602 2,576,531 3,373,632 3,158,654 3,249,147 3,069,147 3,939,147 2,743,851 1,915,000 2,405,270 610,003<br />
Recreation 2,937,067 815,662 950,662 685,662 798,162 696,862 260,937 400,000 240,000 150,000 600,000<br />
Parks & Recreation Impact Fee Projects 1,029,832 109,532 250,000 2,000,000 750,000 1,250,000<br />
Library 704,082 200,000 200,000 200,000 200,000 200,000 200,000 200,000 200,000 200,000 450,000<br />
Oak Hill Cemetery 28,200 53,250 68,300 23,350 103,400 3,450 43,500 3,550 31,600 3,650<br />
Police Department 1,419,221 984,421 734,421 234,421 184,421 234,421 184,421 234,421 592,211<br />
Fire Department 1,465,738 1,256,585 1,158,460 1,164,185 1,173,685 1,066,586 675,000 675,000 950,000 4,125,000 825,000<br />
Non-Departmental 2,613,399 2,500,497 1,593,497 2,006,497 1,769,844 2,043,014 1,725,000 1,729,000 1,743,000 1,168,656 923,003<br />
Contributions to Other Funds 7,437,091 7,018,615 5,989,096 6,112,441 6,238,737 6,343,071 6,400,536 6,511,225 6,539,320 8,956,749 9,192,703<br />
TOTAL EXPENSES 24,147,032 15,490,043 14,053,018 13,880,161 15,637,347 14,506,503 13,388,492 12,536,997 12,183,080 17,037,275 13,854,359<br />
UNAPPROPRIATED SURPLUS:<br />
Beginning Balance 7,838,033 3,107,074 3,226,109 2,202,638 1,794,567 1,524,910 1,225,074 1,269,252 1,320,628 2,266,483 1,247,868<br />
Sources/(Uses) (4,730,959) 119,035 (1,023,472) (408,071) (269,657) (299,837) 44,179 51,376 945,855 (1,018,615) 583,118<br />
Ending Balance 3,107,074 3,226,109 2,202,638 1,794,567 1,524,910 1,225,074 1,269,252 1,320,628 2,266,483 1,247,868 1,830,986<br />
F – 11<br />
EXPENSES:<br />
PARKS:<br />
Beautification Projects (Partial Grant & 100% <strong>City</strong> Funded):<br />
Neighborhood Beautification 50,000 50,000 50,000 50,000 50,000 50,000 50,000 50,000 50,000 50,000 50,000<br />
Beautification Projects (50% Grants):<br />
Memorial Boulevard 27,670<br />
Beautification Projects (100% Grants):<br />
I-4 and U.S. 98 North 23,547<br />
FDOT-I4 & Kathleen Interchange Landscape 281,158<br />
I-4 & Memorial Bridge Beautification 182,524<br />
Bryant Stadium Complex:<br />
Henley Field Structural Inspections 3,750<br />
Henley Field - Locker Room & Batting Cage 80,000<br />
Bryant Stadium - Structural Repairs (Concrete) 10,253<br />
Henley Field - Structural Repairs 300,000<br />
Common Ground Park:<br />
Park Construction 1,810,258<br />
Crystal Grove Park:<br />
Playground Replacement 120,000<br />
Cypress Youth Complex:<br />
Construction ($2.3m <strong>City</strong> & $500k Imp Fees) 177,977<br />
Soccer Complex 4,444 500,000
F – 12<br />
PUBLIC IMPROVEMENT<br />
CAPITAL IMPROVEMENT PLAN<br />
ADJUSTED<br />
2009 <strong>2010</strong> 2011 2012 2013 2014 2015 2016 2017 2018 2019<br />
BUDGET PROPOSED PROJECTED PROJECTED PROJECTED PROJECTED PROJECTED PROJECTED PROJECTED PROJECTED PROJECTED<br />
Dobbins Park:<br />
Playground Replacement 200,000<br />
Freedom Park:<br />
Park Construction 192,926<br />
Horney Park:<br />
Playground 60,000<br />
Lake Bonny Community Park:<br />
Playground Replacement 180,000<br />
Lake Mirror Park:<br />
Hollis Gardens Sidewalk Lighting 95,000<br />
Regency Hotel - Internal Loan Subsidy (Paid 2015) 100,000 100,000 100,000 100,000 100,000 100,000 100,000<br />
Lake Mirror Park - Construction 661,186<br />
Lake Mirror Park - Debt Service (Paid 2018) 1,000,000 1,000,000 1,500,000 1,500,000 1,500,000 1,500,000 1,500,000 1,500,000 1,500,000 2,295,270<br />
Internal Loan - Motel ($450,000 for 10 years @ 6.5%)59,485 59,485 59,485 59,507<br />
Purchase Nally Property ($2,500/mo. for 15 years) 30,000 30,000 30,000 30,000 30,000 30,000 30,000 30,000 30,000 30,000 30,000<br />
Barnett Park Playground Replacement 200,000<br />
Lake Mirror Loggia 45,824<br />
Replace Wood Floor in Magnolia Building 100,000<br />
Lake Parker Park:<br />
Bathroom Renovations 100,000<br />
Playground Replacement 180,000<br />
Dog Park 75,000<br />
Marchant Stadium:<br />
Expansion - Debt Service (To 2015) 891,354 894,150 894,150 894,150 894,150 894,150 894,150<br />
Expansion - Debt Service (To 2015) <strong>City</strong> Share 28,527 28,527 28,527 28,527 28,527 28,527 28,527<br />
Seating - Int. Loan Debt Service (Paid in '16) 62,792 55,470 55,470 55,470 55,470 55,470 55,470 55,470<br />
Marchant Stadium Structural Survey 5,000 5,000<br />
Stadium Scoreboard - Debt Service paid in '10 45,740 22,899<br />
Emergency Bleacher Repairs 25,000<br />
Miami Park:<br />
Playground Replacement 50,000<br />
Peterson Park:<br />
Playground Replacement 200,000<br />
Sertoma Park:<br />
Picnic Shed Replacement 40,000<br />
Park Renovation 55,000
F – 13<br />
PUBLIC IMPROVEMENT<br />
CAPITAL IMPROVEMENT PLAN<br />
ADJUSTED<br />
2009 <strong>2010</strong> 2011 2012 2013 2014 2015 2016 2017 2018 2019<br />
BUDGET PROPOSED PROJECTED PROJECTED PROJECTED PROJECTED PROJECTED PROJECTED PROJECTED PROJECTED PROJECTED<br />
Tigertown:<br />
Stadium Facility Improvements (Debt paid in '16) 111,000 111,000 111,000 111,000 111,000 111,000 161,000 378,381<br />
Minor League Field Fencing 85,000<br />
Infield and Wall Improvements 100,000 50,000<br />
Hanger #3 Renovations 100,000<br />
H.V.A.C. Retr<strong>of</strong>it 200,000<br />
Repair Kitchen Floor 28,000<br />
Washington Park:<br />
Playground Replacement 145,000<br />
Webster Park:<br />
Resurface Basketball Court 25,000<br />
Playground Replacement 110,000<br />
Westside / Southwest Complexes:<br />
S.W./W.S. Complexes-Bathroom Upgrade 55,000<br />
Southwest Complex - Clubhouse Remodel 125,000<br />
Westside Complex Concession Stand Rehab 125,000<br />
Woodlake Park:<br />
Playground Replacement 100,000<br />
Irrigation Projects:<br />
Centralized Irrigation System 50,000 50,000<br />
Sportsfield Projects:<br />
Sports Field Lighting Upgrade 175,000<br />
Sports Complex Scoreboard Replacement 50,000<br />
Sports Field Lighting Replacement 150,000<br />
Miscellaneous Parks Projects:<br />
Park Consultant Design Services 25,000 25,000 25,000 25,000 25,000 25,000 30,000 30,000 30,000 30,000 30,000<br />
In-Town Bypass Maintenance 5,175<br />
Landscape Harden @ Lakeside Village Mall 25,513<br />
Nursery Greenhouse and Facilities 13,190<br />
Pavement Mgmt System - (Re-pave Park Paths) 28,309 50,000 50,000 50,000 50,000<br />
Holiday Decorations 50,000 50,000<br />
Lake Hunter Boat Ramp Picnic Pavilion 35,000<br />
Interlachen Park - Camellia Garden 50,000<br />
Bartow Highway Railroad Planting 30,000<br />
Parks Signage Upgrade - <strong>City</strong> Wide 35,000<br />
Southside Maintenance Facility 250,000<br />
TOTAL PARKS 6,540,602 2,576,531 3,373,632 3,158,654 3,249,147 3,069,147 3,939,147 2,743,851 1,915,000 2,405,270 610,003
F – 14<br />
PUBLIC IMPROVEMENT<br />
CAPITAL IMPROVEMENT PLAN<br />
ADJUSTED<br />
2009 <strong>2010</strong> 2011 2012 2013 2014 2015 2016 2017 2018 2019<br />
BUDGET PROPOSED PROJECTED PROJECTED PROJECTED PROJECTED PROJECTED PROJECTED PROJECTED PROJECTED PROJECTED<br />
RECREATION:<br />
Coleman Bush Building:<br />
Building Renovation ($1,765,000 total project) 1,359,804<br />
Debt Service - Paid <strong>of</strong>f in 2014 236,917 236,917 236,917 236,917 236,917 236,917<br />
Kelly Recreation Complex:<br />
Kelly Rec - A/C & Expansion (<strong>City</strong> share <strong>of</strong> $1m project) 471,082<br />
Kelly Rec - Replace Weight Room Equipment 56,440 10,000<br />
Gandy/Kelly Rec Painting & Repair 60,000<br />
Kelly Rec - Tennis Courts Relighting 120,000<br />
Gandy Pool Heat Pump Replacement 58,000<br />
Gandy Pool Gas Heater Replacement 40,000<br />
Gandy & Simpson / Lane Lines 42,000<br />
Gandy & Simpson Pools - Shade Awnings 30,000<br />
Kelly Rec - Playground 85,000<br />
Kelly Rec - Fence Tennis Courts 35,000<br />
Gandy - Air / Heat Installed in Locker Rooms 52,000<br />
Gandy Pool Deck Repair and Upgrade 90,000<br />
Gym Ro<strong>of</strong> Replacement 125,000<br />
Lake Mirror Center:<br />
Update Theater Lighting 9,769<br />
Theater Ceiling / Seats / HVAC replacement 50,000 350,000<br />
Sound System Improvements 26,000<br />
Furniture Replacement 99,500<br />
Northeast Recreation Complex:<br />
Construction (9 million <strong>City</strong> + 1.5 million Imp Fees) 16,392 450,000<br />
Debt Service - NE Rec Complex (7 years)<br />
Debt Service - Rec Complex Property 143,745 143,745 143,745 143,745 143,745 143,745 35,937<br />
Simpson Park:<br />
Pool Deck Repair 120,050<br />
Replace Weight Room Equipment 23,000<br />
Land Acquisition 35,085<br />
Bathroom Renovation 45,000<br />
Ro<strong>of</strong> Replacement 150,000<br />
Playground Replacement 90,000<br />
Gas Heater/Pool Blankets 165,000<br />
Steel Outer Perimeter Fence 80,000<br />
Simpson Park Pool Resurfacing 175,000<br />
Veterans Park:<br />
Overlaying Tennis Courts with 1" asphalt 72,032 75,000 75,000<br />
Miscellaneous Recreation Projects:<br />
Renovate Buildings and Playgrounds 139,751 100,000 100,000 100,000 100,000 150,000 150,000 150,000 150,000 150,000 150,000<br />
Pool & Vacuum Pump, Valve Replacements 34,200<br />
TOTAL RECREATION 2,937,067 815,662 950,662 685,662 798,162 696,862 260,937 400,000 240,000 150,000 600,000
F – 15<br />
PUBLIC IMPROVEMENT<br />
CAPITAL IMPROVEMENT PLAN<br />
ADJUSTED<br />
2009 <strong>2010</strong> 2011 2012 2013 2014 2015 2016 2017 2018 2019<br />
BUDGET PROPOSED PROJECTED PROJECTED PROJECTED PROJECTED PROJECTED PROJECTED PROJECTED PROJECTED PROJECTED<br />
P&R IMPACT FEE PROJECTS:<br />
District 1:<br />
Freedom Park 200,000<br />
Simpson Park Land Acquisition 28,184<br />
Impact Fee Study 2,640<br />
Coleman Bush expansion 214,460<br />
NE Rec Complex 250,000 2,000,000 500,000<br />
District 2:<br />
Common Ground 8,341<br />
Capital & DS - Kelly Rec A/C & Exp. (Imp Fee share)326,207 109,532<br />
Cypress Youth Complex 250,000 750,000 750,000<br />
TOTAL P&R IMPACT FEE PROJECTS 1,029,832 109,532 250,000 2,000,000 750,000 1,250,000<br />
LIBRARY:<br />
Co-op Funded Projects:<br />
Future Expansion Reserve 547,756 20,000 167,000 160,000 100,000 75,000 45,000 130,000 175,000<br />
Library Furniture 27,000 25,000 100,000<br />
Exterior lighting and signage - (Main) 32,455<br />
Lobby Restroom Renovation (Main) 1,206 10,000<br />
Computer Equipment Upgrade 35,000 40,000 40,000<br />
Technical Services Furniture - Main Library 18,000<br />
Carpet (Main) 665 10,000 125,000<br />
Carpet (Branch) 100,000<br />
Electrical Improvements 5,000<br />
Public Computing Center 140,000<br />
Closed Circuit Camera System Upgrade 15,000 15,000<br />
Interior Ceiling and Lighting 100,000 100,000<br />
Enclose Patio 70,000<br />
Design New Entry 25,000<br />
Construct New Entry 350,000<br />
Meeting Room Renovation (Branch) 90,000<br />
<strong>City</strong> Funded Projects:<br />
Branch Library Emergency A/C Replacement 60,000<br />
TOTAL LIBRARY 704,082 200,000 200,000 200,000 200,000 200,000 200,000 200,000 200,000 200,000 450,000
F – 16<br />
PUBLIC IMPROVEMENT<br />
CAPITAL IMPROVEMENT PLAN<br />
ADJUSTED<br />
2009 <strong>2010</strong> 2011 2012 2013 2014 2015 2016 2017 2018 2019<br />
BUDGET PROPOSED PROJECTED PROJECTED PROJECTED PROJECTED PROJECTED PROJECTED PROJECTED PROJECTED PROJECTED<br />
OAK HILL CEMETERY:<br />
Routine Maintenance 3,200 3,250 3,300 3,350 3,400 3,450 3,500 3,550 3,600 3,650<br />
Oak Hill Expansion Phase III<br />
Oak Hill Expansion Phase IV 25,000<br />
Oak Hill Expansion Phase V 50,000<br />
Oak Hill Irrigation Upgrade 100,000<br />
Resurface Roadways 40,000 40,000<br />
48 Niche Collumbarium 20,000 28,000<br />
Oak Hill Expansion 25,000<br />
TOTAL OAKHILL CEMETERY 28,200 53,250 68,300 23,350 103,400 3,450 43,500 3,550 31,600 3,650<br />
POLICE DEPARTMENT:<br />
LPD Property & Evidence Expansion 94,729<br />
Helicopter Renovation 23,359<br />
General Storage - Property & Evidence Room 10,000<br />
LPD Camera System Repair and Upgrade 8,922<br />
New Flooring/Carpet 50,000 50,000 50,000<br />
Training Center Expansion (Police Impact Fees) 500,000 500,000<br />
A/C Chiller Replacments 450,000<br />
Ro<strong>of</strong> Replacement 10,000 300,000<br />
Replace CAD / Reporting Systems 1,180,000<br />
CAD / Reporting System Repl. (Paid in '17) 92,211 184,421 184,421 184,421 184,421 184,421 184,421 184,421 92,211<br />
Fire Panel 100,000<br />
TOTAL POLICE 1,419,221 984,421 734,421 234,421 184,421 234,421 184,421 234,421 592,211<br />
FIRE DEPARTMENT:<br />
Central Fire Station Debt Service (Paid in '14) 293,635 301,585 308,460 314,185 323,685 327,285<br />
Debt Service - Station #6 200,000 200,000 200,000 200,000 200,000 89,301<br />
Motor Pool Purchases 917,753 650,000 650,000 650,000 650,000 650,000 675,000 675,000 675,000 675,000 675,000<br />
Station #5 Structural Repairs 54,350<br />
Engine Bay Door Upgrade 70,000<br />
Station #1 - Condenser Replacement 35,000<br />
Station #7 - Construction 275,000 3,250,000<br />
Station #7 - Debt Service 150,000<br />
Station 7 Engine Equipment 200,000<br />
TOTAL FIRE 1,465,738 1,256,585 1,158,460 1,164,185 1,173,685 1,066,586 675,000 675,000 950,000 4,125,000 825,000
F – 17<br />
PUBLIC IMPROVEMENT<br />
CAPITAL IMPROVEMENT PLAN<br />
ADJUSTED<br />
2009 <strong>2010</strong> 2011 2012 2013 2014 2015 2016 2017 2018 2019<br />
BUDGET PROPOSED PROJECTED PROJECTED PROJECTED PROJECTED PROJECTED PROJECTED PROJECTED PROJECTED PROJECTED<br />
NON-DEPARTMENTAL:<br />
Neighborhood Projects:<br />
Neighborhood Preservation 30,000 30,000 40,000 40,000 50,000 50,000 60,000 100,000 100,000 100,000 100,000<br />
Neighborhood Matching Grants Program 35,000 35,000 40,000 40,000 45,000 45,000 45,000 65,000 65,000 65,000 65,000<br />
Historic Street Lighting-Cumberland Neighborhoods155,681 50,000 60,000 60,000 60,000 70,000 70,000<br />
Buckingham Street Light Upgrade 6,000<br />
Information Technologies:<br />
D/S for Sunshine St. Loan - Radio Replacement 174,106<br />
Upgrade/Purchase <strong>of</strong> Radio Towers (Paid '12) 264,653 264,653 264,653 264,653<br />
<strong>City</strong> Hall:<br />
<strong>City</strong> Hall Fresh Air & A/C Chillers 200,000<br />
<strong>City</strong> Hall Digital Controls 200,000<br />
Fire Panel Replacement 100,000<br />
Termite Mitigation 75,000<br />
Replace Damaged Doors and Woodwork 35,000<br />
All Other General Fund Buildings:<br />
Air Quality Investigations 6,000<br />
<strong>City</strong> Ro<strong>of</strong> Audit 100,000 150,000<br />
Ro<strong>of</strong> Replacements 130,840 110,000 116,000 122,000 128,000 134,000 141,000 148,000 155,000 163,000 171,000<br />
Air Conditioner Replacements 120,053 60,000 65,000 70,000 75,000 80,000 85,000 90,000 95,000 100,000 105,000<br />
Carpet Replacements 24,219 39,000 41,000 43,000 45,000 47,000 49,000 51,000 53,000 55,000 57,000<br />
Recoating / Sealing 100,000 100,000 100,000 100,000 100,000 100,000 100,000 100,000 100,000 100,000 100,000<br />
Security System Controls (General Fund facilities) 11,546<br />
Miscellaneous Non-Departmental Projects:<br />
ADA Compliance 32,681 25,000 25,000 25,000 25,000 25,000 25,000 25,000 25,000 25,000 25,000<br />
Land Acquisition - (Paid '14)) 152,161 152,161 152,161 152,161 152,161 152,331<br />
Contingency 110,008 150,000 150,000 150,000 150,000 150,000 150,000 150,000 150,000 150,000 150,000<br />
Federal Building Exterior Renovation 77,488<br />
Florida Sheetmetal Demolition 1,970<br />
<strong>Lakeland</strong> Vision 149,886<br />
Ad Valorem Taxes 3,857<br />
Upgrade <strong>City</strong> Elevators 25,000<br />
Debt Service - USF Contrib/Loan - LEDC (Paid '18) 350,000 350,000 350,000 750,000 750,000 1,000,000 1,000,000 1,000,000 1,000,000 410,656<br />
Heritage Town Center - Design & Construction 77,250 810,000<br />
D/S-Heritage Town Center Training Facility (Paid in '14) 189,683 189,683 189,683 189,683 189,683<br />
TOTAL NON DEPARTMENTAL 2,613,399 2,500,497 1,593,497 2,006,497 1,769,844 2,043,014 1,725,000 1,729,000 1,743,000 1,168,656 923,003<br />
CONTRIBUTIONS TO OTHER FUNDS:<br />
General Fund 3,090,000 3,182,700 3,278,181 3,376,526 3,477,822 3,582,157 3,689,622 3,800,310 3,914,320 4,031,749 4,152,702<br />
Fire Station #7 - (6 Personnel per shift) 2,300,000 2,415,000<br />
Dividend assistance 1,950,000 1,975,000 2,000,000 2,025,000 2,050,000 2,050,000 2,050,000 2,050,000 2,050,000 2,050,000 2,050,000<br />
Information Technologies Fund:<br />
VoIP-General Fund Share <strong>of</strong> Phone System Replacement 85,915 85,915 85,915 85,915 85,915 85,915 85,915<br />
<strong>Lakeland</strong> Center Fund:<br />
Capital Transfer 679,231 350,000 350,000 350,000 350,000 350,000 350,000 350,000 350,000 350,000 350,000<br />
Operating Transfer 225,000 225,000 225,000 225,000 225,000 225,000 225,000 225,000 225,000 225,000 225,000<br />
Cleveland Heights Golf Course 325,000 200,000 50,000 50,000 50,000 50,000<br />
Oak Hill Fund 30,000<br />
USF Contribution / Loan through LEDC 1,137,860 1,000,000<br />
TOTAL CONTRIBUTIONS TO OTHER FUNDS 7,437,091 7,018,615 5,989,096 6,112,441 6,238,737 6,343,071 6,400,536 6,511,225 6,539,320 8,956,749 9,192,703<br />
TOTAL EXPENSES 24,147,032 15,490,043 14,053,018 13,880,161 15,637,347 14,506,503 13,388,492 12,536,997 12,183,080 17,037,275 13,854,359
F – 18<br />
DOWNTOWN COMMUNITY REDEVELOPMENT AREA<br />
CAPITAL IMPROVEMENT PLAN<br />
ADJUSTED<br />
2009 <strong>2010</strong> 2011 2012 2013 2014 2015 2016 2017 2018 2019<br />
BUDGET PROPOSED PROJECTED PROJECTED PROJECTED PROJECTED PROJECTED PROJECTED PROJECTED PROJECTED PROJECTED<br />
REVENUES:<br />
Tax Increment Revenues 1,745,650 1,483,803 1,491,000 1,506,000 1,536,000 1,567,000 1,598,000 1,630,000 1,663,000 1,696,000 1,730,000<br />
Investment Income 23,790 14,878 11,500 6,614 2,715 7,216 3,978 4,175 6,197 8,938 8,820<br />
Unappropriated Surplus 659,878 211,791 162,875 129,980 (89,925) 80,972 (4,931) (50,554) (68,523) 2,952 (23,472)<br />
TOTAL REVENUES 2,429,317 1,710,472 1,665,376 1,642,594 1,448,790 1,655,188 1,597,046 1,583,621 1,600,674 1,707,890 1,715,349<br />
EXPENSES:<br />
Streetscape:<br />
Cleaning 22,000 22,500 23,000 23,500 24,000 24,500 25,000 25,500 26,000 26,500 27,000<br />
Pilot Bank - S. Florida Avenue 16,469<br />
Debt Service :<br />
Downtown Streetscape Loan (Paid 2015) 125,000 125,000 125,000 125,000 125,000 125,000 60,250<br />
Lake Mirror Park (Paid 2015) 250,000 350,000 350,000 350,000 350,000 350,000 350,000 250,000<br />
Miscellaneous Projects:<br />
Container Gardens - New 1,000<br />
Container Garden - Maintenance 79,568 81,955 84,413 86,946 89,554 92,241 95,008 97,858 100,794 103,818 106,932<br />
Debt Service - Residential Redevelop (Paid in '21) 837,471 680,000 680,000 680,000 480,000 680,000 680,000 820,000 1,080,000 1,180,000 1,180,000<br />
Residential Redevelopment - Land Acquisition 245,057<br />
Massachusetts Ave Brick Crosswalks 66,858<br />
Downtown Plan Updates / Brochures 50,000<br />
Downtown Signage 225,000<br />
Mowing 16,714 12,360 12,731 13,113 13,506 13,911 14,329 14,758 15,201 15,657 16,127<br />
USF Polytechnic Incubator Downtown 28,787 28,787 28,787<br />
Operating:<br />
Contribution to LDDA 203,493 170,000 170,000 170,000 170,000 170,000 170,000 170,000 170,000 170,000 170,000<br />
Tax Increment Refunds 168,761 140,000 140,308 140,617 140,926 141,236 141,547 141,858 142,170 142,483 142,796<br />
Additional Personnel 38,257 41,070 41,070 43,124 45,280 47,544 49,921 52,417 55,038 57,790 60,679<br />
Pr<strong>of</strong>essional Services 45,263 50,000<br />
Annual Audit/Reporting Requirements 6,120 5,000 6,367 6,495 6,624 6,757 6,892 7,030 7,171 7,243 7,315<br />
Other Operating Expenses 3,500 3,800 3,700 3,800 3,900 4,000 4,100 4,200 4,300 4,400 4,500<br />
TOTAL EXPENSES 2,429,317 1,710,472 1,665,376 1,642,594 1,448,790 1,655,188 1,597,046 1,583,621 1,600,674 1,707,890 1,715,349<br />
UNAPPROPRIATED SURPLUS:<br />
Beginning Balance 1,255,011 595,133 383,343 220,467 90,487 180,412 99,440 104,372 154,925 223,448 220,496<br />
Sources/(Uses) (659,878) (211,791) (162,875) (129,980) 89,925 (80,972) 4,931 50,554 68,523 (2,952) 23,472<br />
Ending Balance 595,133 383,343 220,467 90,487 180,412 99,440 104,372 154,925 223,448 220,496 243,968
F – 19<br />
MID-TOWN COMMUNITY REDEVELOPMENT AREA<br />
CAPITAL IMPROVEMENT PLAN<br />
ADJUSTED<br />
2009 <strong>2010</strong> 2011 2012 2013 2014 2015 2016 2017 2018 2019<br />
BUDGET PROPOSED PROJECTED PROJECTED PROJECTED PROJECTED PROJECTED PROJECTED PROJECTED PROJECTED PROJECTED<br />
REVENUES:<br />
Tax Increment 3,824,716 3,059,773 3,090,000 3,121,000 3,152,000 3,184,000 3,216,000 3,248,000 3,280,000 3,313,000 3,346,000<br />
Interest Income 200,000 59,000 43,000 38,000 48,000 35,000 46,000 61,000 68,000 82,000 57,000<br />
Transfers:<br />
Transportation Fund (Hope VI Debt Service) 70,000 70,000 70,000<br />
Residential Redevelopment - Rental Income 300,000 200,000 200,000 200,000 200,000 200,000 200,000 200,000 200,000 200,000 200,000<br />
Unappropriated Surplus 1,492,120 369,140 929,072 190,500 (356,500) 744,500 (278,500) (403,500) (170,500) (369,498) 647,504<br />
TOTAL REVENUES 5,886,836 3,757,913 4,332,072 3,549,500 3,043,500 4,163,500 3,183,500 3,105,500 3,377,500 3,225,502 4,250,504<br />
EXPENSES:<br />
Landscape / Pedestrian Enhancements:<br />
10th St. - Providence Rd. to N. Fla. Ave 150,000 150,000<br />
Providence Rd. - 10th St. to Alameda Dr. 150,000 150,000<br />
Massachusetts Imp - In Town Bypass to Memorial 100,000 500,000<br />
Parker Street 3-lane conversion 800,000<br />
Other Pedestrian Enhancements (Sidewalks) 150,000 150,000 150,000 150,000 150,000 150,000 150,000 150,000 150,000 150,000 150,000<br />
Landscaping Maint by Other <strong>City</strong> Departments 64,407 40,000 43,000 46,000 50,000 54,000 58,000 63,000 68,000 73,000 79,000<br />
Model Blocks:<br />
N. Lake Wire - land acquisition 500,000 500,000<br />
Northwest - land acquisition 750,000 500,000<br />
Parker St. - land acquisition 559,287<br />
Webster Park South - land acquisition 750,000 500,000<br />
Stella Ave Renovations 100,000<br />
Missouri Ave Demo 2,580<br />
Other Model Blocks 47,420 50,000 50,000 100,000 100,000 100,000 100,000 500,000 750,000 500,000 500,000<br />
Residential Buffers:<br />
Lakeshore interface w/ <strong>Lakeland</strong> Hills Blvd.<br />
N. Lake Wire interface w/ N. Fla. Ave. 100,000 30,000<br />
Kathleen Rd. - Memorial to I-4 100,000 50,000<br />
Other Residential Buffering 125,000 125,000 125,000 125,000 125,000 125,000 125,000<br />
Corridor Enhancements:<br />
US 98 / N. Fla. Ave. - Memorial to Griffin Road 300,000<br />
Other Corridor Enhancements TEAM BRICK 149,415 100,000 102,000 104,000 106,000 108,000 110,000 112,000 114,000 116,000 118,000<br />
Crossroads Motor Lodge Demolition 85,953<br />
Land Acquisition 750,000 1,250,000
F – 20<br />
MID-TOWN COMMUNITY REDEVELOPMENT AREA<br />
CAPITAL IMPROVEMENT PLAN<br />
ADJUSTED<br />
2009 <strong>2010</strong> 2011 2012 2013 2014 2015 2016 2017 2018 2019<br />
BUDGET PROPOSED PROJECTED PROJECTED PROJECTED PROJECTED PROJECTED PROJECTED PROJECTED PROJECTED PROJECTED<br />
Miscellaneous:<br />
Operating Expenses 291,759 148,470 151,000 154,000 157,000 160,000 163,000 166,000 169,000 172,000 175,000<br />
Small Project Assistance 50,000 50,000 50,000 50,000 50,000 50,000 50,000 50,000 50,000 50,000 50,000<br />
Owner-Occupant Acquisition and Relocation Program724,000 200,000<br />
Commercial Property Acquistion/Project 1,000,000 500,000 750,000 500,000 500,000 750,000 750,000 750,000 750,000 750,000 500,000<br />
Transfer to General Fund / Actual Staff 196,943 193,572 203,000 213,000 224,000 235,000 247,000 259,000 272,000 286,000<br />
Metro <strong>Lakeland</strong> Community Housing Strategy 500,000 500,000 500,000 500,000 500,000 500,000 500,000 500,000 500,000 500,000 500,000<br />
Residential Redevelopment Debt Service<br />
Residential Redevelopment 54,515<br />
Residential Redevelopment Property Mgmt 200,000 200,000 200,000 200,000 200,000 200,000 200,000 200,000 200,000 200,000 200,000<br />
Infill Downpayment Assistance 250,000 250,000 250,000 250,000<br />
Infill Construction Incentive 300,000 200,000 200,000 200,000 200,000 200,000 200,000 200,000 200,000 200,000 200,000<br />
Lakeshore Drive Sidewalk (Memorial to Parker) 15,000<br />
Parkview Place Sidewalk (Lkld Hills to W. Lake Parker) 50,000<br />
Lake Parker Stormwater BMPs 50,000 450,000<br />
Ingraham Avenue Enhancements 400,000<br />
Impact Fee Reimbursement for Affordable Housing 42,500 42,500 42,500 42,500 42,500 42,500 42,500 42,500 42,500 42,500 42,500<br />
TOTAL EXPENSES 5,886,836 3,757,913 4,332,072 3,549,500 3,043,500 4,163,500 3,183,500 3,105,500 3,377,500 3,225,502 4,250,504<br />
UNAPPROPRIATED SURPLUS:<br />
Beginning Balance 4,481,317 2,989,197 2,620,057 1,690,985 1,500,485 1,856,985 1,112,485 1,390,985 1,794,485 1,964,985 2,334,483<br />
Sources / (Uses) (1,492,120) (369,140) (929,072) (190,500) 356,500 (744,500) 278,500 403,500 170,500 369,498 (647,504)<br />
Ending Balance 2,989,197 2,620,057 1,690,985 1,500,485 1,856,985 1,112,485 1,390,985 1,794,485 1,964,985 2,334,483 1,686,979
DIXIELAND COMMUNITY REDEVELOPMENT AREA<br />
CAPITAL IMPROVEMENT PLAN<br />
F – 21<br />
ADJUSTED<br />
2009 <strong>2010</strong> 2011 2012 2013 2014 2015 2016 2017 2018 2019<br />
BUDGET PROPOSED PROJECTED PROJECTED PROJECTED PROJECTED PROJECTED PROJECTED PROJECTED PROJECTED PROJECTED<br />
REVENUES:<br />
Tax Increment 330,403 297,363 300,000 303,000 306,000 309,000 312,000 315,000 318,000 321,000 324,000<br />
Interest Income 30,000 2,000 2,900 2,100 2,000 2,000 2,000 3,000 3,000 4,000 4,000<br />
Loan Funds 500,000<br />
Unappropriated Surplus 613,966 100,986 (18,352) 28,831 3,476 23,143 (12,088) (13,238) (13,166) (13,892) (16,336)<br />
TOTAL REVENUES 974,369 400,349 784,548 333,931 311,476 334,143 301,912 304,762 307,834 311,108 311,664<br />
EXPENSES:<br />
Façade Improvement Program:<br />
Small Project Assistance - Façade Impr. 182,000 60,000 60,000 60,000 60,000 50,000 50,000 50,000 50,000 50,000 50,000<br />
Design Assistance 68,000 15,000 15,000 15,000 15,000 15,000 15,000 15,000 15,000 15,000 15,000<br />
Parking and Access Program 50,000 25,000 25,000 25,000 25,000 20,000 20,000 20,000 20,000 20,000 20,000<br />
Landscaping Matching Grants 15,000 15,000 15,000 15,000 15,000 15,000 15,000 15,000 15,000 15,000<br />
Corridor Improvements:<br />
Engineering and Architectural Design 45,000<br />
Debt Service - Corridor Imp. 103,822<br />
Medians and Gateway Features - Construction 215,000 500,000<br />
Alley Improvements 256,972 200,000 75,000 50,000 25,000 25,000 25,000 25,000 25,000 25,000 25,000<br />
Alley Survey 6,000<br />
Debt Service on Proposed Enhancement Loan 71,920 71,920 71,920 71,920 71,920 71,920 71,920 71,920<br />
Miscellaneous:<br />
Maintenance 7,500 7,700 7,900 8,100 8,300 8,500 8,700 8,900 9,100<br />
Operating Expenses / Pr<strong>of</strong>essional Services 17,565 15,000 15,000 15,000 15,000 50,000 15,000 15,000 15,000 15,000 15,000<br />
Annual Audit 1,685 1,736 1,788 1,841 1,896 1,953 2,012 2,072 2,135 2,199 2,264<br />
Meeting Supplies 510 500 510 520 510 520 530 520 530 540 530<br />
Subscriptions & Memberships 750 500 750 750 750 750 750 750 750 750 750<br />
Anticipated Personnel 39,113 39,900 41,900 44,000 46,200 48,500 50,900 53,400 56,100 56,100<br />
Enhancements 10,000 10,000 7,500 7,500 7,500 7,500 7,500 7,500 7,500 7,500 7,500<br />
Publications and Promotions 12,000 10,000 10,000 10,000 10,000 10,000 10,000 10,000 10,000 10,000 10,000<br />
Landscape Guidelines 3,950<br />
Other Operating Expenses 7,500 8,500 11,600 11,800 12,000 12,200 12,400 12,600 12,900 13,200 13,500<br />
TOTAL EXPENSES 974,369 400,349 784,548 333,931 311,476 334,143 301,912 304,762 307,834 311,108 311,664<br />
UNAPPROPRIATED SURPLUS:<br />
Beginning Balance 796,161 182,195 81,209 99,562 70,731 67,254 44,111 56,200 69,437 82,603 96,495<br />
Sources / (Uses) (613,966) (100,986) 18,352 (28,831) (3,476) (23,143) 12,088 13,238 13,166 13,892 16,336<br />
Ending Balance 182,195 81,209 99,562 70,731 67,254 44,111 56,200 69,437 82,603 96,495 112,831
F – 22<br />
PARKING<br />
CAPITAL IMPROVEMENT PLAN<br />
ADJUSTED<br />
2009 <strong>2010</strong> 2011 2012 2013 2014 2015 2016 2017 2018 2019<br />
BUDGET PROPOSED PROJECTED PROJECTED PROJECTED PROJECTED PROJECTED PROJECTED PROJECTED PROJECTED PROJECTED<br />
REVENUES:<br />
Transfer from Transportation Fund:<br />
Orange Street Garage 258,752 130,000 306,000<br />
Main Street Garage 160,000 115,000 204,000<br />
Pay by Space machines 16,400<br />
Munn Park - Parking Lot Resurfacing 13,500<br />
Debt service - Verizon property purchase 88,933 88,933 88,933 88,933 44,752<br />
Lighting Retr<strong>of</strong>it - Main and Orange Street Garage 173,000<br />
Structural Inspection <strong>of</strong> Parking Garages 10,000 10,000 10,000 12,000 12,000 12,000 14,000 14,000 14,000 14,000<br />
TOTAL REVENUES 537,585 386,933 98,933 228,933 56,752 12,000 522,000 14,000 14,000 14,000 14,000<br />
EXPENSES:<br />
Orange Street Garage:<br />
Orange St Garage Deck Coating 258,752 306,000<br />
Orange St. Parking Garage - Exterior Coating 130,000<br />
Main Street Garage:<br />
Main Street Parking Garage - Exterior Coating 115,000<br />
Main St Garage Deck Coating 160,000 204,000<br />
Other Parking Services Projects:<br />
Pay By Space Machines 16,400<br />
Munn Park Parking Lot Resurfacing 13,500<br />
Lighting Retr<strong>of</strong>it - Main and Orange Street Garage 173,000<br />
Structural Inspection <strong>of</strong> Parking Garages 10,000 10,000 10,000 12,000 12,000 12,000 14,000 14,000 14,000 14,000<br />
Verizon Property:<br />
Debt service - Verizon property purchase 88,933 88,933 88,933 88,933 44,752<br />
TOTAL EXPENSES 537,585 386,933 98,933 228,933 56,752 12,000 522,000 14,000 14,000 14,000 14,000<br />
UNAPPROPRIATED SURPLUS
F – 23<br />
THE LAKELAND CENTER<br />
CAPITAL IMPROVEMENT PLAN<br />
ADJUSTED<br />
2009 <strong>2010</strong> 2011 2012 2013 2014 2015 2016 2017 2018 2019<br />
BUDGET PROJECTED PROJECTED PROJECTED PROJECTED PROJECTED PROJECTED PROJECTED PROJECTED PROJECTED PROJECTED<br />
REVENUES:<br />
Capital Transfer from PIF 350,000 350,000 350,000 350,000 350,000 350,000 350,000 350,000 350,000 350,000 350,000<br />
Unappropriated Surplus Used/(Generated) 279,087 125,144 40,000<br />
TOTAL REVENUES 629,087 475,144 390,000 350,000 350,000 350,000 350,000 350,000 350,000 350,000 350,000<br />
EXPENSES:<br />
Electric Powered Golf Carts 15,000 15,000<br />
Fixtures & Equipment 66,228 27,500 17,500 17,500 17,500 18,000 18,000 50,000 50,000 50,000<br />
Electronic Gate Operator for Parking Lots 20,000 20,000<br />
Exhibit Hall and Sikes Hall wall coverings 50,000 100,000<br />
Replace Forklifts 27,000 25,000<br />
Upgrade CCTV System 4,936<br />
Commercial Washer/Dryer Replacement 16,000<br />
Resurfacing <strong>of</strong> all parking lots 81,000 100,000 100,000<br />
Repainting <strong>of</strong> facility exterior 55,000 182,000 200,000 200,000<br />
AV Equipment Upgrades and/or Purchases 20,000 20,000<br />
Ticket Master system replacement 40,000<br />
Ro<strong>of</strong> Replacements 169,009 255,000 252,500 280,000 150,000<br />
Administration Office Space 75,000<br />
Carpet Replacement 200,000 200,000<br />
<strong>Lakeland</strong> Center Carpet replacement 100,000 150,000 140,000<br />
Capital Contingency 144 32,500 80,500 96,500 17,000<br />
Theatre Sound Equipment Upgrade 79,542<br />
Cooling Towers 193,951<br />
Wireless Customer Network 5,000<br />
Lighting Equipment 22,920<br />
Lawn Equipment Building 6,500<br />
Fire Alarm System 125,000<br />
Fire Suppression System 40,000<br />
TOTAL EXPENSES 629,087 475,144 390,000 350,000 350,000 350,000 350,000 350,000 350,000 350,000 350,000<br />
Capital Surplus<br />
Beginning Balance 444,231 165,144 40,000<br />
Sources / (Uses) (279,087) (125,144) (40,000)<br />
Ending Balance 165,144 40,000
F – 24<br />
LAKELAND LINDER REGIONAL AIRPORT<br />
CAPITAL IMPROVEMENT PLAN<br />
ADJUSTED<br />
2009 <strong>2010</strong> 2011 2012 2013 2014 2015 2016 2017 2018 2019<br />
BUDGET PROPOSED PROJECTED PROJECTED PROJECTED PROJECTED PROJECTED PROJECTED PROJECTED PROJECTED PROJECTED<br />
REVENUES:<br />
FDOT Grants 80,000 400,000 357,000 1,000,000<br />
Unappropriated Surplus Used / (Generated) 609,371 416,871 648,441 756,551 503,951 496,615 484,101 481,631 479,207 364,738 365,650<br />
TOTAL CAPITAL REVENUES 689,371 816,871 1,005,441 1,756,551 503,951 496,615 484,101 481,631 479,207 364,738 365,650<br />
EXPENSES:<br />
Radio System Expansion - Transfer to IT 4,778 4,778 4,778 4,778 4,778<br />
Drainage Maintenance-Ditches 25,000 25,000 20,000 20,000 20,000 20,000 20,000 20,000 20,000 20,000 20,000<br />
Ditch Spraying 5,000 5,000 5,000 5,000 5,000 5,000 5,000 5,000 5,000 5,000 5,000<br />
Airfield Security and Access Control 20,000 20,000 20,000 20,000 20,000 20,000 20,000 20,000 20,000 20,000 20,000<br />
Door/Gates Access Control System - Phase 2 156,250<br />
Door/Gates Access Control System - Phase 3 110,000<br />
Equipment 5,000 5,000 5,000 5,000 5,000 5,000 5,000 5,000 5,000 5,000<br />
Rehab South Apron 250,000 1,250,000<br />
Airport Advertising / Promotions-Advertising 75,000 75,000 75,000 50,000 50,000 50,000 50,000 50,000 50,000 50,000 50,000<br />
Airport Maintenance-Sun 'N Fun 25,000 25,000 25,000 25,000 25,000 25,000 25,000 25,000 25,000 25,000 25,000<br />
Airfield Pavement Maintenance 50,000 50,000 50,000 50,000 50,000 50,000 50,000 50,000 50,000 50,000 50,000<br />
Misc. Maintenance Projects 38,000 35,000 35,000 35,000 35,000 35,000 35,000 35,000 35,000 35,000 35,000<br />
Runway Markings Maintenance 30,000 20,000 20,600 21,218 21,855 22,510 23,185 23,881 24,597 25,335 25,335<br />
Terminal:<br />
Terminal Construction 148,093 144,093 140,093 136,093 132,093 128,093 124,093 120,093 116,093<br />
Hangar:<br />
Maintenance Program 10,000 10,000 10,000 10,000 10,000 10,000 10,000 10,000 10,000 10,000 10,000<br />
Door Repairs 20,000 20,000 20,000 20,000 20,000 20,000 20,000 20,000 20,000 20,000 20,000<br />
Tower:<br />
Tower Repairs 1,500 1,500 1,500 1,500 1,500 1,500 1,500 1,500 1,500 1,500<br />
Airside:<br />
LAC Fire Sprinkler Upgrade 10,000 10,000 10,000 10,000 10,000 10,000<br />
LAC Fire System Maintenance 32,000 24,000 24,720 25,462 26,225 27,012 27,823 28,657 29,517 30,402 31,315<br />
Buildout Contingency 50,000 50,000 50,000 50,000 50,000 50,000 50,000 50,000 50,000 50,000 50,000<br />
Repair <strong>of</strong> Fixtures 12,500 12,500 12,500 12,500 12,500 12,500 12,500 12,500 12,500 12,500 12,500<br />
Maint. Piedmont Hawthorne Facility 1,000 1,000 1,000 1,000 1,000 1,000 1,000 1,000 1,000 1,000 1,000<br />
Maint. Tony's Airside Restaurant 5,000 1,000 1,000 1,000 1,000 1,000 1,000 1,000 1,000 1,000 1,000<br />
Maint. Europa Facility 2,000 500 500 500 500 500 500 500 500 500 500<br />
Maint. Renaisance Facility 1,000 1,000 1,000 1,000 1,000 1,000 1,000 1,000 1,000 1,000 1,000<br />
Maint. Air Service Facility 500 500 500 500 500 500 500 500 500 500<br />
Maint. AET LLC Facility 1,000 1,000 1,000 1,000 1,000 1,000 1,000 1,000 1,000 1,000<br />
Capital Costs - Airpark Land Sale:<br />
Install Electric Submeters 25,000 25,000 25,000<br />
Acquire Airfield Sweeper Truck 180,000<br />
FDOT Install Taxiway Lighting - South Section 100,000<br />
TOTAL CAPITAL EXPENSES 689,371 816,871 1,005,441 1,756,551 503,951 496,615 484,101 481,631 479,207 364,738 365,650<br />
UNAPPROPRIATED SURPLUS:<br />
Beginning Balance 1,543,975 820,288 507,114 201,624 24,749 108,165 192,955 337,454 713,735 1,626,741 2,588,552<br />
Sources / (Uses) - Capital (609,371) (416,871) (648,441) (756,551) (503,951) (496,615) (484,101) (481,631) (479,207) (364,738) (365,650)<br />
Sources / (Uses) - Operating (114,316) 103,697 342,951 579,675 587,367 581,406 628,600 857,913 1,392,213 1,326,548 1,264,875<br />
Ending Balance - Capital 2,229,978 2,229,978 2,229,978 2,229,978 2,229,978 2,229,978 2,229,978 2,229,978 2,229,978 2,229,978 2,229,978<br />
Ending Balance - Operating (1,409,690) (1,722,864) (2,028,354) (2,205,229) (2,121,813) (2,037,023) (1,892,524) (1,516,243) (603,237) 358,574 1,257,799<br />
Ending Balance - TOTAL 820,288 507,114 201,624 24,749 108,165 192,955 337,454 713,735 1,626,741 2,588,552 3,487,777
F – 25<br />
STORMWATER<br />
CAPITAL IMPROVEMENT PLAN<br />
ADJUSTED<br />
2009 <strong>2010</strong> 2011 2012 2013 2014 2015 2016 2017 2018 2019<br />
BUDGET PROPOSED PROJECTED PROJECTED PROJECTED PROJECTED PROJECTED PROJECTED PROJECTED PROJECTED PROJECTED<br />
REVENUES:<br />
Stormwater Utility Revenues-Commercial 2,050,860 1,985,000 2,005,000 2,025,000 2,045,000 2,065,000 2,086,000 2,107,000 2,128,000 2,149,000 2,170,000<br />
Stormwater Utility Revenues-Residential 2,311,540 2,335,000 2,358,000 2,382,000 2,406,000 2,430,000 2,454,000 2,479,000 2,504,000 2,529,000 2,554,000<br />
Stormwater Fees-Interfund 96,417 95,000 95,950 96,910 97,879 98,857 99,846 100,844 101,853 102,871 103,900<br />
SWFWMD Grants:<br />
Lk. Hollingsworth Westside 363,398<br />
Lk. Parker - SW Basin BMPs 843,110<br />
Lk. Gibson SW Basin Design 750,132<br />
SOF/DEM Grants:<br />
N <strong>Lakeland</strong> Drainage Basin A 629,000<br />
N <strong>Lakeland</strong> Drainage Basin B 56,233<br />
N <strong>Lakeland</strong> Drainage Basin C 803,765<br />
N <strong>Lakeland</strong> Drainage Basin D 19,752<br />
FDEP Grants:<br />
Urban Restoration Initiative 258,819<br />
Miscellaneous Revenue 27,497<br />
Investments & Earnings 143,313 116,565 113,218 113,517 136,040 153,610 155,674 158,809 159,276 162,222 166,320<br />
Unappropriated Surplus 3,215,123 191,731 30,717 (93,292) 106,142 (23,784) (58,499) 30,438 (52,213) (90,581) (129,316)<br />
TOTAL REVENUES 11,568,959 4,723,296 4,602,885 4,524,134 4,791,061 4,723,684 4,737,021 4,876,092 4,840,915 4,852,512 4,864,904<br />
EXPENSES:<br />
Stormwater Projects 7,932,633 2,882,296 2,500,775 2,275,853 2,801,547 2,777,875 3,304,854 3,437,503 3,370,841 3,375,887 3,381,662<br />
Drainage Projects 3,354,728 1,561,000 1,797,110 1,943,281 1,679,514 1,635,809 1,122,167 1,128,589 1,135,075 1,141,625 1,148,242<br />
Lakes and Environmental Projects 281,598 280,000 305,000 305,000 310,000 310,000 310,000 310,000 335,000 335,000 335,000<br />
TOTAL EXPENSES 11,568,959 4,723,296 4,602,885 4,524,134 4,791,061 4,723,684 4,737,021 4,876,092 4,840,915 4,852,512 4,864,904<br />
UNAPPROPRIATED SURPLUS:<br />
Beginning Balance 4,075,768 860,645 668,914 638,197 731,489 625,347 649,131 707,630 677,192 729,405 819,986<br />
Sources / (Uses) (3,215,123) (191,731) (30,717) 93,292 (106,142) 23,784 58,499 (30,438) 52,213 90,581 129,316<br />
Ending Balance 860,645 668,914 638,197 731,489 625,347 649,131 707,630 677,192 729,405 819,986 949,302
F – 26<br />
STORMWATER<br />
CAPITAL IMPROVEMENT PLAN<br />
ADJUSTED<br />
2009 <strong>2010</strong> 2011 2012 2013 2014 2015 2016 2017 2018 2019<br />
BUDGET PROPOSED PROJECTED PROJECTED PROJECTED PROJECTED PROJECTED PROJECTED PROJECTED PROJECTED PROJECTED<br />
STORMWATER PROJECTS<br />
Lake Bonny:<br />
Diagnostic Study 150,000<br />
Watershed Management Projects 250,000 850,000 950,000 750,000 750,000 425,000<br />
Lake Gibson:<br />
Southwest Basin Retr<strong>of</strong>it 626,537 750,000<br />
FDEP-Urban Restroration Initiative 517,638<br />
Lk Gibson SW Basin-Design 1,421,612 650,000<br />
Watershed Mgmt Plan and Projects 250,000<br />
Lake Hollingsworth:<br />
W Hollingsworth Stormwater Retr<strong>of</strong>it 1,110,559<br />
South Shoreline Erosion Repair 83,547<br />
Hunter\BeulahWire Watershed:<br />
Watershed Mgmt Plan and Projects 900,000 900,000 900,000<br />
Lake Parker:<br />
Lk Parker SW Basin BMPs 2,164,213<br />
Lk Parker SW Basin BMP Study 224,386<br />
North Lkld Stormwater Master Plan 415,949<br />
TMDL Project - W/Q Treatment 900,000 1,100,000 1,100,000 1,500,000 1,900,000<br />
Lake John:<br />
Watershed Mgmt Plan and Projects 250,000<br />
Miscellaneous:<br />
Stormwater O&M 640,192 607,296 625,515 644,280 663,609 683,517 704,023 725,143 746,897 769,304 792,384<br />
Repair and Maintenance <strong>of</strong> PCD's 87,000 88,000 94,000 95,000 96,000 97,000 98,000 104,000 110,000 112,000 114,000<br />
Undesignated Equipment Leases 40,000<br />
Flood Control Automation Retr<strong>of</strong>it 75,000 200,000 200,000 100,000 100,000 100,000 100,000 100,000 100,000<br />
Drainage Maintenance Operations 526,000 526,000 531,260 536,573 541,938 547,358 552,831 558,360 563,943 569,583 575,278<br />
Route Smart - Streetsweeper Ops. 15,000<br />
Crew Truck 46,000<br />
Highlands Hills Ditch Maint & Repairs 250,000<br />
CLMP - 2016 Update 100,000<br />
TOTAL STORMWATER PROJECTS 7,932,633 2,882,296 2,500,775 2,275,853 2,801,547 2,777,875 3,304,854 3,437,503 3,370,841 3,375,887 3,381,662
F – 27<br />
STORMWATER<br />
CAPITAL IMPROVEMENT PLAN<br />
ADJUSTED<br />
2009 <strong>2010</strong> 2011 2012 2013 2014 2015 2016 2017 2018 2019<br />
BUDGET PROPOSED PROJECTED PROJECTED PROJECTED PROJECTED PROJECTED PROJECTED PROJECTED PROJECTED PROJECTED<br />
DRAINAGE PROJECTS:<br />
Storm Sewer Inventory 31,898 50,000 50,000 30,000 30,000 30,000 30,000 30,000 30,000 30,000 30,000<br />
TV & Cleaning Storm Drainage 125,000 125,000 125,000 125,000 125,000 125,000 150,000 150,000 150,000 150,000 150,000<br />
Maint & Retr<strong>of</strong>it <strong>of</strong> Drainage Facilities 295,545 275,000 275,000 275,000 275,000 275,000 300,000 300,000 300,000 300,000 300,000<br />
Drainage Study:<br />
Pinewood Avenue 228,661<br />
Street Sweeping Operations 611,000 611,000 617,110 623,281 629,514 635,809 642,167 648,589 655,075 661,625 668,242<br />
N Lake Parker Ave Drainage Imp 11,786<br />
SOF/DEM N <strong>Lakeland</strong> Drainage Basin A 712,344<br />
SOF/DEM N <strong>Lakeland</strong> Drainage Basin B 57,426<br />
SOF/DEM N <strong>Lakeland</strong> Drainage Basin C 1,177,926<br />
SOF/DEM N <strong>Lakeland</strong> Drainage Basin D 19,752<br />
Mass Ave. & Plum St. Stormsewer Retro 83,390 500,000<br />
Shore Acre Subdivision (Fern Road) 520,000 420,000<br />
Curran St Stormwater Retr<strong>of</strong>it 25,000 160,000<br />
Wayman St. Ditch Repairs 50,000 500,000<br />
Deter Pit Retr<strong>of</strong>it 30,000 200,000<br />
Allamanda St & Horney Park Pump Retr<strong>of</strong>it 40,000 230,000<br />
Ruby Street in Lake Hunter Terrace 15,000 40,000<br />
East Highland Dr./Nunnswood Lane 50,000 250,000<br />
Lake John - Sommerset Weir Retr<strong>of</strong>it 30,000 150,000<br />
Charnes Drive 100,000<br />
TOTAL DRAINAGE PROJECTS 3,354,728 1,561,000 1,797,110 1,943,281 1,679,514 1,635,809 1,122,167 1,128,589 1,135,075 1,141,625 1,148,242<br />
LAKES AND ENVIRONMENTAL PROJECTS:<br />
Contribution to LEAD 25,000 25,000 25,000 25,000 25,000 25,000 25,000 25,000 25,000 25,000 25,000<br />
Lake Improvement Projects 225,000 225,000 250,000 250,000 250,000 250,000 250,000 250,000 275,000 275,000 275,000<br />
NPDES Permitting 1,598<br />
Public Education Programs 30,000 30,000 30,000 30,000 35,000 35,000 35,000 35,000 35,000 35,000 35,000<br />
TOTAL LAKES AND ENV. PROJECTS 281,598 280,000 305,000 305,000 310,000 310,000 310,000 310,000 335,000 335,000 335,000<br />
TOTAL EXPENSES 11,568,959 4,723,296 4,602,885 4,524,134 4,791,061 4,723,684 4,737,021 4,876,092 4,840,915 4,852,512 4,864,904
F – 28<br />
WASTEWATER UTILITY<br />
CAPITAL IMPROVEMENT PLAN<br />
ADJUSTED<br />
2009 <strong>2010</strong> 2011 2012 2013 2014 2015 2016 2017 2018 2019<br />
BUDGET PROPOSED PROJECTED PROJECTED PROJECTED PROJECTED PROJECTED PROJECTED PROJECTED PROJECTED PROJECTED<br />
REVENUES:<br />
Impact Fee Collections 1,652,736 1,200,000 1,500,000 1,800,000 2,200,000 2,200,000 2,200,000 2,200,000 2,200,000 2,200,000 2,200,000<br />
Transfer from Operations-R&R 2,539,240 2,600,000 3,000,000 3,000,000 3,000,000 3,000,000 3,000,000 3,000,000 3,000,000 3,000,000 3,000,000<br />
Contributions from Developers - R&R 75,000 5,000 5,000 5,000 5,000 5,000 5,000 5,000 5,000 5,000 5,000<br />
Property Assessments - Alleys 26,500<br />
Property Assessments - Orangewood 16,782 16,782 16,782 16,782 16,782 16,782 16,782 16,782 16,782 16,782 16,782<br />
Interest Earnings-R&R 65,000 100,000 100,000 100,000 100,000 100,000 100,000 100,000 100,000 100,000 100,000<br />
Interest Earnings-Impact Fees 40,000 100,000 100,000 100,000 100,000 100,000 100,000 100,000 100,000 100,000 100,000<br />
Grant Proceeds-Skyview Utilities 1,500,000<br />
Proceeds from Issuance <strong>of</strong> LT Debt 36,610,668 30,000 41,050,000<br />
Unappropriated Surplus 6,457,975 1,206,285 1,533,885 93,885 143,885 54,036 (47,046) (62,046) (684,782) (624,782) (1,674,782)<br />
TOTAL REVENUES 48,983,901 5,228,067 6,255,667 5,115,667 5,595,667 5,475,818 5,374,736 46,409,736 4,737,000 4,797,000 3,747,000<br />
EXPENSES:<br />
COLLECTION SYSTEM:<br />
Sewer Maintenance: 284<br />
Renewal & Replacement<br />
Contractor Installed Liners 450,000<br />
Contractor Cleaning & Televising 200,000<br />
<strong>City</strong> Installed Short Liners 100,000<br />
<strong>City</strong> Performed Point Repairs 60,000<br />
Rehabilitation Program 866,000 950,000 1,000,000 1,000,000 1,000,000 1,000,000 1,000,000 1,000,000 1,000,000 1,000,000<br />
Other Construction Projects 50,000 50,000 50,000 50,000 50,000 50,000 50,000 70,000 70,000<br />
Other Replacement Projects 50,000 50,000 50,000 50,000 50,000 50,000 50,000 70,000 70,000<br />
Collection System Monitoring 45,000<br />
Relocation Projects:<br />
Undesignated Utility Relocations 50,000 40,000<br />
US 92 - Airport Rd. to Intown Bypass 75,000<br />
West Pipkin, Medulla to Harden. 20,000<br />
Edgewood - Fla Ave to Harden Blvd 459,099<br />
US 98 S. Clubhouse to Winter Lake 200,000 250,000<br />
SR 563 Parkway to Pipkin 50,000<br />
Business 92 Airport Rd to Intown Bypass 50,000 100,000 100,000<br />
Knights Station Road 10,000<br />
Candyce Ave. Sewer Replacement 147,576<br />
Intown Bypass Utility Accommodation 48,582<br />
Inflow Reduction 40,000<br />
Harden Blvd. CRA ( Parkway - Pipkin) 5,000<br />
<strong>Lakeland</strong> Highlands Road Polk Pky to 540 A 400,000<br />
Harden CRA 20,000<br />
US 98 S From 540A to 540 381,592 868,000 1,500,000
F – 29<br />
Impact Fees<br />
SW <strong>Lakeland</strong> Capacity Enhancement 524,000<br />
Lone Palm at Dille Street - Oversizing 9,000<br />
Morgan Creek Phase 2 - Oversizing 21,000<br />
Northeast Service Area Expansion 17,954<br />
Utility Relocation US 98 S From 540A to 540 250,000<br />
Airport Road Oversizing Contribution 100,000<br />
WASTEWATER UTILITY<br />
CAPITAL IMPROVEMENT PLAN<br />
ADJUSTED<br />
2009 <strong>2010</strong> 2011 2012 2013 2014 2015 2016 2017 2018 2019<br />
BUDGET PROPOSED PROJECTED PROJECTED PROJECTED PROJECTED PROJECTED PROJECTED PROJECTED PROJECTED PROJECTED<br />
Sub-total 2,513,803 2,639,000 2,845,000 1,500,000 1,210,000 1,100,000 1,100,000 1,100,000 1,100,000 1,140,000 1,140,000<br />
Pump Stations: 283<br />
Renewal & Replacement<br />
Telemetry System Upgrades 381,060 30,000 25,000 50,000 50,000 50,000 50,000 50,000 100,000 100,000 100,000<br />
Generator Storage Shed 50,000<br />
American Cyanamid Emer. Standby Gen. Install 43,999 50,000<br />
Providence Road PS Pump Replacement 20,000<br />
Northside Pump Station Upgrade. 200,000<br />
Grasslands Generator 55,000<br />
Generator at Great Oaks Pump Station 45,000<br />
Spring Oaks Pump Station (Pump & Panel) 30,000<br />
Bridgefield Pump Station (Pump & Panel) 30,000<br />
Stone Water Pump Station (Pump & Panel) 30,000<br />
Willow Brook Pump Station (Pump & Panel) 30,000<br />
Highland Fairways Generator 45,000<br />
Carillon Lakes Generator 45,000<br />
<strong>Lakeland</strong> Harbor (Pump & Panel) 40,000<br />
Woodlake Cove Pump Station (Pump & Panel) 40,000<br />
Honey Tree III (Pump & Panel) 40,000<br />
West <strong>Lakeland</strong> Pump Station (Pump & Panel) 40,000<br />
Crystal Grove Pump Station Generator 50,000<br />
Cypress Avaiation (Pump & Panel) 30,000<br />
Yankee Place (Pump & Panel) 40,000<br />
Fairway Lakes (Pump & Panel) 40,000<br />
Waterford (Pump & Panel) 40,000<br />
Elizabeth Street (Pump & Panel) 40,000<br />
Morris Realty Pump Station 275,000<br />
Waring Road Pump Station Access 8,000<br />
NW Pump Station Flow Meter Replacement 15,000<br />
SW-Pump & Airpark Upgrade (Eng Oaks II) 8,936<br />
Bentley Pines (Pump & Panel) 50,000<br />
Polk Parkway (Pump & Panel) 50,000<br />
Highland Hills (Pump & Panel) 50,000<br />
Martins Landing Pumps 35,000<br />
Mission Lakes Pump Station Pumps 35,000
F – 30<br />
WASTEWATER UTILITY<br />
CAPITAL IMPROVEMENT PLAN<br />
ADJUSTED<br />
2009 <strong>2010</strong> 2011 2012 2013 2014 2015 2016 2017 2018 2019<br />
BUDGET PROPOSED PROJECTED PROJECTED PROJECTED PROJECTED PROJECTED PROJECTED PROJECTED PROJECTED PROJECTED<br />
Westside Pump Station Pumps 50,000<br />
Replace Oak Street Pump Station Pumps 35,000<br />
Upgrade Southwest Pump Station 100,000<br />
Upgrade Northeast Pump Station 500,000 500,000<br />
Replace Northside Pumpstation Pumps and Controls 800,000<br />
<strong>Lakeland</strong> Square Mall (Pump & Panel) 40,000<br />
Foxwood Pump Station (Pump & Panel) 45,000<br />
Sandpiper Point (Pump & Panel) 45,000<br />
Sandpiper South (Pump & Panel) 45,000<br />
Grasslands (Pump & Panel) 55,000<br />
Carillon Lakes Generator Install 20,000<br />
SW Area-Upgrade Existing Pump Stations [E.O.3] 47,160<br />
Willow Brook Pump Station P&V Rehab 17,000<br />
Interlachen (Pump & Panel) 50,000<br />
Oakbridge (Pump & Panel) 55,000<br />
Replace Publix Pump Station Controls 300,000<br />
Replace Westside Pump Station Controls 200,000<br />
Georgetown (Pump & Panel) 30,000<br />
Pump Stataions continued - Impact Fees<br />
Southwest <strong>Lakeland</strong> Capacity Eval. 5,501<br />
Telemetry System Upgrades 281,365<br />
SW Area-Upgrade Existing Pump Stations [E.O.3] 140,458<br />
Sub-total 953,479 60,000 40,000 200,000 325,000 760,000 870,000 1,040,000 505,000 595,000 600,000<br />
TREATMENT PLANTS:<br />
Glendale: 281<br />
Renewal & Replacement<br />
Replace Reuse Station Gen. & Switch Gear 100,000<br />
Repair and Repave Roads 55,000<br />
Facility Painting 250,000<br />
Replacement <strong>of</strong> Scum Pumping Equipment 100,000<br />
Replacement <strong>of</strong> Clarifier Drive Mechanisms 400,000<br />
Laboratory Fume Hoods Replacement 100,000<br />
Replacement <strong>of</strong> Sludge Pumping Equipment 85,000<br />
Replacement <strong>of</strong> Magnetic Flow Meters 50,000<br />
Plant Painting 250,000<br />
Climber Screen Replacement 120,000<br />
Controls 95,600 70,000<br />
Chlorine Building Containment 223,175<br />
Repair and Repave Service Roads 60,000
F – 31<br />
WASTEWATER UTILITY<br />
CAPITAL IMPROVEMENT PLAN<br />
ADJUSTED<br />
2009 <strong>2010</strong> 2011 2012 2013 2014 2015 2016 2017 2018 2019<br />
BUDGET PROPOSED PROJECTED PROJECTED PROJECTED PROJECTED PROJECTED PROJECTED PROJECTED PROJECTED PROJECTED<br />
Odor Control Enhancements 12,645<br />
Debris Removal 65,000<br />
Replace Primary Scrubber Recirculation System 165,000<br />
Spare Blower 150,000<br />
Flow Equalization Tank 500,000<br />
Grit System Replacement 18,000<br />
TurboGenix Generator 166,500<br />
Repair Walker Clarifiers /Aeration Tanks 165,000<br />
Debris Removal From Process Tanks 41,200<br />
Operator Assistance Program Phase II 25,000<br />
Replacement <strong>of</strong> Submersible Pumps 250,000<br />
Replace Effluent Force Main & Air Release Valves 55,000<br />
Wetland Pump Station Pump Rehab 50,000<br />
Lab Generator Install 50,000<br />
Replacement <strong>of</strong> Wetlands Pump Station Panel 100,000<br />
Solids Processing Improvements 1,000,000<br />
Repair and replace Odor control blowers 75,000<br />
Aquatic Weed Control 50,000<br />
Rehab & Repair Wetland Lift Station Pumps 100,000<br />
Removal <strong>of</strong> Debris from Sludge Holding Tanks 50,000<br />
Northside: 282<br />
Renewal & Replacement<br />
Bypass Pump Station Rehab 175,000<br />
Climber Screen Repairs 250,000<br />
Controls 102,000 40,000<br />
Supplemental Odor Control 35,900<br />
Mixer and Gear Box Refurb 70,000<br />
RAS Pump Replacement 60,000<br />
Replacement <strong>of</strong> Magnetic Flowmeters 60,000<br />
Northside Operator Assist. Program II 25,000<br />
Rehab & Repair Effluent Lift Station Pumps 70,000<br />
Rehab/Repair Odor Control at Northside Headworks 45,000<br />
Westside: 290<br />
Renewal & Replacement<br />
FDEP West Lklnd Wasteload Reduction Facility FY04 20,000<br />
West <strong>Lakeland</strong> Wasteload Facility Land Purchase 14,277<br />
Impact Fees<br />
WLWLRF Publix Pump Station Sampling 2,000<br />
Sub-total 1,276,297 75,000 235,000 450,000 985,000 670,000 470,000 255,000 1,000,000 500,000 100,000
F – 32<br />
WASTEWATER UTILITY<br />
CAPITAL IMPROVEMENT PLAN<br />
ADJUSTED<br />
2009 <strong>2010</strong> 2011 2012 2013 2014 2015 2016 2017 2018 2019<br />
BUDGET PROPOSED PROJECTED PROJECTED PROJECTED PROJECTED PROJECTED PROJECTED PROJECTED PROJECTED PROJECTED<br />
WETLANDS: 288<br />
Renewal & Replacement<br />
Tow Drain and Blowers Generators 109,822<br />
Piping <strong>of</strong> Effluent Ditch 150,000<br />
Distribution Ditch Rehabilitation 175,000<br />
Building Upgrades 170,891<br />
Replacement <strong>of</strong> Stop Gates 11,363<br />
Wetlands Northwest Boundary Fence 132,301<br />
Wetlands East Boundary Fence 180,000<br />
Wetlands Discharge Ditch Dredge 200,000<br />
Treverse Euthrophication/Wetlands Ecosystem 300,000<br />
Repair <strong>of</strong> Control Structures 1 and 7 Outfall Pipes. 160,000<br />
Replace 50 Hp Blower and intake system 30,000<br />
Sub-total 584,377 360,000 375,000 300,000<br />
ENGINEERING 286<br />
Renewal & Replacement<br />
Wastewater Structures Identification and Inspection 112,231<br />
Subdivision and Commercial Development 100,000 100,000 100,000 100,000 100,000 100,000 100,000 100,000 100,000 100,000<br />
County Projects 10,000 10,000 10,000 10,000 10,000 10,000 10,000 10,000 10,000 10,000 10,000<br />
D.O.T. Projects 10,000 10,000 10,000 10,000 10,000 10,000 10,000 10,000 10,000 10,000 10,000<br />
Sewer Line Relocation - Intown Bypass Utility 5,026<br />
FDEP West Lklnd Wasteload Reduction Facility FY04 5,000<br />
Wastewater Support - Other <strong>City</strong> Departments 10,000<br />
Cataloging (Permits, Easements & Svc Agreements) 20,000<br />
Southwest Force Main Replacement 20,000<br />
Candyce Ave. Sewer Replacement 3,075<br />
CSX Relocation Assistance 20,000<br />
Glendale Controls 876<br />
Glendale Debris Removal From Process Tanks 1,500<br />
Glendale Sludge System Modification 1,500<br />
Glendale TurboGenix Generator 3,000<br />
Harden Blvd. CRA ( Parkway - Pipkin) 2,549<br />
Northside Controls 889<br />
SR 563 (Harden Blvd) - N/S Route Relocate 10,000<br />
Utility Relocate-Lkld Highlands Road Polk Pky to 540 A10,000 20,000 10,000<br />
Utility Relocation Project Harden CRA Engineering 1,000 2,000<br />
Undesignated Engineering Projects 60,000 60,000 60,000 60,000 60,000 60,000 60,000 60,000 60,000 60,000
F – 33<br />
WASTEWATER UTILITY<br />
CAPITAL IMPROVEMENT PLAN<br />
ADJUSTED<br />
2009 <strong>2010</strong> 2011 2012 2013 2014 2015 2016 2017 2018 2019<br />
BUDGET PROPOSED PROJECTED PROJECTED PROJECTED PROJECTED PROJECTED PROJECTED PROJECTED PROJECTED PROJECTED<br />
Impact Fees<br />
SW-Pump & Airpark Upgrade (Eng Oaks II) 3,556<br />
SW Area-Upgrade Existing Pump Stations [E.O.3] 6,431<br />
Southwest <strong>Lakeland</strong> Capacity Eval. 3,000<br />
SW <strong>Lakeland</strong> Capacity Enhancement 39,142<br />
US 98 South Growth Area Capacity Expansion 4,762<br />
Engineering - Impact Fees cont.<br />
<strong>Lakeland</strong> Highland Rd. Widening 2,700<br />
Subdivision and Commercial Development 350,000 350,000 400,000 400,000 400,000 400,000 400,000 400,000 400,000 400,000 400,000<br />
Undesiganted Expansion Projects (Eng) 4,299 20,000 20,000 20,000 20,000 20,000 20,000 20,000 20,000 20,000 20,000<br />
English Oaks Land Acquisition 2,640,000<br />
Sub-total 3,300,536 572,000 610,000 600,000 600,000 600,000 600,000 600,000 600,000 900,000 600,000<br />
STATE REVOLVING LOAN<br />
Skyview Utilties - FDEP Grant 1,500,000<br />
Revolving Loan Administration 1,612,674<br />
Skyview Utility System <strong>City</strong> Acceptance 2,021,249<br />
Eng. Oaks Accommodations (Eng Oaks I) 121,663<br />
SW-Pump & Airpark Upgrade (Eng Oaks II) 7,132,806<br />
SW-Upgrade Existing Pump Stat. (Eng Oaks III) 11,628,003<br />
Class A Sludge Stabilization 320,049<br />
Westside Area Roughing Plant 10,619,968<br />
Northside WWTP-FDEP Chlorine Contact Chamber 79,783<br />
Additional Treatment Capacity at Northside 15,800,000<br />
Additional Treatment Capacity at Glendale-Engineering 30,000 250,000<br />
Glendale Capacity Increase 25,000,000<br />
US 98 South Growth Area Capacity Expansion 3,000,000<br />
Engineering<br />
FDEP West Lklnd Wasteload Reduction Facility FY04 28,868<br />
FDEP Glendale Class A Sludge Stabilization 6,300<br />
SW Area-Booster Pump & Airpark Upgrade[E.O. 2] 11,805<br />
SW Area-Upgrade Existing Pump Stations [E.O.3] 27,500<br />
Sub-total 38,110,668 30,000 41,050,000
F – 34<br />
WASTEWATER UTILITY<br />
CAPITAL IMPROVEMENT PLAN<br />
ADJUSTED<br />
2009 <strong>2010</strong> 2011 2012 2013 2014 2015 2016 2017 2018 2019<br />
BUDGET PROPOSED PROJECTED PROJECTED PROJECTED PROJECTED PROJECTED PROJECTED PROJECTED PROJECTED PROJECTED<br />
MISCELLANEOUS:<br />
Impact Fees<br />
Wastewater Building Expansion 250,000<br />
Wastewater Impact Fee Study 50,000 30,000<br />
SRL Debt Service - Impact Fees 730,000 945,000 945,000 945,000 945,000 945,000 945,000 945,000 945,000<br />
Debt Service-Impact Fees 1,052,736 1,052,736 1,052,736 1,052,736 1,052,736 1,052,736 1,052,736 1,052,736<br />
Skyview Utility System 21,993<br />
Renewal & Replacement<br />
Contingency 50,000 150,000 150,000 150,000 150,000 150,000 150,000 150,000 150,000 150,000 150,000<br />
Equipment-noncapital 1,850<br />
Equipment 226,791 92,400 100,000 100,000 100,000 100,000 100,000 100,000 100,000 100,000 100,000<br />
Transfer to Fleet Management Fund 186,000 84,000<br />
Radio Replacement - repayment <strong>of</strong> FY 2000 purchases19,849 19,849 19,849 19,849 19,849<br />
Maximo Phase II Implementation 25,194<br />
Security Enhancements 98,687<br />
Annual Report 9,408 12,000 12,000 12,000 12,000 12,000 12,000 12,000 12,000 12,000 12,000<br />
MAXIMO Upgrades <strong>City</strong> Wide 59,993<br />
Wireless Work Order System Interface 43,028<br />
Local Limits Headworks Study 70,000 80,000 80,000<br />
CWE5183 LibertyNet Archives Implementation 15,000<br />
US98 Capacity Study 100,000<br />
Sanitary Sewer Inventory Conversion 54,000 100,000 75,000 75,000 75,000 75,000 75,000 75,000 75,000 75,000 100,000<br />
Micr<strong>of</strong>iche Archives Conversion 33,000<br />
Environmental Impact Alafia River 86,212<br />
Water Balance Study 25,000<br />
Water Treatability Study 16,000<br />
Transfer to PIF-Training Center Relocation / Renovation 11,082 11,082 11,082 11,082 11,082<br />
Sub-total 2,244,741 1,522,067 2,150,667 2,365,667 2,445,667 2,345,818 2,334,736 2,364,736 1,532,000 1,362,000 1,307,000<br />
TOTAL EXPENSES 48,983,901 5,228,067 6,255,667 5,115,667 5,595,667 5,475,818 5,374,736 46,409,736 4,737,000 4,797,000 3,747,000<br />
ENDING CASH BALANCES:<br />
CAPITAL IMPROVEMENTS ACCOUNT<br />
IMPACT FEES 3,857,587 3,384,851 2,782,115 2,264,379 2,146,643 2,028,907 1,911,171 1,763,435 2,448,435 3,383,435 4,318,435<br />
RENEWAL AND REPLACEMENT 2,061,021 1,327,472 396,323 820,174 794,025 857,725 1,022,507 1,232,289 1,232,071 1,221,853 1,961,635<br />
SRL<br />
TOTAL CASH BALANCES 5,918,608 4,712,323 3,178,438 3,084,553 2,940,668 2,886,632 2,933,678 2,995,724 3,680,506 4,605,288 6,280,070
F – 35<br />
WATER UTILITY<br />
CAPITAL IMPROVEMENT PLAN<br />
ADJUSTED<br />
2009 <strong>2010</strong> 2011 2012 2013 2014 2015 2016 2017 2018 2019<br />
BUDGET PROPOSED PROJECTED PROJECTED PROJECTED PROJECTED PROJECTED PROJECTED PROJECTED PROJECTED PROJECTED<br />
REVENUES:<br />
Impact Fee Collections 2,000,000 750,000 1,000,000 1,200,000 1,500,000 1,500,000 1,750,000 1,750,000 1,750,000 1,750,000 1,750,000<br />
Transfer from Operations-R&R 3,300,000 3,000,000 3,300,000 3,300,000 3,300,000 3,300,000 3,300,000 3,300,000 3,300,000 3,300,000 3,300,000<br />
Interest Earnings-Impact Fees 250,000 250,000 250,000 250,000 250,000 250,000 250,000 250,000 250,000 250,000 250,000<br />
Interest Earnings-Renewal and Replacement 272,000 272,000 272,000 272,000 272,000 272,000 272,000 272,000 272,000 272,000 272,000<br />
Unappropriated Surplus 9,749,597 897,072 1,584,792 (1,074,113) (1,945,223) (1,926,273) (1,971,000) (2,036,390) (2,018,060) (1,901,585) (1,921,750)<br />
TOTAL REVENUES 15,571,597 5,169,072 6,406,792 3,947,887 3,376,777 3,395,727 3,601,000 3,535,610 3,553,940 3,670,415 3,650,250<br />
IMPACT FEE PROJECTS<br />
PRODUCTION:<br />
Permit Renewal 32,771<br />
LWD9550 Northeast Water Treatment Plant 79,352<br />
LWE9596 Water Use Permit Modifications 256,256<br />
LWP9597 Wellfield Imp Program - Tech Srvcs 226,000<br />
LWP9598 Wellfield Imp Program - Construction 700,000<br />
Northeast Plant Upgrade (C.W. Combee WTP) 100,000<br />
Combee Production Well Pump and Motor 150,000<br />
Sub-total 1,294,379 150,000 100,000<br />
RENEWAL AND REPLACEMENT FUND PROJECTS<br />
PRODUCTION:<br />
Tools & Equipment 32,000 34,000 34,000 36,000 36,000 38,000 38,000 40,000 40,000 40,000 40,000<br />
PICS Capital Equipment 4,000 4,000 5,000 5,000 6,000 6,000 8,000 8,000 8,000 10,000 10,000<br />
Equipment Replacement 90,000 90,000 90,000 90,000 90,000 100,000 100,000 100,000 100,000 100,000 100,000<br />
NW Plant Auxiliary System Upgrades 20,000 100,000 100,000 100,000 100,000 100,000 100,000 100,000 100,000 100,000 100,000<br />
Chlorine Building Improvements 25,000<br />
PICS System Replacement 850,000 700,000 600,000 600,000<br />
Security Enhancements 20,407<br />
Rehab HS Pumps & Backwash Transfer Pumps 402,056 60,000<br />
Diesel Containment Structures 1,349,070<br />
Painting <strong>of</strong> Structures Williams WTP 103,355 40,000<br />
NE Monitoring Well Equipment Replacement 30,090 40,000 40,000 40,000 40,000 40,000 40,000 40,000 40,000 40,000 40,000<br />
Chlorine Response Equipment Replacement 5,000 15,000 15,000 20,000 20,000 20,000 20,000 20,000 20,000 20,000 20,000<br />
Williams Security Cameras 200,000<br />
Williams Filter Rehabilitation 987,894 150,000<br />
Transfer to Fleet - Additional Vehicle 36,000<br />
Systems Reporting Development Project 60,000<br />
CWP5529 Diesel Spill Remedial Action Plan 938,440<br />
Combee Chlorine Scrubber Rehabilitation 19,529 50,000 50,000 50,000<br />
Abandonment <strong>of</strong> Unused Wells 40,000<br />
CWP5530 Well Meter Rehab 16,511 25,000<br />
Highlands Chlorine Conversion 25,000<br />
10th Street Fiber Optic Communication 25,000<br />
Highlands Ground Storage Tanks 475,745 1,500,000<br />
Sub-total 5,515,097 1,283,000 2,534,000 941,000 332,000 329,000 356,000 308,000 308,000 360,000 310,000
F – 36<br />
WATER UTILITY<br />
CAPITAL IMPROVEMENT PLAN<br />
ADJUSTED<br />
2009 <strong>2010</strong> 2011 2012 2013 2014 2015 2016 2017 2018 2019<br />
BUDGET PROPOSED PROJECTED PROJECTED PROJECTED PROJECTED PROJECTED PROJECTED PROJECTED PROJECTED PROJECTED<br />
IMPACT FEE PROJECTS<br />
TRANSMISSION AND DISTRIBUTION:<br />
Polk County Road Improvements 70,000 170,000 170,000 170,000 170,000 170,000 170,000 180,000 180,000 184,000 187,700<br />
Medulla Road Extension 299,680<br />
In Town Bypass - Phase II 57,000<br />
<strong>Lakeland</strong> Highlands Rd Widening 1,240,007<br />
Hamilton Road Loop - Ph 1 230,000<br />
Hamilton Road Loop - Ph 2 275,119<br />
Williams Tie South - 20" 450,000<br />
US 98-Highland <strong>City</strong> Widen-SR 540 to CR 540A 90,000<br />
County Line Rd - SW Loop (Gateway to W. Pipkin) 608,000<br />
(Old) Medulla Rd Ext. (Hamilton to County Line) 135,000<br />
Drane Field Rd Ext (Hamilton to County Line) 135,000<br />
540A Widening-US 98S to Lkld Highlands 68,000<br />
S. Florida - Harden Connector (Edgewood Ext) 300,000<br />
Harden Blvd CRA (Parkway thru Pipkin) 276,941<br />
W. Pipkin Widening (Medulla to Harden) 430,000 300,000<br />
Subdivision and Development 98,730 65,000 65,000 66,300 66,300 66,300 67,600 67,600 67,600 69,000 70,400<br />
Sub-total 3,953,477 625,000 955,000 236,300 236,300 236,300 237,600 247,600 247,600 253,000 258,100<br />
RENEWAL AND REPLACEMENT FUND PROJECTS<br />
TRANSMISSION AND DISTRIBUTION:<br />
New Service Connections 122,913 45,000 56,100 57,200 58,400 59,575 60,800 62,000 63,200 64,500 65,775<br />
Minor Extensions & Improvements 158,065 190,000 193,800 197,700 201,600 205,700 209,800 214,000 218,300 222,700 227,100<br />
Distribution Facilities Replacement 94,385 46,000 87,720 89,500 91,275 93,100 94,950 96,850 98,800 100,760 102,775<br />
New Water Meters 188,770 75,000 132,600 135,250 138,000 140,760 143,575 146,450 149,375 152,360 155,400<br />
Meter Relocation/Improvement 3,200 7,500 7,650 7,800 7,960 8,120 8,280 8,450 8,615 8,800 8,965<br />
Tools & Equipment 8,230 12,000 12,240 12,500 12,750 13,000 13,260 13,525 13,800 14,100 14,400<br />
Asbestos Pipe Removal 15,855 25,000 25,500 26,010 26,530 27,060 27,600 28,150 28,710 29,300 29,900<br />
Hydrant Installation-New Annexation 21,720 30,000 30,600 31,210 31,850 32,500 33,150 33,810 34,500 35,190 35,900<br />
<strong>City</strong> Project Support 10,600 31,200 31,840 32,475 33,125 33,800 34,500 35,200 35,900 36,600 37,350<br />
Polk County Project Support 40,980 45,000 45,900 46,800 47,750 48,700 49,700 50,675 51,700 52,725 53,800<br />
State/FDOT Project Support 18,200 25,000 25,500 26,000 26,530 27,100 27,600 28,150 28,700 29,300 29,900<br />
<strong>City</strong> Parks & Rec Support 9,435 30,000 30,600 31,200 31,850 32,500 33,150 33,800 34,460 35,150 35,850<br />
GIS Water Data Collection 109,180 111,365 113,595 115,865 118,180 120,540 122,950 125,400 127,900 130,460 133,100<br />
Asbestos Pipe Abatement-Contractors 3,000 34,680 35,375 36,080 36,800 37,540 38,290 39,060 39,840 40,630 41,450<br />
Traffic Control Support 5,000 20,000 55,000 20,000 30,000 20,800 21,225 21,650 22,100 22,525 23,000<br />
Central Controlled Irrigation 30,735 11,490 11,715 11,950 12,190 12,435 12,690 12,940 13,200 13,465 13,750<br />
Long Term Project Support 3,790 122,290 191,215 195,040 198,940 202,920 206,980 211,100 215,325 219,600 224,000<br />
Water Meter Replacement 132,000 100,000 137,330 140,080 142,880 145,740 148,650 151,625 154,660 157,750 160,905<br />
Backflow Prevention 52,180 64,440 65,730 67,045 68,385 69,755 71,150 72,575 74,025 75,500 77,000<br />
Other Distribution Projects (Contingency) 26,647 250,000 255,000 260,100 265,300 270,600 276,000 281,500 287,130 292,900 298,730<br />
N. Virginia/W. 8th/N. New York Fire Imp 2,779<br />
Woodward/Eddy/Buckingham Fire Imp 52,000<br />
Nottingham/John Arthur Way AC Replace 114,933<br />
Reynolds Rd AC Replace-Trans Upgrade 207,000<br />
Replacement <strong>of</strong> Hand Held Radios 8,650 5,200 5,200 5,200 2,600 2,600 2,600 2,600 2,600 2,600 2,600
F – 37<br />
WATER UTILITY<br />
CAPITAL IMPROVEMENT PLAN<br />
ADJUSTED<br />
2009 <strong>2010</strong> 2011 2012 2013 2014 2015 2016 2017 2018 2019<br />
BUDGET PROPOSED PROJECTED PROJECTED PROJECTED PROJECTED PROJECTED PROJECTED PROJECTED PROJECTED PROJECTED<br />
Water Master Plan Projects 134,825 200,000 200,000 200,000 200,000 200,000 200,000 200,000 200,000 200,000<br />
W Parker St-Wabash to Chestnut System Imp 91,710<br />
Parker Road - Lunn to Old Hwy 37 Tie 167,500<br />
CWD5184 McIntosh Access Rd. Waterline Tie 12,500<br />
CWD5187 Replacement <strong>of</strong> GPS Equipment 4,867<br />
CWD5188 Lake Miriam/CR 37A Int. Imp. 31,243<br />
CWD5189 Providence Road at Hooters 4,130<br />
CWD5190 N. <strong>Lakeland</strong> Drainage Imps. 40,054<br />
CWD5194 Airside Fire Line Replacement 55,000<br />
CWE5197Ewell/ Yates Intersection Imp (Polk) 30,000<br />
CWE5198 CSX Relocation Assistance 100,000<br />
Polk County Road Improvements 50,000 70,000 100,000 100,000 100,000 100,000 100,000 100,000 100,000 100,000 100,000<br />
LWD9569 Northeast Water Maint Facility 105,500<br />
Backflow Preventer Aesthetic Retr<strong>of</strong>it 31,000 20,000 50,000 50,000 50,000 50,000 50,000 50,000 50,000 50,000 40,000<br />
Transfer to Fleet - New Vehicle 88,000<br />
Ground Penetrating Radar (GPR) 30,000<br />
<strong>Lakeland</strong> Highlands Rd Widening - Parkway south 1,000,000<br />
Sub-total 2,651,835 2,505,990 1,900,210 1,895,005 1,932,895 1,954,845 1,986,900 2,049,510 2,052,840 2,086,915 2,111,650<br />
IMPACT FEE PROJECTS<br />
ENGINEERING:<br />
Polk County Road Improvements 27,205 35,000 35,000 35,000 35,000 35,000 35,000 35,000 35,000 40,000 40,000<br />
Medulla Road Extension 5,000<br />
Old Polk <strong>City</strong> Rd - West to Moore 312<br />
Williams Tie South - 20" 50,000<br />
540A Widening - US 98S to Lkld Highlands 7,500<br />
US 98-Highland <strong>City</strong> Widen-SR 540 to CR 540A 10,000<br />
S. Florida - Harden Connector (Edgewood Ext.) 158,919<br />
Harden Blvd CRA (Parkway thru Pipkin) 30,392<br />
(Old) Medulla Rd Ext. (Hamilton to County Line) 15,000<br />
Drane Field Rd Ext (Hamilton to County Line) 15,000<br />
LWE9581 Hamilton Road Loop - Phase I 19,948<br />
In-Town Bypass 195,522<br />
Williams DRI Completion 12,702<br />
<strong>Lakeland</strong> Highlands Rd Widening - Parkway South 554,546<br />
Hamilton Road Loop - Phase 2 25,000<br />
English Oaks Water System Improvements 30,085<br />
CWE5160 Harden Blvd-N/S Route-36"Relocate 2,000<br />
LWD9550 Northeast Water Treatment Plant 999<br />
LWD9594 Cnty Line Rd-Gateway to W. Pipkin 67,000<br />
W. Pipkin Widening (Medulla to Harden) 30,000<br />
Impact Fee Study (Admin) 50,000<br />
Subdivision & Commercial 350,000 350,000 350,000 400,000 400,000 400,000 400,000 400,000 400,000 400,000 400,000<br />
Sub-total 1,577,130 435,000 415,000 435,000 435,000 435,000 435,000 435,000 435,000 440,000 440,000
F – 38<br />
WATER UTILITY<br />
CAPITAL IMPROVEMENT PLAN<br />
ADJUSTED<br />
2009 <strong>2010</strong> 2011 2012 2013 2014 2015 2016 2017 2018 2019<br />
BUDGET PROPOSED PROJECTED PROJECTED PROJECTED PROJECTED PROJECTED PROJECTED PROJECTED PROJECTED PROJECTED<br />
RENEWAL AND REPLACEMENT FUND PROJECTS<br />
ENGINEERING:<br />
DRT - Developer Review Commercial 10,000 10,000 10,000 10,000 10,000 10,000 10,000 10,000 10,000 10,000 10,000<br />
SRT - Developer Review Subdivisions 10,000 10,000 10,000 10,000 10,000 10,000 10,000 10,000 10,000 10,000 10,000<br />
Minor Extensions & Improvements 12,500 20,000 20,000 20,000 20,000 20,000 25,000 25,000 25,000 25,000 25,000<br />
Hydrant Installation-New Annexation 500 3,500 5,000 5,000 5,000 5,000 5,500 5,500 5,500 5,500 5,500<br />
<strong>City</strong> Project Support 15,000 25,000 30,000 30,000 30,000 30,000 30,000 35,000 35,000 35,000 35,000<br />
Polk County Project Support 8,500 8,500 9,500 9,500 9,500 9,500 10,000 10,000 10,000 10,000 10,000<br />
State/FDOT Project Support 8,000 30,000 35,000 35,000 35,000 35,000 40,000 40,000 45,000 45,000 45,000<br />
<strong>City</strong> Parks & Rec Support 7,000 20,000 25,000 25,000 25,000 25,000 30,000 30,000 35,000 35,000 35,000<br />
Other Distribution Projects 100,000 100,000 200,000 200,000 200,000 200,000 230,000 230,000 230,000 250,000 250,000<br />
CWE 5096 Crow Water Projects Easements 45,000 30,000 40,000 40,000 40,000 40,000 45,000 45,000 45,000 45,000 45,000<br />
Nottingham/John Arthur Way AC Replace 3,560<br />
Water Master Plan Projects 30,000 20,000 20,000 20,000 20,000 20,000 20,000 25,000 25,000 25,000 25,000<br />
Replacement <strong>of</strong> Hand Held Radios 12,000 12,000<br />
Polk County Road Improvements 10,000 20,000 25,000 25,000 25,000 25,000 30,000 30,000 35,000 35,000 35,000<br />
MWD1023 Skyview Utility System 70,000<br />
Maximo Implemenation 46,952<br />
CWE5160Harden Blvd-N/S Route-36"Relocate 5,000<br />
CWE5162 W Pipkin Widen(Medulla to Harden) 13,086<br />
Containment Structures 30,000<br />
Parker Road - Lunn to Old Hwy 37 Tie 18,000<br />
In-Town Bypass 2,500<br />
T&D Workorder Management System 42,676<br />
CWP5525 Williams Filter Rehabilitation 10,047<br />
Maximo Upgrade Project 60,313<br />
LibertyNet Archives Implementation 16,645<br />
Transfer to PIF-Training Center Relocation / Renovation 11,082 11,082 11,082 11,082 11,082<br />
Sub-total 579,679 320,082 452,582 440,582 440,582 440,582 485,500 495,500 510,500 530,500 530,500<br />
TOTAL EXPENSES 15,571,597 5,169,072 6,406,792 3,947,887 3,376,777 3,395,727 3,601,000 3,535,610 3,553,940 3,670,415 3,650,250<br />
ENDING CASH BALANCES:<br />
IMPACT FEES 2,474,450 2,414,450 2,144,450 2,923,150 4,001,850 5,080,550 6,307,950 7,625,350 8,942,750 10,249,750 11,551,650<br />
RENEWAL AND REPLACEMENT 3,338,753 2,501,681 1,186,889 1,482,302 2,348,825 3,196,398 3,939,998 4,658,988 5,359,648 5,954,233 6,574,083<br />
TOTAL CASH BALANCES 5,813,203 4,916,131 3,331,339 4,405,452 6,350,675 8,276,948 10,247,948 12,284,338 14,302,398 16,203,983 18,125,733
F – 39<br />
ELECTRIC UTILITY<br />
CAPITAL IMPROVEMENT PLAN<br />
ADJUSTED<br />
2009 <strong>2010</strong> 2011 2012 2013 2014 2015 2016 2017 2018 2019<br />
BUDGET PROPOSED PROJECTED PROJECTED PROJECTED PROJECTED PROJECTED PROJECTED PROJECTED PROJECTED PROJECTED<br />
REVENUES:<br />
Transfer from Operating Fund 40,748,934 23,863,945 36,749,007 37,116,497 37,487,662 37,862,539 38,241,164 38,623,576 39,009,811 39,399,910 39,793,909<br />
Grant Proceeds-Smart Grid 10,000,000 10,000,000<br />
Debt Proceeds 44,701,607 13,000,000 12,000,000<br />
TOTAL REVENUES 85,450,541 23,863,945 59,749,007 59,116,497 37,487,662 37,862,539 38,241,164 38,623,576 39,009,811 39,399,910 39,793,909<br />
EXPENDITURES:<br />
Call Center Technology 150,000<br />
Energy Service Evaluation 245,473<br />
Fire System Batery Replacement 307,741<br />
Heritage Town Center 770,000<br />
NERC Compliance 197,439<br />
Ops Control Center - Parker Street 5,267,704<br />
Smart Grid Design & Study Phase 1,500,000 23,000,000 22,000,000<br />
230kv/69kv Transmission Lines 10,373,646 461,000 2,084,147 3,840,000 7,015,000 6,700,000 2,900,000 7,327,853 4,800,000 1,000,000 2,780,000<br />
Substations 5,077,450 1,431,776 10,564,000 3,280,000 7,500,000 6,400,000 3,300,000 2,100,000 6,400,000 4,700,000<br />
Larsen Plant Unit 8 1,171,100 1,700,000 3,600,000 1,000,000 1,000,000 1,000,000 1,000,000 1,800,000 1,000,000 1,000,000<br />
MMP Administration Building 1,992,470 1,000,000<br />
MMP Maintenance Building 3,000,000<br />
McIntosh Plant Unit 1 931,576<br />
McIntosh Plant Unit 2 1,278,164 1,000,000 2,700,000 1,800,000<br />
McIntosh Plant Unit 3 24,481,728 3,155,307 7,967,000 11,921,000 5,606,000 7,529,000 6,216,000 4,440,000 3,486,000 4,122,000 3,240,000<br />
McIntosh Plant Unit 5 9,884,770 3,674,840 7,430,000 5,185,000 5,691,000 10,697,000 5,203,000 5,209,000 9,215,000 10,221,000 5,228,000<br />
McIntosh GT 12,071 100,000 650,000<br />
Winston 6 100,000 100,000 100,000 100,000<br />
TOTAL LTC CAPITAL PROJECTS 63,641,338 9,722,923 55,945,147 51,576,000 29,612,000 32,426,000 18,619,000 20,076,853 25,701,000 21,043,000 14,048,000<br />
TOTAL R & R PROJECTS 21,809,203 14,141,022 14,515,000 14,915,000 15,326,000 15,750,000 16,186,000 16,634,000 17,095,000 17,569,000 18,056,000<br />
TOTAL EXPENDITURES 85,450,541 23,863,945 70,460,147 66,491,000 44,938,000 48,176,000 34,805,000 36,710,853 42,796,000 38,612,000 32,104,000<br />
CASH BALANCE (10,711,140) (18,085,643) (25,535,981) (35,849,442) (32,413,278) (30,500,555) (34,286,744) (33,498,834) (25,808,926)
F – 40<br />
ELECTRIC UTILITY<br />
CAPITAL IMPROVEMENT PLAN<br />
ADJUSTED<br />
2009 <strong>2010</strong> 2011 2012 2013 2014 2015 2016 2017 2018 2019<br />
BUDGET PROPOSED PROJECTED PROJECTED PROJECTED PROJECTED PROJECTED PROJECTED PROJECTED PROJECTED PROJECTED<br />
230kv/69kv Transmission Lines<br />
LEE8231 Glendale-Eaton Park 69kv Line 286,432<br />
LEE8241 Tenoroc Northwest 69kv Line Reconductor 265,670<br />
LEE8242 Socrum Hemphill 69 kv Line (2,691)<br />
LDE8251 Indian Lakes to Galloway 69kV Line 75,000 4,400,000<br />
LEE8281 Hamilon to Winston 69kv line 1,500,000 1,500,000<br />
LDE8149 Lake Mirror to Palmetto 69kV Upgrade 1,000,000<br />
County Line South to Christina/Dranefield 69kV & 12kV 3,000,000 2,600,000<br />
County Line South to Hamilton 69kV & 12kV 3,000,000 2,200,000<br />
Interstate-Northwest 69kV Reconductor 415,000<br />
Medulla-Dranefield 69kV and 12kV 1,400,000<br />
LEE8252 West-Winston 69kV Line Upgrade 600,000<br />
Crews Lake Terminal for Grove Line 90,000<br />
Grove Terminal For Crews Lake Line 175,000<br />
Mt Oliver to Orangedale/TECO 69kV Line 125,000 800,000 400,000<br />
CEE8119 Bridgewater 69kV and 12kV Lines 1,855,000<br />
CEE8120 Hamilton-Dranefield 69kV Trans & 12kV Dist50,000 384,147 1,500,000 727,853<br />
Orangedale to Socrum 69 KV Route Study 6,611,107<br />
LDE8147 <strong>Lakeland</strong> Highlands Transmission Line Relocation 384,028 386,000<br />
LDE8152 Indian Lakes to Socrum 69 kV Line 75,000 3,000,000<br />
Orangedale Terminal for Socrum 69 KV Line 86,850<br />
Socrum Terminal for Orangedale 69kv Line 162,250<br />
Crews Lake-Grove 69kv 700,000 700,000<br />
Dranefield Terminal for Hamilton 250,000<br />
Indian Lakes 12kV Feeders 1,000,000<br />
McIntosh to Tenoroc 230kV Reconductor 600,000<br />
Medulla-Grove 69kV Line 1,000,000 2,780,000<br />
Mt Oliver 12kV Feeders 300,000 400,000<br />
Spare 230/69kV Auto TX 150MVA 2,500,000<br />
Total 230kv/69kv Trans Lines 10,373,646 461,000 2,084,147 3,840,000 7,015,000 6,700,000 2,900,000 7,327,853 4,800,000 1,000,000 2,780,000
F – 41<br />
ELECTRIC UTILITY<br />
CAPITAL IMPROVEMENT PLAN<br />
ADJUSTED<br />
2009 <strong>2010</strong> 2011 2012 2013 2014 2015 2016 2017 2018 2019<br />
BUDGET PROPOSED PROJECTED PROJECTED PROJECTED PROJECTED PROJECTED PROJECTED PROJECTED PROJECTED PROJECTED<br />
Substations<br />
CEE8205 Dranefield New Circuit D384 384,055<br />
CEE8206 Eaton Park New Circuit R384 317,015<br />
CEE8208 Orangedale V334 Upgrade Existing Line 523<br />
CEE8218 Extend Winston Circuit T354 Double Circuit 50,000 384,000<br />
Galloway TX #2 Upgrade 1,300,000<br />
Grove Sunstation TX #2 1,200,000 800,000<br />
West Substation Upgrade 1,400,000 400,000<br />
Interstate Substation - 2nd Transformer & Feeders 2,500,000 500,000<br />
Southwest Substation TX #2 Upgrade 1,000,000 300,000<br />
Northwest Substation TX #1 Upgrade 1,200,000 200,000<br />
Northwest Substation TX #2 Upgrade 1,200,000 200,000<br />
Mt. Olive Substation 2,500,000 1,000,000<br />
Medulla SubstationUpgrade TX#1 1,000,000 300,000<br />
Replace U3 GSU Transformer (@ McIntosh) 2,580,000<br />
LEE8027 Capacitor Modernization Program (11,254)<br />
LEE8028 County Line South Substation 500,000 200,000 1,500,000<br />
LEE8105 West Sub for Hamilton Sub Delay 8,617<br />
LEE8122 I-4 T&D Lines Relocaton 31,681<br />
LEE8219 Medulla Substation Capacity Upgrade 377,945<br />
LEE8255 West Substation Rebuild Fire 279,559 500,000<br />
LEE8262 Eaton Park Substation Rebuild 96,670<br />
Bridgewater Substation, TX & Feeders 960,000 1,600,000<br />
Glendale Substation Rebuild 1,904<br />
LDS8209 Glendale Substation Rebuild TX #1 1,083,119<br />
LDS8255 Glendale Substation Restoration Fire 129,502 300,000<br />
LEM8025 Hamilton Substation & T&D Feeders 1,600,000 900,000 1,500,000 200,000<br />
LEM8026 RTU Replacement 310,271<br />
LEM8106 Indian Lake Substation 150,000 2,000,000 3,000,000 3,000,000 4,500,000<br />
Indian Lake 30 MVAr Capacity Bank 80,000<br />
Larsen Dist Sub Rebuild 2,200,000<br />
Highland <strong>City</strong> Sub TX #2 Upgrades 1,500,000<br />
LDG9001 LT Project resources 907,845 631,776<br />
Total Substations 5,077,450 1,431,776 10,564,000 3,280,000 7,500,000 6,400,000 3,300,000 2,100,000 6,400,000 4,700,000
F – 42<br />
ELECTRIC UTILITY<br />
CAPITAL IMPROVEMENT PLAN<br />
ADJUSTED<br />
2009 <strong>2010</strong> 2011 2012 2013 2014 2015 2016 2017 2018 2019<br />
BUDGET PROPOSED PROJECTED PROJECTED PROJECTED PROJECTED PROJECTED PROJECTED PROJECTED PROJECTED PROJECTED<br />
Larsen Plant<br />
LPP U8 Condenser Air Removal System Upgrade 250,000<br />
LPP U8 CT Controls Update 600,000 200,000<br />
LPP COL LTC Resources 542,454<br />
LPP U8 CT Turbine Exhaust Plenum Replacement 1,000,000 500,000<br />
LPP U8 CT Turbine Shell Replacement 178,646 1,000,000<br />
LPP U8 Expansion Joint 100,000<br />
LPP U8 Dampers/Expansion Joint 100,000 400,000<br />
LPP U8 Steam Turbine Inspection 1,500,000 1,800,000<br />
LPE U8 Remote Operation 100,000<br />
LPP U8 Generation Reliability Improvement 1,000,000 1,000,000 1,000,000 1,000,000 1,000,000 1,000,000<br />
Total Larsen Plant 1,171,100 1,700,000 3,600,000 1,000,000 1,000,000 1,000,000 1,000,000 1,800,000 1,000,000 1,000,000<br />
McIntosh Plant<br />
MMP Administration Building 1,992,470 1,000,000<br />
MMP Maintenance Building 3,000,000<br />
MMP JT U3 Air Heater Basket Replacement 321,600 150,000 336,000 156,000<br />
MMP JT U3 Ball Mill Shell Repl 111,026<br />
MMP JT U3 Boiler Repairs 594,736<br />
MMP JT U3 CAMR Compliance 156,000<br />
MMP JT U3 Circulating Water Line Coating 1,200,000<br />
MMP JT U3 Clean Air Act (CO2) 60,000 600,000<br />
MMP JT U3 Clean Air Act (NOX) 540,000 30,000 540,000 30,000 540,000 30,000<br />
MMP JT U3 Clean Air Act (SOX) 1,800,000 2,400,000<br />
MMP JT U3 Coal Transportation Options 38,650<br />
MMP JT U3 Coal Unloading/Blending System 2,120,854 1,300,000 2,300,000 2,400,000<br />
MMP JT U3 Coal Yard Heavy Equipment Replacement 325,307 506,000 146,000 146,000 343,000<br />
MMP JT U3 Coal Yard Reconstruction 720,000<br />
MMP JT U3 Coal Yard System Improvements 405,281 600,000 75,000 150,000<br />
MMP JT U3 Controls Replacement 202,859 180,000 210,000 300,000 900,000 1,200,000<br />
MMP JT U3 Clean Air Act SCR 15,171,190<br />
MMP JT U3 Combustion Byproduct Marketing 2,675<br />
MMP JT U3 Cooling Tower Rebuild 1,200,000 1,200,000 1,200,000 1,200,000 600,000<br />
MMP JT U3 CEMS Analyzer Repl 48,527<br />
MMP JT U3 CSI Facility Upgrade 307,219 180,000<br />
MMP JT U3 Economizer Tube Replacement 276,000 462,000<br />
MMP JT U3 Fire System Upgrade 351,772 150,000 150,000<br />
MMP JT U3 Generation Reliability Improvement 3,000,000 3,000,000 3,000,000 3,000,000<br />
MMP JT U3 Hi Temp Reheater Replacement 600,000 840,000<br />
MMP JT U3 High Energy Pipe Assessment and Hanger Study 120,000 120,000<br />
MMP JT U3 Insulation Repair 60,000 60,000 60,000<br />
MMP JT U3 Limestone System Upgrades 782,628<br />
MMP JT U3 Low Nox Burners 1,150,436<br />
MMP JE U3 McIntosh Track & Trestle Rebuild 599,215<br />
MPP JT U3 Mobile Equipment Replacement 145,307<br />
MMP JT U3 Painting 1,200,000 1,200,000 1,200,000 1,200,000 1,200,000
F – 43<br />
ELECTRIC UTILITY<br />
CAPITAL IMPROVEMENT PLAN<br />
ADJUSTED<br />
2009 <strong>2010</strong> 2011 2012 2013 2014 2015 2016 2017 2018 2019<br />
BUDGET PROPOSED PROJECTED PROJECTED PROJECTED PROJECTED PROJECTED PROJECTED PROJECTED PROJECTED PROJECTED<br />
MMP JT U3 Primary Superheater Tube & Economizer Uplegs 60,000<br />
MMP JT U3 Primary Superheater 600,000 1,800,000<br />
MMP JT U3 Pulverizer Improvements 311,492 130,000 180,000 130,000 180,000<br />
MMP JT U3 Rail Cars 228,518<br />
MMP JT U3 Reheat Horizontal Tube Replacement 600,000 1,350,000<br />
MMP JT U3 Reheat Vertical Upleg Tube Replacement225,000 360,000 480,000<br />
MMP JT U3 Reline Process Wastewater Ponds 1,800,000<br />
MMP JT U3 Safety Silencers (12) Replacement 300,000 300,000<br />
MMP JT U3 Scrubber Forced Oxidation 330,384<br />
MMP JT U3 Scrubber Improvements 306,294 270,000 300,000 180,000 180,000 120,000 120,000 210,000 210,000 120,000 210,000<br />
MMP JT U3 Sootblower Wall Panel Repl 322,125 165,000 180,000 180,000 180,000<br />
MMP JT U3 Turbine Blades 336,828<br />
MMP IRP Update & Unit 3 Valuation Study 7,112<br />
MMP MGT HGP Inspection 100,000 650,000<br />
MMP MGT Turbine Controls 12,071<br />
MPP U1 Generation Reliability Improvement 747,224<br />
MPP U1 Boiler Repair and Evaluation 161,852<br />
MMP U1 #11 Well Pump VFD Replacement 22,500<br />
MMP U2 Bridge Crane Upgrade 500,000<br />
MMP U2 Circulating Water Line 135 1,200,000<br />
MMP U2 Major Turbine Outage 1,500,000 1,800,000<br />
MMP U2 Waterwall Tube Replacement 760,007<br />
MMP U2 Generation Reliability Improvement 18,022 1,000,000<br />
MMP U5 Catalyst Replacement 1,000,000 1,000,000<br />
MMP U5 Corrosion Mitigation/Upgrades 600,758 750,000<br />
MMP U5 CT Compressor Major Repair 500,000<br />
MMP U5 DCS Controls Replacement 500,000 1,000,000<br />
MMP U5 Generation Reliability Improvement 2,000,000 2,000,000 2,000,000 2,000,000 2,000,000<br />
MMP U5 ST Generator Rewind 3,174,012<br />
MMP U5 HRSG Upgrades 2,500,000 7,500,000<br />
MMP U5 Row One Ring Segment Replacement 500,000<br />
MMP U5 ST L-0 Blades 550,000 3,000,000<br />
MMP U5 ST Major Outage 2,000,000 5,000,000<br />
MMP U5 Training Simulator 1,000,000<br />
U5 LTMA Assets 2,000,000 3,000,000 3,000,000 3,000,000 3,000,000 3,000,000 3,000,000 3,000,000 3,000,000 3,000,000 3,000,000<br />
Winston SCR and Silencer Replacement 100,000 100,000 100,000 100,000<br />
Allocated Payroll 174,840 180,000 185,000 191,000 197,000 203,000 209,000 215,000 221,000 228,000<br />
Capitalized Purchase Power 3,060,000<br />
Total McIntosh Plant 38,580,785 7,830,147 18,597,000 18,856,000 14,097,000 18,326,000 11,419,000 9,649,000 12,701,000 14,343,000 10,268,000
THIS PAGE IS INTENTIONALLY BLANK<br />
F – 44
Table <strong>of</strong> Contents<br />
Supplementary Information .............................................................. Section—G<br />
Largest Taxpayers ................................................................................ G-2<br />
Schedule <strong>of</strong> Property Tax Rates ......................................................... G-3<br />
General Fund Property Tax Levies and Collections .......................... G-4<br />
Governmental Activities Tax Revenues by Source ........................... G-6<br />
Changes in Fund Balances <strong>of</strong> Governmental Funds ......................... G-7<br />
Glossary <strong>of</strong> Terms ................................................................................ G-8<br />
Abbreviations and Acronyms ............................................................ G-13<br />
Department Tables <strong>of</strong> Organization & Position Management ........ G-15<br />
G-1 Fiscal Year <strong>2010</strong> Annual Budget
Ten Largest Taxpayers<br />
G-2 Fiscal Year <strong>2010</strong> Annual Budget
Schedule <strong>of</strong> Property Tax Rates - Direct and<br />
Overlapping Governments<br />
G-3 Fiscal Year <strong>2010</strong> Annual Budget
General Fund Property Tax Levies and<br />
Collections<br />
G-4 Fiscal Year <strong>2010</strong> Annual Budget
General Fund Property Tax Levies and<br />
Collections (cont’d)<br />
G-5 Fiscal Year <strong>2010</strong> Annual Budget
Governmental Activities Tax Revenues by Source<br />
G-6 Fiscal Year <strong>2010</strong> Annual Budget
Changes in Fund Balances <strong>of</strong> Governmental<br />
Funds<br />
G-7 Fiscal Year <strong>2010</strong> Annual Budget
Glossary <strong>of</strong> Terms<br />
The budget document uses many terms and words that have specific meaning in the context <strong>of</strong><br />
governmental finance or to the <strong>City</strong> <strong>of</strong> <strong>Lakeland</strong>. The glossary defines words and terms that may have very<br />
specific meaning or may not be in common usage.<br />
Accrual Basis: A basis <strong>of</strong> accounting using the economic resources measurement focus. Revenues are<br />
recorded when earned. Expenses are recorded when a liability is incurred. Fixed assets are capitalized<br />
(i.e. recorded on the balance sheet, not the income statement). Depreciation is recorded on fixed assets.<br />
Activity: A specific and distinguishable service performed by one or more organizational components <strong>of</strong><br />
the <strong>City</strong> to accomplish a function for which the <strong>City</strong> is responsible.<br />
Ad Valorem Taxes: Taxes levied on both real and personal property according to the property’s valuation<br />
and the tax rate.<br />
Adoption: The formal action taken by the <strong>City</strong> Commission to authorize or approve the budget.<br />
American Public Power Association (APPA): A service organization for the nation's more than<br />
2,000 community-owned electric utilities that serve more than 43 million Americans.<br />
Appropriation: The spending limit adopted or authorized by the <strong>City</strong> Commission.<br />
Asset: Resources owned or held by governments that have monetary value.<br />
Attrition: A method <strong>of</strong> achieving a reduction in personnel by not refilling the positions vacated through<br />
resignation, reassignment, transfer, retirement, or means other than lay<strong>of</strong>fs.<br />
Authorized Position: An employee position, authorized in the adopted budget to be filled during the year.<br />
Available (Undesignated) Fund Balance: Refers to the funds remaining from the prior year, which are<br />
available for appropriation and expenditure in the current year.<br />
Bad Debt: The estimated amount <strong>of</strong> accounts owed to the <strong>City</strong> (receivables) that will not be collected<br />
during the year. This includes utility accounts, accident damage repair accounts and other miscellaneous<br />
account receivables, which are deemed uncollectible.<br />
Balanced Budget: Total estimated receipts, including appropriated fund balance/reserve, shall equal total<br />
<strong>of</strong> appropriations and reserves for future use.<br />
Base Budget: Cost <strong>of</strong> continuing the existing levels <strong>of</strong> service in the current budget year.<br />
Bond: A long term promissory note or IOU. The note includes a specific principal amount and stated<br />
interest rate. Bonds are used to finance capital projects.<br />
General Obligation (G.O.) Bond: A type <strong>of</strong> bond that is backed by the full faith, credit and taxing<br />
power <strong>of</strong> the <strong>City</strong>.<br />
Revenue Bond: A bond that is backed by a particular revenue source such as water user fees.<br />
Bond Refinancing: A pay<strong>of</strong>f and re-issuance <strong>of</strong> bonds to obtain better interest rates and/or bond<br />
conditions.<br />
Budget: A financial plan approved by the <strong>City</strong> Commission that includes estimates for revenues and limits<br />
on expenditures.<br />
Budget Calendar: The schedule <strong>of</strong> key dates that the <strong>City</strong> follows in the preparation and adoption <strong>of</strong> the<br />
budget.<br />
Budgetary Control: The control or management <strong>of</strong> a government in accordance with the approved budget<br />
for the purpose <strong>of</strong> keeping expenditures within the limitations <strong>of</strong> available appropriations and resources.<br />
Capital Assets: Assets <strong>of</strong> significant value and having a useful life <strong>of</strong> several years. Capital assets are<br />
also called fixed assets.<br />
Capital Improvement Plan (CIP): A financial plan for the improvement <strong>of</strong> streets, parks, utilities and other<br />
major infrastructure items. The capital budget includes revenue sources and expenditure limits.<br />
G-8 Fiscal Year <strong>2010</strong> Annual Budget
Glossary <strong>of</strong> Terms<br />
Capital Outlay: Fixed assets which have a value <strong>of</strong> $1,000 or more and have a useful economic lifetime <strong>of</strong><br />
more than one year or assets <strong>of</strong> any value if the nature <strong>of</strong> the item is such that it must be controlled for<br />
custody purposes as a fixed asset.<br />
Capital Project: Major construction, acquisition, or renovation activities that add value to a government’s<br />
physical assets or significantly increase its useful life.<br />
Central Business District (CBD): The core area <strong>of</strong> <strong>Lakeland</strong>’s downtown.<br />
Charges for Services: A user fee or rate levied against a person or entity that has received an identifiable<br />
benefit in exchange. Examples would include bus fare, water usage charges or grave openings.<br />
Collective Bargaining Agreement: A legal contract between the <strong>City</strong> and representative <strong>of</strong> a recognized<br />
bargaining unit for specific terms and conditions <strong>of</strong> employment (e.g. hours, working conditions, salary,<br />
fringe benefits, and matters affecting health and safety <strong>of</strong> employees).<br />
Consumer Price Index (CPI): A statistical description <strong>of</strong> price levels provided by the U.S. Department <strong>of</strong><br />
Labor. The index is used to measure the increase in the cost <strong>of</strong> living economic inflation.<br />
Component Unit: A legally separate organization for which the elected <strong>of</strong>ficials <strong>of</strong> the <strong>City</strong> are financially<br />
accountable. A component unit can be another organization for which the nature and significance <strong>of</strong> its<br />
relationship with the <strong>City</strong> is such that exclusion would cause the reporting entity’s financial statements to be<br />
misleading or incomplete.<br />
Contingency: A budgetary reserve for emergencies or unanticipated expenditures/opportunities.<br />
Contractual Services: Services rendered to the <strong>City</strong> by private firms, individuals, or other governmental<br />
agencies (e.g. maintenance agreements and pr<strong>of</strong>essional consulting services).<br />
Core Service: Fundamental services or sub-activities provided to meet the <strong>City</strong>’s Mission and Goals<br />
Debt Service: Principal and interest payments for outstanding debt such as bonds or notes payable.<br />
Dedicated Tax: A tax levied to support a specific government program or purpose.<br />
Deficit: The excess <strong>of</strong> an entity’s liabilities over its assets or the excess <strong>of</strong> expenditures or expenses over<br />
revenues during a single accounting period.<br />
Department: Organizational unit <strong>of</strong> government, which is functionally unique in its delivery <strong>of</strong> services.<br />
Depreciation: The portion <strong>of</strong> the cost <strong>of</strong> a fixed asset (i.e. a car or treatment plant) charged as an expense<br />
during the fiscal year. Eventually the entire cost <strong>of</strong> the fixed asset will be charged <strong>of</strong>f as an expense. Only<br />
Enterprise and Internal Service funds have depreciation.<br />
Employee Benefits: Costs incurred by the <strong>City</strong> for pension, health insurance, and other benefits provided<br />
to employees.<br />
Encumbrance: An amount <strong>of</strong> money committed for the payment <strong>of</strong> goods and services not received or<br />
paid.<br />
Expenditure: The payment <strong>of</strong> cash or the transfer <strong>of</strong> property or services for the purpose <strong>of</strong> acquiring<br />
goods and/or services or settling a loss.<br />
Expense: Charges incurred (whether paid immediately or to be paid at a later date) for operations,<br />
maintenance, interest or other charges.<br />
Fiscal Year: The time period for which the budget is authorized and measured by the accounting records.<br />
The <strong>City</strong> <strong>of</strong> <strong>Lakeland</strong>’s fiscal year begins on October 1 st and ends on September 30 th .<br />
Fixed Assets: Assets <strong>of</strong> long-term character that are used for the government, such as land, buildings,<br />
machinery, furniture, and other equipment.<br />
Florida Municipal Power Agency (FMPA): A wholesale power company owned by municipal electric<br />
utilities. FMPA provides economies <strong>of</strong> scale in power generation and related services to support communityowned<br />
electric utilities.<br />
G-9 Fiscal Year <strong>2010</strong> Annual Budget
Glossary <strong>of</strong> Terms<br />
Full-Time Equivalent (FTE): The number <strong>of</strong> employee hours (2080) needed to be equal to one full-time<br />
employee. Several part-time employees may be combined to make one full-time equivalent.<br />
Fund: A fiscal and accounting entity with a self-balancing set <strong>of</strong> accounts recording cash and other<br />
financial resources.<br />
Enterprise Fund: Certain activities are treated as self-supporting businesses (e.g. water and<br />
sewer utilities). The accounting for these activities is accounted for in separate funds called<br />
enterprise funds.<br />
Debt Service Fund: Funds used to record the payment <strong>of</strong> general debt.<br />
General Fund: General purpose fund supported by taxes, fees and other revenues. The funds<br />
may be used for any lawful purpose.<br />
Internal Service Fund: Centralized services that serve all or many established in separate funds.<br />
The other funds are charged a fee for the services provided by the Internal Service Fund.<br />
Special Revenue Fund: A fund used to account for the revenues and expenditures <strong>of</strong> special<br />
earmarked or legally restricted monies.<br />
Stormwater Fund: Revenues, received primarily through the collection <strong>of</strong> residential and<br />
commercial fees as well as transfers from the Transportation Fund for drainage and lake projects,<br />
are used for projects approved by the <strong>City</strong> Commission for stormwater capital activities.<br />
Fund Balance: The difference between a fund’s assets and liabilities, sometimes referred to as the<br />
amount carried over from one year to the next year.<br />
Generally Accepted Accounting Principles (GAAP): Uniform minimum standards for financial<br />
accounting and recording, encompassing the conventions, rules and procedures that define accepted<br />
accounting principles.<br />
Goal: A general and timeless statement <strong>of</strong> direction, purpose or intent based on the community’s needs.<br />
Grants: A contribution by a government or other organization to support a particular function.<br />
Impact Fee: A fee charged to a developer or individual to fund the future cost <strong>of</strong> improvements associated<br />
with the development’s impact on various <strong>City</strong> services; charged as a condition for obtaining a building<br />
permit.<br />
Indirect Cost: A cost necessary for the functioning <strong>of</strong> the organization as a whole that can not be directly<br />
assigned to one service.<br />
Infrastructure: Vital facilities such as roads, sewers, bridges, water lines, public buildings, parks and<br />
airports that are fixed in location.<br />
Inter-Fund Transfer: Legally authorized transfers from a fund receiving revenue to a fund through which<br />
resources are to be expected.<br />
Intergovernmental: Revenue from another governmental agency such as the State <strong>of</strong> Florida or the<br />
United States Federal Government. Some revenues from local units are treated as Charges for Service.<br />
Internal Service Charges: Charges to user departments for financing goods or service provided by one<br />
department to another on a cost-reimbursement basis.<br />
<strong>Lakeland</strong> Area Mass Transit District: A component unit <strong>of</strong> the <strong>City</strong> that accounts for all activities<br />
necessary to provide modern bus transportation in the <strong>Lakeland</strong> area. The <strong>City</strong> does not have any<br />
ownership claim against the assets <strong>of</strong> this entity; however, the <strong>City</strong> does maintain some control over<br />
operations in that the majority <strong>of</strong> its governing board is composed <strong>of</strong> members <strong>of</strong> the <strong>City</strong> Commission.<br />
<strong>Lakeland</strong> Downtown Development Authority: A Component Unit <strong>of</strong> the <strong>City</strong> that has the responsibility <strong>of</strong><br />
improving the economic condition in the Central Business District.<br />
G-10 Fiscal Year <strong>2010</strong> Annual Budget
Glossary <strong>of</strong> Terms<br />
Long-Term Debt: Debt with a maturity <strong>of</strong> more than one year after the date <strong>of</strong> issuance.<br />
Mill: One one-thousandth <strong>of</strong> a dollar <strong>of</strong> assessed value.<br />
Millage: Rate used in calculating taxes based upon the value <strong>of</strong> the property, expressed in mills per dollar<br />
<strong>of</strong> property value.<br />
Mission: A description <strong>of</strong> the purpose, values, strategies, and behavior standards that guide an<br />
organization and move it toward its vision. A mission states what the organization is, what it does, for<br />
whom and why.<br />
Modified Accrual: A basis <strong>of</strong> accounting using the current financial resources as a measurement focus.<br />
Revenues are recognized when both measurable and available. Expenditures are recorded when a liability<br />
is incurred. Fixed assets are recorded as an expenditure in the period the asset is acquired.<br />
Objective: A specific/quantifiable statement <strong>of</strong> what the <strong>City</strong>, a department or a unit expects to accomplish<br />
in a fiscal year.<br />
Outcome: Desired output oriented accomplishments, which can be measured and achieved within a set<br />
time-period. Achievement <strong>of</strong> the outcome advances the organization toward a goal.<br />
Operating Budget: The day-to-day cost <strong>of</strong> providing <strong>City</strong> services. The operating budget does not include<br />
capital purchases, for items <strong>of</strong> $1,000 or greater.<br />
Operating Expenses: The cost for personnel, materials and equipment required for a department to<br />
function.<br />
Operating Revenue: Funds that the government receives as income for day-to-day services including<br />
taxes, fees from specific services, interest earnings, and grant revenues.<br />
Peace River Water Basin: The Peace River Basin is the region <strong>of</strong> land in Central and Southwest Florida<br />
that includes portions <strong>of</strong> Charlotte, Hardee, Desoto, Highlands and Polk Counties from which water drains<br />
into the lakes and streams that ultimately supplies water to the Peace River.<br />
Prioritization: To list or rate in order <strong>of</strong> priority according to the <strong>City</strong>’s Goals.<br />
Program: Group activities, operations or organizational units directed to attaining specific purposes or<br />
objectives.<br />
Property Tax: A tax levied on real estate as well as commercial and industrial personal property based on<br />
the value <strong>of</strong> the property.<br />
Performance Budget: A budget wherein expenditures are based primarily upon measurable performance<br />
<strong>of</strong> activities and work programs.<br />
Performance Measure: Data collected to determine a program’s effectiveness or efficiency in achieving<br />
its objectives.<br />
Program: A group <strong>of</strong> related activities performed by one or more organizational units for the purpose <strong>of</strong><br />
accomplishing a government function.<br />
Repurchase Agreements: An agreement where the <strong>City</strong> transfers cash to a broker-dealer or bank; the<br />
broker-dealer or bank transfers the securities to the <strong>City</strong> and promises to repay the cash plus interest in<br />
exchange for the same securities.<br />
Reserve: An account used to set aside budgeted revenues that are not required for expenditure in the<br />
current budget year or to earmark revenues for a specific future purpose.<br />
Retreat: <strong>City</strong> Commission goal setting meeting held around January <strong>of</strong> each year. <strong>City</strong> Manager<br />
communicates <strong>City</strong> Commission goals and sets parameters for budget preparation with Department heads.<br />
Revenue: Money coming into a fund (other than a transfer) such as taxes, user fees, grants, fines and any<br />
other source <strong>of</strong> money.<br />
G-11 Fiscal Year <strong>2010</strong> Annual Budget
Glossary <strong>of</strong> Terms<br />
Rolled-Back Rate: The millage necessary to raise the same amount <strong>of</strong> ad valorem tax revenue as the<br />
previous year, excluding taxes from new construction.<br />
Southwest Florida Water Management District (SWFMD): Responsible for water resources in sixteen<br />
west central Florida counties: Charlotte, Citrus, DeSoto, Hardee, Hernando, Highlands, Hillsborough, Lake,<br />
Levy, Manatee, Marion, Pasco, Pinellas, Polk, Sarasota and Sumter.<br />
Special Assessment: A compulsory levy made against certain properties to defray all or part <strong>of</strong> the cost <strong>of</strong><br />
a specific capital improvement or service deemed to benefit primarily those properties.<br />
Target Budget: Desirable expenditure levels provided to departments to develop a recommended budget.<br />
Based on the prior year’s adopted budget, excluding one-time expenditures, projected revenues and<br />
reserve requirements.<br />
Tax Base: The total property valuations on which each taxing agency levies its tax rates.<br />
Tax Levy: The total amount <strong>of</strong> revenue raised from general property taxes.<br />
Tax Rate: The amount <strong>of</strong> tax levied for each $1,000 <strong>of</strong> assessed valuation. Often called millage rate.<br />
Taxes: Compulsory charges levied by a government for the purpose <strong>of</strong> financing services performed for<br />
the common benefit <strong>of</strong> the people.<br />
Transfer: A transfer is movement <strong>of</strong> money or assets from one fund to another that is not a payment for<br />
service. Sometimes a transfer is one fund subsidizing another fund.<br />
Unencumbered Balance: The amount <strong>of</strong> an appropriation that was not expended or encumbered and is<br />
still available for future purposes.<br />
User Fee: Revenue paid by a party directly benefiting from the use <strong>of</strong> receipt <strong>of</strong> a public service.<br />
Utility Tax: A consumer tax levied by cities on the <strong>of</strong> utilities such as electricity, telephone or gas.<br />
Did you know…<br />
By the end <strong>of</strong> 1885, “<strong>Lakeland</strong> had a<br />
popular resort hotel (the Tremont) and<br />
housed 400 residents, a dozen shops, 3<br />
hotels, an express <strong>of</strong>fice, 2 telegraph<br />
<strong>of</strong>fices, a newspaper, meat markets,<br />
barber shops, shoemaker’s shop, laundry,<br />
blacksmith shop, boarding houses,<br />
bakeries, billiard rooms, etc”...<br />
G-12 Fiscal Year <strong>2010</strong> Annual Budget
Abbreviations and Acronyms<br />
AADF Annual Average Daily Flow<br />
ACH Automated Clearing House<br />
ADA Americans with Disabilities Act<br />
AD&D Accidental Death & Dismemberment<br />
AP Accounts Payable<br />
ALS Advance Life Support<br />
AMI Average Median Income<br />
AOA Airport Operating Area<br />
APPA American Public Power Association<br />
ARA Aramark Food Services<br />
ARFF Aircraft Rescue & Fire Fighting<br />
ATC Airport Traffic Control<br />
BCE Business Cooperative Education<br />
BEMP Building, Electrical, Mechanical, Planning<br />
BICEP Building Inspection Code Enforcement Program<br />
BITS Building Inspection Transportable System<br />
BEBR Bureau <strong>of</strong> Economic & Business Research<br />
BJA Bureau <strong>of</strong> Justice Assistance<br />
BLS Basic Life Support<br />
BMP Best Management Practices<br />
BOD Biological Oxygen Demand<br />
CACO3 Calcium Carbonate<br />
CADD Computer Assisted Design and Drafting<br />
CAFR Comprehensive Annual Financial Report<br />
CAIR Clean Air Interstate Rule<br />
CBD Commercial Business District<br />
CBE Cooperative Business Education<br />
CBIR Community Budget Issue Request<br />
CDBG Community Development Block Grant<br />
CDC Community Development Corporation<br />
CE Code Enforcement<br />
CIP Capital Improvement Plan<br />
CPI Consumer Price Index<br />
CIS Criminal Investigations<br />
CLMP Comprehensive Lakes Management Plan<br />
CM <strong>City</strong> Manager<br />
COLA Cost <strong>of</strong> Living Allowance<br />
CPR Cardiopulmonary Resuscitation<br />
CRA Community Redevelopment Agency<br />
CROW Contracts Right <strong>of</strong> Way<br />
CSU Community Services Unit<br />
DARE Drug Abuse Resistance Education<br />
DART Domestic Abuse Response Team<br />
DCA Department <strong>of</strong> Community Affairs<br />
DEP Department <strong>of</strong> Environmental Protection<br />
DOT Department <strong>of</strong> Transportation<br />
DNA Dinoclaustic Neuclic Acid<br />
DoIt Department <strong>of</strong> Information Technology<br />
DOJ Department <strong>of</strong> Justice<br />
DRI Development <strong>of</strong> Regional Impact<br />
DRT Design Review Team<br />
DUI Driving Under the Influence<br />
DV Digital Video<br />
EAA Experimental Aircraft Association<br />
ECS Emergency Communications Specialists<br />
EMS Energy Management System<br />
EMT Emergency Medical Technicians<br />
ED WMIS Energy Delivery Work Order Management<br />
Information System<br />
EPA Environmental Protection Agency<br />
EVDO Evolution Data Optimized<br />
EZ Enterprise Zone<br />
FAA Federal Aviation Authority<br />
FAR Federal Aviation Regulation<br />
FDLE Federal Department <strong>of</strong> Law Enforcement<br />
FDOT Florida Department <strong>of</strong> Transportation<br />
FEMA Federal Emergency Management Agency<br />
FHFC Florida Housing Finance Corporation<br />
FHSAA Florida High School Athletic Association<br />
FLC Florida League <strong>of</strong> Cities<br />
FMPA Florida Municipal Power Agency<br />
FMPP Florida Municipal Power Pool<br />
FOAG Florida Office <strong>of</strong> the Attorney General<br />
FRCC Florida Reliability Coordinating Council<br />
FRDAP Florida Recreation Development Assistance Program<br />
FT Full-Time<br />
FTE Full-Time Equivalent<br />
FWC Florida Water Conservation<br />
FY Fiscal Year<br />
GAAP Generally Accepted Accounting Principles<br />
GASB Governmental Accounting Standards Board<br />
GFOA Government Finance Officers Association<br />
GIS/CAD Geographic Information System/Computer Aided<br />
Design<br />
GKS General Knowledge Study<br />
GM General Manager<br />
GPS Global Positioning System<br />
gWh Giga-watt Hour<br />
HHR Hurricane Housing Relief<br />
HOME HOME Investment Partnership Program<br />
HR Human Resources<br />
HVAC Heating, Ventilation & Air Condition<br />
HRMS Human Resources Management System<br />
IDS Intrusion Detection System<br />
ILS Instrument Landing System<br />
IRP Integrated Resource Plan<br />
IT Information Technology<br />
JSS Juvenile Services<br />
KIO Key Intended Outcome<br />
KSI Key Success Indicator<br />
kWh Kilowatt Hour<br />
LAC <strong>Lakeland</strong> Airside Center<br />
LCRA <strong>Lakeland</strong> Community Redevelopment Agency<br />
LDDA <strong>Lakeland</strong> Downtown Development Authority<br />
G-13 Fiscal Year <strong>2010</strong> Annual Budget
Abbreviations and Acronyms<br />
LDR<br />
LEAD<br />
LEDC<br />
LFD<br />
LGN<br />
LLC<br />
LLRA<br />
LPD<br />
LTC<br />
LTMA<br />
M/WBE<br />
MDT<br />
MGD<br />
MLK<br />
MSG<br />
MSTU<br />
MSW<br />
MWA<br />
NAMI<br />
NCAN<br />
NERC<br />
NET<br />
NLC<br />
NPDES<br />
O&M<br />
OCAT<br />
OH<br />
OMB<br />
OMS<br />
OSG<br />
OUC<br />
P&R<br />
PAL<br />
PCC<br />
PCCVB<br />
PCD<br />
PDA<br />
PE<br />
PIAT<br />
PIF<br />
PM<br />
PSC<br />
PW<br />
PSN<br />
PT<br />
PUD<br />
QTI<br />
R&R<br />
RPI<br />
ROI<br />
SAIDI<br />
Land Development Regulation<br />
SANS Storage Area Network<br />
Lakes Education Action Drive<br />
SCADA System Control Data Acquisition<br />
<strong>Lakeland</strong> Economic Development Council<br />
SEOC State Emergency Operation Center<br />
<strong>Lakeland</strong> Fire Department<br />
SHIP State Housing Initiative Program<br />
<strong>Lakeland</strong> Government Network<br />
SIS Special Investigations<br />
Limited Liability Corporation<br />
SOAT Strategic Operating Activity Team<br />
<strong>Lakeland</strong> Linder Regional Airport<br />
SOP Strategic Operating Plan<br />
<strong>Lakeland</strong> Police Department<br />
SOS Special Operations Section<br />
Long Term Capital<br />
SPCC Simpson Park Community Center<br />
Long Term Maintenance Agreement<br />
SRO School Resource Officer<br />
Minority/Women-Owned Business Enterprises SWFWMD Southwest Florida Water Management<br />
Mobile Data Terminal<br />
District<br />
Million Gallons per Day<br />
SWAT Special Weapons and Tactics<br />
Martin Luther King<br />
SWOT Strengths-Weaknesses-Opportunities<br />
Main Street Garage<br />
Threats<br />
Municipal Service Taxing Unit<br />
TBD To Be Determined<br />
Municipal Solid Waste<br />
T&D Transmission & Delivery<br />
Maintenance Water Administration<br />
TAC Targeted Areas <strong>of</strong> Concentration<br />
National Alliance for the Mentally Ill <strong>of</strong> Polk County TD Tourist Development<br />
National College Access Network<br />
TDT Tourist Development Tax<br />
N. American Reliability Corporation<br />
TEA-LU Transportation Efficiency Act-A Legacy for<br />
Neighborhood Enforcement Team<br />
Users<br />
National League <strong>of</strong> Cities<br />
TECO Tampa Electric Company<br />
National Pollution Discharge Elimination System TIP Truancy Interdiction Program<br />
Operating & Maintenance<br />
TMDL Total Maximum Daily Load<br />
Organizational Communications Advisory Team TO Table <strong>of</strong> Organization<br />
Overhead<br />
TPO Transportation Planning Organization<br />
Office <strong>of</strong> Management & Budget<br />
U&CF Urban & Community Forestry<br />
Outage Management System<br />
UCM United Conference <strong>of</strong> Mayors<br />
Orange Street Garage<br />
UG Underground<br />
Orlando Utility Commission<br />
UMS Utility Management System<br />
Parks and Recreation<br />
USEPA United States Environmental Protection<br />
Police Athletic League<br />
Agency<br />
Polk Community College<br />
USF University <strong>of</strong> South Florida<br />
Polk County Convention & Visitors Bureau<br />
UT Utility Tax<br />
Pollution Control Device<br />
VISTE Volunteers in Service to the Elderly<br />
Personal Digital Assistants<br />
VOCA Victims <strong>of</strong> Crime Act<br />
Performance Excellence<br />
VTR Video Tape Recorder<br />
Process Improvement Advisory Team<br />
WA Water<br />
Public Improvement Fund<br />
WC Workers Comp<br />
Preventative Maintenance<br />
WTP Water Treatment Plant<br />
Public Service Commission<br />
WW Wastewater<br />
Public Works<br />
WWTP Wastewater Treatment Plant<br />
Project Safe Neighborhood<br />
YTD Year to Date<br />
Part-Time<br />
Planned Unit Development<br />
Did you know….<br />
Qualified Target Industry<br />
Repair and Replace<br />
<strong>Lakeland</strong> is located midway<br />
Rapid Process Improvement<br />
between Key West and the<br />
Return on Investment<br />
Georgia state line.<br />
System Average Interruption Duration Index<br />
G-14 Fiscal Year <strong>2010</strong> Annual Budget
Department Tables <strong>of</strong> Organization<br />
and Position Management<br />
Table <strong>of</strong> Contents<br />
Airport ........................................................................................................... G-17<br />
<strong>City</strong> Attorney ................................................................................................. G-19<br />
<strong>City</strong> Manager ................................................................................................. G-20<br />
Communications .......................................................................................... G-22<br />
Community Development ............................................................................ G-23<br />
Electric<br />
General Manager ..................................................................................... G-26<br />
Customer Service .................................................................................... G-30<br />
Delivery .................................................................................................... G-34<br />
Production ............................................................................................... G-40<br />
Technical Support ................................................................................... G-48<br />
Human Resources<br />
Civil Service ............................................................................................. G-52<br />
Employee Relations ................................................................................ G-53<br />
Finance .......................................................................................................... G-54<br />
Fire ................................................................................................................. G-57<br />
Information Technology .............................................................................. G-59<br />
Internal Audit ................................................................................................ G-61<br />
<strong>Lakeland</strong> Center ........................................................................................... G-62<br />
Parks & Recreation<br />
Director .................................................................................................... G-64<br />
Cemeteries ............................................................................................... G-65<br />
Cleveland Heights Golf Course .............................................................. G-66<br />
Library ...................................................................................................... G-68<br />
Parks ........................................................................................................ G-71<br />
Recreation ................................................................................................ G-73<br />
G-15 Fiscal Year <strong>2010</strong> Annual Budget
Department Tables <strong>of</strong> Organization<br />
and Position Management<br />
Table <strong>of</strong> Contents<br />
Police Department<br />
Office <strong>of</strong> Chief <strong>of</strong> Police ......................................................................... G-75<br />
Administrative Services .......................................................................... G-76<br />
Investigative Services ............................................................................. G-77<br />
Uniform Patrol Divisions......................................................................... G-78<br />
Public Works<br />
Director .................................................................................................... G-81<br />
Construction and Maintenance .............................................................. G-82<br />
Engineering .............................................................................................. G-84<br />
Facilities Maintenance ............................................................................ G-85<br />
Fleet .......................................................................................................... G-86<br />
Lakes and Stormwater ............................................................................ G-87<br />
Solid Waste .............................................................................................. G-88<br />
Traffic ....................................................................................................... G-90<br />
Purchasing and Risk Management ............................................................. G-92<br />
Retirement Services ..................................................................................... G-94<br />
Wastewater<br />
Administration ......................................................................................... G-95<br />
Collection ................................................................................................. G-96<br />
Treatment ................................................................................................. G-97<br />
Wetlands .................................................................................................. G-98<br />
Water<br />
Administration ........................................................................................G-100<br />
Distribution .............................................................................................G-101<br />
Engineering .............................................................................................G-102<br />
Production ..............................................................................................G-103<br />
G-16 Fiscal Year <strong>2010</strong> Annual Budget
Airport<br />
G-17 Fiscal Year <strong>2010</strong> Annual Budget
Airport<br />
FY09 FY10<br />
Personnel Current Proposed PG Salary Range<br />
Airport Director 1 1 PB3 71,079.00 ‐ 132,011.00<br />
Assistant Airport Director 1 1 PB5 56,433.00 ‐ 104,809.00<br />
Accountant III 1 1 58 51,979.20 ‐ 80,641.60<br />
Airport Property Manager 1 1 51 43,804.80 ‐ 67,974.40<br />
Operations Support Supervisor III 1 1 42 35,172.80 ‐ 54,579.20<br />
Maintenance Mechanic II 1 1 38 31,907.20 ‐ 49,504.00<br />
Maintenance Mechanic I 2 2 33 28,246.40 ‐43,804.80<br />
Administrative Assistant 1 1 33 28,246.40 ‐43,804.80<br />
Operations Support Technician II 1 1 29 25,604.80 ‐ 39,748.80<br />
Operations Support Technician I 1 1 24 22,692.80 ‐ 35,172.80<br />
Office Assistant II 1 1 22 21,590.40 ‐ 33,508.80<br />
Operations Support Worker II 1 1 18 19,593.60 ‐ 30,388.80<br />
TOTAL FULL TIME EMPLOYEES 13 13<br />
Air Traffic Control Tower Chief 1 0 54 47,132.80 ‐ 73,153.60<br />
Air Traffic Controller 7 0 * #N/A<br />
TOTAL GRANT FUNDED POSITIONS 8 0<br />
TOTAL FTE 21 13<br />
G-18 Fiscal Year <strong>2010</strong> Annual Budget
<strong>City</strong> Attorney<br />
FY09 FY10<br />
Personnel Current Proposed PG Salary Range<br />
<strong>City</strong> Attorney 1 1 PB1 104,082.00 ‐ 193,296.00<br />
Assistant <strong>City</strong> Attorney 2 2 PB4 62,598.00 ‐ 116,261.00<br />
Labor Attorney 0 1 PB4 62,598.00 ‐ 116,261.00<br />
Legal Assistant 3 3 40 33,508.80 ‐ 51,979.20<br />
TOTAL FULL TIME EMPLOYEES 6 7<br />
TOTAL FTE 6 7<br />
G-19 Fiscal Year <strong>2010</strong> Annual Budget
<strong>City</strong> Manager<br />
G-20 Fiscal Year <strong>2010</strong> Annual Budget
<strong>City</strong> Manager<br />
<strong>City</strong> Manager's Office FY09 FY10<br />
Personnel Current Proposed PG Salary Range<br />
<strong>City</strong> Manager 1 1 PB1 104,082.00 ‐ 193,296.00<br />
Deputy <strong>City</strong> Manager 1 1 PB2 76,885.00 ‐ 142,802.00<br />
Assistant <strong>City</strong> Manager 1 1 PB2 76,885.00 ‐ 142,802.00<br />
Secretary to the <strong>City</strong> Manager 1 1 42 35,172.80 ‐ 54,579.20<br />
Administrative Assistant 1 1 33 28,246.40 ‐43,804.80<br />
TOTAL FULL TIME EMPLOYEES 5 5<br />
Office Associate I 1 1 24 22,692.80 ‐ 35,172.80<br />
TOTAL PART TIME EMPLOYEES 1 1<br />
SUB TOTAL FTE 5.5 5.5<br />
Community Redevelopment Agency FY09 FY10<br />
Personnel Current Proposed PG Salary Range<br />
CRA Manager 0 1 PB5 56,433.00 ‐ 104,809.00<br />
CRA Project Manager 0 2 56 49,504.00 ‐ 76,793.60<br />
TOTAL FULL TIME EMPLOYEES 0 3<br />
SUB TOTAL FTE 0 3<br />
Performance Excellence FY09 FY10<br />
Personnel Current Proposed PG Salary Range<br />
Office <strong>of</strong> Management & Budget Manager 1 1 63 58,718.40 ‐91,083.20<br />
Strategic Planning & Continuous Improvement Manager 1 1 63 58,718.40 ‐91,083.20<br />
PE Coordinator ‐ Performance Measurement 1 1 51 43,804.80 ‐ 67,974.40<br />
PE Coordinator ‐ Process Improvement 1 1 51 43,804.80 ‐ 67,974.40<br />
Office Associate II 1 1 29 25,604.80 ‐ 39,748.80<br />
TOTAL FULL TIME EMPLOYEES 5 5<br />
SUB TOTAL FTE 5 5<br />
Total FTE 10.5 13.5<br />
G-21 Fiscal Year <strong>2010</strong> Annual Budget
Communications<br />
FY09 FY10<br />
Personnel Current Proposed PG Salary Range<br />
Communications Director 1 1 PB3 71,079.00 ‐ 132,011.00<br />
Communications Marketing Manager 1 1 58 51,979.20 ‐ 80,641.60<br />
Cablecast Producer 1 1 49 41,724.80 ‐ 64,729.60<br />
Communications Officer 1 1 49 41,724.80 ‐ 64,729.60<br />
Communications Marketing Associate 1 1 38 31,907.20 ‐ 49,504.00<br />
<strong>City</strong> Hall Receptionist/Switchboard Operator 1 1 22 21,590.40 ‐ 33,508.80<br />
TOTAL FULL TIME EMPLOYEES 6 6<br />
<strong>City</strong> Hall Receptionist/Switchboard Operator 0 1 22 21,590.40 ‐ 33,508.80<br />
TOTAL PART TIME EMPLOYEES 0 1<br />
TOTAL FTE 6 6.5<br />
G-22 Fiscal Year <strong>2010</strong> Annual Budget
Community Development<br />
G-23 Fiscal Year <strong>2010</strong> Annual Budget
Community Development<br />
Planning FY09 FY10<br />
Personnel Current Proposed PG Salary Range<br />
Director <strong>of</strong> Community Development 1 1 PB2 76,885.00 ‐ 142,802.00<br />
Assistant Director <strong>of</strong> Community Development 1 1 PB4 62,598.00 ‐ 116,261.00<br />
Planning Manager 2 2 69 67,974.40 ‐ 105,435.20<br />
Transportation Planner 1 1 63 58,718.40 ‐91,083.20<br />
CRA Coordinator 1 0 56 49,504.00 ‐ 76,793.60<br />
Principal Planner 1 1 58 51,979.20 ‐ 80,641.60<br />
CRA Project Manager 1 0 56 49,504.00 ‐ 76,793.60<br />
Senior Planner 5 5 54 47,132.80 ‐ 73,153.60<br />
Computer Applications Specialist 1 1 54 47,132.80 ‐ 73,153.60<br />
Economic Development Coordinator 1 1 54 47,132.80 ‐ 73,153.60<br />
Property Information Supervisor 1 0 49 41,724.80 ‐ 64,729.60<br />
Permit Center Coordinator 0 1 54 47,132.80 ‐ 73,153.60<br />
Planner 1 1 42 35,172.80 ‐ 54,579.20<br />
GIS Technician I 1 1 44 36,940.80 ‐ 57,304.00<br />
Building Permit Coordinator 1 0 38 31,907.20 ‐ 49,504.00<br />
Property Information Specialist II 1 1 38 31,907.20 ‐ 49,504.00<br />
Administrative Assistant 1 1 33 28,246.40 ‐43,804.80<br />
Property Information Specialist I 1 1 31 26,894.40 ‐ 41,724.80<br />
CRA Program Administrator 1 0 29 25,604.80 ‐ 39,748.80<br />
Office Associate II 1 1 29 25,604.80 ‐ 39,748.80<br />
Office Associate I 1 0 24 22,692.80 ‐ 35,172.80<br />
Office Assistant II 1 1 22 21,590.40 ‐ 33,508.80<br />
TOTAL FULL TIME EMPLOYEES 26 21<br />
SUB‐TOTAL FTE 26 21<br />
Code Enforcement FY09 FY10<br />
Personnel Current Proposed PG Salary Range<br />
Neighborhood Services Manager 1 1 65 61,630.40 ‐ 95,617.60<br />
Code Enforcement Supervisor 1 1 49 41,724.80 ‐ 64,729.60<br />
Code Enforcement Officer 3 3 42 35,172.80 ‐ 54,579.20<br />
Sign Enforcement Officer 1 1 42 35,172.80 ‐ 54,579.20<br />
Office Associate II 2 2 29 25,604.80 ‐ 39,748.80<br />
Office Associate I 1 1 24 22,692.80 ‐ 35,172.80<br />
TOTAL FULL TIME EMPLOYEES 9 9<br />
Office Associate I 1 1 24 22,692.80 ‐ 35,172.80<br />
TOTAL PART TIME EMPLOYEES 1 1<br />
SUB‐TOTAL FTE 9.5 9.5<br />
G-24 Fiscal Year <strong>2010</strong> Annual Budget
Community Development<br />
Affordable Housing<br />
FY09 FY10<br />
Personnel Current Proposed PG Salary Range<br />
Housing Programs Coordinator 1 1 51 43,804.80 ‐ 67,974.40<br />
Housing Rehabilitation Specialist II 2 2 45 37,835.20 ‐ 58,718.40<br />
Code Enforcement Officer 2 2 42 35,172.80 ‐ 54,579.20<br />
Housing Rehabilitation Finance Officer II 2 2 42 35,172.80 ‐ 54,579.20<br />
Planning Assistant 1 1 36 30,388.80 ‐ 47,132.80<br />
Account Clerk II 1 1 26 23,816.00 ‐ 36,940.80<br />
Office Assistant II 1 1 22 21,590.40 ‐ 33,508.80<br />
TOTAL FULL TIME EMPLOYEES 10 10<br />
SUB‐TOTAL FTE 10 10<br />
Building Inspection FY09 FY10<br />
Personnel Current Proposed PG Salary Range<br />
Chief Building Official 1 1 65 61,630.40 ‐ 95,617.60<br />
Deputy Building Official 1 1 60 54,579.20 ‐ 84,656.00<br />
Plans Examiner I 3 2 56 49,504.00 ‐ 76,793.60<br />
Electrical Inspector 2 1 51 43,804.80 ‐ 67,974.40<br />
Mechanical Inspector 2 1 51 43,804.80 ‐ 67,974.40<br />
Plumbing Inspector 2 1 51 43,804.80 ‐ 67,974.40<br />
Building Inspector I 3 3 51 43,804.80 ‐ 67,974.40<br />
Field Services Inspector 1 1 45 37,835.20 ‐ 58,718.40<br />
License Inspector III 1 1 40 33,508.80 ‐ 51,979.20<br />
Building Permit Coordinator 1 0 38 31,907.20 ‐ 49,504.00<br />
License Inspector II 1 1 36 30,388.80 ‐ 47,132.80<br />
License Inspector I 1 1 31 26,894.40 ‐ 41,724.80<br />
Permit Clerk 4 2 31 26,894.40 ‐ 41,724.80<br />
Office Associate II 0 1 29 25,604.80 ‐ 39,748.80<br />
Office Associate I 1 0 24 22,692.80 ‐ 35,172.80<br />
TOTAL FULL TIME EMPLOYEES 24 17<br />
Building Inspector I 1 1 51 43,804.80 ‐ 67,974.40<br />
Electrical Inspector 1 1 51 43,804.80 ‐ 67,974.40<br />
Mechanical Inspector 1 1 51 43,804.80 ‐ 67,974.40<br />
Plumbing Inspector 1 1 51 43,804.80 ‐ 67,974.40<br />
Office Associate II 1 0 29 25,604.80 ‐ 39,748.80<br />
Office Associate I 1 1 24 22,692.80 ‐ 35,172.80<br />
TOTAL PART TIME EMPLOYEES 6 5<br />
SUB‐TOTAL FTE 27 19.5<br />
Community Development TOTAL FTE's 72.5 60<br />
G-25 Fiscal Year <strong>2010</strong> Annual Budget
Electric: General Manager’s Office<br />
Legend<br />
Left number = 2009<br />
Right Number = <strong>2010</strong><br />
G-26 Fiscal Year <strong>2010</strong> Annual Budget
Electric: General Manager’s Office<br />
G-27 Fiscal Year <strong>2010</strong> Annual Budget
Electric: General Manager’s Office<br />
Personnel FY09 FY10<br />
SUMMARY BY DIVISION Current Proposed<br />
General Manager 24 26<br />
Energy Production 244 235<br />
Energy Delivery 218 218<br />
Customer Service 109 103<br />
Technical Support 29 28<br />
TOTAL FULL‐TIME EMPLOYEES 624 610<br />
SUMMARY PART‐TIME / SEASONAL<br />
Customer Service Representative I 1 1<br />
Office Associate I 1 0<br />
College Interns 5 5<br />
Co‐op Students 3 3<br />
DCT/BCE Students 3 3<br />
High School Summer Interns 1 1<br />
Power Academy Interns 0 5<br />
Manager <strong>of</strong> Special Projects 0 1<br />
TOTAL PART‐TIME EMPLOYEES 14 19<br />
CONTRACT LABOR 16 11<br />
GENERAL MANAGER FY09 FY10<br />
Current Proposed PG Salary Range<br />
General Manager 1 1 PB1 104,082.00 ‐ 193,296.00<br />
Deputy General Manager 1 1 PB2 76,885.00 ‐ 142,802.00<br />
Business Operations Mgr II ‐ Corporate 1 1 67 64,729.60 ‐ 100,401.60<br />
Business Operations Manager II 1 1 67 64,729.60 ‐ 100,401.60<br />
Manager <strong>of</strong> Legislative '&' Regulatory Relations 1 1 63 58,718.40 ‐91,083.20<br />
Manager <strong>of</strong> Corporate Performance 1 1 62 57,304.00 ‐ 88,899.20<br />
Executive Assistant 1 1 48 40,726.40 ‐ 63,190.40<br />
Administrative Assistant 2 2 33 28,246.40 ‐43,804.80<br />
TOTAL FULL TIME EMPLOYEES 9 9<br />
G-28 Fiscal Year <strong>2010</strong> Annual Budget
Electric: General Manager’s Office<br />
FY09 FY10<br />
General Manager/Pricing & Rates Current Proposed<br />
Manager <strong>of</strong> Pricing and Rates 1 1 71 71,364.80 ‐ 110,697.60<br />
Engineer III ‐ <strong>Lakeland</strong> Electric 1 1 69 67,974.40 ‐ 105,435.20<br />
Electric Utility Analyst 1 1 54 47,132.80 ‐ 73,153.60<br />
Data Analyst II 1 1 42 35,172.80 ‐ 54,579.20<br />
TOTAL FULL TIME EMPLOYEES 4 4<br />
FY09 FY10<br />
General Manager / Electric System Compliance Current Proposed<br />
Manager <strong>of</strong> Electric System Compliance 1 1 78 84,656.00 ‐ 131,352.00<br />
Administrative Assistant 1 1 33 28,246.40 ‐43,804.80<br />
TOTAL FULL TIME EMPLOYEES 2 2<br />
FY09 FY10<br />
Current Proposed<br />
Manager <strong>of</strong> Special Projects 0 1 78 84,656.00 ‐ 131,352.00<br />
TOTAL PART‐TIME EMPLOYEES 0 1<br />
FY09 FY10<br />
General Manager / Training and Workforce Development Current Proposed<br />
Director <strong>of</strong> Training and Workforce Development 1 1 69 67,974.40 ‐ 105,435.20<br />
Senior Lineman Trainer 1 1 58 51,979.20 ‐ 80,641.60<br />
Safety and Training Specialist 1 1 58 51,979.20 ‐ 80,641.60<br />
Lineman Trainer 1 1 56 48297.60 ‐ 73,091.20<br />
Training Specialist 3 3 54 47,132.80 ‐ 73,153.60<br />
Employee Programs Specialist 1 1 36 30,388.80 ‐ 47,132.80<br />
Utility Worker 2 29 25,604.80 ‐ 39,748.80<br />
Office Associate II 1 1 29 25,604.80 ‐ 39,748.80<br />
TOTAL FULL TIME EMPLOYEES 9 11<br />
GM Sub‐total 24 26<br />
G-29 Fiscal Year <strong>2010</strong> Annual Budget
Electric: Customer Service<br />
G-30 Fiscal Year <strong>2010</strong> Annual Budget
Electric: Customer Service<br />
G-31 Fiscal Year <strong>2010</strong> Annual Budget
Electric: Customer Service<br />
G-32 Fiscal Year <strong>2010</strong> Annual Budget
Electric: Customer Service<br />
CUSTOMER SERVICE DIVISION<br />
FY09 FY10<br />
Current Proposed<br />
Assistant GM ‐ Customer Service 1 1 PB3 71,079.00 ‐ 132,011.00<br />
Computer Applications Specialist 2 2 54 47,132.80 ‐ 73,153.60<br />
3 3<br />
Customer Service/Energy & Business Services<br />
Manager <strong>of</strong> Energy & Business Services 1 1 69 67,974.40 ‐ 105,435.20<br />
Senior Account Executive 1 1 54 47,132.80 ‐ 73,153.60<br />
Account Executive 2 2 49 41,724.80 ‐ 64,729.60<br />
Energy Analyst II 3 3 45 37,835.20 ‐ 58,718.40<br />
Office Associate II 0 0 29 25,604.80 ‐ 39,748.80<br />
Customer Service Representative II 2 2 29 25,604.80 ‐ 39,748.80<br />
9 9<br />
Customer Service/Call Center FY09 FY10<br />
Current Proposed<br />
Call Center Manager 1 1 58 51,979.20 ‐ 80,641.60<br />
Customer Service Trainer 1 1 54 47,132.80 ‐ 73,153.60<br />
Customer Service Team Leader 4 4 38 31,907.20 ‐ 49,504.00<br />
Customer Service Representative II 30 26 29 25,604.80 ‐ 39,748.80<br />
36 32<br />
Customer Service/Field Services FY09 FY10<br />
Current Proposed<br />
Manager <strong>of</strong> Field Services 1 1 58 51,979.20 ‐ 80,641.60<br />
Field Service Supervisor 1 1 47 39,748.80 ‐ 61,630.40<br />
Energy Diversion Investigator 2 2 40 32,697.60 ‐ 49,483.20<br />
Field Services Coordinator 1 1 40 33,508.80 ‐ 51,979.20<br />
Meter Service Worker 12 12 38 31,137.60 ‐ 47,112.00<br />
Meter Reading Coordinator 2 2 38 31,907.20 ‐ 49,504.00<br />
Meter Reader 20 18 29 24,980.80 ‐ 37,835.20<br />
Customer Service Representative II 2 2 29 25,604.80 ‐ 39,748.80<br />
Customer Service Representative I 0 0 24 22,692.80 ‐ 35,172.80<br />
41 39<br />
Customer Service/Billing and Collections FY09 FY10<br />
Current Proposed<br />
Revenue Manager 1 1 60 54,579.20 ‐ 84,656.00<br />
Customer Service Team Leader 2 2 38 31,907.20 ‐ 49,504.00<br />
Account Clerk IV 1 1 33 28,246.40 ‐43,804.80<br />
Customer Service Representative II 16 16 29 25,604.80 ‐ 39,748.80<br />
20 20<br />
CS Subtotal 109 103<br />
G-33 Fiscal Year <strong>2010</strong> Annual Budget
Electric: Delivery<br />
G-34 Fiscal Year <strong>2010</strong> Annual Budget
Electric: Delivery<br />
G-35 Fiscal Year <strong>2010</strong> Annual Budget
Electric: Delivery<br />
<strong>Lakeland</strong> Electric<br />
ED Right <strong>of</strong> Way<br />
FY10 Proposed<br />
Budgeted FTE’s<br />
2/2<br />
AGM / Delivery<br />
PB 2<br />
1/1<br />
Legend<br />
Left number = 2009<br />
Right Number = <strong>2010</strong><br />
Utilities Right <strong>of</strong> Way Officer<br />
PG 58<br />
1/1<br />
Right <strong>of</strong> Way Liaison Specialist<br />
PG 51<br />
1/1<br />
G-36 Fiscal Year <strong>2010</strong> Annual Budget
Electric: Delivery<br />
G-37 Fiscal Year <strong>2010</strong> Annual Budget
Electric: Delivery<br />
ENERGY DELIVERY DIVISION<br />
Delivery AGM / Right‐<strong>of</strong>‐Way (17ED1) FY09 FY10<br />
Current Proposed<br />
Assistant GM ‐ Delivery 1 1 PB2 76,885.00 ‐ 142,802.00<br />
Utilities Right‐Of‐Way Officer 1 1 58 51,979.20 ‐ 80,641.60<br />
Right <strong>of</strong> Way Liaison Specialist 1 1 51 43,804.80 ‐ 67,974.40<br />
3 3<br />
Delivery Operations (17ED3) FY09 FY10<br />
Current Proposed<br />
Energy Delivery Operations Manager 1 1 71 71,364.80 ‐ 110,697.60<br />
System Operations Engineer 1 1 71 71,364.80 ‐ 110,697.60<br />
T&D Supervisor 6 6 65 61,630.40 ‐ 95,617.60<br />
Utilities Resource Coordinator 1 1 60 54,579.20 ‐ 84,656.00<br />
Electrician Foreman 1 1 58 50,710.40 ‐76,752.00<br />
Lead Transmission/Distribution Lineperson 12 12 58 50,710.40 ‐76,752.00<br />
Electrician 1st Class 2 2 54 45,988.80 ‐ 69,617.60<br />
Lineman 1st Class 61 60 54 45,988.80 ‐ 69,617.60<br />
Lineman 1st Class 31* 30* 54 45,988.80 ‐ 69,617.60<br />
Lineman Apprentice 30* 30* 40 32,697.60 ‐ 49,483.20<br />
Planning Specialist I 1 1 54 47,132.80 ‐ 73,153.60<br />
Line Clearance Coordinator 2 2 51 43,804.80 ‐ 67,974.40<br />
Utility Line Inspector 2 2 42 34,320.00 ‐ 51,958.40<br />
Special Equipment Operator 2 2 40 32,697.60 ‐ 49,483.20<br />
Materials Reclaimer II 1 1 36 29,640.00 ‐ 44,865.60<br />
Traffic Control Foreman 1 1 31 26,228.80 ‐ 39,728.00<br />
Materials Reclaimer I 1 1 29 24,980.80 ‐ 37,835.20<br />
Traffic Control Technician 1 1 22 21,590.40 ‐ 33,508.80<br />
96 95<br />
Delivery/ EMS / System Control / Reliability (17ED4) FY09 FY10<br />
Current Proposed<br />
Manager <strong>of</strong> Electric System Control 1 1 74 76,793.60 ‐ 119,142.40<br />
Energy Management System Supervisor 1 1 71 71,364.80 ‐ 110,697.60<br />
Lead Electric System Operator 2 2 63 58,718.40 ‐91,083.20<br />
Supervisor <strong>of</strong> Troubleman 1 1 63 58,718.40 ‐91,083.20<br />
Chief Energy Managment System Tech 1 1 60 54,579.20 ‐ 84,656.00<br />
Electric System Operator 12 12 60 54,579.20 ‐ 84,656.00<br />
Energy Management System Analyst 1 1 60 54,579.20 ‐ 84,656.00<br />
Troubleman 7 7 56 48297.60 ‐ 73,091.20<br />
Planning Specialist I 1 1 54 47,132.80 ‐ 73,153.60<br />
SCADA/EMS Technician 2 2 54 45,988.80 ‐ 69,617.60<br />
29 29<br />
G-38 Fiscal Year <strong>2010</strong> Annual Budget
Electric: Delivery<br />
Delivery Engineering (17ED5) FY09 FY10<br />
Current Proposed<br />
Energy Delivery Engineering Manager 1 1 78 84,656.00 ‐ 131,352.00<br />
Engineering Supervisor 1 1 74 76,793.60 ‐ 119,142.40<br />
New Development Engineering (NDE) Supervisor 1 1 71 71,364.80 ‐ 110,697.60<br />
Pr<strong>of</strong>essional Engineer ‐ <strong>Lakeland</strong> Electric 3 2 71 71,364.80 ‐ 110,697.60<br />
Engineer III ‐ <strong>Lakeland</strong> Electric 4 4 69 67,974.40 ‐ 105,435.20<br />
Engineer II ‐ <strong>Lakeland</strong> Electric 1 1 65 61,630.40 ‐ 95,617.60<br />
Maintenance and Services Engineering Supervisor 1 1 64 60,174.40 ‐ 93,329.60<br />
Engineer I ‐ <strong>Lakeland</strong> Electric 1 1 58 51,979.20 ‐ 80,641.60<br />
Engineering Technician IV ‐ <strong>Lakeland</strong> Electric 10 10 58 51,979.20 ‐ 80,641.60<br />
Engineering Technician IV ‐ <strong>Lakeland</strong> Electric 1* 1* 58 51,979.20 ‐ 80,641.60<br />
Engineering Technician III ‐ LE 8 8 54 47,132.80 ‐ 73,153.60<br />
Power Quality Specialist 1 1 54 47,132.80 ‐ 73,153.60<br />
Engineering Technician II ‐ <strong>Lakeland</strong> Electric 1 1 47 39,748.80 ‐ 61,630.40<br />
Engineering Technician I ‐ <strong>Lakeland</strong> Electric 0 0 40 33,508.80 ‐ 51,979.20<br />
Office Associate II 1 1 29 25,604.80 ‐ 39,748.80<br />
34 33<br />
Delivery Substation Operations (17ED6) FY09 FY10<br />
Current Proposed<br />
Manager <strong>of</strong> Substation Operations 1 1 78 84,656.00 ‐ 131,352.00<br />
Engineering Supervisor 1 1 74 76,793.60 ‐ 119,142.40<br />
Pr<strong>of</strong>essional Engineer ‐ <strong>Lakeland</strong> Electric 1 1 71 71,364.80 ‐ 110,697.60<br />
Engineer III ‐ <strong>Lakeland</strong> Electric 2 2 69 67,974.40 ‐ 105,435.20<br />
T&D Supervisor 1 1 65 61,630.40 ‐ 95,617.60<br />
Engineering Technician IV ‐ <strong>Lakeland</strong> Electric 1 1 58 51,979.20 ‐ 80,641.60<br />
Utilities Resource Coordinator 1 1 60 54,579.20 ‐ 84,656.00<br />
Electrician Foreman 2 2 58 50,710.40 ‐76,752.00<br />
Apparatus Repairer Foreman 1 1 56 48297.60 ‐ 73,091.20<br />
Electrician 1st Class 7 7 54 45,988.80 ‐ 69,617.60<br />
Apparatus Repairer 1st Class 4 4 47 38,771.20 ‐ 58,697.60<br />
Electrician Apprentice 4 5 45 36,920.00 ‐ 55,910.40<br />
Industrial Coatings Specialist 2 2 33 27,560.00 ‐ 41,724.80<br />
Operations Support Technician II 2 2 29 25,604.80 ‐ 39,748.80<br />
30 31<br />
Delivery/System Protection (17ED7) FY09 FY10<br />
Current Proposed<br />
Manager <strong>of</strong> System Protection 1 1 78 84,656.00 ‐ 131,352.00<br />
Chief Protective Relay Technician 1 1 66 63,190.40 ‐ 98,009.60<br />
Engineer II ‐ <strong>Lakeland</strong> Electric 1 1 65 61,630.40 ‐ 95,617.60<br />
Chief Meter Technician 1 1 60 54,579.20 ‐ 84,656.00<br />
Meter Technician III 5 5 54 47,132.80 ‐ 73,153.60<br />
Meter Technician III 1* 0 54 47,132.80 ‐ 73,153.60<br />
Protective Relay Technician 3 3 54 45,988.80 ‐ 69,617.60<br />
Meter Technician II 2 2 47 38,771.20 ‐ 58,697.60<br />
Electronics/Relay Apprentice 1 1 45 36,920.00 ‐ 55,910.40<br />
Account Clerk III 1 1 29 25,604.80 ‐ 39,748.80<br />
16 16<br />
Delivery Business Operations (17ED9) FY09 FY10<br />
Current Proposed<br />
Business Operations Manager II 1 1 67 64,729.60 ‐ 100,401.60<br />
Business Analyst 1 1 54 47,132.80 ‐ 73,153.60<br />
Computer Applications Specialist 2 2 54 47,132.80 ‐ 73,153.60<br />
Materials Planner 1 1 47 39,748.80 ‐ 61,630.40<br />
Inventory Control Specialist 0 1 42 35,172.80 ‐ 54,579.20<br />
IT Support Specialist I 1 1 40 33,508.80 ‐ 51,979.20<br />
Account Clerk IV 1 1 33 28,246.40 ‐43,804.80<br />
Account Clerk III 1 1 29 25,604.80 ‐ 39,748.80<br />
Office Associate II 2 2 29 25,604.80 ‐ 39,748.80<br />
10 11<br />
ED Sub‐total 218 218<br />
G-39 Fiscal Year <strong>2010</strong> Annual Budget
Electric: Production<br />
G-40 Fiscal Year <strong>2010</strong> Annual Budget
Electric: Production<br />
Legend<br />
Left number = 2009<br />
Right Number = <strong>2010</strong><br />
G-41 Fiscal Year <strong>2010</strong> Annual Budget
Electric: Production<br />
Legend<br />
Left number = 2009<br />
Right Number = <strong>2010</strong><br />
Legend<br />
Left number = 2009<br />
Right Number = <strong>2010</strong><br />
G-42 Fiscal Year <strong>2010</strong> Annual Budget
Electric: Production<br />
Legend<br />
Left number = 2009<br />
Right Number = <strong>2010</strong><br />
Legend<br />
Left number = 2009<br />
Right Number = <strong>2010</strong><br />
G-43 Fiscal Year <strong>2010</strong> Annual Budget
Electric: Production<br />
Legend<br />
Left number = 2009<br />
Right Number = <strong>2010</strong><br />
Legend<br />
Left number = 2009<br />
Right Number = <strong>2010</strong><br />
G-44 Fiscal Year <strong>2010</strong> Annual Budget
Electric: Production<br />
ENERGY PRODUCTION DIVISION FY09 FY10<br />
Current Proposed<br />
Assistant GM ‐ Production 1 1 PB2 76,885.00 ‐ 142,802.00<br />
Energy Production/Production<br />
Administration<br />
Plant Manager 1 1 78 84,656.00 ‐ 131,352.00<br />
EP Qualification Program Supervisor 1 1 65 61,630.40 ‐ 95,617.60<br />
Project Safety Management (PSM) Administrator 1 1 54 47,132.80 ‐ 73,153.60<br />
Administrative Assistant 1 1 33 28,246.40 ‐43,804.80<br />
Operations Section<br />
Superintendent <strong>of</strong> Power Production 1 1 71 71,364.80 ‐ 110,697.60<br />
Power Production Supervisor 8 7 65 61,630.40 ‐ 95,617.60<br />
Power Production Foreman 5 5 58 51,979.20 ‐ 80,641.60<br />
Multicraft Operator 27 28 56 48297.60 ‐ 73,091.20<br />
Control Center Operator 10 7 54 45,988.80 ‐ 69,617.60<br />
Multicraft Operator Apprentice III 4 8 47 38,771.20 ‐ 58,697.60<br />
Power Plant Operator III 13 13 47 38,771.20 ‐ 58,697.60<br />
Power Plant Operator II 9 4 42 34,320.00 ‐ 51,958.40<br />
Maintenance Manager 1 1 71 71,364.80 ‐ 110,697.60<br />
Power Production Supervisor 2 2 65 61,630.40 ‐ 95,617.60<br />
Maintenance Support Supervisor 1 1 47 39,748.80 ‐ 61,630.40<br />
Operations Support Tech II ‐ LE 1 1 29 24,980.80 ‐ 37,835.20<br />
Operations Support Tech I ‐ LE 1 1 24 22,131.20 ‐ 33,488.00<br />
Office Associate I 1 1 24 22,692.80 ‐ 35,172.80<br />
Power Production Foreman 2 2 58 51,979.20 ‐ 80,641.60<br />
Plant Mechanic II 15 13 53 45,988.80 ‐ 71,364.80<br />
Plant Mechanic I 1 1 49 40,705.60 ‐ 61,651.20<br />
Power Production Foreman 3 3 58 51,979.20 ‐ 80,641.60<br />
Instrument And Control Specialist 1 1 54 45,988.80 ‐ 69,617.60<br />
Station Electrician 11 10 54 45,988.80 ‐ 69,617.60<br />
Instrument And Control Technician II 13 12 51 42,744.00 ‐ 64,729.60<br />
Power Production Foreman 1 1 58 51,979.20 ‐ 80,641.60<br />
Plant Welder 9 9 53 44,865.60 ‐ 67,953.60<br />
Industrial Coatings Foreman 1 1 38 31,907.20 ‐ 49,504.00<br />
Power Production Projects Coor 1 1 65 61,630.40 ‐ 95,617.60<br />
Utilities Resource Coordinator 1 1 60 54,579.20 ‐ 84,656.00<br />
Maintenance Coordinator 8 8 51 42,744.00 ‐ 64,729.60<br />
Materials Planner 1 1 47 39,748.80 ‐ 61,630.40<br />
Office Associate I 1 0 24 22,692.80 ‐ 35,172.80<br />
G-45 Fiscal Year <strong>2010</strong> Annual Budget
Electric: Production<br />
Fire Protection Section<br />
Protective Equipment Specialist II 2 2 54 45,988.80 ‐ 69,617.60<br />
Superintendent <strong>of</strong> Stores & Security 1 1 54 47,132.80 ‐ 73,153.60<br />
Inventory Control Specialist 1 1 42 35,172.80 ‐ 54,579.20<br />
Warehouse Operations Technician II 5 5 33 28,246.40 ‐43,804.80<br />
Warehouse Op Tech I ‐ LE 2 2 31 26,228.80 ‐ 39,728.00<br />
Chemical Process Control 0 0 #N/A #N/A<br />
Supervisor <strong>of</strong> Chemical Process Control 1 1 73 74,921.60 ‐ 116,230.40<br />
Power Production Foreman 3 3 58 51,979.20 ‐ 80,641.60<br />
Power Plant Operator III 15 15 47 38,771.20 ‐ 58,697.60<br />
Power Plant Operator II 1 1 42 34,320.00 ‐ 51,958.40<br />
Power Plant Operator I 0 2 38 31,137.60 ‐ 47,112.00<br />
Power Production Foreman 1 1 58 51,979.20 ‐ 80,641.60<br />
Power Plant Operator III 4 4 47 38,771.20 ‐ 58,697.60<br />
Production Subtotal 193 186<br />
Energy Production/Business Operations FY09 FY10<br />
Current Proposed<br />
Business Operations Manager III 1 1 71 71,364.80 ‐ 110,697.60<br />
Energy Resource Specialist 0 1 63 58,718.40 ‐91,083.20<br />
Business Analyst II 1 1 58 51,979.20 ‐ 80,641.60<br />
Computer Applications Specialist 1 1 54 47,132.80 ‐ 73,153.60<br />
Electric Utility Analyst 1 1 54 47,132.80 ‐ 73,153.60<br />
Account Clerk IV 3 3 33 28,246.40 ‐43,804.80<br />
Office Associate I 2 2 24 22,692.80 ‐ 35,172.80<br />
Business Operations Subtotal 9 10<br />
Energy Production/Engineering FY09 FY10<br />
Current Proposed<br />
Energy Production Engineering Manager 1 1 78 84,656.00 ‐ 131,352.00<br />
Supervisor <strong>of</strong> WFM/Projects 1 1 69 67,974.40 ‐ 105,435.20<br />
Engineer IV ‐ <strong>Lakeland</strong> Electric 2 1 71 71,364.80 ‐ 110,697.60<br />
Engineer III ‐ <strong>Lakeland</strong> Electric 2 3 69 67,974.40 ‐ 105,435.20<br />
Engineering Supervisor 1 1 74 76,793.60 ‐ 119,142.40<br />
Engineer IV ‐ <strong>Lakeland</strong> Electric 0 1 71 71,364.80 ‐ 110,697.60<br />
Engineer III ‐ <strong>Lakeland</strong> Electric 1 0 69 67,974.40 ‐ 105,435.20<br />
Engineering Technician IV ‐ <strong>Lakeland</strong> Electric 1 2 58 51,979.20 ‐ 80,641.60<br />
Instrument And Control Specialist 2 2 54 45,988.80 ‐ 69,617.60<br />
Engineering Technician IV ‐ <strong>Lakeland</strong> Electric 2 1 58 51,979.20 ‐ 80,641.60<br />
Engineering Technician II ‐ <strong>Lakeland</strong> Electric 1 1 47 39,748.80 ‐ 61,630.40<br />
Engineer IV ‐ <strong>Lakeland</strong> Electric 1 1 71 71,364.80 ‐ 110,697.60<br />
Multicraft Operator 1 2 56 48297.60 ‐ 73,091.20<br />
Engineering Technician III ‐ LE 1 1 54 47,132.80 ‐ 73,153.60<br />
Environmental Group<br />
Regulatory Programs Coordinator 1 1 54 47,132.80 ‐ 73,153.60<br />
Engineering Technician IV ‐ <strong>Lakeland</strong> Electric 1 1 58 51,979.20 ‐ 80,641.60<br />
Work Force Management<br />
Engineering Construction Supervisor 1 1 65 61,630.40 ‐ 95,617.60<br />
Power Production Foreman 2 1 58 51,979.20 ‐ 80,641.60<br />
Engineering Subtotal 22 22<br />
G-46 Fiscal Year <strong>2010</strong> Annual Budget
Electric: Production<br />
Energy Production/Special Projects FY09 FY10<br />
Current Proposed<br />
Manager <strong>of</strong> Special Projects 1 1 78 84,656.00 ‐ 131,352.00<br />
Engineer IV ‐ <strong>Lakeland</strong> Electric 2 1 71 71,364.80 ‐ 110,697.60<br />
Engineer III ‐ <strong>Lakeland</strong> Electric 2 2 69 67,974.40 ‐ 105,435.20<br />
Special Projects Sub‐total 5 4<br />
Energy Production/Fuels FY09 FY10<br />
Current Proposed<br />
Manager <strong>of</strong> Fuels 2 1 76 80,641.60 ‐ 125,112.00<br />
Fuels Coordinator 2 2 60 54,579.20 ‐ 84,656.00<br />
Power Production Foreman 1 0 58 51,979.20 ‐ 80,641.60<br />
Power Production Supervisor 1 1 65 61,630.40 ‐ 95,617.60<br />
Power Production Foreman 1 1 58 51,979.20 ‐ 80,641.60<br />
Power Plant Operator III 5 5 47 38,771.20 ‐ 58,697.60<br />
Power Plant Operator II 0 0 42 34,320.00 ‐ 51,958.40<br />
Power Plant Operator I 0 1 38 31,137.60 ‐ 47,112.00<br />
Operations Support Technician III 1 0 33 28,246.40 ‐43,804.80<br />
Statistician 1 1 33 28,246.40 ‐43,804.80<br />
Fuels Sub‐total 14 12<br />
EP Subtotal 244 235<br />
G-47 Fiscal Year <strong>2010</strong> Annual Budget
Electric: Technical Support<br />
G-48 Fiscal Year <strong>2010</strong> Annual Budget
Electric: Technical Support<br />
G-49 Fiscal Year <strong>2010</strong> Annual Budget
Electric: Technical Support<br />
<strong>Lakeland</strong> Electric<br />
TS AGM<br />
FY ’10<br />
Budgeted FTE’s 3<br />
AGM / Technical Support<br />
PB3<br />
1/1<br />
Legend<br />
Left number = 2009<br />
Right Number = <strong>2010</strong><br />
Power Pool Coordinator<br />
PG 67<br />
1/1<br />
Administrative Assistant<br />
PG 33<br />
1/1<br />
G-50 Fiscal Year <strong>2010</strong> Annual Budget
Electric: Technical Support<br />
TECHNICAL SUPPORT DIVISION FY09 FY10<br />
Current Proposed<br />
Associate GM ‐ Tech Support 1 1 PB3 71,079.00 ‐ 132,011.00<br />
Power Pool Coordinator 1 1 67 64,729.60 ‐ 100,401.60<br />
Administrative Assistant 1 1 33 28,246.40 ‐43,804.80<br />
3 3<br />
Technical Support/System Planning FY09 FY10<br />
Current Proposed<br />
Manager <strong>of</strong> System Planning 2 1 78 84,656.00 ‐ 131,352.00<br />
Engineer IV ‐ <strong>Lakeland</strong> Electric 0 1 71 71,364.80 ‐ 110,697.60<br />
Engineer III ‐ <strong>Lakeland</strong> Electric 2 1 69 67,974.40 ‐ 105,435.20<br />
Engineer II ‐ <strong>Lakeland</strong> Electric 1 1 65 61,630.40 ‐ 95,617.60<br />
Energy Resource Specialist 1 1 63 58,718.40 ‐91,083.20<br />
Planning Specialist III 2 2 63 58,718.40 ‐91,083.20<br />
Engineer I ‐ <strong>Lakeland</strong> Electric 1 1 58 51,979.20 ‐ 80,641.60<br />
Data Analyst II 1 1 42 35,172.80 ‐ 54,579.20<br />
10 9<br />
Technical Support/Contract Services FY09 FY10<br />
Current Proposed<br />
Contracts Manager 1 0 67 64,729.60 ‐ 100,401.60<br />
Contracts Coordinator Supv 0 1 60 54,579.20 ‐ 84,656.00<br />
Supervisor <strong>of</strong> Administrative Services 1 1 47 39,748.80 ‐ 61,630.40<br />
Contracts Analyst 1 1 33 28,246.40 ‐43,804.80<br />
Account Clerk III 3 3 29 25,604.80 ‐ 39,748.80<br />
Mail Clerk II 1 1 29 25,604.80 ‐ 39,748.80<br />
Mail Clerk I 1 1 24 22,692.80 ‐ 35,172.80<br />
Office Associate I 1 2 24 22,692.80 ‐ 35,172.80<br />
Account Clerk I 2 1 24 22,692.80 ‐ 35,172.80<br />
11 11<br />
Technical Support/Environmental Affairs FY09 FY10<br />
Current Proposed<br />
Manager <strong>of</strong> Environmental Affairs 1 1 76 80,641.60 ‐ 125,112.00<br />
Environmental Coordinator 1 1 71 71,364.80 ‐ 110,697.60<br />
Engineer III ‐ <strong>Lakeland</strong> Electric 1 1 69 67,974.40 ‐ 105,435.20<br />
Engineer II ‐ <strong>Lakeland</strong> Electric 0 0 65 61,630.40 ‐ 95,617.60<br />
Alternative Energy Coordinator 1 1 51 43,804.80 ‐ 67,974.40<br />
Office Associate II 1 1 29 25,604.80 ‐ 39,748.80<br />
5 5<br />
TS Subtotal 29 28<br />
Part Time<br />
Part Time/Seasonal:<br />
Office Associate I 1 0 24 22,692.80 ‐ 35,172.80<br />
1 0<br />
G-51 Fiscal Year <strong>2010</strong> Annual Budget
Human Resources - Civil Service<br />
FY09 FY10<br />
Personnel Current Proposed PG Salary Range<br />
Civil Service Director 1 1 PB3 71,079.00 ‐ 132,011.00<br />
Computer Applications Specialist 1 1 54 47,132.80 ‐ 73,153.60<br />
HR Specialist 2 2 54 47,132.80 ‐ 73,153.60<br />
HR Generalist 2 2 49 41,724.80 ‐ 64,729.60<br />
HR Assistant 2 2 40 33,508.80 ‐ 51,979.20<br />
Administrative Assistant 1 1 33 28,246.40 ‐43,804.80<br />
Office Associate I 1 1 24 22,692.80 ‐ 35,172.80<br />
TOTAL FULL TIME EMPLOYEES 10 10<br />
Office Associate I 1 1 24 22,692.80 ‐ 35,172.80<br />
Office Assistant I 1 1 19 20,072.00 ‐ 31,137.60<br />
TOTAL PART TIME EMPLOYEES 2 2<br />
TOTAL FTE 11 11<br />
G-52 Fiscal Year <strong>2010</strong> Annual Budget
Human Resources - Employee Relations<br />
FY09 FY10<br />
Personnel Current Proposed PG Salary Range<br />
Director <strong>of</strong> Workforce Development & Labor Relations 1 PB3 71,079.00 ‐ 132,011.00<br />
Policy and Labor Relations Manager 1 1 64 60,174.40 ‐ 93,329.60<br />
Manager <strong>of</strong> Employee Engagement & Retention 1 1 64 60,174.40 ‐ 93,329.60<br />
HR Specialist 3 4 54 47,132.80 ‐ 73,153.60<br />
HR Generalist 2 2 49 41,724.80 ‐ 64,729.60<br />
HR Assistant 2 2 40 33,508.80 ‐ 51,979.20<br />
Administrative Assistant 1 1 33 28,246.40 ‐43,804.80<br />
Office Associate I 2 2 24 22,692.80 ‐ 35,172.80<br />
TOTAL FULL TIME EMPLOYEES 13 13<br />
Personnel Assistant 1 1 36 30,388.80 ‐ 47,132.80<br />
TOTAL PART TIME EMPLOYEES 1 1<br />
TOTAL FTE 13.5 13.5<br />
G-53 Fiscal Year <strong>2010</strong> Annual Budget
Finance<br />
G-54 Fiscal Year <strong>2010</strong> Annual Budget
Finance<br />
Central Accounting FY09 FY10<br />
Personnel Current Proposed PG Salary Range<br />
Finance Director 1 1 PB2 76,885.00 ‐ 142,802.00<br />
Assistant Finance Director ‐ General 1 1 PB4 62,598.00 ‐ 116,261.00<br />
Payroll/HRMS Manager 1 1 67 64,729.60 ‐ 100,401.60<br />
Treasury Manager 1 1 71 71,364.80 ‐ 110,697.60<br />
Accounts Payable Manager 0 1 63 58,718.40 ‐91,083.20<br />
Chief Accountant 3 2 63 58,718.40 ‐91,083.20<br />
Payroll Manager 1 1 60 54,579.20 ‐ 84,656.00<br />
Accountant III 1 1 58 51,979.20 ‐ 80,641.60<br />
Computer Applications Specialist 2 1 54 47,132.80 ‐ 73,153.60<br />
Accountant II 2 2 51 43,804.80 ‐ 67,974.40<br />
Accountant I 1 0 47 39,748.80 ‐ 61,630.40<br />
Payroll Specialist 3 3 40 33,508.80 ‐ 51,979.20<br />
Investment Management Assistant 1 1 38 31,907.20 ‐ 49,504.00<br />
Accounts Payable Supervisor 0 1 38 31,907.20 ‐ 49,504.00<br />
Account Clerk IV 3 2 33 28,246.40 ‐43,804.80<br />
Account Clerk III 0 2 29 25,604.80 ‐ 39,748.80<br />
Account Clerk II 1 0 26 23,816.00 ‐ 36,940.80<br />
Account Clerk I 1 0 24 22,692.80 ‐ 35,172.80<br />
TOTAL FULL TIME EMPLOYEES 23 21<br />
Computer Applications Specialist 0 1 54 47,132.80 ‐ 73,153.60<br />
TOTAL PART TIME EMPLOYEES 0 1<br />
TOTAL FTE 23 21.5<br />
<strong>City</strong> Clerk FY09 FY10<br />
Personnel Current Proposed PG Salary Range<br />
<strong>City</strong> Clerk 1 1 51 43,804.80 ‐ 67,974.40<br />
Deputy <strong>City</strong> Clerk 1 1 38 31,907.20 ‐ 49,504.00<br />
Records Supervisor 1 1 38 31,907.20 ‐ 49,504.00<br />
Warehouse Operations Technician I 1 1 31 26,894.40 ‐ 41,724.80<br />
Office Associate II 1 1 29 25,604.80 ‐ 39,748.80<br />
TOTAL FULL TIME EMPLOYEES 5 5<br />
TOTAL FTE 5 5<br />
G-55 Fiscal Year <strong>2010</strong> Annual Budget
Finance<br />
Treasurer FY09 FY10<br />
Personnel Current Proposed PG Salary Range<br />
<strong>City</strong> Treasurer 1 1 63 58,718.40 ‐91,083.20<br />
Office Manager 2 2 38 31,907.20 ‐ 49,504.00<br />
Account Clerk III 2 2 29 25,604.80 ‐ 39,748.80<br />
Account Clerk II 2 2 26 23,816.00 ‐ 36,940.80<br />
TOTAL FULL TIME EMPLOYEES 7 7<br />
Cashier I 1 1 19 20,072.00 ‐ 31,137.60<br />
TOTAL PART TIME EMPLOYEES 1 1<br />
TOTAL FTE 7.5 7.5<br />
Electric Utility Finance FY09 FY10<br />
Personnel Current Proposed PG Salary Range<br />
Assistant Finance Director ‐ LE 1 1 PB4 62,598.00 ‐ 116,261.00<br />
Utilities Accounting and Finance Supervisor 1 1 67 64,729.60 ‐ 100,401.60<br />
Chief Accountant 1 1 63 58,718.40 ‐91,083.20<br />
Accountant III 4 4 58 51,979.20 ‐ 80,641.60<br />
Account Clerk IV 2 2 33 28,246.40 ‐43,804.80<br />
Account Clerk III 2 1 29 25,604.80 ‐ 39,748.80<br />
Account Clerk II 0 1 26 23,816.00 ‐ 36,940.80<br />
TOTAL FULL TIME EMPLOYEES 11 11<br />
Account Clerk I 1 0 24 22,692.80 ‐ 35,172.80<br />
Account Clerk II 1 0 26 23,816.00 ‐ 36,940.80<br />
TOTAL PART TIME EMPLOYEES 2 0<br />
TOTAL FTE 12 11<br />
Customer Billing FY09 FY10<br />
Personnel Current Proposed PG Salary Range<br />
Finance Customer Billing Manager 1 1 65 61,630.40 ‐ 95,617.60<br />
Assistant Finance Manager <strong>of</strong> Customer Billing 1 1 56 49,504.00 ‐ 76,793.60<br />
Office Manager 1 1 38 31,907.20 ‐ 49,504.00<br />
Account Clerk IV 1 1 33 28,246.40 ‐43,804.80<br />
Account Clerk III 6 5 29 25,604.80 ‐ 39,748.80<br />
Office Associate II 1 1 29 25,604.80 ‐ 39,748.80<br />
TOTAL FULL TIME EMPLOYEES 11 10<br />
Account Clerk III 0 1 29 25,604.80 ‐ 39,748.80<br />
TOTAL PART TIME EMPLOYEES 0 1<br />
TOTAL FTE 11 10.5<br />
Finance Total FTE's: 58.5 55.5<br />
G-56 Fiscal Year <strong>2010</strong> Annual Budget
Fire<br />
G-57 Fiscal Year <strong>2010</strong> Annual Budget
Fire<br />
FY09 FY10<br />
Personnel Current Proposed PG Salary Range<br />
Fire Chief 1 1 PB3 71,079.00 ‐ 132,011.00<br />
Assistant Fire Chief 2 2 PB5 56,433.00 ‐ 104,809.00<br />
Fire Marshall 1 1 63 58,718.40 ‐91,083.20<br />
Battalion Chief 6 6 63 54,511.40 ‐ 85,019.18<br />
Training Chief 1 1 58 51,979.20 ‐ 80,641.60<br />
Rescue Chief 1 1 54 47,132.80 ‐ 73,153.60<br />
Fire Equipment Supervisor 1 1 53 45,988.80 ‐ 71,364.80<br />
Fire Lieutenant 27 27 55 47,401.51 ‐ 66,680.40<br />
Fire Safety Inspector 6 5 51 43,804.80 ‐ 67,974.40<br />
Public Education Officer 1 1 51 43,804.80 ‐ 67,974.40<br />
Fire Equipment Mechanic 1 2 47 39,748.80 ‐ 61,630.40<br />
Driver Engineer 42 42 49 40,946.72 ‐ 57,604.91<br />
Firefighter 57 54 45 37,131.54 ‐ 52,259.20<br />
Administrative Assistant 1 1 33 28,246.40 ‐43,804.80<br />
Account Clerk III 1 1 29 25,604.80 ‐ 39,748.80<br />
Office Associate I 2 2 24 22,692.80 ‐ 35,172.80<br />
TOTAL FULL TIME EMPLOYEES 151 148<br />
Fire and Life Safety Educator 2 1 20 20,571.20 ‐ 31,907.20<br />
TOTAL PART TIME EMPLOYEES 2 1<br />
TOTAL FTE 152 148.5<br />
G-58 Fiscal Year <strong>2010</strong> Annual Budget
Information Technology<br />
G-59 Fiscal Year <strong>2010</strong> Annual Budget
Information Technology<br />
FY09 FY10<br />
Personnel Current Proposed PG Salary Range<br />
Information Technology Director 1 1 PB2 76,885.00 ‐ 142,802.00<br />
IT Operations Manager 1 1 63 58,718.40 ‐91,083.20<br />
Information Security Officer 1 1 63 58,718.40 ‐91,083.20<br />
Project Manager I 1 1 51 43,804.80 ‐ 67,974.40<br />
IT Inventory Specialist 1 1 36 30,388.80 ‐ 47,132.80<br />
Computer Applications Specialist 1 0 54 47,132.80 ‐ 73,153.60<br />
Administrative Assistant 1 0 33 28,246.40 ‐43,804.80<br />
Account Clerk IV 1 1 33 28,246.40 ‐43,804.80<br />
Account Clerk III 1 1 29 25,604.80 ‐ 39,748.80<br />
ADMINISTRATION FULL TIME EMPLOYEES 9 7<br />
Radio Communications System Supervisor 1 1 60 54,579.20 ‐ 84,656.00<br />
Senior Simulcast System Specialist 1 1 54 47,132.80 ‐ 73,153.60<br />
COMMUNICATIONS FULL TIME EMPLOYEES 2 2<br />
Telecommunications Manager 1 1 67 64,729.60 ‐ 100,401.60<br />
Engineer III ‐ I.T. 1 1 67 64,729.60 ‐ 100,401.60<br />
Fiber Optics Supervisor 1 1 63 58,718.40 ‐91,083.20<br />
Chief Electronics/Relay Technician 1 1 60 54,579.20 ‐ 84,656.00<br />
Fiber Optics Specialist 1 1 56 49,504.00 ‐ 76,793.60<br />
Electronics/Relay Technician 3 3 54 47,132.80 ‐ 73,153.60<br />
Fiber Operations Technician 1 1 54 47,132.80 ‐ 73,153.60<br />
Telecommunications Service Coordinator 2 2 47 39,748.80 ‐ 61,630.40<br />
Account Clerk IV 1 1 33 28,246.40 ‐43,804.80<br />
GIS Technician II 0 1 49 41,724.80 ‐ 64,729.60<br />
TELECOMMUNICATIONS FULL TIME EMPLOYEES 12 13<br />
Systems and Programming Manager 2 2 PBA 59,732.00 ‐ 111,102.00<br />
Database Manager 1 1 PBA 59,732.00 ‐ 111,102.00<br />
Systems Analyst 7 7 PBB 54,294.00 ‐ 100,987.00<br />
Programmer III 7 7 PBC 49,383.00 ‐ 92,098.00<br />
Database Administrator II 3 3 PBB 54,294.00 ‐ 100,987.00<br />
Programmer II 6 6 PBD 44,872.00 ‐ 83,463.00<br />
APPLICATION DEVELOPMENT & SUPPORT FULL TIME EMPLOYEES 26 26<br />
Network Manager 1 1 63 58,718.40 ‐91,083.20<br />
Network Administrator 1 1 60 54,579.20 ‐ 84,656.00<br />
Network Technician 4 4 54 47,132.80 ‐ 73,153.60<br />
IT Support Specialist II 2 2 45 37,835.20 ‐ 58,718.40<br />
NETWORK ADMINISTRATION & SUPPORT FULL TIME EMPLOYEES 8 8<br />
IT Support Manager 1 1 63 58,718.40 ‐91,083.20<br />
IT Support Specialist III 6 6 49 41,724.80 ‐ 64,729.60<br />
IT Support Specialist II 3 3 45 37,835.20 ‐ 58,718.40<br />
PC SUPPORT FULL TIME EMPLOYEES 10 10<br />
GIS Technician II 4 3 49 41,724.80 ‐ 64,729.60<br />
GIS Technician I 1 1 44 36,940.80 ‐ 57,304.00<br />
GIS FULL TIME EMPLOYEES 5 4<br />
Public Safety IT Manager 1 1 63 58,718.40 ‐91,083.20<br />
Systems Analyst 1 1 PBB 54,294.00 ‐ 100,987.00<br />
Programmer II 1 1 PBD 44,872.00 ‐ 83,463.00<br />
Network Technician 1 1 54 47,132.80 ‐ 73,153.60<br />
PUBLIC SAFETY FULL TIME EMPLOYEES 4 4<br />
`<br />
TOTAL FTE 76 74<br />
G-60 Fiscal Year <strong>2010</strong> Annual Budget
Internal Audit<br />
Internal Auditor<br />
FY ’10<br />
2 Budgeted FTE’s<br />
Internal Audit Manager<br />
PB 4<br />
1/1<br />
Legend<br />
Left number = 2009<br />
Right Number = <strong>2010</strong><br />
Internal Auditor I<br />
PG 49<br />
1/1<br />
FY09 FY10<br />
Personnel Current Proposed PG Salary Range<br />
Internal Audit Manager 1 1 PB4 62,598.00 ‐ 116,261.00<br />
Internal Auditor I 1 1 49 41,724.80 ‐ 64,729.60<br />
TOTAL FULL TIME EMPLOYEES 2 2<br />
TOTAL FTE 2 2<br />
G-61 Fiscal Year <strong>2010</strong> Annual Budget
<strong>Lakeland</strong> Center<br />
G-62 Fiscal Year <strong>2010</strong> Annual Budget
<strong>Lakeland</strong> Center<br />
FY09 FY10<br />
Personnel Current Proposed PG Salary Range<br />
<strong>Lakeland</strong> Center Director 1 1 PB3 71,079.00 ‐ 132,011.00<br />
Assistant <strong>Lakeland</strong> Center Director 1 1 PB5 56,433.00 ‐ 104,809.00<br />
<strong>Lakeland</strong> Center Accountant 1 1 58 51,979.20 ‐ 80,641.60<br />
Client Services Manager 1 1 51 43,804.80 ‐ 67,974.40<br />
Marketing Manager 1 1 49 41,724.80 ‐ 64,729.60<br />
Marketing Sales Representative 1 1 47 39,748.80 ‐ 61,630.40<br />
Senior Client Services Coordinator 1 1 45 37,835.20 ‐ 58,718.40<br />
Client Services Coordinator 2 2 38 31,907.20 ‐ 49,504.00<br />
Marketing Associate 1 1 35 29,660.80 ‐ 45,988.80<br />
Administrative Assistant 1 1 33 28,246.40 ‐43,804.80<br />
Account Clerk IV 1 1 33 28,246.40 ‐43,804.80<br />
Guest Services Supervisor 1 1 29 25,604.80 ‐ 39,748.80<br />
Groups Sales Coordinator 1 1 24 22,692.80 ‐ 35,172.80<br />
Office Assistant I 1 1 19 20,072.00 ‐ 31,137.60<br />
ADMINISTRATION FULL TIME EMPLOYEES 15 15<br />
<strong>Lakeland</strong> Center Operations Manager 1 1 56 49,504.00 ‐ 76,793.60<br />
<strong>Lakeland</strong> Center Technician Coordinator 1 1 45 37,835.20 ‐ 58,718.40<br />
<strong>Lakeland</strong> Center Chief Engineer 1 1 45 37,835.20 ‐ 58,718.40<br />
Maintenance Tech ‐ TLC 2 2 36 30,388.80 ‐ 47,132.80<br />
Operations Support Supervisor II 1 1 36 30,388.80 ‐ 47,132.80<br />
Event Setup Supervisor 3 3 31 26,894.40 ‐ 41,724.80<br />
Operations Support Worker II 9 8 18 19,593.60 ‐ 30,388.80<br />
OPERATIONS FULL EMPLOYEES 18 17<br />
Box Office Manager 1 1 47 39,748.80 ‐ 61,630.40<br />
Assistant Box Office Manager 1 1 33 28,246.40 ‐43,804.80<br />
Box Office Supervisor 1 2 29 25,604.80 ‐ 39,748.80<br />
BOX OFFICE FULL TIME EMPLOYEES 1 2<br />
Office Associate I 1 24 22,692.80 ‐ 35,172.80<br />
FULL TIME TEMPORARY EMPLOYEES 0 1<br />
Parking Supervisor 1 1 12 16,931.20 ‐ 26,249.60<br />
<strong>Lakeland</strong> Center Pool Employee 200 197 * #N/A<br />
PART TIME EMPLOYEES 200 198<br />
TOTAL FTE 134 134<br />
G-63 Fiscal Year <strong>2010</strong> Annual Budget
Parks and Recreation: Director<br />
Director FY09 FY10<br />
Personnel Current Proposed PG Salary Range<br />
Parks & Rec. Director 1 1 PB2 76,885.00 ‐ 142,802.00<br />
Assistant Director <strong>of</strong> Parks & Recreation Admin and Planning 1 1 PB4 62,598.00 ‐ 116,261.00<br />
Office Associate II 1 1 29 25,604.80 ‐ 39,748.80<br />
Administrative Assistant 1 0 33 28,246.40 ‐43,804.80<br />
TOTAL FULL TIME EMPLOYEES 3 3<br />
Administrative Assistant 0 1 33 28,246.40 ‐43,804.80<br />
TOTAL PART TIME EMPLOYEES 0 1<br />
TOTAL FTE 3 3.5<br />
G-64 Fiscal Year <strong>2010</strong> Annual Budget
Parks and Recreation: Cemeteries<br />
Cemeteries FY09 FY10<br />
Personnel Current Proposed PG Salary Range<br />
Superintendant <strong>of</strong> Cemeteries 1 1 54 47,132.80 ‐ 73,153.60<br />
Operations Support Supervisor III 1 1 42 35,172.80 ‐ 54,579.20<br />
Operations Support Technician III 1 1 33 28,246.40 ‐43,804.80<br />
Operations Support Technician II 1 1 29 25,604.80 ‐ 39,748.80<br />
Office Associate II 1 1 29 25,604.80 ‐ 39,748.80<br />
Operations Support Technician I 5 5 24 22,692.80 ‐ 35,172.80<br />
TOTAL FULL TIME EMPLOYEES 10 10<br />
Office Assistant II 1 1 22 21,590.40 ‐ 33,508.80<br />
TOTAL PART TIME EMPLOYEES 1 1<br />
Operations Support Worker II 2 2 18 19,593.60 ‐ 30,388.80<br />
TOTAL FULL TIME TEMPORARY 2 2<br />
TOTAL FTE 11.5 11.5<br />
G-65 Fiscal Year <strong>2010</strong> Annual Budget
Parks and Recreation: Cleveland Heights<br />
Golf Course<br />
G-66 Fiscal Year <strong>2010</strong> Annual Budget
Parks and Recreation: Cleveland<br />
Heights Golf Course<br />
Cleveland Heights Golf Course FY09 FY10<br />
Personnel Current Proposed PG Salary Range<br />
Golf Course Manager 1 1 60 54,579.20 ‐ 84,656.00<br />
Office Associate II 1 1 29 25,604.80 ‐ 39,748.80<br />
ADMINISTRATION FULL TIME EMPLOYEES 2 2<br />
Golf Pr<strong>of</strong>essional 1 1 36 30,388.80 ‐ 47,132.80<br />
Assistant Golf Pr<strong>of</strong>essional 1 0 20 20,571.20 ‐ 31,907.20<br />
COURSE OPERATIONS FULL TIME EMPLOYEES 2 1<br />
Greens Superintendent 1 1 51 43,804.80 ‐ 67,974.40<br />
Grounds Maintenance Worker II ‐ Golf Course 1 1 24 22,692.80 ‐ 35,172.80<br />
Light Equipment Mechanic I ‐ Golf Course 1 1 24 22,692.80 ‐ 35,172.80<br />
Grounds Maintenance Worker I ‐ Golf Course 5 5 16 18,657.60 ‐ 28,953.60<br />
COURSE MAINTENANCE FULL TIME EMPLOYEES 8 8<br />
Food and Beverage Manager 1 1 33 28,246.40 ‐43,804.80<br />
Food Supervisor 1 1 22 21,590.40 ‐ 33,508.80<br />
Cook 2 2 16 18,657.60 ‐ 28,953.60<br />
Beverage Service Worker 1 1 * #N/A<br />
Food Service Worker 1 1 * #N/A<br />
FOOD AND BEVERAGE FULL TIME EMPLOYEES 6 6<br />
Sales Assistant 4 4 * #N/A<br />
Player Assistant 7 7 * #N/A<br />
Cart Attendant 7 7 * #N/A<br />
Food Service Worker 24 20 * #N/A<br />
Kitchen Utility Worker I 9 9 * #N/A<br />
Grounds Worker 12 8 8 15,350.40 ‐ 23,816.00<br />
Office Assistant I 1 1 19 20,072.00 ‐ 31,137.60<br />
PART TIME EMPLOYEES 64 56<br />
TOTAL FTE 50 45<br />
G-67 Fiscal Year <strong>2010</strong> Annual Budget
Parks and Recreation: Library<br />
G-68 Fiscal Year <strong>2010</strong> Annual Budget
Parks and Recreation: Library<br />
Main Library FY09 FY10<br />
Personnel Current Proposed PG Salary Range<br />
<strong>City</strong> Librarian 1 1 58 51,979.20 ‐ 80,641.60<br />
Assistant <strong>City</strong> Librarian 1 1 54 47,132.80 ‐ 73,153.60<br />
Librarian Supervisor 2 2 45 37,835.20 ‐ 58,718.40<br />
Librarian 5 5 42 35,172.80 ‐ 54,579.20<br />
Library Associate 6 6 33 28,246.40 ‐43,804.80<br />
Office Associate II 1 1 29 25,604.80 ‐ 39,748.80<br />
Library Clerk 5 5 20 20,571.20 ‐ 31,907.20<br />
Operations Support Worker I 2 2 14 17,763.20 ‐ 27,560.00<br />
TOTAL FULL TIME EMPLOYEES 23 23<br />
Librarian 3 3 42 35,172.80 ‐ 54,579.20<br />
Librarian ‐ Bookmobile 1 1 42 35,172.80 ‐ 54,579.20<br />
Library Associate 1 1 33 28,246.40 ‐43,804.80<br />
Library Clerk 2 2 20 20,571.20 ‐ 31,907.20<br />
TOTAL FULL TIME COUNTY FUNDED POSITIONS 7 7<br />
Library Clerk 1 1 20 20,571.20 ‐ 31,907.20<br />
Library Page 1 1 4 14,996.80 ‐ 21,590.40<br />
TOTAL PART TIME COUNTY FUNDED POSITIONS 2 2<br />
TOTAL COUNTY FUNDED POSITIONS 9 8<br />
Librarian Supervisor 1 1 45 37,835.20 ‐ 58,718.40<br />
Library Associate 2 2 33 28,246.40 ‐43,804.80<br />
TOTAL eLIBRARY FULL TIME POSITIONS 3 3<br />
Library Technical Assistant 3 3 24 22,692.80 ‐ 35,172.80<br />
TOTAL eLIBRARY PART TIME POSITIONS 3 3<br />
Librarian 1 1 42 35,172.80 ‐ 54,579.20<br />
Library Technical Assistant 2 3 24 22,692.80 ‐ 35,172.80<br />
Library Clerk 3 3 20 20,571.20 ‐ 31,907.20<br />
Proctor‐Library 2 2 *<br />
Library Page 9 8 4 14,996.80 ‐ 21,590.40<br />
TOTAL PART TIME EMPLOYEES 17 17<br />
TOTAL FTE 44 44<br />
G-69 Fiscal Year <strong>2010</strong> Annual Budget
Parks and Recreation: Library<br />
Branch Library FY09 FY10<br />
Personnel Current Proposed PG Salary Range<br />
Librarian Supervisor 1 1 45 37,835.20 ‐ 58,718.40<br />
Librarian 1 1 42 35,172.80 ‐ 54,579.20<br />
Library Technical Assistant 2 2 24 22,692.80 ‐ 35,172.80<br />
Operations Support Worker I 1 1 14 17,763.20 ‐ 27,560.00<br />
TOTAL FULL TIME EMPLOYEES 5 5<br />
Library Clerk 1 1 20 20,571.20 ‐ 31,907.20<br />
TOTAL COUNTY FUNDED POSITIONS 1 1<br />
Library Clerk 2 1 20 20,571.20 ‐ 31,907.20<br />
Library Page 2 2 4 14,996.80 ‐ 21,590.40<br />
Library Technical Assistant 0 1 24 22,692.80 ‐ 35,172.80<br />
TOTAL PART TIME EMPLOYEES 4 4<br />
TOTAL FTE 7.5 7.5<br />
TOTAL LIBRARY FTE'S: 51.5 51.5<br />
G-70 Fiscal Year <strong>2010</strong> Annual Budget
Parks and Recreation: Parks<br />
G-71 Fiscal Year <strong>2010</strong> Annual Budget
Parks and Recreation: Parks<br />
Parks FY09 FY10<br />
Personnel Current Proposed PG Salary Range<br />
Assistant Director Park and Recreation Operations 1 1 PB4 62,598.00 ‐ 116,261.00<br />
Assistant Superintendent <strong>of</strong> Parks 2 2 54 47,132.80 ‐ 73,153.60<br />
<strong>City</strong> Arborist 1 1 49 41,724.80 ‐ 64,729.60<br />
Horticultural Specialist 1 1 49 41,724.80 ‐ 64,729.60<br />
Operations Support Supervisor III 7 8 42 35,172.80 ‐ 54,579.20<br />
Operations Support Supervisor II 8 9 36 30,388.80 ‐ 47,132.80<br />
Account Clerk IV 1 1 33 28,246.40 ‐43,804.80<br />
Operations Support Technician III 3 3 33 28,246.40 ‐43,804.80<br />
Tree Trimmer Parks '&' Rec 2 2 31 26,894.40 ‐ 41,724.80<br />
Operations Support Technician II 9 10 29 25,604.80 ‐ 39,748.80<br />
Office Associate II 1 1 29 25,604.80 ‐ 39,748.80<br />
Equipment Operator I 1 1 29 25,604.80 ‐ 39,748.80<br />
Office Associate I 1 1 24 22,692.80 ‐ 35,172.80<br />
Operations Support Technician I 42 38 24 22,692.80 ‐ 35,172.80<br />
Office Assistant II 1 1 22 21,590.40 ‐ 33,508.80<br />
Operations Support Worker II 14 15 18 19,593.60 ‐ 30,388.80<br />
TOTAL FULL TIME EMPLOYEES 95 95<br />
Operations Support Supervisor III 1 0 42 35,172.80 ‐ 54,579.20<br />
Operations Support Supervisor II 1 0 36 30,388.80 ‐ 47,132.80<br />
Operations Support Technician II 1 1 29 25,604.80 ‐ 39,748.80<br />
Operations Support Technician I 2 4 24 22,692.80 ‐ 35,172.80<br />
Operations Support Technician II ‐ (P/T) 7 0 29 25,604.80 ‐ 39,748.80<br />
TOTAL GRANT FUNDED POSITIONS 12 5<br />
Parking Attendant (Parks & Rec.) 25 25 8 15,350.40 ‐ 23,816.00<br />
Operations Support Worker II 22 25 18 19,593.60 ‐ 30,388.80<br />
TOTAL PART TIME EMPLOYEES 47 50<br />
TOTAL FTE 130.5 125<br />
G-72 Fiscal Year <strong>2010</strong> Annual Budget
Parks and Recreation: Recreation<br />
G-73 Fiscal Year <strong>2010</strong> Annual Budget
Parks and Recreation: Recreation<br />
Recreation FY09 FY10<br />
Personnel Current Proposed PG Salary Range<br />
Superintendant <strong>of</strong> Recreation 1 1 60 54,579.20 ‐ 84,656.00<br />
Asst Superintendent <strong>of</strong> Recreation 1 1 54 47,132.80 ‐ 73,153.60<br />
Recreation Supervisor III 3 3 49 41,724.80 ‐ 64,729.60<br />
Aquatics Supervisor 1 1 47 39,748.80 ‐ 61,630.40<br />
Therapeutic Supervisor 1 1 45 37,835.20 ‐ 58,718.40<br />
Recreation Supervisor II 3 2 45 37,835.20 ‐ 58,718.40<br />
Assistant Aquatic Supervisor 1 1 42 35,172.80 ‐ 54,579.20<br />
Recreation Supervisor I 7 7 40 33,508.80 ‐ 51,979.20<br />
Swimming Pool Operator 3 3 33 28,246.40 ‐43,804.80<br />
Office Associate II 1 1 29 25,604.80 ‐ 39,748.80<br />
Senior Lifeguard 1 1 27 24,398.40 ‐ 37,835.20<br />
Custodian Foreman 3 3 27 24,398.40 ‐ 37,835.20<br />
Office Associate I 3 2 24 22,692.80 ‐ 35,172.80<br />
Recreation Leader 5 6 24 22,692.80 ‐ 35,172.80<br />
Office Assistant II 1 1 22 21,590.40 ‐ 33,508.80<br />
Operations Support Worker I 8 8 14 17,763.20 ‐ 27,560.00<br />
TOTAL FULL TIME EMPLOYEES 43 42<br />
Recreation Supervisor II 0 1 45 37,835.20 ‐ 58,718.40<br />
Recreation Leader 10 10 24 22,692.80 ‐ 35,172.80<br />
Lead Lifeguard 2 2 18 19,593.60 ‐ 30,388.80<br />
Playground Coordinator 8 8 8 15,350.40 ‐ 23,816.00<br />
Bus Driver 7 5 6 14,996.80 ‐ 22,692.80<br />
Playground Instructor 37 31 6 14,996.80 ‐ 22,692.80<br />
Lifeguard 40 40 12 16,931.20 ‐ 26,249.60<br />
Tennis Instructor 8 8 6 14,996.80 ‐ 22,692.80<br />
TOTAL PART TIME EMPLOYEES 112 105<br />
TOTAL FTE 99 94.5<br />
G-74 Fiscal Year <strong>2010</strong> Annual Budget
Police Department: Office <strong>of</strong> Chief <strong>of</strong> Police<br />
G-75 Fiscal Year <strong>2010</strong> Annual Budget
Police Department: Administrative Services<br />
G-76 Fiscal Year <strong>2010</strong> Annual Budget
Police Department: Investigative Services<br />
G-77 Fiscal Year <strong>2010</strong> Annual Budget
Police Department: Uniform Patrol Divisions<br />
G-78 Fiscal Year <strong>2010</strong> Annual Budget
Police Department<br />
FY09 FY10<br />
Personnel Current Proposed PG Salary Range<br />
Police Chief 1 1 PB2 76,885.00 ‐ 142,802.00<br />
Assistant Police Chief 2 2 PB4 62,598.00 ‐ 116,261.00<br />
Assistant Police Chief Admin Services 1 1 PB4 62,598.00 ‐ 116,261.00<br />
Police General Counselor 1 1 PB4 62,598.00 ‐ 116,261.00<br />
Police Captain 4 4 67 64,729.60 ‐ 100,401.60<br />
Chief Accountant 1 1 63 58,718.40 ‐91,083.20<br />
Police Lieutenant 11 11 63 56,543.76 ‐ 86,027.76<br />
Police Sergeant 33 32 56 47,567.52 ‐ 72,377.76<br />
Police Planning '&' Research Supervisor 1 1 54 47,132.80 ‐ 73,153.60<br />
Crime Scene Supervisor 1 1 54 47,132.80 ‐ 73,153.60<br />
Civilian Background Investigator 1 1 49 41,724.80 ‐ 64,729.60<br />
Community Services Unit ‐ Supervisor 1 1 49 41,724.80 ‐ 64,729.60<br />
PAL Executive Director 1 1 49 41,724.80 ‐ 64,729.60<br />
Police Officer 179 166 49 40,010.88 ‐ 60,889.92<br />
Police Facility/Fleet Coordinator 1 1 47 39,748.80 ‐ 61,630.40<br />
PAL Program Coordinator 0 1 45 37,835.20 ‐ 58,718.40<br />
Accreditation Manager 1 1 45 37,835.20 ‐ 58,718.40<br />
Police Administrative Coordinator 4 4 45 37,835.20 ‐ 58,718.40<br />
Emergency Communications Shift Supervisor 4 4 42 35,172.80 ‐ 54,579.20<br />
Community Resources Coordinator 1 1 40 33,508.80 ‐ 51,979.20<br />
Crime Scene Technician II 1 1 40 33,508.80 ‐ 51,979.20<br />
Legal Assistant 1 1 40 33,508.80 ‐ 51,979.20<br />
Crime Analyst 1 3 38 31,907.20 ‐ 49,504.00<br />
Crime Scene Technician I 3 3 36 30,388.80 ‐ 47,132.80<br />
Chief Clerk 2 1 36 30,388.80 ‐ 47,132.80<br />
Property Evidence Specialist 0 1 36 30,388.80 ‐ 47,132.80<br />
Administrative Assistant 2 1 33 28,246.40 ‐43,804.80<br />
Account Clerk IV 1 1 33 28,246.40 ‐43,804.80<br />
Court Liaison 1 1 33 28,246.40 ‐43,804.80<br />
Emergency Communications Specialist 36 36 33 28,246.40 ‐43,804.80<br />
Civilian Crime Prevention Practitioner 6 4 31 26,894.40 ‐ 41,724.80<br />
Account Clerk III 2 3 29 25,604.80 ‐ 39,748.80<br />
Police Property Clerk 5 4 29 25,604.80 ‐ 39,748.80<br />
Office Associate II 4 2 29 25,604.80 ‐ 39,748.80<br />
Public Safety Aide I 15 12 29 25,604.80 ‐ 39,748.80<br />
Police Records Clerk 10 24 22,692.80 ‐ 35,172.80<br />
Account Clerk II 1 0 26 23,816.00 ‐ 36,940.80<br />
Office Associate I 11 6 24 22,692.80 ‐ 35,172.80<br />
Office Assistant II 6 1 22 21,590.40 ‐ 33,508.80<br />
TOTAL FULL TIME EMPLOYEES 347 327<br />
G-79 Fiscal Year <strong>2010</strong> Annual Budget
Police Department<br />
FY09 FY10<br />
Personnel Current Proposed PG Salary Range<br />
Police Sergeant ‐ IPS Coordinator 1 1 56 47,567.52 ‐ 72,377.76<br />
Police Sergeant ‐ SRO 1 1 56 47,567.52 ‐ 72,377.76<br />
Police Officer ‐ SRO 8 8 49 40,010.88 ‐ 60,889.92<br />
Victim Assistance Coordinator ‐VOCA 1 1 36 30,388.80 ‐ 47,132.80<br />
Victim Assistance Coordinator ‐DART 1 1 36 30,388.80 ‐ 47,132.80<br />
Victim Assistance Advocate ‐ VOCA 2 2 27 24,398.40 ‐ 37,835.20<br />
Victim Assistance Advocate ‐ DART 1 0 27 24,398.40 ‐ 37,835.20<br />
TOTAL GRANT FUNDED POSITIONS 15 14<br />
Staff Inspector 0 1 45 37,835.20 ‐ 58,718.40<br />
Training Instructor ‐ LPD 0 1 49 41,724.80 ‐ 64,729.60<br />
Civilian Background Investigator 0 1 49 41,724.80 ‐ 64,729.60<br />
Latent Print Examiner 0 2 47 39,748.80 ‐ 61,630.40<br />
Chief Pilot 1 0 #N/A<br />
DCT/BCE Student 8 0 4 14,996.80 ‐ 21,590.40<br />
Police Auxiliary Operator Sworn 10 5 14 17,763.20 ‐ 27,560.00<br />
Police Auxiliary Operator ‐ Civilian 9 5 14 17,763.20 ‐ 27,560.00<br />
Office Associate I 2 0 24 22,692.80 ‐ 35,172.80<br />
Account Clerk III 1 0 29 25,604.80 ‐ 39,748.80<br />
Emergency Communications Specialist 7 5 33 28,246.40 ‐43,804.80<br />
TOTAL PART TIME EMPLOYEES 38 20<br />
TOTAL FTE 381 351<br />
G-80 Fiscal Year <strong>2010</strong> Annual Budget
Public Works: Director<br />
FY09 FY10<br />
Personnel Current Proposed PG Salary Range<br />
Public Works Director 1 1 PB2 76,885.00 ‐ 142,802.00<br />
Assistant Director <strong>of</strong> Public Works 1 1 PB4 62,598.00 ‐ 116,261.00<br />
Special Projects Coordinator 1 1 56 49,504.00 ‐ 76,793.60<br />
Computer Applications Specialist 1 1 54 47,132.80 ‐ 73,153.60<br />
Administrative Assistant 1 1 33 28,246.40 ‐43,804.80<br />
Account Clerk IV 1 1 33 28,246.40 ‐43,804.80<br />
TOTAL FULL TIME EMPLOYEES 6 6<br />
Administrative Assistant 1 1 33 28,246.40 ‐43,804.80<br />
TOTAL PART TIME EMPLOYEES 1 1<br />
TOTAL FTE 6.5 6.5<br />
G-81 Fiscal Year <strong>2010</strong> Annual Budget
Public Works: Construction and Maintenance<br />
G-82 Fiscal Year <strong>2010</strong> Annual Budget
Public Works: Construction and<br />
Maintenance<br />
FY09 FY10<br />
Personnel Current Proposed PG Salary Range<br />
Manager <strong>of</strong> Construction '&' Maintenance 1 1 65 61,630.40 ‐ 95,617.60<br />
Supervisor <strong>of</strong> Maintenance‐Public Works 1 1 56 49,504.00 ‐ 76,793.60<br />
Construction Supervisor 1 1 56 49,504.00 ‐ 76,793.60<br />
Pavement Management Coordinator 1 1 49 41,724.80 ‐ 64,729.60<br />
Construction Foreman 2 2 47 39,748.80 ‐ 61,630.40<br />
Maintenance Foreman II ‐ Streets 3 3 47 39,748.80 ‐ 61,630.40<br />
Water Utilities Pipefitter Foreman 1 1 45 37,835.20 ‐ 58,718.40<br />
Equipment Operator IV 2 2 42 35,172.80 ‐ 54,579.20<br />
Environmental Technician II 1 1 40 33,508.80 ‐ 51,979.20<br />
Equipment Operator III 4 4 38 31,907.20 ‐ 49,504.00<br />
Construction Trades Worker III 2 2 38 31,907.20 ‐ 49,504.00<br />
Water Utilities Pipefitter II 2 2 36 30,388.80 ‐ 47,132.80<br />
Construction Trades Worker II 11 11 33 28,246.40 ‐43,804.80<br />
Account Clerk IV 1 1 33 28,246.40 ‐43,804.80<br />
Equipment Operator II Streets 10 9 33 28,246.40 ‐43,804.80<br />
Pavement Marking Technician 1 1 33 28,246.40 ‐43,804.80<br />
Warehouse Operations Technician II 1 1 33 28,246.40 ‐43,804.80<br />
Water Utilities Pipefitter I 2 2 31 26,894.40 ‐ 41,724.80<br />
Office Associate II 2 2 29 25,604.80 ‐ 39,748.80<br />
Construction Trades Worker I 7 8 29 25,604.80 ‐ 39,748.80<br />
Operations Support Technician II 1 1 29 25,604.80 ‐ 39,748.80<br />
Equipment Operator I 2 2 29 25,604.80 ‐ 39,748.80<br />
Operations Support Technician I 5 5 24 22,692.80 ‐ 35,172.80<br />
TOTAL FULL TIME EMPLOYEES 64 64<br />
TOTAL FTE 64 64<br />
G-83 Fiscal Year <strong>2010</strong> Annual Budget
Public Works: Engineering<br />
FY09 FY10<br />
Personnel Current Proposed PG Salary Range<br />
Civil Engineer Manager 1 1 74 76,793.60 ‐ 119,142.40<br />
Pr<strong>of</strong>essional Engineer ‐ Public Works 1 1 69 67,974.40 ‐ 105,435.20<br />
Traffic Engineer 1 1 67 64,729.60 ‐ 100,401.60<br />
<strong>City</strong> Surveyor 1 1 63 58,718.40 ‐91,083.20<br />
Engineer II ‐ Public Works 3 3 63 58,718.40 ‐91,083.20<br />
Engineer I ‐ Public Works 1 1 56 49,504.00 ‐ 76,793.60<br />
Engineering Technician III ‐ Public Works 1 1 51 43,804.80 ‐ 67,974.40<br />
Engineering Technician II ‐ PW 1 1 45 37,835.20 ‐ 58,718.40<br />
Engineering Inspector 3 4 42 35,172.80 ‐ 54,579.20<br />
Survey Mapping Technician III 2 2 40 33,508.80 ‐ 51,979.20<br />
Survey Mapping Technician II 2 1 36 30,388.80 ‐ 47,132.80<br />
Survey Mapping Technician I 2 1 29 25,604.80 ‐ 39,748.80<br />
TOTAL FULL TIME EMPLOYEES 19 18<br />
TOTAL FTE 19 18<br />
G-84 Fiscal Year <strong>2010</strong> Annual Budget
Public Works: Facilities Maintenance<br />
FY09 FY10<br />
Personnel Current Proposed PG Salary Range<br />
Facilities Maintenance Manager 1 1 65 61,630.40 ‐ 95,617.60<br />
Facilities Maintenance Supervisor 1 1 56 49,504.00 ‐ 76,793.60<br />
Facilities Project Coordinator 1 1 54 47,132.80 ‐ 73,153.60<br />
Maintenance Electrician 1 1 49 41,724.80 ‐ 64,729.60<br />
Security Specialist 1 1 45 37,835.20 ‐ 58,718.40<br />
Maintenance Mechanic III 2 1 42 35,172.80 ‐ 54,579.20<br />
Maintenance Mechanic II 5 6 38 31,907.20 ‐ 49,504.00<br />
Painter 3 3 33 28,246.40 ‐43,804.80<br />
Administrative Assistant 1 1 33 28,246.40 ‐43,804.80<br />
Maintenance Mechanic I 2 2 33 28,246.40 ‐43,804.80<br />
Account Clerk III 1 1 29 25,604.80 ‐ 39,748.80<br />
Operations Support Worker II 1 1 18 19,593.60 ‐ 30,388.80<br />
TOTAL MAINTENANCE FULL TIME EMPLOYEES 20 20<br />
Custodial Supervisor 1 1 31 26,894.40 ‐ 41,724.80<br />
Custodian Foreman 2 2 27 24,398.40 ‐ 37,835.20<br />
Janitorial Lead 2 3 16 18,657.60 ‐ 28,953.60<br />
Operations Support Worker I 26 23 14 17,763.20 ‐ 27,560.00<br />
TOTAL JANITORIAL FULL TIME EMPLOYEES 31 29<br />
Fire Suppression System Foreman 1 1 53 45,988.80 ‐ 71,364.80<br />
Fire Suppression System Technician II 2 2 47 39,748.80 ‐ 61,630.40<br />
TOTAL FIRE SAFETY TEAM FULL TIME EMPLOYEES 3 3<br />
Operations Support Worker I 1 0 14 17,763.20 ‐ 27,560.00<br />
TOTAL PART TIME EMPLOYEES 1 0<br />
TOTAL FTE 54.5 52<br />
G-85 Fiscal Year <strong>2010</strong> Annual Budget
Public Works: Fleet<br />
FY09 FY10<br />
Personnel Current Proposed PG Salary Range<br />
Fleet Manager 1 1 65 61,630.40 ‐ 95,617.60<br />
Automotive Shop Foreman 2 2 54 47,132.80 ‐ 73,153.60<br />
Fleet Financial Analyst 1 1 51 43,804.80 ‐ 67,974.40<br />
Automotive Mechanic III 18 18 47 39,748.80 ‐ 61,630.40<br />
Automotive Maintenance Coordinator 1 1 49 41,724.80 ‐ 64,729.60<br />
Automotive Mechanic II 1 2 42 35,172.80 ‐ 54,579.20<br />
Paint '&' Body Mechanic 1 0 36 30,388.80 ‐ 47,132.80<br />
Office Manager 1 1 38 31,907.20 ‐ 49,504.00<br />
Automotive Mechanic I 2 1 38 31,907.20 ‐ 49,504.00<br />
Warehouse Operations Technician I 1 1 31 26,894.40 ‐ 41,724.80<br />
Equipment Operator I 1 0 29 25,604.80 ‐ 39,748.80<br />
Account Clerk III 1 1 29 25,604.80 ‐ 39,748.80<br />
Automotive Parts Clerk 2 1 27 24,398.40 ‐ 37,835.20<br />
Account Clerk II 1 1 26 23,816.00 ‐ 36,940.80<br />
Automotive Mechanic Helper 1 1 18 19,593.60 ‐ 30,388.80<br />
TOTAL FULL TIME EMPLOYEES 35 32<br />
TOTAL FTE 35 32<br />
G-86 Fiscal Year <strong>2010</strong> Annual Budget
Public Works: Lakes and Stormwater<br />
FY09 FY10<br />
Personnel Current Proposed PG Salary Range<br />
Manager <strong>of</strong> Lakes '&' Stormwater 1 1 65 61,630.40 ‐ 95,617.60<br />
Environmental Specialist 3 3 47 39,748.80 ‐ 61,630.40<br />
Lakes Program Coordinator 1 1 40 33,508.80 ‐ 51,979.20<br />
TOTAL FULL TIME EMPLOYEES 5 5<br />
TOTAL FTE 5 5<br />
G-87 Fiscal Year <strong>2010</strong> Annual Budget
Public Works: Solid Waste<br />
G-88 Fiscal Year <strong>2010</strong> Annual Budget
Public Works: Solid Waste<br />
FY09 FY10<br />
Personnel Current Proposed PG Salary Range<br />
Manager <strong>of</strong> Solid Waste 1 1 65 61,630.40 ‐ 95,617.60<br />
Supervisor <strong>of</strong> Solid Waste 3 3 54 47,132.80 ‐ 73,153.60<br />
Solid Waste Foreman 2 2 47 39,748.80 ‐ 61,630.40<br />
Solid Waste Collection Driver III 17 17 31 26,894.40 ‐ 41,724.80<br />
Account Clerk III 1 1 29 25,604.80 ‐ 39,748.80<br />
Office Associate II 1 1 29 25,604.80 ‐ 39,748.80<br />
Solid Waste COllection Driver II 15 15 29 25,604.80 ‐ 39,748.80<br />
Customer Service Representative II 1 1 29 25,604.80 ‐ 39,748.80<br />
Solid Waste Collection Driver I 10 10 24 22,692.80 ‐ 35,172.80<br />
Customer Service Representative I 1 1 24 22,692.80 ‐ 35,172.80<br />
Solid Waste Collector 33 33 20 20,571.20 ‐ 31,907.20<br />
TOTAL FULL TIME EMPLOYEES 85 85<br />
TOTAL FTE 85 85<br />
G-89 Fiscal Year <strong>2010</strong> Annual Budget
Public Works: Traffic<br />
Traffic<br />
FY09 FY10<br />
Personnel Current Proposed PG Salary Range<br />
Manager <strong>of</strong> Traffic Operations 1 1 65 61,630.40 ‐ 95,617.60<br />
Traffic Signal Foreman 1 1 51 43,804.80 ‐ 67,974.40<br />
Traffic System Operator 1 1 51 43,804.80 ‐ 67,974.40<br />
Asst Traffic Sys Operator 1 1 45 37,835.20 ‐ 58,718.40<br />
Traffic Signal Technician 3 3 45 37,835.20 ‐ 58,718.40<br />
Traffic Engineering Technician 1 1 40 33,508.80 ‐ 51,979.20<br />
Traffic Sign Fabricator 1 1 31 26,894.40 ‐ 41,724.80<br />
Office Associate II 1 1 29 25,604.80 ‐ 39,748.80<br />
Traffic Sign Technician 3 3 27 24,398.40 ‐ 37,835.20<br />
TOTAL FULL TIME EMPLOYEES 13 13<br />
Traffic Engineering Aide 1 1 24 22,692.80 ‐ 35,172.80<br />
TOTAL PART TIME EMPLOYEES 1 1<br />
SUB‐TOTAL FTE 13.5 13.5<br />
G-90 Fiscal Year <strong>2010</strong> Annual Budget
Public Works: Traffic<br />
Parking<br />
FY09 FY10<br />
Personnel Current Proposed PG Salary Range<br />
Parking System Foreman 1 1 38 31,907.20 ‐ 49,504.00<br />
Parking Service Attendant 6 5 27 24,398.40 ‐ 37,835.20<br />
TOTAL FULL TIME EMPLOYEES 7 6<br />
Parking Service Attendant 2 0 27 24,398.40 ‐ 37,835.20<br />
TOTAL PART TIME EMPLOYEES 2 0<br />
SUB‐TOTAL FTE 8 6<br />
TRAFFIC TOTAL FTE'S: 21.5 19.5<br />
G-91 Fiscal Year <strong>2010</strong> Annual Budget
Purchasing and Risk Management<br />
G-92 Fiscal Year <strong>2010</strong> Annual Budget
Purchasing and Risk Management<br />
Purchasing and Stores FY09 FY10<br />
Personnel Current Proposed PG Salary Range<br />
Purchasing Manager 1 1 65 61,630.40 ‐ 95,617.60<br />
Assistant Purchasing Manager 1 1 54 47,132.80 ‐ 73,153.60<br />
Superintendant <strong>of</strong> Stores 1 1 49 41,724.80 ‐ 64,729.60<br />
Inventory Control Specialist 1 1 42 35,172.80 ‐ 54,579.20<br />
Purchasing Agent 4 4 42 35,172.80 ‐ 54,579.20<br />
Material Specialist 2 2 42 35,172.80 ‐ 54,579.20<br />
Warehouse Operations Technician I 5 4 31 26,894.40 ‐ 41,724.80<br />
Account Clerk III 1 2 29 25,604.80 ‐ 39,748.80<br />
Account Clerk II 2 2 26 23,816.00 ‐ 36,940.80<br />
TOTAL FULL TIME EMPLOYEES 18 18<br />
SUB‐TOTAL FTE 18 18<br />
Risk Management FY09 FY10<br />
Personnel Current Proposed PG Salary Range<br />
Risk & Purchasing Director 1 1 PB3 71,079.00 ‐ 132,011.00<br />
Safety Manager 1 1 56 49,504.00 ‐ 76,793.60<br />
Health Benefits Coordinator 1 1 54 47,132.80 ‐ 73,153.60<br />
Safety Coordinator Energy Delivery 1 1 49 41,724.80 ‐ 64,729.60<br />
Safety Coordinator 2 2 49 41,724.80 ‐ 64,729.60<br />
Safety Officer 1 1 49 41,724.80 ‐ 64,729.60<br />
Occupational Health Nurse 1 1 47 39,748.80 ‐ 61,630.40<br />
Risk Management Executive Assistant 1 1 40 33,508.80 ‐ 51,979.20<br />
Administrative Assistant 1 1 33 28,246.40 ‐43,804.80<br />
Account Clerk III 1 1 29 25,604.80 ‐ 39,748.80<br />
Office Associate II 3 3 29 25,604.80 ‐ 39,748.80<br />
Office Associate I 1 1 24 22,692.80 ‐ 35,172.80<br />
TOTAL FULL TIME EMPLOYEES 15 15<br />
SUB‐TOTAL FTE 15 15<br />
PURCHASING & RISK MANAGEMENT TOTAL FTE's: 33 33<br />
G-93 Fiscal Year <strong>2010</strong> Annual Budget
Retirement Services<br />
FY09 FY10<br />
Personnel Current Proposed PG Salary Range<br />
Retirement System ‐ Administrator 1 1 PB4 62,598.00 ‐ 116,261.00<br />
Pension Benefits Manager 1 1 56 49,504.00 ‐ 76,793.60<br />
Pension Benefits Administrator 1 1 42 35,172.80 ‐ 54,579.20<br />
Pension Benefits Assistant 1 1 38 31,907.20 ‐ 49,504.00<br />
TOTAL FULL TIME EMPLOYEES 4 4<br />
Office Assistant I 1 1 19 20,072.00 ‐ 31,137.60<br />
TOTAL PART TIME EMPLOYEES 1 1<br />
TOTAL FTE 4.5 4.5<br />
G-94 Fiscal Year <strong>2010</strong> Annual Budget
Wastewater: Administration<br />
Director <strong>of</strong> Water Utilities<br />
PB 2<br />
1/1<br />
Wastewater<br />
Administration<br />
FY ’10<br />
1 Budgeted FTE<br />
2 Part Time<br />
Legend<br />
Left number = 2009<br />
Right Number = <strong>2010</strong><br />
Assistant Director <strong>of</strong><br />
Water Utilities<br />
(Wastewater)<br />
PB 4<br />
1/1<br />
Part Time<br />
Account Clerk IV<br />
PG 33<br />
2/2<br />
G-95 Fiscal Year <strong>2010</strong> Annual Budget
Wastewater: Collection<br />
G-96 Fiscal Year <strong>2010</strong> Annual Budget
Wastewater: Treatment<br />
G-97 Fiscal Year <strong>2010</strong> Annual Budget
Wastewater: Wetlands<br />
FY09 FY10<br />
Personnel Current Proposed PG Salary Range<br />
Assistant Director <strong>of</strong> Water Utilities 1 1 PB4 62,598.00 ‐ 116,261.00<br />
ADMINISTRATION FULL TIME EMPLOYEES 1 1<br />
Manager <strong>of</strong> Wastewater Collection 1 1 60 54,579.20 ‐ 84,656.00<br />
Wastewater Collection Superintendent 1 1 58 51,979.20 ‐ 80,641.60<br />
Engineering Technician III ‐ Water 1 1 51 43,804.80 ‐ 67,974.40<br />
Warehouse Operations Technician II 1 1 33 28,246.40 ‐43,804.80<br />
Office Associate II 2 2 29 25,604.80 ‐ 39,748.80<br />
COLLECTION ADMINISTRATION FULL TIME EMPLOYEES 6 6<br />
Collection System Supervisor 1 1 51 43,804.80 ‐ 67,974.40<br />
Inspection '&' Sealing Technician 2 2 47 39,748.80 ‐ 61,630.40<br />
Water Utilities Pipefitter Foreman 2 2 45 37,835.20 ‐ 58,718.40<br />
Water Utilities Pipefitter II 5 5 36 30,388.80 ‐ 47,132.80<br />
Equipment Operator II Streets 4 4 33 28,246.40 ‐43,804.80<br />
Water Utilities Pipefitter I 3 3 31 26,894.40 ‐ 41,724.80<br />
Operations Support Technician I 1 1 24 22,692.80 ‐ 35,172.80<br />
SEWER MAINTENANCE FULL TIME EMPLOYEES 18 18<br />
Pumping Station Supervisor 1 1 49 41,724.80 ‐ 64,729.60<br />
Electrical Technician 2 3 45 37,835.20 ‐ 58,718.40<br />
Pump Station Equipment Mechanic I 1 0 38 31,907.20 ‐ 49,504.00<br />
Pumping Station Operator II 3 3 36 30,388.80 ‐ 47,132.80<br />
Pumping Station Operator I 3 3 31 26,894.40 ‐ 41,724.80<br />
Operations Support Technician I 1 2 24 22,692.80 ‐ 35,172.80<br />
PUMPING STATIONS FULL TIME EMPLOYEES 11 12<br />
G-98 Fiscal Year <strong>2010</strong> Annual Budget
Wastewater Utilities:<br />
Industrial Pretreatment Tech II 2 2 38 31,907.20 ‐ 49,504.00<br />
Industrial Pretreatment Technician I 1 1 36 30,388.80 ‐ 47,132.80<br />
PRETREATMENT FULL TIME EMPLOYEES 3 3<br />
Manager <strong>of</strong> Wastewater Treatment 1 1 60 54,579.20 ‐ 84,656.00<br />
Chief Wastewater Plant Operator 1 1 54 47,132.80 ‐ 73,153.60<br />
Wastewater Equipment Maintenance Supervisor 1 1 49 41,724.80 ‐ 64,729.60<br />
Wastewater Plant Supervisor 4 4 49 41,724.80 ‐ 64,729.60<br />
Wastewater Equipment Mechanic III 1 1 47 39,748.80 ‐ 61,630.40<br />
Electrical Technician 2 45 37,835.20 ‐ 58,718.40<br />
Wastewater Equipment Mechanic II 4 5 38 31,907.20 ‐ 49,504.00<br />
Wastewater Plant Operator II 6 6 38 31,907.20 ‐ 49,504.00<br />
W.CARL DICKS PLANT FULL TIME EMPLOYEES 20 19<br />
Chief Wastewater Plant Operator 1 1 54 47,132.80 ‐ 73,153.60<br />
Wastewater Plant Supervisor 4 4 49 41,724.80 ‐ 64,729.60<br />
Wastewater Plant Operator II 6 6 38 31,907.20 ‐ 49,504.00<br />
Operations Support Technician I 1 1 24 22,692.80 ‐ 35,172.80<br />
NORTHSIDE PLANT FULL TIME EMPLOYEES 12 12<br />
Wastewater Plant Operator II 3 3 38 31,907.20 ‐ 49,504.00<br />
WEST LAKELAND WASTELOAD FACILITY FT EMPLOYEES 3 3<br />
`<br />
Wastewater Chemist 1 1 56 49,504.00 ‐ 76,793.60<br />
Laboratory Technician II 3 3 38 31,907.20 ‐ 49,504.00<br />
LABORATORY FULL TIME EMPLOYEES 4 4<br />
Environmental Scientist 1 1 56 49,504.00 ‐ 76,793.60<br />
Environmental Technician III 1 1 45 37,835.20 ‐ 58,718.40<br />
Environmental Technician I 1 1 36 30,388.80 ‐ 47,132.80<br />
Equipment Operator I 1 1 29 25,604.80 ‐ 39,748.80<br />
Operations Support Technician I 1 1 24 22,692.80 ‐ 35,172.80<br />
WETLANDS MANAGEMENT FULL TIME EMPLOYEES 5 5<br />
Account Clerk IV 2 2 33 28,246.40 ‐43,804.80<br />
Laboratory Technician II 1 1 38 31,907.20 ‐ 49,504.00<br />
DCT/BCE Student 1 0 4 14,996.80 ‐ 21,590.40<br />
PART TIME EMPLOYEES 4 3<br />
TOTAL FTE WITH CONTRACT 85 84.5<br />
Water Utilities Pipefitter I 2 2 31 26,894.40 ‐ 41,724.80<br />
Operations Support Technician I 2 1 24 22,692.80 ‐ 35,172.80<br />
Account Clerk I 1 0 24 22,692.80 ‐ 35,172.80<br />
CONTRACT EMPLOYEES 5 3<br />
TOTAL FTE WITH CONTRACT 90 87.5<br />
G-99 Fiscal Year <strong>2010</strong> Annual Budget
Water: Administration<br />
G-100 Fiscal Year <strong>2010</strong> Annual Budget
Water: Distribution<br />
G-101 Fiscal Year <strong>2010</strong> Annual Budget
Water: Engineering<br />
G-102 Fiscal Year <strong>2010</strong> Annual Budget
Water: Production<br />
G-103 Fiscal Year <strong>2010</strong> Annual Budget
Water Utilities:<br />
FY09 FY10<br />
Personnel Current Proposed PG Salary Range<br />
Water Utilities Director 1 1 PB2 76,885.00 ‐ 142,802.00<br />
Assistant Director <strong>of</strong> Water Utilities 1 1 PB4 62,598.00 ‐ 116,261.00<br />
Chief Accountant 1 1 63 58,718.40 ‐91,083.20<br />
Environmental Coordinator 1 1 71 71,364.80 ‐ 110,697.60<br />
Computer Applications Specialist 1 1 54 47,132.80 ‐ 73,153.60<br />
Data Analyst II 1 1 42 35,172.80 ‐ 54,579.20<br />
Account Clerk IV 1 1 33 28,246.40 ‐43,804.80<br />
ADMINISTRATION FULL TIME EMPLOYEES 7 7<br />
Water Utilities Engineering Supervisor 1 1 74 76,793.60 ‐ 119,142.40<br />
Water Utility Construction Coordinator 1 1 71 71,364.80 ‐ 110,697.60<br />
Pr<strong>of</strong>essional Engineer ‐ Water 2 3 69 67,974.40 ‐ 105,435.20<br />
Engineer III ‐ Water 2 1 67 64,729.60 ‐ 100,401.60<br />
Engineering Technician Supervisor 1 1 58 51,979.20 ‐ 80,641.60<br />
Engineering Technician IV ‐ Water 3 3 56 49,504.00 ‐ 76,793.60<br />
Water Utilities New Growth Technician III 1 1 51 43,804.80 ‐ 67,974.40<br />
Engineering Technician III ‐ Water 1 1 51 43,804.80 ‐ 67,974.40<br />
Engineering Technician II ‐ Water 2 1 45 37,835.20 ‐ 58,718.40<br />
Utility Line Inspector 4 4 42 34,320.00 ‐ 51,958.40<br />
Engineering Technician I ‐ Water 2 3 38 31,907.20 ‐ 49,504.00<br />
Office Associate II 1 2 29 25,604.80 ‐ 39,748.80<br />
ENGINEERING FULL TIME EMPLOYEES 21 22<br />
Manager <strong>of</strong> Water Production 1 1 60 54,579.20 ‐ 84,656.00<br />
Water Chemist 1 1 56 49,504.00 ‐ 76,793.60<br />
Water Control Systems Program Integrator 1 1 56 49,504.00 ‐ 76,793.60<br />
Chief Water Plant Operator 2 2 54 47,132.80 ‐ 73,153.60<br />
Water Plant Supervisor 10 10 49 41,724.80 ‐ 64,729.60<br />
Electrical Technician 1 1 45 37,835.20 ‐ 58,718.40<br />
Water Plant Operator II 13 13 38 31,907.20 ‐ 49,504.00<br />
Water Plant Mechanic II 2 2 38 31,907.20 ‐ 49,504.00<br />
Water Plant Instrument/Control Technician II 1 1 45 37,835.20 ‐ 58,718.40<br />
Water Plant Instrument/Control Technician I 1 1 38 31,907.20 ‐ 49,504.00<br />
Office Associate II 2 2 29 25,604.80 ‐ 39,748.80<br />
Operations Support Technician I 2 2 24 22,692.80 ‐ 35,172.80<br />
PRODUCTION FULL TIME EMPLOYEES 37 37<br />
Manager <strong>of</strong> Water Distribution 1 1 60 54,579.20 ‐ 84,656.00<br />
Engineering Technician IV ‐ Water 1 1 56 49,504.00 ‐ 76,793.60<br />
Water Distribution Supervisor 2 2 54 47,132.80 ‐ 73,153.60<br />
Engineering Technician III ‐ Water 2 2 51 43,804.80 ‐ 67,974.40<br />
Materials Planner 1 1 47 39,748.80 ‐ 61,630.40<br />
Water Meter Repairer Foreman 2 2 45 37,835.20 ‐ 58,718.40<br />
Water Utilities Pipefitter Foreman 6 6 45 37,835.20 ‐ 58,718.40<br />
Water Meter Repairer II 11 12 36 30,388.80 ‐ 47,132.80<br />
Water Utilities Pipefitter II 22 22 36 30,388.80 ‐ 47,132.80<br />
Account Clerk IV 1 1 33 28,246.40 ‐43,804.80<br />
Account Clerk III 1 1 29 25,604.80 ‐ 39,748.80<br />
Office Associate II 1 1 29 25,604.80 ‐ 39,748.80<br />
Traffic Control Technician 4 4 22 21,590.40 ‐ 33,508.80<br />
DISTRIBUTION FULL TIME EMPLOYEES 55 56<br />
DCT/BCE Student 2 2 4 14,996.80 ‐ 21,590.40<br />
PART TIME EMPLOYEES 2 2<br />
TOTAL FTE: 121 123<br />
G-104 Fiscal Year <strong>2010</strong> Annual Budget
THIS PAGE IS INTENTIONALLY BLANK<br />
G-105 Fiscal Year <strong>2010</strong> Annual Budget
<strong>City</strong> <strong>of</strong> <strong>Lakeland</strong>, Florida<br />
228 South Massachusetts Avenue<br />
<strong>Lakeland</strong>, Florida 33801-5086<br />
www.lakelandgov.net<br />
863-834-6000