Global Export Forecast - Export Development Canada (EDC)
Global Export Forecast - Export Development Canada (EDC)
Global Export Forecast - Export Development Canada (EDC)

You also want an ePaper? Increase the reach of your titles
YUMPU automatically turns print PDFs into web optimized ePapers that Google loves.
Anchors Aweigh?<br />
<strong>Global</strong> <strong>Export</strong> <strong>Forecast</strong><br />
Spring 2012
E X P O R T F O R E C A S T O V E R V I E W 2 0 1 2<br />
1.0 GEF Executive Summary<br />
2.0 Country Overviews<br />
3.0 Sector Overview<br />
<strong>EDC</strong> Economics<br />
Peter Hall, Vice-President and Chief Economist<br />
Tina Drew, Administrator<br />
4.0 Provincial <strong>Export</strong> Outlook<br />
5.0 Annexes<br />
Economics and Political Intelligence Centre<br />
Stuart Bergman<br />
John Bitzan<br />
Jérôme Bourque<br />
Hendrik Brakel<br />
Catherine Couture<br />
Nadia Frazzoni<br />
Andrea Gardella<br />
Barbara Grinfeld<br />
Veronica Lares<br />
Todd MacDonald<br />
Aimee Rae<br />
Indika Joy Rankothge<br />
Jorge Andres Rave<br />
Richard Schuster<br />
Geoff Stone<br />
Ian Tobman<br />
Peter Whelan<br />
BACK TO TABLE OF CONTENTS 1
E X P O R T F O R E C A S T O V E R V I E W 2 0 1 2<br />
1.0 GEF Executive Summary<br />
2.0 Country Overviews<br />
3.0 Sector Overview<br />
4.0 Provincial <strong>Export</strong> Outlook<br />
5.0 Annexes<br />
Table of Contents<br />
1.0 GEF Executive Summary ................................................................................................... 4<br />
1.1 Hard Landing in the BRICs? Not Likely ....................................................................... 8<br />
1.2 Drag and Drop? – Fiscal Austerity and the World Economy ........................................ 9<br />
1.3 Eurozone: Reprieve…For Now .................................................................................... 11<br />
1.4 Iran Jitters ................................................................................................................... 13<br />
2.0 Country Overviews ............................................................................................................ 15<br />
2.1 Brazil ........................................................................................................................... 16<br />
2.2 <strong>Canada</strong> ........................................................................................................................ 17<br />
2.3 China ........................................................................................................................... 18<br />
2.4 Euro Area ..................................................................................................................... 19<br />
2.5 India ............................................................................................................................. 20<br />
2.6 Japan ........................................................................................................................... 21<br />
2.7 Mexico .......................................................................................................................... 22<br />
2.8 Russian Federation ...................................................................................................... 23<br />
2.9 South Africa .................................................................................................................. 24<br />
2.10 United States................................................................................................................ 25<br />
3.0 Sector Overview ................................................................................................................. 26<br />
3.1 Energy .......................................................................................................................... 28<br />
3.2 Ores and Metals ........................................................................................................... 29<br />
3.3 Agri-Food ..................................................................................................................... 30<br />
3.4 Fertilizers ...................................................................................................................... 31<br />
3.5 Forestry Products ......................................................................................................... 32<br />
3.6 Automotive ................................................................................................................... 33<br />
3.7 Industrial Machinery and Equipment ............................................................................ 34<br />
3.8 Advanced Technology .................................................................................................. 35<br />
3.9 Aerospace .................................................................................................................... 36<br />
3.10 Chemicals and Plastics ................................................................................................ 37<br />
3.11 Consumer Goods ......................................................................................................... 38<br />
3.12 Services <strong>Export</strong> Sector................................................................................................. 39<br />
BACK TO TABLE OF CONTENTS 2
E X P O R T F O R E C A S T O V E R V I E W 2 0 1 2<br />
1.0 GEF Executive Summary<br />
2.0 Country Overviews<br />
3.0 Sector Overview<br />
4.0 Provincial <strong>Export</strong> Outlook<br />
5.0 Annexes<br />
4.0 Provincial <strong>Export</strong> Outlook ................................................................................................. 40<br />
4.1 Newfoundland and Labrador ........................................................................................ 43<br />
4.2 Prince Edward Island ................................................................................................... 44<br />
4.3 Nova Scotia .................................................................................................................. 45<br />
4.4 New Brunswick ............................................................................................................. 46<br />
4.5 Quebec......................................................................................................................... 47<br />
4.6 Ontario ......................................................................................................................... 48<br />
4.7 Manitoba ...................................................................................................................... 49<br />
4.8 Saskatchewan .............................................................................................................. 50<br />
4.9 Alberta .......................................................................................................................... 51<br />
4.10 British Columbia ........................................................................................................... 52<br />
5.0 Annexes .............................................................................................................................. 53<br />
5.1 Experience and Attitude ............................................................................................... 54<br />
5.2 Payment Risk Maps ..................................................................................................... 75<br />
BACK TO TABLE OF CONTENTS 3
E X P O R T F O R E C A S T O V E R V I E W 2 0 1 2<br />
1.0 GEF Executive Summary<br />
1.0 GEF Executive Summary<br />
1.1 Hard Landing in the BRICs?<br />
Not Likely<br />
1.2 Drag and Drop? –<br />
Fiscal Austerity and<br />
the World Economy<br />
1.3 Eurozone: Reprieve…<br />
For Now<br />
1.4 Iran Jitters<br />
2.0 Country Overviews<br />
3.0 Sector Overview<br />
4.0 Provincial <strong>Export</strong> Outlook<br />
5.0 Annexes<br />
BACK TO TABLE OF CONTENTS 4
E X P O R T F O R E C A S T O V E R V I E W 2 0 1 2<br />
1.0 GEF Executive Summary<br />
1.1 Hard Landing in the BRICs?<br />
Not Likely<br />
1.2 Drag and Drop? –<br />
Fiscal Austerity and<br />
the World Economy<br />
1.3 Eurozone: Reprieve…<br />
For Now<br />
1.4 Iran Jitters<br />
2.0 Country Overviews<br />
3.0 Sector Overview<br />
4.0 Provincial <strong>Export</strong> Outlook<br />
5.0 Annexes<br />
Anchors Aweigh?<br />
Where is the world economy headed? If forecasting is a tricky business at the best of times, then the<br />
last 4 years take the cake. Pundits can gauge conditions and make their best call, but they all rely<br />
on a good dose of ceteris paribus – conditions being normal enough that the rules in the economic<br />
models are obeyed. But conditions have been far from normal for a long time. A growing list of events<br />
unprecedented in our time – or ever – is complicating the forecaster’s craft, and testing the profession’s<br />
credibility.<br />
Unprecedented events<br />
Consider the length of the last global growth cycle – at about 16 years, twice normal. This duped<br />
many into thinking that recessions were a thing of the past. The Great Recession, the worst in over<br />
60 years, traded the poise for panic overnight, and sent world leaders scrambling for solutions. The<br />
policy response was impressive, and for its size, scale and swiftness, likely has no peer in human<br />
history. Its impact created the illusion of recovery, but 6 months later the spurt fi zzled and ever since, a<br />
highly unusual phase of on-again, off-again growth has prevailed.<br />
A long list of risks<br />
The risk list isn’t helping. Financial near-collapse and fi scal splurging saw OECD economies’ public<br />
debt levels soar to unthinkable heights, and now the most fragile of these – mostly in Southern Europe<br />
– threaten to undermine the entire global economy. This is terrible news for a Western fi nancial system<br />
that was weak before the onset of recession. If either of these issues turns nasty, there is very little left<br />
in the kitty to re-stimulate growth. Oil prices are a further bugbear, spiking this time around in response<br />
to Iran’s sabre rattling. Slowing emerging markets have only perpetuated an unusually pervasive and<br />
long-standing sense of unease.<br />
Slower performance<br />
Current conditions are weighing more heavily on some. Staggering under the burden of its most indebted<br />
nations, Europe’s response is immediate austerity. Whether this move ends up instilling confi dence and<br />
restoring economic activity remains to be seen. Huge cutbacks in an imbalanced economy can easily<br />
drive things further downward. Measures have already taken effect, and the result is almost certainly a<br />
pan-European double-dip recession. Thus far, efforts to ring-fence the problem in the peripheral nations<br />
have minimized the global impact of the Eurozone debacle.<br />
Western woes shifted sights to emerging markets as an antidote. That hope was short-lived. The<br />
mighty BRIC (Brazil, Russia, India, China) nations have each tasted slowdown in the past 6 months.<br />
In the absence of strong OECD growth, China has relied heavily on public stimulus, and recent policy<br />
tightening has dampened growth. Internal capacity problems are behind the slowdowns in India and<br />
Brazil, while Russia’s close ties with Europe are weighing down its prospects.<br />
A “new normal”?<br />
Yet another wave of slowing has left the world jaded. Many have the impression that capitalism has<br />
failed, that the policy response has likewise failed, and that emerging market growth leaders have<br />
fi zzled at just the wrong time. Discouraged, many have become resigned to a slow-growth scenario<br />
that is increasingly referred to as the “new normal.” This can be a dangerous shift; after all, it was a<br />
similar psychological shift that perpetuated the Great Depression. Is sluggish growth truly the best we<br />
can expect over the near term?<br />
BACK TO TABLE OF CONTENTS 5
E X P O R T F O R E C A S T O V E R V I E W 2 0 1 2<br />
1.0 GEF Executive Summary<br />
1.1 Hard Landing in the BRICs?<br />
Not Likely<br />
1.2 Drag and Drop? –<br />
Fiscal Austerity and<br />
the World Economy<br />
1.3 Eurozone: Reprieve…<br />
For Now<br />
1.4 Iran Jitters<br />
2.0 Country Overviews<br />
3.0 Sector Overview<br />
4.0 Provincial <strong>Export</strong> Outlook<br />
5.0 Annexes<br />
Thankfully, not everyone is slowing. Japan is recovering from last year’s devastation, and restored<br />
business volumes together with reconstruction will lift growth. But the surge won’t last; true momentum<br />
will have to come from some other source. Is the US economy up to the task? In spite of popular<br />
sentiment, thus far, it seems so. First, consider that current US growth is broadly based: it is occurring<br />
(sustainably this time) in consumer spending, in the beleaguered housing market, in industrial<br />
production, and is being boosted by rapid export growth. Second, it is also occurring without new,<br />
aggressive stimulus measures. Third, growth is rising in spite of persistent pessimism. And fi nally,<br />
growth is occurring in spite of weakening in the rest of the world. Momentum this strong that rises<br />
against the odds suggests that the US economy – long shackled to levels of activity well below average<br />
– has gone a long way to exhausting its pre-recession excesses, and is rising back up to normal levels<br />
– “old normal” levels, in actual fact.<br />
Will this momentum persist? Here is today’s key question. The world economy is presently like a hotair<br />
balloon, fi lled, fi red up and ready to take off. But strong ropes are holding overall progress back. If<br />
the ropes prevail until the fuel is exhausted, then the fl ight will be short. But evidence suggests there is<br />
plenty of fuel: even with recent growth, the US economy is still operating well below normal, so there<br />
is still lots of immediate potential. This is backed up by growing evidence of pent-up demand in key<br />
sectors. As such, it will take a pretty nasty turn of events to engineer a US about-face.<br />
World forecast numbers may seem humdrum, but the details are anything but. While the Eurozone<br />
sees outright contraction of 0.3 per cent, the US will enjoy 2.6% growth this year. As recovery sets in,<br />
the US economy is forecast to rise 3% next year, even as fi scal contraction takes more than 1% away<br />
from GDP growth – implying none too subtly that underlying growth is much more aggressive than<br />
the headline numbers suggest. Europe will benefi t from this upsurge, but continued austerity will limit<br />
growth to 0.7%. At the same time, emerging markets will see growth slow to 5.1% this year before rising<br />
again to 5.7% collectively in 2013.<br />
Many expect that recovery spells higher commodity prices. Economic downturn caused commodity<br />
inventories to surge, but surprisingly, prices did not swoon for long. Fiscal stimulus created a false<br />
recovery that revived fallen prices, and huge liquidity injections – money that found few normal channels<br />
into the regular economy – were parked in various investments. This has in all likelihood supported<br />
today’s commodity prices, and if so, when normal fl ows of cash resume, prices will correct. As we move<br />
closer to 2013, we expect oil and base metal prices to ease, further aiding the recovery.<br />
<strong>Canada</strong>’s commodity producers may balk, but price levels will still be high enough to keep most projects<br />
viable. Lower prices will help other exporters by weakening the loonie. The economy as a whole will<br />
benefi t, as it will rely more on international trade in the coming years. <strong>Canada</strong>’s domestic economy –<br />
particularly consumption, housing and the government sector – has been unusually strong during the<br />
recession period. However, high consumer debt, an overbought housing market and fi scal withdrawal<br />
together suggest a weak near-term domestic outlook.<br />
Thus far, things are looking good for trade. <strong>Export</strong> momentum is outstanding – merchandise exports<br />
are already up 5.3% over last year’s levels, and any further growth this year will move the fi gure higher.<br />
US momentum suggests that there is indeed more growth ahead for exporters of services and raw,<br />
intermediate and fi nished Canadian goods. <strong>Export</strong>ers will also benefi t from continued diversifi cation<br />
of sales into fast-growing emerging markets. All told, Canadian exports are projected to rise 7.1% this<br />
year and 7.3% in 2013, following 10.8% growth in 2011. All of <strong>Canada</strong>’s regions and the bulk of its<br />
broad industry sectors will participate in this good-news story.<br />
The bottom line? It may not look great on the surface, but behind what many are calling “new normal”<br />
growth is a faster-paced global economy, full of opportunity. This underlying dynamic is enabling the<br />
world economy to weigh anchor on its next growth phase. <strong>Canada</strong> stands to benefi t for a number of<br />
reasons. In fact, our greatest challenge may well be fi nding the means to accommodate the growth we<br />
see in the next cycle.<br />
BACK TO TABLE OF CONTENTS 6
E X P O R T F O R E C A S T O V E R V I E W 2 0 1 2<br />
1.0 GEF Executive Summary<br />
1.1 Hard Landing in the BRICs?<br />
Not Likely<br />
1.2 Drag and Drop? –<br />
Fiscal Austerity and<br />
the World Economy<br />
1.3 Eurozone: Reprieve…<br />
For Now<br />
1.4 Iran Jitters<br />
2.0 Country Overviews<br />
3.0 Sector Overview<br />
4.0 Provincial <strong>Export</strong> Outlook<br />
5.0 Annexes<br />
Table 1: <strong>Global</strong> GDP <strong>Forecast</strong> by Country (Growth)<br />
Top Markets Market Share of <strong>Export</strong> Outlook<br />
World Economy<br />
(% growth)<br />
2010 2011 2012(f) 2013(f)<br />
NAFTA 22.1 2.0 2.6 3.0<br />
United States 18.4 1.8 2.6 3.0<br />
<strong>Canada</strong> 1.7 2.3 2.0 2.2<br />
Mexico 2.0 4.1 3.3 3.4<br />
Western Europe 17.7 1.6 -0.0 0.8<br />
United Kingdom 2.8 0.9 0.2 0.5<br />
EA 13.5 1.6 -0.3 0.7<br />
Western Europe non-EMU & Scandinavia 1.5 2.6 2.1 2.6<br />
Japan 5.5 -0.9 1.7 1.6<br />
Australia & New Zealand 1.3 1.8 3.1 3.2<br />
Emerging ASIA 22.6 7.9 7.1 7.9<br />
China,P.R.: Mainland 12.8 9.2 7.7 8.7<br />
India 5.1 7.4 7.3 7.9<br />
ASEAN-5 3.1 4.8 5.3 5.7<br />
Other East Asia & Pacifi c 0.5 6.4 6.2 6.6<br />
Other South Asia 1.1 5.0 4.2 5.3<br />
Asian NIEs 3.7 3.9 3.8 4.4<br />
Emerging Europe & Central Asia 7.5 4.2 3.4 3.9<br />
Russia 2.8 4.1 3.7 3.9<br />
Latin America (incl. Mexico) 8.1 4.4 3.7 3.9<br />
South America 5.6 4.7 3.8 4.1<br />
Argentina 0.8 8.9 3.8 3.4<br />
Brazil 2.8 2.7 3.1 4.1<br />
Central America and the Caribbean 0.6 3.3 4.0 4.4<br />
Middle East & North Africa 4.7 3.7 3.9 4.2<br />
Sub-Saharan Africa 2.0 4.9 4.9 5.2<br />
Industrialized Countries 48.3 1.6 1.5 2.1<br />
Developing Countries 51.7 6.2 5.1 5.7<br />
Total <strong>Global</strong> Economy 100.0 3.8 3.4 3.9<br />
Source: <strong>EDC</strong> Economics. 2011 is actual data, 2012 and 2013 are forecast.<br />
Asian Newly Industrialized Economies (NIEs) are Hong Kong, Singapore, South Korea and Taiwan. ASEAN-5 are Malaysia, Thailand,<br />
Indonesia, Philippines and Viet Nam.<br />
Note - GDP history growth is based on IMF PPP weights.<br />
Table 2: Canadian Merchandise <strong>Export</strong>s <strong>Forecast</strong> by Country<br />
Top Markets CAD bn % Share of <strong>Export</strong> Outlook<br />
Total <strong>Export</strong>s<br />
(% growth)<br />
2010 2011 2011 2012(f) 2013(f)<br />
Developed Markets<br />
United States 307.2 73.4 9.9 7.9 7.2<br />
Western Europe 40.8 9.8 14.9 2.4 7.0<br />
Japan, Oceania & Developed Asia 22.8 5.4 24.4 8.1 8.2<br />
Emerging Markets<br />
Latin America & Caribbean 12.8 3.1 12.7 6.5 7.4<br />
Emerging Europe and Central Asia 4.0 1.0 23.7 7.9 10.2<br />
Africa & the Middle East 6.5 1.6 3.9 6.8 5.6<br />
Emerging Asia 24.5 5.9 24.0 12.9 16.6<br />
Total Goods <strong>Export</strong>s 418.8 100.0 11.9 7.6 7.8<br />
Total Emerging Markets 47.9 11.4 17.7 9.9 12.2<br />
Total to Industrialized Countries 370.8 88.6 11.2 7.3 7.2<br />
Source: Statistics <strong>Canada</strong>, <strong>EDC</strong> Economics. 2011 is actual data, 2012 and 2013 are forecast.<br />
BACK TO TABLE OF CONTENTS 7
E X P O R T F O R E C A S T O V E R V I E W 2 0 1 2<br />
1.0 GEF Executive Summary<br />
1.1 Hard Landing in the BRICs?<br />
Not Likely<br />
1.2 Drag and Drop? –<br />
Fiscal Austerity and<br />
the World Economy<br />
1.3 Eurozone: Reprieve…<br />
For Now<br />
1.4 Iran Jitters<br />
2.0 Country Overviews<br />
3.0 Sector Overview<br />
4.0 Provincial <strong>Export</strong> Outlook<br />
5.0 Annexes<br />
1.1 Hard Landing in the BRICs? Not Likely<br />
With the EU still putting out fires and anticipating anemic growth over the coming period and the US not<br />
far removed from 9% unemployment and losing its top credit rating, prospects in the BRIC countries<br />
have gained new importance. The numbers reveal a BRIC slowdown for both external and domestic<br />
reasons, with important global implications. In the current context, will the stars of the last decade<br />
continue to power growth, or are they fading?<br />
China is slowing, thanks to a weakening residential property market and concerns over much slower<br />
import demand from Europe. These two factors are key elements pushing China’s growth down from<br />
9.2% last year to 7.7% in 2012. According to the IMF, a further worsening of the situation in the Eurozone<br />
in the form of a sovereign default or a collapse of a major fi nancial institution would pull growth down to<br />
4% this year for China, well below the recession-mark – and invite a global recession. However, China<br />
is fully expected to sidestep such an outcome: a new and untested Chinese leadership can afford, and<br />
would undoubtedly provide, stimulus to avoid such an event and the domestic unrest it would unleash.<br />
Russia is highly sensitive to the cold spell descending upon Europe. With the Eurozone accounting for<br />
almost 50% of Russia’s trade and EU members making up 75% of FDI into Russia, <strong>EDC</strong> Economics<br />
growth outlook for the country is down to 3.7% for this year. Although Vladimir Putin’s re-election has<br />
reduced short-term political uncertainty, his continued ability to rein in domestic opposition through<br />
a large increase in social spending (totaling $160 billion) will be dependent upon the fl uctuations of<br />
energy and commodity prices. Betting on the sustainability of $120 per barrel of oil, which Russia would<br />
need to balance its budget, begins to raise concerns over its fi scal and economic stability in the medium<br />
term. Again, public stimulus, which Russia can also afford in the short term, would save the day in the<br />
event of sharply slower growth.<br />
Although the Brazilian economy accelerated slightly in the 4th quarter of 2011, GDP grew by only 2.7%<br />
year-to-year, a far cry from the explosive 7.5% rate in 2010. External shocks are less of an issue in Brazil<br />
– despite growing trade links with China, total trade accounts for only 20% of GDP. Brazil’s diffi culties<br />
are more on the home front. Severe policy tightening has been effective – perhaps too effective – in<br />
cooling the domestic economy. The government now fi nds itself trying to re-stimulate consumption,<br />
the main engine of growth, through signifi cant fi scal and monetary policy moves. This is expected to<br />
forestall a more dramatic slowing, but won’t be enough to keep Brazil from weak performance in the<br />
3% range this year.<br />
And what about the promising Indian economy? Like Brazil, slowing growth is more of an internal<br />
issue. Political gridlock in Delhi – one of the main impediments to growth and nothing new to India – is<br />
only increasing with the recent success of regional parties. Recent corruption scandals and failure to<br />
signifi cantly improve the regulatory and business environment are impeding the attraction of foreign<br />
investment. Moreover, the European crisis has compromised access to long-term capital from European<br />
fi nancial institutions, threatening the implementation of key investment projects. Even so, there is still<br />
enough domestic momentum to prevent a hard landing. But if India’s progress on structural changes is<br />
interrupted more permanently, the darling of the BRICs may lose some luster.<br />
While a sharp slowing of the BRICs would almost certainly mean global recession, the likelihood is<br />
low; gradual slowdown followed by public stimulus will avoid a messy outcome. Weaker performance<br />
will take some pressure off commodity prices, a help to the US and other developed markets. In the<br />
medium term, slowing is also an opportunity for the BRIC countries to retool their economic policies in<br />
order to build more stable and sustainable growth.<br />
The temporary wobble in emerging markets demonstrates that, while their superior “catch-up” growth<br />
is boosting world growth, further development is needed before they will assume “engine” status.<br />
Fortunately, they have enough in their coffers to keep them going until the true engines get going.<br />
BACK TO TABLE OF CONTENTS 8
E X P O R T F O R E C A S T O V E R V I E W 2 0 1 2<br />
1.0 GEF Executive Summary<br />
1.1 Hard Landing in the BRICs?<br />
Not Likely<br />
1.2 Drag and Drop? –<br />
Fiscal Austerity and<br />
the World Economy<br />
1.3 Eurozone: Reprieve…<br />
For Now<br />
1.4 Iran Jitters<br />
2.0 Country Overviews<br />
3.0 Sector Overview<br />
4.0 Provincial <strong>Export</strong> Outlook<br />
5.0 Annexes<br />
1.2 Drag and Drop? – Fiscal Austerity and the World Economy<br />
World governments are tightening their belts to get defi cits under control, but this comes at a tough time<br />
for an already-vulnerable global economy. The IMF reports that the world itself will be heading into two<br />
more years of austerity with government trying to reign in expenditure. With governments around the<br />
world cutting back, what are the knock-on effects that will affect the global economy?<br />
According to the IMF, the answer depends on whether one is looking at the short-term or long-term<br />
effects. In the long term, reducing debt raises output by lowering real interest rates and providing fi scal<br />
opportunities for cutting distortionary taxes – effectively increasing output. However, the same models<br />
suggest that cutbacks equal to 1% of GDP can have painful short-term effects, most notably, reducing<br />
output by up to 2%, and raising unemployment rates by 0.3% or more. Fortunately for the global<br />
economy, fi scal consolidation and the resulting fi scal drag will blanket the world in a highly uneven<br />
manner.<br />
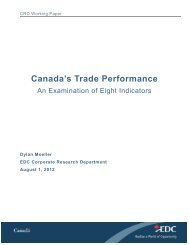
Government spending is forecast to decline by 0.9% of global GDP in 2012 and 2013, which could have<br />
signifi cant growth dampening effects, but these cutbacks are not happening to the same degree across<br />
the board. Unsurprisingly, the most signifi cant cuts are occurring in the advanced economies where<br />
defi cits are projected at 5.2% of GDP this year and 4% in 2013. To address these defi cits, advanced<br />
economies will cut expenditures by 1.3% and 1.2% of GDP in 2012 and 2013, respectively. Leading<br />
the way in this exercise of fi scal austerity is the European Union (EU) with expected cuts amounting to<br />
1% of GDP in 2012 and 0.8% in 2013. As the EU faces a recession this year and tepid growth in 2013,<br />
these cuts will act as an added drag on its stagnating economies.<br />
In stark contrast to the advanced economies, emerging markets will run defi cits of only 1.7% of their<br />
GDP in 2012 and 1.4% in 2013. In these markets there will be modest fi scal consolidation, resulting in<br />
meager defi cit reduction fi gures: 0.1% of GDP this year and 0.4% for the next. With much faster GDP<br />
growth, forecast to reach 5.4% in 2012 and 5.9% in 2013, this belt-tightening can be easily absorbed.<br />
Emerging economies will not be evenly affected by fi scal consolidation. For example, in the Middle<br />
East and North Africa government expenditure will actually increase by 1.4% this year with expected<br />
budget surpluses during this period, driven by oil prices. On the other side of the globe, Central Asia<br />
and Russia are forecast to continue spending too, with defi cits increasing collectively by 0.6% of GDP<br />
in 2012 and 0.2% in 2013.<br />
This is not to suggest that all emerging economies are spending freely. Latin America and the Caribbean<br />
will see defi cits fall from 2.5% of GDP this year to 2.1% in the next, and austerity measures will be<br />
modest, estimated at 0.0% of GDP in 2012 and 0.4% in 2013. In sub-Saharan Africa where cutbacks<br />
could reach 0.8% and 0.3% of GDP in 2012 and 2013, GDP growth is forecast to grow at a robust rate<br />
of 5.5% and 5.3% between now and 2013.<br />
Finally, developing Asia is projected to run defi cits amounting to 2.3% in 2012 and 1.8% in 2013 of<br />
their GDP, with government expenditures declining by 0.6% of GDP now and 0.5% in 2013. With GDP<br />
growth projected at 7.3% and 7.8% in 2012 and 2013, the impact appears negligible. In addition,<br />
because government balance sheets are in great shape with low debt levels, countries like China have<br />
room for fi scal stimulus in the event of slowdown.<br />
BACK TO TABLE OF CONTENTS 9
E X P O R T F O R E C A S T O V E R V I E W 2 0 1 2<br />
1.0 GEF Executive Summary<br />
1.1 Hard Landing in the BRICs?<br />
Not Likely<br />
1.2 Drag and Drop? –<br />
Fiscal Austerity and<br />
the World Economy<br />
1.3 Eurozone: Reprieve…<br />
For Now<br />
1.4 Iran Jitters<br />
2.0 Country Overviews<br />
3.0 Sector Overview<br />
4.0 Provincial <strong>Export</strong> Outlook<br />
5.0 Annexes<br />
A few conclusions from this overview of government spending are evident: fi rst, the onus will be more<br />
on the private sector to pick up the slack in advanced economies where fi scal drag will be felt most;<br />
second, relatively robust growth in most emerging markets should continue, keeping opportunities<br />
open for Canadian businesses; third, fi scal consolidation should serve most regions well in the medium<br />
to long term by addressing structural imbalances and creating an economic environment ready to<br />
foster growth. Overall, global austerity is already beginning to exact less from the global economy,<br />
easing back from 1.4% of the world’s GDP in 2010 to only 0.9% this year – a trend that will hopefully<br />
continue. However, these cutbacks come during a delicate time for the world economy, especially after<br />
the aggressive public spending cuts last year. The global economy will still be swimming against this<br />
current of austerity, but hopefully it will weather the short-term pain for the long-term gain of returning<br />
to a state of balance.<br />
Figure 1: Government Budget Balances (% of GDP)<br />
0.0<br />
-1.0<br />
-2.0<br />
-3.0<br />
-4.0<br />
-5.0<br />
-6.0<br />
-7.0<br />
-8.0<br />
-9.0<br />
-10.0<br />
World<br />
Advanced economies<br />
Emerging and developing economies<br />
2009 2010 2011 2012(f) 2013(f)<br />
Source: IMF/WEO<br />
Figure 2: Changes in Government Budget Balances (% of GDP)<br />
2.0<br />
1.5<br />
1.0<br />
2012<br />
2013<br />
0.5<br />
-0.5<br />
-1.0<br />
-1.5<br />
-2.0<br />
World<br />
Advanced economies<br />
Source: IMF/WEO<br />
Euro area<br />
Major advanced economies (G7)<br />
Newly industrialized Asian economies<br />
Other advanced economies<br />
European Union<br />
Emerging and deveoping economies<br />
Central and eastern Europe<br />
Commonwealth of Independent States<br />
Developing Asia<br />
ASEAN-5<br />
Latin America and the Caribbean<br />
Middle East and North Africa<br />
Sub-Saharan Africa<br />
BACK TO TABLE OF CONTENTS 10
E X P O R T F O R E C A S T O V E R V I E W 2 0 1 2<br />
1.0 GEF Executive Summary<br />
1.1 Hard Landing in the BRICs?<br />
Not Likely<br />
1.2 Drag and Drop? –<br />
Fiscal Austerity and<br />
the World Economy<br />
1.3 Eurozone: Reprieve…<br />
For Now<br />
1.4 Iran Jitters<br />
2.0 Country Overviews<br />
3.0 Sector Overview<br />
4.0 Provincial <strong>Export</strong> Outlook<br />
5.0 Annexes<br />
1.3 Eurozone: Reprieve…For Now<br />
After a year of crisis and calamity in Europe, for now the storm seems to have passed. Equity markets<br />
are up with the FTSE Eurofi rst 300 at its highest level since July, while sovereign bond yields are down<br />
sharply. Markets breathed a huge sigh of relief on February 21 when Eurozone Finance Ministers<br />
signed off on the second €130 billion rescue package for Greece. The European Central Bank has<br />
also taken bold steps lending over €1 trillion of cheap three-year loans to hundreds of banks since<br />
December.<br />
As a result, the risk of a disorderly default has been taken off the table for now. European banks, even<br />
the risky ones, are now fl ush with cash, making it unlikely that a Lehman-style fi nancial crisis will occur.<br />
Also, many banks have used the extra cash to buy sovereign debt, so government bond yields have<br />
fallen to more manageable levels. Spanish and Italian yields are now below 5%, down from peaks of<br />
7.3% for Italy and 6.7% for Spain. So, has the problem been solved or just delayed?<br />
Start with Greece, which just came through the largest debt restructuring in history. The 70% haircut<br />
on sovereign bonds held by the private sector will cut Greek debt by around €105 billion, although it is<br />
to be replaced by €130 billion of new lending under the generous terms of the new bailout package.<br />
Even the optimistic scenario has public debt reaching 120.5% of GDP by 2020. If tough austerity<br />
continues to hurt the Greek economy, debt could be back above 160% of GDP within a few years and<br />
possibly require another bailout. Markets are deeply skeptical. Restructuring saw the yield on Greek<br />
10-year bonds drop from 40% to 19%, an improvement, but under the circumstances, a substantial risk<br />
premium that prices in a high likelihood of future default. Why so glum?<br />
The European experience with austerity has taught us that if fi scal consolidation is challenging when<br />
economies are growing, it is extraordinarily diffi cult during a downturn. The more governments cut<br />
spending and raise taxes, the more they depress already anemic growth. Europe is headed for a tough<br />
recession in 2012 as growth turned negative in the 4th quarter of 2011, and is likely to stay fl at or in<br />
the red for most of this year. Our forecast for Eurozone GDP is a 0.3% contraction in 2012 and 0.7%<br />
growth the following year. But this masks a considerable divergence between the core, which will be<br />
fl at to slightly positive, and the very tough recessions on the periphery.<br />
Figure 3: Real GDP Growth (%)<br />
4.0%<br />
2.0%<br />
2011 2012(f) 2013(f)<br />
0.0%<br />
-2.0%<br />
-4.0%<br />
-6.0%<br />
-8.0%<br />
Germany France Netherlands Euro Area Ireland Italy Spain Portugal Greece<br />
Source: IMF/WEO<br />
BACK TO TABLE OF CONTENTS 11
E X P O R T F O R E C A S T O V E R V I E W 2 0 1 2<br />
1.0 GEF Executive Summary<br />
1.1 Hard Landing in the BRICs?<br />
Not Likely<br />
1.2 Drag and Drop? –<br />
Fiscal Austerity and<br />
the World Economy<br />
1.3 Eurozone: Reprieve…<br />
For Now<br />
1.4 Iran Jitters<br />
2.0 Country Overviews<br />
3.0 Sector Overview<br />
4.0 Provincial <strong>Export</strong> Outlook<br />
5.0 Annexes<br />
In order to get back to growth, the<br />
countries of peripheral Europe<br />
Figure 4: GDP Deflators (1999 = 100)<br />
must become competitive after 150.0<br />
years of lost ground. A decade<br />
of high infl ation and credit-fuelled<br />
145.0<br />
spending raised input and labour 140.0<br />
costs by 35-40% in peripheral<br />
Europe, while these costs rose<br />
135.0<br />
just 6% in Germany. Locked in 125.0<br />
to the euro, for these countries<br />
devaluation is not an option. Are<br />
115.0<br />
there alternatives? Internal defl ation 110.0<br />
is one option: years of persistently<br />
high unemployment can gradually<br />
105.0<br />
reduce wages across the board<br />
100.0<br />
and get them back to competitive<br />
levels. The alternative is to pull off<br />
a productivity miracle. In the<br />
Source: Haver Analytics, IMF/WEO<br />
absence of miracles, it looks like Peripheral Europe is destined for a multi-year recession.<br />
1999<br />
2000<br />
2001<br />
2002<br />
2003<br />
2004<br />
2005<br />
2006<br />
2007<br />
2008<br />
2009<br />
2010<br />
2011<br />
Greece<br />
Ireland<br />
Portugal<br />
Spain<br />
Italy<br />
France<br />
Germany<br />
Another important lesson from the 2008 crisis is that it’s diffi cult to achieve growth with an impaired<br />
fi nancial sector, as credit is the lifeblood of the economy. European banks have been pulled back<br />
from the brink by the ECB’s generous $1 trillion of liquidity, but they remain under strain. They must<br />
contend with losses on sovereign debt, rising provisions for impaired loans in a tough economy, multiple<br />
downgrades from rating agencies, all while raising their tier-1 capital ratios to 9% by July 2013. This<br />
means either raising additional equity, not an easy task even for the strongest banks in such a stressed<br />
environment, or shrinking the asset side of the balance sheet by restraining new lending and/or selling<br />
off assets. As a result, Europe is suffering from a credit crunch as banks deleverage and the latest ECB<br />
Bank lending survey shows severe tightening of bank credit standards.<br />
As such, Peripheral Europe must balance budgets and completely retool their economies to become<br />
more competitive in the midst of a severe recession and a credit crunch. Tough austerity hasn’t worked<br />
so far and it’s diffi cult to see why it would suddenly succeed in 2012. Greece remains shaky and<br />
Portugal will be unable to return to private credit markets next year, so will almost certainly need a<br />
second bailout.<br />
While the ECB and the EU can deal with challenges in the short term, perhaps the greatest threat to the<br />
viability of the Eurozone is what might occur over the medium to longer term, particularly in the event<br />
of a deterioration in either of Italy or Spain. This is because risk premiums are part of the new normal<br />
for Europe and elevated debt servicing costs will threaten their solvency. Italy, with a debt to GDP ratio<br />
of 120% and a 5% cost of funds must maintain a primary surplus greater than 6% of GDP just to keep<br />
the debt stock stable. Were Italy to fall into a tough recession with debt spiraling upward to 130% or<br />
140% of GDP, and with austerity unable to repair the balance sheet, then the Eurozone would be left<br />
in a diffi cult position. The Italian economy is simply too large to rescue with fi scal transfers, and the<br />
alternative is for the ECB to print a continuous stream of euros to fi nance unsustainable debt, a certain<br />
recipe for infl ation that would be unthinkable for Germany.<br />
European leaders and the ECB deserve credit for taking diffi cult steps that have been successful up to<br />
now in containing the sovereign debt problem within the peripheral nations, which is critical for global<br />
stability. Policy measures are most likely to remain focused on containment, as a spread of infection<br />
beyond the periphery would have a much more damaging impact on the broader world economy. More<br />
comprehensive solutions, such as closer fi scal integration and the issuance of European bonds remain<br />
years away. This means that the problems of the Eurozone are still far from being solved and the road<br />
ahead will be treacherous indeed.<br />
BACK TO TABLE OF CONTENTS 12
E X P O R T F O R E C A S T O V E R V I E W 2 0 1 2<br />
1.0 GEF Executive Summary<br />
1.1 Hard Landing in the BRICs?<br />
Not Likely<br />
1.2 Drag and Drop? –<br />
Fiscal Austerity and<br />
the World Economy<br />
1.3 Eurozone: Reprieve…<br />
For Now<br />
1.4 Iran Jitters<br />
2.0 Country Overviews<br />
3.0 Sector Overview<br />
4.0 Provincial <strong>Export</strong> Outlook<br />
5.0 Annexes<br />
1.4 Iran Jitters<br />
Ongoing violence in Syria and the complex transitions underway in Egypt, Libya and Tunisia guarantee<br />
that the “Arab Spring” uprisings will continue to feature prominently in news headlines in 2012. However,<br />
this year and the next, the Arab Spring will have to share the stage with Iran, as the nuclear standoff<br />
between that country and a coalition of Western and like-minded states inches toward a crisis point.<br />
At its core, the confrontation between the West and Iran is about the country’s failure to address wellfounded<br />
international concerns about the possible military dimensions of its nuclear program. <strong>Canada</strong>,<br />
the European Union, the US and other like-minded countries fear that Iran’s enrichment of uranium to<br />
higher and higher levels will one day allow it to manufacture nuclear weapons.<br />
Negotiations with Iran were fi rst launched in 2002 when the UN’s International Atomic Energy Agency<br />
(IAEA) discovered several hitherto undeclared Iranian nuclear sites involved in suspicious activities.<br />
Since then, the West has embarked on numerous diplomatic initiatives and initiated sanctions to try<br />
to compel Iran to halt its enrichment efforts and to abandon its suspected pursuit of nuclear weapons.<br />
What is different in the 2012-2013 timeframe is that the patience of the West and Israel with Iran is<br />
growing thin. Following the release of an IAEA report that raised concerns about Iran’s experimentation<br />
with technologies essential to developing nuclear weapons, the US, European Union, <strong>Canada</strong> and<br />
other like-minded countries adopted tough new economic sanctions against Iran in November 2011<br />
that are unprecedented in their scope. For its part, Israel, which sees a nuclear-weapons-capable Iran<br />
as an existential threat, appears closer than ever to launching a military strike against Iran’s nuclear<br />
facilities. In fact, Israel’s Prime Minister stated in March that his country will decide whether to attack<br />
Iran within about a year if sanctions and diplomacy fail to persuade Iran to cease enriching uranium and<br />
to dismantle a secretly constructed underground uranium enrichment facility. Israel’s rush to act refl ects<br />
the belief of the Israeli leadership that Iran’s defensive preparations will be too advanced next year for<br />
an Israeli air raid to signifi cantly set back the Iranian nuclear program .<br />
The US does not share the same sense of urgency, partly because the military means and arsenal<br />
of bunker busting bombs available to it are far greater than Israel’s. A US-initiated attack on Iran is<br />
therefore less likely in the next two years.<br />
Nevertheless, concern about the possibility of an Iran-Israel confrontation disrupting oil exports from<br />
the Persian Gulf (20% of oil traded worldwide) have served to elevate global concerns about an oil price<br />
spike this year or the next. What is the probability that Israel will act on its threats?<br />
An Israeli decision to attack Iran in 2012 would not be taken lightly. Israel assesses that Iran would<br />
retaliate by pressuring its ally in Lebanon, Hizballah, to launch rockets against Israeli cities. Military<br />
action in 2012 is also opposed by the US government, whose military planners believe that Iran would<br />
not only retaliate against Israel but also against US troops in Afghanistan and perhaps in the Persian<br />
Gulf. Finally, an Israeli raid, even if successful, would have a limited payoff. Analysts estimate that an<br />
Israeli bombing attack would only set back the Iranian nuclear program by 2 to 4 years.<br />
Together, these considerations are probably (but not certainly) compelling enough to dissuade Israel<br />
from military action in 2012 and to give the recently imposed economic sanctions as well as diplomatic<br />
efforts a last chance to work. However, without a diplomatic breakthrough or changes in Israeli<br />
assumptions about Iran’s nuclear weapons capability, a military confrontation between Israel and Iran<br />
is increasingly likely in 2013.<br />
BACK TO TABLE OF CONTENTS 13
E X P O R T F O R E C A S T O V E R V I E W 2 0 1 2<br />
1.0 GEF Executive Summary<br />
1.1 Hard Landing in the BRICs?<br />
Not Likely<br />
1.2 Drag and Drop? –<br />
Fiscal Austerity and<br />
the World Economy<br />
1.3 Eurozone: Reprieve…<br />
For Now<br />
1.4 Iran Jitters<br />
2.0 Country Overviews<br />
3.0 Sector Overview<br />
4.0 Provincial <strong>Export</strong> Outlook<br />
5.0 Annexes<br />
An Israeli attack would probably take the form of pinpoint air strikes against key nuclear enrichment<br />
sites. In addition to retaliating against Israel, Iran could opt to temporarily slow transit times of tankers<br />
passing through the Strait of Hormuz so as to mobilize world opinion against Israel and any future<br />
strikes. The Strait is a narrow chokepoint through which most of the oil and LNG produced by the Arab<br />
Gulf monarchies and Iran must pass to reach world markets. Shipping slow-downs in the Strait would<br />
probably cause temporary price spikes in the neighbourhood of USD$125-150/bbl for West Texas<br />
Intermediate (WTI). However, export disruptions would likely not be maintained for more than a month<br />
or two, since the US Navy, acting to secure world oil supplies, would retaliate against Iran, whose<br />
tankers must also transit the Strait. More extreme measures, such as an extended closure of the Strait<br />
or military attacks against the US-allied Gulf kingdoms would be unlikely since they would deprive Iran<br />
of any international or regional support and would again trigger severe retaliation.<br />
Looking ahead, fear of military confl ict in the Persian Gulf is unlikely to subside in the next two years<br />
unless there is a breakthrough in negotiations between the West and Iran. The fear factor will add a risk<br />
premium to crude prices, yet the North American market will remain adequately supplied. We expect<br />
the price of WTI to average USD$100/bbl in 2012 and a somewhat lower USD$95/bbl in 2013.<br />
Figure 5: Gulf Oil <strong>Export</strong>s and Potential Disruptions)<br />
7,000<br />
6,000<br />
Via the Strait of Hormuz<br />
Via alternate route<br />
Thousands of Barrels per Day (2010)<br />
5,000<br />
4,000<br />
3,000<br />
2,000<br />
1,000<br />
0<br />
Bahrain Iran Iraq Kuwait Oman Qatar Saudi Arabia UAE<br />
Source: IMF/WEO, IEA<br />
BACK TO TABLE OF CONTENTS 14
E X P O R T F O R E C A S T O V E R V I E W 2 0 1 2<br />
1.0 GEF Executive Summary<br />
2.0 Country Overviews<br />
2.0 Country Overviews<br />
2.1 Brazil<br />
2.2 <strong>Canada</strong><br />
2.3 China<br />
2.4 Euro Area<br />
2.5 India<br />
2.6 Japan<br />
2.7 Mexico<br />
2.8 Russian Federation<br />
2.9 South Africa<br />
2.10 United States<br />
3.0 Sector Overview<br />
4.0 Provincial <strong>Export</strong> Outlook<br />
5.0 Annexes<br />
BACK TO TABLE OF CONTENTS 15
E X P O R T F O R E C A S T O V E R V I E W 2 0 1 2<br />
1.0 GEF Executive Summary<br />
2.0 Country Overviews<br />
2.1 Brazil<br />
2.2 <strong>Canada</strong><br />
2.3 China<br />
2.4 Euro Area<br />
2.5 India<br />
2.6 Japan<br />
2.7 Mexico<br />
2.8 Russian Federation<br />
2.9 South Africa<br />
2.10 United States<br />
3.0 Sector Overview<br />
4.0 Provincial <strong>Export</strong> Outlook<br />
5.0 Annexes<br />
2.1 Brazil<br />
Country Overview: President Dilma Rousseff took<br />
offi ce January 1, 2011 and is backed by a 10-party<br />
coalition representing 70% of Congress. Political<br />
progress requires constant horse-trading that slows<br />
the passage of fundamental reforms such as tax policies, widely considered<br />
necessary to maintain fi scal sustainability and to accelerate growth to a<br />
level that will continue to move Brazil forward. <strong>EDC</strong> Economics expects<br />
supportive domestic economic activity over the next 2 years, driven by<br />
Brazil’s main engine of growth, consumer spending, which currently<br />
benefi ts from historically low levels of unemployment, continued robust<br />
credit growth and poverty reduction initiatives. GDP grew 2.7% in 2011<br />
and it is forecasted to expand by around 3% in 2012 and 4.1% in 2013.<br />
Trade and Investment Environment: The government has temporarily<br />
reduced import taxes on 99 capital goods and 6 IT and telecommunications<br />
products to 2%, with the goal of increasing imports of goods that are not<br />
produced locally but that are required for the manufacture of domestic<br />
goods. Massive capital infl ows and FX intervention have allowed foreign<br />
exchange reserves to grow to around USD 356 billion in February which<br />
supports a strong liquidity ratio. The government increased tax policies<br />
toward capital infl ows aiming to reduce the pressures on the currency.<br />
As a result, foreign loans with an average life of up to 5 years are now<br />
subject to a new IOF tax of 6%. <strong>EDC</strong> Economics does not anticipate any<br />
fi nancing problems over the forecast horizon as Brazil’s external fi nancing<br />
requirements are comfortably covered by net foreign direct investment<br />
(FDI) and portfolio infl ows. Overall, Brazil’s net external creditor position<br />
and strong external liquidity mitigate risk to external shocks.<br />
Outlook: The outlook for the Brazilian economy is positive. Over the short<br />
term, downside risks include uncertainty about the magnitude of the global<br />
slowdown as well as concerns associated with infl ation, refl ecting in part<br />
domestic demand not being adequately met by domestic supply. The<br />
government also needs to prevent the formation of asset bubbles in the<br />
economy while banking regulators deal with rising household indebtedness<br />
and debt servicing costs relative to income. In the medium term, some<br />
structural reforms need to be undertaken to ensure sustainable growth<br />
and improve fi scal accounts. The FIFA World Cup and the Olympics will<br />
offer excellent opportunities for exporters over the next 5 to 7 years. State<br />
intervention in the economy is likely to increase with Brazil’s policy of<br />
supporting “national champions”.<br />
Country Stats<br />
President<br />
Dilma Rousseff (PT)<br />
Next Elections<br />
• Presidential: October 2014<br />
• Legislative: October 2014<br />
Nominal GDP PPP (2011e)<br />
USD 2.5 trillion<br />
Total Trade/GDP:<br />
across provinces:<br />
19%<br />
Exchange Regime:<br />
Free fl oat<br />
Merchandise Imports from<br />
<strong>Canada</strong> (2011):<br />
CAD 2.7 billion<br />
Main Imports:<br />
M&E, chemicals<br />
Source: IMF, EIU & Statistics<br />
<strong>Canada</strong><br />
Risks to the Outlook:<br />
Further progress<br />
on microeconomic<br />
reforms<br />
A sharp reversal in<br />
capital fl ows or asset<br />
bubble formation<br />
Figure 6: Brazil – Economic Indicators<br />
10.0<br />
7.0<br />
GDP Growth<br />
Fiscal Balance<br />
Current Account (%GDP)<br />
Figure 7: Ease of Doing Business (WDI): Regional<br />
Comparison (best=1)<br />
180<br />
160<br />
Bolivia<br />
5.0<br />
3.0<br />
140<br />
120<br />
100<br />
Brazil<br />
Argentina<br />
1.0<br />
80<br />
-1.0<br />
-3.0<br />
60<br />
40<br />
20<br />
Peru<br />
Columbia<br />
-5.0<br />
2009 2010 2011 2012(f) 2013(f)<br />
0<br />
Source: Haver Analytics, EIA<br />
Source: Haver Analytics, EIA<br />
BACK TO TABLE OF CONTENTS 16
E X P O R T F O R E C A S T O V E R V I E W 2 0 1 2<br />
1.0 GEF Executive Summary<br />
2.0 Country Overviews<br />
2.1 Brazil<br />
2.2 <strong>Canada</strong><br />
2.3 China<br />
2.4 Euro Area<br />
2.5 India<br />
2.6 Japan<br />
2.7 Mexico<br />
2.8 Russian Federation<br />
2.9 South Africa<br />
2.10 United States<br />
3.0 Sector Overview<br />
4.0 Provincial <strong>Export</strong> Outlook<br />
5.0 Annexes<br />
2.2 <strong>Canada</strong><br />
Country Overview: <strong>Canada</strong>’s GDP growth softened<br />
from 3.2% in 2010 to 2.5% in 2011 as consumption<br />
slowed and exports continued to surge ahead, helped<br />
by soaring commodity prices and strong demand<br />
from emerging markets. High levels of consumer debt and an overheating<br />
housing market remain near-term concerns. A boost in exports from rising<br />
US demand in 2012 will help to offset soft consumption, but Canadian<br />
exporters will continue to struggle with the effects of a very strong currency,<br />
which is not only lowering the Canadian dollar value of foreign sales but<br />
also increasing the cost of Canadian inputs (such as labour) relative to<br />
US and other competitors. Nevertheless, the strong export performance<br />
in 2011 demonstrates that Canadian companies have been able to adapt<br />
and compete despite the soaring loonie.<br />
Trade and Investment Environment: <strong>Canada</strong>’s overall export performance<br />
for 2011 has been very impressive with exports rising by 12.9%. The<br />
biggest contributors were the energy, metals and agriculture sectors;<br />
however, strong commodity prices are only part of the story. On the<br />
volume side, the top performing sector was machinery and equipment<br />
where shipments rose by 6% for the year. In fact, <strong>Canada</strong>’s exports of<br />
industrial and agricultural machinery rose by 11.8%, the largest annual<br />
increase on record. Automotive also saw a solid 5.8% increase in volumes<br />
for 2011, as US consumer demand gathered momentum.<br />
<strong>Canada</strong>’s exports to emerging markets soared by a whopping 19.4% for<br />
the year. The US recovery has been impressive with exports rising 9.9%<br />
last year, and this is still by far the most important destination accounting<br />
for 75% of exports. However, the emerging market numbers are simply<br />
stunning: exports to Turkey topped 51.8%, Russia rose 30.7%, China<br />
charged ahead by 27.0%, and India increased by 27.4%. Because these<br />
countries will sustain higher economic growth rates than developed<br />
markets, it’s likely that <strong>Canada</strong>’s exports can continue to expand at<br />
impressive rates. This trade diversifi cation will position them well for<br />
growth and success in the years ahead.<br />
Outlook: <strong>EDC</strong> is forecasting GDP growth of 2.0% this year and 2.2% in<br />
2013 as exports continue to recover, while at the same time Canadian<br />
consumption begins to slow. <strong>EDC</strong> Economics is forecasting that the<br />
dollar will average USD 1.01 this year, then fall to USD 0.97 in 2013, with<br />
signifi cant volatility expected through the forecast horizon.<br />
Country Stats<br />
Prime Minister<br />
Stephen Harper<br />
Next Elections<br />
• Parliamentary: October 2015<br />
Nominal GDP (2011)<br />
USD 1.8 trillion<br />
Total Trade/GDP:<br />
52%<br />
Exchange Regime:<br />
Managed fl oat<br />
Main Imports:<br />
Crude petroleum<br />
Motor vehicles<br />
Motor vehicle parts<br />
Source: IMF, EIU &<br />
Statistics <strong>Canada</strong><br />
Risks to the Outlook:<br />
A stronger-thanexpected<br />
US<br />
recovery would boost<br />
exports<br />
Overheating housing<br />
market could fall<br />
back to earth<br />
Figure 8: <strong>Canada</strong> – Economic Indicators<br />
10.0<br />
5.0<br />
0.0<br />
-5.0<br />
GDP Growth<br />
Fiscal Balance<br />
Current Account (%GDP)<br />
-10.0<br />
2009 2010 2011 2012(f) 2013(f)<br />
Source: Haver Analytics, EIU, <strong>EDC</strong> Economics<br />
Figure 9: Ease of Doing Business (WDI): Regional<br />
Comparison (best=1)<br />
60<br />
55<br />
50<br />
45<br />
40<br />
35<br />
30<br />
25<br />
20<br />
15<br />
10<br />
5<br />
0<br />
U.S.<br />
Source: Haver, EIU<br />
UK<br />
<strong>Canada</strong><br />
Japan<br />
Mexico<br />
BACK TO TABLE OF CONTENTS 17
E X P O R T F O R E C A S T O V E R V I E W 2 0 1 2<br />
1.0 GEF Executive Summary<br />
2.0 Country Overviews<br />
2.1 Brazil<br />
2.2 <strong>Canada</strong><br />
2.3 China<br />
2.4 Euro Area<br />
2.5 India<br />
2.6 Japan<br />
2.7 Mexico<br />
2.8 Russian Federation<br />
2.9 South Africa<br />
2.10 United States<br />
3.0 Sector Overview<br />
4.0 Provincial <strong>Export</strong> Outlook<br />
5.0 Annexes<br />
2.3 China<br />
Country Overview: China is in the midst of transforming<br />
its economy as the growth model of exports-investmenturbanization<br />
shows signs of fatigue. The 12th Five-Year<br />
Plan (FYP) hopes to re-shape the economy into one<br />
driven primarily by consumption and innovation. The FYP also places<br />
greater emphasis on infrastructure investment in the under-developed<br />
central and western provinces as well as greater investments in R&D<br />
and high-tech sectors in coastal provinces. While the focus on continued<br />
growth remains, the plan also lays out measures to expand the social<br />
safety net. A once-in-a-decade leadership change is taking place in 2012<br />
and has already generated its share of drama, with the dismissal of Bo<br />
Xilai, a populist provincial head of the Communist Party of China with<br />
leadership ambitions; behind closed doors, the CCP political machine<br />
is not the well-oiled machine it tries to portray itself to be. The next<br />
generation of leaders will have critical decisions to make on land reforms,<br />
the hukou system, and greater participation in the political process as well<br />
as positioning China’s growing importance on the international stage, all<br />
the while managing the economic transformation.<br />
Trade and Investment Environment: While China continues to be a top<br />
destination for global FDI and investments, its complicated commercial<br />
environment poses several challenges for foreign investors. Once ratified,<br />
the <strong>Canada</strong>-China Foreign Investment Promotion and Protection Agreement<br />
(FIPA) will provide greater certainty and protection for Canadian investors<br />
going forward. At the same time, China is becoming a major source of capital<br />
for the rest of the world, with FDI outflow from China expected to reach USD<br />
90 billion in 2012, some of which has already made its way to <strong>Canada</strong>’s<br />
energy sector. On the other hand, Chinese demand for commodities will<br />
deteriorate in 2012 due to the real estate sector-led economic slowdown.<br />
The internationalization of the renminbi as a global currency will continue<br />
apace in 2012, but full convertibility remains a few years away. Various<br />
countries have signed agreements to increase the use of renminbi in trade<br />
settlement.<br />
Outlook: The country will have a turbulent year in 2012, faced with the<br />
bursting of a residential property bubble and slowing demand from its key<br />
export market (Europe). Yet the government retains a number of policy<br />
and administrative options to stimulate the economy and manage social<br />
order, as authorities will want to avoid social instability and unrest prior to<br />
the upcoming once-in-a-decade leadership transition change.<br />
Country Stats<br />
General Secretary of CCP<br />
and President<br />
Hu Jintao<br />
Next Elections<br />
Leadership elections - late<br />
2012/2013<br />
Nominal GDP (2011)<br />
USD 7 trillion<br />
Total Trade/GDP:<br />
52%<br />
Exchange Regime:<br />
Crawling Peg<br />
Merchandise Imports from<br />
<strong>Canada</strong> (2010):<br />
CAD 12.9 billion<br />
Main Imports:<br />
Industrial M&E<br />
Source: IMF, EIU &<br />
Statistics <strong>Canada</strong><br />
Risks to the Outlook:<br />
Fiscal stimulus<br />
package; rapid<br />
monetary and credit<br />
loosening<br />
Real estate bubble<br />
burst; debt crisis in<br />
Europe<br />
Figure 10: China – Economic Indicators<br />
15.0<br />
Figure 11: Ease of Doing Business (WDI): Regional<br />
Comparison (best=1)<br />
170<br />
10.0<br />
150<br />
130<br />
India<br />
Indonesia<br />
5.0<br />
0.0<br />
110<br />
90<br />
70<br />
50<br />
China<br />
-5.0<br />
-10.0<br />
GDP Growth<br />
Fiscal Balance<br />
Current Account (%GDP)<br />
2009 2010 2011 2012(f) 2013(f)<br />
30<br />
10<br />
-10<br />
Korea<br />
Singapore<br />
Source: Haver Analytics, IMF/WEO, <strong>EDC</strong> Economics<br />
Source: Haver, EIU<br />
BACK TO TABLE OF CONTENTS 18
E X P O R T F O R E C A S T O V E R V I E W 2 0 1 2<br />
1.0 GEF Executive Summary<br />
2.0 Country Overviews<br />
2.1 Brazil<br />
2.2 <strong>Canada</strong><br />
2.3 China<br />
2.4 Euro Area<br />
2.5 India<br />
2.6 Japan<br />
2.7 Mexico<br />
2.8 Russian Federation<br />
2.9 South Africa<br />
2.10 United States<br />
3.0 Sector Overview<br />
4.0 Provincial <strong>Export</strong> Outlook<br />
5.0 Annexes<br />
2.4 Euro Area<br />
Country Overview: The Eurozone is the world’s largest economy<br />
accounting for almost 20% of global GDP, but it has struggled with a<br />
sovereign debt crisis that will test the very future of the currency union as<br />
well as the international fi nancial system. The Eurozone received a muchneeded<br />
reprieve from the crisis as Greece successfully restructured its<br />
debt and received a second €130-billion support package. At the same<br />
time, the European Central Bank provided a massive liquidity injection<br />
of over €1 trillion of 3-year loans to hundreds of banks at a 1% interest<br />
rate. This has made a disorderly default unlikely for now, while providing<br />
struggling banks with much-needed cash to stave off a credit crisis.<br />
However, there are many challenges ahead in the coming years, including<br />
restoring competitiveness in the periphery countries that have seen costs<br />
soar, tough austerity involving both spending cuts and tax hikes, and<br />
avoiding a credit crunch as banks deleverage and raise credit standards.<br />
Trade and Investment Environment: Despite its challenges, the Eurozone<br />
holds tremendous opportunities for Canadian exporters because of its<br />
wealthy, advanced economies. In 2011, Canadian companies exported<br />
CAD 39.8 billion of merchandise to the European Union, everything<br />
from precious metals and aerospace to soybeans and pharmaceuticals.<br />
However, investment is an even larger part of the relationship with Europe<br />
as Canadian Direct Investment amounts to CAD 157 billion. The European<br />
Union has recently completed the ninth round of negotiations toward a<br />
Comprehensive Economic and Trade Agreement that covers intellectual<br />
property and government procurement in addition to goods and services.<br />
Both parties are aiming to conclude an agreement by the end of 2012.<br />
Outlook: <strong>EDC</strong> Economics is forecasting that the Eurozone will experience<br />
a recession in 2012 as growth turned negative in the 4th quarter of 2011<br />
and is likely to remain weak for most of this year. The forecast calls for<br />
a -0.3% contraction in 2012 and 0.7% growth the following year. But this<br />
masks a considerable divergence between the core where Germany and<br />
the Netherlands will chalk up moderate expansion in the 0.6% range, then<br />
onto France where GDP will remain essentially fl at, while Peripheral Europe,<br />
particularly Greece and Portugal, will experience tough recessions. Over<br />
the next 2 years, exporters should expect continued volatility as fi nancial<br />
markets will remain vulnerable. European leaders will have to consider<br />
new governance models that entail tighter fi scal integration in order to<br />
restore confi dence and stabilize the euro.<br />
Country Stats<br />
Nominal GDP (2011)<br />
USD 13.4 trillion<br />
Share of <strong>Global</strong> Economy:<br />
19%<br />
Total Trade/GDP:<br />
71%<br />
Exchange Regime:<br />
Independent fl oat<br />
Merchandise Imports from<br />
<strong>Canada</strong> (2010):<br />
CAD 43.3 billion<br />
Main Imports:<br />
Chemicals<br />
Telecom equipment<br />
Automotive products<br />
Source: IMF, EIU &<br />
Statistics <strong>Canada</strong><br />
Risks to the Outlook:<br />
Strong business<br />
confi dence in core<br />
Europe<br />
Political risks<br />
as voters reject<br />
austerity and reform<br />
Figure 12: Euro Area – Economic Indicators<br />
8.0<br />
6.0<br />
4.0<br />
2.0<br />
0.0<br />
-2.0<br />
-4.0<br />
-6.0<br />
-8.0<br />
GDP Growth<br />
Fiscal Balance<br />
Current Account (%GDP)<br />
-10.0<br />
2009 2010 2011 2012(f)<br />
2013(f)<br />
Source: Haver Analytics, EIU, <strong>EDC</strong> Economics<br />
Figure 13: Ease of Doing Business (WDI): Regional<br />
Comparison (best=1)<br />
110<br />
100<br />
90<br />
80<br />
70<br />
60<br />
50<br />
40<br />
30<br />
20<br />
10<br />
0<br />
Germany<br />
Source: Haver, EIU<br />
France<br />
Italy<br />
Spain<br />
Ireland<br />
BACK TO TABLE OF CONTENTS 19
E X P O R T F O R E C A S T O V E R V I E W 2 0 1 2<br />
1.0 GEF Executive Summary<br />
2.0 Country Overviews<br />
2.1 Brazil<br />
2.2 <strong>Canada</strong><br />
2.3 China<br />
2.4 Euro Area<br />
2.5 India<br />
2.6 Japan<br />
2.7 Mexico<br />
2.8 Russian Federation<br />
2.9 South Africa<br />
2.10 United States<br />
3.0 Sector Overview<br />
4.0 Provincial <strong>Export</strong> Outlook<br />
5.0 Annexes<br />
2.5 India<br />
Country Overview: Corruption scandals have drained<br />
government resources and nearly paralyzed the<br />
legislative process in recent months. The Indian National<br />
Congress fared poorly at the polls in 2011 and early 2012,<br />
so the INC-led coalition could fi nd it difficult to pass major reforms in the<br />
near term. At the same time, the government has shown little interest<br />
in fi scal consolidation, despite weaker revenue growth from the slowing<br />
economy and the need to recapitalize state-owned banks.<br />
Trade and Investment Environment: Trade continues to rapidly grow in<br />
importance but overall remains a small share of the economy. Negotiations<br />
for a free trade agreement with <strong>Canada</strong>, which are due to be completed by<br />
the end of 2013, will give bilateral trade a welcome boost. Canadian noncommodity<br />
exports will particularly benefi t once implemented.<br />
Despite a relatively open foreign investment policy that allows 100%<br />
foreign ownership in most sectors, India has failed to reach its full potential<br />
as an FDI destination. Government attempts to increase FDI infl ows<br />
have been slowed by uncertain regulations, critical infrastructure defi cits<br />
and corruption. Land acquisition is a particularly sensitive issue. The<br />
government’s plan to spend USD 1 trillion on infrastructure represents one<br />
of the best opportunities for Canadian companies, although we expect the<br />
full amount will not be invested in the 5-year time frame as planned.<br />
Corruption in India is widespread, especially in the public sector; the<br />
judiciary is independent and considered competent and fair, especially<br />
at the higher levels. Despite recent judicial sector reforms, often cases<br />
can still take years or decades to be resolved. Enforcing rulings can also<br />
prove diffi cult.<br />
Outlook: With inflation abating, monetary authorities have started<br />
loosening credit conditions, although we don’t expect the economy to<br />
show material signs of improvements until the second half of 2012. The<br />
Congress-led UPA governing coalition is likely to govern through to the end<br />
of its mandate in 2014. Criticism over the government’s inability to pass<br />
important reforms will sharpen if it is not seen to be actively managing<br />
obstacles to India’s continued rapid development. The government will,<br />
however, refrain from pursuing unpopular reforms throughout much<br />
of 2012 in order to restore a more positive public image with the 2014<br />
elections in mind.<br />
Country Stats<br />
Prime Minister<br />
Manmohan Singh, Indian<br />
National Congress<br />
Next Elections<br />
April/May 2014<br />
Nominal GDP (2011)<br />
USD 1,843.4 billion<br />
Total Trade/GDP (2011):<br />
45.0%<br />
Exchange Regime:<br />
Managed fl oat<br />
Merchandise Imports from<br />
<strong>Canada</strong> (2011):<br />
CAD 2.0 billion<br />
Main Imports:<br />
Mineral fuels (37%)<br />
Industrial M&E (16%)<br />
Precious metals & gems (11%)<br />
Source: IMF, EIU &<br />
Statistics <strong>Canada</strong><br />
Risks to the Outlook:<br />
Greater-thanexpected<br />
FDI; food<br />
infl ation falls<br />
External fi nancing<br />
vulnerable; lack of<br />
fi scal consolidation<br />
Figure 16: India – Economic Indicators<br />
10.0<br />
Figure 17: Ease of Doing Business (WDI): Regional<br />
Comparison (best=1)<br />
170<br />
5.0<br />
150<br />
130<br />
India<br />
Indonesia<br />
0.0<br />
110<br />
90<br />
70<br />
China<br />
-5.0<br />
-10.0<br />
GDP Growth<br />
Fiscal Balance<br />
Current Account (%GDP)<br />
2009 2010 2011 2012(f) 2013(f)<br />
50<br />
30<br />
10<br />
-10<br />
Korea<br />
Singapore<br />
Source: Haver Analytics, EIU, <strong>EDC</strong> Economics<br />
Source: Haver Analytics, EIU<br />
BACK TO TABLE OF CONTENTS 20
E X P O R T F O R E C A S T O V E R V I E W 2 0 1 2<br />
1.0 GEF Executive Summary<br />
2.0 Country Overviews<br />
2.1 Brazil<br />
2.2 <strong>Canada</strong><br />
2.3 China<br />
2.4 Euro Area<br />
2.5 India<br />
2.6 Japan<br />
2.7 Mexico<br />
2.8 Russian Federation<br />
2.9 South Africa<br />
2.10 United States<br />
3.0 Sector Overview<br />
4.0 Provincial <strong>Export</strong> Outlook<br />
5.0 Annexes<br />
2.6 Japan<br />
Country Overview: Japan’s economy will rebound in<br />
2012, primarily driven by reconstruction activity following<br />
last year’s devastating earthquake and tsunami.<br />
Japanese exporters face a diffi cult environment, caught<br />
between the slowdown in China, Europe sovereign debt problems and<br />
the strong yen. The government has had little success in tackling its<br />
massive debt, which now exceeds 200% of GDP, by far the largest in the<br />
industrial world. The world’s third largest economy is also facing an aging<br />
and declining population, while it continues to struggle with defl ation. On<br />
the political front, the Prime Minister‘s popularity has fallen steadily since<br />
taking office last year, to a point where another change of leadership<br />
cannot be ruled out ahead of the 2013 elections.<br />
Trade and Investment Environment: Outside the agricultural sector,<br />
Japan is one of the world’s most open economies, with trade and<br />
investment across a broad spectrum of industries, particularly high-tech<br />
goods, machinery and equipment and automobiles. Last year’s nuclear<br />
disaster has pushed the country to become more aggressive in securing<br />
off-shore energy supplies, including ventures in <strong>Canada</strong>’s shale gas<br />
sector. Despite this openness, transparent legal system and tax regime<br />
and low level of corruption, Japan has failed to attract signifi cant amounts<br />
of FDI to its territory in the last decade. Faced with a challenging domestic<br />
economic environment and the strong yen, Japanese companies are<br />
increasingly looking to expand abroad. On the trade front, Japan and<br />
<strong>Canada</strong> have recently released a joint study recommending that the two<br />
countries begin negotiations of a comprehensive and high-level economic<br />
partnership agreement. Both <strong>Canada</strong> and Japan have expressed interest<br />
in joining the Trans-Pacifi c Partnership, which would also facilitate<br />
bilateral trade in goods and services between the two countries. Bilateral<br />
trade is largely complementary, with <strong>Canada</strong> exporting raw materials and<br />
importing transportation vehicles, parts and machinery and equipment.<br />
Outlook: Japan will need to tackle several challenges over the next few<br />
years to safeguard its long-term prosperity. It is too soon to see if the<br />
recent introduction of an explicit infl ation target by the central bank will<br />
solve the issue of persistent defl ation, but the move is a step in the right<br />
direction. Other reforms may be more diffi cult to pass and implement,<br />
especially if parliament were to become more fragmented, which would<br />
give the political leadership a weak hand in negotiating with the strong<br />
bureaucracy.<br />
Country Stats<br />
President<br />
Yoshihiko Noda<br />
Next Elections<br />
• Parliamentary:<br />
August 30, 2013<br />
Nominal GDP (2011)<br />
USD 5.9 billion<br />
Total Trade/GDP:<br />
31%<br />
Exchange Regime:<br />
Independent fl oat<br />
Merchandise Imports from<br />
<strong>Canada</strong> (2011):<br />
CAD 8,069 million<br />
Main Imports:<br />
Industrial supplies<br />
Services<br />
Capital equipment<br />
Source: IMF, EIU &<br />
Statistics <strong>Canada</strong><br />
Risks to the Outlook:<br />
European and global<br />
economy improves<br />
weaker yen<br />
Sovereign<br />
downgrade; sharp<br />
Chinese slowdown<br />
Figure 14: Japan – Economic Indicators<br />
10.0<br />
5.0<br />
GDP Growth<br />
Fiscal Balance<br />
Current Account (%GDP)<br />
Figure 15: Ease of Doing Business (WDI): Regional<br />
Comparison (best=1)<br />
25<br />
20<br />
Japan<br />
0.0<br />
15<br />
Australia<br />
10<br />
Korea<br />
-5.0<br />
-10.0<br />
2009 2010 2011 2012(f) 2013(f)<br />
5<br />
0<br />
New Zealand<br />
Singapore<br />
Source: Haver Analytics, IMF/WEO, <strong>EDC</strong> Economics<br />
Source: Haver Analytics, EIU<br />
BACK TO TABLE OF CONTENTS 21
E X P O R T F O R E C A S T O V E R V I E W 2 0 1 2<br />
1.0 GEF Executive Summary<br />
2.0 Country Overviews<br />
2.1 Brazil<br />
2.2 <strong>Canada</strong><br />
2.3 China<br />
2.4 Euro Area<br />
2.5 India<br />
2.6 Japan<br />
2.7 Mexico<br />
2.8 Russian Federation<br />
2.9 South Africa<br />
2.10 United States<br />
3.0 Sector Overview<br />
4.0 Provincial <strong>Export</strong> Outlook<br />
5.0 Annexes<br />
2.7 Mexico<br />
Country Overview: Mexico is a large open economy<br />
that has become an important part of the global<br />
supply chain, thanks to its large network of free trade<br />
agreements. It ranks 53rd overall in terms of ease<br />
of doing business (World Bank) and is assigned an investment grade<br />
rating by Moody’s, Fitch and S&P. Economic activity is tied greatly to the<br />
US economy via trade, remittances and investment. Long-term growth<br />
potential is relatively modest at 3.5% per year.<br />
Trade and Investment Environment: Although Mexico’s business<br />
environment remains politicized and without a strong legal framework, it is<br />
changing due to the more global focus of the government and the private<br />
sector. Measures have been taken to make doing business in Mexico<br />
easier, and access to international arbitration is guaranteed by law and<br />
NAFTA. The country offers a welcoming environment for businesses in<br />
almost every sector except in the energy sector. Corruption and criminal<br />
violence are also factors that negatively impact the business environment.<br />
Outlook: With PRI-PAN cooperation increasingly improbable, a legislative<br />
stalemate is likely until the presidential and legislative elections in July<br />
2012. The strong lead the PRI secured in the 2011 state elections<br />
suggests that the party is likely to be elected in the 2012 presidential<br />
elections. However, the unpredictable nature of Mexican politics and the<br />
noted popularity of the PAN candidate, former education minister Josefi na<br />
Vasquez Mota, and the PRD candidate Andres Manuel Lopez Obrador<br />
could still make for a close race. Elections slated for July are not expected<br />
to shake international investors’ confi dence in the market as leading<br />
candidates for both the PRI and the PAN are aligned with most of the<br />
current administration’s policies. This could change if the PRD were to<br />
make signifi cant headway between now and elections. Strong links to the<br />
US economy support a positive outlook for Mexico this year and next.<br />
Direct exposures, via trade links, to the crisis in Europe are limited and local<br />
subsidiaries of Spanish banks operate with a high level of independence<br />
from their parent organizations. Most indicators of external vulnerability<br />
show that Mexico is in good shape. The current account defi cit is low and<br />
easily fi nanced by FDI, external debt service ratios are modest, foreign<br />
exchange reserves are near record levels and the country has secured a<br />
credit line with the IMF. Contagion from Europe is nonetheless a concern<br />
as it is for many markets, mainly via the risk of a global fl ight to quality.<br />
Country Stats<br />
President<br />
Felipe Caldern<br />
Next Elections<br />
Presidential: July 2012<br />
Legislative: July 2012<br />
Nominal GDP (2011)<br />
USD 1.2 trillion<br />
Total Trade/GDP (2011):<br />
62%<br />
Exchange Regime:<br />
Free fl oat<br />
Merchandise Imports from<br />
<strong>Canada</strong> (2011):<br />
CAD 4.7 billion<br />
Main Imports:<br />
Electronic and ICT<br />
M&E<br />
Aerospace<br />
Source: IMF, EIU &<br />
Statistics <strong>Canada</strong><br />
Risks to the Outlook:<br />
US economic activity<br />
proves stronger than<br />
expected<br />
Escalation of<br />
the debt crisis<br />
in Europe<br />
Figure 18: Mexico – Economic Indicators<br />
6.0<br />
4.0<br />
2.0<br />
0.0<br />
-2.0<br />
-4.0<br />
-6.0<br />
GDP Growth<br />
-8.0<br />
Fiscal Balance<br />
Current Account (%GDP)<br />
-10.0<br />
2009 2010 2011 2012(f) 2013(f)<br />
Source: Haver Analytics, IMF/WEO, <strong>EDC</strong> Economics<br />
Figure 19: Ease of Doing Business (WDI): Regional<br />
Comparison (best=1)<br />
160<br />
140<br />
120<br />
100<br />
80<br />
60<br />
40<br />
20<br />
0<br />
Mexico<br />
Source: Haver Analytics, EIU<br />
Belize<br />
Panama<br />
Columbia<br />
Brazil<br />
BACK TO TABLE OF CONTENTS 22
E X P O R T F O R E C A S T O V E R V I E W 2 0 1 2<br />
1.0 GEF Executive Summary<br />
2.0 Country Overviews<br />
2.1 Brazil<br />
2.2 <strong>Canada</strong><br />
2.3 China<br />
2.4 Euro Area<br />
2.5 India<br />
2.6 Japan<br />
2.7 Mexico<br />
2.8 Russian Federation<br />
2.9 South Africa<br />
2.10 United States<br />
3.0 Sector Overview<br />
4.0 Provincial <strong>Export</strong> Outlook<br />
5.0 Annexes<br />
2.8 Russian Federation<br />
Country Overview: Strong domestic demand has been<br />
facilitated by the steadily recovering domestic banking<br />
sector that has seen reduced pressure from loan-loss<br />
provisioning. The accompanying credit growth has been<br />
robust, with loan growth (y/y) rates in the double digits throughout 2011,<br />
rising to 27% by year-end. The ruling United Russia party suffered<br />
signifi cant losses in the parliamentary elections in December 2011. Even<br />
with the drop in popular support (down to 49% from 70% support in the<br />
2008 elections), there were allegations of widespread vote rigging which<br />
led to large demonstrations. While the protest movement failed to prevent<br />
Vladimir Putin’s re-election for president, his administration will have to<br />
be mindful of key constituencies opposing him, such as the urban middle<br />
class. This could result in greater efforts to tackle corruption and perhaps<br />
give greater voice to economic liberals within government.<br />
Trade and Investment Environment: Trade and investment matters are<br />
strategic areas of both domestic and foreign policy. The government has at<br />
times intervened in sectors deemed to be strategic to Russia’s foreign and<br />
security or commercial policies, such as oil and gas, minerals, defence<br />
and aerospace. While fi ghting graft has become a key policy focus of<br />
the former Medvedev government with notable effort on tackling lowlevel<br />
corruption, the government has acknowledged that more progress<br />
is needed. According to the World Bank’s “Ease of Doing Business 2012,”<br />
Russia ranked 120 out of 183 economies. WTO accession later this year<br />
will bring reduced tariff rates on specifi c products such as agriculture<br />
equipment and machinery, which will drop immediately from 15% to<br />
5%. The ancillary benefi ts of ameliorating operating environment and<br />
protection of intellectual property (IP) rights will be much more gradual and<br />
should lead to a marked improvement in the predictability, transparency<br />
and dispute resolution options available to exporters.<br />
Outlook: The cyclical recovery is being supported by growing consumer<br />
demand and improving conditions in the financial sector; however, the<br />
deteriorating conditions in the Eurozone and uncertainty over future<br />
government policies represent downside risks. The medium-term outlook<br />
is clouded by unfavourable demographics and productivity constraints.<br />
In addition to a challenging investment environment, Russia’s history of<br />
volatile growth and inflation are key impediments to foreign investment and<br />
stable growth. Despite medium-term structural challenges, public debt is<br />
just 12% of GDP and will remain manageable for the foreseeable future.<br />
Country Stats<br />
President<br />
Dmitry Medvedev<br />
and Vladimir Putin<br />
as of May 7th<br />
Next Elections<br />
• Duma: December 2017<br />
• Presidential: 2018<br />
Nominal GDP (2011)<br />
USD 1.8 trillion<br />
Total Trade/GDP (2011):<br />
54%<br />
Exchange Regime:<br />
Managed fl oat<br />
Merchandise Imports from<br />
<strong>Canada</strong> (2011):<br />
CAD 1,497 million<br />
Main Imports:<br />
M&E, food & agricultural<br />
products, chemicals, metals<br />
Source: IMF, EIU &<br />
Statistics <strong>Canada</strong><br />
Risks to the Outlook:<br />
Continuing strong<br />
commodity prices;<br />
progress on<br />
privatization<br />
Escalating debt<br />
crisis in Europe;<br />
delayed structural<br />
reforms<br />
Figure 20: Russia – Economic Indicators<br />
6.0<br />
4.0<br />
2.0<br />
0.0<br />
-2.0<br />
Figure 21: Ease of Doing Business (WDI): Regional<br />
Comparison (best=1)<br />
180<br />
160<br />
140<br />
120<br />
100<br />
Russia<br />
Ukraine<br />
-4.0<br />
-6.0<br />
GDP Growth<br />
-8.0<br />
Fiscal Balance<br />
Current Account (%GDP)<br />
-10.0<br />
2009 2010 2011 2012(f) 2013(f)<br />
Source: Haver Analytics, EIU, <strong>EDC</strong> Economics<br />
80<br />
60<br />
40<br />
20<br />
0<br />
Turkey<br />
Poland<br />
Source: Haver Analytics, EIU<br />
Hungary<br />
BACK TO TABLE OF CONTENTS 23
E X P O R T F O R E C A S T O V E R V I E W 2 0 1 2<br />
1.0 GEF Executive Summary<br />
2.0 Country Overviews<br />
2.1 Brazil<br />
2.2 <strong>Canada</strong><br />
2.3 China<br />
2.4 Euro Area<br />
2.5 India<br />
2.6 Japan<br />
2.7 Mexico<br />
2.8 Russian Federation<br />
2.9 South Africa<br />
2.10 United States<br />
3.0 Sector Overview<br />
4.0 Provincial <strong>Export</strong> Outlook<br />
5.0 Annexes<br />
2.9 South Africa<br />
Country Overview: South Africa is noteworthy both on its own<br />
merits and as a gateway into the region. Its ports systems<br />
are essential to many of its land-locked neighbours.<br />
The ruling African National Congress’s position is well established for<br />
the foreseeable future, although President Zuma’s tenure is less certain.<br />
Presidential and legislative elections are due in 2014. The continent’s<br />
largest economy is well diversifi ed and has a sizable private sector. The<br />
fi nancial sector is highly developed and well supervised. The Central Bank<br />
has independence and the legal system is effective and transparent.<br />
Economic growth is getting back on track. Although last year’s recovery will<br />
be interrupted by the EU’s false start and weaker growth in China, expect<br />
a 2.8% outcome this year followed by a 3.5% gain in 2013. Household<br />
debt loads have eased and consumer activity is recovering. Private sector<br />
credit growth remains soft with a 25% unemployment rate. The CB will<br />
likely nudge rates higher by year-end to temper infl ation pressures.<br />
Trade and Investment Environment: On an annual basis, total trade<br />
(goods) amounts to half of GDP, while inbound FDI and capital infl ows<br />
account for about 5% of GDP – matching the current account shortfall.<br />
Given the importance of trade and investment, the government is<br />
expected to ensure that the business-friendly environment remains intact,<br />
though there are certain uncertainties. Since 1994 the government has<br />
been gradually implementing its “Black Economic Empowerment” (BEE)<br />
strategy. The intent is to redress the inequities created under Apartheid.<br />
Nationalistic strains within the ANC have also hampered the investment<br />
environment. Mining nationalization continues to make headlines despite<br />
repeated government claims to the contrary. Organized labour action is<br />
another consideration. Workers often strike to channel their grievances<br />
to employers and exert pressure on the government to adopt pro-worker<br />
policies.<br />
Outlook: South Africa’s fortunes are tied to the health of the US, EU<br />
and increasingly the Asian economies. However, there remain stumbling<br />
blocks including a signifi cant infrastructure defi cit and lingering socioeconomic<br />
imbalances. In spite of occasional factionalism, the ruling ANC<br />
is well positioned to retain power. South Africa continues to have extensive<br />
economic and political relations with the regional and international<br />
community, which will likely provide a degree of continuity.<br />
Country Stats<br />
President<br />
Jacob Zuma<br />
Next Elections<br />
• Legislative: April 2014<br />
• Presidential: April 2014<br />
Nominal GDP PPP (2011e)<br />
USD 406 billion<br />
Total Trade/GDP:<br />
48%<br />
Exchange Regime:<br />
Free fl oat<br />
Merchandise Imports from<br />
<strong>Canada</strong> (2011):<br />
CAD 632 million<br />
Main Imports:<br />
Manufactured goods<br />
Source: IMF, EIU &<br />
Statistics <strong>Canada</strong><br />
Risks to the Outlook:<br />
Low external and<br />
government debt<br />
burden; solid<br />
banking sector<br />
Weak currency;<br />
large current<br />
account defi cit;<br />
shift in investor<br />
sentiment<br />
Figure 22: South Africa – Economic Indicators<br />
10.0<br />
5.0<br />
GDP Growth<br />
Fiscal Balance<br />
Current Account (%GDP)<br />
Figure 23: Ease of Doing Business (WDI): Regional<br />
Comparison (best=1)<br />
180<br />
160<br />
140<br />
Zimbabwe<br />
0.0<br />
120<br />
100<br />
80<br />
Seychelles<br />
Zambia<br />
Kenya<br />
-5.0<br />
60<br />
40<br />
20<br />
South Africa<br />
-10.0<br />
2009 2010 2011 2012(f) 2013(f)<br />
Source: Haver Analytics, IMF/WEO, <strong>EDC</strong> Economics<br />
0<br />
Source: Haver Analytics, EIU<br />
BACK TO TABLE OF CONTENTS 24
E X P O R T F O R E C A S T O V E R V I E W 2 0 1 2<br />
1.0 GEF Executive Summary<br />
2.0 Country Overviews<br />
2.1 Brazil<br />
2.2 <strong>Canada</strong><br />
2.3 China<br />
2.4 Euro Area<br />
2.5 India<br />
2.6 Japan<br />
2.7 Mexico<br />
2.8 Russian Federation<br />
2.9 South Africa<br />
2.10 United States<br />
3.0 Sector Overview<br />
4.0 Provincial <strong>Export</strong> Outlook<br />
5.0 Annexes<br />
2.10 United States<br />
Country Overview: The US accounts for 20% of<br />
global GDP and is ranked 4th best country in the world<br />
in terms of ease of doing business (World Bank).<br />
Trade and Investment Environment: <strong>Export</strong>s of Canadian goods to the<br />
US are forecasted to grow by just over 7% this year and next. This year<br />
would mark the fi rst time in 12 years that exports to the US have grown<br />
faster than to the rest of the world. The US accounts for over 70% of<br />
our merchandise exports, 40% of the stock of Canadian direct investment<br />
abroad, and 50% of all sales made by Canadian foreign affi liates. In<br />
terms of ease of trading across borders, enforcing contracts and resolving<br />
insolvency, the US ranks 20th, 7th and 15th, respectively (World Bank).<br />
Outlook: Although consumer confi dence remains well below normal<br />
levels, it is trending upwards. Supporting this is continued deleveraging<br />
by US households which will cap upside risk to consumer spending, but<br />
leave household balance sheets in good shape 2 years from now. Home<br />
builder confi dence is slowly improving supported by falling inventory of<br />
existing homes for sale and record housing affordability. We expect good<br />
growth in housing but overall activity will remain well below normal levels.<br />
Commercial construction also appears to be fi nding a fl oor, with banks<br />
showing easing lending standards and increased demand for related<br />
loans. The outlook for manufacturing is positive supported by broader<br />
improvements in the domestic economy, and moderated, but still strong<br />
demand, for exports. Most importantly there is also emerging evidence that<br />
small businesses, traditionally the main source of job growth in a recovery,<br />
are feeling more comfortable about the state of the US economy. The<br />
corporate sector as a whole is recording solid profi ts and their balance<br />
sheets are flush with cash.<br />
There remain formidable downside risks to the outlook, most notably<br />
the unresolved sovereign debt crisis in Europe. Add to this the price of<br />
oil, which could spike on political risks in the Middle East (particularly<br />
Iran), pushing up the price of gasoline, acting as a tax for consumers<br />
and businesses alike. Finally, the outcome of this year’s elections is<br />
of particular importance given implications on potential changes in<br />
government spending and taxation. Current legislation is estimated to<br />
cut roughly 2.5 percentage points from 2013 GDP growth (our forecast<br />
includes roughly half of this fi gure).<br />
Country Stats<br />
President<br />
Barak Obama<br />
Next Elections<br />
Presidential:<br />
November 2012<br />
Nominal GDP (2011)<br />
USD 15.1 trillion<br />
Total Trade / GDP:<br />
25%<br />
Exchange Regime:<br />
Independent fl oat<br />
Merchandise Imports from<br />
<strong>Canada</strong> (2011):<br />
CAD 330 billion<br />
Main Imports:<br />
Consumer goods e.g. autos,<br />
services, capital goods,<br />
petroleum, industrial supplies<br />
Source: IMF, EIU &<br />
Statistics <strong>Canada</strong><br />
Risks to the Outlook:<br />
Further<br />
fi scal<br />
stimulus<br />
Escalating debt crisis<br />
in Europe;<br />
higher gasoline<br />
prices<br />
Figure 24: US – Economic Indicators<br />
10.0<br />
5.0<br />
GDP Growth<br />
Fiscal Balance<br />
Current Account (%GDP)<br />
Figure 25: Ease of Doing Business (WDI): Regional<br />
Comparison (best=1)<br />
60<br />
50<br />
Mexico<br />
0.0<br />
40<br />
-5.0<br />
-10.0<br />
30<br />
20<br />
10<br />
US<br />
UK<br />
<strong>Canada</strong><br />
Japan<br />
-15.0<br />
2009 2010 2011 2012(f) 2013(f)<br />
Source: Haver Analytics, EIU, <strong>EDC</strong> Economics<br />
0<br />
Source: Haver Analytics, EIU<br />
BACK TO TABLE OF CONTENTS 25
E X P O R T F O R E C A S T O V E R V I E W 2 0 1 2<br />
1.0 GEF Executive Summary<br />
3.0 Sector Overview<br />
2.0 Country Overviews<br />
3.0 Sector Overview<br />
3.1 Energy<br />
3.2 Ores and Metals<br />
3.3 Agri-Food<br />
3.4 Fertilizers<br />
3.5 Forestry Products<br />
3.6 Automotive<br />
3.7 Industrial Machinery<br />
and Equipment<br />
3.8 Advanced Technology<br />
3.9 Aerospace<br />
3.10 Chemicals and Plastics<br />
3.11 Consumer Goods<br />
3.12 Services <strong>Export</strong> Sector<br />
4.0 Provincial <strong>Export</strong> Outlook<br />
5.0 Annexes<br />
BACK TO TABLE OF CONTENTS 26
E X P O R T F O R E C A S T O V E R V I E W 2 0 1 2<br />
1.0 GEF Executive Summary<br />
2.0 Country Overviews<br />
3.0 Sector Overview<br />
3.1 Energy<br />
3.2 Ores and Metals<br />
3.3 Agri-Food<br />
3.4 Fertilizers<br />
3.5 Forestry Products<br />
3.6 Automotive<br />
3.7 Industrial Machinery<br />
and Equipment<br />
3.8 Advanced Technology<br />
3.9 Aerospace<br />
3.10 Chemicals and Plastics<br />
3.11 Consumer Goods<br />
3.12 Services <strong>Export</strong> Sector<br />
4.0 Provincial <strong>Export</strong> Outlook<br />
5.0 Annexes<br />
3.0 Sector Overview<br />
After a solid performance in 2011, Canadian exports of goods will continue their upward climb this<br />
year and next, albeit at a slower pace than in the past 2 years growing 8% in both years. The loonie is<br />
expected to remain around parity with the USD, presenting ongoing cost and competitive challenges<br />
for Canadian exporters; however, some reprieve is expected next year as falling commodity prices drag<br />
the loonie down; <strong>EDC</strong> Economics’ outlook is for the Canadian dollar to average USD 1.01 this year and<br />
USD 0.97 in 2013.<br />
High commodity prices continue to be a key driver for several export sectors, and while a softening<br />
in most prices has already begun (and is expected to continue) they will remain well above historical<br />
norms. For the energy and metals and mining sectors, the effects of high prices will translate into<br />
higher volume shipments beyond the forecast horizon even as the nominal effect wanes. The pricing<br />
environment will also fuel the ongoing ramp-up in global exploration and development activity and<br />
lead to sustained foreign demand for Canadian-made machinery and equipment in 2012, accelerating<br />
further in 2013.<br />
Weakness emanating from Europe over the next 2 years will be partially offset by an accelerating<br />
US economic recovery. <strong>EDC</strong> Economics’ view that US housing starts will rise to 800,000 units this<br />
year, along with the signifi cant deleveraging of US households and the improvement in the labour<br />
market, shapes the export outlook for several key Canadian industries, including consumer goods,<br />
forestry products, and chemicals and plastics. Underperforming will be the aerospace industry, which<br />
continues to feel the lagged impacts of the last crisis, and advanced technology with a much-reduced<br />
export capacity. And finally, the elimination of adverse supply-side conditions will lead to a rebound in<br />
automotive production this year (after facing signifi cant parts shortages due to catastrophic weather in<br />
Asia last year) and also in the volume of agri-food (which battled diffi cult weather conditions in 2011),<br />
before moderating next year.<br />
Table 3: <strong>Export</strong> <strong>Forecast</strong> Overview<br />
CAD bn % Share of <strong>Export</strong> Outlook<br />
Total <strong>Export</strong>s<br />
(% growth)<br />
2011 2011 2011 2012(f) 2013(f)<br />
Agri-Food 44.2 8.9 12.8 8.3 5.1<br />
Energy 114.9 23.1 21.3 6.6 4.4<br />
Forestry 27.0 5.4 1.5 3.7 17.3<br />
Chemical and Plastics 35.2 7.1 8.4 7.4 6.4<br />
Fertilizers 8.7 1.7 29.2 10.0 7.7<br />
Metals, Ores and<br />
Other Industrial Products 72.4 14.6 15.9 6.7 9.8<br />
Aircraft and Parts 10.2 2.0 -0.2 7.2 9.5<br />
Advanced Technology 13.9 2.8 -2.0 2.0 2.4<br />
Industrial Machinery and Equip. 26.5 5.3 11.0 7.8 12.0<br />
Motor Vehicles and Parts 54.4 11.0 3.6 14.3 9.9<br />
Consumer Goods 8.1 1.6 6.7 4.3 6.0<br />
Special Transactions* 3.4 0.7 -8.0 6.0 9.8<br />
Total Goods Sector 418.8 84.3 11.9 7.6 7.8<br />
Total Service Sector 77.8 15.7 5.0 4.0 4.2<br />
Total <strong>Export</strong>s 496.6 100.0 10.8 7.1 7.3<br />
Total Volumes 100.0 3.3 6.4 4.6<br />
Total Goods Nominal<br />
(excl. Energy) 303.9 61.2 8.7 8.0 9.1<br />
Total Goods Nominal<br />
(excl. Autos and Energy) 249.5 50.2 9.9 6.7 8.9<br />
Source: Statistics <strong>Canada</strong>. <strong>EDC</strong> Economics. 2011 is actual data while 2012 and 2013 are forecast. Special transactions* mainly low-valued<br />
transactions, value of repairs to equipment and goods returned to country of origin.<br />
BACK TO TABLE OF CONTENTS 27
E X P O R T F O R E C A S T O V E R V I E W 2 0 1 2<br />
1.0 GEF Executive Summary<br />
2.0 Country Overviews<br />
3.0 Sector Overview<br />
3.1 Energy<br />
3.2 Ores and Metals<br />
3.3 Agri-Food<br />
3.4 Fertilizers<br />
3.5 Forestry Products<br />
3.6 Automotive<br />
3.7 Industrial Machinery<br />
and Equipment<br />
3.8 Advanced Technology<br />
3.9 Aerospace<br />
3.10 Chemicals and Plastics<br />
3.11 Consumer Goods<br />
3.12 Services <strong>Export</strong> Sector<br />
4.0 Provincial <strong>Export</strong> Outlook<br />
5.0 Annexes<br />
3.1 Energy<br />
After rising 21% in 2011, energy sales will rise 7% in 2012 and another<br />
4% in 2013. Support this year comes mostly from gains in crude oil pricing<br />
and shipments, while stronger natural gas sales will do much of the heavy<br />
lifting in 2013. Coal sales growth will be soft this year due to pricing, but<br />
will post stronger results next year.<br />
Elevated global oil prices will spell solid opportunities for <strong>Canada</strong>’s oil<br />
shipments going forward. Canadian supply is expected to rise through<br />
the forecast, supported largely by increased output from Albertan oil<br />
sands. Perhaps more interesting, however, is the reversal of the decline<br />
in conventional oil production. Traditionally a headwind for the industry,<br />
related production actually rose last year. With Canadian oil rigs operation<br />
near all-time highs, we expect this new-found tailwind to provide a modest<br />
lift to export growth through the forecast. With global supply interruptions<br />
threatening in Iran, South Sudan, Syria and Yemen, the price of WTI crude<br />
will hover around USD100/bbl this year before slipping to $95/bbl in 2013.<br />
Accordingly, sales of petroleum and related products will grow 12% in<br />
2012, followed by a 3% gain next year.<br />
The story for natural gas is much more volatile with exports expected to<br />
fall 26% this year, followed by a 19% gain in 2013. The forecast is mainly<br />
driven by our price outlook, which sees Henry Hub gas selling for USD3/<br />
mmbtu in 2012 and $3.50/mmbtu in 2013. The US remains awash in shale<br />
gas and although drilling activity continues to fall, inventories stand near<br />
record highs. With prices holding well below levels seen only a few years<br />
ago, there is little incentive to increase production of conventional gas<br />
here in <strong>Canada</strong>. Lower all-in production costs for shale gas points to a<br />
more optimistic view for production in British Columbia. Over the longer<br />
term, shale gas will look even more attractive, as investment in natural<br />
gas liquefaction capabilities permits the export of gas to lucrative Asian<br />
markets.<br />
Sector Stats<br />
International <strong>Export</strong>s<br />
2011: CAD 114.9 bn<br />
Number of <strong>Export</strong>ers<br />
2010: 49<br />
2000: 42<br />
Share of Total<br />
Canadian <strong>Export</strong>s<br />
2011: 23.2%<br />
Sector Distribution<br />
across provinces:<br />
NFLD: 6.9%<br />
NB: 9.3%<br />
NS: 0.4%<br />
PEI: 0.0%<br />
QC: 2.9%<br />
ON: 2.7%<br />
MN: 1.0%<br />
SK: 9.1%<br />
AB: 58.8%<br />
BC: 8.8%<br />
Canadian Direct<br />
Investment Abroad (2010):<br />
CAD 87.3 bn<br />
Source: Statistics <strong>Canada</strong><br />
Figure 26: Industrial Production and Crude <strong>Forecast</strong><br />
Table 4: Energy <strong>Export</strong> Outlook by Region<br />
160.00<br />
140.00<br />
120.00<br />
100.00<br />
80.00<br />
60.00<br />
40.00<br />
20.00<br />
Jan-04<br />
US Nominal Crude Oil Prices: WTI Spot Average ($ Per Barrel) (LS)<br />
US Industrial Production (2002=100) (RS)<br />
Jan-05<br />
Jan-06<br />
Jan-07<br />
Source: Haver Analytics, EIA<br />
Jan-08<br />
Jan-09<br />
Jan-10<br />
Jan-11<br />
Jan-12<br />
Jan-13<br />
115<br />
110<br />
105<br />
100<br />
95<br />
90<br />
85<br />
80<br />
Top Markets CAD bn % Share <strong>Export</strong> Outlook<br />
of <strong>Export</strong>s (% growth)<br />
2011 2011 2011 2012(f) 2013(f)<br />
Developed Markets<br />
United States 104.0 90.5 19 7 4<br />
Western Europe 3.2 2.8 85 2 1<br />
Japan, Oceania<br />
and Developed Asia 4.6 4.0 41 2 3<br />
Emerging Markets<br />
Latin America<br />
and Caribbean 1.4 1.3 81 5 2<br />
Emerging Europe<br />
and Central Asia 0.3 0.3 67 1 4<br />
Africa and the Middle East 0.2 0.1 180 9 3<br />
Emerging Asia 1.6 1.4 6 9 9<br />
Total Developed Markets 111.3 96.9 21 7 4<br />
Total Emerging Markets 3.5 3.1 38 7 6<br />
Total World 114.9 100.0 21 7 4<br />
Source: Statistics <strong>Canada</strong>, <strong>EDC</strong> Economics. 2011 is actual data, while 2012 and 2013 are<br />
forecast.<br />
BACK TO TABLE OF CONTENTS 28
E X P O R T F O R E C A S T O V E R V I E W 2 0 1 2<br />
1.0 GEF Executive Summary<br />
2.0 Country Overviews<br />
3.0 Sector Overview<br />
3.1 Energy<br />
3.2 Ores and Metals<br />
3.3 Agri-Food<br />
3.4 Fertilizers<br />
3.5 Forestry Products<br />
3.6 Automotive<br />
3.7 Industrial Machinery<br />
and Equipment<br />
3.8 Advanced Technology<br />
3.9 Aerospace<br />
3.10 Chemicals and Plastics<br />
3.11 Consumer Goods<br />
3.12 Services <strong>Export</strong> Sector<br />
4.0 Provincial <strong>Export</strong> Outlook<br />
5.0 Annexes<br />
3.2 Ores and Metals<br />
<strong>Export</strong>s from the metals complex were again star performers on <strong>Canada</strong>’s<br />
trade stage in 2011 as insatiable demand from emerging markets and<br />
record high prices for metals pushed the sector’s foreign sales to an all-time<br />
high. <strong>EDC</strong> Economics expects some softening in prices over the forecast<br />
horizon as market dynamics for most base metals return to equilibrium,<br />
Chinese growth moderates and the attraction of metals as a fi nancial<br />
asset diminishes. However, even a weaker pricing environment will see<br />
high prices fuelling investment in Greenfi eld and Brownfi eld projects.<br />
Gold prices will likely prove stickier as central banks in developed markets<br />
maintain unprecedented monetary conditions to foster growth and stave<br />
off tightening credit conditions. Producers will face increased competition<br />
for scarce resources, keeping industry costs elevated.<br />
Canadian iron ore shipments will get another hefty boost in 2012 as<br />
production at Quebec’s Bloom Lake mine ramps up; current Phase 2<br />
expansion will double output over the next few years. Foreign sales of<br />
nickel will also add to growth this year, thanks to Vale’s return to normal at<br />
Sudbury and Voisey’s Bay after last year’s supply interruptions. Foreign<br />
sales of precious metals will keep soaring in 2012. Canadian gold mine<br />
output is set to jump over 20% with incremental gains contributed mostly<br />
by Osisko’s Malartic mine. Despite the trend of declining ore grades and<br />
higher costs, record gold prices will continue to drive investment.<br />
The outlook for US vehicle production and construction is quite bright<br />
over the next 2 years, providing a life to manufactured metals. Aluminum<br />
exports, however, will underperform due to relatively fl at smelting capacity;<br />
signifi cant additions to the Kitimat smelter in British Columbia will provide<br />
some momentum in 2015 and beyond. For Canadian steel makers,<br />
structural conditions on both the supply and demand sides will remain<br />
challenging over the next several years. The sector’s export performance<br />
will refl ect both current excess plant capacity and sliding demand as steel<br />
usage in construction falls.<br />
Sector Stats<br />
International <strong>Export</strong>s<br />
2011: CAD 72.4 bn<br />
Number of <strong>Export</strong>ers<br />
2010: 2,761<br />
1999: 3,081<br />
Share of Total<br />
Canadian <strong>Export</strong>s<br />
2011: 14.6%<br />
Sector Distribution<br />
across provinces:<br />
NFLD: 4.2%<br />
NB: 0.8%<br />
NS: 0.4%<br />
PEI: 0.0%<br />
QC: 25.4%<br />
ON: 52.4%<br />
MN: 2.8%<br />
SK: 0.5%<br />
AB: 3.5%<br />
BC: 7.3%<br />
Canadian Direct<br />
Investment Abroad (2010):<br />
CAD 58 bn<br />
Source: Statistics <strong>Canada</strong><br />
Figure 27: Metals & Mining: Pricing and Activity<br />
1,000<br />
800<br />
600<br />
400<br />
200<br />
0<br />
20081<br />
20082<br />
Capacity Utilization: Primary Metal Manufacturing (%) (RS)<br />
Commodity Price Index: Metals/Minerals (LS)<br />
Source: Haver Analytics<br />
20083<br />
20084<br />
20091<br />
20092<br />
20093<br />
20094<br />
20101<br />
20102<br />
20103<br />
20104<br />
20111<br />
20112<br />
20113<br />
20114<br />
120<br />
100<br />
80<br />
60<br />
40<br />
20<br />
0<br />
Table 5: Canadian Metal Ores and<br />
Metal Products <strong>Export</strong> Outlook by Region<br />
Top Markets CAD bn % Share <strong>Export</strong> Outlook<br />
of <strong>Export</strong>s (% growth)<br />
2011 2011 2011 2012(f) 2013(f)<br />
Developed Markets<br />
United States 33.0 49.7 7 9 8<br />
Western Europe 20.6 31.1 25 3 9<br />
Japan, Oceania<br />
and Developed Asia 4.7 7.1 50 7 12<br />
Emerging Markets<br />
Latin America<br />
and Caribbean 1.4 2.1 20 6 11<br />
Emerging Europe<br />
and Central Asia 0.7 1.1 157 4 11<br />
Africa and the Middle East 0.8 1.2 25 5 9<br />
Emerging Asia 5.2 7.8 36 18 21<br />
Total Developed Markets 58.3 87.8 16 7 9<br />
Total Emerging Markets 8.1 12.2 37 13 17<br />
Total World 66.4 100.0 18 8 10<br />
Source: Statistics <strong>Canada</strong>, <strong>EDC</strong> Economics. 2011 is actual data while 2012 and 2013<br />
are forecast.<br />
BACK TO TABLE OF CONTENTS 29
E X P O R T F O R E C A S T O V E R V I E W 2 0 1 2<br />
1.0 GEF Executive Summary<br />
2.0 Country Overviews<br />
3.0 Sector Overview<br />
3.1 Energy<br />
3.2 Ores and Metals<br />
3.3 Agri-Food<br />
3.4 Fertilizers<br />
3.5 Forestry Products<br />
3.6 Automotive<br />
3.7 Industrial Machinery<br />
and Equipment<br />
3.8 Advanced Technology<br />
3.9 Aerospace<br />
3.10 Chemicals and Plastics<br />
3.11 Consumer Goods<br />
3.12 Services <strong>Export</strong> Sector<br />
4.0 Provincial <strong>Export</strong> Outlook<br />
5.0 Annexes<br />
3.3 Agri-Food<br />
<strong>Canada</strong>’s agricultural exports will perform well in 2012 as harvests soar<br />
after difficult weather conditions in 2011. <strong>EDC</strong> Economics is forecasting<br />
an 8% gain this year and a further 5% increase in 2013. After a 2-year<br />
struggle with water-saturated soils in the Prairies, seeded area will rise<br />
impressively this year and yields will return to trend. Overall, the next<br />
2 years should be very positive for the Canadian agri-food industry<br />
because of skyrocketing demand from emerging markets as well as rising<br />
use of grains for biofuel.<br />
In 2011, commodity prices surged to record highs but retreated in the<br />
second half as global production began to catch up to mounting demand.<br />
Moreover, many of the fearful stories of droughts and disasters that rattled<br />
global commodity markets either failed to materialize or were not as<br />
bad as expected. While prices are off their peak, and expected to soften<br />
somewhat in 2012, they remain very strong by historical standards. In fact,<br />
even if the world has a record grain harvest, without severe weather, it<br />
would only enable production to catch up with demand. Canadian farmers<br />
will continue to shift production toward the most lucrative crops, such as<br />
canola and durum wheat, which will be key contributors to export growth.<br />
Wheat will also see increased production, as seeded area is forecast to<br />
rise 11%.<br />
<strong>Canada</strong>’s exports of processed food and beverages will show modest<br />
growth, but pricing will increase only moderately as confi dence remains<br />
shaky and strained consumers will remain price-sensitive at the grocery<br />
store. As labour markets improve and household deleveraging tapers off,<br />
consumers will spend more on higher-margin specialty items. <strong>Canada</strong>’s<br />
fi sh exports will rise 3% this year and next. Crab prices will continue<br />
to receive a boost from weak Alaskan supplies, but salmon prices are<br />
dropping fast as Chilean supplies return to the market. Weak prices will<br />
persist, but the net effect will be a slight improvement overall.<br />
Sector Stats<br />
International <strong>Export</strong>s<br />
2011: CAD 44.2 bn<br />
Number of <strong>Export</strong>ers<br />
2010: 2,925<br />
1999: 3,484<br />
Share of Total<br />
Canadian <strong>Export</strong>s<br />
2011: 8.9%<br />
Sector Distribution<br />
across provinces:<br />
NFLD: 2.0%<br />
NB: 3.1%<br />
NS: 2.6%<br />
PEI: 1.1%<br />
QC: 12.7%<br />
ON: 22.1%<br />
MN: 9.7%<br />
SK: 23.0%<br />
AB: 17.9%<br />
BC: 5.9%<br />
Canadian Direct<br />
Investment Abroad (2010)*:<br />
CAD 11.7 bn<br />
*Food, beverage and tobacco - does<br />
not include NAICS 11<br />
Source: Statistics <strong>Canada</strong><br />
Figure 28: <strong>Global</strong> Grain Market Returning to Balance<br />
(millions of metric tonnes)<br />
2,400<br />
2,300<br />
2,200<br />
2,100<br />
2,000<br />
1,900<br />
1,800<br />
1,700<br />
1,600<br />
Demand<br />
Production<br />
1990<br />
1992<br />
1994<br />
1996<br />
1998<br />
2000<br />
2002<br />
2004<br />
2006<br />
2008<br />
2010<br />
2012<br />
Source: USDA World Agriculture Supply and Demand Estimates<br />
Table 6: Agri-Food <strong>Export</strong> Outlook by Region<br />
Top Markets CAD bn % Share <strong>Export</strong> Outlook<br />
of <strong>Export</strong>s (% growth)<br />
2011 2011 2011 2012(f) 2013(f)<br />
Developed Markets<br />
United States 21.9 49.6 10.6 6 6<br />
Western Europe 3.2 7.2 22.0 9 1<br />
Japan, Oceania<br />
and Developed Asia 6.2 14.0 21.0 10 5<br />
Emerging Markets<br />
Latin America<br />
and Caribbean 3.5 7.9 10.9 6 3<br />
Emerging Europe<br />
and Central Asia 1.0 2.2 21.0 8 8<br />
Africa and the Middle East 2.4 5.5 7.7 7 0<br />
Emerging Asia 6.0 13.5 10.5 15 8<br />
Total Developed Markets 31.3 70.9 13.6 7 5<br />
Total Emerging Markets 12.9 29.1 10.8 11 5<br />
Total World 44.2 100.0 12.8 8 5<br />
Source: Statistics <strong>Canada</strong>, <strong>EDC</strong> Economics. 2011 is actual data while 2012 and 2013<br />
are forecast.<br />
BACK TO TABLE OF CONTENTS 30
E X P O R T F O R E C A S T O V E R V I E W 2 0 1 2<br />
1.0 GEF Executive Summary<br />
2.0 Country Overviews<br />
3.0 Sector Overview<br />
3.1 Energy<br />
3.2 Ores and Metals<br />
3.3 Agri-Food<br />
3.4 Fertilizers<br />
3.5 Forestry Products<br />
3.6 Automotive<br />
3.7 Industrial Machinery<br />
and Equipment<br />
3.8 Advanced Technology<br />
3.9 Aerospace<br />
3.10 Chemicals and Plastics<br />
3.11 Consumer Goods<br />
3.12 Services <strong>Export</strong> Sector<br />
4.0 Provincial <strong>Export</strong> Outlook<br />
5.0 Annexes<br />
3.4 Fertilizers<br />
<strong>Global</strong> demand for fertilizer and Canadian fertilizer exports is expected<br />
to remain fi rm through most of 2012 following last year’s near record<br />
numbers. Both short- and long-term macro-fundamentals, including high<br />
food, fuel and feed prices, and tight global grain inventories, are positive<br />
factors. In addition, recent weather-related destruction of crops in several<br />
parts of the world will incent farmers to increase their use of fertilizer to<br />
boost yields.<br />
The softening of demand in Q4/11 has continued into 2012, but we expect<br />
demand for all three crop nutrients – nitrogen, phosphorus and potassium –<br />
to rebound. Overall, global demand for fertilizer is expected to increase by<br />
nearly 3% in 2012 according to the UN Food and Agricultural Organization<br />
(FAO). As in 2011, demand for Canadian exports into South East Asia,<br />
South Asia, China and Latin America will remain robust. Worries about<br />
the Eurozone could weaken developed market demand, but are unlikely<br />
to lead to a fertilizer market collapse as in 2009 given emerging market<br />
demand and food security requirements.<br />
Investments to increase global production continue as the fertilizer industry<br />
is close to capacity. Despite the new production coming online this year,<br />
especially for urea, nitrogen and phosphates, the impact on pricing will be<br />
muted as the supply and demand balance for crop nutrients remains tight.<br />
Furthermore, supply side levers available to potash producers should<br />
keep prices fi rm through much of 2012. Overall, despite some softening in<br />
the market, prices are likely to remain high and above long-term historical<br />
values. At the same time, elevated prices may be altering purchasing<br />
behaviour. Farmers and distributors, especially in North America, seem<br />
to be delaying nutrient purchases and adopting a “just-in time” approach<br />
to take advantage of anticipated price drops, when this behaviour in fact<br />
can bunch orders and precipitate price spikes. The evolution of Chinese<br />
authorities’ restrictions on fertilizer exports and Indian fertilizer contract<br />
negotiations and bookings can also add to pricing volatility.<br />
Sector Stats<br />
International <strong>Export</strong>s<br />
2011: CAD 8.7 bn<br />
Number of <strong>Export</strong>ers<br />
N/A<br />
Share of Total<br />
Canadian <strong>Export</strong>s<br />
2011: 1.7%<br />
Sector Distribution<br />
across provinces:<br />
NFLD: 0%<br />
NB: 3.5%<br />
NS: 0%<br />
PEI: 0%<br />
QC: 0.2%<br />
ON: 4.2%<br />
MN: 2.3%<br />
SK: 75.6%<br />
AB: 13.6%<br />
BC: 0.6%<br />
Canadian Direct<br />
Investment Abroad (2010):<br />
N/A<br />
Source: Statistics <strong>Canada</strong><br />
Figure 29: Fertilizers (USD/metric tonne)<br />
Table 7: Fertilizers <strong>Export</strong> Outlook by Region<br />
1600<br />
1400<br />
1200<br />
1000<br />
800<br />
600<br />
400<br />
200<br />
0<br />
Jan-2004<br />
Jul-2004<br />
DAP: U.S. (US$/Metric.Ton) (LS)*<br />
Potassium Chloride:*<br />
<strong>Canada</strong> (US$/Metric.Ton) (LS)<br />
TSP: U.S. (US$/Metric.Ton) (LS)*<br />
Urea:*<br />
Ukraine Bulk<br />
(US$/Metric.Ton) (LS)<br />
S&P GSCI Grains Index<br />
(Jan-5-70=100) (RS)<br />
*Average Price<br />
Source: Haver Analytics<br />
Jan-2005<br />
Jul-2005<br />
Jan-2006<br />
Jul-2006<br />
Jan-2007<br />
Jul-2007<br />
Jan-2008<br />
Jul-2008<br />
Jan-2009<br />
Jul-2009<br />
Jan-2010<br />
Jul-2010<br />
Jan-2011<br />
Jul-2011<br />
Jan-2012<br />
800<br />
700<br />
600<br />
500<br />
400<br />
300<br />
200<br />
100<br />
0<br />
Top Markets CAD bn % Share <strong>Export</strong> Outlook<br />
of <strong>Export</strong>s (% growth)<br />
2011 2011 2011 2012(f) 2013(f)<br />
Developed Markets<br />
United States 5.5 63.6 20.4 7 6<br />
Western Europe 0.0 0.2 -48.4 5 5<br />
Japan, Oceania<br />
and Developed Asia 0.2 2.3 72.5 10 7<br />
Emerging Markets<br />
Latin America<br />
and Caribbean 0.9 10.6 44.7 14 7<br />
Emerging Europe<br />
and Central Asia 0.0 0.0 -42.0 6 7<br />
Africa and the Middle East 0.0 0.1 88.6 7 5<br />
Emerging Asia 2.0 23.2 50.2 17 13<br />
Total Developed Markets 5.7 66.1 21.2 7 6<br />
Total Emerging Markets 2.9 33.9 48.5 16 11<br />
Total World 8.7 100.0 29.2 10 8<br />
Source: Statistics <strong>Canada</strong>, <strong>EDC</strong> Economics. 2011 is actual data while 2012 and 2013<br />
are forecast.<br />
BACK TO TABLE OF CONTENTS 31
E X P O R T F O R E C A S T O V E R V I E W 2 0 1 2<br />
1.0 GEF Executive Summary<br />
2.0 Country Overviews<br />
3.0 Sector Overview<br />
3.1 Energy<br />
3.2 Ores and Metals<br />
3.3 Agri-Food<br />
3.4 Fertilizers<br />
3.5 Forestry Products<br />
3.6 Automotive<br />
3.7 Industrial Machinery<br />
and Equipment<br />
3.8 Advanced Technology<br />
3.9 Aerospace<br />
3.10 Chemicals and Plastics<br />
3.11 Consumer Goods<br />
3.12 Services <strong>Export</strong> Sector<br />
4.0 Provincial <strong>Export</strong> Outlook<br />
5.0 Annexes<br />
3.5 Forestry Products<br />
The US housing market is about to take off, with home inventories at<br />
their lowest since 2006, housing affordability at record highs, and the US<br />
economy adding an average 320,000 jobs per month since July. There is<br />
also growing anecdotal evidence that banks are working with distressed<br />
homeowners rather than foreclosing. With substantial capacity curtailed<br />
during the downturn, both temporary and permanent, we expect shortterm<br />
price pressures in 2012 and 2013 while supply chains are rebuilt.<br />
West Coast producers will also benefi t from greater reconstruction activity<br />
in Japan after last year’s tsunami. <strong>Export</strong>s to China will moderate in 2012<br />
as the Chinese housing market is facing excesses of its own, which<br />
need to be cleared. Furthermore, Chinese importers may favour Russian<br />
suppliers, as Russia is expected to lower its log export tax to comply with<br />
its WTO accession obligations.<br />
Pulp demand from China, now <strong>Canada</strong>’s largest export market, appears<br />
to be stabilizing following the inventory down cycle in the second half of<br />
2011. While global producers are making early calls for price increases<br />
to Asia, signifi cant additions to global pulp capacity late in 2011 and<br />
the economic slowdown in China suggest increases will be limited. The<br />
economic weakness in Europe, combined with a generalized declining<br />
trend in paper consumption in industrial economies, will keep pulp<br />
inventories at comfortable levels.<br />
While the long-standing decline in paper consumption will continue in<br />
industrial economies, a more positive US economic outlook will improve<br />
demand for ad lineage, offi ce papers, magazines, containerboard and<br />
packaging grades. Emerging market opportunities continue to present the<br />
best growth prospects going forward, although Asian producers are also<br />
making inroads in various segments. Industry consolidation will continue<br />
to rationalize excess capacity and maintain profi t margins in the sunset<br />
segments of the industry.<br />
Sector Stats<br />
International <strong>Export</strong>s<br />
2011: CAD 27 bn<br />
Number of <strong>Export</strong>ers*<br />
2010: 1,063<br />
2000: 1,526<br />
Share of Total<br />
Canadian <strong>Export</strong>s<br />
2011: 5.4%<br />
Sector Distribution<br />
across provinces:<br />
NFLD: 0.6%<br />
NB: 5.6%<br />
NS: 2.7%<br />
PEI: 0%<br />
QC: 27.4%<br />
ON: 17%<br />
MN: 1.5%<br />
SK: 1.0%<br />
AB: 7.7%<br />
BC: 36.6%<br />
Canadian Direct<br />
Investment Abroad (2010)*:<br />
CAD 10.5 bn<br />
*includes wood and paper products;<br />
excludes NAICS 11<br />
Source: Statistics <strong>Canada</strong><br />
Figure 30: US Housing Recovery Under Way<br />
2,000<br />
1,800<br />
1,600<br />
1,400<br />
1,200<br />
1,000<br />
800<br />
600<br />
400<br />
200<br />
0<br />
Mar-02<br />
Housing Starts, Singles (SAAR, Thous.) (LS)<br />
New Single Houses For Sale, Months Supply (SA) - (RS)<br />
Months' Supply of Existing Single Fam Homes on the Market (SA) - (RS)<br />
Mar-03<br />
Mar-04<br />
Mar-05<br />
Source: Haver Analytics<br />
Mar-06<br />
Mar-07<br />
Mar-08<br />
Mar-09<br />
Mar-10<br />
Mar-11<br />
Mar-12<br />
20.0<br />
18.0<br />
16.0<br />
14.0<br />
12.0<br />
10.0<br />
8.0<br />
6.0<br />
4.0<br />
2.0<br />
0.0<br />
Table 8: Forestry <strong>Export</strong> Outlook by Region<br />
Top Markets CAD bn % Share <strong>Export</strong> Outlook<br />
of <strong>Export</strong>s (% growth)<br />
2011 2011 2011 2012(f) 2013(f)<br />
Developed Markets<br />
United States 16.7 61.7 -4.1 3 14<br />
Western Europe 1.3 4.8 -8.9 -2 13<br />
Japan, Oceania<br />
and Developed Asia 2.5 9.4 6.4 9 16<br />
Emerging Markets<br />
Latin America<br />
and Caribbean 0.8 2.9 -2.0 5 14<br />
Emerging Europe<br />
and Central Asia 0.2 0.9 29.7 5 16<br />
Africa and the Middle East 0.4 1.6 -15.3 7 13<br />
Emerging Asia 5.1 18.7 28.6 3 29<br />
Total Developed Markets 20.5 76 -3.2 4 14<br />
Total Emerging Markets 6.5 24 20.0 4 26<br />
Total World 27.0 100 1.5 4 17<br />
Source: Statistics <strong>Canada</strong>, <strong>EDC</strong> Economics. 2011 is actual data while 2012 and 2013<br />
are forecast.<br />
BACK TO TABLE OF CONTENTS 32
E X P O R T F O R E C A S T O V E R V I E W 2 0 1 2<br />
1.0 GEF Executive Summary<br />
2.0 Country Overviews<br />
3.0 Sector Overview<br />
3.1 Energy<br />
3.2 Ores and Metals<br />
3.3 Agri-Food<br />
3.4 Fertilizers<br />
3.5 Forestry Products<br />
3.6 Automotive<br />
3.7 Industrial Machinery<br />
and Equipment<br />
3.8 Advanced Technology<br />
3.9 Aerospace<br />
3.10 Chemicals and Plastics<br />
3.11 Consumer Goods<br />
3.12 Services <strong>Export</strong> Sector<br />
4.0 Provincial <strong>Export</strong> Outlook<br />
5.0 Annexes<br />
3.6 Automotive<br />
On the heels of a disappointing trade performance in the automotive<br />
sector, North American production is ramping up and Canadian OEMs<br />
are back to full capacity. The Canadian dollar is projected to hover<br />
around parity this year and will leave Canadian producers bereft of the<br />
competitive advantages enjoyed during the last decade. Very high input<br />
costs combined with soaring oil prices will pose additional challenges over<br />
the forecast horizon, particularly given <strong>Canada</strong>’s product mix, which is<br />
weighted toward larger vehicles.<br />
Improving macroeconomic conditions in the US are feeding through into<br />
consumer confi dence and spending. <strong>EDC</strong> Economics expects that in 2012<br />
the fi rming labour market and much lower levels of household debt will<br />
combine with rising vehicle replacement rates and population growth to<br />
fuel sales of 14 million units, up from 12.7 million units in 2011. Inventory<br />
levels in the US have been very low by historical standards, leaving<br />
dealers ill-prepared for last year’s supply disruptions, and an added boost<br />
due to inventory rebuild is expected in H1/12.<br />
While demand conditions are extremely favourable, supply-side<br />
developments for Canadian-based producers are less so. After driving<br />
growth in 2011, the Detroit-3 will take a back seat to Honda and Toyota in<br />
2012. The Japanese manufacturers will enjoy very high growth rates this<br />
year; however, they will not fully recoup last year’s losses which translated<br />
into falling market share. The trend toward shorter model life-cycles will<br />
provide signifi cant opportunities for tooling shops while Canadian parts<br />
suppliers will suffer from the trend toward OEM new capacity relocating to<br />
“right-to-work” states in the US and Mexico. Overall, Canadian production<br />
levels are projected to remain well below the peak seen early last decade;<br />
however, when foreign affi liate sales are taken into account the outlook is<br />
much brighter.<br />
Sector Stats<br />
International <strong>Export</strong>s<br />
2011: CAD 54.4 bn<br />
Number of <strong>Export</strong>ers*<br />
2010: 844<br />
2000: 909<br />
Share of Total<br />
Canadian <strong>Export</strong>s<br />
2011: 11%<br />
Sector Distribution<br />
across provinces:<br />
NFLD: 0%<br />
NB: 0%<br />
NS: 1.9%<br />
PEI: 0%<br />
QC: 4.0%<br />
ON: 92.1%<br />
MN: 0.9%<br />
SK: 0.1%<br />
AB: 0.5%<br />
BC: 0.5%<br />
Canadian Direct<br />
Investment Abroad (2010)*:<br />
CAD 31.3 bn<br />
*Reporting the broader sector of<br />
transportation equipment (and<br />
services)<br />
Source: Statistics <strong>Canada</strong><br />
Figure 31: US Demand and Canadian Supply<br />
Table 9: Automotive <strong>Export</strong> Outlook by Region<br />
1,600,000<br />
1,400,000<br />
1,200,000<br />
1,000,000<br />
800,000<br />
600,000<br />
400,000<br />
200,000<br />
0<br />
200801<br />
200805<br />
US: Light Vehicle Sales (NSA, Units) (LS)<br />
<strong>Canada</strong>: Light Vehicle Production (NSA, Units) (RS)<br />
Source: Haver Analytics<br />
200809<br />
200901<br />
200905<br />
200909<br />
201001<br />
201005<br />
201009<br />
201101<br />
201105<br />
201109<br />
201201<br />
350,000<br />
300,000<br />
250,000<br />
200,000<br />
150,000<br />
100,000<br />
50,000<br />
0<br />
Top Markets CAD bn % Share <strong>Export</strong> Outlook<br />
of <strong>Export</strong>s (% growth)<br />
2011 2011 2011 2012(f) 2013(f)<br />
Developed Markets<br />
United States 52.8 97.1 3.5 14 10<br />
Western Europe 0.2 0.4 26.8 5 5<br />
Japan, Oceania<br />
and Developed Asia 0.1 0.2 -0.4 9 11<br />
Emerging Markets<br />
Latin America<br />
and Caribbean 0.1 0.1 -8.1 7 11<br />
Emerging Europe<br />
and Central Asia 0.1 0.1 62.9 8 12<br />
Africa and the Middle East 0.3 0.5 25.9 7 9<br />
Emerging Asia 0.1 0.2 39.6 12 17<br />
Total Developed Markets 53.2 97.7 3.6 14 10<br />
Total Emerging Markets 1.2 2.3 4.8 8 12<br />
Total World 54.4 100.0 3.6 14 10<br />
Source: Statistics <strong>Canada</strong>, <strong>EDC</strong> Economics. 2011 is actual data while 2012 and 2013<br />
are forecast.<br />
BACK TO TABLE OF CONTENTS 33
E X P O R T F O R E C A S T O V E R V I E W 2 0 1 2<br />
1.0 GEF Executive Summary<br />
2.0 Country Overviews<br />
3.0 Sector Overview<br />
3.1 Energy<br />
3.2 Ores and Metals<br />
3.3 Agri-Food<br />
3.4 Fertilizers<br />
3.5 Forestry Products<br />
3.6 Automotive<br />
3.7 Industrial Machinery<br />
and Equipment<br />
3.8 Advanced Technology<br />
3.9 Aerospace<br />
3.10 Chemicals and Plastics<br />
3.11 Consumer Goods<br />
3.12 Services <strong>Export</strong> Sector<br />
4.0 Provincial <strong>Export</strong> Outlook<br />
5.0 Annexes<br />
3.7 Industrial Machinery and Equipment<br />
Following last year’s spectacular performance, Canadian exports of<br />
industrial machinery and equipment (M&E) will post healthy, albeit<br />
moderating, gains over the next 24 months. Weakness emanating from<br />
Europe will be offset by an accelerating US economy where growing<br />
business and consumer confi dence, improving labour market conditions<br />
and record-high cash levels in the corporate sector will encourage<br />
investment spending. Sales to emerging markets, a small but rapidly<br />
growing share of overall sales, will outperform the traditional markets<br />
throughout and beyond the forecast horizon.<br />
Weakening agricultural commodity prices will temper demand for<br />
agricultural M&E in 2012 and again in 2013, but sales will remain solid.<br />
Opportunities in Eastern Europe and Central Asia will continue to recover<br />
from the collapse witnessed during the global crisis, with exports to the<br />
region expanding rapidly. Demand for construction machinery south of the<br />
border, on the other hand, will accelerate as a result of greater construction<br />
activity in the housing, commercial and industrial sectors. Demand for<br />
institutional buildings and infrastructure will decline due to the pullback<br />
of public spending and ongoing fi scal challenges at the municipal and<br />
state levels. Oil and gas M&E sales will remain solid in 2012 and 2013,<br />
though the pace of growth will slow from last year’s torrid rate. Markets<br />
further afi eld will offer growing opportunities led by sales to Caribbean-<br />
Latin America and Africa-Middle East.<br />
Opportunities south of the border abound, including rising freight traffi c<br />
and a corresponding increase in investment in rolling stock; however,<br />
the recent closure of Caterpillar’s Electromotive diesel plant is indicative<br />
of the challenging competitive landscape facing the Canadian industry.<br />
The small but growing renewable energy segment of the industry will<br />
face challenging conditions over the next few years as incentives and<br />
subsidies expire in both the wind and solar power generating industry in<br />
the US. Slowing demand from the industrial sector, however, is expected<br />
to be offset by still robust growth in the residential segment.<br />
Sector Stats<br />
International <strong>Export</strong>s<br />
2011: CAD 26.5 bn<br />
Number of <strong>Export</strong>ers<br />
2010: 2,347<br />
2000: 2,365<br />
Share of Total<br />
Canadian <strong>Export</strong>s<br />
2011: 5.3%<br />
Sector Distribution<br />
across provinces:<br />
NFLD: 0%<br />
NB: 0.7%<br />
NS: 0.6%<br />
PEI: 0.2%<br />
QC: 20%<br />
ON: 52%<br />
MN: 4.7%<br />
SK: 2.1%<br />
AB: 14.3%<br />
BC: 5.4%<br />
Canadian Direct<br />
Investment Abroad (2010):<br />
CAD 3.5 bn<br />
Source: Statistics <strong>Canada</strong><br />
Figure 32: Demand Indicators for M&E<br />
105<br />
100<br />
95<br />
90<br />
85<br />
80<br />
75<br />
US Industrial Production Index (SA, 2007=100) (LS)<br />
Emerging Markets: Investment Spending (% of GDP) (RS)<br />
2000<br />
2001<br />
2002<br />
2003<br />
2004<br />
2005<br />
2006<br />
2007<br />
2008<br />
2009<br />
2010<br />
2011<br />
35<br />
30<br />
25<br />
20<br />
15<br />
10<br />
5<br />
0<br />
Table 10: Machinery and<br />
Equipment <strong>Export</strong> Outlook by Region<br />
Top Markets CAD bn % Share <strong>Export</strong> Outlook<br />
of <strong>Export</strong>s (% growth)<br />
2011 2011 2011 2012(f) 2013(f)<br />
Developed Markets<br />
United States 18.5 69.8 22.0 7 12<br />
Western Europe 2.2 8.5 2.0 5 9<br />
Japan, Oceania<br />
and Developed Asia 1.2 4.4 -8.9 9 10<br />
Emerging Markets<br />
Latin America<br />
and Caribbean 1.4 5.4 13.5 7 11<br />
Emerging Europe<br />
and Central Asia 0.9 3.2 11.3 16 14<br />
Africa and the Middle East 0.9 3.5 1.7 7 10<br />
Emerging Asia 1.4 5.2 28.8 12 17<br />
Total Developed Markets 21.9 83 17.5 7 12<br />
Total Emerging Markets 4.6 17 14.5 10 13<br />
Total World 26.5 100 11.0 8 12<br />
Source: Haver Analytics<br />
Source: Statistics <strong>Canada</strong>, <strong>EDC</strong> Economics. 2011 is actual data while 2012 and 2013 are<br />
forecast. Includes rail and other transportation<br />
BACK TO TABLE OF CONTENTS 34
E X P O R T F O R E C A S T O V E R V I E W 2 0 1 2<br />
1.0 GEF Executive Summary<br />
2.0 Country Overviews<br />
3.0 Sector Overview<br />
3.1 Energy<br />
3.2 Ores and Metals<br />
3.3 Agri-Food<br />
3.4 Fertilizers<br />
3.5 Forestry Products<br />
3.6 Automotive<br />
3.7 Industrial Machinery<br />
and Equipment<br />
3.8 Advanced Technology<br />
3.9 Aerospace<br />
3.10 Chemicals and Plastics<br />
3.11 Consumer Goods<br />
3.12 Services <strong>Export</strong> Sector<br />
4.0 Provincial <strong>Export</strong> Outlook<br />
5.0 Annexes<br />
3.8 Advanced Technology<br />
The export landscape for advanced technology is changing rapidly. Overall,<br />
structural shifts and the need to lower costs to remain competitive in the<br />
context of a strong Canadian dollar are expected to continue shaping the<br />
industry. Production trends show a concentration of R&D and services in<br />
<strong>Canada</strong> and a re-location of manufacturing activities to emerging markets.<br />
Major segments of opportunity for merchandise exports in this sector are<br />
in electrical components, measuring and testing devices and wireless<br />
equipment.<br />
<strong>Export</strong>s of electrical equipment will benefi t from a more positive outlook<br />
for housing starts in the US. In addition, the US energy bill introduced in<br />
2005 will continue to support capital investment and grid modernization<br />
south of the border. Measuring and testing equipment is a highly R&Ddriven<br />
segment that will present plenty of possibilities for those companies<br />
concentrated in the health sector. Main opportunities for growth will be in<br />
developed markets faced with an aging population.<br />
The convergence in media telecommunications technologies will require<br />
major information technology investments by internet service providers<br />
and carriers around the world, boosting demand for networking equipment.<br />
In addition, wireless cell phones and voice over internet protocol<br />
communications will increasingly replace traditional telephone services,<br />
creating good prospects for Canadian exporters in this segment.<br />
The relative value of the Canadian dollar against the USD will reduce the<br />
competitiveness of the computer equipment segment over the forecast<br />
horizon. As a result, manufacturing of computer and peripheral equipment,<br />
semiconductors, circuit and other electronic components will continue to<br />
be outsourced to emerging markets and in particular to Asia and Mexico.<br />
Sector Stats<br />
International <strong>Export</strong>s<br />
2011: CAD 13.9 bn<br />
Number of <strong>Export</strong>ers<br />
2010: 1,596<br />
2000: 1,601<br />
Share of Total<br />
Canadian <strong>Export</strong>s<br />
2011: 2.8%<br />
Sector Distribution<br />
across provinces:<br />
NFLD: 0.1%<br />
NB: 0.3%<br />
NS: 0.9%<br />
PEI: 0.1%<br />
QC: 27.2%<br />
ON: 54.1%<br />
MN: 2.4%<br />
SK: 0.3%<br />
AB: 6.2%<br />
BC: 8.5%<br />
Canadian Direct<br />
Investment Abroad (2010):<br />
CAD 22.4 bn<br />
Source: Statistics <strong>Canada</strong><br />
Figure 33: Advanced Technology <strong>Export</strong>s by Segment<br />
(2001 vs. 2011 % share)<br />
All Other Electrical Equipment<br />
Wiring Device<br />
Electrical Equip<br />
Reproducing Magnetic and Optical Media<br />
Navigational, Measuring, Medical and Control Instr<br />
Semiconductor and Other Electronic<br />
Audio and Video Equipment<br />
Computer and Peripheral Equipment<br />
Communication and Energy Wire and Cable<br />
Other Communications Equipment<br />
Radio and Television Broadcasting and<br />
Wireless Equipment<br />
Telephone Apparatus<br />
Source: AT: Statistics <strong>Canada</strong>. <strong>EDC</strong> Economics<br />
2011<br />
2001<br />
0% 5% 10% 15% 20% 25% 30%<br />
Table 11: Advanced Technology <strong>Export</strong> Outlook by Region<br />
Top Markets CAD bn % Share <strong>Export</strong> Outlook<br />
of <strong>Export</strong>s (% growth)<br />
2011 2011 2011 2012(f) 2013(f)<br />
Developed Markets<br />
United States 9.1 65.6 -1.8 2 1<br />
Western Europe 1.7 12.3 -5.0 -11 1<br />
Japan, Oceania<br />
and Developed Asia 0.9 6.6 -1.5 9 5<br />
Emerging Markets<br />
Latin America<br />
and Caribbean 0.7 5.4 -2.2 7 6<br />
Emerging Europe<br />
and Central Asia 0.3 1.8 1.8 6 6<br />
Africa and the Middle East 0.4 2.7 -6.4 6 4<br />
Emerging Asia 0.8 5.6 3.4 12 11<br />
Total Developed Markets 11.7 84.5 -2.3 1 1<br />
Total Emerging Markets 2.2 15.5 -0.6 9 8<br />
Total World 13.9 100.0 -2.0 2 2<br />
Source: Statistics <strong>Canada</strong>, <strong>EDC</strong> Economics. 2011 is actual data while 2012 and 2013<br />
are forecast.<br />
BACK TO TABLE OF CONTENTS 35
E X P O R T F O R E C A S T O V E R V I E W 2 0 1 2<br />
1.0 GEF Executive Summary<br />
2.0 Country Overviews<br />
3.0 Sector Overview<br />
3.1 Energy<br />
3.2 Ores and Metals<br />
3.3 Agri-Food<br />
3.4 Fertilizers<br />
3.5 Forestry Products<br />
3.6 Automotive<br />
3.7 Industrial Machinery<br />
and Equipment<br />
3.8 Advanced Technology<br />
3.9 Aerospace<br />
3.10 Chemicals and Plastics<br />
3.11 Consumer Goods<br />
3.12 Services <strong>Export</strong> Sector<br />
4.0 Provincial <strong>Export</strong> Outlook<br />
5.0 Annexes<br />
3.9 Aerospace<br />
Although the aerospace sector is still feeling the effects of the 2008-09<br />
global fi nancial downturn, exports are expected to record positive gains<br />
in the next 2 years. Over the medium term, environmental concerns will<br />
cause the retirement of older aircraft, increase fl eet modernization and<br />
drive technological, infrastructure and operational improvements. This<br />
should not only increase the potential for aircraft sales, but also result in<br />
higher business volumes for after-market companies that supply spare<br />
parts and services to the sector.<br />
In the aircraft segment, business jet deliveries are expected to remain<br />
stronger than commercial jet deliveries and continue driving much of the<br />
industry growth over the next couple of years. Bombardier is estimating<br />
a delivery of 180 business aircraft and 55 commercial aircraft in 2012,<br />
leaving commercial jet deliveries well below the 5-year average. The<br />
company’s latest fi nancial results report a signifi cant number of orders for<br />
the C-Series and the fi rst deliveries are expected in late 2013, with major<br />
deliveries following in 2014 and 2015. North America and Europe continue<br />
to be the largest markets for aircraft deliveries; however, given rapid<br />
growth in Asia Pacifi c the global demand profi le will change signifi cantly<br />
over the next 20 years.<br />
The rest of the aerospace industry is expected to post strong positive<br />
gains over the forecast horizon, with helicopters and fl ight simulators<br />
contributing strongly to the growth. Helicopter demand will be driven by<br />
growing exploration and production in the oil and gas sector in remote<br />
areas. The civil fl ight simulator segment is still a promising niche market,<br />
as evidenced by CAE’s training services contracts with many emerging<br />
markets, including the United Arab Emirates. Pratt & Whitney will continue<br />
ramping up production and supporting the engines for Bombardier’s<br />
C-Series. Last October, the company received Transport <strong>Canada</strong><br />
certifi cation for the new (P&WC) PW210S engine and is moving into the<br />
production phase of the program.<br />
Sector Stats<br />
International <strong>Export</strong>s<br />
2011: CAD 10.2 bn<br />
Number of <strong>Export</strong>ers*<br />
2010: 844<br />
2000: 909<br />
Share of Total<br />
Canadian <strong>Export</strong>s<br />
2011: 2.0%<br />
Sector Distribution<br />
across provinces:<br />
NFLD: 0.1%<br />
NB: 0.0%<br />
NS: 0.4%<br />
PEI: 0.4%<br />
QC: 65.7%<br />
ON: 25.9%<br />
MN: 4.1%<br />
SK: 0.0%<br />
AB: 1.5%<br />
BC: 1.8%<br />
Canadian Direct<br />
Investment Abroad (2010)*:<br />
CAD 31.3 bn<br />
*Reporting the broader sector of<br />
transportation equipment (and<br />
services)<br />
Source: Statistics <strong>Canada</strong><br />
Figure 34: US Gulf Coast Type Fuel Spot Prices (USD)<br />
Table 12: Aerospace <strong>Export</strong> Outlook by Region<br />
6<br />
5<br />
4<br />
3<br />
2<br />
1<br />
0<br />
April-90<br />
April-91<br />
April-92<br />
April-93<br />
April-94<br />
April-95<br />
April-96<br />
April-97<br />
April-98<br />
April-99<br />
April-00<br />
April-01<br />
April-02<br />
April-03<br />
April-04<br />
Source: US Energy Information Administration<br />
April-05<br />
April-06<br />
April-07<br />
April-08<br />
April-09<br />
April-10<br />
April-11<br />
Top Markets CAD bn % Share <strong>Export</strong> Outlook<br />
of <strong>Export</strong>s (% growth)<br />
2011 2011 2011 2012(f) 2013(f)<br />
Developed Markets<br />
United States 5.4 53.4 7.9 6 9<br />
Western Europe 2.3 22.9 -21.4 4 8<br />
Japan, Oceania<br />
and Developed Asia 0.7 7.2 54.1 9 11<br />
Emerging Markets<br />
Latin America<br />
and Caribbean 0.4 4.0 3.3 7 11<br />
Emerging Europe<br />
and Central Asia 0.3 3.0 -27.5 6 11<br />
Africa and the Middle East 0.4 3.7 -34.7 6 9<br />
Emerging Asia 0.6 5.8 78.8 27 15<br />
Total Developed Markets 8.5 83.5 0.2 6 9<br />
Total Emerging Markets 1.7 16.5 -2.6 13 12<br />
Total World 10.2 100.0 -0.2 7 9<br />
Source: Statistics <strong>Canada</strong>, <strong>EDC</strong> Economics. 2011 is actual data, 2012 and 2013 are<br />
forecast.<br />
BACK TO TABLE OF CONTENTS 36
E X P O R T F O R E C A S T O V E R V I E W 2 0 1 2<br />
1.0 GEF Executive Summary<br />
2.0 Country Overviews<br />
3.0 Sector Overview<br />
3.1 Energy<br />
3.2 Ores and Metals<br />
3.3 Agri-Food<br />
3.4 Fertilizers<br />
3.5 Forestry Products<br />
3.6 Automotive<br />
3.7 Industrial Machinery<br />
and Equipment<br />
3.8 Advanced Technology<br />
3.9 Aerospace<br />
3.10 Chemicals and Plastics<br />
3.11 Consumer Goods<br />
3.12 Services <strong>Export</strong> Sector<br />
4.0 Provincial <strong>Export</strong> Outlook<br />
5.0 Annexes<br />
3.10 Chemicals and Plastics<br />
<strong>Export</strong>s of chemicals and plastics will rise 7% in 2012, followed by 6% in<br />
2013. Growth is driven by improved optimism in the US which saw rising<br />
consumer, small business and home builder confi dence in the latter part<br />
of 2011. The US will continue to be the main driver of exports over the<br />
forecast with that market taking in 80% of the sector’s total shipments.<br />
International price and demand will determine overseas shipments of<br />
chemicals as signifi cant changes in Canadian capacity are not expected<br />
over the short term. Prices for petrochemicals will get a lift in 2012 on a<br />
rise in the price of crude oil, but we expect little change in 2013 as falling<br />
energy prices are offset by a weaker Canadian dollar. Over the longer term,<br />
we expect to see Canadian companies continue to shift toward natural gas<br />
feedstock (as a means of lowering input costs) and a slow diversifi cation<br />
of <strong>Canada</strong>’s petrochemical product mix (e.g. production of corn-derived<br />
succinic acid in 2013). Meanwhile, exports of pharmaceuticals, which<br />
have been falling since 2009, are expected to decline further on reduced<br />
demand from European markets. US health care reforms may bring about<br />
new opportunities for this once-booming industry, presenting an upside<br />
risk to our forecast.<br />
<strong>Export</strong>s of plastics will rise on growing demand from packaging, automotive<br />
and construction in the US (the destination for 90% of industry exports).<br />
US international trade growth is expected to hold strong while autos sales<br />
get a lift from improved household balance sheets. Finally, both residential<br />
and commercial construction are expected to grow through the forecast.<br />
<strong>Canada</strong> remains a good location from which to serve US clients, but<br />
companies interested in unlocking the benefi ts of generally faster-growing<br />
emerging markets will be increasingly attracted to overseas investments.<br />
Increasing R&D spending to develop more environmentally-friendly<br />
production methods for chemicals and plastics products is another growth<br />
opportunity for the sector.<br />
Sector Stats<br />
International <strong>Export</strong>s<br />
2011: CAD 35.2 bn<br />
Number of <strong>Export</strong>ers<br />
2010: 1,991<br />
1999: 2,175<br />
Share of Total<br />
Canadian <strong>Export</strong>s<br />
2011: 7.1%<br />
Sector Distribution<br />
across provinces:<br />
NFLD: 0%<br />
NB: 0.3%<br />
NS: 0.8%<br />
PEI: 0.1%<br />
QC: 17.3%<br />
ON: 54.3%<br />
MN: 2.8%<br />
SK: 2.5%<br />
AB: 18.4%<br />
BC: 3.5%<br />
Canadian Direct<br />
Investment Abroad (2010):<br />
CAD 13.5 bn<br />
Source: Statistics <strong>Canada</strong><br />
Figure 35: Demand Indicators for Chemicals<br />
and Plastics<br />
3,000,000<br />
2,500,000<br />
2,000,000<br />
1,500,000<br />
1,000,000<br />
500,000<br />
0<br />
20081<br />
20082<br />
Source: Haver Analytics<br />
US: Vehicle Production (NSA, Units) (LS)<br />
Housing Starts (SAAR, Thous.Units) (RS)<br />
20083<br />
20084<br />
20091<br />
20092<br />
20093<br />
20094<br />
20101<br />
20102<br />
20103<br />
20104<br />
20111<br />
20112<br />
20113<br />
20114<br />
1,200<br />
1,000<br />
800<br />
600<br />
400<br />
200<br />
0<br />
Table 13: Chemicals and Plastics Outlook by Region<br />
Top Markets CAD bn % Share <strong>Export</strong> Outlook<br />
of <strong>Export</strong>s (% growth)<br />
2011 2011 2011 2012(f) 2013(f)<br />
Developed Markets<br />
United States 27.9 79.3 8.9 7 6<br />
Western Europe 3.0 8.6 11.1 3 2<br />
Japan, Oceania<br />
and Developed Asia 1.1 3.1 4.6 19 8<br />
Emerging Markets<br />
Latin America<br />
and Caribbean 1.2 3.3 -10.1 5 8<br />
Emerging Europe<br />
and Central Asia 0.2 0.5 -15.1 9 8<br />
Africa and the Middle East 0.4 1.1 6.6 10 6<br />
Emerging Asia 1.4 4.0 19.2 14 14<br />
Total Developed Markets 32.1 91.1 9.0 7 6<br />
Total Emerging Markets 3.1 8.9 2.9 10 11<br />
Total World 35.2 100.0 8.4 7 6<br />
Source: Statistics <strong>Canada</strong>, <strong>EDC</strong> Economics. 2011 is actual data while 2012 and 2013<br />
are forecast.<br />
BACK TO TABLE OF CONTENTS 37
E X P O R T F O R E C A S T O V E R V I E W 2 0 1 2<br />
1.0 GEF Executive Summary<br />
2.0 Country Overviews<br />
3.0 Sector Overview<br />
3.1 Energy<br />
3.2 Ores and Metals<br />
3.3 Agri-Food<br />
3.4 Fertilizers<br />
3.5 Forestry Products<br />
3.6 Automotive<br />
3.7 Industrial Machinery<br />
and Equipment<br />
3.8 Advanced Technology<br />
3.9 Aerospace<br />
3.10 Chemicals and Plastics<br />
3.11 Consumer Goods<br />
3.12 Services <strong>Export</strong> Sector<br />
4.0 Provincial <strong>Export</strong> Outlook<br />
5.0 Annexes<br />
3.11 Consumer Goods<br />
Reversing a long-running trend of falling foreign sales, Canadian exports<br />
of consumer goods jumped 6.7% last year due to very strong demand<br />
from European and Asian customers. This strength, particularly in the face<br />
of a persistently high Canadian loonie and a very competitive landscape,<br />
is impressive. The sector will continue to refl ect the diversifi cation story<br />
playing out across the country as sales to Emerging Asia outpace those to<br />
developed markets over the medium term.<br />
Despite recent success in non-traditional markets, the US still accounts<br />
for over three-quarters of foreign sales. After 3 years of deleveraging, US<br />
consumers are in much better shape heading into 2012 than they have<br />
been for years. The ratio of overall household debt to personal disposable<br />
income has dropped from a peak of almost 130% during the pre-crisis<br />
years to 110% at the end of 2011. <strong>EDC</strong> Economics expects that US<br />
consumer spending on durable goods will jump 8% in 2012 and a further<br />
5% in 2013 as pent-up demand drives a strong rebound in spending.<br />
After 3 years of wallowing at record low levels, there are also signs of<br />
revival in US housing activity. Housing starts are projected to increase<br />
from just over 600,000 units in 2011 to 800,000 this year and 1.1 million<br />
in 2013 – fuelling demand for household furnishings, kitchen cabinets and<br />
appliances.<br />
Despite the rosy demand outlook, the industry faces a pricing environment<br />
that is very challenging. While some reprieve is expected in 2013<br />
and beyond as the loonie dips below parity, existing pressures from<br />
price-sensitive consumers and heightened competition from low-cost<br />
jurisdictions will erode the sector’s share of the overall national trade pie.<br />
Sector Stats<br />
International <strong>Export</strong>s<br />
2011: CAD 8.1 bn<br />
Number of <strong>Export</strong>ers<br />
2010: 1,375<br />
2000: 2,020<br />
Share of Total<br />
Canadian <strong>Export</strong>s<br />
2011: 1.6%<br />
Sector Distribution<br />
across provinces:<br />
NFLD: 0.1%<br />
NB: 0.2%<br />
NS: 0.9%<br />
PEI: 0%<br />
QC: 30.7%<br />
ON: 56.9%<br />
MN: 2.1%<br />
SK: 0.3%<br />
AB: 2.1%<br />
BC: 6.6%<br />
Canadian Direct<br />
Investment Abroad (2010):<br />
CAD 8.4 bn<br />
Source: Statistics <strong>Canada</strong><br />
Figure 36: US Consumer Spending<br />
Table 14: Consumer Goods <strong>Export</strong> Outlook by Region<br />
1,200<br />
1,000<br />
800<br />
600<br />
400<br />
200<br />
0<br />
20082<br />
20083<br />
Source: Haver Analytics.<br />
Housing Starts (SAAR, Thous.Units) (LS)<br />
US Consumer Spending (%y/y) (RS)<br />
20084<br />
20091<br />
20092<br />
20093<br />
20094<br />
20101<br />
20102<br />
20103<br />
20104<br />
20111<br />
20112<br />
20113<br />
20114<br />
3.0%<br />
2.0%<br />
1.0%<br />
0.0%<br />
-1.0%<br />
-2.0%<br />
-3.0%<br />
-4.0%<br />
-5.0%<br />
-6.0%<br />
Top Markets CAD bn % Share <strong>Export</strong> Outlook<br />
of <strong>Export</strong>s (% growth)<br />
2011 2011 2011 2012(f) 2013(f)<br />
Developed Markets<br />
United States 6.3 77.7 4.2 4 5<br />
Western Europe 1.1 14.0 14.1 3 7<br />
Japan, Oceania<br />
and Developed Asia 0.3 4.1 48.1 14 11<br />
Emerging Markets<br />
Latin America<br />
and Caribbean 0.1 1.3 4.4 7 11<br />
Emerging Europe<br />
and Central Asia 0.0 0.6 18.9 6 11<br />
Africa and the Middle East 0.1 1.0 -6.4 6 9<br />
Emerging Asia 0.1 1.2 0.0 15 18<br />
Total Developed Markets 7.7 95.9 6.9 4 6<br />
Total Emerging Markets 0.3 4.1 1.9 9 13<br />
Total World 8.1 100.0 6.7 4 6<br />
Source: Statistics <strong>Canada</strong>, <strong>EDC</strong> Economics. 2011 is actual data while 2012 and 2013<br />
are forecast.<br />
BACK TO TABLE OF CONTENTS 38
E X P O R T F O R E C A S T O V E R V I E W 2 0 1 2<br />
1.0 GEF Executive Summary<br />
2.0 Country Overviews<br />
3.0 Sector Overview<br />
3.1 Energy<br />
3.2 Ores and Metals<br />
3.3 Agri-Food<br />
3.4 Fertilizers<br />
3.5 Forestry Products<br />
3.6 Automotive<br />
3.7 Industrial Machinery<br />
and Equipment<br />
3.8 Advanced Technology<br />
3.9 Aerospace<br />
3.10 Chemicals and Plastics<br />
3.11 Consumer Goods<br />
3.12 Services <strong>Export</strong> Sector<br />
4.0 Provincial <strong>Export</strong> Outlook<br />
5.0 Annexes<br />
3.12 Services <strong>Export</strong> Sector<br />
After two years of healthy growth, <strong>Canada</strong>’s service export sector has<br />
surpassed pre-recession peaks and will continue to experience steady<br />
growth. The merchandise export sector however, which has been growing<br />
very rapidly as it recoups losses experienced during the 2008-09 crisis,<br />
has outperformed and the share of services exports in total trade fell back<br />
to 14% in 2011.<br />
For overall services exports, <strong>EDC</strong> Economics is forecasting growth of<br />
approximately 4% both this year and next. Commercial services, which<br />
account for the bulk of all Canadian services exports, are expected to<br />
accelerate over the forecast horizon, growing 3.7% in 2012 and 4.9% in<br />
2013. Transportation services are projected to expand by 7.1% this year<br />
and then decelerate, but continue growing by 5.6% next year. Meanwhile,<br />
travel services for businesses and individuals, making up about a quarter<br />
of services exports, will grow by 3.5% this year and 1.5% next year.<br />
Trade performance among the subsectors of commercial services group<br />
has been mixed over the past couple of years. The Canadian fi nancial<br />
sector was well positioned to capitalize on opportunities south of the border;<br />
growth in this segment will moderate over the forecast horizon however<br />
as improving conditions in the US reduce opportunities. Other segments<br />
of the services industry, particularly construction management and<br />
engineering services, will benefi t from the improving US macroeconomic<br />
landscape and major projects in the resources industries. R&D-related<br />
exports along with services related to the advanced technology sector will<br />
continue to grow, offsetting the weakness seen on the merchandise trade<br />
side of the industry.<br />
Sector Stats<br />
International <strong>Export</strong>s<br />
2011: CAD 76.9 bn<br />
Number of <strong>Export</strong>ers<br />
2010: 7,083<br />
2000: 6,636<br />
Share of Total<br />
Canadian <strong>Export</strong>s<br />
2011: 15.5%<br />
Sector Distribution<br />
across provinces:<br />
N/A<br />
Canadian Direct<br />
Investment Abroad (2010):<br />
CAD 59.8 bn<br />
Transportation service exports generally mirror activity on the merchandise<br />
trade side, and as trade flows normalize, growth rates here will moderate.<br />
The rail transportation sector, however, will outperform over the next 24<br />
months, as higher volumes of agricultural products and growing reliance<br />
on rail transportation to get crude oil down to refi neries in the US push up<br />
demand substantially.<br />
Source: Statistics <strong>Canada</strong><br />
Figure 37: Tourism and the Canadian Dollar<br />
Table 15: Services <strong>Export</strong> Outlook<br />
60%<br />
50%<br />
40%<br />
30%<br />
20%<br />
10%<br />
0%<br />
-10%<br />
-20%<br />
-30%<br />
-40%<br />
-50%<br />
200801<br />
200807<br />
200901<br />
US Tourism: to <strong>Canada</strong> (% gr y/y)<br />
FRB Exchange Rate: United States/<strong>Canada</strong> (US$/C$)<br />
200907<br />
201001<br />
201007<br />
201101<br />
201107<br />
201201<br />
1.20<br />
1.00<br />
0.80<br />
0.60<br />
0.40<br />
0.20<br />
0.00<br />
2009 2010 2011 2012(f) 2013(f)<br />
Total Service<br />
<strong>Export</strong>s ($ mn) 68,293 71,253 74,845 77,828 81,076<br />
annual % change -5.78 4.33 5.04 4 4<br />
Commercial<br />
Services ($ mn) 40,324 41,263 43,221 44,808 47,003<br />
annual % change -4.03 2.33 4.75 4 5<br />
Transportation<br />
Services ($ mn) 10,559 12,005 13,250 14,177 14,967<br />
annual % change -13.37 13.69 10.37 14 6<br />
Travel<br />
Services ($ mn) 15,547 16,198 16,759 17,276 17,507<br />
annual % change -6.03 4.19 3.46 3 1<br />
Government<br />
Services ($ mn) 1,864 1,788 1,616 1,568 1,599<br />
annual % change 7.50 -4.08 -9.62 -3 2<br />
Source: Statistics <strong>Canada</strong>, <strong>EDC</strong> Economics. 2011 is actual data while 2012 and 2013 are<br />
forecast.<br />
Source: Haver Analytics<br />
BACK TO TABLE OF CONTENTS 39
E X P O R T F O R E C A S T O V E R V I E W 2 0 1 2<br />
1.0 GEF Executive Summary<br />
4.0 Provincial <strong>Export</strong> Outlook<br />
2.0 Country Overviews<br />
3.0 Sector Overview<br />
4.0 Provincial <strong>Export</strong> Outlook<br />
4.1 Newfoundland and Labrador<br />
4.2 Prince Edward Island<br />
4.3 Nova Scotia<br />
4.4 New Brunswick<br />
4.5 Quebec<br />
4.6 Ontario<br />
4.7 Manitoba<br />
4.8 Saskatchewan<br />
4.9 Alberta<br />
4.10 British Columbia<br />
5.0 Annexes<br />
BACK TO TABLE OF CONTENTS 40
E X P O R T F O R E C A S T O V E R V I E W 2 0 1 2<br />
1.0 GEF Executive Summary<br />
2.0 Country Overviews<br />
3.0 Sector Overview<br />
4.0 Provincial <strong>Export</strong> Outlook<br />
4.1 Newfoundland and Labrador<br />
4.2 Prince Edward Island<br />
4.3 Nova Scotia<br />
4.4 New Brunswick<br />
4.5 Quebec<br />
4.6 Ontario<br />
4.7 Manitoba<br />
4.8 Saskatchewan<br />
4.9 Alberta<br />
4.10 British Columbia<br />
5.0 Annexes<br />
The export outlook for 2012 sees a continuation of the robust growth seen over<br />
the past 2 years, but at a slightly slower pace as the nominal impact of record-high<br />
prices begins to fade and more than offsets a pickup in actual volume shipments.<br />
The seemingly insatiable demand from emerging markets seen over the past<br />
couple of years will ease slightly this year and is a response to a slowing of GDP<br />
growth in BRICM markets, while the US economic recovery picks up steam. Most provinces will<br />
experience a deceleration from last year’s rapid growth rate, with the exception of Prince Edward Island<br />
and Ontario which will both see a rebound due to supply-side factors. Next year, British Columbia and<br />
Nova Scotia will enjoy double-digit gains thanks to the forestry and energy sectors, respectively, while<br />
most other provinces will remain at or slightly below 2012 growth rates.<br />
<strong>Export</strong>s from Newfoundland and Labrador will continue to grow but at a slower pace of 5% in 2012<br />
and 7% in 2013. Growth this year will be due to sizable gains in exports of industrial goods, which will<br />
offset declining energy output.<br />
<strong>EDC</strong> Economics expects Prince Edward Island’s export sector to continue on its upward trajectory,<br />
and the forecast is for growth of approximately 7% both this year and next. The US economic recovery<br />
is gaining traction, which will underpin fi rming demand across all sectors, while a weakening loonie next<br />
year will provide a boost to nominal receipts.<br />
On the whole, an improved demand outlook from the US as well as increased natural gas production<br />
will not be enough to offset the strong fall in natural gas prices and production capacity shutdowns in<br />
the newsprint sector that will drive Nova Scotia’s export receipts down by 1% in 2012. A rebound of<br />
12% will follow next year thanks to large broad-based gains in 2013.<br />
After a stellar performance over the past few years, New Brunswick’s export growth will slow to 6%<br />
in 2012 and 3% in 2013 as energy prices weaken. Improvements in the US housing market will lend<br />
support to exports of wood products and the industrial goods sector will see mixed results, with lower<br />
output from the metals sector being offset by greater potash production.<br />
Quebec’s exports are expected to increase a modest 7% this year and next. Growth will be driven by<br />
a variety of factors, including strong prices and demand for commodities, higher aircraft deliveries, and<br />
the nascent rebound in the US housing market.<br />
<strong>EDC</strong> Economics is forecasting a healthy 9% increase in exports out of Ontario in both 2012 and<br />
2013, slightly above the national level. A rebound in the automotive industry and still-strong prices for<br />
industrial goods will frame this year’s picture, while strength in 2013 will be broad-based as the US<br />
economy picks up steam and a weaker loonie pads foreign sale receipts.<br />
After surging 15% last year, Manitoba’s exports are poised for a solid 8% increase in 2012 followed<br />
by a further 7% rise next year. The outlook is underpinned by improving demand from the US and stillhigh,<br />
albeit moderating, agricultural commodity prices.<br />
After a blistering 25% increase in exports last year, Saskatchewan’s growth will slow to a solid 8%<br />
this year, followed by a 3% rise in 2013. The province’s energy exports will receive a boost from rising<br />
prices, while agriculture should rebound after the wet weather conditions that lowered harvests over<br />
the past 2 years.<br />
BACK TO TABLE OF CONTENTS 41
E X P O R T F O R E C A S T O V E R V I E W 2 0 1 2<br />
1.0 GEF Executive Summary<br />
2.0 Country Overviews<br />
3.0 Sector Overview<br />
4.0 Provincial <strong>Export</strong> Outlook<br />
4.1 Newfoundland and Labrador<br />
4.2 Prince Edward Island<br />
4.3 Nova Scotia<br />
4.4 New Brunswick<br />
4.5 Quebec<br />
4.6 Ontario<br />
4.7 Manitoba<br />
4.8 Saskatchewan<br />
4.9 Alberta<br />
4.10 British Columbia<br />
5.0 Annexes<br />
Following last year’s very strong performance, Alberta’s export sector will see growth moderate but<br />
continue to post steady gains; <strong>EDC</strong> Economics forecasts a 7% increase this year followed by a slightly<br />
slower 6% in 2013. After the very strong price gains for key commodities last year, upside potential is<br />
limited and prices will begin to soften next year.<br />
British Columbia’s exports will continue to expand rapidly over the next 2 years, despite the dampening<br />
effect of a slowing Chinese economy. Growth of 4% this year and 13% in 2013 refl ect a recovery in the<br />
US residential market, ongoing development in the mining sector, and higher energy output next year.<br />
Table 16: Canadian Merchandise <strong>Export</strong> <strong>Forecast</strong><br />
by Province<br />
Provinces CAD mn % Share <strong>Export</strong> Outlook<br />
of Province’s<br />
(% growth)<br />
Total <strong>Export</strong>s<br />
2011 2011 2011 2012(f) 2013(f)<br />
Newfoundland and Labrador* 12.1 2.9 31.5 5.5 6.8<br />
Prince Edward Island 0.7 0.2 5.8 6.8 6.6<br />
Nova Scotia 4.4 1.0 3.1 -1.2 12.3<br />
New Brunswick 14.9 3.5 17.1 5.6 2.6<br />
Quebec 62.2 14.8 7.6 6.7 7.1<br />
Ontario 155.4 37.1 6.4 9.4 9.4<br />
Manitoba 11.8 2.8 15.1 8.2 6.8<br />
Saskatchewan 29.5 7.0 24.6 8.2 3.1<br />
Alberta 93.0 22.2 18.3 7.3 5.8<br />
British Columbia 32.8 7.8 14.2 4.5 13.4<br />
Territories 2.0 0.5 -9.4 -1.8 10.6<br />
Total Goods <strong>Export</strong>s 418.8 100.0 11.9 7.6 7.8<br />
Source: Statistics <strong>Canada</strong>, <strong>EDC</strong> Economics. 2011 actual data, while 2012 and 2013 are forecast.<br />
*Includes <strong>EDC</strong> estimate for crude oil exports (not included in national total from Statistics <strong>Canada</strong>)<br />
BACK TO TABLE OF CONTENTS 42
E X P O R T F O R E C A S T O V E R V I E W 2 0 1 2<br />
1.0 GEF Executive Summary<br />
2.0 Country Overviews<br />
3.0 Sector Overview<br />
4.0 Provincial <strong>Export</strong> Outlook<br />
4.1 Newfoundland and Labrador<br />
4.2 Prince Edward Island<br />
4.3 Nova Scotia<br />
4.4 New Brunswick<br />
4.5 Quebec<br />
4.6 Ontario<br />
4.7 Manitoba<br />
4.8 Saskatchewan<br />
4.9 Alberta<br />
4.10 British Columbia<br />
5.0 Annexes<br />
4.1 Newfoundland and Labrador<br />
The province’s export sector, which is dominated by<br />
commodities, benefi ted from skyrocketing energy prices<br />
and strong demand for iron ore last year, sending overall<br />
foreign sales soaring 32%. <strong>EDC</strong> Economics is forecasting<br />
continued export growth, albeit at a more moderate pace of 5.5% in 2012<br />
and 6.8% in 2013. Growth this year will be due to sizable gains in exports of<br />
industrial goods which will offset declining energy output. Strong demand<br />
for iron ore from China (including Chinese infrastructure investments in<br />
the Bahamas) will augment the broad-based recovery in US shipments.<br />
The outlook for industrial goods is bright both this year and next, driven<br />
mainly by higher volumes as prices have limited upside potential and are<br />
expected to soften next year. Foreign sales of iron ore will continue to build<br />
as a result of ramped-up production at IOC, Wabush and Labrador Iron<br />
Mines over the forecast horizon. Sector prospects beyond 2013 continue<br />
to be bright, thanks to signifi cant investment by New Millennium Capital<br />
Corporation and Tata Steel Ltd. The overall sector will be slightly weighed<br />
down by declining output at Voisey’s Bay this year.<br />
Falling crude production will drag energy export volumes into negative<br />
territory this year, but the price effect of persistently high oil prices will<br />
tip sales receipts into positive territory. Next year, WTI oil prices will<br />
soften and we expect an annual average of $95/bbl in 2013. Declining<br />
production at Hibernia is somewhat offset by growth from Hibernia South,<br />
in addition to ramped-up production at North Amethyst – a satelite fi eld of<br />
White Rose. Come-by-Chance refi nery has reopened following repairs of<br />
damages caused by a fi re and will experience a ramp-up in activity.<br />
The balance of the province’s exports consist of a broad mix of goods,<br />
including seafood, aquaculture, machinery and equipment, aerospace,<br />
and alcoholic beverages, and are shipped by numerous small and mediumsized<br />
companies. We expect exports in this category to experience modest<br />
growth this year and in 2013, although volatility and sensitivity to external<br />
developments are prominent features of this segment.<br />
Provincial Stats<br />
GDP<br />
CAD 28.1 billion<br />
International <strong>Export</strong>s/GDP<br />
37%<br />
Number of <strong>Export</strong>ers<br />
2010: 195<br />
1999: 178<br />
Trade Balance (2011)<br />
CAD 8.5 billion<br />
Largest <strong>Export</strong><br />
Destinations<br />
1. United States 66%<br />
2. China 9%<br />
3. Netherlands 5%<br />
Share of <strong>Export</strong>s to<br />
Emerging Markets<br />
2011: 16.4%<br />
2007:6.8%<br />
Herfindahl Index<br />
(Trade diversification<br />
where 0=extreme<br />
concentration)<br />
Sector: 0.50<br />
Regional: 0.46<br />
Figure 38: Oil <strong>Export</strong>s Overinflated by Crude Oil Price<br />
Table 17: Newfoundland & Labrador Merchandise Outlook<br />
9000<br />
8000<br />
7000<br />
6000<br />
5000<br />
4000<br />
3000<br />
2000<br />
1000<br />
Oil and Gas Extraction ($C, mil) (LS)<br />
Crude Oil Price - WTI ($/bbl) (RS)<br />
0<br />
2000 2001 2002 2003 2004 2005 2006 2007 2008 2009 2010 2011<br />
Source: Haver Analytics, CANSIM<br />
120<br />
100<br />
80<br />
60<br />
40<br />
20<br />
0<br />
Top Sectors CAD mn % Share <strong>Export</strong> Outlook<br />
of Province’s<br />
Total <strong>Export</strong>s (% growth)<br />
2011 2011 2011 2012(f) 2013(f)<br />
Energy 7,972 65.9 33.3 4 2<br />
Industrial Goods 3,026 25.0 35.2 11 19<br />
Agri-Food 876 7.2 10.3 3 3<br />
Forestry 161 1.3 36.7 -2 5<br />
All Others 71 0.6 -8.3 6 8<br />
Total 12,105 100.0 31.5 5 7<br />
Total excl. energy 4,133 34.1 28.1 9 15<br />
Source: Statistics <strong>Canada</strong>, <strong>EDC</strong> Economics. 2011 actual data, while 2012 and 2013 are<br />
forecast.<br />
BACK TO TABLE OF CONTENTS 43
E X P O R T F O R E C A S T O V E R V I E W 2 0 1 2<br />
1.0 GEF Executive Summary<br />
2.0 Country Overviews<br />
3.0 Sector Overview<br />
4.0 Provincial <strong>Export</strong> Outlook<br />
4.1 Newfoundland and Labrador<br />
4.2 Prince Edward Island<br />
4.3 Nova Scotia<br />
4.4 New Brunswick<br />
4.5 Quebec<br />
4.6 Ontario<br />
4.7 Manitoba<br />
4.8 Saskatchewan<br />
4.9 Alberta<br />
4.10 British Columbia<br />
5.0 Annexes<br />
4.2 Prince Edward Island<br />
Following 2 years of declines, Prince Edward Island’s<br />
export sector set out on the road to recovery last year,<br />
posting a gain of almost 6%. <strong>EDC</strong> Economics expects<br />
foreign sales to continue on this upward trajectory, and<br />
the forecast is for growth of 7% both this year and next. The US economic<br />
recovery is gaining traction, which will underpin fi rming demand across<br />
all sectors, while a weakening loonie next year will provide a boost to<br />
nominal receipts.<br />
The export outlook will be shaped by the traditional and still dominant<br />
agri-food sub-sectors: seafood and potatoes. Last year, bad weather<br />
caused a marked decline in lobster landings. In 2012, the PEI lobster<br />
fi shery will see a bounce-back to more normal levels of lobster supply,<br />
pushing up exports to the US. In the potato sub-sector, higher prices for<br />
table potatoes and processed spuds will underpin growth this year thanks<br />
to tight supply in the US which has been supporting prices. Unfortunately,<br />
PEI is itself confronting reduced inventories, so the Island will not see a<br />
major uptick in quantities exported. Next year, the US market will return<br />
to balance, thereby easing price pressure and slowing export demand for<br />
PEI potatoes.<br />
The Island’s other “new” industries will be boosted by increased demand<br />
from a recovering US economy. In the transportation category, PEI<br />
companies, which specialize in the maintenance and overhaul of airplanes,<br />
are expected to see an increase in work orders as the aerospace sector<br />
gradually picks up this year and gains altitude in 2013.<br />
One of the Island’s newer emerging industries that warrants attention<br />
is the bio-sciences sector, specifi cally laboratory reagents and animal<br />
vaccines. Until now, the sector has trailed closely behind agri-food,<br />
transportation, industrial goods and machinery and equipment, putting it<br />
within range of the top fi ve export sectors. Powered by investment from<br />
the likes of Novartis, which injected $2.8 million into expanding its existing<br />
R&D facilities on PEI between 2011 and 2012, vaccine products have<br />
seen steady export growth over the past 10 years. Although 2011 saw<br />
an unusual decrease in exports, the vaccines targeting fi sh bacteria and<br />
viruses appear to have made strong inroads in Chile, the UK and the US<br />
and should return to more typical positive growth in 2012 and 2013.<br />
Provincial Stats<br />
GDP<br />
CAD 5.1 billion<br />
International <strong>Export</strong>s/GDP<br />
21%<br />
Number of <strong>Export</strong>ers<br />
2010: 158<br />
1999: 131<br />
Trade Balance (2011)<br />
CAD 1.2 billion<br />
Largest <strong>Export</strong><br />
Destinations<br />
1. United States 70%<br />
Massachusetts 18%<br />
New Jersey 12%<br />
New York 8%<br />
2. United Kingdom 2%<br />
3. Japan 2%<br />
Share of <strong>Export</strong>s to<br />
Emerging Markets<br />
2011: 16.7%<br />
2007:10.3%<br />
Herfindahl Index<br />
(Trade diversification<br />
where 0=extreme<br />
concentration)<br />
Sector: 0.46<br />
Regional: 0.52<br />
Figure 39: US Restaurant Activity<br />
Drives Agricultural <strong>Export</strong>s<br />
15<br />
10<br />
5<br />
0<br />
-5<br />
-10<br />
2002 2003 2004 2005 2006 2007 2008 2009 2010 2011<br />
Source: Haver Analytics, CANSIM<br />
PEI: Domestic <strong>Export</strong>s:<br />
Agricultural & Fishing<br />
Products (NSA, Mil.C$) (LS)<br />
Restaurant Perf Index:<br />
Current Situation:<br />
Customer Traffic<br />
(>100=Expansion) (RS)<br />
108.0<br />
105.0<br />
102.0<br />
99.0<br />
96.0<br />
93.0<br />
Table 18: Prince Edward Island Merchandise Outlook<br />
Top Sectors CAD mn % Share <strong>Export</strong> Outlook<br />
of Province’s<br />
Total <strong>Export</strong>s (% growth)<br />
2011 2011 2011 2012(f) 2013(f)<br />
Agri-Food 475.8 65.1 1.8 7 5<br />
M&E 51.9 7.1 62.5 6 11<br />
Transportation 50.2 6.9 41.8 7 12<br />
Industrial Goods 54.8 7.5 -8.6 8 7<br />
All Others 98.7 13.5 2.2 6 10<br />
Total 731.3 100.0 5.8 7 7<br />
Total excl. energy 731 100.0 5.9 7 7<br />
Source: Statistics <strong>Canada</strong>, <strong>EDC</strong> Economics. 2011 actual data, while 2012 and 2013 are<br />
forecast.<br />
BACK TO TABLE OF CONTENTS 44
E X P O R T F O R E C A S T O V E R V I E W 2 0 1 2<br />
1.0 GEF Executive Summary<br />
2.0 Country Overviews<br />
3.0 Sector Overview<br />
4.0 Provincial <strong>Export</strong> Outlook<br />
4.1 Newfoundland and Labrador<br />
4.2 Prince Edward Island<br />
4.3 Nova Scotia<br />
4.4 New Brunswick<br />
4.5 Quebec<br />
4.6 Ontario<br />
4.7 Manitoba<br />
4.8 Saskatchewan<br />
4.9 Alberta<br />
4.10 British Columbia<br />
5.0 Annexes<br />
4.3 Nova Scotia<br />
On the whole, an improved demand outlook from the US<br />
as well as increased natural gas production will not be<br />
enough to offset the strong fall in natural gas prices and<br />
production capacity shutdowns in the newsprint sector<br />
that will drive export receipts down in 2012. A rebound will follow in 2013.<br />
In particular, the natural gas sector is expected to record positive<br />
production growth over the next 2 years. Encana expects to ramp up<br />
production at the Deep Panuke Field to 200 mmcf a day. According to the<br />
National Energy Board, volumes from Deep Panuke are likely to offset<br />
ongoing declines in output from the Sable fi elds. As per media reports,<br />
production is expected to start in July 2012. In addition, Shell has recently<br />
won a bid to commence oil and gas exploration in four parcels of acreage<br />
off Nova Scotia. The company plans to conduct seismic tests next year<br />
and start drilling in 2014. This is anticipated to have a positive impact on<br />
the province’s energy production capacity over the medium to long term.<br />
The newly formed Professional Lobster Fisherman’s Association in Nova<br />
Scotia has been applying pressure to increase lobster prices, with positive<br />
results to date. Most of the growth in exports is likely to come from sales<br />
of lobster and shrimp to China. The industry will continue to work hard to<br />
increase market diversifi cation. Markets such as Russia, Hong Kong and<br />
South Korea are becoming increasingly important. Aquaculture farms and<br />
investment to increase processing capacity should translate into export<br />
gains for the fisheries industry over the forecast horizon.<br />
The shutdown of the New Page Port Hawkesbury paper mill last September<br />
and the recently announced production shutdowns in the Bowater Mersey<br />
Mill in Brooklyn will adversely impact export volumes in the newsprint<br />
sector. According to a report by the Atlantic Provinces Economic Council,<br />
if the New Page Mill is not re-opened export revenues for the newsprint<br />
sector will suffer a $300-million loss this year.<br />
Finally, Michelin is expected to hold production steady this year in response<br />
to weaker demand from European markets, but ramp up volumes in 2013.<br />
The company expects to grow production by 25% by 2015, as well as<br />
increase export diversifi cation.<br />
Provincial Stats<br />
GDP<br />
CAD 36.4 billion<br />
International <strong>Export</strong>s/GDP<br />
19%<br />
Number of <strong>Export</strong>ers<br />
2010: 670<br />
1999: 819<br />
Trade Balance (2011)<br />
CAD -3.9 billion (defi cit)<br />
Largest <strong>Export</strong><br />
Destinations<br />
1. United States 74%<br />
Massachusetts 20%<br />
South Carolina 15%<br />
Michigan 6%<br />
2. China 3%<br />
3. France 2%<br />
Share of <strong>Export</strong>s to<br />
Emerging Markets<br />
2011: 10.5%<br />
2007:7.4%<br />
Herfindahl Index<br />
(Trade diversification<br />
where 0=extreme<br />
concentration)<br />
Sector: 0.21<br />
Regional: 0.56<br />
Figure 40: Sable Project Nova Scotia<br />
Table 19: Nova Scotia Merchandise Outlook<br />
500,000<br />
450,000<br />
400,000<br />
350,000<br />
300,000<br />
250,000<br />
200,000<br />
150,000<br />
100,000<br />
50,000<br />
0<br />
Mar-08<br />
May-08<br />
Gas Equivalent Volume (E3M3/Month)<br />
Jul-08<br />
Sep-08<br />
Nov-08<br />
Jan-09<br />
Mar-09<br />
May-09<br />
Jul-09<br />
Sep-09<br />
Nov-09<br />
Jan-10<br />
Mar-10<br />
May-10<br />
Jul-10<br />
Sep-10<br />
Nov-10<br />
Jan-11<br />
Mar-11<br />
May-11<br />
Jul-11<br />
Sep-11<br />
Nov-11<br />
Jan-12<br />
Source: <strong>Canada</strong>-Nova Scotia Offshore Petroleum Board (CNSOPB)<br />
Top Sectors CAD mn % Share <strong>Export</strong> Outlook<br />
of Province’s<br />
Total <strong>Export</strong>s (% growth)<br />
2011 2011 2011 2012(f) 2013(f)<br />
Natural Gas 214 5.0 -10.0 -9 56<br />
Agri-Food 1,152 26.3 15.4 7 3<br />
Forestry 721 16.5 -9.8 -37 15<br />
Motor Vehicle 1,045 23.8 7.8 3 13<br />
All Others 1,249 28.5 0.5 5 12<br />
Total 4,380 100.0 3.1 -1 12<br />
Total excl. energy 3,936 89.9 4.5 -2 9<br />
Source: Statistics <strong>Canada</strong>, <strong>EDC</strong> Economics. 2011 actual data, while 2012 and 2013 are<br />
forecast.<br />
BACK TO TABLE OF CONTENTS 45
E X P O R T F O R E C A S T O V E R V I E W 2 0 1 2<br />
1.0 GEF Executive Summary<br />
2.0 Country Overviews<br />
3.0 Sector Overview<br />
4.0 Provincial <strong>Export</strong> Outlook<br />
4.1 Newfoundland and Labrador<br />
4.2 Prince Edward Island<br />
4.3 Nova Scotia<br />
4.4 New Brunswick<br />
4.5 Quebec<br />
4.6 Ontario<br />
4.7 Manitoba<br />
4.8 Saskatchewan<br />
4.9 Alberta<br />
4.10 British Columbia<br />
5.0 Annexes<br />
4.4 New Brunswick<br />
New Brunswick’s export growth will slow in 2012 and<br />
2013 as energy prices weaken. Improvements in the<br />
US housing market will lend support to exports of wood<br />
products and the industrial goods sector will see mixed<br />
results, with lower output from the metals sector being offset by greater<br />
potash production.<br />
With global oil supply interruptions threatening in the Middle East, the price<br />
of WTI crude will hover around USD100/bbl this year before slipping to<br />
USD95/bbl in 2013. Meanwhile, natural gas prices will fall to USD3/mmbtu in<br />
2012 before rising to USD 3.50 next year, as the US market remains awash<br />
in shale gas. The completion of the Point Lepreau nuclear power plant<br />
refurbishment will provide the capacity to increase export sales of electricity<br />
in response to rising US industrial production. Shale gas exploration<br />
continues, but technical challenges in unlocking New Brunswick’s potential<br />
mean production and exports remain a few years away.<br />
With the US housing market finally picking up steam, wood products exports<br />
will see a strong increase in 2012 and 2013, supported by the reopening<br />
of the Weyerhauser mill in the Miramichi area. Meanwhile, pulp prices<br />
have deteriorated more sharply than anticipated, particularly for dissolving<br />
pulp for the textile market, with substantial global capacity being added or<br />
converted. On the paper side, fundamentals for containerboard remain<br />
stable, while those for supercalendered paper have deteriorated slightly.<br />
<strong>Export</strong>s of agri-food products will slow considerably in 2012, as farmed<br />
salmon prices are expected to decline signifi cantly due to rising production<br />
and exports from Chile. Lobster landings are expected to improve in 2012,<br />
as 2011 was affected by adverse weather conditions. Potato and snow<br />
crab prices should also improve due, respectively, to a smaller US crop<br />
and weaker supplies from Russia and Alaska. Also supporting export<br />
growth will be the opening of the Rogersville cranberry bog.<br />
Mineral exports will decline in 2012 and 2013 with lower output at the<br />
Brunswick Mine, which is slated to close in 2013. Production at Halfmile and<br />
other potential projects, such as Mount Pleasant and Sisson Brook, will not<br />
be sufficient to offset the closure of Brunswick Mine. The new Sussex potash<br />
mine due to open next year will double potash capacity by 2015. Exploration<br />
on a new greenfield potash mine, also in the Sussex area, has begun.<br />
Provincial Stats<br />
GDP<br />
CAD 29.4 billion<br />
International <strong>Export</strong>s/GDP<br />
40%<br />
Number of <strong>Export</strong>ers<br />
2010: 540<br />
1999: 692<br />
Trade Balance (2011)<br />
CAD 1.2 billion<br />
Largest <strong>Export</strong><br />
Destinations<br />
1. United States 84%<br />
52%<br />
9%<br />
5%<br />
2. Netherlands 4%<br />
3. Brazil 1%<br />
Share of <strong>Export</strong>s to<br />
Emerging Markets<br />
2011: 6.7%<br />
2007:5.5%<br />
Herfindahl Index<br />
(Trade diversification<br />
where 0=extreme<br />
concentration)<br />
Sector: 0.51<br />
Regional: 0.72<br />
Figure 41: Manufacturing Sector Improving<br />
Table 20: New Brunswick Merchandise Outlook<br />
1400<br />
1300<br />
1200<br />
1100<br />
1000<br />
900<br />
Shipments of Durable Goods and Food Products (SA)<br />
Source: Haver Analytics, <strong>EDC</strong> Economics<br />
800<br />
2002- 2003- 2004- 2005- 2006- 2007- 2008- 2009- 2010-<br />
Q1 Q1 Q1 Q1 Q1 Q1 Q1 Q1 Q1<br />
2011-<br />
Q1<br />
2012-<br />
Q1<br />
Top Sectors CAD mn % Share <strong>Export</strong> Outlook<br />
of Province’s<br />
Total <strong>Export</strong>s (% growth)<br />
2011 2011 2011 2012(f) 2013(f)<br />
Energy 10,691 71.9 23.0 7 1<br />
Forestry 1,512 10.2 -2.8 1 15<br />
Agri-Food 1,380 9.3 18.1 2 5<br />
Industrial Goods 958 6.4 3.0 -5 -8<br />
M&E 194 1.3 -16.8 6 11<br />
All Others 124 0.8 15.0 15 10<br />
Total 14,859 100.0 17.1 6 3<br />
Total excl. energy 4,168 28.1 4.3 1 6<br />
Source: Statistics <strong>Canada</strong>, <strong>EDC</strong> Economics. 2011 actual data, while 2012 and 2013 are<br />
forecast.<br />
BACK TO TABLE OF CONTENTS 46
E X P O R T F O R E C A S T O V E R V I E W 2 0 1 2<br />
1.0 GEF Executive Summary<br />
2.0 Country Overviews<br />
3.0 Sector Overview<br />
4.0 Provincial <strong>Export</strong> Outlook<br />
4.1 Newfoundland and Labrador<br />
4.2 Prince Edward Island<br />
4.3 Nova Scotia<br />
4.4 New Brunswick<br />
4.5 Quebec<br />
4.6 Ontario<br />
4.7 Manitoba<br />
4.8 Saskatchewan<br />
4.9 Alberta<br />
4.10 British Columbia<br />
5.0 Annexes<br />
4.5 Quebec<br />
Quebec’s exports are expected to increase modestly this<br />
year and next, following a relatively fl at 2011. Growth will<br />
be driven by a variety of factors, including strong prices<br />
and demand for commodities, higher aircraft deliveries,<br />
and the nascent rebound in the US housing market (the effect of which<br />
will be augmented by the 2-year extension, effective January 2012, of the<br />
Softwood Lumber Agreement between the US and <strong>Canada</strong>).<br />
Quebec’s aluminum production dipped in early 2012 due to production<br />
interruptions at Rio Tinto Alcan’s Alma smelter, which saw a temporary<br />
reduction of 30% (i.e. over 100,000 tonnes). At the Shawinigan smelter,<br />
output was temporarily reduced by 50% due to technical issues. Despite<br />
these disruptions, production during 2012-13 is expected to expand<br />
modestly with further upside potential in 2013. New investments in the<br />
sector that will boost this future growth include the announced third<br />
expansion phase at the Aluminerie Allouette smelter ($2 billion over<br />
15 years) and Alcoa’s 5-year, $2.1-billion investment into its two smelters<br />
in Baie-Comeau.<br />
Mining sector output will increase both this year and next. A key driver of<br />
this expansion is the $80-billion, government-led initiative unveiled in 2011<br />
(Plan Nord) to support mineral extraction in the northern regions. Under<br />
the plan, Xstrata is investing $500 million to develop its Raglan nickel<br />
mine in Nunavik, expected to produce 40,000 tonnes of nickel concentrate<br />
by 2016. In terms of other notable mining projects, ArcelorMittal’s Mont-<br />
Wright project is expected to double its iron-ore production in the coming<br />
years. Cliff Natural Resources’ Bloom Lake Mine will continue expanding<br />
its output through 2012-13, with the entirety of its production (roughly<br />
12 million tonnes this year) destined for the Chinese market.<br />
The aerospace sector is expected to fi nally shed the sluggishness that<br />
has characterized the sector since the recession. Bombardier will lead<br />
the charge with the fi rst delivery of its C Series planes expected in the<br />
2012-13 time frame; there are reportedly close to 150 fi rm orders for the<br />
planes, pointing toward strength into 2013 and beyond. C Series aside,<br />
Bombardier is expecting a strong year for deliveries in 2012, particularly<br />
for business aircraft.<br />
Provincial Stats<br />
GDP<br />
CAD 319.3 billion<br />
International <strong>Export</strong>s/GDP<br />
26%<br />
Number of <strong>Export</strong>ers<br />
2010: 8,001<br />
1999: 8,108<br />
Trade Balance (2011)<br />
-$11 billion (defi cit)<br />
Largest <strong>Export</strong><br />
Destinations<br />
1. United States 69%<br />
2. China 4%<br />
3. Germany 2%<br />
Share of <strong>Export</strong>s to<br />
Emerging Markets<br />
2011: 13.2%<br />
2007: 7.6%<br />
Herfindahl Index<br />
(Trade diversification<br />
where 0=extreme<br />
concentration)<br />
Sector: 0.24<br />
Regional: 0.50<br />
Figure 42: Quebec: <strong>Export</strong> Demand Indicators<br />
Table 21: Quebec Merchandise Outlook<br />
thous CAD<br />
14,000,000<br />
12,000,000<br />
10,000,000<br />
8,000,000<br />
6,000,000<br />
4,000,000<br />
2,000,000<br />
0<br />
200801<br />
Quebec: Shipments: All Mfg Industries (LH)<br />
LME Aluminum, ($/Metric Tonne) (RS)<br />
200806<br />
200811<br />
Source: Haver, CANSIM<br />
200904<br />
200909<br />
201002<br />
201007<br />
201012<br />
201105<br />
201110<br />
$3,500<br />
$3,000<br />
$2,500<br />
$2,000<br />
$1,500<br />
$1,000<br />
$500<br />
$0<br />
Top Sectors CAD mn % Share <strong>Export</strong> Outlook<br />
of Province’s<br />
Total <strong>Export</strong>s (% growth)<br />
2011 2011 2011 2012(f) 2013(f)<br />
Industrial Goods 24,511 39.4 9.7 6 5<br />
M&E 8,348 13.4 7.8 5 8<br />
Forestry 7,402 11.9 -2.5 6 11<br />
Transportation 7,457 12.0 5.3 8 10<br />
Agri-Food 5,597 9.0 12.9 9 7<br />
Consumer Goods 2,478 4.0 -1.2 2 5<br />
All Others 6,364 10.2 14.6 11 7<br />
Total 62,157 100.0 7.6 7 7<br />
Total excl. energy 58,795 94.6 7.0 7 7<br />
Source: Statistics <strong>Canada</strong>, <strong>EDC</strong> Economics. 2011 actual data,<br />
while 2012 and 2013 are forecast.<br />
BACK TO TABLE OF CONTENTS 47
E X P O R T F O R E C A S T O V E R V I E W 2 0 1 2<br />
1.0 GEF Executive Summary<br />
2.0 Country Overviews<br />
3.0 Sector Overview<br />
4.0 Provincial <strong>Export</strong> Outlook<br />
4.1 Newfoundland and Labrador<br />
4.2 Prince Edward Island<br />
4.3 Nova Scotia<br />
4.4 New Brunswick<br />
4.5 Quebec<br />
4.6 Ontario<br />
4.7 Manitoba<br />
4.8 Saskatchewan<br />
4.9 Alberta<br />
4.10 British Columbia<br />
5.0 Annexes<br />
4.6 Ontario<br />
Ontario’s export sector expansion rate will be strong<br />
in both 2012 and 2013, above the national level.<br />
Commodity prices will remain high in 2012, driving gains<br />
in the mining industry. Softening prices in 2013 will be<br />
accompanied by a falling loonie, offsetting the nominal impact and giving<br />
Ontario manufacturers a much-needed reprieve. Strength in 2013 will be<br />
broad-based as the US economy picks up steam and a weaker loonie<br />
pads foreign sale receipts. Ontario’s export sector is oriented toward<br />
the US market, but the trade diversifi cation story is evident even in the<br />
manufacturing heartland of <strong>Canada</strong>, with China becoming the secondlargest<br />
export destination (excluding precious metals).<br />
While signifi cantly smaller than it was before the recession, the auto<br />
sector remains the single largest export sector in Ontario. Following the<br />
natural disaster-related disruptions that plagued the Canadian automotive<br />
industry in 2011, production is back to normal and large gains at Honda<br />
and Toyota will drive export growth this year. Next year, the industry will<br />
moderate but continue posting healthy gains as the loonie dips below<br />
parity and US vehicle sales climb toward pre-recession levels.<br />
Double-digit increases in production at several Ontario gold mines,<br />
including the Young Davidson project, La Ronde and Kirkland Lake, will<br />
back record-high sales over the next 2 years. Higher output of both nickel<br />
and copper will also contribute to growth as the Lockerby nickel/copper<br />
mine is expected to reach full production by the end of 2012 and Vale’s<br />
Sudbury operations will be ramping up following supply disruptions in<br />
2011. The outlook for steel exports, however, is lacklustre in comparison.<br />
The recent announcement that US Steel will not restart production at its<br />
Hamilton plant highlights the underlying weakness in the industry despite<br />
improving demand from downstream industries. In this environment, it is<br />
highly unlikely that Essar Algoma will bring its (idled) capacity online.<br />
Ontario’s pharmaceutical industry still faces a challenging business<br />
environment shaped by falling R&D spending and expiring patents. Yet an<br />
uptick in venture capital activity in 2011 and a slew of recently announced<br />
investments, including expansion plans for Teva <strong>Canada</strong>’s Stouffville plant<br />
and GlaxoSmithKline’s Mississauga production facility, bode well for the<br />
medium-term outlook.<br />
Provincial Stats<br />
GDP<br />
$612.5 billion<br />
International <strong>Export</strong>s/GDP<br />
31%<br />
Number of <strong>Export</strong>ers<br />
2010: 16,655<br />
1999: 18,265<br />
Trade Balance (2011)<br />
$73 billion (defi cit)<br />
Largest <strong>Export</strong><br />
Destinations<br />
1. United States 77%<br />
Michigan 31%;<br />
California 11%<br />
New York 8%<br />
2. United Kingdom 9%<br />
3. Norway 2%<br />
Share of <strong>Export</strong>s to<br />
Emerging Markets<br />
2011: 5.8%<br />
2007:3.9%<br />
Herfindahl Index<br />
(Trade diversification<br />
where 0=extreme<br />
concentration)<br />
Sector: 0.26<br />
Regional: 0.61<br />
Figure 43: Ontario: <strong>Export</strong> Demand Indicators<br />
Table 22: Ontario Merchandise Outlook<br />
1,800,000<br />
1,600,000<br />
1,400,000<br />
1,200,000<br />
1,000,000<br />
800,000<br />
600,000<br />
400,000<br />
200,000<br />
0<br />
US: Vehicle Sales (NSA, Units) (LS)<br />
US Industrial Production (RS)<br />
Source: Haver Analytics<br />
200701<br />
200707<br />
200801<br />
200807<br />
200901<br />
200907<br />
201001<br />
201007<br />
201101<br />
201107<br />
201201<br />
120<br />
110<br />
100<br />
90<br />
80<br />
70<br />
60<br />
50<br />
Top Sectors CAD mn % Share <strong>Export</strong> Outlook<br />
of Province’s<br />
Total <strong>Export</strong>s (% growth)<br />
2011 2011 2011 2012(f) 2013(f)<br />
Industrial Goods 57,398 36.9 13.3 8 10<br />
Motor Vehicle 50,130 32.3 2.4 15 10<br />
M&E 20,909 13.5 2.9 6 8<br />
Agri-Food 9,767 6.3 5.5 7 6<br />
Forestry 4,590 3.0 -0.3 -1 12<br />
Consumer Goods 4,594 3.0 13.2 5 7<br />
All Others 8,024 5.2 -2.3 7 6<br />
Total 155,413 100.0 6.4 9 9<br />
Source: Statistics <strong>Canada</strong>, <strong>EDC</strong> Economics. 2011 actual data, while 2012 and 2013 are<br />
forecast.<br />
BACK TO TABLE OF CONTENTS 48
E X P O R T F O R E C A S T O V E R V I E W 2 0 1 2<br />
1.0 GEF Executive Summary<br />
2.0 Country Overviews<br />
3.0 Sector Overview<br />
4.0 Provincial <strong>Export</strong> Outlook<br />
4.1 Newfoundland and Labrador<br />
4.2 Prince Edward Island<br />
4.3 Nova Scotia<br />
4.4 New Brunswick<br />
4.5 Quebec<br />
4.6 Ontario<br />
4.7 Manitoba<br />
4.8 Saskatchewan<br />
4.9 Alberta<br />
4.10 British Columbia<br />
5.0 Annexes<br />
4.7 Manitoba<br />
After surging 15% last year, Manitoba’s exports are<br />
poised for a solid 8% increase in 2012 followed by a more<br />
moderate 7% rise next year. <strong>EDC</strong> Economics’ forecast for<br />
solid export growth is underpinned by improving demand<br />
from the US and still-high, albeit moderating, agricultural commodity<br />
prices. The energy sector is benefi ting from the soaring price of oil, driven<br />
by instability in the Middle East and North Africa. Pressure from the strong<br />
Canadian dollar remains a signifi cant challenge for exporters; however,<br />
some reprieve is expected next year as the loonie dips to USD 0.97.<br />
Manitoba is <strong>Canada</strong>’s most diversifi ed provincial economy and almost all<br />
of its sectors are fi ring on all cylinders.<br />
Manitoban agri-food exports are forecast to rise by 10% this year, as a<br />
large increase in the volume of exports will compensate for lower prices<br />
for most grains in 2012. After 2 years of water-saturated soils, farmers<br />
are looking forward to vastly improved conditions and harvests this year.<br />
Higher canola production over the forecast period will be a key contributor<br />
to Manitoba’s export growth, while durum sales will also climb refl ecting<br />
much higher prices. Manitoba’s livestock exports will increase, particularly<br />
beef, which is seeing solid price increases and higher demand from<br />
emerging markets and Korea (which recently lifted its ban on Canadian<br />
beef).<br />
Manitoba’s energy sector will be a strong driver of growth over the forecast<br />
horizon, with exports expected to rise 11% this year and 5% in 2013. In<br />
spite of low growth in petroleum production, higher oil prices through 2012<br />
will raise the value of the province’s crude exports, while providing the<br />
incentive needed for increased drilling activity to support output. With US<br />
industrial activity picking up and Manitoba Hydro’s Wuskwatim generating<br />
station coming online in 2012, our forecast is positive for Manitoba’s<br />
electricity exports.<br />
Finally, in the transportation sector, the aerospace industry will benefi t<br />
from rising aircraft orders that will provide a welcome boost for Boeing<br />
Winnipeg, while Standard Aero’s multi-year contracts with US NAVAIR<br />
and EuroLot should boost export prospects in the service segment.<br />
Provincial Stats<br />
GDP<br />
CAD 54.3 billion<br />
International <strong>Export</strong>s/GDP<br />
27%<br />
Number of <strong>Export</strong>ers<br />
2010: 1,156<br />
1999: 1,263<br />
Trade Balance (2011)<br />
CAD 4.3 billion (defi cit)<br />
Largest <strong>Export</strong><br />
Destinations<br />
1. United States 61%<br />
2. China 8%<br />
3. Japan 6%<br />
Share of <strong>Export</strong>s to<br />
Emerging Markets<br />
2011: 22.3%<br />
2007:19.8%<br />
Herfindahl Index<br />
(Trade diversification<br />
where 0=extreme<br />
concentration)<br />
Sector: 0.22<br />
Regional: 0.41<br />
Figure 44: Manitoban Imports Back to Pre-Crisis Levels,<br />
but <strong>Export</strong>s Still Have a Way to Go (Monthly, CAD Millions)<br />
1600<br />
1400<br />
1200<br />
1000<br />
800<br />
600<br />
400<br />
Jan<br />
2010<br />
Jan<br />
2002<br />
Imports<br />
<strong>Export</strong>s<br />
Jan<br />
2003<br />
Jan<br />
2004<br />
Jan<br />
2005<br />
Source: Statistics <strong>Canada</strong><br />
Jan<br />
2006<br />
Jan<br />
2007<br />
Jan<br />
2008<br />
Jan<br />
2009<br />
Jan<br />
2010<br />
Jan<br />
2011<br />
Jan<br />
2012<br />
Table 23: Manitoba Merchandise Outlook<br />
Top Sectors CAD mn % Share <strong>Export</strong> Outlook<br />
of Province’s<br />
Total <strong>Export</strong>s (% growth)<br />
2011 2011 2011 2012(f) 2013(f)<br />
Agri-Food 4,279 36.3 5.8 10 5<br />
Industrial Goods 3,180 27.0 32.1 5 7<br />
M&E 1,444 12.3 18.4 9 12<br />
Energy 1,128 9.6 30.6 11 5<br />
Motor Vehicle 469 4.0 8.7 13 10<br />
Forestry 401 3.4 7.4 3 11<br />
All others 881 7.5 -1.7 6 9<br />
Total 11,783 100.0 15.1 8 7<br />
Total excl. energy 10,655 90.4 13.7 8 7<br />
Source: Statistics <strong>Canada</strong>, <strong>EDC</strong> Economics. 2011 actual data, while 2012 and 2013<br />
are forecast.<br />
BACK TO TABLE OF CONTENTS 49
E X P O R T F O R E C A S T O V E R V I E W 2 0 1 2<br />
1.0 GEF Executive Summary<br />
2.0 Country Overviews<br />
3.0 Sector Overview<br />
4.0 Provincial <strong>Export</strong> Outlook<br />
4.1 Newfoundland and Labrador<br />
4.2 Prince Edward Island<br />
4.3 Nova Scotia<br />
4.4 New Brunswick<br />
4.5 Quebec<br />
4.6 Ontario<br />
4.7 Manitoba<br />
4.8 Saskatchewan<br />
4.9 Alberta<br />
4.10 British Columbia<br />
5.0 Annexes<br />
4.8 Saskatchewan<br />
After a blistering 25% increase in exports last year,<br />
Saskatchewan’s growth will slow to a solid 8% this<br />
year, followed by a 3% rise in 2013. The province’s<br />
energy exports will receive a boost from rising prices,<br />
while agriculture should rebound after the wet weather conditions that<br />
lowered harvests over the past 2 years.<br />
Saskatchewan’s energy exports will grow by 5% this year even though<br />
the oil production profi le is fairly stable through 2013, as earnings will<br />
be pushed up by climbing oil prices. Rising light crude output out of the<br />
Bakken will be offset by sustained declines in conventional production<br />
of heavy oil, simply because the Western <strong>Canada</strong> Sedimentary Basin is<br />
mature and production has been declining for years. High energy prices<br />
will continue to drive investment, and higher drilling activity will continue<br />
through the forecast horizon, although it will take time for additional<br />
production capacity to come online.<br />
The volume of Saskatchewan’s agri-food exports will take off in 2012 as<br />
last year’s fl ooding and much heavier-than-normal springtime precipitation<br />
led to challenging conditions in 2011, which saw a remarkably low level<br />
of acreage being seeded. However, soaring export volumes will be partly<br />
offset by lower grain prices, which will persist below the heights reached<br />
in 2011. Despite this, the long-term price drivers for global agriculture<br />
remain strong, particularly the rapidly rising emerging market demand for<br />
food as well as soaring production of biofuel. However, the record-high<br />
prices have driven big increases in supply and inventories will recover to<br />
normal levels. This year, Saskatchewan farmers have shifted production<br />
toward higher-margin canola and durum, while corn will remain essentially<br />
unchanged. Saskatchewan’s beef exports will see slight declines in<br />
export volumes, but these will be supported by strong prices this year, as<br />
consumer demand builds momentum.<br />
Fertilizer exports will post solid growth both this year and next, with the<br />
strongest performance coming from the potash sector. As an input into<br />
global agriculture, fertilizers are affected by the same retreat in agriculture<br />
prices, but potash much less so. Canpotex’s growing shipments to Brazil,<br />
India and other Asian importers will be supported by impressive emerging<br />
market growth, which should continue through 2012 and into next year.<br />
Provincial Stats<br />
GDP<br />
CAD 63.5 billion<br />
International <strong>Export</strong>s/GDP<br />
39%<br />
Number of <strong>Export</strong>ers<br />
2010: 761<br />
1999: 731<br />
Trade Balance (2011)<br />
CAD 20.2 billion<br />
Largest <strong>Export</strong><br />
Destinations<br />
1. United States 62%<br />
2. China 6%<br />
3. Japan 3%<br />
Share of <strong>Export</strong>s to<br />
Emerging Markets<br />
2011: 24.9%<br />
2007: 23.3%<br />
Herfindahl Index<br />
(Trade diversification<br />
where 0=extreme<br />
concentration)<br />
Sector: 0.31<br />
Regional: 0.41<br />
Figure 45: Saskatchewan <strong>Export</strong>s Back to Pre-Crisis<br />
Levels (CAD Millions)<br />
30,000<br />
25,000<br />
20,000<br />
15,000<br />
10,000<br />
5,000<br />
0<br />
2002 2003 2004 2005 2006 2007 2008 2009 2010 2011<br />
Source: Statistics <strong>Canada</strong><br />
Oil and Gas Extraction<br />
Non-Metallic Mineral Mining<br />
and Quarrying<br />
Wheat Farming<br />
Oilseed (except Soybean)<br />
Farming<br />
Inorganic Chemical<br />
Manufacturing<br />
Dry Pea and Bean Farming<br />
OTHERS<br />
Table 24: Saskatchewan Merchandise Outlook<br />
Top Sectors CAD mn % Share <strong>Export</strong> Outlook<br />
of Province’s<br />
Total <strong>Export</strong>s (% growth)<br />
2011 2011 2011 2012(f) 2013(f)<br />
Energy 10,500 35.6 23.7 5 -1<br />
Agri-Food 10,166 34.4 23.2 10 3<br />
Fertilizers 6,555 22.2 30.3 10 7<br />
Chemicals/Plastics 871 2.9 34.4 6 6<br />
All Others 1,427 4.8 12.2 7 13<br />
Total 29,520 100.0 24.6 8 3<br />
Total excl. energy 19,020 64.4 25.1 10 5<br />
Source: Statistics <strong>Canada</strong>, <strong>EDC</strong> Economics. 2011 actual data, while 2012 and 2013<br />
are forecast.<br />
BACK TO TABLE OF CONTENTS 50
E X P O R T F O R E C A S T O V E R V I E W 2 0 1 2<br />
1.0 GEF Executive Summary<br />
2.0 Country Overviews<br />
3.0 Sector Overview<br />
4.0 Provincial <strong>Export</strong> Outlook<br />
4.1 Newfoundland and Labrador<br />
4.2 Prince Edward Island<br />
4.3 Nova Scotia<br />
4.4 New Brunswick<br />
4.5 Quebec<br />
4.6 Ontario<br />
4.7 Manitoba<br />
4.8 Saskatchewan<br />
4.9 Alberta<br />
4.10 British Columbia<br />
5.0 Annexes<br />
4.9 Alberta<br />
Following last year’s very strong performance, Alberta’s<br />
export sector will see growth moderate but continue<br />
to post steady gains; <strong>EDC</strong> Economics forecasts a<br />
7% increase this year followed by a slightly slower<br />
6% in 2013. After the very strong price gains for key commodities last<br />
year, upside potential is limited and prices will begin to soften next year.<br />
Volumes will be down for natural gas and newsprint over the coming<br />
2 years. Overall, <strong>EDC</strong> anticipates that export revenues will clock in just<br />
shy of USD 100 billion in 2012, but clear this hurdle the following year.<br />
Our forecast for exports of crude oil and petroleum products is largely<br />
driven by increased volume as price gains are limited. However, the<br />
impact from high prices will continue to be felt on the supply side, as<br />
heightened production activity will continue going forward due to signifi cant<br />
investments and enhanced extraction techniques. Bitumen output could<br />
rise as much as 10% this year and next. We expect an annual average<br />
price for WTI crude of USD100/bbl this year, falling to USD95/bbl next year.<br />
The outlook for natural gas, on the other hand, is weak and is shaped by<br />
a regional market oversupplied thanks to ample US shale gas production.<br />
Natural gas prices will slip 25% to average just USD3/mmbtu this year.<br />
A price rebound is on tap next year, but will be insuffi cient to help entice<br />
production and export gains. With greater returns in the crude market, the<br />
shift toward more rig activity in the crude segment over natural gas will<br />
remain in place.<br />
Industrial goods, M&E, agri-food and forestry are Alberta’s other major<br />
export segments. Turning to industrial goods, the performance will be<br />
mixed. Fertilizers, chemicals and plastics will help propel industrial goods<br />
growth as global demand continues to rise and the US recovery boosts<br />
demand. Metals and ore sales, while less impressive, will benefi t from a<br />
rebound in the US auto sector. The agri-food sector will also post solid<br />
gains thanks to higher sales of wheat, oilseeds and Alberta beef. The<br />
recovering US and Japanese markets alongside continued growth in sales<br />
to China, Mexico and the UAE will see steady double-digit volume sales of<br />
wheat and pulses. Meanwhile, prepared meat sales will advance 12% in<br />
both years. M&E sales linked to oil and gas drilling activity will continue to<br />
be strong over the forecast.<br />
Provincial Stats<br />
GDP<br />
CAD 263.5 billion<br />
International <strong>Export</strong>s/GDP<br />
33%<br />
Number of <strong>Export</strong>ers<br />
2010: 2,972<br />
1999: 2,901<br />
Trade Balance (2011)<br />
$69 billion<br />
Largest <strong>Export</strong><br />
Destinations<br />
1. United States 43%<br />
2. China 3%<br />
3. Japan 2%<br />
Share of <strong>Export</strong>s to<br />
Emerging Markets<br />
2011: 7.2%<br />
2007:7.6%<br />
Herfindahl Index<br />
(Trade diversification<br />
where 0=extreme<br />
concentration)<br />
Sector: 0.53<br />
Regional: 0.76<br />
Figure 46: Alberta Rig Count vs WTI Prices<br />
800<br />
700<br />
600<br />
500<br />
400<br />
300<br />
200<br />
100<br />
0<br />
Source: Statistics <strong>Canada</strong><br />
Canadian Rig Count: Alberta (Units) (LS)<br />
Crude Oil Spot Prices: US: WTI-40 [Cushing] ($/Bbl) (RS)<br />
Jan-00<br />
Jan-01<br />
Jan-02<br />
Jan-03<br />
Jan-04<br />
Jan-05<br />
Jan-06<br />
Jan-07<br />
Jan-08<br />
Jan-09<br />
Jan-10<br />
Jan-11<br />
Jan-12<br />
160<br />
140<br />
120<br />
100<br />
80<br />
60<br />
40<br />
20<br />
0<br />
Table 25: Alberta Merchandise Outlook<br />
Top Sectors CAD mn % Share <strong>Export</strong> Outlook<br />
of Province’s<br />
Total <strong>Export</strong>s (% growth)<br />
2011 2011 2011 2012(f) 2013(f)<br />
Energy 67,596 72.6 19.3 8 5<br />
Industrial Goods 10,200 11.0 15.4 4 5<br />
Agri-Food 7,912 8.5 18.4 10 5<br />
M&E 4,362 4.7 26.5 7 10<br />
Forestry 2,078 2.2 -8.5 -1 20<br />
All Others 898 1.0 17.9 8 9<br />
Total 93,046 100.0 18.3 7 6<br />
Total excl. energy 25,450 27.4 15.7 6 7<br />
Source: Statistics <strong>Canada</strong>, <strong>EDC</strong> Economics. 2011 actual data, while 2012 and 2013<br />
are forecast.<br />
BACK TO TABLE OF CONTENTS 51
E X P O R T F O R E C A S T O V E R V I E W 2 0 1 2<br />
1.0 GEF Executive Summary<br />
2.0 Country Overviews<br />
3.0 Sector Overview<br />
4.0 Provincial <strong>Export</strong> Outlook<br />
4.1 Newfoundland and Labrador<br />
4.2 Prince Edward Island<br />
4.3 Nova Scotia<br />
4.4 New Brunswick<br />
4.5 Quebec<br />
4.6 Ontario<br />
4.7 Manitoba<br />
4.8 Saskatchewan<br />
4.9 Alberta<br />
4.10 British Columbia<br />
5.0 Annexes<br />
4.10 British Columbia<br />
The expected slowdown in China this year will dampen the<br />
strong export growth of key commodities seen in recent<br />
years. Nonetheless, continued strong demand from<br />
China and other rapidly growing Asian economies over<br />
the medium to long term will benefi t British Columbia’s export sector, as<br />
will the US housing recovery.<br />
We anticipate strong growth of BC’s forestry sector exports in 2012 and<br />
2013. As residential construction activity in China gears down, weaker<br />
Chinese demand for wood products will be more than compensated for<br />
by reconstruction in Japan following last year’s devastating tsunami, and<br />
stronger US housing starts. Chinese pulp imports will again be an important<br />
growth driver going forward, although import demand will weaken from<br />
recent high growth rates with the slowing economy. We do not expect the<br />
Catalyst Paper restructuring to lead to capacity curtailment at the company’s<br />
BC operations, although this remains a downside risk to our outlook.<br />
Signifi cantly weaker prices for natural gas and coal will see exports of<br />
energy decline in 2012. This will come despite rising production of natural<br />
gas from both the Horn River Basin and the Montney shale gas formation,<br />
and greater coal exports with the reopening of the Quintette mine and<br />
capacity expansion of West Coast coal terminals. There is mounting<br />
interest in the province’s energy potential for natural gas and coal,<br />
particularly from Asia, due to growing demand for steel and electricity. As<br />
a result, international energy companies are lining up to invest in BC’s<br />
energy potential, with further interest driven by uncertainty over the future<br />
of the Japanese nuclear sector. Two export-oriented LNG terminals have<br />
been approved, and analysts expect Shell to submit an application for a<br />
third one in the near future.<br />
While the fundamentals for gold and copper will deteriorate over the<br />
forecast horizon, industrial goods exports will benefi t from greater capacity<br />
in the province’s metal mining sector. New supply is coming on stream in<br />
2012, including Copper Mountain, Mount Milligan and New Afton, which will<br />
boost ore and metal exports despite weaker prices for key commodities.<br />
With more than 350 mineral exploration operations and 20 major mine<br />
projects active throughout the province, as well as signifi cant additions to<br />
the Kitimat smelter in the province, the long-term outlook for BC’s mining<br />
sector is quite promising.<br />
Provincial Stats<br />
GDP<br />
CAD 203.1 billion<br />
International <strong>Export</strong>s/GDP<br />
22%<br />
Number of <strong>Export</strong>ers<br />
2010: 5,077<br />
1999: 5,543<br />
Trade Balance (2011)<br />
CAD -7 billion (deficit)<br />
Largest <strong>Export</strong><br />
Destinations<br />
1. United States 43%<br />
2. China 15%<br />
3. Japan 14%<br />
Share of <strong>Export</strong>s to<br />
Emerging Markets<br />
2011: 24.5%<br />
2007:12.6%<br />
Herfindahl Index<br />
(Trade diversification<br />
where 0=extreme<br />
concentration)<br />
Sector: 0.23<br />
Regional: 0.24<br />
Figure 47: Asian Demand Boost<br />
16,000<br />
14,000<br />
12,000<br />
10,000<br />
8,000<br />
6,000<br />
4,000<br />
<strong>Export</strong>s to Asia (LS)<br />
<strong>Export</strong>s to Asia (share of total) (RS)<br />
2002 2003 2004 2005 2006 2007 2008 2009 2010 2011<br />
Source: Industry <strong>Canada</strong><br />
45.0<br />
40.0<br />
35.0<br />
30.0<br />
25.0<br />
20.0<br />
15.0<br />
Table 26: BC Merchandise Outlook<br />
Top Sectors CAD mn % Share <strong>Export</strong> Outlook<br />
of Province’s<br />
Total <strong>Export</strong>s (% growth)<br />
2011 2011 2011 2012(f) 2013(f)<br />
Forestry 9,900 30.2 8.8 9 24<br />
Energy 10,054 30.7 25.1 -1 8<br />
Industrial Goods 6,557 20.0 18.4 7 10<br />
M&E 2,416 7.4 6.3 5 8<br />
Agri-Food 2,587 7.9 1.5 4 6<br />
All Others 1,285 3.9 4.9 5 8<br />
Total 32,799 100.0 14.2 4 13<br />
Total excl. energy 22,745 69.3 10.0 7 16<br />
Source: Statistics <strong>Canada</strong>, <strong>EDC</strong> Economics. 2011 actual data, while 2012 and 2013<br />
are forecast.<br />
BACK TO TABLE OF CONTENTS 52
E X P O R T F O R E C A S T O V E R V I E W 2 0 1 2<br />
1.0 GEF Executive Summary<br />
5.0 Annexes<br />
2.0 Country Overviews<br />
3.0 Sector Overview<br />
4.0 Provincial <strong>Export</strong> Outlook<br />
5.0 Annexes<br />
5.1 Experience and Attitude<br />
5.2 Payment Risk Maps<br />
BACK TO TABLE OF CONTENTS 53
E X P O R T F O R E C A S T O V E R V I E W 2 0 1 2<br />
1.0 GEF Executive Summary<br />
2.0 Country Overviews<br />
3.0 Sector Overview<br />
4.0 Provincial <strong>Export</strong> Outlook<br />
5.0 Annexes<br />
5.1 Experience and Attitude<br />
5.2 Payment Risk Maps<br />
<strong>EDC</strong> Payment Experience:<br />
Measured by the number and<br />
size of <strong>EDC</strong> claims experienced<br />
in a particular country over a<br />
period of a year, relative to<br />
<strong>EDC</strong>’s business volume growth.<br />
positive<br />
Positive: The number of claims<br />
or the amounts claimed have<br />
decreased in proportion to <strong>EDC</strong><br />
business volume growth.<br />
neutral<br />
Neutral: The number of<br />
claims or the amounts claimed<br />
have remained unchanged in<br />
proportion to <strong>EDC</strong> business<br />
volume growth.<br />
5.1 Experience and Attitude<br />
Algeria<br />
Risk Level<br />
Short-term commercial:<br />
Medium<br />
Medium-long-term commercial: Medium<br />
Sovereign:<br />
Medium<br />
<strong>EDC</strong> payment experience 2011: Negative: (–)<br />
Angola<br />
Risk Level<br />
Short-term commercial:<br />
Medium<br />
Medium-long-term commercial: Medium<br />
Sovereign:<br />
Medium<br />
<strong>EDC</strong> payment experience 2011: Positive: (+)<br />
Argentina<br />
Risk Level<br />
Short-term commercial:<br />
Medium-High<br />
Medium-long-term commercial: Medium-High<br />
Sovereign:<br />
High<br />
<strong>EDC</strong> payment experience 2011: Positive: (+)<br />
negative<br />
Negative: The number of<br />
claims or the amounts claimed<br />
have increased in proportion to<br />
<strong>EDC</strong> business volume growth.<br />
Armenia<br />
Risk Level<br />
Short-term commercial:<br />
Medium-long-term commercial:<br />
Sovereign:<br />
<strong>EDC</strong> payment experience 2011:<br />
Medium-High<br />
Medium-High<br />
Medium-High<br />
Insuffi cient Data<br />
Australia<br />
Risk Level<br />
Short-term commercial:<br />
Low<br />
Medium-long-term commercial: Low<br />
Sovereign:<br />
Low<br />
<strong>EDC</strong> payment experience 2011: Positive: (+)<br />
BACK TO TABLE OF CONTENTS 54
E X P O R T F O R E C A S T O V E R V I E W 2 0 1 2<br />
1.0 GEF Executive Summary<br />
2.0 Country Overviews<br />
3.0 Sector Overview<br />
4.0 Provincial <strong>Export</strong> Outlook<br />
5.0 Annexes<br />
5.1 Experience and Attitude<br />
5.2 Payment Risk Maps<br />
Azerbaijan<br />
Risk Level<br />
Short-term commercial:<br />
Medium-long-term commercial:<br />
Sovereign:<br />
<strong>EDC</strong> payment experience 2011:<br />
Medium<br />
Medium<br />
Medium<br />
Insuffi cient Data<br />
<strong>EDC</strong> Payment Experience:<br />
Measured by the number and<br />
size of <strong>EDC</strong> claims experienced<br />
in a particular country over a<br />
period of a year, relative to<br />
<strong>EDC</strong>’s business volume growth.<br />
positive<br />
Positive: The number of claims<br />
or the amounts claimed have<br />
decreased in proportion to <strong>EDC</strong><br />
business volume growth.<br />
neutral<br />
Neutral: The number of<br />
claims or the amounts claimed<br />
have remained unchanged in<br />
proportion to <strong>EDC</strong> business<br />
volume growth.<br />
negative<br />
Negative: The number of<br />
claims or the amounts claimed<br />
have increased in proportion to<br />
<strong>EDC</strong> business volume growth.<br />
Bahamas<br />
Risk Level<br />
Short-term commercial:<br />
Low<br />
Medium-long-term commercial: Low<br />
Sovereign:<br />
Low<br />
<strong>EDC</strong> payment experience 2011: Positive: (+)<br />
Bahrain<br />
Risk Level<br />
Short-term commercial:<br />
Medium<br />
Medium-long-term commercial: Medium<br />
Sovereign:<br />
Medium<br />
<strong>EDC</strong> payment experience 2011: Negative: (–)<br />
Bangladesh<br />
Risk Level<br />
Short-term commercial:<br />
Medium<br />
Medium-long-term commercial: Medium-High<br />
Sovereign:<br />
Medium-High<br />
<strong>EDC</strong> payment experience 2011: Positive: (+)<br />
Barbados<br />
Risk Level<br />
Short-term commercial:<br />
Low<br />
Medium-long-term commercial: Low<br />
Sovereign:<br />
Medium<br />
<strong>EDC</strong> payment experience 2011: Positive: (+)<br />
BACK TO TABLE OF CONTENTS 55
E X P O R T F O R E C A S T O V E R V I E W 2 0 1 2<br />
1.0 GEF Executive Summary<br />
2.0 Country Overviews<br />
3.0 Sector Overview<br />
4.0 Provincial <strong>Export</strong> Outlook<br />
5.0 Annexes<br />
5.1 Experience and Attitude<br />
Bolivia, Plurinational State of<br />
Risk Level<br />
Short-term commercial:<br />
Medium-High<br />
Medium-long-term commercial: Medium-High<br />
Sovereign:<br />
Medium-High<br />
<strong>EDC</strong> payment experience 2011: Positive: (+)<br />
5.2 Payment Risk Maps<br />
<strong>EDC</strong> Payment Experience:<br />
Measured by the number and<br />
size of <strong>EDC</strong> claims experienced<br />
in a particular country over a<br />
period of a year, relative to<br />
<strong>EDC</strong>’s business volume growth.<br />
positive<br />
Positive: The number of claims<br />
or the amounts claimed have<br />
decreased in proportion to <strong>EDC</strong><br />
business volume growth.<br />
neutral<br />
Neutral: The number of<br />
claims or the amounts claimed<br />
have remained unchanged in<br />
proportion to <strong>EDC</strong> business<br />
volume growth.<br />
negative<br />
Negative: The number of<br />
claims or the amounts claimed<br />
have increased in proportion to<br />
<strong>EDC</strong> business volume growth.<br />
Botswana<br />
Risk Level<br />
Short-term commercial:<br />
Low<br />
Medium-long-term commercial: Low<br />
Sovereign:<br />
Medium<br />
<strong>EDC</strong> payment experience 2011: Positive: (+)<br />
Brazil<br />
Risk Level<br />
Short-term commercial:<br />
Medium<br />
Medium-long-term commercial: Medium<br />
Sovereign:<br />
Medium<br />
<strong>EDC</strong> payment experience 2011: Negative: (–)<br />
Bulgaria<br />
Risk Level<br />
Short-term commercial:<br />
Medium<br />
Medium-long-term commercial: Medium<br />
Sovereign:<br />
Medium<br />
<strong>EDC</strong> payment experience 2011: Positive: (+)<br />
Cameroon<br />
Risk Level<br />
Short-term commercial:<br />
Medium-long-term commercial:<br />
Sovereign:<br />
<strong>EDC</strong> payment experience 2011:<br />
Medium<br />
Medium<br />
Medium-High<br />
Insuffi cient Data<br />
BACK TO TABLE OF CONTENTS 56
E X P O R T F O R E C A S T O V E R V I E W 2 0 1 2<br />
1.0 GEF Executive Summary<br />
2.0 Country Overviews<br />
3.0 Sector Overview<br />
4.0 Provincial <strong>Export</strong> Outlook<br />
5.0 Annexes<br />
5.1 Experience and Attitude<br />
Chile<br />
Risk Level<br />
Short-term commercial:<br />
Low<br />
Medium-long-term commercial: Low<br />
Sovereign:<br />
Low<br />
<strong>EDC</strong> payment experience 2011: Positive: (+)<br />
5.2 Payment Risk Maps<br />
<strong>EDC</strong> Payment Experience:<br />
Measured by the number and<br />
size of <strong>EDC</strong> claims experienced<br />
in a particular country over a<br />
period of a year, relative to<br />
<strong>EDC</strong>’s business volume growth.<br />
positive<br />
Positive: The number of claims<br />
or the amounts claimed have<br />
decreased in proportion to <strong>EDC</strong><br />
business volume growth.<br />
neutral<br />
Neutral: The number of<br />
claims or the amounts claimed<br />
have remained unchanged in<br />
proportion to <strong>EDC</strong> business<br />
volume growth.<br />
negative<br />
Negative: The number of<br />
claims or the amounts claimed<br />
have increased in proportion to<br />
<strong>EDC</strong> business volume growth.<br />
China<br />
Risk Level<br />
Short-term commercial:<br />
Low<br />
Medium-long-term commercial: Low<br />
Sovereign:<br />
Low<br />
<strong>EDC</strong> payment experience 2011: Positive: (+)<br />
Colombia<br />
Risk Level<br />
Short-term commercial:<br />
Medium<br />
Medium-long-term commercial: Medium<br />
Sovereign:<br />
Medium<br />
<strong>EDC</strong> payment experience 2011: Positive: (+)<br />
Costa Rica<br />
Risk Level<br />
Short-term commercial:<br />
Medium<br />
Medium-long-term commercial: Medium<br />
Sovereign:<br />
Medium<br />
<strong>EDC</strong> payment experience 2011: Positive: (+)<br />
Côte d’Ivoire<br />
Risk Level<br />
Short-term commercial:<br />
Medium-long term Commercial:<br />
Sovereign:<br />
<strong>EDC</strong> payment experience 2011:<br />
High*<br />
High<br />
High<br />
No Information<br />
BACK TO TABLE OF CONTENTS 57
E X P O R T F O R E C A S T O V E R V I E W 2 0 1 2<br />
1.0 GEF Executive Summary<br />
2.0 Country Overviews<br />
3.0 Sector Overview<br />
4.0 Provincial <strong>Export</strong> Outlook<br />
5.0 Annexes<br />
5.1 Experience and Attitude<br />
Croatia<br />
Risk Level<br />
Short-term commercial:<br />
Medium<br />
Medium-long-term commercial: Meduim<br />
Sovereign:<br />
Medium<br />
<strong>EDC</strong> payment experience 2011: Positive: (+)<br />
5.2 Payment Risk Maps<br />
<strong>EDC</strong> Payment Experience:<br />
Measured by the number and<br />
size of <strong>EDC</strong> claims experienced<br />
in a particular country over a<br />
period of a year, relative to<br />
<strong>EDC</strong>’s business volume growth.<br />
positive<br />
Positive: The number of claims<br />
or the amounts claimed have<br />
decreased in proportion to <strong>EDC</strong><br />
business volume growth.<br />
neutral<br />
Neutral: The number of<br />
claims or the amounts claimed<br />
have remained unchanged in<br />
proportion to <strong>EDC</strong> business<br />
volume growth.<br />
negative<br />
Negative: The number of<br />
claims or the amounts claimed<br />
have increased in proportion to<br />
<strong>EDC</strong> business volume growth.<br />
Cuba<br />
Risk Level<br />
Short-term commercial:<br />
Medium-long-term commercial:<br />
Sovereign:<br />
<strong>EDC</strong> payment experience 2011:<br />
Czech Republic<br />
Risk Level<br />
Short-term commercial:<br />
Medium-long-term commercial:<br />
Sovereign:<br />
<strong>EDC</strong> payment experience 2011:<br />
Dominican Republic<br />
Risk Level<br />
Short-term commercial:<br />
Medium-long-term commercial:<br />
Sovereign:<br />
<strong>EDC</strong> payment experience 2011:<br />
Medium-High*<br />
High<br />
High<br />
No Information<br />
Low<br />
Low<br />
Low<br />
Neutral: (O)<br />
Medium<br />
Medium<br />
Medium-High<br />
Neutral: (O)<br />
Ecuador<br />
Risk Level<br />
Short-term commercial:<br />
Medium-High<br />
Medium-long term Commercial: Medium-High<br />
Sovereign:<br />
High<br />
<strong>EDC</strong> payment experience 2011: Positive: (+)<br />
BACK TO TABLE OF CONTENTS 58
E X P O R T F O R E C A S T O V E R V I E W 2 0 1 2<br />
1.0 GEF Executive Summary<br />
2.0 Country Overviews<br />
3.0 Sector Overview<br />
4.0 Provincial <strong>Export</strong> Outlook<br />
5.0 Annexes<br />
5.1 Experience and Attitude<br />
5.2 Payment Risk Maps<br />
Egypt<br />
Risk Level<br />
Short-term commercial:<br />
Medium-long-term commercial:<br />
Sovereign:<br />
<strong>EDC</strong> payment experience 2011:<br />
Medium<br />
Medium<br />
Medium<br />
Neutral: (O)<br />
<strong>EDC</strong> Payment Experience:<br />
Measured by the number and<br />
size of <strong>EDC</strong> claims experienced<br />
in a particular country over a<br />
period of a year, relative to<br />
<strong>EDC</strong>’s business volume growth.<br />
positive<br />
Positive: The number of claims<br />
or the amounts claimed have<br />
decreased in proportion to <strong>EDC</strong><br />
business volume growth.<br />
neutral<br />
Neutral: The number of<br />
claims or the amounts claimed<br />
have remained unchanged in<br />
proportion to <strong>EDC</strong> business<br />
volume growth.<br />
negative<br />
Negative: The number of<br />
claims or the amounts claimed<br />
have increased in proportion to<br />
<strong>EDC</strong> business volume growth.<br />
El Salvador<br />
Risk Level<br />
Short-term commercial:<br />
Medium<br />
Medium-long-term commercial: Medium<br />
Sovereign:<br />
Medium<br />
<strong>EDC</strong> payment experience 2011: Positive: (+)<br />
Equatorial Guinea<br />
Risk Level<br />
Short-term commercial:<br />
Medium-High<br />
Medium-long-term commercial: Medium-High<br />
Sovereign:<br />
Medium-High<br />
<strong>EDC</strong> payment experience 2011: Insuffi cient Data<br />
Estonia<br />
Risk Level<br />
Short-term commercial:<br />
Medium<br />
Medium-long-term commercial: Low<br />
Sovereign:<br />
Low<br />
<strong>EDC</strong> payment experience 2011: Positive: (+)<br />
Ethiopia<br />
Risk Level<br />
Short-term commercial:<br />
Medium-long-term commercial:<br />
Sovereign:<br />
<strong>EDC</strong> payment experience 2011:<br />
Medium-High<br />
High<br />
High<br />
Insuffi cient Data<br />
BACK TO TABLE OF CONTENTS 59
E X P O R T F O R E C A S T O V E R V I E W 2 0 1 2<br />
1.0 GEF Executive Summary<br />
2.0 Country Overviews<br />
3.0 Sector Overview<br />
4.0 Provincial <strong>Export</strong> Outlook<br />
5.0 Annexes<br />
5.1 Experience and Attitude<br />
France<br />
Risk Level<br />
Short-term commercial:<br />
Low<br />
Medium-long-term commercial: Low<br />
Sovereign:<br />
Low<br />
<strong>EDC</strong> payment experience 2011: Positive: (+)<br />
5.2 Payment Risk Maps<br />
<strong>EDC</strong> Payment Experience:<br />
Measured by the number and<br />
size of <strong>EDC</strong> claims experienced<br />
in a particular country over a<br />
period of a year, relative to<br />
<strong>EDC</strong>’s business volume growth.<br />
positive<br />
Positive: The number of claims<br />
or the amounts claimed have<br />
decreased in proportion to <strong>EDC</strong><br />
business volume growth.<br />
neutral<br />
Neutral: The number of<br />
claims or the amounts claimed<br />
have remained unchanged in<br />
proportion to <strong>EDC</strong> business<br />
volume growth.<br />
negative<br />
Negative: The number of<br />
claims or the amounts claimed<br />
have increased in proportion to<br />
<strong>EDC</strong> business volume growth.<br />
Gabon<br />
Risk Level<br />
Short-term commercial:<br />
Medium<br />
Medium-long-term commercial: Medium<br />
Sovereign:<br />
Medium-High<br />
<strong>EDC</strong> payment experience 2011: Negative: (–)<br />
Georgia<br />
Risk Level<br />
Short-term commercial:<br />
Medium-High<br />
Medium-long-term commercial: Medium-High<br />
Sovereign:<br />
Medium-High<br />
<strong>EDC</strong> payment experience 2011: Positive: (+)<br />
Germany<br />
Risk Level<br />
Short-term commercial:<br />
Low<br />
Medium-long-term commercial: Low<br />
Sovereign:<br />
Low<br />
<strong>EDC</strong> payment experience 2011: Positive: (+)<br />
Ghana<br />
Risk Level<br />
Short-term commercial:<br />
Medium-High<br />
Medium-long-term commercial: Medium-High<br />
Sovereign:<br />
Medium-High<br />
<strong>EDC</strong> payment experience 2011: Positive: (+)<br />
BACK TO TABLE OF CONTENTS 60
E X P O R T F O R E C A S T O V E R V I E W 2 0 1 2<br />
1.0 GEF Executive Summary<br />
2.0 Country Overviews<br />
3.0 Sector Overview<br />
4.0 Provincial <strong>Export</strong> Outlook<br />
5.0 Annexes<br />
5.1 Experience and Attitude<br />
Greece<br />
Risk Level<br />
Short-term commercial:<br />
Medium-High<br />
Medium-long-term commercial: High<br />
Sovereign:<br />
High<br />
<strong>EDC</strong> payment experience 2011 Negative: (–)<br />
5.2 Payment Risk Maps<br />
<strong>EDC</strong> Payment Experience:<br />
Measured by the number and<br />
size of <strong>EDC</strong> claims experienced<br />
in a particular country over a<br />
period of a year, relative to<br />
<strong>EDC</strong>’s business volume growth.<br />
positive<br />
Guinea<br />
Risk Level<br />
Short-term commercial:<br />
Medium-long-term commercial:<br />
Sovereign:<br />
<strong>EDC</strong> payment experience 2011:<br />
High<br />
High<br />
High<br />
Insuffi cient Data<br />
Positive: The number of claims<br />
or the amounts claimed have<br />
decreased in proportion to <strong>EDC</strong><br />
business volume growth.<br />
neutral<br />
Neutral: The number of<br />
claims or the amounts claimed<br />
have remained unchanged in<br />
proportion to <strong>EDC</strong> business<br />
volume growth.<br />
negative<br />
Negative: The number of<br />
claims or the amounts claimed<br />
have increased in proportion to<br />
<strong>EDC</strong> business volume growth.<br />
Haiti<br />
Risk Level<br />
Short-term commercial:<br />
High<br />
Medium-long-term commercial: High<br />
Sovereign:<br />
High<br />
<strong>EDC</strong> payment experience 2011: Insuffi cient Data<br />
Hong Kong<br />
Risk Level<br />
Short-term commercial:<br />
Low<br />
Medium-long-term commercial: Low<br />
Sovereign:<br />
Low<br />
<strong>EDC</strong> payment experience 2011: Positive: (+)<br />
Hungary<br />
Risk Level<br />
Short-term commercial:<br />
Medium<br />
Medium-long-term commercial: Medium<br />
Sovereign:<br />
Medium<br />
<strong>EDC</strong> payment experience 2011: Positive: (+)<br />
BACK TO TABLE OF CONTENTS 61
E X P O R T F O R E C A S T O V E R V I E W 2 0 1 2<br />
1.0 GEF Executive Summary<br />
2.0 Country Overviews<br />
3.0 Sector Overview<br />
4.0 Provincial <strong>Export</strong> Outlook<br />
5.0 Annexes<br />
5.1 Experience and Attitude<br />
India<br />
Risk Level<br />
Short-term commercial:<br />
Medium<br />
Medium-long-term commercial: Medium<br />
Sovereign:<br />
Medium<br />
<strong>EDC</strong> payment experience 2011: Positive: (+)<br />
5.2 Payment Risk Maps<br />
<strong>EDC</strong> Payment Experience:<br />
Measured by the number and<br />
size of <strong>EDC</strong> claims experienced<br />
in a particular country over a<br />
period of a year, relative to<br />
<strong>EDC</strong>’s business volume growth.<br />
positive<br />
Indonesia<br />
Risk Level<br />
Short-term commercial:<br />
Medium<br />
Medium-long-term commercial: Medium<br />
Sovereign:<br />
Medium<br />
<strong>EDC</strong> payment experience 2011: Positive: (+)<br />
Positive: The number of claims<br />
or the amounts claimed have<br />
decreased in proportion to <strong>EDC</strong><br />
business volume growth.<br />
neutral<br />
Neutral: The number of<br />
claims or the amounts claimed<br />
have remained unchanged in<br />
proportion to <strong>EDC</strong> business<br />
volume growth.<br />
negative<br />
Negative: The number of<br />
claims or the amounts claimed<br />
have increased in proportion to<br />
<strong>EDC</strong> business volume growth.<br />
Iraq<br />
Risk Level<br />
Short-term commercial:<br />
Medium-long-term commercial:<br />
Sovereign:<br />
<strong>EDC</strong> payment experience 2011:<br />
Israel<br />
Risk Level<br />
Short-term commercial:<br />
Medium-long-term commercial:<br />
Sovereign:<br />
<strong>EDC</strong> payment experience 2011:<br />
High<br />
High<br />
High<br />
Insuffi cient Data<br />
Medium<br />
Low<br />
Low<br />
Neutral: (O)<br />
Italy<br />
Risk Level<br />
Short-term commercial:<br />
Low<br />
Medium-long-term commercial: Low<br />
Sovereign:<br />
Low<br />
<strong>EDC</strong> payment experience 2011: Positive: (+)<br />
BACK TO TABLE OF CONTENTS 62
E X P O R T F O R E C A S T O V E R V I E W 2 0 1 2<br />
1.0 GEF Executive Summary<br />
2.0 Country Overviews<br />
3.0 Sector Overview<br />
4.0 Provincial <strong>Export</strong> Outlook<br />
5.0 Annexes<br />
5.1 Experience and Attitude<br />
5.2 Payment Risk Maps<br />
Jamaica<br />
Risk Level<br />
Short-term commercial:<br />
Medium-long-term commercial:<br />
Sovereign:<br />
<strong>EDC</strong> payment experience 2011:<br />
Medium<br />
Medium-High<br />
Medium-High<br />
Neutral: (O)<br />
<strong>EDC</strong> Payment Experience:<br />
Measured by the number and<br />
size of <strong>EDC</strong> claims experienced<br />
in a particular country over a<br />
period of a year, relative to<br />
<strong>EDC</strong>’s business volume growth.<br />
positive<br />
Positive: The number of claims<br />
or the amounts claimed have<br />
decreased in proportion to <strong>EDC</strong><br />
business volume growth.<br />
neutral<br />
Neutral: The number of<br />
claims or the amounts claimed<br />
have remained unchanged in<br />
proportion to <strong>EDC</strong> business<br />
volume growth.<br />
negative<br />
Negative: The number of<br />
claims or the amounts claimed<br />
have increased in proportion to<br />
<strong>EDC</strong> business volume growth.<br />
Japan<br />
Risk Level<br />
Short-term commercial:<br />
Low<br />
Medium-long-term commercial: Low<br />
Sovereign:<br />
Low<br />
<strong>EDC</strong> payment experience 2011: Positive: (+)<br />
Jordan<br />
Risk Level<br />
Short-term commercial:<br />
Medium<br />
Medium-long-term commercial: Medium<br />
Sovereign:<br />
Medium<br />
<strong>EDC</strong> payment experience 2011: Neutral: (O)<br />
Kazakhstan<br />
Risk Level<br />
Short-term commercial:<br />
Medium<br />
Medium-long-term commercial: Medium<br />
Sovereign:<br />
Medium<br />
<strong>EDC</strong> payment experience 2011: Positive: (+)<br />
Kenya<br />
Risk Level<br />
Short-term commercial:<br />
Medium<br />
Medium-long-term commercial: Medium-High<br />
Sovereign:<br />
Medium-High<br />
<strong>EDC</strong> payment experience 2011: Negative: (–)<br />
BACK TO TABLE OF CONTENTS 63
E X P O R T F O R E C A S T O V E R V I E W 2 0 1 2<br />
1.0 GEF Executive Summary<br />
2.0 Country Overviews<br />
3.0 Sector Overview<br />
4.0 Provincial <strong>Export</strong> Outlook<br />
5.0 Annexes<br />
5.1 Experience and Attitude<br />
Kuwait<br />
Risk Level<br />
Short-term commercial:<br />
Low<br />
Medium-long-term commercial: Low<br />
Sovereign:<br />
Low<br />
<strong>EDC</strong> payment experience 2011: Negative: (–)<br />
5.2 Payment Risk Maps<br />
<strong>EDC</strong> Payment Experience:<br />
Measured by the number and<br />
size of <strong>EDC</strong> claims experienced<br />
in a particular country over a<br />
period of a year, relative to<br />
<strong>EDC</strong>’s business volume growth.<br />
positive<br />
Positive: The number of claims<br />
or the amounts claimed have<br />
decreased in proportion to <strong>EDC</strong><br />
business volume growth.<br />
neutral<br />
Neutral: The number of<br />
claims or the amounts claimed<br />
have remained unchanged in<br />
proportion to <strong>EDC</strong> business<br />
volume growth.<br />
negative<br />
Negative: The number of<br />
claims or the amounts claimed<br />
have increased in proportion to<br />
<strong>EDC</strong> business volume growth.<br />
Kyrgyzstan<br />
Risk Level<br />
Short-term commercial:<br />
Medium-long-term commercial:<br />
Sovereign:<br />
<strong>EDC</strong> payment experience 2011:<br />
Lebanon<br />
Risk Level<br />
Short-term commercial:<br />
Medium-long-term commercial:<br />
Sovereign:<br />
<strong>EDC</strong> payment experience 2011:<br />
Libya<br />
Risk Level<br />
Short-term commercial:<br />
Medium-long-term commercial:<br />
Sovereign:<br />
<strong>EDC</strong> payment experience 2011:<br />
High<br />
High<br />
High<br />
Insuffi cient Data<br />
Medium<br />
Medium-High<br />
Medium-High<br />
Neutral: (O)<br />
Medium-High<br />
Medium-High<br />
Medium-High<br />
Insuffi cient Data<br />
Lithuania<br />
Risk Level<br />
Short-term commercial:<br />
Medium<br />
Medium-long-term commercial: Low<br />
Sovereign:<br />
Medium<br />
<strong>EDC</strong> payment experience 2011: Negative: (–)<br />
BACK TO TABLE OF CONTENTS 64
E X P O R T F O R E C A S T O V E R V I E W 2 0 1 2<br />
1.0 GEF Executive Summary<br />
2.0 Country Overviews<br />
3.0 Sector Overview<br />
4.0 Provincial <strong>Export</strong> Outlook<br />
5.0 Annexes<br />
5.1 Experience and Attitude<br />
Malaysia<br />
Risk Level<br />
Short-term commercial:<br />
Low<br />
Medium-long-term commercial: Low<br />
Sovereign:<br />
Low<br />
<strong>EDC</strong> payment experience 2011: Positive: (+)<br />
5.2 Payment Risk Maps<br />
<strong>EDC</strong> Payment Experience:<br />
Measured by the number and<br />
size of <strong>EDC</strong> claims experienced<br />
in a particular country over a<br />
period of a year, relative to<br />
<strong>EDC</strong>’s business volume growth.<br />
positive<br />
Positive: The number of claims<br />
or the amounts claimed have<br />
decreased in proportion to <strong>EDC</strong><br />
business volume growth.<br />
neutral<br />
Neutral: The number of<br />
claims or the amounts claimed<br />
have remained unchanged in<br />
proportion to <strong>EDC</strong> business<br />
volume growth.<br />
negative<br />
Negative: The number of<br />
claims or the amounts claimed<br />
have increased in proportion to<br />
<strong>EDC</strong> business volume growth.<br />
Mali<br />
Risk Level<br />
Short-term commercial:<br />
Medium-High<br />
Medium-long-term commercial: High<br />
Sovereign:<br />
High<br />
<strong>EDC</strong> payment experience 2011: Positive: (+)<br />
Mauritania<br />
Risk Level<br />
Short-term commercial:<br />
Medium-High<br />
Medium-long-term commercial: High<br />
Sovereign:<br />
High<br />
<strong>EDC</strong> payment experience 2011: Positive: (+)<br />
Mauritius<br />
Risk Level<br />
Short-term commercial:<br />
Low<br />
Medium-long-term commercial: Medium<br />
Sovereign:<br />
Medium<br />
<strong>EDC</strong> payment experience 2011: Positive: (+)<br />
Mexico<br />
Risk Level<br />
Short-term commercial:<br />
Medium-long-term commercial:<br />
Sovereign:<br />
<strong>EDC</strong> payment experience 2011:<br />
Medium<br />
Low<br />
Medium<br />
Neutral: (O)<br />
BACK TO TABLE OF CONTENTS 65
E X P O R T F O R E C A S T O V E R V I E W 2 0 1 2<br />
1.0 GEF Executive Summary<br />
2.0 Country Overviews<br />
3.0 Sector Overview<br />
4.0 Provincial <strong>Export</strong> Outlook<br />
5.0 Annexes<br />
5.1 Experience and Attitude<br />
Mongolia<br />
Risk Level<br />
Short-term commercial:<br />
Medium<br />
Medium-long-term commercial: Medium-High<br />
Sovereign:<br />
Medium-High<br />
<strong>EDC</strong> payment experience 2011: Positive: (+)<br />
5.2 Payment Risk Maps<br />
<strong>EDC</strong> Payment Experience:<br />
Measured by the number and<br />
size of <strong>EDC</strong> claims experienced<br />
in a particular country over a<br />
period of a year, relative to<br />
<strong>EDC</strong>’s business volume growth.<br />
positive<br />
Positive: The number of claims<br />
or the amounts claimed have<br />
decreased in proportion to <strong>EDC</strong><br />
business volume growth.<br />
neutral<br />
Neutral: The number of<br />
claims or the amounts claimed<br />
have remained unchanged in<br />
proportion to <strong>EDC</strong> business<br />
volume growth.<br />
negative<br />
Negative: The number of<br />
claims or the amounts claimed<br />
have increased in proportion to<br />
<strong>EDC</strong> business volume growth.<br />
Morocco<br />
Risk Level<br />
Short-term commercial:<br />
Medium<br />
Medium-long-term commercial: Medium<br />
Sovereign:<br />
Medium<br />
<strong>EDC</strong> payment experience 2011: Positive: (+)<br />
Mozambique<br />
Risk Level<br />
Short-term commercial:<br />
Medium-High<br />
Medium-long-term commercial: Medium-High<br />
Sovereign:<br />
Medium-High<br />
<strong>EDC</strong> payment experience 2011: Insuffi cient Data<br />
Namibia<br />
Risk Level<br />
Short-term commercial:<br />
Low<br />
Medium-long-term commercial: Low<br />
Sovereign:<br />
Medium<br />
<strong>EDC</strong> payment experience 2011: Positive: (+)<br />
Netherlands<br />
Risk Level<br />
Short-term commercial:<br />
Low<br />
Medium-long-term commercial: Low<br />
Sovereign:<br />
Low<br />
<strong>EDC</strong> payment experience 2011: Positive: (+)<br />
BACK TO TABLE OF CONTENTS 66
E X P O R T F O R E C A S T O V E R V I E W 2 0 1 2<br />
1.0 GEF Executive Summary<br />
2.0 Country Overviews<br />
3.0 Sector Overview<br />
4.0 Provincial <strong>Export</strong> Outlook<br />
5.0 Annexes<br />
5.1 Experience and Attitude<br />
Nigeria<br />
Risk Level<br />
Short-term commercial:<br />
Medium-High<br />
Medium-long-term commercial: Medium<br />
Sovereign:<br />
Medium<br />
<strong>EDC</strong> payment experience 2011: Positive: (+)<br />
5.2 Payment Risk Maps<br />
<strong>EDC</strong> Payment Experience:<br />
Measured by the number and<br />
size of <strong>EDC</strong> claims experienced<br />
in a particular country over a<br />
period of a year, relative to<br />
<strong>EDC</strong>’s business volume growth.<br />
positive<br />
Positive: The number of claims<br />
or the amounts claimed have<br />
decreased in proportion to <strong>EDC</strong><br />
business volume growth.<br />
positive<br />
neutral<br />
Neutral: The number of<br />
claims or the amounts claimed<br />
have remained unchanged in<br />
proportion to <strong>EDC</strong> business<br />
volume growth.<br />
negative<br />
Negative: The number of<br />
claims or the amounts claimed<br />
have increased in proportion to<br />
<strong>EDC</strong> business volume growth.<br />
Oman<br />
Risk Level<br />
Short-term commercial:<br />
Low<br />
Medium-long-term commercial: Low<br />
Sovereign:<br />
Low<br />
<strong>EDC</strong> payment experience 2011: Positive: (+)<br />
Pakistan<br />
Risk Level<br />
Short-term commercial:<br />
Medium-High<br />
Medium-long-term commercial: High<br />
Sovereign:<br />
High<br />
<strong>EDC</strong> payment experience 2011: Positive: (+)<br />
Panama<br />
Risk Level<br />
Short-term commercial:<br />
Medium<br />
Medium-long-term commercial: Low<br />
Sovereign:<br />
Medium<br />
<strong>EDC</strong> payment experience 2011: Positive: (+)<br />
Peru<br />
Risk Level<br />
Short-term commercial:<br />
Medium<br />
Medium-long-term commercial: Medium<br />
Sovereign:<br />
Medium<br />
<strong>EDC</strong> payment experience 2011: Positive: (+)<br />
BACK TO TABLE OF CONTENTS 67
E X P O R T F O R E C A S T O V E R V I E W 2 0 1 2<br />
1.0 GEF Executive Summary<br />
2.0 Country Overviews<br />
3.0 Sector Overview<br />
4.0 Provincial <strong>Export</strong> Outlook<br />
5.0 Annexes<br />
5.1 Experience and Attitude<br />
Philippines<br />
Risk Level<br />
Short-term commercial:<br />
Medium<br />
Medium-long-term commercial: Medium<br />
Sovereign:<br />
Medium<br />
<strong>EDC</strong> payment experience 2011: Positive: (+)<br />
5.2 Payment Risk Maps<br />
<strong>EDC</strong> Payment Experience:<br />
Measured by the number and<br />
size of <strong>EDC</strong> claims experienced<br />
in a particular country over a<br />
period of a year, relative to<br />
<strong>EDC</strong>’s business volume growth.<br />
positive<br />
Positive: The number of claims<br />
or the amounts claimed have<br />
decreased in proportion to <strong>EDC</strong><br />
business volume growth.<br />
neutral<br />
Neutral: The number of<br />
claims or the amounts claimed<br />
have remained unchanged in<br />
proportion to <strong>EDC</strong> business<br />
volume growth.<br />
negative<br />
Negative: The number of<br />
claims or the amounts claimed<br />
have increased in proportion to<br />
<strong>EDC</strong> business volume growth.<br />
Poland<br />
Risk Level<br />
Short-term commercial:<br />
Low<br />
Medium-long-term commercial: Low<br />
Sovereign:<br />
Low<br />
<strong>EDC</strong> payment experience 2011: Positive: (+)<br />
Portugal<br />
Risk Level<br />
Short-term commercial:<br />
Low<br />
Medium-long-term commercial: Low<br />
Sovereign:<br />
Medium<br />
<strong>EDC</strong> payment experience 2011: Negative: (–)<br />
Qatar<br />
Risk Level<br />
Short-term commercial:<br />
Low<br />
Medium-long-term commercial: Low<br />
Sovereign:<br />
Low<br />
<strong>EDC</strong> payment experience 2011: Neutral: (O)<br />
Romania<br />
Risk Level<br />
Short-term commercial:<br />
Medium<br />
Medium-long-term commercial: Medium<br />
Sovereign:<br />
Medium<br />
<strong>EDC</strong> payment experience 2011: Positive: (+)<br />
BACK TO TABLE OF CONTENTS 68
E X P O R T F O R E C A S T O V E R V I E W 2 0 1 2<br />
1.0 GEF Executive Summary<br />
2.0 Country Overviews<br />
3.0 Sector Overview<br />
4.0 Provincial <strong>Export</strong> Outlook<br />
5.0 Annexes<br />
5.1 Experience and Attitude<br />
Russian Federation<br />
Risk Level<br />
Short-term commercial:<br />
Medium<br />
Medium-long-term commercial: Medium<br />
Sovereign:<br />
Medium<br />
<strong>EDC</strong> payment experience 2011: Negative: (–)<br />
5.2 Payment Risk Maps<br />
<strong>EDC</strong> Payment Experience:<br />
Measured by the number and<br />
size of <strong>EDC</strong> claims experienced<br />
in a particular country over a<br />
period of a year, relative to<br />
<strong>EDC</strong>’s business volume growth.<br />
positive<br />
Saudi Arabia<br />
Risk Level<br />
Short-term commercial:<br />
Medium-long-term commercial:<br />
Sovereign:<br />
<strong>EDC</strong> payment experience 2011:<br />
Low<br />
Low<br />
Low<br />
Neutral: (O)<br />
Positive: The number of claims<br />
or the amounts claimed have<br />
decreased in proportion to <strong>EDC</strong><br />
business volume growth.<br />
neutral<br />
Neutral: The number of<br />
claims or the amounts claimed<br />
have remained unchanged in<br />
proportion to <strong>EDC</strong> business<br />
volume growth.<br />
negative<br />
Negative: The number of<br />
claims or the amounts claimed<br />
have increased in proportion to<br />
<strong>EDC</strong> business volume growth.<br />
Senegal<br />
Risk Level<br />
Short-term commercial:<br />
Medium<br />
Medium-long-term commercial: High<br />
Sovereign:<br />
High<br />
<strong>EDC</strong> payment experience 2011: Negative: (–)<br />
Singapore<br />
Risk Level<br />
Short-term commercial:<br />
Low<br />
Medium-long-term commercial: Low<br />
Sovereign:<br />
Low<br />
<strong>EDC</strong> payment experience 2011: Positive: (+)<br />
Slovakia<br />
Risk Level<br />
Short-term commercial:<br />
Low<br />
Medium-long-term commercial: Low<br />
Sovereign:<br />
Low<br />
<strong>EDC</strong> payment experience 2011: Negative: (–)<br />
BACK TO TABLE OF CONTENTS 69
E X P O R T F O R E C A S T O V E R V I E W 2 0 1 2<br />
1.0 GEF Executive Summary<br />
2.0 Country Overviews<br />
3.0 Sector Overview<br />
4.0 Provincial <strong>Export</strong> Outlook<br />
5.0 Annexes<br />
5.1 Experience and Attitude<br />
South Africa<br />
Risk Level<br />
Short-term commercial:<br />
Low<br />
Medium-long-term commercial: Low<br />
Sovereign:<br />
Medium<br />
<strong>EDC</strong> payment experience 2011: Positive: (+)<br />
5.2 Payment Risk Maps<br />
<strong>EDC</strong> Payment Experience:<br />
Measured by the number and<br />
size of <strong>EDC</strong> claims experienced<br />
in a particular country over a<br />
period of a year, relative to<br />
<strong>EDC</strong>’s business volume growth.<br />
positive<br />
Positive: The number of claims<br />
or the amounts claimed have<br />
decreased in proportion to <strong>EDC</strong><br />
business volume growth.<br />
neutral<br />
Neutral: The number of<br />
claims or the amounts claimed<br />
have remained unchanged in<br />
proportion to <strong>EDC</strong> business<br />
volume growth.<br />
negative<br />
Negative: The number of<br />
claims or the amounts claimed<br />
have increased in proportion to<br />
<strong>EDC</strong> business volume growth.<br />
Republic of Korea<br />
Risk Level<br />
Short-term commercial:<br />
Low<br />
Medium-long-term commercial: Low<br />
Sovereign:<br />
Low<br />
<strong>EDC</strong> payment experience 2011: Positive: (+)<br />
Spain<br />
Risk Level<br />
Short-term commercial:<br />
Low<br />
Medium-long-term commercial: Low<br />
Sovereign:<br />
Low<br />
<strong>EDC</strong> payment experience 2011: Positive: (+)<br />
Sri Lanka<br />
Risk Level<br />
Short-term commercial:<br />
Medium<br />
Medium-long-term commercial: Medium-High<br />
Sovereign:<br />
Medium-High<br />
<strong>EDC</strong> payment experience 2011: Negative: (–)<br />
Syrian Arab Republic<br />
Risk Level<br />
Short-term commercial:<br />
High<br />
Medium-long-term commercial: High<br />
Sovereign:<br />
High<br />
<strong>EDC</strong> payment experience 2011: Positive: (+)<br />
BACK TO TABLE OF CONTENTS 70
E X P O R T F O R E C A S T O V E R V I E W 2 0 1 2<br />
1.0 GEF Executive Summary<br />
2.0 Country Overviews<br />
3.0 Sector Overview<br />
4.0 Provincial <strong>Export</strong> Outlook<br />
5.0 Annexes<br />
5.1 Experience and Attitude<br />
Taiwan, Province of China<br />
Risk Level<br />
Short-term commercial:<br />
Low<br />
Medium-long-term commercial: Low<br />
Sovereign:<br />
Low<br />
<strong>EDC</strong> payment experience 2011: Positive: (+)<br />
5.2 Payment Risk Maps<br />
<strong>EDC</strong> Payment Experience:<br />
Measured by the number and<br />
size of <strong>EDC</strong> claims experienced<br />
in a particular country over a<br />
period of a year, relative to<br />
<strong>EDC</strong>’s business volume growth.<br />
positive<br />
Tajikistan<br />
Risk Level<br />
Short-term commercial:<br />
Medium-long-term commercial:<br />
Sovereign:<br />
<strong>EDC</strong> payment experience 2011:<br />
Medium-High<br />
High<br />
High<br />
No Information<br />
Positive: The number of claims<br />
or the amounts claimed have<br />
decreased in proportion to <strong>EDC</strong><br />
business volume growth.<br />
neutral<br />
Neutral: The number of<br />
claims or the amounts claimed<br />
have remained unchanged in<br />
proportion to <strong>EDC</strong> business<br />
volume growth.<br />
negative<br />
Negative: The number of<br />
claims or the amounts claimed<br />
have increased in proportion to<br />
<strong>EDC</strong> business volume growth.<br />
Tanzania, United Republic of<br />
Risk Level<br />
Short-term commercial:<br />
Medium<br />
Medium-long-term commercial: Medium-High<br />
Sovereign:<br />
Medium-High<br />
<strong>EDC</strong> payment experience 2011: Negative: (–)<br />
Thailand<br />
Risk Level<br />
Short-term commercial:<br />
Medium<br />
Medium-long-term commercial: Low<br />
Sovereign:<br />
Medium<br />
<strong>EDC</strong> payment experience 2011: Positive: (+)<br />
Trinidad & Tobago<br />
Risk Level<br />
Short-term commercial:<br />
Medium<br />
Medium-long-term commercial: Low<br />
Sovereign:<br />
Medium<br />
<strong>EDC</strong> payment experience 2011: Negative: (–)<br />
BACK TO TABLE OF CONTENTS 71
E X P O R T F O R E C A S T O V E R V I E W 2 0 1 2<br />
1.0 GEF Executive Summary<br />
2.0 Country Overviews<br />
3.0 Sector Overview<br />
4.0 Provincial <strong>Export</strong> Outlook<br />
5.0 Annexes<br />
5.1 Experience and Attitude<br />
Tunisia<br />
Risk Level<br />
Short-term commercial:<br />
Medium<br />
Medium-long-term commercial: Medium<br />
Sovereign:<br />
Medium<br />
<strong>EDC</strong> payment experience 2011: Negative: (–)<br />
5.2 Payment Risk Maps<br />
<strong>EDC</strong> Payment Experience:<br />
Measured by the number and<br />
size of <strong>EDC</strong> claims experienced<br />
in a particular country over a<br />
period of a year, relative to<br />
<strong>EDC</strong>’s business volume growth.<br />
positive<br />
Turkey<br />
Risk Level<br />
Short-term commercial:<br />
Medium<br />
Medium-long-term commercial: Medium<br />
Sovereign:<br />
Medium<br />
<strong>EDC</strong> payment experience 2011: Positive: (+)<br />
Positive: The number of claims<br />
or the amounts claimed have<br />
decreased in proportion to <strong>EDC</strong><br />
business volume growth.<br />
neutral<br />
Neutral: The number of<br />
claims or the amounts claimed<br />
have remained unchanged in<br />
proportion to <strong>EDC</strong> business<br />
volume growth.<br />
negative<br />
Negative: The number of<br />
claims or the amounts claimed<br />
have increased in proportion to<br />
<strong>EDC</strong> business volume growth.<br />
Turkmenistan<br />
Risk Level<br />
Short-term commercial:<br />
Medium-long-term commercial:<br />
Sovereign:<br />
<strong>EDC</strong> payment experience 2011:<br />
Uganda<br />
Risk Level<br />
Short-term commercial:<br />
Medium-long-term commercial:<br />
Sovereign:<br />
<strong>EDC</strong> payment experience 2011:<br />
High<br />
Medium-High<br />
Medium-High<br />
No Information<br />
Medium<br />
Medium<br />
Medium-High<br />
Insuffi cient Data<br />
Ukraine<br />
Risk Level<br />
Short-term commercial:<br />
Medium-long-term commercial:<br />
Sovereign:<br />
<strong>EDC</strong> payment experience 2011:<br />
Medium-High<br />
Medium-High<br />
Medium-High<br />
Insuffi cient Data<br />
BACK TO TABLE OF CONTENTS 72
E X P O R T F O R E C A S T O V E R V I E W 2 0 1 2<br />
1.0 GEF Executive Summary<br />
2.0 Country Overviews<br />
3.0 Sector Overview<br />
4.0 Provincial <strong>Export</strong> Outlook<br />
5.0 Annexes<br />
5.1 Experience and Attitude<br />
United Arab Emirates<br />
Risk Level<br />
Short-term commercial:<br />
Low<br />
Medium-long-term commercial: Low<br />
Sovereign:<br />
Low<br />
<strong>EDC</strong> payment experience 2011: Positive: (+)<br />
5.2 Payment Risk Maps<br />
<strong>EDC</strong> Payment Experience:<br />
Measured by the number and<br />
size of <strong>EDC</strong> claims experienced<br />
in a particular country over a<br />
period of a year, relative to<br />
<strong>EDC</strong>’s business volume growth.<br />
positive<br />
Positive: The number of claims<br />
or the amounts claimed have<br />
decreased in proportion to <strong>EDC</strong><br />
business volume growth.<br />
neutral<br />
Neutral: The number of<br />
claims or the amounts claimed<br />
have remained unchanged in<br />
proportion to <strong>EDC</strong> business<br />
volume growth.<br />
negative<br />
Negative: The number of<br />
claims or the amounts claimed<br />
have increased in proportion to<br />
<strong>EDC</strong> business volume growth.<br />
United Kingdom<br />
Risk Level<br />
Short-term commercial:<br />
Low<br />
Medium-long-term commercial: Low<br />
Sovereign:<br />
Low<br />
<strong>EDC</strong> payment experience 2011: Positive: (+)<br />
United States<br />
Risk Level<br />
Short-term commercial:<br />
Medium<br />
Medium-long-term commercial: Low<br />
Sovereign:<br />
Low<br />
<strong>EDC</strong> payment experience 2011: Positive: (+)<br />
Uruguay<br />
Risk Level<br />
Short-term commercial:<br />
Medium<br />
Medium-long-term commercial: Medium<br />
Sovereign:<br />
Medium<br />
<strong>EDC</strong> payment experience 2011: Positive: (+)<br />
Uzbekistan<br />
Risk Level<br />
Short-term commercial:<br />
Medium-long-term commercial:<br />
Sovereign:<br />
<strong>EDC</strong> payment experience 2011:<br />
Medium-High<br />
High<br />
High<br />
Insuffi cient Data<br />
BACK TO TABLE OF CONTENTS 73
E X P O R T F O R E C A S T O V E R V I E W 2 0 1 2<br />
1.0 GEF Executive Summary<br />
2.0 Country Overviews<br />
3.0 Sector Overview<br />
4.0 Provincial <strong>Export</strong> Outlook<br />
5.0 Annexes<br />
5.1 Experience and Attitude<br />
Venezuela, Bolivarian Republic of<br />
Risk Level<br />
Short-term commercial:l:<br />
Medium-High<br />
Medium-long-term commercial: Medium-High<br />
Sovereign:<br />
Medium-High<br />
<strong>EDC</strong> payment experience 2011: Positive: (+)<br />
5.2 Payment Risk Maps<br />
<strong>EDC</strong> Payment Experience:<br />
Measured by the number and<br />
size of <strong>EDC</strong> claims experienced<br />
in a particular country over a<br />
period of a year, relative to<br />
<strong>EDC</strong>’s business volume growth.<br />
positive<br />
Positive: The number of claims<br />
or the amounts claimed have<br />
decreased in proportion to <strong>EDC</strong><br />
business volume growth.<br />
neutral<br />
Neutral: The number of<br />
claims or the amounts claimed<br />
have remained unchanged in<br />
proportion to <strong>EDC</strong> business<br />
volume growth.<br />
negative<br />
Negative: The number of<br />
claims or the amounts claimed<br />
have increased in proportion to<br />
<strong>EDC</strong> business volume growth.<br />
Viet Nam<br />
Risk Level<br />
Short-term commercial:<br />
Medium-long-term commercial:<br />
Sovereign:<br />
<strong>EDC</strong> payment experience 2011:<br />
Yemen<br />
Risk Level<br />
Short-term commercial:<br />
Medium-long-term commercial:<br />
Sovereign:<br />
<strong>EDC</strong> payment experience 2011:<br />
Zambia<br />
Risk Level<br />
Short-term commercial:<br />
Medium-long-term commercial:<br />
Sovereign:<br />
<strong>EDC</strong> payment experience 2011:<br />
Medium<br />
Medium-High<br />
Medium-High<br />
No Information<br />
High<br />
High<br />
High<br />
No Information<br />
Medium<br />
Medium<br />
Medium<br />
Insuffi cient Data<br />
BACK TO TABLE OF CONTENTS 74
E X P O R T F O R E C A S T O V E R V I E W 2 0 1 2<br />
1.0 GEF Executive Summary<br />
2.0 Country Overviews<br />
3.0 Sector Overview<br />
4.0 Provincial <strong>Export</strong> Outlook<br />
5.2 Payment Risk Maps<br />
Latin America<br />
Short-term payment risk<br />
5.0 Annexes<br />
5.1 Experience and Attitude<br />
5.2 Payment Risk Maps<br />
Mexico<br />
Guatemala<br />
El Salvador<br />
Nicaragua<br />
Costa Rica<br />
Belize<br />
Honduras<br />
Panama<br />
Colombia<br />
Venezuela*<br />
Guyana<br />
Suriname<br />
French Guiana<br />
Ecuador*<br />
Peru<br />
Brazil<br />
Bolivia<br />
Paraguay<br />
Chile<br />
Uruguay<br />
Argentina<br />
Prohibited<br />
High<br />
Medium-High<br />
Medium<br />
Low<br />
* Special restrictions may apply<br />
No Information<br />
BACK TO TABLE OF CONTENTS 75
E X P O R T F O R E C A S T O V E R V I E W 2 0 1 2<br />
1.0 GEF Executive Summary<br />
2.0 Country Overviews<br />
Caribbean<br />
Short-term payment risk<br />
3.0 Sector Overview<br />
4.0 Provincial <strong>Export</strong> Outlook<br />
5.0 Annexes<br />
5.1 Experience and Attitude<br />
5.2 Payment Risk Maps<br />
The Bahamas<br />
Bermuda<br />
Cuba*<br />
Jamaica<br />
Haiti<br />
Dominican Republic<br />
Sint Maarten<br />
Curaçao<br />
Aruba<br />
Puerto Rico<br />
Saint-Kitts<br />
& Nevis<br />
Saint-Vincent<br />
Antigua<br />
and Barbuda<br />
Guadeloupe<br />
Dominica<br />
Martinique<br />
Saint Lucia<br />
Barbados<br />
Grenada<br />
Trinidad and Tobago<br />
Prohibited<br />
High<br />
Medium-High<br />
Medium<br />
* Special restrictions may apply<br />
Low<br />
No Information<br />
BACK TO TABLE OF CONTENTS 76
E X P O R T F O R E C A S T O V E R V I E W 2 0 1 2<br />
1.0 GEF Executive Summary<br />
2.0 Country Overviews<br />
Asia/Pacific<br />
Short-term payment risk<br />
3.0 Sector Overview<br />
4.0 Provincial <strong>Export</strong> Outlook<br />
5.0 Annexes<br />
North Korea<br />
5.1 Experience and Attitude<br />
5.2 Payment Risk Maps<br />
Mongolia<br />
Japan<br />
Afghanistan<br />
China<br />
Nepal<br />
Bhutan<br />
Burma<br />
Myanmar<br />
Pakistan*<br />
India<br />
Hong Kong<br />
South Korea<br />
Taiwan<br />
Bangladesh<br />
Laos<br />
Viet Nam<br />
Thailand<br />
Cambodia<br />
Philippines<br />
The Maldives<br />
Sri Lanka*<br />
Malaysia<br />
Brunei<br />
PNG<br />
Singapore<br />
Indonesia<br />
Timor-Leste<br />
Prohibited<br />
High<br />
Medium-High<br />
Medium<br />
* Special restrictions may apply<br />
Low<br />
No Information<br />
BACK TO TABLE OF CONTENTS 77
E X P O R T F O R E C A S T O V E R V I E W 2 0 1 2<br />
1.0 GEF Executive Summary<br />
2.0 Country Overviews<br />
Central Europe<br />
Short-term payment risk<br />
3.0 Sector Overview<br />
4.0 Provincial <strong>Export</strong> Outlook<br />
5.0 Annexes<br />
5.1 Experience and Attitude<br />
5.2 Payment Risk Maps<br />
Poland<br />
Czech Republic<br />
Slovakia<br />
Moldova<br />
Slovenia<br />
Hungary<br />
Romania<br />
Croatia<br />
Kosovo<br />
Bosnia and Herzegovina<br />
Bulgaria<br />
Serbia<br />
Montenegro<br />
Albania<br />
Macedonia<br />
Greece<br />
Turkey<br />
Malta<br />
Cyprus<br />
Prohibited<br />
High<br />
Medium-High<br />
Medium<br />
Low<br />
No Information<br />
BACK TO TABLE OF CONTENTS 78
E X P O R T F O R E C A S T O V E R V I E W 2 0 1 2<br />
1.0 GEF Executive Summary<br />
2.0 Country Overviews<br />
Western Europe<br />
Short-term payment risk<br />
3.0 Sector Overview<br />
4.0 Provincial <strong>Export</strong> Outlook<br />
5.0 Annexes<br />
5.1 Experience and Attitude<br />
5.2 Payment Risk Maps<br />
Iceland<br />
United Kingdom<br />
Norway<br />
Sweden<br />
Finland<br />
Ireland<br />
Belgium<br />
Denmark<br />
Germany<br />
Netherlands<br />
Luxembourg<br />
France<br />
Austria<br />
Italy<br />
Switzerland<br />
Portugal<br />
Spain<br />
Prohibited<br />
High<br />
Medium-High<br />
Medium<br />
Low<br />
No Information<br />
BACK TO TABLE OF CONTENTS 79
E X P O R T F O R E C A S T O V E R V I E W 2 0 1 2<br />
1.0 GEF Executive Summary<br />
2.0 Country Overviews<br />
Former Soviet Union<br />
Short-term payment risk<br />
3.0 Sector Overview<br />
4.0 Provincial <strong>Export</strong> Outlook<br />
5.0 Annexes<br />
5.1 Experience and Attitude<br />
5.2 Payment Risk Maps<br />
Lithuania<br />
Latvia<br />
Estonia<br />
Belarus<br />
Moldova<br />
Ukraine<br />
Georgia<br />
Russia<br />
Armenia<br />
Kazakhstan<br />
Azerbaijan<br />
Turkmenistan<br />
Uzbekistan<br />
Tajikistan<br />
Kyrgyzstan<br />
Prohibited<br />
High<br />
Medium-High<br />
Medium<br />
Low<br />
No Information<br />
BACK TO TABLE OF CONTENTS 80
E X P O R T F O R E C A S T O V E R V I E W 2 0 1 2<br />
1.0 GEF Executive Summary<br />
2.0 Country Overviews<br />
Africa<br />
Short-term payment risk<br />
3.0 Sector Overview<br />
4.0 Provincial <strong>Export</strong> Outlook<br />
5.0 Annexes<br />
5.1 Experience and Attitude<br />
5.2 Payment Risk Maps<br />
Morocco<br />
Tunisia<br />
Burkina Faso<br />
Nigeria<br />
Mauritania<br />
Algeria<br />
Libya<br />
Egypt<br />
Senegal<br />
Gambia<br />
Guinea-<br />
Bissau<br />
Guinea<br />
Sierra Leone*<br />
Liberia*<br />
Côte<br />
d’Ivoire*<br />
Togo<br />
Ghana<br />
Cameroon<br />
Equatorial Guinea<br />
Mali<br />
Benin<br />
Gabon<br />
Niger<br />
Chad<br />
Congo<br />
Kinshasa*<br />
Sudan<br />
Sudan South<br />
Ethiopia<br />
Eritrea*<br />
Djibouti<br />
Uganda<br />
Rwanda<br />
Kenya<br />
Burundi<br />
Tanzania<br />
Malawi<br />
Somalia*<br />
Zambia<br />
Congo Brazzaville<br />
Central African Republic<br />
Angola<br />
Namibia<br />
South Africa<br />
Mauritius<br />
Madagascar<br />
Mozambique<br />
Zimbabwe*<br />
Botswana<br />
Swaziland<br />
Lesotho<br />
Prohibited<br />
High<br />
Medium-High<br />
Medium<br />
* Special restrictions may apply<br />
Low<br />
No Information<br />
BACK TO TABLE OF CONTENTS 81
E X P O R T F O R E C A S T O V E R V I E W 2 0 1 2<br />
1.0 GEF Executive Summary<br />
2.0 Country Overviews<br />
Middle East<br />
Short-term payment risk<br />
3.0 Sector Overview<br />
4.0 Provincial <strong>Export</strong> Outlook<br />
5.0 Annexes<br />
5.1 Experience and Attitude<br />
Syria*<br />
Iraq*<br />
5.2 Payment Risk Maps<br />
Lebanon*<br />
Israel<br />
Iran<br />
Jordan<br />
Bahrain<br />
Kuwait<br />
Saudi Arabia<br />
Oman<br />
Qatar<br />
U.A.E.<br />
Yemen<br />
Prohibited<br />
High<br />
Medium-High<br />
Medium<br />
Low<br />
* Special restrictions may apply<br />
No Information<br />
BACK TO TABLE OF CONTENTS 82
E X P O R T F O R E C A S T O V E R V I E W 2 0 1 2<br />
1.0 GEF Executive Summary<br />
2.0 Country Overviews<br />
Latin America<br />
Medium- & long-term payment risks<br />
3.0 Sector Overview<br />
4.0 Provincial <strong>Export</strong> Outlook<br />
5.0 Annexes<br />
5.1 Experience and Attitude<br />
5.2 Payment Risk Maps<br />
Mexico<br />
Guatemala<br />
El Salvador<br />
Nicaragua<br />
Costa Rica<br />
Belize<br />
Honduras<br />
Panama<br />
Colombia<br />
Venezuela*<br />
Guyana<br />
Suriname<br />
French Guiana<br />
Ecuador*<br />
Peru<br />
Brazil<br />
Bolivia<br />
Paraguay<br />
Chile<br />
Uruguay<br />
Argentina<br />
Prohibited<br />
High<br />
Medium-High<br />
Medium<br />
Low<br />
* Special restrictions may apply<br />
No Information<br />
BACK TO TABLE OF CONTENTS 83
E X P O R T F O R E C A S T O V E R V I E W 2 0 1 2<br />
1.0 GEF Executive Summary<br />
2.0 Country Overviews<br />
Caribbean<br />
Medium- & long-term payment risks<br />
3.0 Sector Overview<br />
4.0 Provincial <strong>Export</strong> Outlook<br />
5.0 Annexes<br />
5.1 Experience and Attitude<br />
5.2 Payment Risk Maps<br />
The Bahamas<br />
Bermuda<br />
Cuba*<br />
Jamaica<br />
Haiti<br />
Dominican Republic<br />
Sint Maarten<br />
Curaçao<br />
Aruba<br />
Puerto Rico*<br />
Saint-Kitts<br />
& Nevis<br />
Saint-Vincent<br />
Antigua<br />
and Barbuda<br />
Guadeloupe*<br />
Dominica<br />
Martinique*<br />
Saint Lucia<br />
Barbados<br />
Grenada<br />
Trinidad and Tobago<br />
Prohibited<br />
High<br />
Medium-High<br />
Medium<br />
* Special restrictions may apply<br />
Low<br />
No Information<br />
BACK TO TABLE OF CONTENTS 84
E X P O R T F O R E C A S T O V E R V I E W 2 0 1 2<br />
1.0 GEF Executive Summary<br />
2.0 Country Overviews<br />
Asia/Pacific<br />
Medium- & long-term payment risks<br />
3.0 Sector Overview<br />
4.0 Provincial <strong>Export</strong> Outlook<br />
5.0 Annexes<br />
5.1 Experience and Attitude<br />
5.2 Payment Risk Maps<br />
Mongolia<br />
North Korea*<br />
Japan<br />
Afghanistan<br />
China<br />
Nepal<br />
Bhutan<br />
Burma<br />
(Myanmar)<br />
Pakistan*<br />
India<br />
Hong Kong<br />
South Korea<br />
Taiwan<br />
Bangladesh<br />
Laos<br />
Viet Nam<br />
Thailand<br />
Cambodia<br />
Philippines<br />
The Maldives<br />
Sri Lanka*<br />
Malaysia<br />
Brunei<br />
PNG<br />
Singapore<br />
Indonesia<br />
Timor Leste<br />
Prohibited<br />
High<br />
Medium-High<br />
Medium<br />
* Special restrictions may apply<br />
Low<br />
No Information<br />
BACK TO TABLE OF CONTENTS 85
E X P O R T F O R E C A S T O V E R V I E W 2 0 1 2<br />
1.0 GEF Executive Summary<br />
2.0 Country Overviews<br />
Central Europe<br />
Medium- & long-term payment risks<br />
3.0 Sector Overview<br />
4.0 Provincial <strong>Export</strong> Outlook<br />
5.0 Annexes<br />
5.1 Experience and Attitude<br />
5.2 Payment Risk Maps<br />
Poland<br />
Czech Republic<br />
Slovakia<br />
Moldova<br />
Slovenia<br />
Hungary<br />
Romania<br />
Croatia<br />
Kosovo<br />
Bosnia and Herzegovina<br />
Bulgaria<br />
Serbia<br />
Montenegro<br />
Albania<br />
Macedonia<br />
Greece<br />
Turkey<br />
Malta<br />
Cyprus<br />
Prohibited<br />
High<br />
Medium-High<br />
Medium<br />
Low<br />
No Information<br />
BACK TO TABLE OF CONTENTS 86
E X P O R T F O R E C A S T O V E R V I E W 2 0 1 2<br />
1.0 GEF Executive Summary<br />
2.0 Country Overviews<br />
Western Europe<br />
Medium- & long-term payment risks<br />
3.0 Sector Overview<br />
4.0 Provincial <strong>Export</strong> Outlook<br />
5.0 Annexes<br />
5.1 Experience and Attitude<br />
5.2 Payment Risk Maps<br />
Iceland<br />
United Kingdom<br />
Norway<br />
Sweden<br />
Finland<br />
Ireland<br />
Belgium<br />
Denmark<br />
Germany<br />
Netherlands<br />
Luxembourg<br />
France<br />
Austria<br />
Italy<br />
Switzerland<br />
Portugal<br />
Spain<br />
Prohibited<br />
High<br />
Medium-High<br />
Medium<br />
Low<br />
No Information<br />
BACK TO TABLE OF CONTENTS 87
E X P O R T F O R E C A S T O V E R V I E W 2 0 1 2<br />
1.0 GEF Executive Summary<br />
2.0 Country Overviews<br />
Former Soviet Union<br />
Medium- & long-term payment risks<br />
3.0 Sector Overview<br />
4.0 Provincial <strong>Export</strong> Outlook<br />
5.0 Annexes<br />
5.1 Experience and Attitude<br />
5.2 Payment Risk Maps<br />
Lithuania<br />
Latvia<br />
Estonia<br />
Belarus<br />
Moldova<br />
Ukraine<br />
Georgia<br />
Russia<br />
Armenia<br />
Kazakhstan<br />
Azerbaijan<br />
Turkmenistan<br />
Uzbekistan<br />
Tajikistan<br />
Kyrgyzstan<br />
Prohibited<br />
High<br />
Medium-High<br />
Medium<br />
Low<br />
No Information<br />
BACK TO TABLE OF CONTENTS 88
E X P O R T F O R E C A S T O V E R V I E W 2 0 1 2<br />
1.0 GEF Executive Summary<br />
2.0 Country Overviews<br />
Africa<br />
Medium- & long-term payment risks<br />
3.0 Sector Overview<br />
4.0 Provincial <strong>Export</strong> Outlook<br />
5.0 Annexes<br />
5.1 Experience and Attitude<br />
5.2 Payment Risk Maps<br />
Morocco<br />
Tunisia<br />
Burkina Faso<br />
Nigeria<br />
Mauritania<br />
Senegal<br />
Gambia<br />
Guinea-<br />
Bissau<br />
Guinea<br />
Sierra Leone*<br />
Algeria<br />
Mali<br />
Niger<br />
Libya<br />
Chad<br />
Egypt<br />
Sudan<br />
South Sudan<br />
Ethiopia<br />
Eritrea*<br />
Djibouti*<br />
Somalia*<br />
Uganda<br />
Liberia*<br />
Côte<br />
d’Ivoire*<br />
Togo<br />
Ghana<br />
Cameroon<br />
Equatorial Guinea<br />
Benin<br />
Gabon<br />
Congo<br />
Kinshasa*<br />
Rwanda<br />
Kenya<br />
Burundi<br />
Tanzania<br />
Malawi<br />
Zambia<br />
Congo Brazzaville<br />
Central African Republic<br />
Angola<br />
Namibia<br />
South Africa<br />
Botswana<br />
Mauritius<br />
Madagascar<br />
Mozambique<br />
Zimbabwe*<br />
Swaziland<br />
Lesotho<br />
Prohibited<br />
High<br />
Medium-High<br />
Medium<br />
Low<br />
No Information<br />
* Special restrictions may apply<br />
BACK TO TABLE OF CONTENTS 89
E X P O R T F O R E C A S T O V E R V I E W 2 0 1 2<br />
1.0 GEF Executive Summary<br />
2.0 Country Overviews<br />
Middle East<br />
Medium- & long-term payment risks<br />
3.0 Sector Overview<br />
4.0 Provincial <strong>Export</strong> Outlook<br />
5.0 Annexes<br />
5.1 Experience and Attitude<br />
Syria*<br />
Iraq*<br />
5.2 Payment Risk Maps<br />
Lebanon*<br />
Israel<br />
Iran<br />
Jordan<br />
Bahrain<br />
Kuwait<br />
Saudi Arabia<br />
Oman<br />
Qatar<br />
U.A.E.<br />
Yemen<br />
Prohibited<br />
High<br />
Medium-High<br />
Medium<br />
Low<br />
* Special restrictions may apply<br />
No Information<br />
BACK TO TABLE OF CONTENTS 90
E X P O R T F O R E C A S T O V E R V I E W 2 0 1 2<br />
1.0 GEF Executive Summary<br />
2.0 Country Overviews<br />
3.0 Sector Overview<br />
4.0 Provincial <strong>Export</strong> Outlook<br />
5.0 Annexes<br />
5.1 Experience and Attitude<br />
5.2 Payment Risk Maps<br />
Other reports published by <strong>EDC</strong> Economics<br />
<strong>Export</strong> Performance Monitor<br />
The <strong>Export</strong> Performance Monitor is a monthly publication which tracks recent movements in Canadian<br />
exports by industry and geographic market. The monitor also assesses <strong>EDC</strong>’s main export forecast,<br />
which is produced twice yearly.<br />
Commodity Analyst<br />
The Commodity Analyst is a monthly report on activity in the principal commodity markets. The report<br />
includes commentary on the short-term outlook as well as charts and tables highlighting recent trends.<br />
Commodity Tracker<br />
The Commodity Tracker is a weekly table of commodity prices and economic indicators related to<br />
activity in the commodity markets that are most relevant to Canadian exporters.<br />
Weekly Commentary by Peter G. Hall<br />
Short, intuitive insights into this week’s hot economic issues.<br />
Country Snapshots<br />
<strong>Canada</strong> Country Overview<br />
US Country Overview<br />
Japan Country Overview<br />
Euro Area Overview<br />
Brazil Country Overview<br />
Mexico Country Overview<br />
China Country Overview<br />
India Country Overview<br />
Russian Federation Country Overview<br />
South Africa Country Overview<br />
This assessment is valid at date of issue but always subject to review.<br />
Please contact the <strong>EDC</strong> Economics Division for current position.<br />
This document is a compilation of publicly available information. It is not intended to provide specifi c advice and should not be<br />
relied on as such. It is intended as an overview only. No action or decision should be taken without detailed independent research<br />
and professional advice concerning the specifi c subject matter of such action or decision. While <strong>Export</strong> <strong>Development</strong> <strong>Canada</strong><br />
(<strong>EDC</strong>) has made reasonable commercial efforts to ensure that the information contained in this document is accurate, <strong>EDC</strong> does<br />
not represent or warrant the accurateness, timeliness or completeness of the information contained herein. This document or<br />
any part of it may become obsolete at any time. It is the user’s responsibility to verify any information contained herein before<br />
relying on such information. <strong>EDC</strong> is not liable in any manner whatsoever for any loss or damage caused by or resulting from any<br />
inaccuracies, errors or omissions in the information contained in this document. This document is not intended to and does not<br />
constitute legal or tax advice. For legal or tax advice, please consult a qualifi ed professional.<br />
<strong>EDC</strong> is the owner of trademarks and offi cial marks. Any use of an <strong>EDC</strong> trademark or official mark without written permission is<br />
strictly prohibited. All other trademarks appearing in this document are the property of their respective owners. The information<br />
presented is subject to change without notice. <strong>EDC</strong> assumes no responsibility for inaccuracies contained herein. Copyright ©<br />
2012 <strong>Export</strong> <strong>Development</strong> <strong>Canada</strong>. All rights reserved.<br />
BACK TO TABLE OF CONTENTS 91
For the complete Spring 2012 <strong>Global</strong> <strong>Export</strong> <strong>Forecast</strong> visit<br />
www.edc.ca/gef<br />
<strong>EDC</strong> is the owner of trademarks and official marks. Any use of an <strong>EDC</strong> trademark or official mark without written permission is strictly prohibited.<br />
All other trademarks appearing in this document are the property of their respective owners. The information presented is subject to change without<br />
notice. <strong>EDC</strong> assumes no responsibility for inaccuracies contained herein. Copyright © 2012 <strong>Export</strong> <strong>Development</strong> <strong>Canada</strong>. All rights reserved.