

Motor Vehicle Crashes in New Zealand 2011 - Ministry of Transport
Motor Vehicle Crashes in New Zealand 2011 - Ministry of Transport
Motor Vehicle Crashes in New Zealand 2011 - Ministry of Transport

Create successful ePaper yourself
Turn your PDF publications into a flip-book with our unique Google optimized e-Paper software.
102<br />
<strong>Motor</strong> <strong>Vehicle</strong> <strong>Crashes</strong> <strong>in</strong> <strong>New</strong> <strong>Zealand</strong> <strong>2011</strong><br />
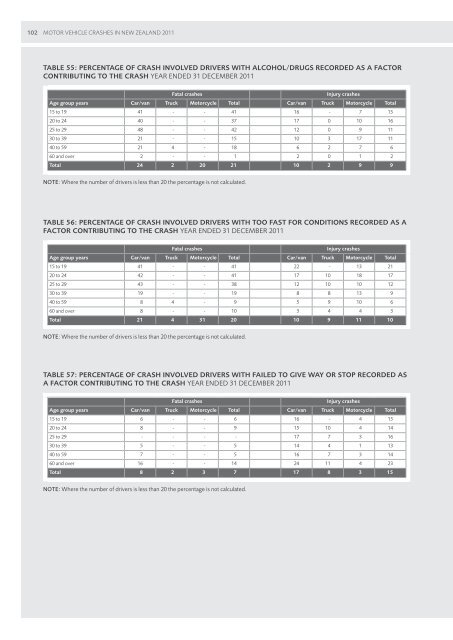
Table 55: PERCENTAGE <strong>of</strong> Crash Involved Drivers with ALCOHOL/DRUGS RECORDED as a FACTOR<br />
Contribut<strong>in</strong>g TO the Crash Year ENDED 31 December <strong>2011</strong><br />
Fatal crashes<br />
Injury crashes<br />
Age group years Car/van Truck <strong>Motor</strong>cycle Total Car/van Truck <strong>Motor</strong>cycle Total<br />
15 to 19 41 - - 41 16 - 7 15<br />
20 to 24 40 - - 37 17 0 10 16<br />
25 to 29 48 - - 42 12 0 9 11<br />
30 to 39 21 - - 15 10 3 17 11<br />
40 to 59 21 4 - 18 6 2 7 6<br />
60 and over 2 - - 1 2 0 1 2<br />
Total 24 2 20 21 10 2 9 9<br />
NOTE: Where the number <strong>of</strong> drivers is less than 20 the percentage is not calculated.<br />
Table 56: PERCENTAGE <strong>of</strong> Crash Involved Drivers with TOO FAST FOR CONDITIONS RECORDED as a<br />
FACTOR Contribut<strong>in</strong>g TO the Crash Year ENDED 31 December <strong>2011</strong><br />
Fatal crashes<br />
Injury crashes<br />
Age group years Car/van Truck <strong>Motor</strong>cycle Total Car/van Truck <strong>Motor</strong>cycle Total<br />
15 to 19 41 - - 41 22 - 13 21<br />
20 to 24 42 - - 41 17 10 18 17<br />
25 to 29 43 - - 38 12 10 10 12<br />
30 to 39 19 - - 19 8 8 13 9<br />
40 to 59 8 4 - 9 5 9 10 6<br />
60 and over 8 - - 10 3 4 4 3<br />
Total 21 4 31 20 10 9 11 10<br />
NOTE: Where the number <strong>of</strong> drivers is less than 20 the percentage is not calculated.<br />
Table 57: PERCENTAGE <strong>of</strong> Crash Involved Drivers with FAILED TO GIVE WAY OR STOP RECORDED as<br />
a FACTOR Contribut<strong>in</strong>g TO the Crash Year ENDED 31 December <strong>2011</strong><br />
Fatal crashes<br />
Injury crashes<br />
Age group years Car/van Truck <strong>Motor</strong>cycle Total Car/van Truck <strong>Motor</strong>cycle Total<br />
15 to 19 6 - - 6 16 - 4 15<br />
20 to 24 8 - - 9 15 10 4 14<br />
25 to 29 - - - - 17 7 3 16<br />
30 to 39 5 - - 5 14 4 1 13<br />
40 to 59 7 - - 5 16 7 3 14<br />
60 and over 16 - - 14 24 11 4 23<br />
Total 8 2 3 7 17 8 3 15<br />
NOTE: Where the number <strong>of</strong> drivers is less than 20 the percentage is not calculated.


