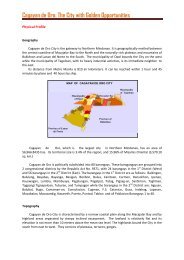
MDG Watch - NSCB
MDG Watch - NSCB
MDG Watch - NSCB

Create successful ePaper yourself
Turn your PDF publications into a flip-book with our unique Google optimized e-Paper software.
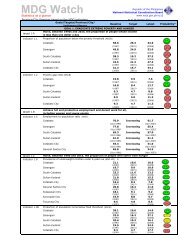
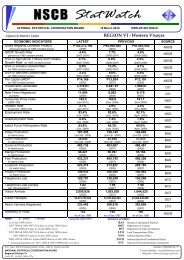
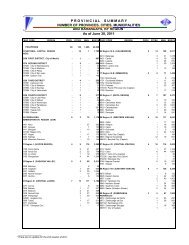
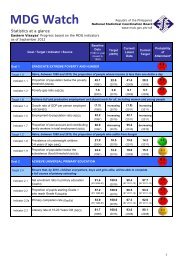
Statistics at a glance Province/City Progress based on the <strong>MDG</strong> indicators as of March 30, 2008<br />
indicator 23b<br />
target 9<br />
indicator 29<br />
target 10<br />
indicator 30<br />
Goals/Targets/Province/City/<br />
Indicators/Source<br />
Baseline Target Latest Probability*<br />
Death rate associated with tuberculosis per 100,000 pop'n (DOH-XII) 4/<br />
Cotabato 2.6 Decreasing 14.7<br />
(2003) (1990-2015) (2005)<br />
Sarangani 1.4 Decreasing 6.2<br />
(2003) (1990-2015) (2005)<br />
South Cotabato 1.8 Decreasing 9.3<br />
(2003) (1990-2015) (2005)<br />
Sultan Kudarat 1.1 Decreasing 8.6<br />
(2003) (1990-2015) (2005)<br />
Cotabato City 3.0 Decreasing 16.6<br />
(2003) (1990-2015) (2005)<br />
General Santos City 2.6 Decreasing 36.7<br />
(2003) (1990-2015) (2005)<br />
Kidapawan City 8.7 Decreasing 26.4<br />
(2003) (1990-2015) (2005)<br />
GOAL 7. ENSURE ENVIRONMENTAL SUSTAINABILITY<br />
Integrate the principles of sustainable development into country policies & programmes to reverse the<br />
loss of environmental resources<br />
Proportion of households using solid fuels for cooking (1990 & 2000 CPH, NSO)<br />
Cotabato 90.2 Decreasing 78.3<br />
(1990) (1990-2015) (2000)<br />
Sarangani 89.9 Decreasing 79.9<br />
(1990) (1990-2015) (2000)<br />
South Cotabato 88.1 Decreasing 76.4<br />
(1990) (1990-2015) (2000)<br />
Sultan Kudarat 86.1 Decreasing 79.2<br />
(1990) (1990-2015) (2000)<br />
Cotabato City 59.5 Decreasing 31.5<br />
(1990) (1990-2015) (2000)<br />
General Santos City 58.5 Decreasing 31.3<br />
(1990) (1990-2015) (2000)<br />
Kidapawan City 82.6 Decreasing 61.4<br />
(1990) (1990-2015) (2000)<br />
Koronadal City 81.1 Decreasing 57.9<br />
(1990) (1990-2015) (2000)<br />
Tacurong City 73.1 Decreasing 49.9<br />
(1990) (1990-2015) (2000)<br />
Halve, by 2015, the proportion of population without sustainable access to safe drinking water and<br />
improved sanitation<br />
Proportion of households with access to safe drinking water (1990 & 2000 CPH, NSO)<br />
Cotabato 47.7 23.9 37.5<br />
(1990) (2015) (2000)<br />
Sarangani 49.9 25.0 41.1<br />
(1990) (2015) (2000)<br />
South Cotabato 28.7 14.4 24.0<br />
(1990) (2015) (2000)<br />
Sultan Kudarat 31.6 15.8 16.5<br />
(1990) (2015) (2000)<br />
Cotabato City 14.1 7.1 27.9<br />
(1990) (2015) (2000)<br />
General Santos City 3.7 1.9 8.4<br />
(1990) (2015) (2000)<br />
Kidapawan City 38.5 19.3 31.8<br />
(1990) (2015) (2000)<br />
Koronadal City 7.5 3.8 6.8<br />
(1990) (2015) (2000)<br />
Tacurong City 5.3 2.7 2.3<br />
(1990) (2015) (2000)