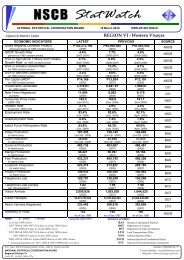
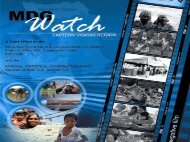
MDG Watch - NSCB
MDG Watch - NSCB
MDG Watch - NSCB

You also want an ePaper? Increase the reach of your titles
YUMPU automatically turns print PDFs into web optimized ePapers that Google loves.
<strong>MDG</strong> <strong>Watch</strong><br />
Republic of the Philippines<br />
National Statistical Coordination Board<br />
www.nscb.gov.ph/ru12<br />
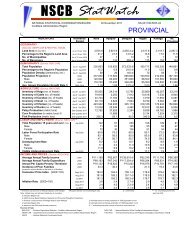
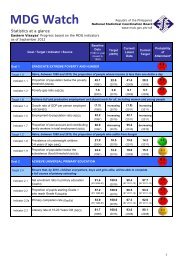
Statistics at a glance Province/City Progress based on the <strong>MDG</strong> indicators as of March 30, 2008<br />
Goals/Targets/Province/City/<br />
Baseline Target Latest Probability*<br />
Indicators/Source<br />
GOAL 1. ERADICATE EXTREME POVERTY AND HUNGER<br />
target 1<br />
indicator 1a<br />
indicator 1b<br />
indicator 2<br />
target 2<br />
indicator 4<br />
Halve, between 1990s and 2015, the proportion of people whose income is less than one dollar a day<br />
Proportion of population below the poverty threshold<br />
(<strong>NSCB</strong>)<br />
Cotabato 58.6 29.3 34.6<br />
(1997) (2015) (2006)<br />
Sarangani 49.8 24.9 52.0<br />
(1997) (2015) (2006)<br />
South Cotabato 38.3 19.2 37.3<br />
(1997) (2015) (2006)<br />
Sultan Kudarat 42.5 21.3 47.4<br />
(1997) (2015) (2006)<br />
Cotabato City 31.3 15.7 44.1<br />
(2000) (2015) (2006)<br />
Proportion of population living below food threshold<br />
(<strong>NSCB</strong>)<br />
Cotabato 39.1 19.6 14.9<br />
(1997) (2015) (2006)<br />
Sarangani 32.5 16.3 27.1<br />
(1997) (2015) (2006)<br />
South Cotabato 20.6 10.3 16.1<br />
(1997) (2015) (2006)<br />
Sultan Kudarat 19.5 9.8 24.3<br />
(1997) (2015) (2006)<br />
Cotabato City 9.3 4.7 17.7<br />
(2000) (2015) (2006)<br />
Poverty gap ratio (<strong>NSCB</strong>)<br />
Cotabato 19.8 9.9 7.6<br />
(1997) (2015) (2006)<br />
Sarangani 16.8 8.4 12.7<br />
(1997) (2015) (2006)<br />
South Cotabato 9.3 4.7 8.8<br />
(1997) (2015) (2006)<br />
Sultan Kudarat 9.9 5.0 11.2<br />
(1997) (2015) (2006)<br />
Cotabato City 9.3 4.7 11.3<br />
(2000) (2015) (2006)<br />
Halve, between 1990 and 2015, the proportion of people who suffer from hunger<br />
Prevalence of underweight children under 5 years of age (NNC-XII) 3/<br />
Cotabato 21.1 10.6 14.9<br />
(2003) (2015) (2006)<br />
Sarangani 19.7 9.9 11.6<br />
(2003) (2015) (2006)<br />
South Cotabato 23.2 11.6 15.3<br />
(2003) (2015) (2006)<br />
Sultan Kudarat 21.8 10.9 19.4<br />
(2003) (2015) (2006)<br />
Cotabato City 16.4 8.2 11.1<br />
(2003) (2015) (2006)<br />
General Santos City 20.8 10.4 11.6<br />
(2003) (2015) (2006)<br />
Kidapawan City 18.1 9.1 15.7<br />
(2003) (2015) (2006)<br />
Koronadal City 15.9 8.0 6.5<br />
(2003) (2015) (2006)<br />
Tacurong City 9.6 4.8 8.3<br />
(2003) (2015) (2006)
Statistics at a glance Province/City Progress based on the <strong>MDG</strong> indicators as of March 30, 2008<br />
target 3<br />
indicator 6<br />
Goals/Targets/Province/City/<br />
Indicators/Source<br />
Baseline Target Latest Probability*<br />
GOAL 2. ACHIEVE UNIVERSAL PRIMARY EDUCATION<br />
Ensure that, by 2015, children everywhere, boys and girls alike, will be able to complete a full course<br />
of primary schooling<br />
Net enrolment ratio in primary education (DepEd-XII) 2/<br />
Cotabato 82.4 100.0 76.4<br />
(SY 2003-04) (2015) (SY 2006-07)<br />
Sarangani 71.5 100.0 67.9<br />
(SY 2003-04) (2015) (SY 2006-07)<br />
South Cotabato 74.2 100.0 69.2<br />
(SY 2003-04) (2015) (SY 2006-07)<br />
Sultan Kudarat 71.4 100.0 66.9<br />
(SY 2003-04) (2015) (SY 2006-07)<br />
Cotabato City 91.1 100.0 92.0<br />
(SY 2003-04) (2015) (SY 2006-07)<br />
General Santos City 79.3 100.0 76.7<br />
(SY 2003-04) (2015) (SY 2006-07)<br />
Kidapawan City 76.2 100.0 68.0<br />
(SY 2003-04) (2015) (SY 2006-07)<br />
Koronadal City 73.0 100.0 65.7<br />
(SY 2003-04) (2015) (SY 2006-07)<br />
indicator 7a<br />
Proportion of pupils starting grade 1 who reach grade 6 (DepEd-XII) 2/<br />
Cotabato 42.5 100.0 45.0<br />
(SY 2003-04) (2015) (SY 2006-07)<br />
Sarangani 40.5 100.0 45.9<br />
(SY 2003-04) (2015) (SY 2006-07)<br />
South Cotabato 51.8 100.0 53.0<br />
(SY 2003-04) (2015) (SY 2006-07)<br />
Sultan Kudarat 47.6 100.0 48.2<br />
(SY 2003-04) (2015) (SY 2006-07)<br />
Cotabato City 48.5 100.0 49.5<br />
(SY 2003-04) (2015) (SY 2006-07)<br />
General Santos City 58.3 100.0 54.5<br />
(SY 2003-04) (2015) (SY 2006-07)<br />
Kidapawan City 56.3 100.0 52.3<br />
(SY 2003-04) (2015) (SY 2006-07)<br />
Koronadal City 58.0 100.0 59.4<br />
(SY 2003-04) (2015) (SY 2006-07)<br />
indicator 7b Primary completion rate (DepEd-XII) 2/<br />
Cotabato 40.8 100.0 43.7<br />
(SY 2003-04) (2015) (SY 2006-07)<br />
Sarangani 38.5 100.0 41.5<br />
(SY 2003-04) (2015) (SY 2006-07)<br />
South Cotabato 50.0 100.0 51.1<br />
(SY 2003-04) (2015) (SY 2006-07)<br />
Sultan Kudarat 43.7 100.0 45.8<br />
(SY 2003-04) (2015) (SY 2006-07)<br />
Cotabato City 47.5 100.0 48.9<br />
(SY 2003-04) (2015) (SY 2006-07)<br />
General Santos City 56.5 100.0 52.1<br />
(SY 2003-04) (2015) (SY 2006-07)<br />
Kidapawan City 55.0 100.0 51.2<br />
(SY 2003-04) (2015) (SY 2006-07)<br />
Koronadal City 56.8 100.0 58.5<br />
(SY 2003-04) (2015) (SY 2006-07)
Statistics at a glance Province/City Progress based on the <strong>MDG</strong> indicators as of March 30, 2008<br />
target 4<br />
Goals/Targets/Province/City/<br />
Baseline Target Latest Probability*<br />
Indicators/Source<br />
GOAL 3. PROMOTE GENDER EQUALITY AND EMPOWER WOMEN<br />
Eliminate gender disparity in primary and secondary education preferably by 2005 and to all levels of<br />
education no later than 2015<br />
indicator 9a<br />
indicator 9b<br />
Ratio of girls to boys in primary education (DepEd-XII) 2/<br />
Cotabato 0.96 1.00 0.96<br />
(SY 2003-04) (2015) (SY 2006-07)<br />
Sarangani 0.98 1.00 1.00 Target Attained<br />
(SY 2003-04) (2015) (SY 2006-07)<br />
South Cotabato 0.95 1.00 0.95<br />
(SY 2003-04) (2015) (SY 2006-07)<br />
Sultan Kudarat 0.95 1.00 0.96<br />
(SY 2003-04) (2015) (SY 2006-07)<br />
Cotabato City 1.03 1.00 1.01 Target Attained<br />
(SY 2003-04) (2015) (SY 2006-07)<br />
General Santos City 0.97 1.00 0.97<br />
(SY 2003-04) (2015) (SY 2006-07)<br />
Kidapawan City 0.95 1.00 0.92<br />
(SY 2003-04) (2015) (SY 2006-07)<br />
Koronadal City 0.95 1.00 0.95<br />
(SY 2003-04) (2015) (SY 2006-07)<br />
Ratio of girls to boys in secondary education (DepEd-XII) 2/<br />
Cotabato 1.08 1.00 1.09 Target Attained<br />
(SY 2003-04) (2015) (SY 2006-07)<br />
Sarangani 1.17 1.00 1.18 Target Attained<br />
(SY 2003-04) (2015) (SY 2006-07)<br />
South Cotabato 1.06 1.00 1.08 Target Attained<br />
(SY 2003-04) (2015) (SY 2006-07)<br />
Sultan Kudarat 1.08 1.00 1.08 Target Attained<br />
(SY 2003-04) (2015) (SY 2006-07)<br />
Cotabato City 1.23 1.00 1.13 Target Attained<br />
(SY 2003-04) (2015) (SY 2006-07)<br />
General Santos City 1.08 1.00 1.05 Target Attained<br />
(SY 2003-04) (2015) (SY 2006-07)<br />
Kidapawan City 1.12 1.00 1.17 Target Attained<br />
(SY 2003-04) (2015) (SY 2006-07)<br />
Koronadal City 1.13 1.00 1.12 Target Attained<br />
(SY 2003-04) (2015) (SY 2006-07)<br />
indicator 10<br />
Ratio of literate females to males of 15-24 year-olds (DepEd-XII)<br />
Cotabato 96.6 100.0 97.1<br />
(1990) (2015) (2000)<br />
Sarangani 96.3 100.0 96.9<br />
(1990) (2015) (2000)<br />
South Cotabato 96.4 100.0 96.0<br />
(1990) (2015) (2000)<br />
Sultan Kudarat 94.6 100.0 97.0<br />
(1990) (2015) (2000)<br />
Cotabato City 120.0 100.0 121.4 Target Attained<br />
(1990) (2015) (2000)<br />
General Santos City 108.1 100.0 107.7 Target Attained<br />
(1990) (2015) (2000)<br />
Kidapawan City 102.8 100.0 102.1 Target Attained<br />
(1990) (2015) (2000)<br />
Koronadal City 101.7 100.0 103.9 Target Attained<br />
(1990) (2015) (2000)<br />
Tacurong City 102.0 100.0 101.2 Target Attained<br />
(1990) (2015) (2000)
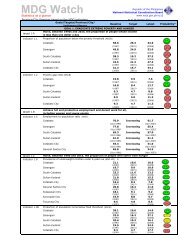
Statistics at a glance Province/City Progress based on the <strong>MDG</strong> indicators as of March 30, 2008<br />
target 5<br />
indicator 13<br />
indicator 14<br />
indicator 15<br />
target 6<br />
indicator 16<br />
indicator 17<br />
Goals/Targets/Province/City/<br />
Indicators/Source<br />
Baseline Target Latest Probability*<br />
GOAL 4. REDUCE CHILD MORTALITY<br />
Reduce by two-thirds, between 1990 and 2015, the under-five mortality rate<br />
Under-five mortality rate per 1,000 livebirths (TWG on Maternal and Child Mortality, <strong>NSCB</strong>)<br />
Cotabato 73.4 24.5 71.7<br />
(1990) (2015) (1995)<br />
South Cotabato 77.4 25.8 70.5<br />
(1990) (2015) (1995)<br />
Sultan Kudarat 82.4 27.5 81.7<br />
(1990) (2015) (1995)<br />
Cotabato City 60.9 20.3 50.0<br />
(1990) (2015) (1995)<br />
General Santos City 57.2 19.1 44.1<br />
(1990) (2015) (1995)<br />
Infant mortality rate per 1,000 livebirths (TWG on Maternal and Child Mortality, <strong>NSCB</strong>)<br />
Cotabato 53.0 17.7 52.0<br />
(1990) (2015) (1995)<br />
South Cotabato 55.4 18.5 51.2<br />
(1990) (2015) (1995)<br />
Sultan Kudarat 58.5 19.5 58.0<br />
(1990) (2015) (1995)<br />
Cotabato City 44.0 14.7 36.1<br />
(1990) (2015) (1995)<br />
General Santos City 43.2 14.4 33.3<br />
(1990) (2015) (1995)<br />
Proportion of 1 year old children imunized against measles (DOH-XII) 4/<br />
Cotabato 77.4 100.0 75.1<br />
(2003) (2015) (2005)<br />
Sarangani 79.0 100.0 77.0<br />
(2003) (2015) (2005)<br />
South Cotabato 71.9 100.0 81.3<br />
(2003) (2015) (2005)<br />
Sultan Kudarat 88.4 100.0 80.6<br />
(2003) (2015) (2005)<br />
Cotabato City 61.2 100.0 74.9<br />
(2003) (2015) (2005)<br />
General Santos City 70.2 100.0 73.9<br />
(2003) (2015) (2005)<br />
Kidapawan City 79.4 100.0 92.3<br />
(2003) (2015) (2005)<br />
GOAL 5. REDUCE MATERNAL MORTALITY<br />
Reduce by three-quarters, between 1990 and 2015, the maternal mortality ratio<br />
Maternal mortality ratio per 100,000 livebirths (TWG on Maternal and Child Mortality, <strong>NSCB</strong>)<br />
Cotabato 167.5 41.9 164.2<br />
(1990) (2015) (1995)<br />
South Cotabato 214.1 53.5 197.0<br />
(1990) (2015) (1995)<br />
Sultan Kudarat 269.7 67.4 267.0<br />
(1990) (2015) (1995)<br />
Cotabato City 182.8 45.7 149.9<br />
(1990) (2015) (1995)<br />
General Santos City 210.0 52.5 161.7<br />
(1990) (2015) (1995)<br />
Proportion of births attended by skilled health personnel (DOH-XII) 4/<br />
Cotabato 90.7 100.0 90.4<br />
(2003) (2015) (2005)<br />
Sarangani 91.0 100.0 94.1<br />
(2003) (2015) (2005)<br />
South Cotabato 82.3 100.0 81.2<br />
(2003) (2015) (2005)<br />
Sultan Kudarat 96.2 100.0 97.2<br />
(2003) (2015) (2005)<br />
Cotabato City 89.0 100.0 92.5<br />
(2003) (2015) (2005)<br />
General Santos City 98.6 100.0 96.9<br />
Kidapawan City<br />
(2003) (2015) (2005)<br />
98.4 100.0 99.0<br />
(2003) (2015) (2005)
Statistics at a glance Province/City Progress based on the <strong>MDG</strong> indicators as of March 30, 2008<br />
target 7<br />
indicator 19<br />
Goals/Targets/Province/City/<br />
Indicators/Source<br />
Baseline Target Latest Probability*<br />
GOAL 6. COMBAT HIV/AIDS, MALARIA AND OTHER DISEASES<br />
Have halted by 2015 and begun to reverse the spread of HIV/AIDS<br />
Condom use rate of the contraceptive prevalence rate (DOH-XII) 4/<br />
Cotabato 6.8 Increasing 5.1<br />
(2003) (1990-2015) (2005)<br />
Sarangani 4.7 Increasing 5.0<br />
(2003) (1990-2015) (2005)<br />
South Cotabato 7.4 Increasing 3.9<br />
(2003) (1990-2015) (2005)<br />
Sultan Kudarat 4.5 Increasing 4.4<br />
(2003) (1990-2015) (2005)<br />
Cotabato City 12.1 Increasing 8.7<br />
(2003) (1990-2015) (2005)<br />
General Santos City 9.9 Increasing 11.5<br />
(2003) (1990-2015) (2005)<br />
Kidapawan City 5.5 Increasing 2.9<br />
(2003) (1990-2015) (2005)<br />
target 8<br />
indicator 21a<br />
indicator 21b<br />
indicator 23a<br />
Have halted by 2015 and begun to reverse the incidence of malaria and major diseases<br />
Prevalence associated with malaria per 100,000 population (DOH-XII) 4/<br />
Cotabato 7.4 Decreasing 4.8<br />
(2003) (1990-2015) (2005)<br />
Sarangani 25.9 Decreasing 381.9<br />
(2003) (1990-2015) (2005)<br />
South Cotabato 0.0 Decreasing 74.8<br />
(2003) (1990-2015) (2005)<br />
Sultan Kudarat 217.7 Decreasing 216.4<br />
(2003) (1990-2015) (2005)<br />
Cotabato City 0.0 Decreasing 7.2<br />
(2003) (1990-2015) (2005)<br />
General Santos City 0.4 Decreasing 14.0<br />
(2003) (1990-2015) (2005)<br />
Kidapawan City 0.0 Decreasing 0.0<br />
(2003) (1990-2015) (2005)<br />
Death rate associated with nalaria per 100,000 pop'n (DOH-XII) 4/<br />
Cotabato 0.0 Decreasing 0.0<br />
(2003) (1990-2015) (2005)<br />
Sarangani 0.6 Decreasing 0.0<br />
(2003) (1990-2015) (2005)<br />
South Cotabato 0.1 Decreasing 0.0<br />
(2003) (1990-2015) (2005)<br />
Sultan Kudarat 1.1 Decreasing 0.0<br />
(2003) (1990-2015) (2005)<br />
Cotabato City 0.0 Decreasing 0.6<br />
(2003) (1990-2015) (2005)<br />
General Santos City 0.4 Decreasing 1.0<br />
(2003) (1990-2015) (2005)<br />
Kidapawan City 0.0 Decreasing 0.0<br />
(2003) (1990-2015) (2005)<br />
Prevalence associated with tuberculosis per 100,000 population (DOH-XII) 4/<br />
Cotabato 80.2 Decreasing 190.5<br />
(2003) (1990-2015) (2005)<br />
Sarangani 96.3 Decreasing 139.6<br />
(2003) (1990-2015) (2005)<br />
South Cotabato 140.2 Decreasing 132.9<br />
(2003) (1990-2015) (2005)<br />
Sultan Kudarat 102.4 Decreasing 104.1<br />
(2003) (1990-2015) (2005)<br />
Cotabato City 0.0 Decreasing 115.0<br />
(2003) (1990-2015) (2005)<br />
General Santos City 0.9 Decreasing 43.0<br />
(2003) (1990-2015) (2005)<br />
Kidapawan City 0.0 Decreasing 6.2<br />
(2003) (1990-2015) (2005)
Statistics at a glance Province/City Progress based on the <strong>MDG</strong> indicators as of March 30, 2008<br />
indicator 23b<br />
target 9<br />
indicator 29<br />
target 10<br />
indicator 30<br />
Goals/Targets/Province/City/<br />
Indicators/Source<br />
Baseline Target Latest Probability*<br />
Death rate associated with tuberculosis per 100,000 pop'n (DOH-XII) 4/<br />
Cotabato 2.6 Decreasing 14.7<br />
(2003) (1990-2015) (2005)<br />
Sarangani 1.4 Decreasing 6.2<br />
(2003) (1990-2015) (2005)<br />
South Cotabato 1.8 Decreasing 9.3<br />
(2003) (1990-2015) (2005)<br />
Sultan Kudarat 1.1 Decreasing 8.6<br />
(2003) (1990-2015) (2005)<br />
Cotabato City 3.0 Decreasing 16.6<br />
(2003) (1990-2015) (2005)<br />
General Santos City 2.6 Decreasing 36.7<br />
(2003) (1990-2015) (2005)<br />
Kidapawan City 8.7 Decreasing 26.4<br />
(2003) (1990-2015) (2005)<br />
GOAL 7. ENSURE ENVIRONMENTAL SUSTAINABILITY<br />
Integrate the principles of sustainable development into country policies & programmes to reverse the<br />
loss of environmental resources<br />
Proportion of households using solid fuels for cooking (1990 & 2000 CPH, NSO)<br />
Cotabato 90.2 Decreasing 78.3<br />
(1990) (1990-2015) (2000)<br />
Sarangani 89.9 Decreasing 79.9<br />
(1990) (1990-2015) (2000)<br />
South Cotabato 88.1 Decreasing 76.4<br />
(1990) (1990-2015) (2000)<br />
Sultan Kudarat 86.1 Decreasing 79.2<br />
(1990) (1990-2015) (2000)<br />
Cotabato City 59.5 Decreasing 31.5<br />
(1990) (1990-2015) (2000)<br />
General Santos City 58.5 Decreasing 31.3<br />
(1990) (1990-2015) (2000)<br />
Kidapawan City 82.6 Decreasing 61.4<br />
(1990) (1990-2015) (2000)<br />
Koronadal City 81.1 Decreasing 57.9<br />
(1990) (1990-2015) (2000)<br />
Tacurong City 73.1 Decreasing 49.9<br />
(1990) (1990-2015) (2000)<br />
Halve, by 2015, the proportion of population without sustainable access to safe drinking water and<br />
improved sanitation<br />
Proportion of households with access to safe drinking water (1990 & 2000 CPH, NSO)<br />
Cotabato 47.7 23.9 37.5<br />
(1990) (2015) (2000)<br />
Sarangani 49.9 25.0 41.1<br />
(1990) (2015) (2000)<br />
South Cotabato 28.7 14.4 24.0<br />
(1990) (2015) (2000)<br />
Sultan Kudarat 31.6 15.8 16.5<br />
(1990) (2015) (2000)<br />
Cotabato City 14.1 7.1 27.9<br />
(1990) (2015) (2000)<br />
General Santos City 3.7 1.9 8.4<br />
(1990) (2015) (2000)<br />
Kidapawan City 38.5 19.3 31.8<br />
(1990) (2015) (2000)<br />
Koronadal City 7.5 3.8 6.8<br />
(1990) (2015) (2000)<br />
Tacurong City 5.3 2.7 2.3<br />
(1990) (2015) (2000)
Statistics at a glance Province/City Progress based on the <strong>MDG</strong> indicators as of March 30, 2008<br />
Goals/Targets/Province/City/<br />
Indicators/Source<br />
Baseline Target Latest Probability*<br />
indicator 31 Proportion of households with sanitary toilet facility (1990 & 2000 CPH, NSO)<br />
Cotabato 65.5 32.8 50.5<br />
(1990) (2015) (2000)<br />
Sarangani 64.0 32.0 52.4<br />
(1990) (2015) (2000)<br />
South Cotabato 43.7 21.9 31.8<br />
(1990) (2015) (2000)<br />
Sultan Kudarat 52.3 26.2 45.7<br />
(1990) (2015) (2000)<br />
Cotabato City 47.6 23.8 23.9<br />
(1990) (2015) (2000)<br />
General Santos City 28.7 14.4 12.1<br />
(1990) (2015) (2000)<br />
Kidapawan City 48.2 24.1 30.7<br />
(1990) (2015) (2000)<br />
Koronadal City 18.0 9.0 11.9<br />
(1990) (2015) (2000)<br />
Tacurong City 18.3 9.2 8.8<br />
(1990) (2015) (2000)<br />
target 11 By 2020, have achieved significant improvement in the lives of at least 100 million slum dwellers<br />
indicator 32 Proportion of households with access to secure tenure (1990 & 2000 CPH, NSO)<br />
Cotabato 88.7 Increasing 62.7<br />
(1990) (1990-2015) (2000)<br />
Sarangani 92.8 Increasing 53.3<br />
(1990) (1990-2015) (2000)<br />
South Cotabato 91.6 Incrreasing 64.4<br />
(1990) (1990-2015) (2000)<br />
Sultan Kudarat 92.8 Increasing 60.0<br />
(1990) (1990-2015) (2000)<br />
Cotabato City 90.7 Increasing 56.0<br />
(1990) (1990-2015) (2000)<br />
General Santos City 89.9 Increasing 62.5<br />
(1990) (1990-2015) (2000)<br />
GOAL 8. DEVELOP A GLOBAL PARTNERSHIP FOR DEVELOPMENT<br />
target 16<br />
In cooperation with developing countries, develop and implement strategies for decent and productive<br />
work for youth<br />
indicator 45 Unemployment rate of 15-24 year olds (NSO) 16.3 (Decreasing) 16.9<br />
(2002) (2002-2015) (2006)<br />
target 18<br />
In cooperation with the private sector, make available the benefits of new technologies, especially<br />
information and communications<br />
indicator 47a Telephone lines subscribers per 100 population (NTC) 2.7 (Increasing) 2.8<br />
(2000) (2000-2015) (2004)<br />
a/ Regional figures average of Cotabato, Sultan Kudarat, South Cotabato, Cotabato City and General Santos City.<br />
1/ Regional figures based on the old regional set-up which excludes South Cotabato, Sarangani and General Santos City<br />
2/ Figures for public schools only; sourced from the BEIS<br />
3/ Data starting 2003 based on the International reference Standard (IRS); figures for previous years based on the National reference Standard (NRS)<br />
4/ With the issuance of EO 36, DOH-started gathering data for South Cotabato, Sarangani , General Santos City, Koronadal City and Tacurong City only in 2003.<br />
* based on the comparison of actual (from baseline to latest data) and required (from baseline to target year) rates of progress<br />
Probability of Achieving the Goal:<br />
Low: Pace of Progress is less than 0.5<br />
Medium: Pace of Progress between 0.5 and 0.9<br />
High: Pace of Progress is greater than 0.9<br />
For your inquiries and information needs, visit or call the:<br />
National Statistical Coordination Board-XII, cor. Gonzalo Javier and Ugalingan Piang Sts., Cotabato City<br />
Telefax No. (064) 421-1817, e-mail address: nscbrd12@yahoo.com, website: www.nscb.gov.ph/ru12