here - Institute for Astronomy Umleitung
here - Institute for Astronomy Umleitung
here - Institute for Astronomy Umleitung

You also want an ePaper? Increase the reach of your titles
YUMPU automatically turns print PDFs into web optimized ePapers that Google loves.
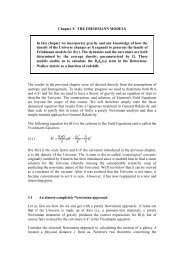
Title: Science preparation and key personnel<br />
Reference: MUSE-MEM-SCI-053<br />
Issue: 1.0<br />
Date: 02/02/04<br />
Page: 10/25<br />
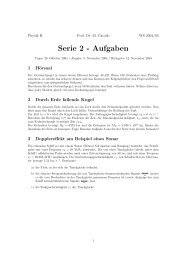
Fig 6. (left) Observational estimates of the cumulative luminosity function of candidate Ly α emitters<br />
(LAE) at z ~ 5.8. The three continuous functions are from (l-r) the LALA survey [19], the Subara<br />
Deep Survey [1] and the CADIS survey [18]. LALA only picks up LAE of very high equivalent width<br />
but has a high confirmation rate so far [19], so it is likely a lower limit. CADIS has a lower<br />
confirmation rate and may be regarded as an upper limit. The three points separated by a dotted<br />
line is the sample of 15 objects from Hu et al (2003). The right-angled limits represents the lack of<br />
detection by Martin & Sawicki using a similar but less sensitive technique to that used by us. The<br />
hatched area is a reasonable representation of these observations with reality likely lying in the<br />
middle. (right) As at left, except at z = 6.5. The hatched region is simply translated from the z = 5.8<br />
diagram assuming no evolution. The upper and far-left axes show observational quantities. Only<br />
three galaxies are known at this redshift, those from Hu et al (H02) and Kodaira et al (K03) The<br />
<strong>for</strong>mer is shown both as observed and also demagnified by the A370 lens. The variable sensitivity of<br />
the proposed survey arising from sky lines and spatial effects due to the VPH grating gives the<br />
curved sensitivity-area relation shown as the heavy line. We expect to detect 20 LAE down to a<br />
sensitivity limit substantially below that explored by the previous narrow-band surveys. Adapting<br />
the number density from Hu et al would boost this by an order of magnitude.<br />
4.2.3. Future plans<br />
We plan to continue and extend these<br />
observations in the context of MUSE science<br />
preparation. For example, a third SAURON<br />
deep field has recently been obtained on another<br />
region of the SSA cluster. The 20 hours of<br />
integration on this field would allow us to get<br />
deeper and to improve our experience in datareduction<br />
of IFUs in this context. Along the<br />
same line, we plan to use the PMAS IFU (Roth<br />
et al, 2000) in operation at Calar Alto 3.5m<br />
telescope. The recently commissioned new<br />
PPAK fiber bundle gives a large field of view<br />
(70x70 arcsec²) at the cost of low spatial<br />
sampling (2.7 arcsec). An example of PMAS<br />
capabilities is shown in Figure 7.<br />
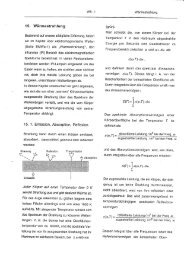
Fig.7. Ly α contours of the DLA galaxy on the lineof-sight<br />
to Q2233+131 as observed with PMAS at<br />
the Calar Alto 3.5m Telescope, superimposed on<br />
an 8” × 8” WFPC2 image. The total Ly α flux<br />
measured from the 2 hours PMAS exposure is<br />
2.4×10 -16 erg/cm 2 /sec with a 3σ detection limit of<br />
1×10 -17 erg/cm 2 /sec. The inferred velocity field is<br />
inconsistent with rotation of the DLA galaxy and<br />
interpreted as an outflow. From Christensen et<br />
al.2004, A&A in press.