efsa-opinion-chromium-food-drinking-water
efsa-opinion-chromium-food-drinking-water
efsa-opinion-chromium-food-drinking-water

Create successful ePaper yourself
Turn your PDF publications into a flip-book with our unique Google optimized e-Paper software.
Chromium in <strong>food</strong> and <strong>drinking</strong> <strong>water</strong><br />
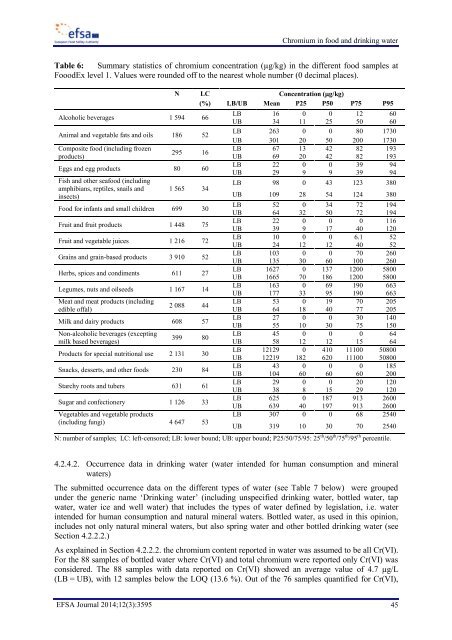
Table 6: Summary statistics of <strong>chromium</strong> concentration (µg/kg) in the different <strong>food</strong> samples at<br />
FooodEx level 1. Values were rounded off to the nearest whole number (0 decimal places).<br />
Alcoholic beverages 1 594 66<br />
Animal and vegetable fats and oils 186 52<br />
Composite <strong>food</strong> (including frozen<br />
products)<br />
N LC Concentration (g/kg)<br />
(%) LB/UB Mean P25 P50 P75 P95<br />
295 16<br />
Eggs and egg products 80 60<br />
Fish and other sea<strong>food</strong> (including<br />
amphibians, reptiles, snails and<br />
insects)<br />
1 565 34<br />
Food for infants and small children 699 30<br />
Fruit and fruit products 1 448 75<br />
Fruit and vegetable juices 1 216 72<br />
Grains and grain-based products 3 910 52<br />
Herbs, spices and condiments 611 27<br />
Legumes, nuts and oilseeds 1 167 14<br />
Meat and meat products (including<br />
edible offal)<br />
2 088 44<br />
Milk and dairy products 608 57<br />
Non-alcoholic beverages (excepting<br />
milk based beverages)<br />
399 80<br />
Products for special nutritional use 2 131 30<br />
Snacks, desserts, and other <strong>food</strong>s 230 84<br />
Starchy roots and tubers 631 61<br />
Sugar and confectionery 1 126 33<br />
Vegetables and vegetable products<br />
(including fungi) 4 647 53<br />
LB 16 0 0 12 60<br />
UB 34 11 25 50 60<br />
LB 263 0 0 80 1730<br />
UB 301 20 50 200 1730<br />
LB 67 13 42 82 193<br />
UB 69 20 42 82 193<br />
LB 22 0 0 39 94<br />
UB 29 9 9 39 94<br />
LB 98 0 43 123 380<br />
UB 109 28 54 124 380<br />
LB 52 0 34 72 194<br />
UB 64 32 50 72 194<br />
LB 22 0 0 0 116<br />
UB 39 9 17 40 120<br />
LB 10 0 0 6.1 52<br />
UB 24 12 12 40 52<br />
LB 103 0 0 70 260<br />
UB 135 30 60 100 260<br />
LB 1627 0 137 1200 5800<br />
UB 1665 70 186 1200 5800<br />
LB 163 0 69 190 663<br />
UB 177 33 95 190 663<br />
LB 53 0 19 70 205<br />
UB 64 18 40 77 205<br />
LB 27 0 0 30 140<br />
UB 55 10 30 75 150<br />
LB 45 0 0 0 64<br />
UB 58 12 12 15 64<br />
LB 12129 0 410 11100 50800<br />
UB 12219 182 620 11100 50800<br />
LB 43 0 0 0 185<br />
UB 104 60 60 60 200<br />
LB 29 0 0 20 120<br />
UB 38 8 15 29 120<br />
LB 625 0 187 913 2600<br />
UB 639 40 197 913 2600<br />
LB 307 0 0 68 2540<br />
UB 319 10 30 70 2540<br />
N: number of samples; LC: left-censored; LB: lower bound; UB: upper bound; P25/50/75/95: 25 th /50 th /75 th /95 th percentile.<br />
4.2.4.2. Occurrence data in <strong>drinking</strong> <strong>water</strong> (<strong>water</strong> intended for human consumption and mineral<br />
<strong>water</strong>s)<br />
The submitted occurrence data on the different types of <strong>water</strong> (see Table 7 below) were grouped<br />
under the generic name ‘Drinking <strong>water</strong>’ (including unspecified <strong>drinking</strong> <strong>water</strong>, bottled <strong>water</strong>, tap<br />
<strong>water</strong>, <strong>water</strong> ice and well <strong>water</strong>) that includes the types of <strong>water</strong> defined by legislation, i.e. <strong>water</strong><br />
intended for human consumption and natural mineral <strong>water</strong>s. Bottled <strong>water</strong>, as used in this <strong>opinion</strong>,<br />
includes not only natural mineral <strong>water</strong>s, but also spring <strong>water</strong> and other bottled <strong>drinking</strong> <strong>water</strong> (see<br />
Section 4.2.2.2.)<br />
As explained in Section 4.2.2.2. the <strong>chromium</strong> content reported in <strong>water</strong> was assumed to be all Cr(VI).<br />
For the 88 samples of bottled <strong>water</strong> where Cr(VI) and total <strong>chromium</strong> were reported only Cr(VI) was<br />
considered. The 88 samples with data reported on Cr(VI) showed an average value of 4.7 µg/L<br />
(LB = UB), with 12 samples below the LOQ (13.6 %). Out of the 76 samples quantified for Cr(VI),<br />
EFSA Journal 2014;12(3):3595 45