efsa-opinion-chromium-food-drinking-water
efsa-opinion-chromium-food-drinking-water efsa-opinion-chromium-food-drinking-water
Chromium in food and bottled water J 2.7. Acinus, cytoplasmic alteration in pancreas female mice For the dose-response analysis of the incidence of acinus,cytoplasmic alteration in pancreas female mice all non-restricted models, except the probit and logistic model showed an acceptable fit (p > 0.05) which resulted in BMDL 10 values ranging between 0.72 and 0.26 mg/kg b.w. per day. The graphs in Figure J19 show the fit of the Gamma and the Weibull model. A BMDL 10 = 0.26 mg/kg b.w. per day was used to characterize these data. Using a different modelling approach not following EFSA (2009) ADTSR reported a BMDL 10 of 0.52 mg/kg b.w. per day. Table J19: Incidence of pancreas acinus cytoplasmic alteration in B6C3D1 female mice exposed to SDD in drinking water for 2 years. The benchmark dose (BMD -10 ), the 95 % benchmark dose lower confidence limit (BMDL-10) values for a BMR of 10 % extra risk with characteristics of the model fit. Data Dose 0 0.38 1.4 3.1 8.7 Response 0/48 6/50 6/49 14/50 32/50 Models Restriction BMD Minus 10 BMDL 10 N of P- (mg/kg (mg/kg Loglikelihood Accepted parameters value b.w. per b.w. per day) day) Full model na 5 99.0 – – – – Null (reduced) model na 1 134.9 - - - - Probit na 2 103.6 0.03 no 2.24 1.89 LogProbit none 3 102.2 0.08 yes 0.60 0.30 Logistic na 2 103.9 0.02 no 2.44 2.03 LogLogistic none 3 101.6 0.14 yes 0.64 0.31 Quantal-Linear /QL) na 2 101.4 0.17 yes 0.92 0.72 Multistage Cancer na same as QL Multistage none 3 101.4 0.08 yes 0.89 0.57 Weibull none 2 100.8 0.25 yes 0.64 0.30 Gamma none 2 100.7 0.30 yes 0.61 0.26 b.w.: body weight; na: not applicable; if: invalid fit. Weibull Model, with BMR of 10% Extra Risk for the BMD and 0.95 Lower Confidence Limit for the BMDL Gamma Multi-Hit Model, with BMR of 10% Extra Risk for the BMD and 0.95 Lower Confidence Limit for the BMDL 0.8 Weibull BMD Lower Bound 1 Gamma Multi-Hit BMD Lower Bound 0.7 0.6 0.8 Fraction Affected 0.5 0.4 0.3 Fraction Affected 0.6 0.4 0.2 0.2 0.1 0 0 BMDL BMD BMDL BMD 12:33 01/21 2014 0 1 2 3 4 5 6 7 8 9 dose 12:10 01/21 2014 0 1 2 3 4 5 6 7 8 9 dose Figure J19: Fits of the Weibull model (left) and gamma model (right) to the dose-response data on acinus, cytoplasmic alteration in pancreas in female mice. EFSA Journal 2014;12(3):3595 252
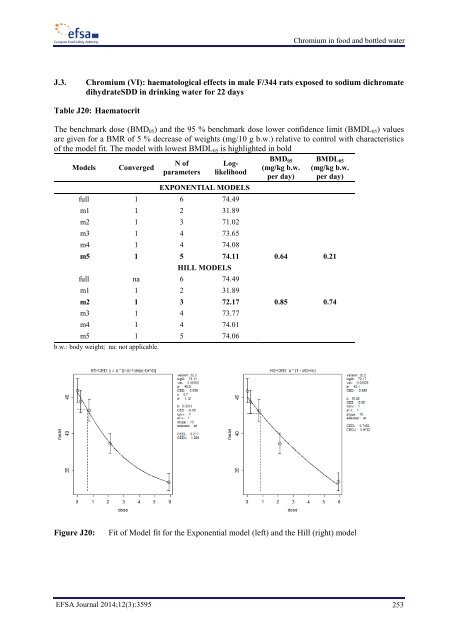
Chromium in food and bottled water J.3. Chromium (VI): haematological effects in male F/344 rats exposed to sodium dichromate dihydrateSDD in drinking water for 22 days Table J20: Haematocrit The benchmark dose (BMD 05 ) and the 95 % benchmark dose lower confidence limit (BMDL 05 ) values are given for a BMR of 5 % decrease of weights (mg/10 g b.w.) relative to control with characteristics of the model fit. The model with lowest BMDL 05 is highlighted in bold Models Converged N of parameters Loglikelihood EXPONENTIAL MODELS full 1 6 74.49 m1 1 2 31.89 m2 1 3 71.02 m3 1 4 73.65 m4 1 4 74.08 BMD 05 (mg/kg b.w. per day) BMDL 05 (mg/kg b.w. per day) m5 1 5 74.11 0.64 0.21 HILL MODELS full na 6 74.49 m1 1 2 31.89 m2 1 3 72.17 0.85 0.74 m3 1 4 73.77 m4 1 4 74.01 m5 1 5 74.06 b.w.: body weight; na: not applicable. Figure J20: Fit of Model fit for the Exponential model (left) and the Hill (right) model EFSA Journal 2014;12(3):3595 253
- Page 201 and 202: Chromium in food and bottled water
- Page 203 and 204: Chromium in food and bottled water
- Page 205 and 206: Chromium in food and bottled water
- Page 207 and 208: Chromium in food and bottled water
- Page 209 and 210: Chromium in food and bottled water
- Page 211 and 212: Chromium in food and bottled water
- Page 213 and 214: Chromium in food and bottled water
- Page 215 and 216: Chromium in food and bottled water
- Page 217 and 218: Chromium in food and bottled water
- Page 219 and 220: Chromium in food and bottled water
- Page 221 and 222: Chromium in food and bottled water
- Page 223 and 224: Chromium in food and bottled water
- Page 225 and 226: Chromium in food and bottled water
- Page 227 and 228: Chromium in food and bottled water
- Page 229 and 230: Chromium in food and bottled water
- Page 231 and 232: Chromium in food and bottled water
- Page 233 and 234: Chromium in food and bottled water
- Page 235 and 236: J.1.2. mice Chromium in food and bo
- Page 237 and 238: Chromium in food and bottled water
- Page 239 and 240: Chromium in food and bottled water
- Page 241 and 242: Chromium in food and bottled water
- Page 243 and 244: Chromium in food and bottled water
- Page 245 and 246: Chromium in food and bottled water
- Page 247 and 248: Chromium in food and bottled water
- Page 249 and 250: Chromium in food and bottled water
- Page 251: Chromium in food and bottled water
- Page 255 and 256: Chromium in food and bottled water
- Page 257 and 258: Chromium in food and bottled water
- Page 259 and 260: Chromium in food and bottled water
- Page 261: Chromium in food and bottled water
Chromium in <strong>food</strong> and bottled <strong>water</strong><br />
J.3.<br />
Chromium (VI): haematological effects in male F/344 rats exposed to sodium dichromate<br />
dihydrateSDD in <strong>drinking</strong> <strong>water</strong> for 22 days<br />
Table J20: Haematocrit<br />
The benchmark dose (BMD 05 ) and the 95 % benchmark dose lower confidence limit (BMDL 05 ) values<br />
are given for a BMR of 5 % decrease of weights (mg/10 g b.w.) relative to control with characteristics<br />
of the model fit. The model with lowest BMDL 05 is highlighted in bold<br />
Models<br />
Converged<br />
N of<br />
parameters<br />
Loglikelihood<br />
EXPONENTIAL MODELS<br />
full 1 6 74.49<br />
m1 1 2 31.89<br />
m2 1 3 71.02<br />
m3 1 4 73.65<br />
m4 1 4 74.08<br />
BMD 05<br />
(mg/kg b.w.<br />
per day)<br />
BMDL 05<br />
(mg/kg b.w.<br />
per day)<br />
m5 1 5 74.11 0.64 0.21<br />
HILL MODELS<br />
full na 6 74.49<br />
m1 1 2 31.89<br />
m2 1 3 72.17 0.85 0.74<br />
m3 1 4 73.77<br />
m4 1 4 74.01<br />
m5 1 5 74.06<br />
b.w.: body weight; na: not applicable.<br />
Figure J20:<br />
Fit of Model fit for the Exponential model (left) and the Hill (right) model<br />
EFSA Journal 2014;12(3):3595 253


