Surface State Density Calculations
Surface State Density Calculations
Surface State Density Calculations

Create successful ePaper yourself
Turn your PDF publications into a flip-book with our unique Google optimized e-Paper software.
1<br />
<strong>Surface</strong> <strong>State</strong> <strong>Density</strong> <strong>Calculations</strong><br />
Step 1 – screen diodes<br />
Perform IV measurement to find “good diodes”, those with low leakage current and highest<br />
breakdown voltage.<br />
Step 2 – perform CV<br />
Use IV curve results to find voltage range that does not have significant leakage current that may<br />
damage diode. This is important because there is no current limiting mechanism on CV machine<br />
(compliance setting). Incidentally, the compliance used for IV graphs was 0.1 µA/cm 2 .<br />
Step 3 – doping concentration estimation<br />
Use CV curve to calculate doping concentration<br />
For p type silicon, here is a typical cv curve<br />
A) Plot 1/C 2 vs. V<br />
*NOTE – curvature in this region may represent nonuniform doping in the semiconductor.
2<br />
B) Calculate the doping concentration, N<br />
ε s = semiconductor dielectric constant<br />
A = diode area<br />
q = magnitude of electronic charge<br />
N = doping concentration (acceptor/donor)<br />
STEP 4 – Calculate Debye length, L D<br />
STEP 5 – Calculate the semiconductor flat band capacitance, C FBS<br />
STEP 6 – Calculate dielectric layer capacitance C i<br />
Calculate or experimentally measure dielectric layer (insulating layer) capacitance (C i )<br />
Calculate by<br />
Ci <br />
<br />
i<br />
d<br />
A<br />
A = diode area<br />
d = insulating layer thickness<br />
ε i = insulating layer dielectric constant<br />
Experimentally obtain by …<br />
*Maximum capacitance with minimal<br />
leakage current (as ascertained by IV<br />
curves from semiconductor parameter<br />
analyzer HP 4145A) is equal to insulator<br />
capacitance, because depletion layer<br />
thickness is essentially 0.
3<br />
The depletion layer thickness increases as the capacitance decreases due to effectively increasing<br />
distance, d, (remember C = εA/d). Therefore, at max capacitance, the depletion layer thickness<br />
is essentially 0, so d = insulator thickness. So, you can back calculate ε i (insulator dielectric<br />
constant) if you know d = insulator thickness …<br />
STEP 7 – Calculate the overall flat band capacitance C FB<br />
Once C i is calculated, you can calculate overall flat band capacitance….<br />
And the ratio C FB /C i<br />
Supplemental<br />
If you know the dielectric layer thickness, the ratio can also be found by….<br />
C<br />
FB<br />
/ C<br />
i<br />
1<br />
<br />
<br />
iL<br />
1<br />
d<br />
s<br />
D<br />
i<br />
STEP 8 – calculating V shift<br />
The “standard” method is to regraph the CV curve as C/C i v.s. V
4<br />
Then use the ratio C FB /C i to estimate the flat band voltage shift V shift or ΔV. Basically, in an ideal<br />
diode, the flat band voltage condition/capacitance ΔV = 0. So, the attached paper attributes the<br />
voltage shift to interfacial states.<br />
Charges<br />
Q m – mobile charges – bias dependent location<br />
Q ot – oxide trapped – distributed in oxide<br />
Q f – fixed oxide – located near surface charge<br />
Q it – interface traps – at interface<br />
From discussion of<br />
SiO 2 /Si diode in<br />
“Semiconductor<br />
Devices Physics and<br />
Technology” by SZE,<br />
Pgs 197‐200<br />
Effect of charge<br />
Q m, Q ot, Q f – shifts curves to left or right (negative charges shift curve to right)<br />
Q it – charge or discharge over range of bias (<br />
change slope)
5<br />
V<br />
FB<br />
<br />
ms<br />
Q<br />
<br />
f<br />
Q<br />
c<br />
m<br />
i<br />
Q<br />
ot<br />
<br />
ms<br />
= work function of metal – work function of semiconductor<br />
STEP 9 – Find ms<br />
P-type<br />
N-type<br />
<br />
ms<br />
<br />
<br />
m<br />
s<br />
m<br />
[ x Eg<br />
B<br />
/ 2 <br />
]<br />
Eg/2= intrinsic Fermi level<br />
<br />
m<br />
= metal work function<br />
X = electron affinity of<br />
semiconductor<br />
<br />
ms<br />
<br />
m<br />
<br />
s<br />
m<br />
[ x Eg<br />
/ 2 <br />
B<br />
]<br />
= Fermi level difference<br />
between Fermi level and intrinsic<br />
Fermi level<br />
STEP 10<br />
X, E g – can be found from reference tables<br />
– may be found from reference tables or calculated<br />
Calculate surface STATE density by….<br />
N f = number/cm 2<br />
N f = surface state density<br />
Method 1<br />
A) Do steps 1 – 4 as described; skip step 5<br />
B) Do step 6 by using reference vale for ε i , use experimental C i to calculate “d”<br />
C) Do step 7 using<br />
C<br />
FB<br />
/ C<br />
i<br />
1<br />
<br />
<br />
iL<br />
1<br />
d<br />
s<br />
D<br />
i<br />
Method 2<br />
D) Do step 8 graphing C/C i vs. V<br />
Use calculated C FB /C i to get V shift<br />
E) Do steps 9 and 10<br />
A) Do steps 1-5 as stated<br />
B) Use experimental value of C i found in step 6
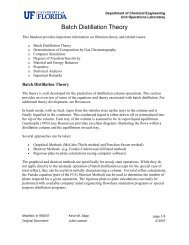
6<br />
Example<br />
C) Do step 7 using and C FB /C i<br />
D) Do steps 8,9, 10<br />
A) Calculating Doping Concentration<br />
(slope) = 2.53 x 10 19<br />
E srelative = E s /E o = 9.7 SiC<br />
A = .005026548 cm 2<br />
B) Calculate debye Length (L D )<br />
T = 300k<br />
K = 1.3806x10 ‐23 J/k (or kgm 2 /s 2 k)<br />
Ε o = 8.85418 x 10 ‐12 F/m<br />
C) Calculating C FBS<br />
Unit Check<br />
D) Get C i from experimental CV curves<br />
F
7<br />
C i = 1/760 x 10 -12 F<br />
E) Calculate C FB<br />
Incidentally…<br />
C<br />
/ 0.998 1<br />
fB C i<br />
F) From this I found V shift (by reading the curves) to be<br />
V shift = – 3.95V<br />
G) Calculate P type Fermi Level distance from intrinsic Fermi level…<br />
Variables<br />
The equations to be solved are…<br />
1)<br />
2)<br />
effective density of states in<br />
valence band<br />
acceptor cone<br />
effective hole mass<br />
= electron rest mass<br />
= .91095 x 10 ‐30 kg<br />
Back to Fermi Level calculation….<br />
= 1 for SiC
8<br />
E i = intrinsic Fermi level<br />
E g = band gap<br />
H) Now to find <br />
m<br />
<br />
ms<br />
<br />
<br />
m<br />
s<br />
m<br />
[ x Eg<br />
B<br />
/ 2 <br />
]<br />
E g = 2.996 eV for SiC<br />
For SiC at 300k<br />
E g = 2.996<br />
X = 4.1 eV (used value for GaN!)<br />
estimated<br />
For Pt metal contact<br />
<br />
m<br />
=5.65eV<br />
<br />
ms<br />
5.65<br />
4.1<br />
(2.996 / 2) 1.32<br />
1.<br />
27eV<br />
Calculate <strong>Surface</strong> state density….